Article

Prediction of Road Traffic Accidents on a Road in Portugal: A Multidisciplinary Approach Using Artificial Intelligence, Statistics, and Geographic Information Systems

1
CIMA, IIFA, University of Évora, 7000-671 Évora, Portugal
2
Department of Mathematics, ECT, University of Évora, 7000-671 Évora, Portugal
3
Department of Informatics, ECT, University of Évora, 7000-671 Évora, Portugal
4
ICT, IIFA, University of Évora, 7000-671 Évora, Portugal
5
Department of Geosciences, University of Évora, 7000-671 Évora, Portugal
6
Algoritmi Research Centre, University of Évora, 7000-671 Évora, Portugal
7
Department of Visual Arts and Design, EA, University of Évora, 7000-208 Évora, Portugal
*
Authors to whom correspondence should be addressed.
Information 2023, 14(4), 238; https://doi.org/10.3390/info14040238
Submission received: 7 March 2023 / Revised: 17 March 2023 / Accepted: 22 March 2023 / Published: 13 April 2023

Abstract

:
Road Traffic Accidents (RTA) cause human losses and irreparable physical and psychological damage to many of the victims. They also involve a very relevant economic dimension. It is urgent to improve the management of human and material resources for more effective prevention. This work makes an important contribution by presenting a methodology that allowed for achieving a predictive model for the occurrence of RTA on a road with a high RTA rate. The prediction is obtained for each road segment for a given time and day and combines results from statistical methods, spatial analysis, and artificial intelligence models. The performance of three Machine Learning (ML) models (Random Forest, C5.0 and Logistic Regression) is compared using different approaches for imbalanced data (random sampling, directional sampling, and Random Over-Sampling Examples (ROSE)) and using different segment lengths (500 m and 2000 m). This study used RTA data from 2016–2019 (training) and from May 2021–June 2022 (test). The most effective model was an ML logistic regression with the ROSE approach, using segments length 500 m (sensitivity = 87%, specificity = 60%, AUC = 0.82). The model was implemented in a digital application, and a Portuguese security force is already using it.

1. Introduction

According to the World Health Organization, approximately 1.3 million people around the world die each year as a result of RTA (leaving between 20 and 50 million people with non-fatal injuries). It is the leading cause of death for children, and young adults aged 5–29 [1]. Despite having registered a downward trend compared to previous years, in 2020 Portugal registered 27,725 accidents with victims, resulting in 536 deaths. These values place Portugal as the ninth-highest country in the European Union with the most fatalities per million inhabitants (52, i.e., 10 more than the European Union average) [2]. On the other hand, in Portugal, the economic impact caused by RTA is equivalent to 1.2% of the Gross Domestic Product (GDP), i.e., 2.3 billion euros [3].
It is urgent to take measures for effective prevention that lead to a very relevant reduction of human losses and irreparable physical and psychological damage that they cause too many of the victims. Identifying factors responsible for the occurrence of RTA and their severity, as well as building predictive models for the occurrence and severity, make these measures efficient and effective.
The project Modelling and Prediction of Road Traffic Accidents in the District of Setúbal (MOPREVIS) was conceived to respond to a need felt by a Security Force, the Portuguese Gendarmerie (Guarda Nacional Republicana–GNR). It has the purpose of reducing fatalities and serious injuries in the district of Setúbal, in Portugal. Although Setúbal is not one of the districts with the highest RTA number, serious RTAs are a relevant concern.
The main goal of MOPREVIS was achieved, by providing the GNR of Setúbal with a decision-making framework, that is based on scientific support. It gives a relevant contribution to optimizing the management of human and material resources for the prevention of RTA. The application allows visualization and analysis of data about RTA that occurred in the action area of GNR of Setúbal (approximately 5000 km 2 ) [4]. It has a Geographic Information System (GIS) atlas [5], based on a new severity indicator and on the identification of accident clusters with fatalities. Its greatest added value is the incorporation of a predictive part that combines results from the application of the statistical methodology, spatial analysis, and Artificial Intelligence models. The tool predicts RTA hotspots [6] and, for some selected roads, it predicts the occurrence of RTA on a given road segment at a given time of a given day. The results are displayed on a map with information by segment.
The principal objective of this study is to present the methodology that allowed to build of a prediction model for the occurrence of RTA on the road EN10 (Estrada Nacional no. 10). It is one of the main roads that cover rural areas with low population density and urban areas with high population density. Moreover, the characteristics of this road are very varied, e.g., the number of lanes is not constant, the presence of verges is not constant along the whole road, among others. The RTA under study are collisions, crashes, and pedestrian running over and not just crashes as is often considered in the literature [7,8].
As far as we know, this is the first time that a predictive model has been applied to a road with such heterogeneous characteristics. On the other hand, there is no monitoring of daily traffic, which is common on most roads in Portugal. Therefore, there are no predictive variables that have proven to be important in predictive models, such as traffic density, average speed, or a congestion index [9,10,11] or data collected in real-time [8].
The other objective of this work is to compare the performance of three Machine Learning (ML) models (Random Forest (RF), C5.0 and Logistic Regression (LR)), using different approaches for imbalanced data (random sampling, directional sampling, and Random Over-Sampling Examples (ROSE)) when using different segment lengths (500 m and 2000 m).
This paper is organized as follows. Section 2 presents a review of the literature on road accident prediction models. Section 3 presents the study area, data description, models, and methodology used in a very detailed way. Section 4 presents the results obtained and compares the different approaches. Section 5 presents a brief discussion and some final remarks in Section 6.

2. Literature Review

Several predictive models have been presented in the literature. An overview of data analysis techniques and various algorithms used to build predictions and to identify many risk factors is available in Chand et al. [12]. The systematic literature review presented in Silva et al. [13] describes various papers that used ML techniques to develop crash prediction models. A review of the state-of-the-art in the prediction of road accidents, comprising data mining and ML techniques, can be found in Gutierrez-Osorio and Pedraza [14]. Hossain et al. [15] provides a systematic review of the state-of-the-art of real-time crash prediction. In this last work, the authors concluded that despite the substantial progress predicting crash risk in real-time is still limited to an idea that is not ready for deployment. Mohammed et al. [16] presents predictive models based on geometric and traffic features, road access and segment length, speed, heavy vehicles, and econometric and social variables. In Abdulhafedh [17] is presented an overview of road crash prediction models for crash frequency, crash classification by severity, and crash frequency and severity. After these reviews, other works have emerged focusing on three types: severity of accidents and severity of victims (e.g., [18,19,20,21,22,23,24,25,26,27,28,29,30]), frequency of accidents (e.g., [31,32,33,34]), and occurrence of accidents (e.g., [7,8,9,10,11,35]), the category in which our study fits.
Ma et al. [9] applied the genetic programming (GP) approach with an elite gene bank to predict the occurrence of road accidents. An explicit traffic flow crash risk function LR and a backwards-propagation neural network, combined with a partial dependency plot, were used as baseline methods to examine the interpretability and accuracy of GP. An 8 km Shanghai Expressway was divided into 36 segments and was considered the congestion index, the average speed of the section and standard deviation, and traffic volume. This study concludes that the GP can select important variables and avoid over-fitting. Also, it concludes that the crash risk mainly comes from the traffic volume, the speed of the upstream segment, and the speed of the current segment. In this case, the accuracy of the GP method is greatly affected by data quality and variables in the model.
To predict real-time crashes by segment type (merge, diverge, weaving, and basic segments) on expressways in Florida, Wang et al. [8] used a nested logit model. Previously, an RF model is used to order the significant variables by importance in the accident occurrence. Data have information about crash information (crash time, coordinates, severity, type, and the number of vehicles involved); geometry of the road; weather; and traffic (0–10 min before a crash, at 1-min intervals, and from five detectors in the upstream and downstream). The weather parameter, indicating the pavement’s wet condition, had a similar effect on the crash risk between different segment types. The geometry and traffic parameters had significantly different impacts between different segment types. On the other hand, the study revealed that when the number of upstream ramps increases or when the distance between them and the target segment decreases, the crash risk will increase.
Man et al. [7] presents a combining Generative Adversarial Network (GAN) and transfer learning to examine the transferability of real-time crash prediction models under an extremely imbalanced data setting. A real-time crash prediction model is calibrated under an extremely imbalanced data setting with RTA from a Motorway in the UK. Then, the model is applied to predict traffic crashes for five other datasets by using transfer learning. A Wasserstein GAN (WGAN) was applied to generate synthetic crash data, and non-crash data were randomly under-sampled.
Guo et al. [10] established a traffic crash risk prediction model using LR with SMOTE. This model uses real-time traffic flow data and risky driving behaviour data to explore the traffic crash risk on freeways. The author concludes that the main variables that affect the risk of a crash accident are volume, average speed, the quotient between free flow speed and current average road speed, the coefficient of variation of speed, sharp acceleration and deceleration.
The prediction of accident occurrence by segment type is considered in Zheng et al. [11], with data from a highway in California, USA. From 35 detectors located an average of about 0.5 miles apart, data were collected every 30 s about traffic volume, vehicle speed and road occupancy, 5–10 min before the accident and over periods of 5 min without accidents as case-control samples in a 1:4 ratio (1 accident to 4 non-accidents), controlled for the types of segments (basic sections, weaving areas, merging areas and diverging areas), day of the week and time of day. The accident occurrence prediction is made separately by segment type, considering Bayesian Logistic Regression (BLR).
A Deep Spatio-Temporal Graph Convolutional Network (DSTGCN) is proposed in Yu et al. [35] to predict road accidents, considering records of Beijing, China. The proposed model is composed of three components: a spatial learning layer, a spatio-temporal learning layer and an embedding layer. Based on the accident records, citywide vehicle speeds, road networks and meteorological conditions, it was concluded that DSTGCN outperforms both classical and state-of-the-art methods.

3. Materials and Methods
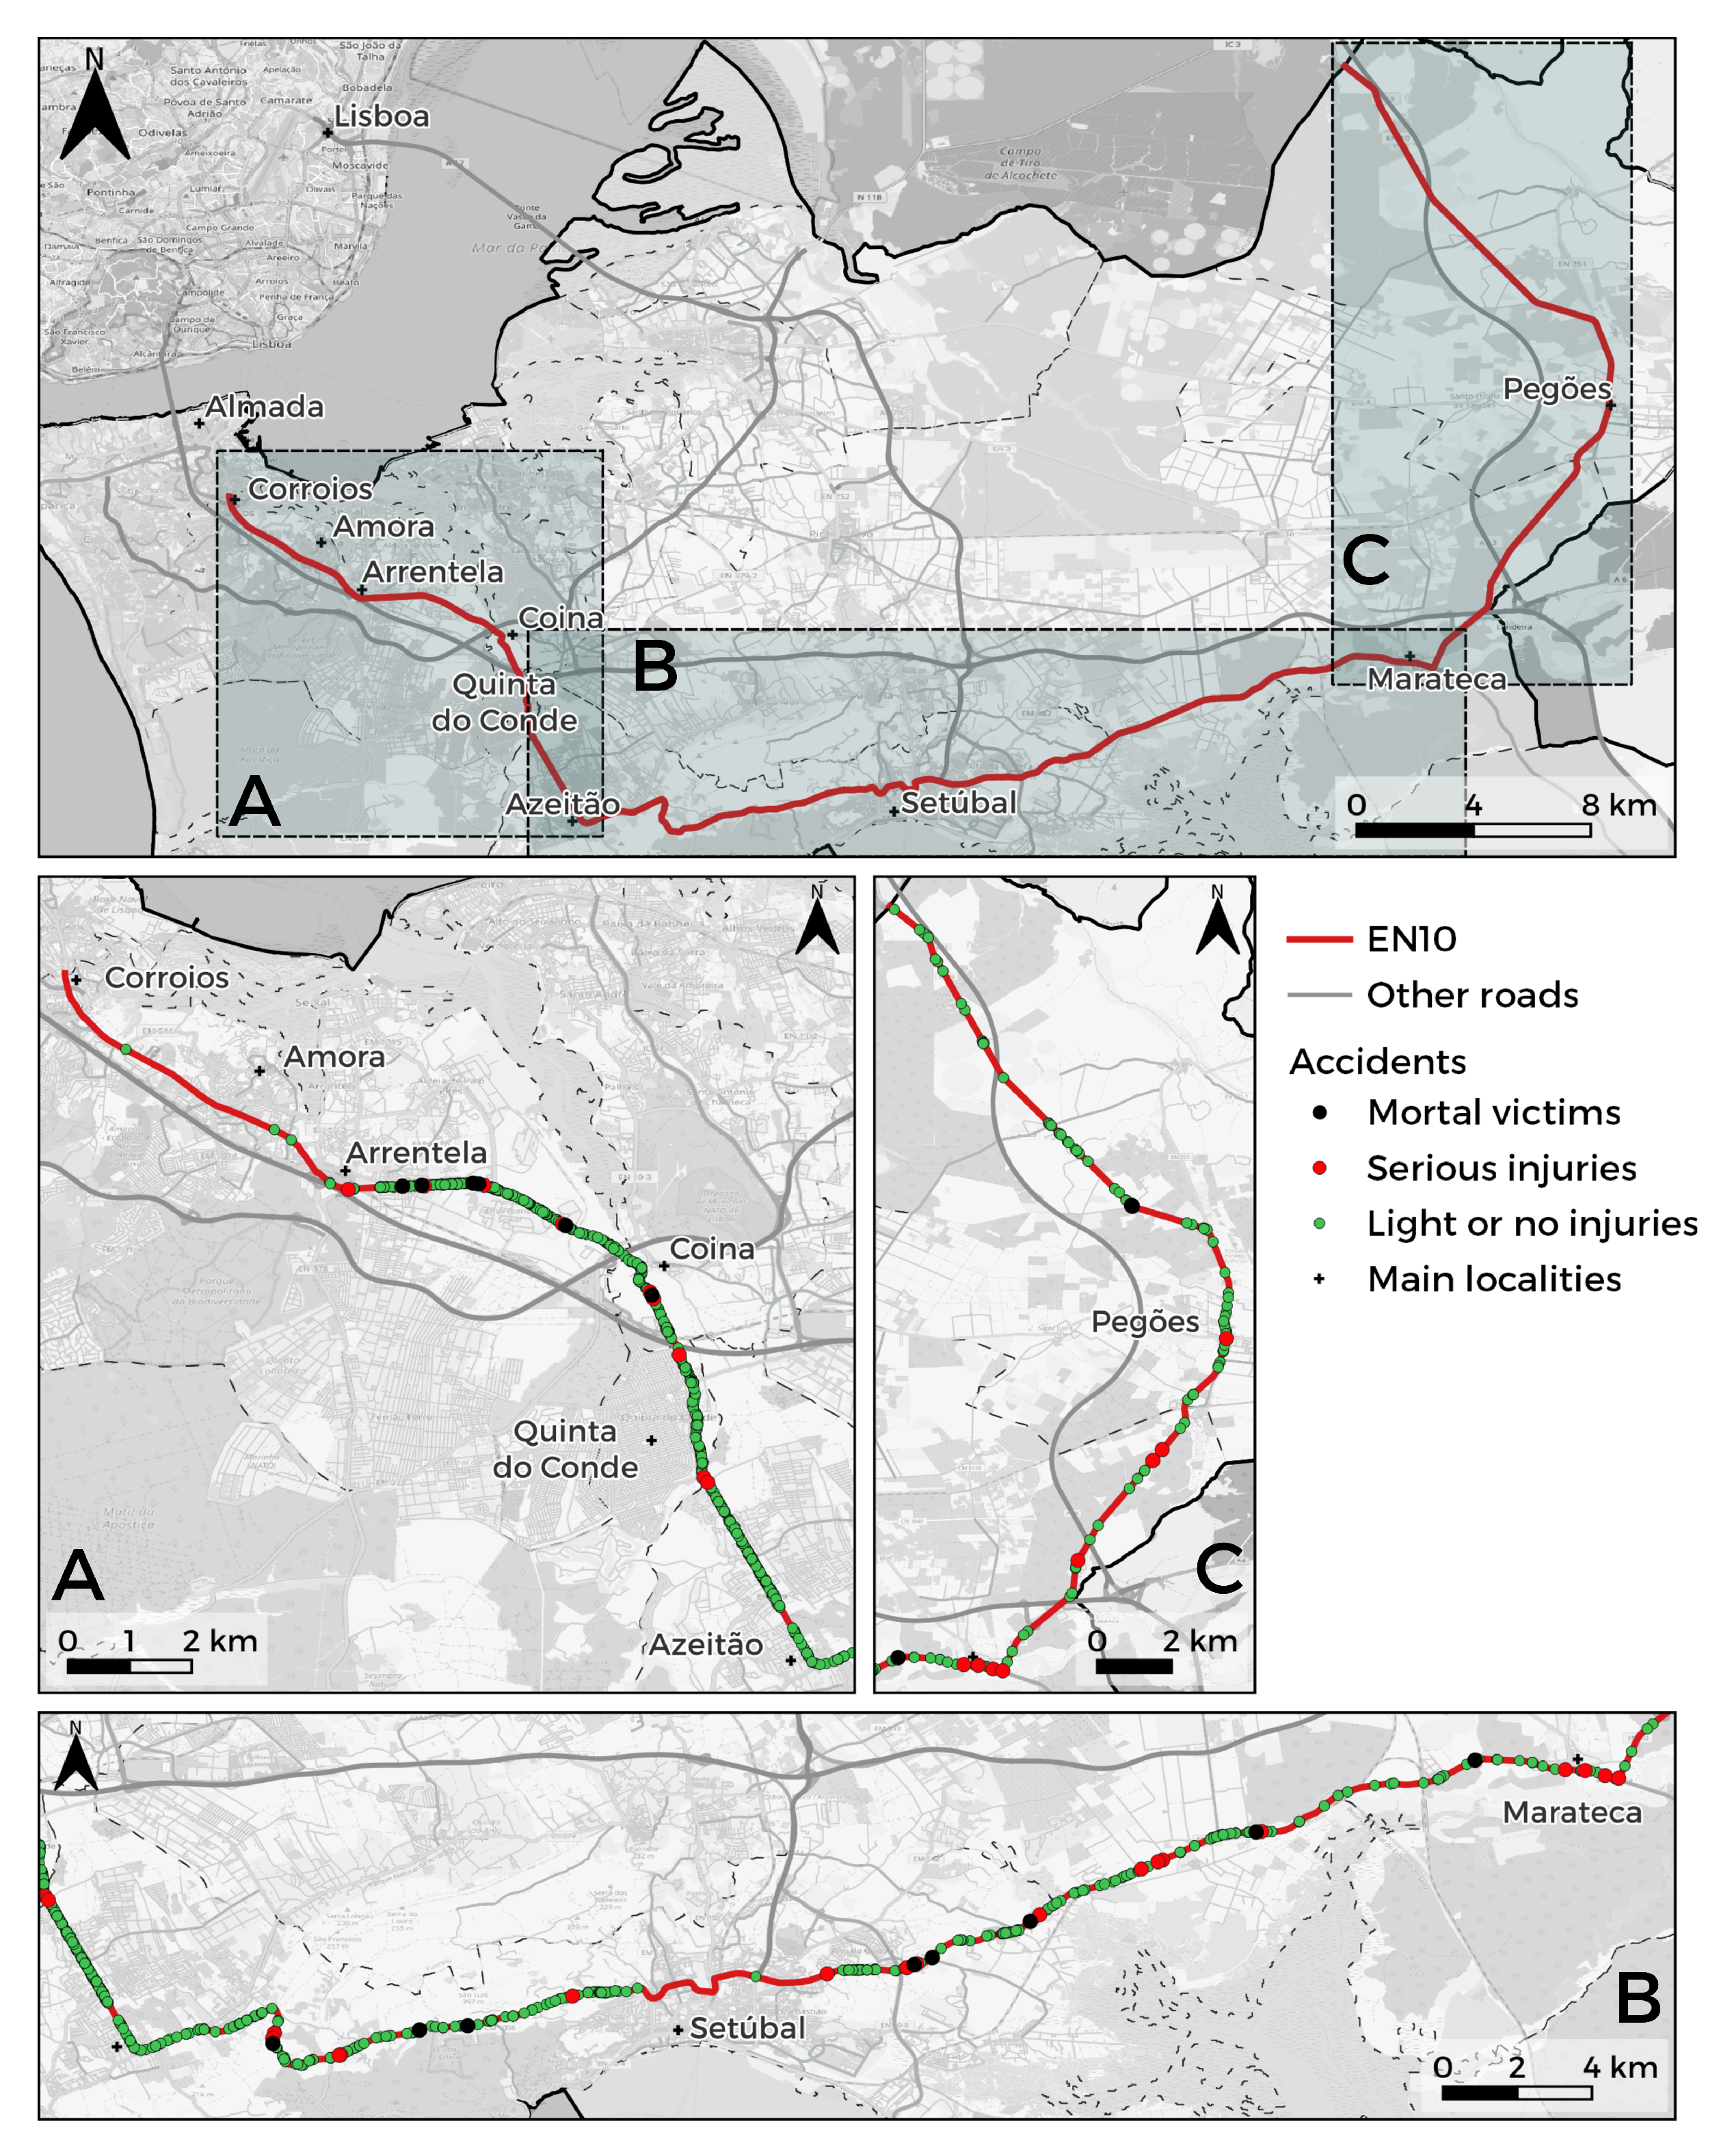
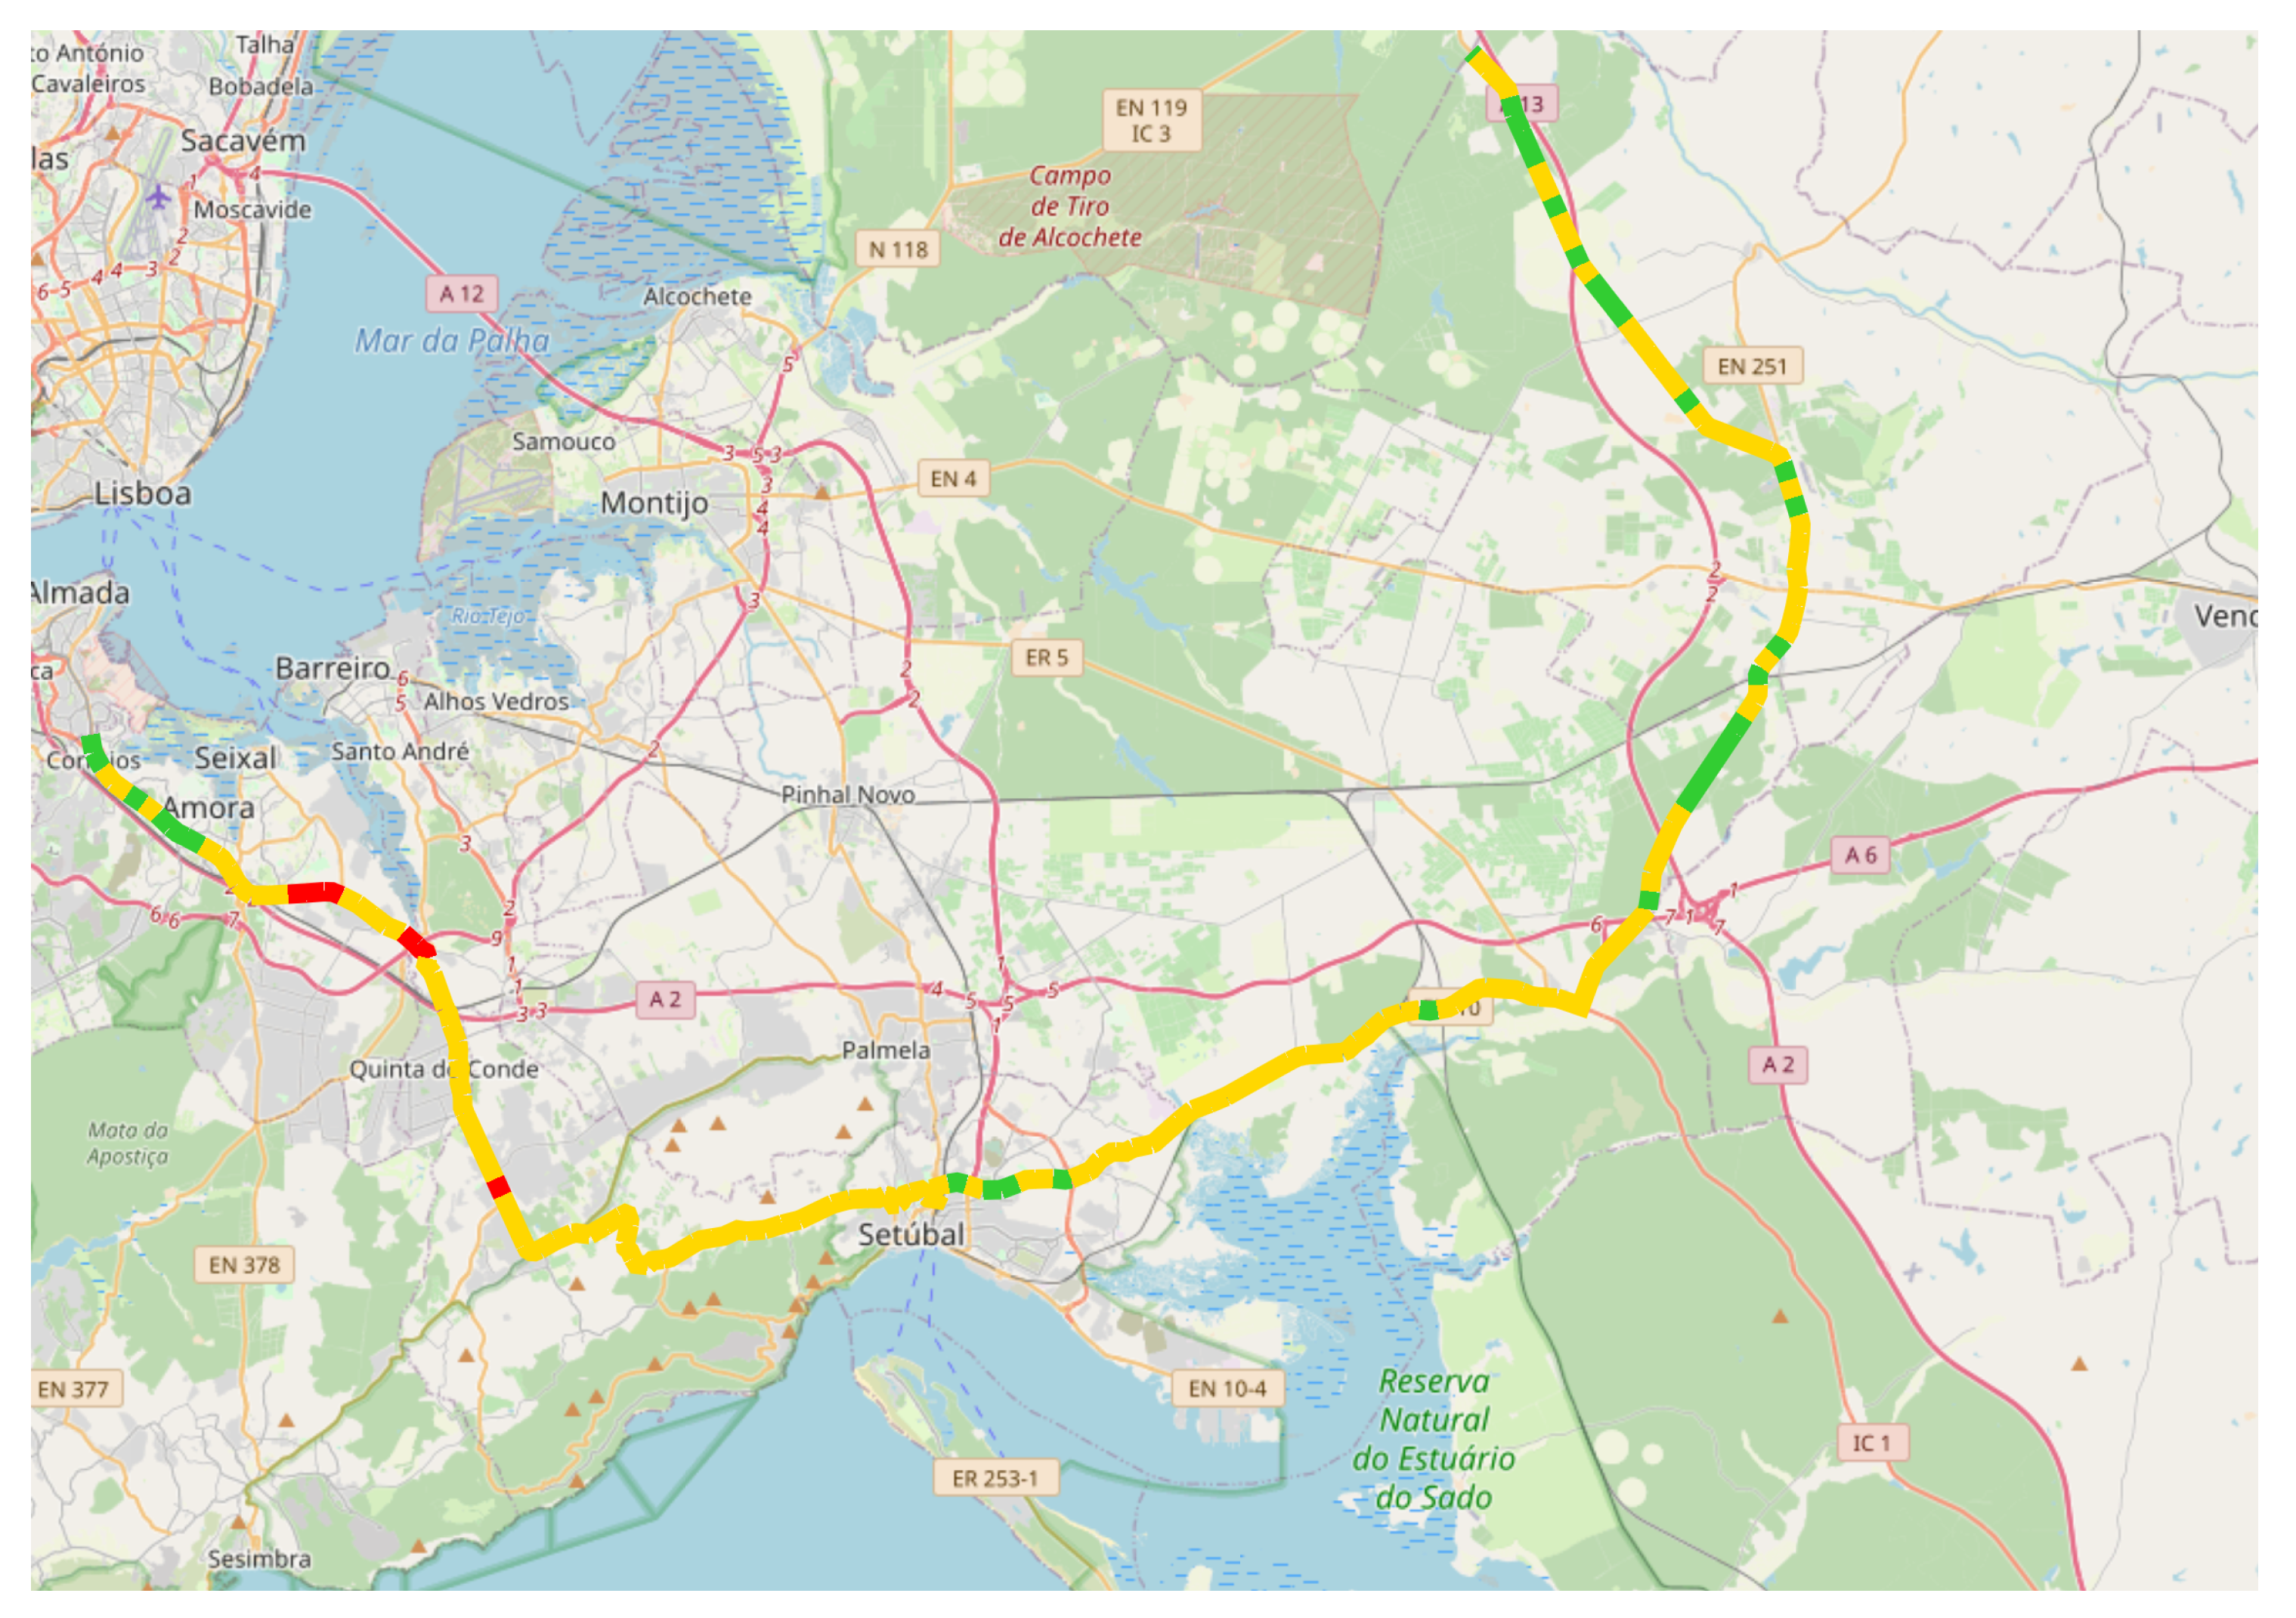
3.1. Study Area

The district of Setúbal is situated near Lisbon and spans an area of 5064 km 2 , divided into 13 municipalities that comprise both urban and rural areas. The district is accessible by important access roads to Lisbon and has many tourist spots that increase traffic flow during peak periods.
The EN10 is a public road that is 85.66 km long with 17.90 km running through towns. It belongs to the national road network of Portugal and is one of the ring roads in the Lisbon Metropolitan Area.
In the Setúbal district, the EN10 crosses important locations from East to West and North to South, and crosses the main highways and access to city high-traffic roads, providing access to most locations on the Setúbal Peninsula. This study divides the EN10 into three primary sections according to their general direction and importance for traffic flow in the district: a Northwest-Southeast section (A), a West-East section (B), and a South-North section (C), which extends beyond the district boundaries (Figure 1).

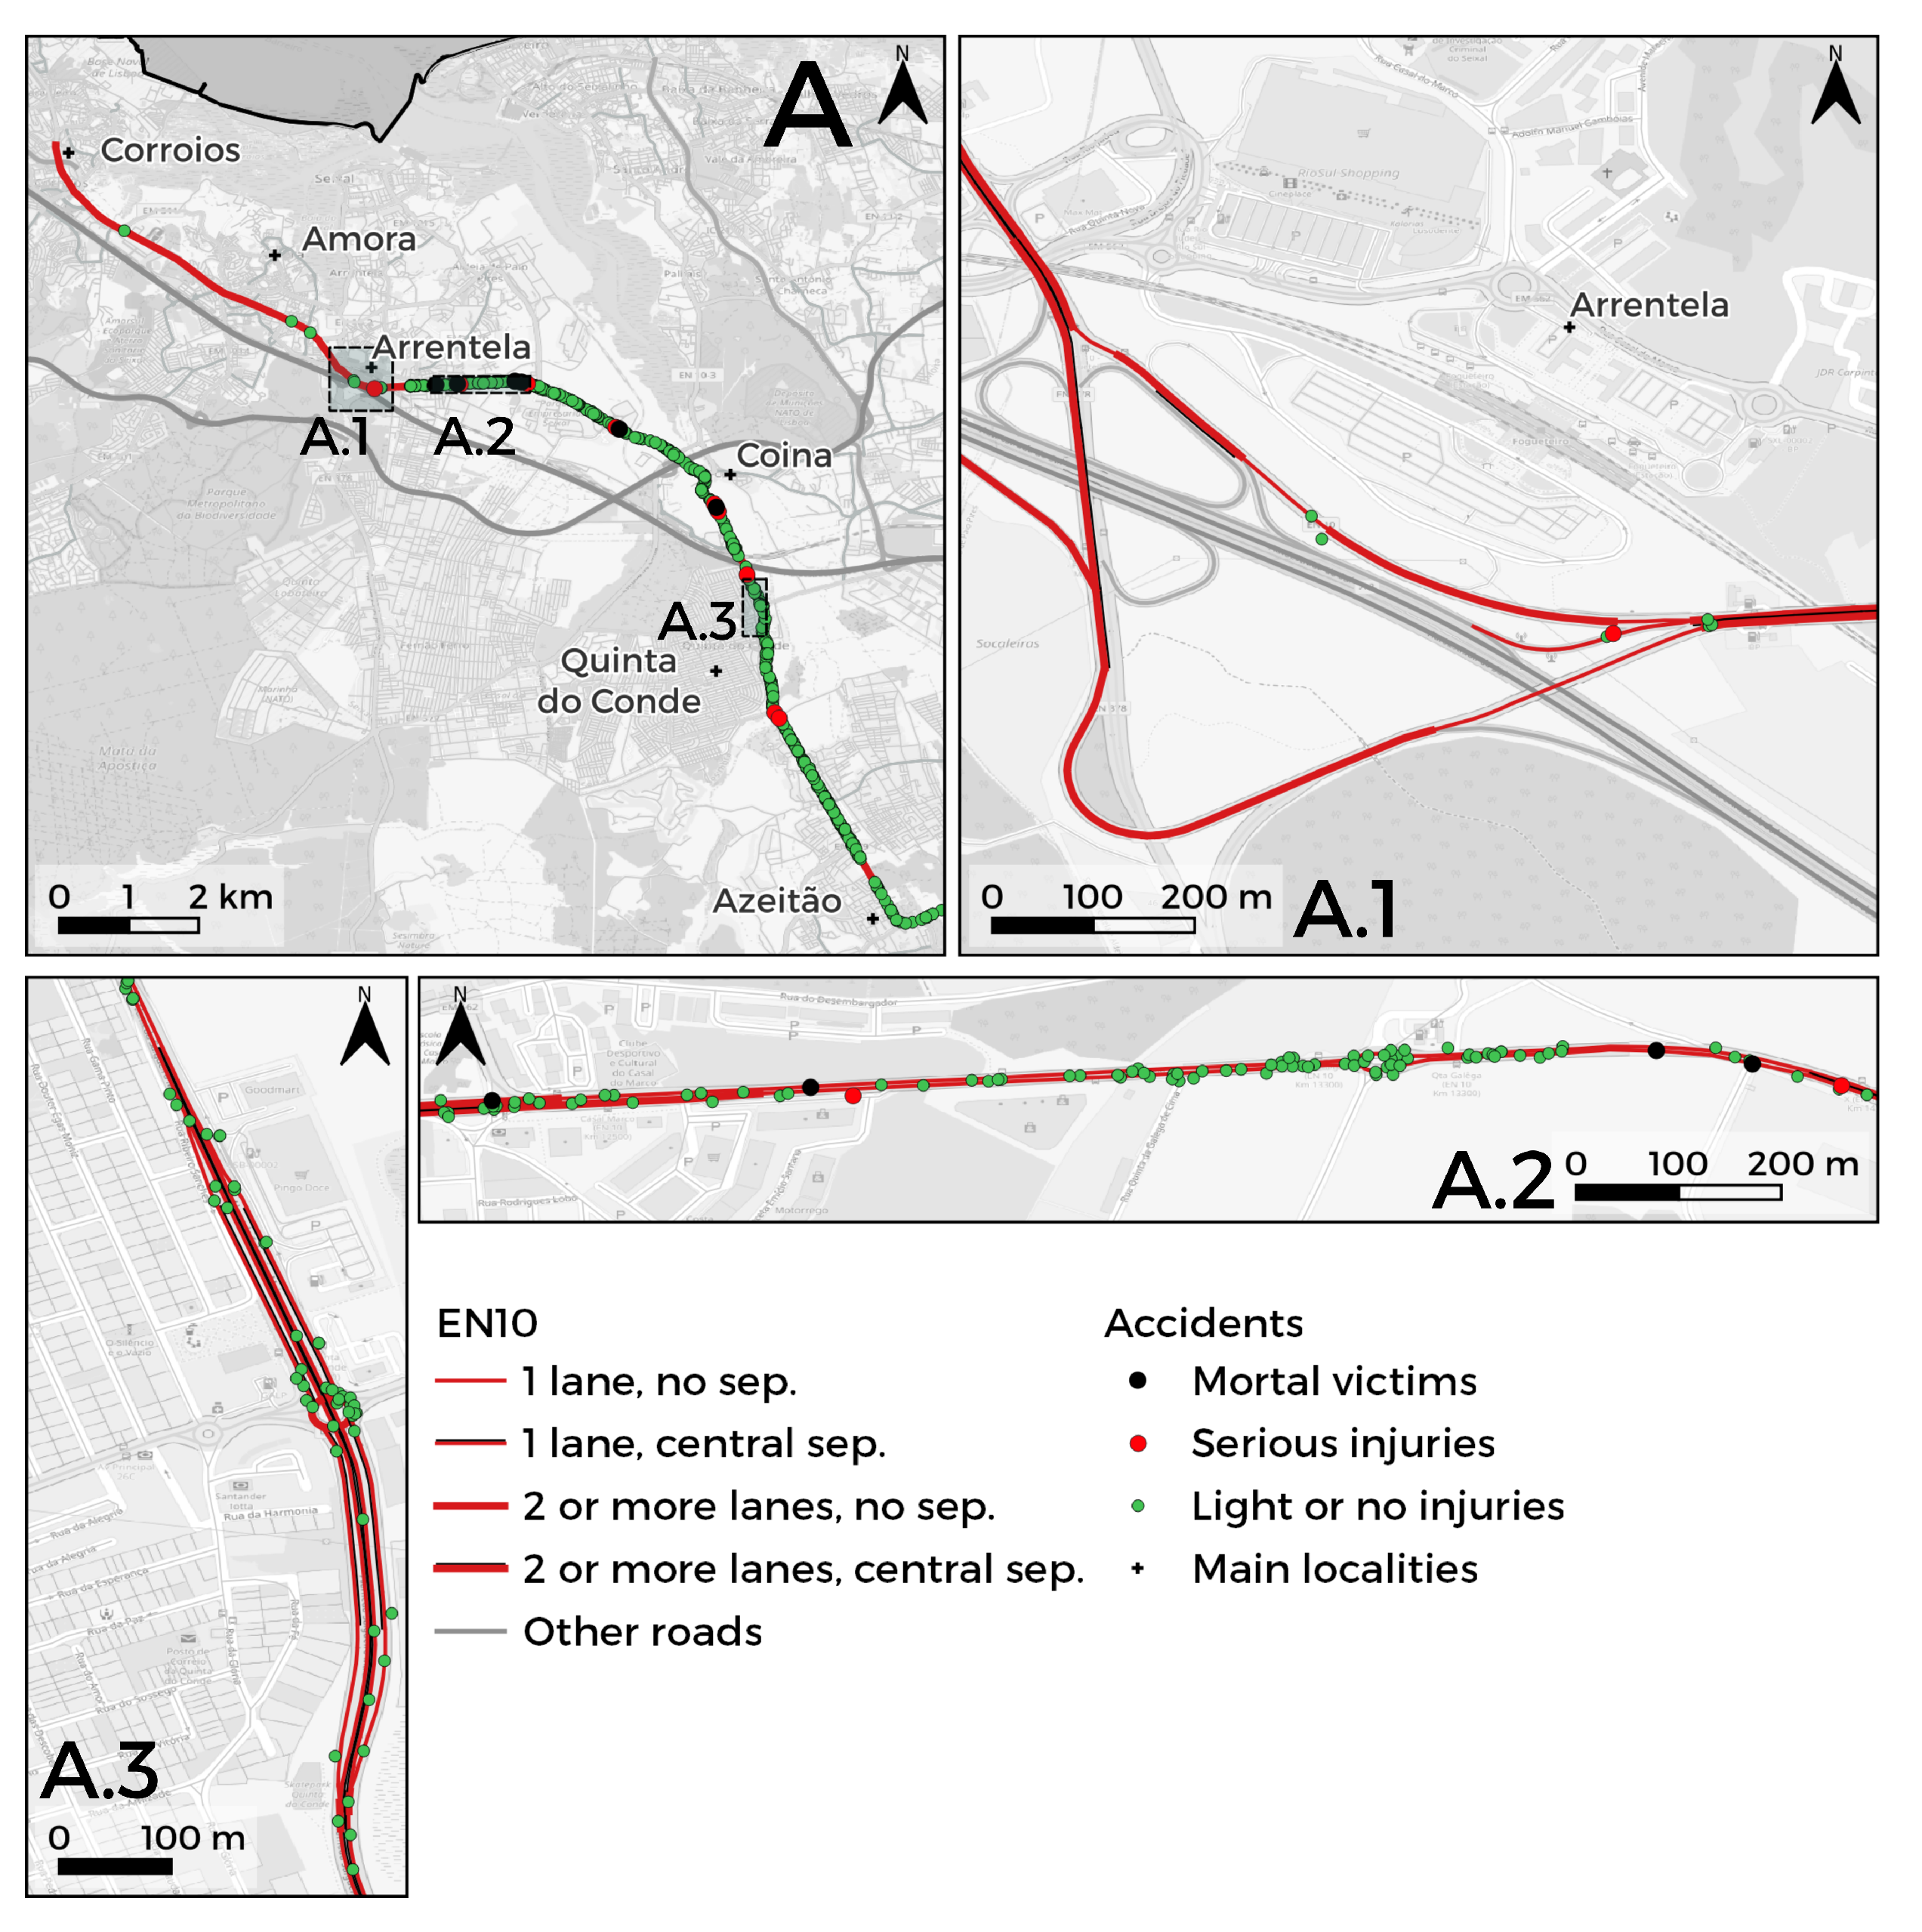
3.1.1. Section A: Northwest-Southeast

This section has the greatest flow of traffic, due to the daily commute to Lisbon. It has the most significant variation of the public road, with the addition of carriageways in both directions. Three areas stand out in this section based on their interaction with other influential roads, their complexity, or the number of RTA found in the area (Figure 2).
A.1: is a subsection where the carriageway of the EN10 separates, allowing interaction with two of the main roadways in the district, a highway and a national road. The separation occurs gradually to a progressively wider pavement. At the convergence with a national road, the north-south direction has three lanes, with the outer one acting as a deceleration ramp for the highway and and exit for the continuation of the EN10. This subsection has a high traffic volume, increasing the likelihood of RTA.
A.2: is a straight subsection where the carriage has two configurations: (i) two traffic lanes in each direction, separated by a narrow pavement, and (ii) one lane in each direction without a physical central divider.
A.3: there is a roundabout that connects this road with a densely populated village. The carriageway has two lanes in each direction, where the external lanes connect to the roundabout and the interior lanes carry through and underpass beneath the roundabout. This area has no accidents with fatalities and only one with serious injuries. Most of the accidents with damage are concentrated at intersections between the EN10 and other roads and when approaching the roundabout (Figure 2). It should be noted that the RTA represented in the figure correspond only to the fraction of RTA that were registered by the GNR. This area is within the jurisdiction of the PSP security force and close to their police station. Therefore, most of the RTA that occur here should be reported by the PSP, and not by the GNR.

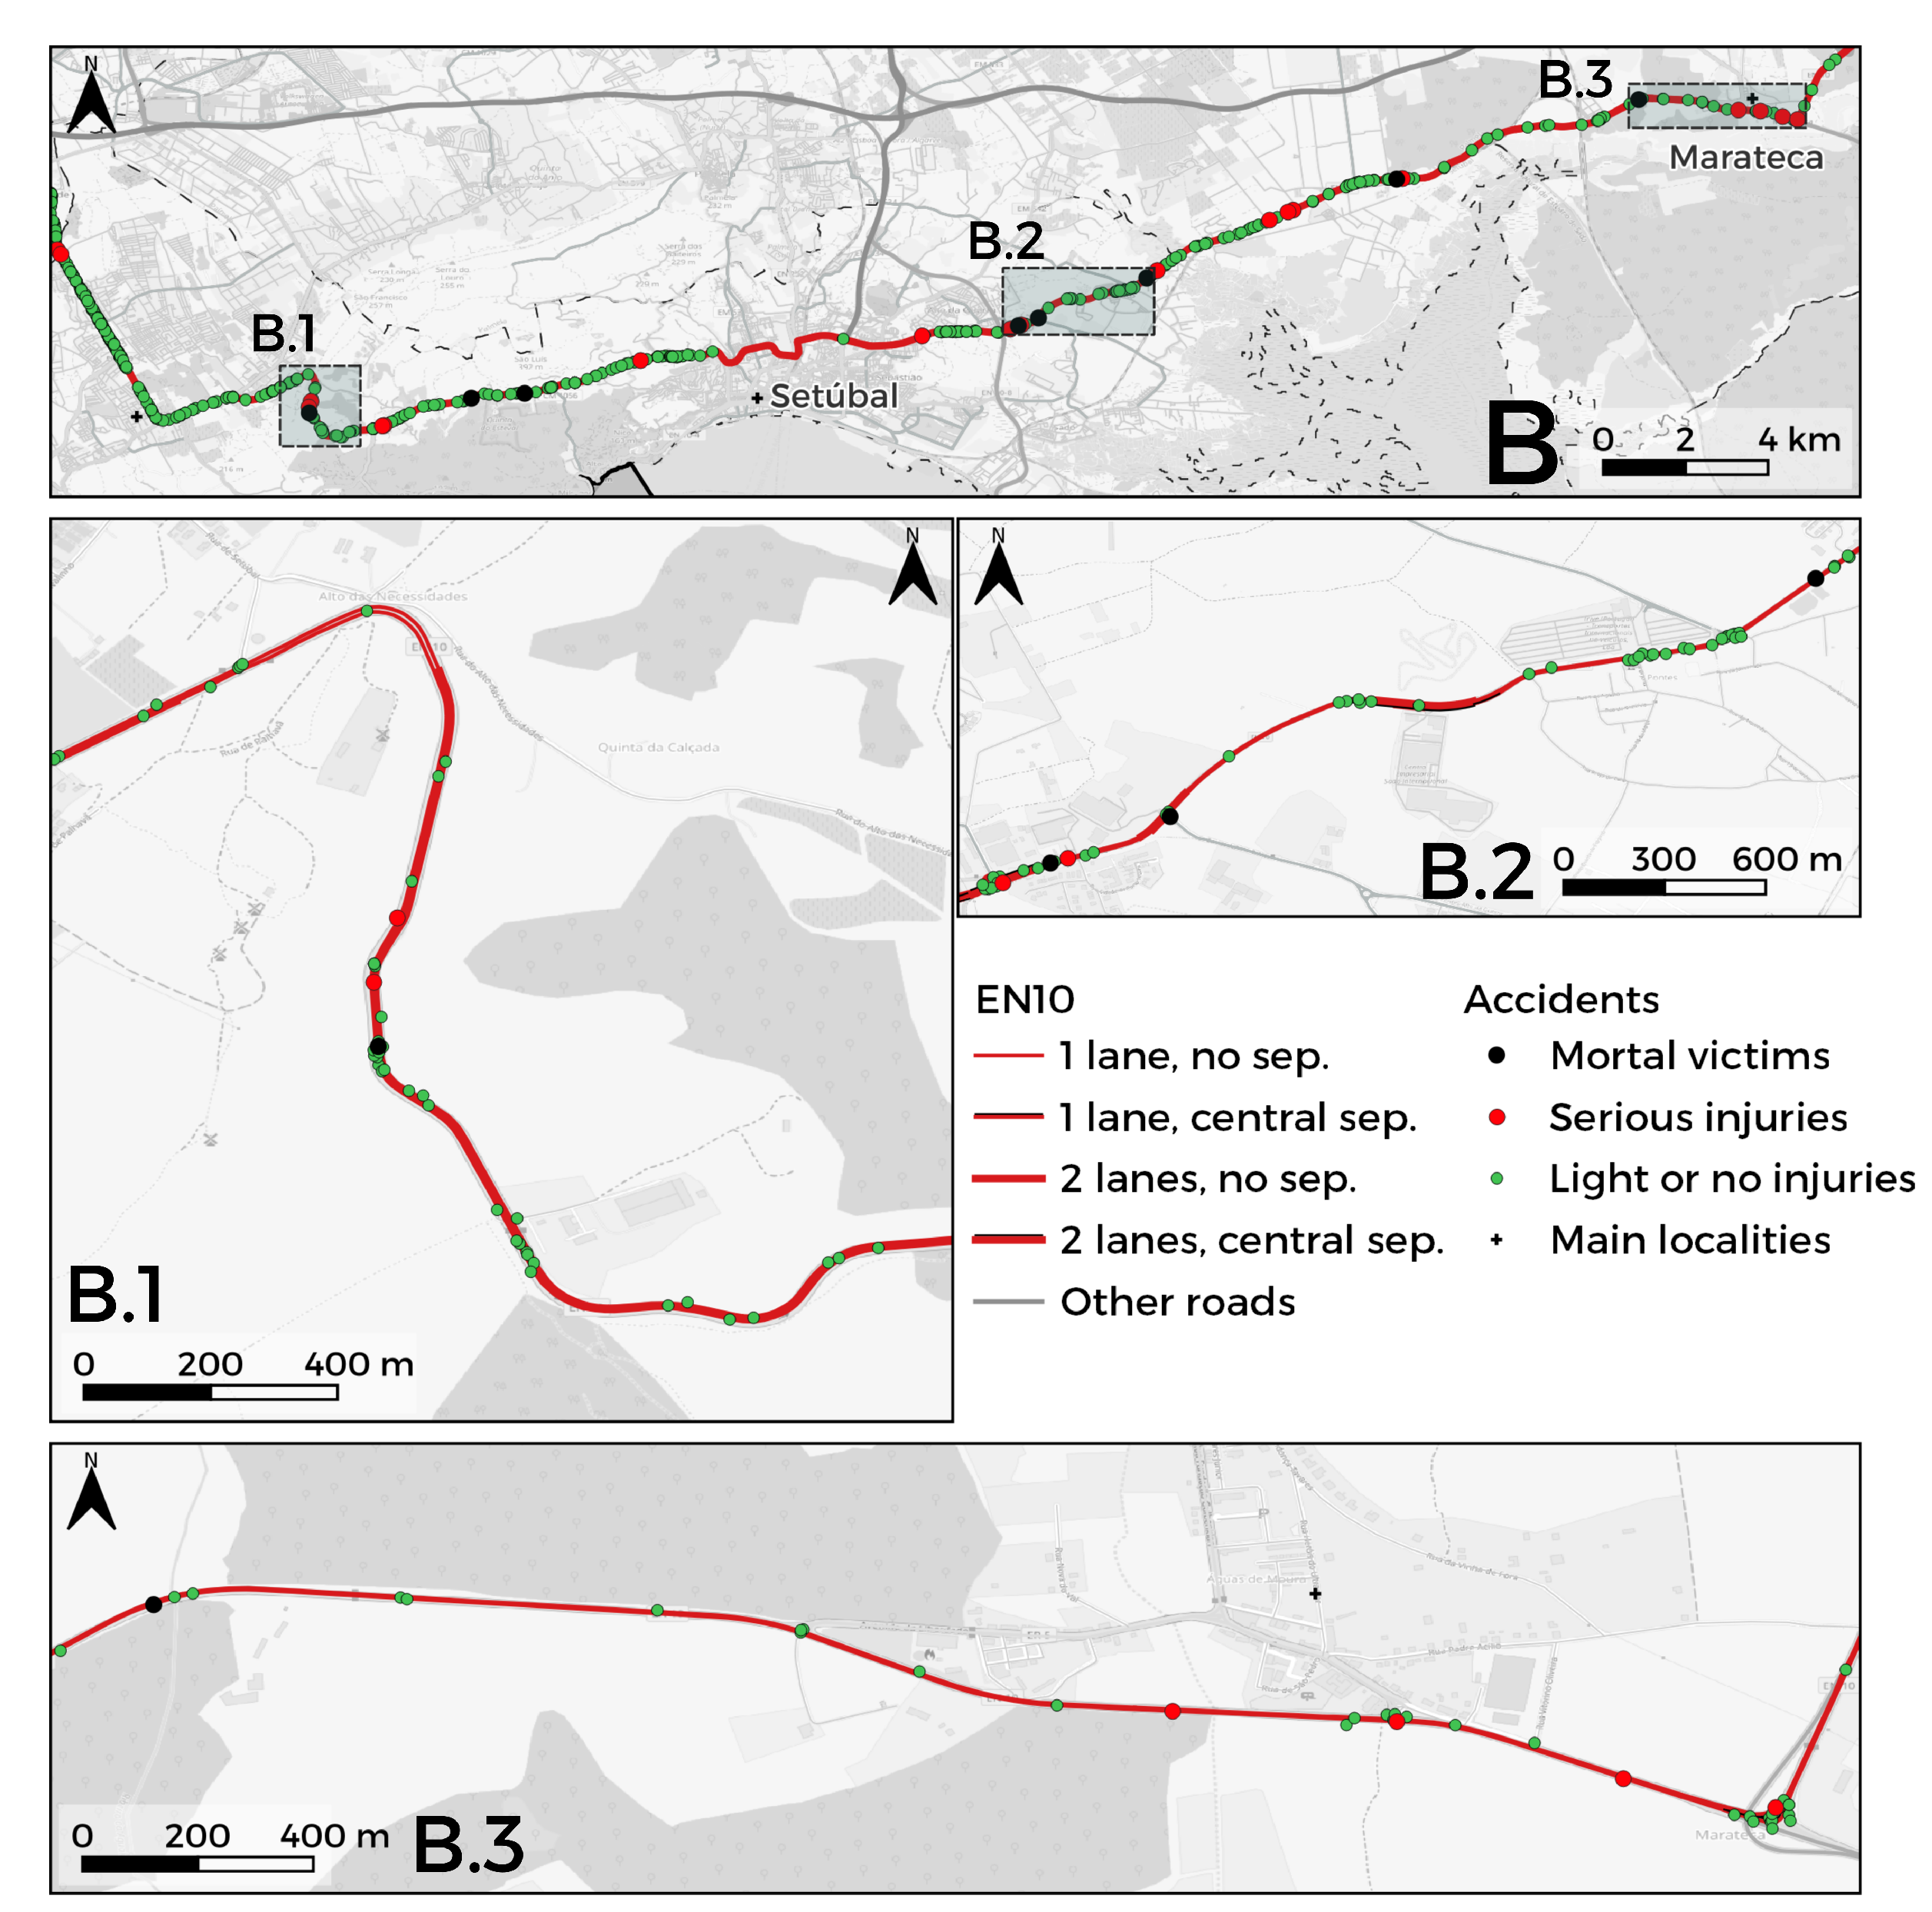
3.1.2. Section B: West-East

This section serves as an important alternative to the highway for those crossing the Setúbal Peninsula, and is one of the few accesses to the city of Setúbal. It should be noted that a significant portion of the city of Setúbal falls outside the GNR’s jurisdiction area, and there is no available information on RTA that occurred within the urban area. Three subsections in this section were selected based on their unique geometry, the concentration of RTA, or interaction with other influential roads (Figure 3).
B.1: here the EN10 follows an inclined curvilinear path. In the north-south direction, there is only one lane of traffic, while in the opposite direction there are two lanes. The two directions are separated by a set of flexible bollards. There is only one recorded RTA with fatalities and four others with serious injuries. The most serious RTA occurred near a bend in the middle of the slope, together with multiple RTA resulting in minor injuries or only damage, emphasizing the hazardous nature of this location.
B.2: is located shortly after the city of Setúbal, where several RTA of varying severity occur on a segment of the EN10. It displays straight and curvilinear lengths, with and without a central separator, and an important roundabout. The carriageway has only one lane per direction, which temporarily changes at intersections and accesses to local roads. Most RTA that occur here result in minor injuries or damage, except for six severe RTA, three of which are near the roundabout.
B.3: in this subsection, the EN10 turns north, and the complementary itinerary begins towards the South of Portugal. A central divider is present just in this part. The carriageway has one lane per direction. This area concentrates numerous RTA, many of them serious, particularly in the first few meters of the itinerary route.

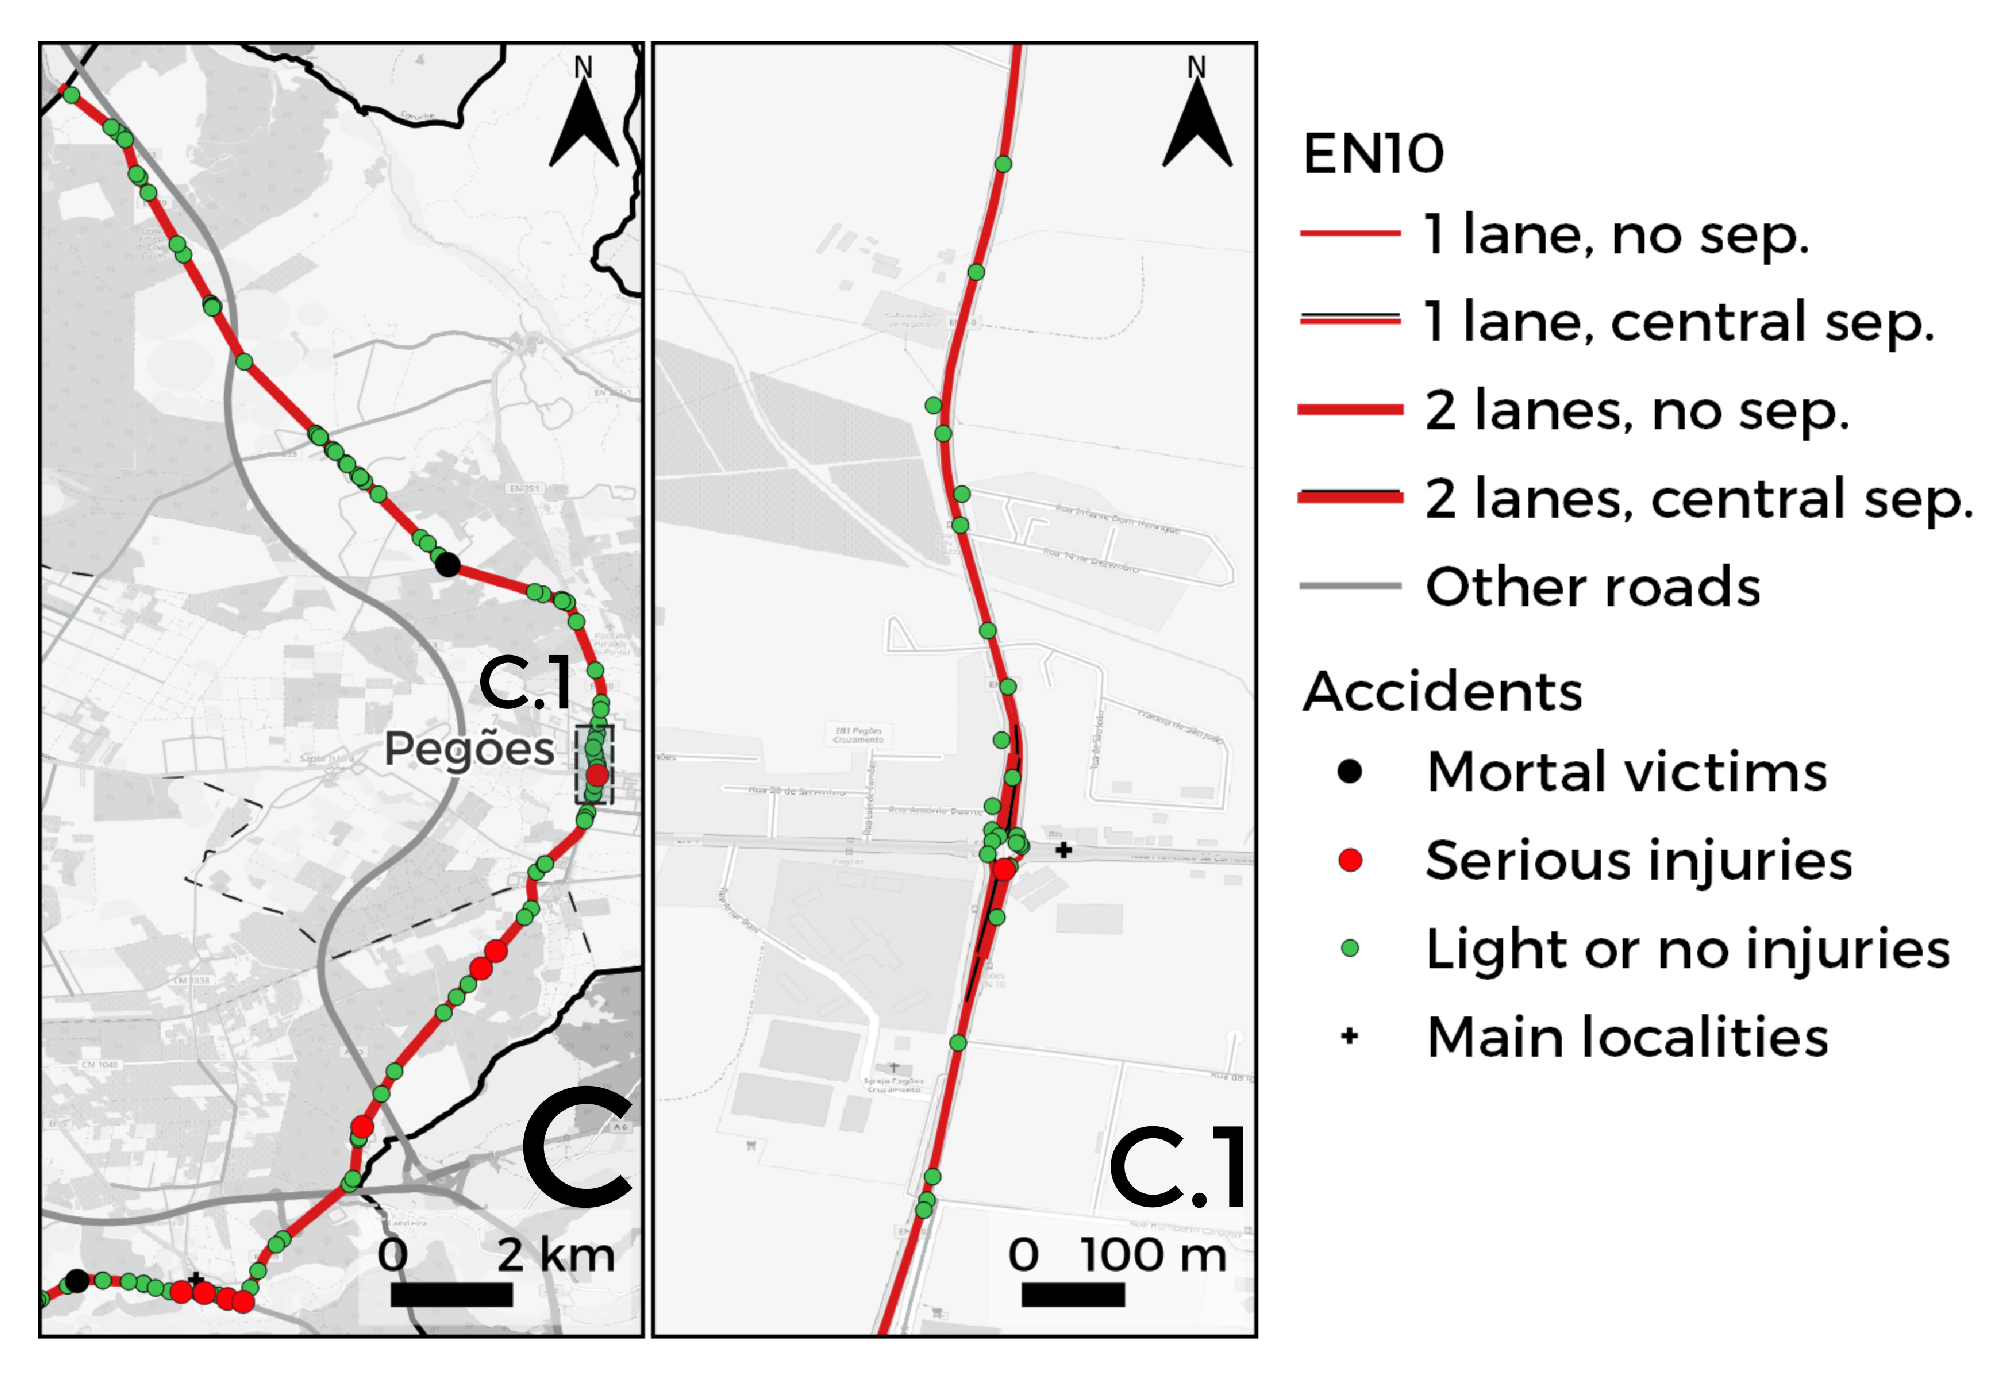
3.1.3. Section C: South-North

Despite its length, this segment lacks variation. The carriageway has one lane per direction with no central divider, and at intersections it has two lanes. There is one area that is worth highlighting (Figure 4).
C.1: it has the only roundabout in section C, which connects the EN10 to another national road. The roundabout has two traffic lanes at the entrance and a central separator dividing the directions. Both at the roundabout and its vicinity there is a concentration of RTA resulting in minor injuries or damages.

3.2. Segmentation of the EN10

The seed for the segmentation process of the EN10 was the roadway Shapefile obtained from OpenStreetMap (OSM), after applying the filter to select the road under study. Subsequently, and resorting to the QGIS platform (QGIS) [36], such Shapefile was extended to incorporate sections that, albeit belonging to the EN10, did not appear in the filter above. Therefore, obtaining a new file, containing the complete road.
Afterwards, a simplification was made by eliminating access roads to the carriageway, and converting separate tracks into a single line. This way, results in a Shapefile with 182 lines, where each line represents a variable-sized section of the average line that crosses the main road of the EN10. The aggregation of these lines into a single one is crucial to guarantee the correct segmentation of the road; for this purpose, a script was created in R that automates the process, and segments the route into specific lengths. The result was then validated in the QGIS.
Following, these segments were combined with data from the road network, pavement quality index, vertical signalling, number of trees and RTA. For vertical signs, each category was broken down into different sets, and for accidents, subsets were created according to their severity.
To unite the different data, it is necessary to find the centroid of each segment. Then all objects are converted into simple features. This class transformation allows assigning to each centroid the distance of the closest section of each information about the road, which was used as a variable. This variable, unite the identifier of each section of each data external to the centroid of the segment.
In the case of accidents, a buffer was used around the segmented road to describe the accidents corresponding to each segment–in this case, 15 m–and then crossed with on-site accidents. The total number of accidents was counted and how many victims of each severity class occurred, how many signs there were in each vertical signalling category, and, finally, how many trees there were per segment.
Establishing a relationship between the accident id and the respective segment identifier was an important step. On the one hand, for the subsequent addition of complementary information to the segments. On the other hand, since the severity index of each accident allowed to calculate an average, median, and maximum severity index for each segment. Lastly, this merged information about the roads, vertical signs and accidents was exported into a Shapefile and a CSV.
The Shapefile was added to QGIS where a final verification of the segment lengths. A quality test was carried out too, comparing the number of accidents with that indicated in the road file, and some values obtained from the files received with all information about the road. Given the irregular spatial distribution and small extension of bridges and tunnels, the “bridge” and “tunnel” variables were corrected in this last step, ensuring the correct identification of the sections with their presence. Finally, information on geometry and coordinates was added.
For the study case at hand, we explored two road segmentations: one with 500 m segments and another with segments of 2000 m. Afterwards, accident information was crossed-reference with each defined road segment, adding an extra buffer of 15 m.

3.3. Data

When an RTA occurs in Portugal, the security forces that take care of the occurrence (in this case the GNR) fill out the Statistical Bulletin of Road Accidents (Boletim Estatístico de Acidentes de Viação–BEAV). This instrument aims to characterize the circumstances in which the road accidents occurred, as well as the individuals and vehicles involved in the accident [37]. BEAV is divided into two distinct parts: (1) to be filled in all accidents; (2) to be filled only in accidents with victims. The first part contains the essential elements for identifying the accident, and general information about vehicles, drivers, and the number of victims. When occurring a road accident with just property damage, only this information is available. If a road accident with victims occurs, the second part is intended to describe the accident, vehicles, drivers, and individuals involved.
The National Road Safety Authority (Autoridade Nacional de Segurança Rodoviária–ANSR) updates the information about the injuries of the victims 30 days after the RTA. The severity of injuries of the victims, within 30 days of the occurrence of the accident, are classified as [37]:
  • fatality: victim who dies;
  • severe injury: victim whose bodily injury requires hospitalization for more than 24 h and who does not die within 30 days of the accident;
  • minor injury: victim whose bodily injury did not require hospitalization, or whose hospitalization has been less than 24 h, and who does not die within 30 days of the accident.
Meteorological information at the time and place of the accident was provided by the Portuguese Institute of Sea and Atmosphere (Instituto Português do Mar e da Atmosfera–IPMA) at the meteorological station closest to the accident. From Portuguese Infrastructures (Infraestruturas de Portugal–IP) it was possible to obtain information about the characteristics of the road where the RTA occurred.
It is important to reinforce that the objective of this work is to develop a predictive model to be used in real-time by the security forces. For this reason, we should only consider predictive variables that can be known prior to the occurrence of the RTA. Thus, we will only use meteorological variables, temporal variables and variables related to the road characteristics. The following predictive variables were used, in their original form:
  • Road characteristics: segment id (factor variable with categories between 1 and 172 when segments of 500 m are considered, and between 1 and 45 when segments with 2000 m are considered); road layout (curve or straight road); type of road intersection (an intersection, a junction, an entrance connecting branch, a roundabout or outside a road intersection); the number of lanes (1 or 2); quality of pavement classification (categorical variable with 12 categories); type of roadside (segment with paved, unpaved or non-existence roadside); the existence of a tunnel/bridge in the segment and the number of trees in the segment;
  • Atmospheric conditions: precipitation, temperature; wind speed; and if is sunny/rainy at a given hour;
  • Temporal characteristics: year, month, day of the week, hour, holiday, and if it is a school day;
  • Road signals: number of vertical signs; giving away priority signs, complementary signs, confirmation signs, turn signs, information signs, proximity of a locality sign, obligation signs, danger signs, pre-signalling signs, prohibition signs, some other kind of signs, the lane selection and the route allocation signs;
  • Velocity information: the speed limit on that segment, and the historical values of the average speed on the segment, in Km/h (given by Waze–https://www.waze.com/pt-PT/live-map/, (accessed on 30 January 2022).
Data validation involved the confirmation of the RTA location and therefore detailed maps of the locations were spatially analysed to attest their position. Conflicting locations or non-conformable sites were corrected, and when no definitive decision was possible, they were discarded. The total number of non-conformable positions on the EN10 was negligible.
This work analyses historical RTA that occurred on the EN10, between 1 January 2016 and 31 December 2019, and were reported in the BEAV. To validate the predictive models is used RTA data on the EN10 between from 1 May 2021 to 5 July 2022. Therefore, data from the period corresponding to the COVID-19 pandemic were not considered, since it was very atypical and do not translate the reality.

3.4. Negative Samples Generation

After the segmentation process explained in Section 3.2, the road segments only have the positive samples, i.e., the information referring to an RTA occurrence.
Therefore, there was no data regarding when accidents didn’t occur, i.e., the negative samples. To create such samples, the process is started by generating all the dates, including hours, from 1 January 2016, until 31 December 2019, and from 1 May 2021, until 5 July 2022 (excluding the cases when there were accidents).
Such dates were enriched with the following temporal dependent variables: seasonal movement (yes, no); traffic peak (yes, no); day shifts (early/night, going to work, morning or afternoon, leaving work); school period (yes, no); sunrise or sunset period (yes, no); and holidays period (yes, no).
The generated temporal information was then cross-referenced with the road segments, for the two segmentation cases mentioned above.
Finally, each pair date/hour and segment was enriched with meteorological information. For that, it is considered the weather stations closest to the segments, getting hourly precipitation (mm), hourly wind direction (°), hourly temperature (°C) and hourly wind speed (m/s). Such historical meteorological information was obtained from https://snirh.apambiente.pt/ (accessed on 30 December 2022).
The outcome of this process is the negative samples of our dataset.

3.5. Machine Learning Models

To predict the occurrence of an RTA in a given segment, ML classification algorithms were used. The response variable was defined as  y = 1  if, for a segment of the road, in a given period, an RTA has occurred, and  y = 0  if in the same segment and period, there is no RTA occurrence.
Following previous results [4], the best supervised ML algorithms for RTA data from the same case study were the C5.0 and the RF. However, when only a small sample was available to train the models, these algorithms do not perform better than a fitted statistical LR model. For this predictive study, a statistical LR model with good performance could not be obtained due to the high number of coefficients arising from the road segments (171 for the 500 m case). For that reason, we fitted an ML LR model, which is better suited for predictions, and also enables to observe how an ML LR behaves when a statistical one couldn’t be fitted.
RF is one of the most used classification ML algorithms, and it consists in building decision trees on different samples, collecting the majority voting to provide the final prediction for classification problems. C5.0 is a decision tree algorithm that uses an information entropy to determine the best rule that splits the data at that node. The LR is, like RF, one of the most used ML algorithms, and is useful when the main goal is to obtain accurate predictions instead of inference. For that reason, an LR algorithm was considered. A detailed description of each of the ML algorithms can be found in Gutierrez-Osorio and Pedraza [14] and Jo [38]. Other supervised ML algorithms could be used, but we intended to compare the most used ones.
The performance of each ML algorithm was compared for the two road segment sizes, and using three approaches to deal with the imbalance of the data: a random negative sampling approach (RNS), a directional negative sampling approach (DNS), and a ROSE approach. Note that the negative sampling approach described in Section 3.4, creates a severely imbalanced dataset, being the occurrence of the RTA the minority class.
In the RNS approach, is obtained a random sample from the negative cases (the majority class), being four times the number of positive cases (the minority class), resulting in a 4:1 relation between the negative and the positive cases.
In the DNS approach, for each RTA, the hour, the day of the week, the month, and the number of the road segment is registered. For each of these variables, it is selected, at random, another value from its possible range, maintaining all other explanatory variables of the dataset. The result is also a 4:1 relation between the negative and the positive cases, but with the difference that now the negative cases are very similar to the positive cases.
Finally, the ROSE approach [39] consists in obtaining a random sample from the negative cases, also four times the positive cases, and then oversampling the negative cases by replicating the minority class. It allows obtaining synthesized RTA from the existing ones. Therefore, after sampling from the negative samples to have a 4:1 relation in the dataset, the oversampling allows obtaining approximately a 1:1 relation between the negative and the positive cases.
In accordance with a thoughtful and operational decision by the GNR, the ML models are adjusted looking to get a cut-off point to maximize the sensitivity, while maintaining the specificity, when possible, up to 60%. To evaluate the performance of the ML models, the discrimination measures usually used are accuracy, sensitivity, specificity, positive predictive values (PPV) and negative predictive values (NPV). For imbalanced data, the sensitivity is a more interesting measure than the specificity, but both measures can be combined into a single score balancing both measures, called the geometric mean or G-Mean [40]. The F-score or the F-measure, combines into a single measure the balance between positive predictive values and sensitivity, while Matthew’s correlation coefficient (MCC) uses all the information of the confusion matrix in a single metric. The AUC, the area under the ROC curve, is also obtained since it is a common performance measurement for a classification problem at various threshold settings. It represents a measure of how the model is capable of distinguishing between the positive and the negative classes.
All analyses were conducted using R version 4.0.4 [41].

3.6. Models Fitting

Data was pre-processed to be used in the ML algorithms, being deleted some observations due to missing values and no missing values’ imputation was made. The dataset was also transformed using a design matrix, by expanding factors into dummy variables, into a total of 84 predictors.
When the negative samples were added, the dataset had 1139 entries with RTA and 6,029,871 entries with no accidents when the EN10 road was segmented in 500 m. When segments size 2000 m were considered, the dataset had 1139 entries with accidents, and 1,506,621 with no accidents.
The description of the training dataset, and how the parameters were tuned in each ML algorithm for each sampling approach, are next described. When considering the EN10 road segmented in sections of 500 more 171 predictors (identifying the 172 segments) were added in each ML, and the following steps were done:
  • RNS approach: after the pre-processing phase, a random sample of the negative samples is obtained such that the majority class has four times more cases than the minority class. The training dataset has now 1114 entries with RTA and 4416 without RTA. The LR uses a 10-fold cross-validation. The C5.0 uses 20 boosting iterations and a rules model. For the RF, the number of variables randomly collected to be sampled at each split time was 255, with a 10-fold cross-validation.
  • DNS approach: same procedure as in the random sampling approach, but in the RF the number of variables randomly collected to be sampled at each split time was 128, with a 10-fold cross-validation.
  • ROSE approach: after the pre-processing phase and random sampling of the negative samples such that the majority class has four times more cases than the minority class, the minority class was oversampled using the ROSE technique. The training dataset has now 4230 entries with RTA and 4270 without accidents. The LR uses a 10-fold cross-validation, the C5.0 a 25 repetitions bootstrap with 20 trials and a rules model. In the RF, the number of variables randomly collected to be sampled at each split time was 128, with a 10-fold cross-validation.
When considering the EN10 road in segments of 2000 m length, it was applied the same approach as the one used for the 500 m case and for each ML. In this case, more 44 predictors (identifying the 45 segments) were added in each ML, since we have fewer segments, and in the:
  • RNS approach: The number of variables randomly collected to be sampled at each split time was 127;
  • DNS approach: The RF the number of variables randomly collected to be sampled at each split time was 64;
  • ROSE approach: The RF used 64 for the number of variables randomly collected to be sampled at each split time. After the oversampling approach, the training dataset has 4175 entries with RTA and 4325 without RTA.
The test dataset has 393 entries with RTA and 2,265,872 entries without RTA when the EN10 road was segmented in 500 m and 568,253 entries without RTA when EN10 was segmented in 2000 m. The same approach was applied to the test dataset regarding the performance evaluation of the models and the sampling approaches.
When considering the EN10 road in segments 500 m lengths, after pre-processing the data, we have for the
  • RNS approach: the final test dataset had 393 entries with RTA and 1552 entries without RTA.
  • DNS approach: the final dataset had 393 entries with RTA and 1552 entries without RTA.
  • ROSE approach: the final dataset had 1013 entries with RTA and 928 entries without RTA.
When considering the EN10 road splitted into segments of size 2000 m, after pre-processing the data, we have for the
  • RNS approach: the final test dataset had 372 entries with RTA and 959 entries without RTA.
  • DNS approach: the final dataset had 372 entries with RTA and 959 without RTA.
  • ROSE approach: the final dataset had 972 entries with RTA and 175 entries without RTA.

4. Results

From the information about the RTA that occurred on the EN10 during the period 2016–2019 (train data), the following can be highlighted:
  • 1139 total RTA (4% of the RTA recorded in the Setúbal district) of which 299 were with minor injuries, 29 with serious injuries and 16 with deaths.
  • 954 RTA were collisions, 165 were crashes and 20 were pedestrian running-over.
  • The highest number of RTA was recorded in the municipalities of Setúbal (n = 467), Seixal (n = 291) and Sesimbra (n = 126).
  • The majority of RTA with victims occurred on level roads with a straight line; a large part of the pavement was recorded with good quality and in places with a paved roadside.
  • About 10% of the RTA occurred at sunrise/sunset times.
  • The highest number of RTA was registered during working hours (59.2%, n = 674) (i.e., between 07:00 and 20:00) and working days (72.1%, n = 821) (Monday to Friday).
  • The majority of RTA involved light vehicles (833 out of 1261, 73.4%), 184 (16.2%) involved motorcycles and 118 (10.4%) involved heavy vehicles.
  • In 1059 RTA at least 1 driver was subjected to alcohol control. From a total of 2005 drivers who tested for alcohol, approximately 3% of them reported a rate above the legal limits (i.e., rate above 0.5 g/L), resulting in RTA’s with 3 serious injuries and 1 death.
From the information about the RTA that occurred on the EN10 between 1 May 2021 and 5 July 2022 (test data), the following can be highlighted:
  • 293 RTA (4% of the RTA recorded in the Setúbal district) of which were registered 92 with minor injuries, 10 with serious injuries and 2 with deaths.
  • 236 RTA were collisions, 51 were crashes and 6 were pedestrian running-over.
  • The highest number of RTA was recorded in the municipalities of Setúbal (n = 102), Seixal (n = 94) and Sesimbra (n = 45).
  • The majority of RTA with victims occurred on level roads with a straight line; a large part of the pavement had reasonable quality and in places with a paved roadside.
  • Only 8% of the RTA not occurred at sunrise/sunset times.
  • The highest number of RTA was registered during working hours (79.5%, n = 233) (i.e., between 07:00 and 20:00) and working days (76.1%, n = 223) (Monday to Friday).
  • The majority of RTA involved light vehicles (73.8%, n = 214), 58 (20%) involved motorcycles and 18 (6.2%) involved heavy vehicles.
  • In 95 RTA, at least 1 driver was subjected to alcohol control. From a total of 170 drivers who tested for alcohol, approximately 2% of them reported a rate above the legal limits (i.e., rate above 0.5 g/L), resulting in RTA’s with 3 minor injuries.
The results of the performance of LR, RF and C5.0 algorithms, for each of the sampling methods, are presented in Table 1, Table 2 and Table 3.
With the RNS approach, when EN10 is divided into segments of 500 m in length, both the LR and the C5.0 perform very closely to each other and are slightly better than the RF (Table 1). It can be achieved 88.8% of correct predictions of RTA using the LR algorithm. Mathew’s correlation coefficient is about 0.44 in the LR, which confers a high correlation between the observed and predicted classifications. Moreover, the G-mean, which measures the balance between classification performances on both the majority and minority classes, is slightly higher as well for the LR, with a value equal to 0.73. Comparing the results when the EN10 is divided into segments of 2000 m in length, is again the LR that presents better performance than the two other algorithms. The sensibility, the G-mean and the MCC are higher in the LR algorithm. The prediction performance of LR with the RNS approach is slightly better when considering segments with 500 m instead of 2000 m.
With the DNS approach, when EN10 is divided into segments 500 m in length, LR performs a little better than the RF and the C5.0 algorithms (Table 2). It can be achieved 67.9% of correct predictions of RTA. Mathew’s correlation coefficient is about 0.21 and the G-mean of 0.63, which confers not a too high correlation between the observed and predicted classifications, but a good balance between classification performances on both the majority and minority classes. For 2000 m long segments, the C5.0 algorithm slightly outperformed the other two algorithms. Overall, the predictive performance was better when considering segments 500 m long.
With the ROSE approach, when EN10 is divided into segments 500 m long, LR performs a little better than the RF and the C5.0 algorithms (Table 3). It is possible to get 87.1% correct predictions of RTA. Mathew’s correlation coefficient is also high with a value equal to 0.49 and the G-mean is equal to 0.72, which gives a high correlation between the observed and predicted classifications. Moreover, the AUC value of nearly 0.82, allows making an excellent distinction between RTA and no RTA occurrences. For segments of 2000 m in length, it is also the LR that presents better performance. This algorithm yields a higher value of the G-mean and the MCC. With the ROSE approach using a segment length of 500 m long slightly improves the prediction performance.
From the overall results, it is possible to conclude that:
  • The EN10 road, with shorter segments, improves the discrimination measures. Therefore, for this specific road with very heterogeneous characteristics, the usage of shorter segments improves the prediction performance;
  • When comparing the performance of the three approaches used to balance the RTA data, the ROSE approach performs better. Sampling the majority class, followed by an oversampling of the minority class (RTA), allowed us to obtain an approximately balanced dataset for training and testing and resulted in better prediction performance. It is noteworthy that DNS, by selecting negative cases similar to the positive cases, presents always worst results than RNS.
  • The LR algorithm presents a slightly better performance than C5.0, having both much better results than the RF, either in the DNS and ROSE approaches and for both segment lengths. For the DNS approach (the one with the worst performance) the C5.0 presents better discrimination measures than the LR.
Finally, according to the LR model, adjusted for 500 m segments length, with ROSE, the most important factors for the prediction are: the month of the year, the day of the week, the time of the day, whether it is a holiday or a school day, temperature, precipitation, wind speed, the historical average speed and the number of vertical traffic signs.

5. Discussion

RTA severity prediction generally explores the relationship between accident severity or victim severity and relevant factors (such as driver behaviour, vehicle characteristics, geometry, and road conditions). It provides critical information to emergency services and traffic managers to implement measures to reduce the side effects of the accident, such as providing faster medical assistance to people injured in the RTA, thus reducing the fatalities [42]. The predictive models of the occurrence of RTA enable the possibility to act in advance and take measures so that the accident can be avoided.
Predictive models for the occurrence of crash accidents have been used on expressways [8,9], motorways [7], freeways [10] and highways [11]. Recently, a study was published that considers a greater heterogeneity of roads and presented a proposal of a prediction model for the occurrence of traffic accidents but only related to the urban road network [35]. In our study, we considered RTA (crashes, collisions, or pedestrian running-over) on a road, which makes prediction more difficult. On the other hand, the road considered (EN10) has 85.66 km long, 17.90 km of which is within towns, and has various heterogeneous characteristics, such as the type of surface, the existence of roadsides in some sections and their suppression in other sections, among other aspects previously described.
Usually, there is accurate information about traffic volume, speed, and other traffic-related parameters on the road for which the prediction model is being obtained [8,9,10,11]. In some cases, the information is measured in short periods of time [8,11], or it may differ depending on the driver and vehicle [11]. In our case, there is no monitoring of daily traffic and, therefore, there are no such variables that have proved to be important in the prediction models. We must point out that the lack of information about these variables is common on most roads in Portugal, which reinforces the importance of implementing this type of model presented in our work.
The roads considered are often segmented [8,9,11] to adjust the models and different types of segments are considered [8,11], with cases in which a model is adjusted for each segment type [11]. However, the segment length effect is not analysed. We have studied the effect of road segment size on the predictive performance of the models. All segments were constant, which reduced the complexity of the model. The choice of the segment length was based on the existing literature, and the shortest length that allowed to have enough events in each segment was 500 m. We wanted to evaluate the effect of the segment sizes, and we considered segments with twice this length (1000 m–not presented in this study) and with 2000 m. We have concluded that for a road with such heterogeneity as EN10, a smaller length segment captures best the road characteristics, improving the model’s performance.
The problem of extremely unbalanced data is not always explicitly addressed [8,9,35]. When considering some approaches, it was SMOTE [10] and Wasserstein GAN [7] that performed best. In this paper, three approaches were considered to mitigate the issue of imbalanced data (RNS, DNS and ROSE), having concluded that ROSE allows the models to perform better. It was interesting to note that RNS provides better results than DNS. Maybe this is due to the similitude of positive and negative samples obtained in DNS and, with this, the models have more difficulty in correctly predicting a positive/negative case.
Finally, as previously described, this work is a significant contribution to the area of RTA prediction. It describes in detail, to our knowledge for the first time, the process of creating a predictive model for a road with such heterogeneous characteristics. The model that had better performance has already been implemented in an application (Figure 5) that is being used by the GNR in Setúbal, contributing to making this security force more effective and efficient in RTA prevention. It predicts the occurrence of an RTA on a given road segment at a given time and day. With this information, in the digital tool developed, all segments with a high probability of an RTA occurring are coloured red, those with an intermediate probability are coloured yellow and those that the model does not predict RTA are coloured green. With this information, the Setúbal GNR sends patrols to the segments with a higher risk of RTA and their presence greatly reduces the likelihood of an occurrence of an RTA in that location.
Since there is a limitation of resources for road surveillance in the district, this security force can use this predictive tool (which integrates predictive models for other 3 roads) to guide the available officers to where the probability of an accident is higher, making prevention work more effective. A recent report received from the security force that is testing this model (which is integrated into the digital tool), states that “...it’s possible to realize that in supporting decision-making, the tool facilitates the decision of the main highlights to broadcast to the patrols at the beginning of their shifts”.

6. Final Remarks

This paper describes the procedures for obtaining a model to predict the occurrence of RTA on a Road (EN10) in Portugal.
The methodology used a mixture of knowledge between artificial intelligence, statistics, and geographic information systems. It consists of four fundamental steps: (1) division of the road into segments of two different lengths (500 m and 2000 m); (2) generation of negative samples to get information about the periods and segments in which there were no accidents; (3) fitting 3 ML models (LR, RF and C 5.0) with 3 different approaches to mitigate the large imbalance data (RNS, DNS, and ROSE); (4) comparison of models’ performance.
Following this methodology, it was concluded that the LR with the ROSE approach, with segments of size 500 m, was the one with the best performance. This model and others, obtained using an identical methodology for three other roads in the district of Setúbal, were implemented in a digital application that supports the decision-making process of a security force in Portugal, the GNR. In this way, it will be possible for the GNR to better manage the human resources at its disposal, to effectively predict the occurrence of RTA on that road.
These types of models have never been implemented in Portugal. At an international level, there is no knowledge of the application of predictive models for the occurrence of RTA in this context, i.e., with a lack of information on some variables of great interest (such as specific information on vehicles and traffic intensity), as well in a road with heterogeneous features as the one considered.
The next research step will be the design of a predictive model for the occurrence of RTA with victims. In this case, the imbalance of the data will be even more pronounced. Other ML models should be considered (such as XGBoost and AdaBoost) and/or other approaches for data imbalance (such as extremely rare events).
Finally, it should be noted that this investigation was developed within a project (MOPREVIS) that was a success in linking the academic environment and multidisciplinary applied science to a concrete social problem, involving state—from central to local level—and private partners. It was a good networking practice.

Author Contributions

Conceptualization, all authors; methodology, P.I., G.J., D.S., P.N., A.A., M.S. and V.N.; software, P.I., G.J., D.S., P.N., A.A., M.S., V.N. and L.R.; validation, P.I., G.J., D.S., P.N., A.A., M.S., V.N. and P.R.M.; formal analysis, P.I., G.J., P.N., A.A., V.N., P.Q. and J.S.; investigation, all authors; resources, all authors; data curation, D.S., A.A., V.N., P.Q. and J.S.; writing—original draft preparation, P.I., G.J., D.S., P.N., A.A., V.N., P.Q. and J.S.; writing—review and editing, all authors; visualization, D.S., P.N., M.S. and V.N.; supervision, P.I. and G.J.; project administration, P.I. and V.N.; funding acquisition, P.I., G.J., P.N., A.A., V.N., P.Q. and J.S. All authors have read and agreed to the published version of the manuscript.

Funding

This research was funded by the Portuguese funding agency, FCT—Fundação para a Ciência e a Tecnologia, grant number FCT DSAIPA/DS/0090/2018, “MOPREVIS—Modelação e Predição de Acidentes de Viação no Distrito de Setúbal”, within the scope of the National Initiative on Digital Skills e.2030, Portugal INCoDe.2030.

Data Availability Statement

Restrictions apply to the availability of these data. Data was obtained from the Portuguese GNR in the context of the MOPREVIS project.

Acknowledgments

The authors are grateful for the data support given by ANSR, Infraestruturas de Portugal and IPMA.

Conflicts of Interest

The authors declare no conflict of interest.

Abbreviations

The following abbreviations are used in this manuscript:
ANSRAutoridade Nacional de Segurança Rodoviária (National Road Safety Authority)
BEAVStatistical Bulletin of Road Traffic Accidents
DNSDirectional Negative Sampling Approach
ENNational Road
GNRGuarda Nacional Republicana (National Republican Guard)
IPInfraestruturas de Portugal (infrastructures of Portugal)
IPMAInstituto Português do Mar e da Atmosfera (Portuguese Institute for Sea
and Atmosphere)
LRLogistic Regression
MCCMatthew’s Correlation Coefficient
MLMachine Learning
MOPREVISModeling and Prediction of Road Traffic Accidents in the District of Setúbal
NPVNegative Predictive Values
PPVPositive Predictive Values
RFRandom Forest
RNSRandom Negative Sampling Approach
ROSERandom Over-Sampling Examples
RTARoad Traffic Accidents

References

  1. WHO. Preventing Injuries and Violence: An Overview; Technical Report; World Health Organization: Geneva, Switzerland, 2022.
  2. European Commission. European Road Safety Observatory. In Annual Statistical Report on Road Safety in the EU, 2021; Technical Report; European Commission, Directorate General for Transport: Brussels, Belgium, 2022. [Google Scholar]
  3. Lusa. Sinistralidade Rodoviária Tem Impacto Económico e Social Negativo de 1, 2% do PIB–Governo. 2018. Available online: https://www.rtp.pt/noticias/pais/sinistralidade-rodoviaria-tem-impacto-economico-e-social-negativo-de-12-do-pib-governo_n1112193 (accessed on 25 November 2022).
  4. Infante, P.; Jacinto, G.; Afonso, A.; Rego, L.; Nogueira, V.; Quaresma, P.; Saias, J.; Santos, D.; Nogueira, P.; Silva, M.; et al. Comparison of statistical and machine-learning models on road traffic accident severity classification. Computers 2022, 11, 80. [Google Scholar] [CrossRef]
  5. Nogueira, P.; Silva, M.; Infante, P.; Nogueira, V.; Manuel, P.; Afonso, A.; Jacinto, G.; Rego, L.; Quaresma, P.; Saias, J.; et al. Learning from Accidents: Spatial Intelligence Applied to Road Accidents with Insights from a Case Study in Setúbal District, Portugal. ISPRS Int. J. Geo-Inf. 2023, 12, 93. [Google Scholar] [CrossRef]
  6. Santos, D.; Saias, J.; Quaresma, P.; Nogueira, V.B. Machine learning approaches to traffic accident analysis and hotspot prediction. Computers 2021, 10, 157. [Google Scholar] [CrossRef]
  7. Man, C.K.; Quddus, M.; Theofilatos, A. Transfer learning for spatio-temporal transferability of real-time crash prediction models. Accid. Anal. Prev. 2022, 165, 106511. [Google Scholar] [CrossRef] [PubMed]
  8. Wang, L.; Wang, K.; Ma, W.; Abdel-Aty, M.; Li, L. Real-time safety analysis for expressways considering the heterogeneity of different segment types. J. Saf. Res. 2022, 80, 349–361. [Google Scholar] [CrossRef] [PubMed]
  9. Ma, X.; Lu, J.; Liu, X.; Qu, W. A genetic programming approach for real-time crash prediction to solve trade-off between interpretability and accuracy. J. Transp. Saf. Secur. 2022. [Google Scholar] [CrossRef]
  10. Guo, M.; Zhao, X.; Yao, Y.; Yan, P.; Su, Y.; Bi, C.; Wu, D. A study of freeway crash risk prediction and interpretation based on risky driving behavior and traffic flow data. Accid. Anal. Prev. 2021, 160, 106328. [Google Scholar] [CrossRef] [PubMed]
  11. Zheng, Q.; Xu, C.; Liu, P.; Wang, Y. Investigating the predictability of crashes on different freeway segments using the real-time crash risk models. Accid. Anal. Prev. 2021, 159, 106213. [Google Scholar] [CrossRef] [PubMed]
  12. Chand, A.; Jayesh, S.; Bhasi, A. Road traffic accidents: An overview of data sources, analysis techniques and contributing factors. Mater. Today Proc. 2021, 47, 5135–5141. [Google Scholar] [CrossRef]
  13. Silva, P.B.; Andrade, M.; Ferreira, S. Machine learning applied to road safety modeling: A systematic literature review. J. Traffic Transp. Eng. (Engl. Ed.) 2020, 7, 775–790. [Google Scholar] [CrossRef]
  14. Gutierrez-Osorio, C.; Pedraza, C. Modern data sources and techniques for analysis and forecast of road accidents: A review. J. Traffic Transp. Eng. (Engl. Ed.) 2020, 7, 432–446. [Google Scholar] [CrossRef]
  15. Hossain, M.; Abdel-Aty, M.; Quddus, M.A.; Muromachi, Y.; Sadeek, S.N. Real-time crash prediction models: State-of-the-art, design pathways and ubiquitous requirements. Accid. Anal. Prev. 2019, 124, 66–84. [Google Scholar] [CrossRef] [PubMed] [Green Version]
  16. Mohammed, A.A.; Ambak, K.; Mosa, A.M.; Syamsunur, D. A review of traffic accidents and related practices worldwide. Open Transp. J. 2019, 13, 65–83. [Google Scholar] [CrossRef] [Green Version]
  17. Abdulhafedh, A. Road crash prediction models: Different statistical modeling approaches. J. Transp. Technol. 2017, 7, 190. [Google Scholar] [CrossRef]
  18. Al-Mistarehi, B.W.; Alomari, A.H.; Imam, R.; Mashaqba, M. Using Machine Learning Models to Forecast Severity Level of Traffic Crashes by R Studio and ArcGIS. Front. Built Environ. 2022, 8, 860805. [Google Scholar] [CrossRef]
  19. Boo, Y.; Choi, Y. Comparison of mortality prediction models for road traffic accidents: An ensemble technique for imbalanced data. BMC Public Health 2022, 22, 1476. [Google Scholar] [CrossRef]
  20. Brühwiler, L.; Fu, C.; Huang, H.; Longhi, L.; Weibel, R. Predicting individuals’ car accident risk by trajectory, driving events, and geographical context. Comput. Environ. Urban Syst. 2022, 93, 101760. [Google Scholar] [CrossRef]
  21. Dong, S.; Khattak, A.; Ullah, I.; Zhou, J.; Hussain, A. Predicting and analyzing road traffic injury severity using boosting-based ensemble learning models with SHAPley Additive exPlanations. Int. J. Environ. Res. Public Health 2022, 19, 2925. [Google Scholar] [CrossRef]
  22. Yan, M.; Shen, Y. Traffic Accident Severity Prediction Based on Random Forest. Sustainability 2022, 14, 1729. [Google Scholar] [CrossRef]
  23. Ahmed, S.; Hossain, M.A.; Bhuiyan, M.M.I.; Ray, S.K. A Comparative Study of Machine Learning Algorithms to Predict Road Accident Severity. In Proceedings of the 2021 20th International Conference on Ubiquitous Computing and Communications (IUCC/CIT/DSCI/SmartCNS), London, UK, 20–22 December 2021; pp. 390–397. [Google Scholar] [CrossRef]
  24. Bedane, T.T.; Assefa, B.G.; Mohapatra, S.K. Preventing Traffic Accidents through Machine Learning Predictive Models. In Proceedings of the 2021 International Conference on Information and Communication Technology for Development for Africa (ICT4DA), Bahir Dar, Ethiopia, 22–24 November 2021; pp. 36–41. [Google Scholar] [CrossRef]
  25. Najafi Moghaddam Gilani, V.; Hosseinian, S.M.; Ghasedi, M.; Nikookar, M. Data-driven urban traffic accident analysis and prediction using logit and machine learning-based pattern recognition models. Math. Probl. Eng. 2021, 2021, 9974219. [Google Scholar] [CrossRef]
  26. Malik, S.; El Sayed, H.; Khan, M.A.; Khan, M.J. Road Accident Severity Prediction—A Comparative Analysis of Machine Learning Algorithms. In Proceedings of the 2021 IEEE Global Conference on Artificial Intelligence and Internet of Things (GCAIoT), Dubai, United Arab Emirates, 12–16 December 2021; pp. 69–74. [Google Scholar] [CrossRef]
  27. Assi, K. Traffic Crash Severity Prediction—A Synergy by Hybrid Principal Component Analysis and Machine Learning Models. Int. J. Environ. Res. Public Health 2020, 17, 7598. [Google Scholar] [CrossRef] [PubMed]
  28. Nour, M.K.; Naseer, A.; Alkazemi, B.; Jamil, M.A. Road traffic accidents injury data analytics. Int. J. Adv. Comput. Sci. Appl. 2020, 11, 762–770. [Google Scholar] [CrossRef]
  29. Yassin, S.S.; Pooja. Road accident prediction and model interpretation using a hybrid K-means and random forest algorithm approach. SN Appl. Sci. 2020, 2, 1576. [Google Scholar] [CrossRef]
  30. Mokoatle, M.; Vukosi Marivate, D.; Michael Esiefarienrhe Bukohwo, P. Predicting road traffic accident severity using accident report data in South Africa. In Proceedings of the 20th Annual International Conference on Digital Government Research, Dubai, United Arab Emirates, 18–20 June 2019; pp. 11–17. [Google Scholar] [CrossRef]
  31. Guerra, A.; Gadhiya, V.; Srisurin, P. Crash Prediction on Road Segments using Machine Learnings Methods. ASEAN Eng. J. 2022, 12, 27–37. [Google Scholar] [CrossRef]
  32. Ndume, V.A.; Rutalebwa, E.C.; Runyoro, A.A.K. Prediction of Road Accidents Trend in Tanzania Using ARIMA Model: The Road Safety Implication by 2021–2030. Int. J. Traffic Transp. Eng. 2022, 11, 1–7. [Google Scholar] [CrossRef]
  33. Farhan, A.; Kattan, L.; Tay, R. Collisions on local roads: Model development and policy level scenario analysis. Can. J. Civ. Eng. 2020, 47, 77–87. [Google Scholar] [CrossRef]
  34. Costa, J.O.; Maria, A.P.; Pereira, P.A.; Freitas, E.F.; Soares, F.E. Portuguese two-lane highways: Modelling crash frequencies for different temporal and spatial aggregation of crash data. Transport 2018, 33, 92–103. [Google Scholar] [CrossRef] [Green Version]
  35. Yu, L.; Du, B.; Hu, X.; Sun, L.; Han, L.; Lv, W. Deep spatio-temporal graph convolutional network for traffic accident prediction. Neurocomputing 2021, 423, 135–147. [Google Scholar] [CrossRef]
  36. QGIS Development Team. QGIS Geographic Information System. QGIS Association. Available online: https://www.qgis.org (accessed on 30 January 2022).
  37. ANSR. Manual de Prenchimento. Boletim Estatístico de Acidente de Viação. 2013. Available online: http://www.ansr.pt/Estatisticas/BEAV/Documents/MANUALPREENCHIMENTOBEAV.pdf (accessed on 25 November 2022).
  38. Jo, T. Machine Learning Foundations: Supervised, Unsupervised, and Advanced Learning; Springer: Cham, Switzerland, 2021. [Google Scholar]
  39. Menardi, G.; Torelli, N. Training and assessing classification rules with imbalanced data. Data Min. Knowl. Discov. 2014, 28, 92–122. [Google Scholar] [CrossRef]
  40. He, H.; Garcia, E.A. Learning from imbalanced data. IEEE Trans. Knowl. Data Eng. 2009, 21, 1263–1284. [Google Scholar] [CrossRef]
  41. R Core Team. R: A Language and Environment for Statistical Computing; R Foundation for Statistical Computing: Vienna, Austria, 2021. [Google Scholar]
  42. Gan, J.; Li, L.; Zhang, D.; Yi, Z.; Xiang, Q. An alternative method for traffic accident severity prediction: Using deep forests algorithm. J. Adv. Transp. 2020, 2020, 1257627. [Google Scholar] [CrossRef]
Figure 1. EN10 divided by sections, and RTA between 2016 and 2019 categorized by severity. Top: Complete EN10; Middle-left: Section A; Middle-right: Section C; Bottom: Section B.
Information 14 00238 g001
Figure 2. Section A and its main areas (A.1A.3); RTA between 2016 and 2019 according to their severity. Note: sep = separator, i.e., protective border.
Information 14 00238 g002
Figure 3. Section B and its main areas (B.1B.3); RTA between 2016 and 2019 according to their severity.
Information 14 00238 g003
Figure 4. Section C and its main area (C.1); RTA between 2016 and 2019 according to their severity.
Information 14 00238 g004
Figure 5. Digital application to support decision: prediction probability of an RTA in EN10 on a given time of the day by segments of 500 m. Red segments have a probability greater than 90%, yellow segments have a probability greater than the cut-off point and lesser than 90% and green segments have a probability lesser than the cut-off point.
Information 14 00238 g005
Table 1. Performance measures for the Logistic Regression (LR), Random Forest (RF) and C5.0 algorithms, by road segments length (500 m and 2000 m), for the RNS approach.
Machine Learning Algorithms
Segment: 500 mSegment: 2000 m
MeasureLRRFC5.0LRRFC5.0
Accuracy0.6810.6740.6770.6900.6770.677
Sensibility0.8880.8020.8450.8710.8280.836
Specificity0.5970.6220.6090.6200.6180.615
PPV0.4720.4620.4670.4710.4570.457
NPV0.9290.8850.9060.9250.9030.906
G-mean0.7280.7060.7170.7350.7160.717
F-score0.6160.5860.6010.6110.5890.591
MCC0.4410.3830.4120.4410.4010.405
AUC0.8280.7870.8130.8130.7860.799
Table 2. Performance measures for the Logistic Regression (LR), Random Forest (RF) and C5.0 algorithms, by road segments length (500 m and 2000 m), for the DNS approach.
Machine Learning Algorithms
Segment: 500 mSegment: 2000 m
MeasureLRRFC5.0LRRFC5.0
Accuracy0.6040.5630.5200.6000.5280.588
Sensibility0.6790.6130.7990.6340.6590.656
Specificity0.5840.5510.4490.5910.4950.571
PPV0.2930.2570.2690.2820.2480.279
NPV0.8780.8490.8980.8650.8520.868
G-mean0.6300.5810.5990.6120.5710.612
F-score0.4090.3620.4020.3900.3600.391
MCC0.2120.1320.2030.1820.1240.183
AUC0.6710.6220.6600.6480.6010.649
Table 3. Performance measures for the Logistic Regression (LR), Random Forest (RF) and C5.0 algorithms, by road segments length (500 m and 2000 m), for the ROSE approach.
Machine Learning Algorithms
Segment: 500 mSegment: 2000 m
MeasureLRRFC5.0LRRFC5.0
Accuracy0.7380.7180.7110.7340.6930.716
Sensibility0.8710.8350.8420.8570.7910.821
Specificity0.6020.6160.5960.6060.5910.607
PPV0.6910.6560.6460.6950.6690.686
NPV0.8210.8100.8120.8020.7300.764
G-mean0.7240.7170.7090.7200.6840.706
F-score0.7710.7350.7310.7670.7250.748
MCC0.4920.4590.4480.4790.3900.439
AUC0.8180.7830.7960.8030.7570.777
Disclaimer/Publisher’s Note: The statements, opinions and data contained in all publications are solely those of the individual author(s) and contributor(s) and not of MDPI and/or the editor(s). MDPI and/or the editor(s) disclaim responsibility for any injury to people or property resulting from any ideas, methods, instructions or products referred to in the content.

