Article

RF Coverage Design for the Implementation of a Broadband Monitoring Service in the Context of 5G-Enabled Smart Cities

by
Theofilos Chrysikos
1,*,
Sotiria Gourna
2 and
Aikaterini Skouroliakou
3
1
Department of Electrical and Computer Engineering, University of Patras, 26504 Patras, Greece
2
Department of Informatics and Telecommunications, University of Thessaly, 35100 Lamia, Greece
3
Department of Biomedical Engineering, University of West Attica, 12243 Athens, Greece
*
Author to whom correspondence should be addressed.
Information 2023, 14(3), 156; https://doi.org/10.3390/info14030156
Submission received: 30 November 2022 / Revised: 12 February 2023 / Accepted: 16 February 2023 / Published: 2 March 2023
(This article belongs to the Special Issue 5G Networks and Wireless Communication Systems)

Abstract

:
As the recent COVID-19 pandemic has aptly demonstrated, emergency scenarios concerning public health and safety may require citizens to remain at home even as patients, potentially in the context of a municipal or national lockdown. Homestay patients may require real-time monitoring, which will offer not only communication but also empirical data and will contribute to developing their personalized electronic health record in knowledge bases. Our paper features an extensive RF coverage design for such a municipally deployed and administered 5G-enabled smart city network, supporting a broadband monitoring service. The antenna deployment for the outdoor urban topology is analytically described (for the downlink channel), and the intrinsic indoor propagation characteristics are considered for the uplink channel. A digital baseband signaling scheme is assumed on the basis of a user-customized health-related monitoring service. Path loss and fading calculations consider the potential worst-case propagation conditions so that the RF coverage will be reliable, leading to a resilient city-wide municipal network.

1. Introduction

The concept of smart cities is no longer a futuristic scenario. Instead, it is becoming a key aspect of modern urban planning. The present-day urban environment is increasingly enabled by information and communication technologies. Digital applications are offered over energy and telecom infrastructure networks. As the energy needs of large metropolitan areas grow, so does the demand for the smarter management of resources. A smart and sustainable city aspires to function in a way that offers quality of life for its citizens [1].
Since decentralization is not a realistically feasible solution, the impact of population density on the environment needs to be taken into consideration so that smart city planning can provide cost-effective ways of optimizing the consumption of energy and natural resources while minimizing pollution [2]. At the same time, it is imperative to consider efficient solutions for waste disposal [3]. A smart city is an ecosystem that offers a variety of services to its citizens and allows for the seamless exchange of information among all its interconnected subsystems [4]. While maintaining this system-level overview, we re-structured our notion of smart cities on the basis of a network-defined model that serves as the theoretical stepping stone for all innovative results and concepts featured in this work.
The paper is structured as follows: Section 2 defines our outlook on smart cities through the lens of network infrastructure. This is the theoretical basis for our innovative results. Section 3 reshapes the service-oriented definition of smart cities as a human-centric designation, on par with ICT-centric implementation, which is presented in Section 4. Section 5 introduces the 5G network as the broadband game changer, which serves, as shown in Section 6, as a smart city enabler. Section 7 features some handpicked examples of smart city case studies across the international scene, whereas Section 8 discusses the economic impact of 5G on smart cities, further strengthening our outlook of a smart city as a network-defined model. Section 9 introduces our innovative results, beginning from the deployment of 5G-enabled smart city base stations so that coverage in a certain urban area is accomplished for a minimum actual broadband connectivity rate of 2.048 Mbps, as per ITU specifications, for variable shadow fading considerations. Section 10 presents the impact of indoor channel conditions on the transmission of baseband information, corresponding to a smart city user monitoring service. This process addresses the pass-band modulations available in the context of 5G-enabled infrastructure and takes into consideration the external wall penetration for indoor-to-outdoor propagation for the uplink channel. Section 11 summarizes our findings and conclusions and discusses open future work. Finally, all references are provided.

2. A New Outlook on Smart Cities: The Network-Defined Model

The acquisition and analysis of empirical data from the smart city networking infrastructure provides the necessary feedback that enables the evaluation of all services and the optimal use of resources regarding long-term sustainability [5]. According to the authors’ opinion (and the basis of the innovate results presented in this paper), an infrastructure-defined smart city will provide even greater potential for the designation and implementation of services while being inclusive of the time-domain and frequency-domain analysis offered in the traditional service-defined model [5].
In this context, the term “infrastructure” refers directly to the network deployment via which smart city services are offered. Therefore, the infrastructure-defined model that is proposed in this paper, is, in a more explicit manner, a network-defined model. Thus, the concept of smart cities is identified as its deployment: the network infrastructure. The authors’ reasoning for this lies in the fundamental notion that the existence of a smart city, which allows for a singular, base-level, and functional definition as a basis for every other case study and application, is empirically validated and confirmed via its network infrastructure. Without the interconnection of its integral components and without a network infrastructure, a smart city cannot exist as such.

3. Services for Smart Cities: The Human-Centric Designation

The contemporary models of sustainable cities revolve around the smart city axis, i.e., cities that operate with a “smart economy”, “smart mobility”, “smart environment”, “smart people”, and “smart living” [5].
These solutions must be interconnected, enhance the residents’ ties to the actual infrastructure of cities, focus on the integrated urban environment, and include all sectors and parameters that affect the quality of living. These fundamental areas of interest can be categorized as follows [6,7]:
  • The term “smart economy” refers to e-business and e-commerce, increased production, and ICT (information and communications technology)-driven production and distribution processes, i.e., the integration of integrated communications and electronic systems in the modern era and ICT-oriented innovation, as well as new products, services, and business models;
  • The concept of “smart mobility” gives priority to clean and non-motorized energy options over conventionally fueled transportation systems and infrastructure. Smart mobility also refers to all necessary information and the means of passing this information to the public in order to drastically reduce CO2 emissions. This provides yet another example of why a network-defined model of a smart city is more effective;
  • The term “smart environment” refers to the overall means and methods for energy efficiency and green policy in an urban metropolitan area. This includes renewable resources, energy metering, pollution control, building renovation, green buildings, green urban design, resource efficiency, and, finally, all effective techniques for the reuse and renewal of resources that serve the “smart environment” cause;
  • In the context of a smart city, e-skills and the ability to work within the ICT concept, access education, and manage human resources within a society that promotes excellence and innovation are some of the characteristics that deem someone a “smart person”;
  • “Smart living” encompasses an ICT-oriented mentality and way of life. It also includes a healthy and safe life in a culturally active city, with a variety of historical and contemporary references, which are preserved but also further enhanced with the introduction of ICT-based innovation.
The conception, design, implementation, and seamless provision of services from the municipality to the citizens is built on the following key axes [8,9]:
  • e-Government of the municipality: participation in decision making and implementation of decisions through participatory democratic processes, featuring transparency and public control in the activities of the municipal administration;
  • Improvement in the access to the infrastructure of the municipality: Provide innovative services and/or extension of existing services, with the option of “remote access” for both tactical and emergency (i.e., pandemic) scenarios. The digitized services of the municipal register, residence certificate, and family share are also included in this section, which will not only reduce delays and bureaucracy but also reduce the needless consumption of material (e.g., paper) and human resources;
  • Networking infrastructure provided by the city to the citizens (community services and networking infrastructure) related to the implementation of applications and technologies to improve the quality of life of the city’s residents. This infrastructure will vary and involve both wired and wireless physical means of transmission but will always have to provide broadband connectivity per user device (and not an “in general” downlink broadband rate), i.e., at least 2.048 Mbps/device in order to provide robust access and service to citizen–users from the services offered.
The paradigms of smart city services are provided in the following sections. These implementations are based on the conceptual design of the Internet-of-Things (IoT), where an ecosystem of interconnected devices and entities has been considered the epicenter of each service and application.
This ecosystem involves both the interconnected citizen–users and the smart devices that comprise the pool of physical and virtual entities to which each service refers. This ecosystem is spread throughout a physical urban surface where the service signal is meddled with obstacles and other channel impairments.
The reliability of each service is related to the robustness of the network architecture, since the quality of service of the infrastructure correlates significantly with the quality of experience for each end user. These entities should also support broadband connectivity through their physical interfaces, whether wireless or wired, for both downlink and uplink streams of transmission. This pool of services and applications includes smart public transport, smart parking applications, waste bin monitoring systems, and quality-of-life services. As far as the network architecture is concerned, 5G is designated to be the key technological infrastructure in this endeavor.

4. Services for Smart Cities: The ICT-Centric Implementation

The fundamental ICT layer consists of a sensor grid in the city, where all points of interest are to be monitored and controlled. These sensors include installed CCTV cameras, natural parameter sensors, RFID tags, mobile devices, embedded SIMS, and actuators. These points of interest could include traffic intersections, bus stops, railway stations, utility poles, and water supply lines. These sensor/device arrays are further connected to wireless or wireless communication devices, such as routers/switches, which serve as gateways for further devices that acquire and evaluate data as part of an overall monitoring and control system [10].
Communication networking technologies provide the infrastructure for smart cities so that all devices, computers, and physical users can establish reliable and secure communication links. This includes mostly terrestrial (wired and wireless) but also satellite networks. The network-defined mode of smart cities encompasses all range groupings, from personal and home/local area networking to metropolitan/wide area networking [11].
The availability of real-time data and information in various verticals is very important for the success of smart city designation and implementation. This ubiquitous availability requires setting up advanced data centers and cloud infrastructure that integrates different smart city applications [12].
High-performance data analytics using advanced AI algorithms aided by machine learning are also key technologies for smart city applications, as decisions need to be made in real time across different domains. This can include understanding the current state of a system and predicting the future state through predictive analytics. Fuzzy logic analysis may need to be employed for different parameters [13].
Finally, an integrated management and administration center is meant to provide a single interface for assessing all information at the city level. These command and control centers do not imply that only one will be applicable to a single city, but many smaller ones could feed the necessary information to its different nodes [14]. Thus, scalability in terms of population density, area coverage, and aggregation of services and collected data will be the determining factors as to the hierarchy of the different gateways and command centers. The municipal character of a smart city designation implies that the city council can be the top administrative authority [15].

5. 5G: The Broadband “Game Changer”

The outgoing 4th generation long-term evolution (4G LTE) system supports data transfer speeds of up to 100 Mbps downlink [6]. Its extension, the 4G+ (LTE-A) system supports rates of up to 300 Mbps, and by using small cells to provide additional broadband coverage we have been able to achieve downlink rates of up to 500 Mbps in the microwave frequencies [6].
The implementation of fifth generation (5G) cellular systems heralds the move towards more sophisticated and smarter technology [16]. 5G licensing started in the second half of 2020 and covers the microwave frequencies of 700 MHz, 3.5 GHz for urban environments (cities), and 28 GHz [5]. A bandwidth up to 100 MHz is allocated for urban topologies and for the 3.5–3.6 GHz microwave band [5]. Thus, it is possible—and in many cases, essential—to establish smaller cells than the 4G infrastructure, with a radius of 100 m or even smaller depending on the coverage scenario in question. The criterion for cell deployment is the minimum broadband per device (Mbps per device), which indirectly includes user density (device density) [5].
5G deployment allows for transmission rates ranging from 250 Mbps per device up to peak rates of 1 Gbps per device [3]. At such broadband speeds, all multimedia applications that constitute the 5G use cases can be supported, as well as AR/VR applications [17]. Smart city platforms can be implemented with a very low network latency, since both the transmission delay (due to the high transmission rate) and the propagation delay (due to the smaller cells and, therefore, smaller propagation distances) will have significantly lower values [18].
The deployment of 5G in relation to smart city strategic designs and implementation will exploit all the advantages of this smaller cell, higher bandwidth, and higher spectral efficiency technology, with a focus on broadband connectivity per device, thus addressing one of the main network-related challenges of smart cities: user density in a topology with high density of obstacles and shadowing effects. The densification of 5G base stations resolves the smart city’s need for more antenna systems per unit area (base station density) [19].
5G can be described as a software-defined network architecture that can be dynamically deployed to provide the essential level of control for a given application. It is also possible to dynamically allocate resources based on network slicing to serve private customers and implement private use cases. This will facilitate novel business use cases. This potential impacts positively on ad hoc networks in general and on smart city scenarios in particular [20].
The role of 5G as an enabler of smart city technology is studied in the next section.

6. 5G as a Smart City Enabler

5G, with its advanced features, as discussed in the previous section, meets the demands of smart city services and applications. The 5G capabilities that enable large-scale IoT implementation for smart cities are [21,22,23]:
  • Device connectivity: 5G supports a significant increase in the number of interconnected devices, such as sensors, cameras, and actuators, in a wireless infrastructure, which is the basis of IoT deployment. These devices are required in homes, roads, traffic hubs, and public places, such as bus stops and railway stations, in order to support smart traffic systems, smart homes, and public safety, as well as the security and surveillance requirements of smart cities. The interconnection of these devices is made possible by the very large increase in the capacity of the 5G system, due to the following:
    (a)
    Optical conversion of the backhaul/core of the network with the deployment of fiber optics in cities;
    (b)
    The usage of more antenna systems with lower transmit power per antenna;
    (c)
    Therefore, more cells for a given urban coverage area;
    (d)
    Thus, serving more users within each cell and, therefore, across all cells in total. These users are no longer only physical users—subscribers to the mobile service with their mobile phones—but also virtual users, i.e., smart devices that can be served with multi-adaptive rates of broadband connectivity by 5G antennas (i.e., base stations).
  • Very high bandwidth up to 100 MHz to support video streaming services over wireless channels and high volumes of data;
  • Ultralow network latency for improved user experience, including delivery of 3D and holographic images, for applications such as unmanned driving and AR/VR applications. The latency of less than 1 ms provided by 5G enables ultralow-latency communications that can support sensitive applications in the context of smart cities;
  • “Always-on” connectivity provided by 5G supports services in high-mobility/vehicular environments, such as high-speed cars and trains, with strict requirements in terms of Doppler spread and multipath fading. One hundred percent geographical coverage is also required to support an intelligent traffic monitoring and management system. Many smart healthcare services also require an “Always ON” mode, as the reliability of communications is paramount when biomedically sensitive information is involved;
  • Energy efficiency: The deployment of a massive number of antennas and devices can burden the energy requirements of a smart city ecosystem. Designation based on 5G ensures that smaller cells and reliable channel estimation leads to a minimum power consumption for all involved devices.
Table 1 provides selected examples of services upon various domains of the smart world that 5G-enabled smart cities can support [21,22,23].

7. Case Studies of Smart Cities

In this section, we present selected case studies of smart cities on an international scale [24,25,26,27]. It should be noted that these case studies (Barcelona, Stratford, Singapore) are handpicked based on recognition and the exemplary status of the renowned smart cities, providing a showcase but not a thorough analysis of the smart city testbeds.
Barcelona has carried out significant reforms to become a smart city. To achieve the initial goals of a smart city, Barcelona is employing information and communication technologies (ICTs) to lead companies, institutions, specific sites, universities, technology centers, incubators, housing, dissemination, and entrepreneurs towards digital renovation and excellence [25]. With the aim of supporting smart city initiatives in terms of connectivity, Barcelona is employing 3G and 4G technologies, Wi-Fi mesh network, sensor network, public Wi-Fi network, new mobility plan, new heating and cooling systems, new energy networks, and underground tunnels. In addition, to better serve the city in terms of fast response, fiber optic cables are being deployed, covering 325 km of the city. Currently, Barcelona is moving towards a 5G-enabled smart city hub for Southern Europe [28,29,30].
Throughout the last decade, Stratford has emerged as a “smart city” by launching a smart metering program to address new energy saving regulations and stimulate economic growth. To achieve the launch goals, Motorola’s 802.11n wide area network (MWAN) was deployed city wide. The Motorola AP 7181 802.11n was used as the external access point, and an AXS1800 GPON system was used to transmit the encrypted smart meter data. In the beginning, the meters were manually read once a month. To perform the audit, smart meters were installed in 200 houses based on a 40-access-point grid network. During the trial period, the meters were remotely accessed daily to determine how to reduce electricity consumption [26]. Recently, Stratford has moved on to 5G technology in order to boost the smart city services offered to its citizens [31].
Singapore has been consistently moving towards more sustainable urban development and a smarter city planning. One of the key motivations behind the city’s transformation is the need for a smart transport system so that some of the city’s constraints, such as land and lack of natural resources, would be overcome. Published research shows that in Singapore, roads already occupy 12% of the land area and the number of cars has increased to 9,700,000, marking a 62% lead over buses, taxis, and two-wheelers. To implement the intelligent transport system, sensors were deployed by leveraging the ultrahigh-speed 1 Gbps national broadband access and wireless broadband infrastructure [27]. Smart technologies not only help monitor traffic but also enable the capabilities to predict future congestion that can lead to optimal route management. In addition, to accommodate people with disabilities, RFID cards are used to extend the transit times at traffic light poles. Recently, Singapore has extended its smart city services and applications towards maritime IoT via the deployment of 5G technology [32].

8. Economic Impact of 5G on Smart Cities

The impact of 5G on the deployment of smart cities, the technological renovation of urban metropolitan areas, and the quality of life of the citizens, as well as economic growth and development, is no longer a theoretical issue. Already entering its third year of global launching, 5G has offered tangible examples of how a city benefits not only from the technological and qualitative aspects but also in terms of economics [33,34,35].
Smart city solutions applied to the management of electrical grids and vehicle traffic have resulted in substantial financial gains through a reduction in energy and fuel consumption [33]. 5G solutions have enabled cities to accomplish significant smart grid efficiencies [33].
In addition to providing increased bandwidth and data rates, 5G cells have allowed the ubiquitous connection of an even larger number of devices within the network infrastructure. This has led not only to a significant increase in the pool of physical users benefiting from existing services and applications but also in investment towards novel services with emphasis on AR/VR and shifting the paradigm from quality-of-service (QoS) to quality-of-experience (QoE) [34].
It has also been showcased that the economic impact of 5G-enabled smart cities is not limited to the city finances but also to budget investment for further city development and job openings. Thus, the GDP increases, and the job openings create more career choices for the citizens towards a more “digitally aware” professional environment [35].

9. A Novel Methodology for 5G-Enabled Broadband Connectivity Coverage of Smart Cities

Smart city applications are deployed in topologies with many buildings of varying heights and construction materials, with mobile users wishing to connect to the services offered by each municipality [36,37,38]. Wireless propagation in such environments is hindered by both large-scale and small-scale fading, whereas channel state information is not known beforehand but requires assumptions within a certain probabilistic range (semideterministic channel prediction) based on measurements and other empirical data.
All these mobile users, either in an outdoor environment or in their apartments, require a broadband connection, the minimum value of which is set by the ITU at 2.048 Mbps [5]. This is set as the essential minimum rate for each user connecting to the municipal services. This means that when there is a large accumulation of users (i.e., an increased density of users wishing to connect to the services), congestion occurs due to the increased telecommunication traffic. In the case of wireless networking, the distribution of broadband connectivity to users within range who wish to connect to the smart city’s broadband infrastructure is of particular importance.
It is therefore imperative to establish a reliable method for the prediction and calculation of the signal-to-noise ratio (SNR) in order to provide a robust metric for the calculation of the total bandwidth connectivity rate offered by any given antenna in the urban area [36]. The maximum reach of any given antenna, that is, the cell radius, is determined by the minimum broadband rate of 2.048 per device. This means that the average (expected) number of devices per cell needs to be estimated. If empirical data exist, then the number of devices becomes the basis for all further calculations. In any case, the local mean SNR (the SNR at each point of interest) needs to be calculated in a reliable, albeit empirical, manner [37].
This requires the calculation of noise, which in our case is already provided from the empirical data derived from extensive measurements that we performed, and the signal power (i.e., local mean value) is the objective of this section. To achieve the reliable calculation of the local mean received power, validated RF models were employed, adjusted for use in the 3.5 GHz channel. The idealistic free space path loss model was employed first, since it serves as a reference path model for all subsequent calculations [38].
The basic radio propagation mechanism is described mathematically by Friis’ formula and is based on the physical concept of the propagation of EM radiation as an ideal sphere with an ever-increasing radius in space. As the radius of this ideal sphere increases (i.e., the distance between the transmitter, which is assumed to be located at the center of the ideal sphere, and the receiver, which is located on the surface of the sphere), the radiation density per unit volume (J/m3) decreases [39].
If the speed of the propagation of the EM radiation (i.e., the rate of increase of the sphere) equals the speed of light, then the rate of increase of the sphere leads to a decrease in the power density per unit area (W/m2). In this way, the inverse square law in Friis’ formula is explained, which in its logarithmic form is expressed as follows [39]:
P L ( d ) = 32.45 + 20 log 10 f ( M H z ) + 20 log 10 d ( k m )
The logarithmic formulation of Friis’ formula, also known as the free space model, calculates (in dB) the mean path loss as a function of the distance between the transmitter and the receiver (in km) and the operating frequency of the system. Knowing the mean path loss and the total radiated power from the transmitter (effective isotropic radiated power (EIRP)), we can calculate (in dBm) the local mean received power.
Equation (1) calculates the mean path loss as a function of distance expressed in kilometers. It is often more useful to employ a formula that calculates the path loss, with the metric of distance expressed in meters. This proves more convenient when we consider limited-range networks, e.g., a municipal Wi-Fi in a city square. In addition, the trend for both small cells in deployed 4G networks and the expanding 5G system is for smaller-range cells, so that path loss models should be able to take as an input variable the transmitter–receiver distance directly in meters rather than in kilometers. The following equation provides the loss in dB when the transmitter–receiver distance is expressed in meters [40]:
L t o t a l = P L ( d 0 ) + N log 10 ( d d 0 )
where P L 0 ( d B ) is the reference path loss for the reference distance, d 0 , which is considered equal to 100 m or 1 km for outdoor environments and equal to 1 m for indoor environments; N equals 10 n , where n is the path loss exponent which equals 2 for the free space model. The frequency dependence is “embedded” in the coefficient P L ( d 0 ) (i.e., reference path loss), which is calculated from Equation (1), assuming a distance equal to the reference distance, d 0 .
The local mean received power, according to the free space model, corresponds to the losses that depend on the distance between the transmitter and the receiver (T–R separation) and the operating frequency of the wireless system under consideration. Thus, the free space model assumes strictly deterministic losses. In realistic propagation environments, however, with many obstacles and complex electromagnetic propagation phenomena, the free space model is not reliable for the calculation (i.e., prediction) of the local mean received power, because it does not consider losses due to the fact of shadowing and other phenomena (reflection, scattering, and diffraction) [41].
The first simple way to incorporate these additional losses into the model of Equation (2) is to modify the value of the path loss exponent accordingly. This, in most cases, corresponds to a path loss exponent larger than 2 (i.e., the free space model value).
When the shadowing losses are due to the fact of fixed (i.e., static) obstacles, their impact on the signal attenuation for a given location of the transmitter and receiver exceeds the time scale of seconds or minutes. These losses are then incorporated in the logarithmic formula, and the shadow loss is also included in the total path loss calculated (predicted) by the model, which leads to the Log-Distance path loss (shadow) model [42].
The mathematical expression of the log-distance path loss model is given by the expression [43]:
L t o t a l = P L ( d 0 ) + N log 10 ( d d 0 ) + X σ
where PL(d0) is the path loss for the reference distance (as in the free space model, the reference distance is taken equal to 1 m for indoor environments); N is the path loss exponent (×10); and Xs is a Gaussian random variable with zero mean and a standard deviation equal to σ dB. N and σ are calculated from empirical data (either from textbooks or other published works or hands-on measurements) [42].
Assuming a coverage rate equal to 95% (suboptimal scenario), the relationship between the Gaussian random variable and the shadowing deviation is equal to [42]:
Χ σ = z × σ ( d B ) = 1.645 × σ ( d B )
The main disadvantage of the logarithmic distance model is the need to concurrently provide reliable values for two parameters (path loss exponent and shadowing depth). Our method relies on assigning a fixed n = 2 value for the path loss exponent, as per free space specifications, and the “transfer” of all excess path losses (any path loss “beyond” the deterministic distance-dependent attenuation, meaning practically all shadow losses due to the fact of obstacles) to the shadow variable Xs (dB).
Thus, we calculate the range of each smart city antenna based on the following formula:
d ( m ) = 10 [ P t ( d B m ) + G t ( d B ) P R ( d B m ) + 27.55 20 log 10 f ( M H z ) ( 1.645 × σ ( d B ) ) 20 ]
This formula is obtained by incorporating the deterministic and shadowing losses, a predefined total radiated power (EIRP) for the transmitter (municipal base station antenna) and, thus, calculating the maximum range of the antenna, which serves as the 5G-enabled smart city cell radius.
Since the smart city platform is implemented with a 5G microwave network, the total radiated power (EIRP) is set to 24 dBm (the logarithmic sum Pt(dBm) + Gt(dB) in the equation) [5], the frequency equals 3.5 GHz (or 3500 MHz), and the minimum level of the local mean received power is set to −85 dBm.
This specific selection of local mean received power level is due to the extensive noise level measurements we conducted in two urban centers: Patras, Greece, and Athens, Greece, with the SNR-3006 EMF equipment [5]. We conducted measurements of the noise levels at various band widths, starting from a reference level of the 1 MHz spectrum. The averaging of the results demonstrates a noise level of −95 dBm for the 100 MHz spectrum around the 3.5 GHz carrier frequency. Thus, an average received power level of −85 dBm provides a minimum SNR of 10 dB at the cell edge, which approximates the requirement of 10.6 dB for the lower-throughput modulation schemes [40,41,42,43].
Thus, we calculate the range (in meters) of each antenna system of the smart city platform as a function of the shadowing depth (in dB), as follows:
d ( m ) = 10 [ 65.67 d B ( 1.645 × σ ( d B ) ) 20 ]
The variation of the output (antenna system range) with respect to the input (shadowing deviation) is illustrated in the following plot (Figure 1).
This method allows for the exact calculation of the cell radius of the smart city platform for each possible value of the shadowing depth (from 0 to 14 dB). The average value of the shadowing depth, for 7.1 dB, gives us a maximum range of 660.7 m, close to the boundary of a 4G/4G+ mobile cell (500 m).
For a shadowing depth equal to 10 dB, which is a more realistic value for an outdoor obstacle-dense propagation environment, such as a city urban center [25,26], the range of each antenna is defined at 197.93 m (~200 m), and the area of each antenna (coverage area) equals 0.1567 square kilometers (sq km). This provides a key planning and deployment distinction between 4G and 5G networks.
The importance of calculating the coverage area of each antenna system is that we can calculate the number of total antennas required to cover a total area corresponding to the center of a large city or the whole of a medium-sized city, for the purpose of implementing a smart city platform for a large- or medium-sized municipality, respectively.
Since each antenna used by the municipality is an omnidirectional dipole antenna, we consider a circular coverage range, which can be approximated as a square, as depicted in Figure 2, with a square side of 2d, where d is the range calculated from Equation (6). Considering a total square coverage area in a two-dimensional x–y-axis system, the total number of antennas for a given area surface is calculated as follows:
z = x ( m ) × y ( m ) 4 × d 2
For instance, a total urban area of 10 square kilometers, suffering from a shadowing depth of 10 dB, provides (from Equation (6)) d = 197.93 m and a respective coverage area equal to 0.1567 square kilometers (square approximation). Therefore, Equation (7) provides z = 63.816, which is rounded to the next higher integer value and, therefore, we have 64 antennas required (as 5G-enabled municipal base stations at 3.5 GHz) to cover an urban area of 10 square kilometers.
The next logical step is to extend this methodology so that we can calculate the number of antennas for any possible value of shadowing depth (in dB) and urban area (in square kilometers). This requires the solution of a two-input variable system, so a 3D graph is required. The code was produced in MATLAB environment, and the results are shown in Figure 3. Thus, we can extend the total urban surface for coverage up to 50 square kilometers.
For a bandwidth allocation of 100 MHz, the lower-throughput BPSK modulation scheme (worst-case scenario at the cell edge) can provide up to 100 Mbps (total downlink rate) per 5G municipal base station; therefore, a generic FDMA scheme can serve up to 50 users. Orthogonality can double those users up to 100. Each subcarrier can have a spectrum allocation of 2 MHz.

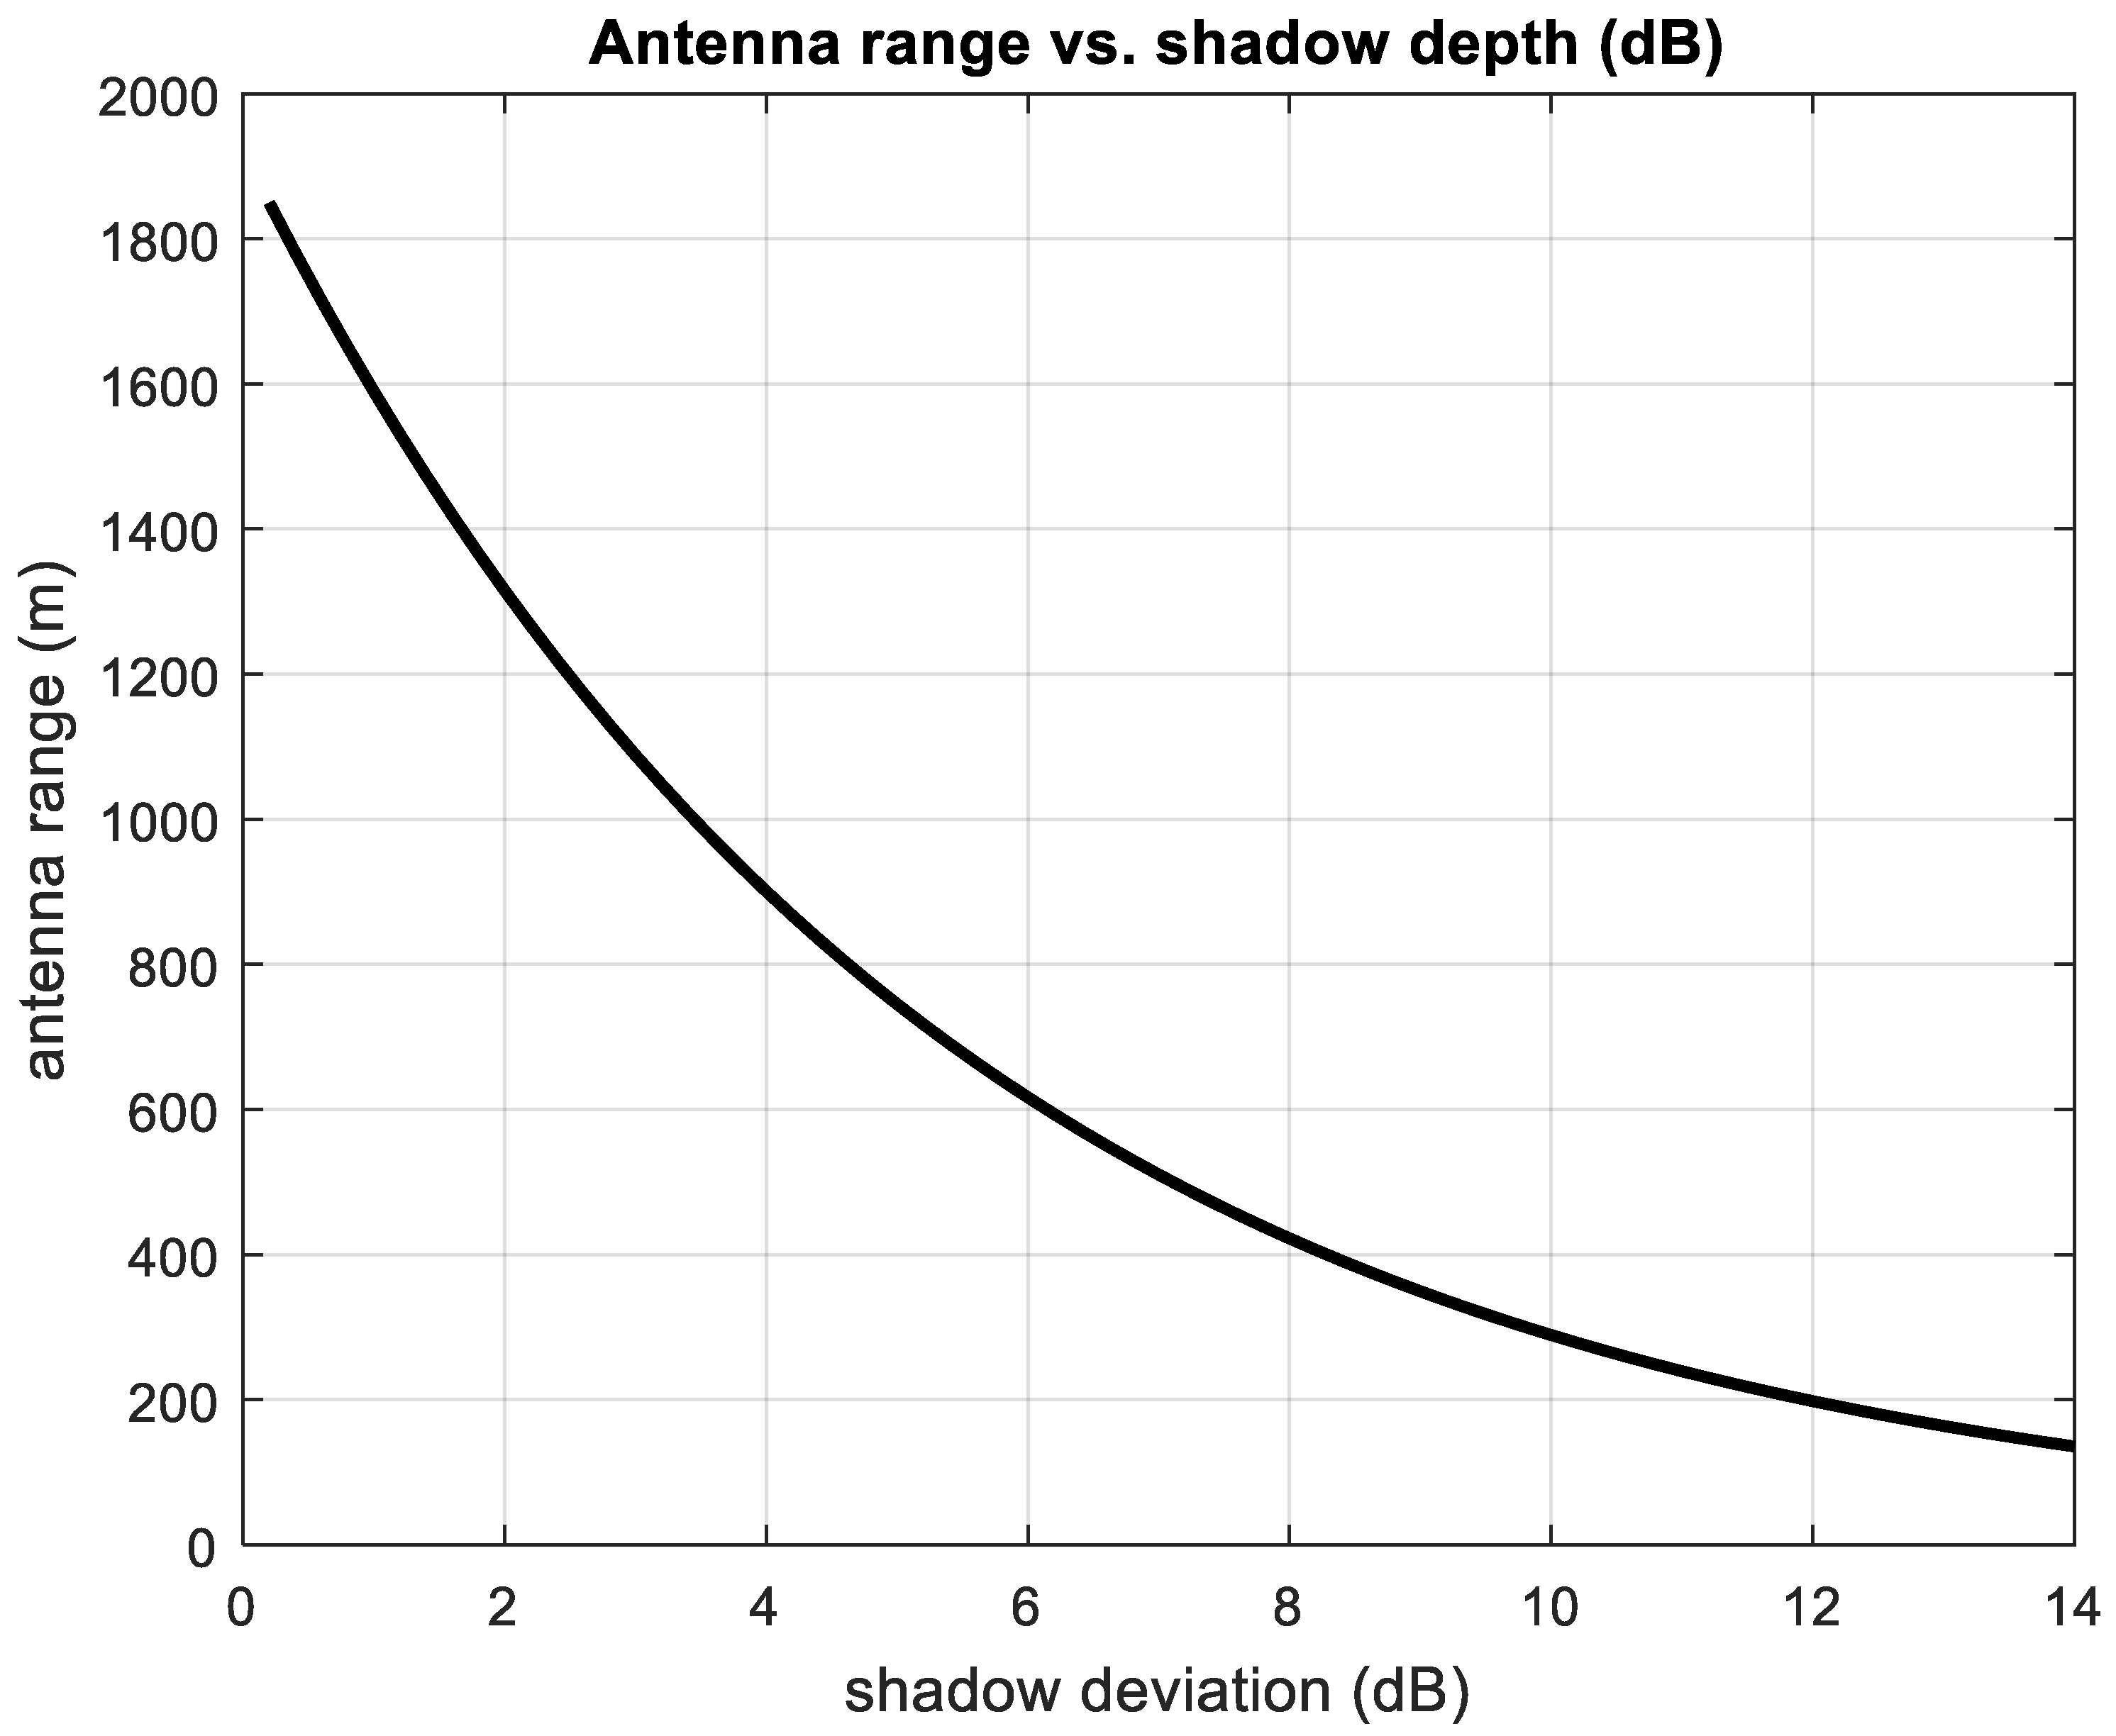
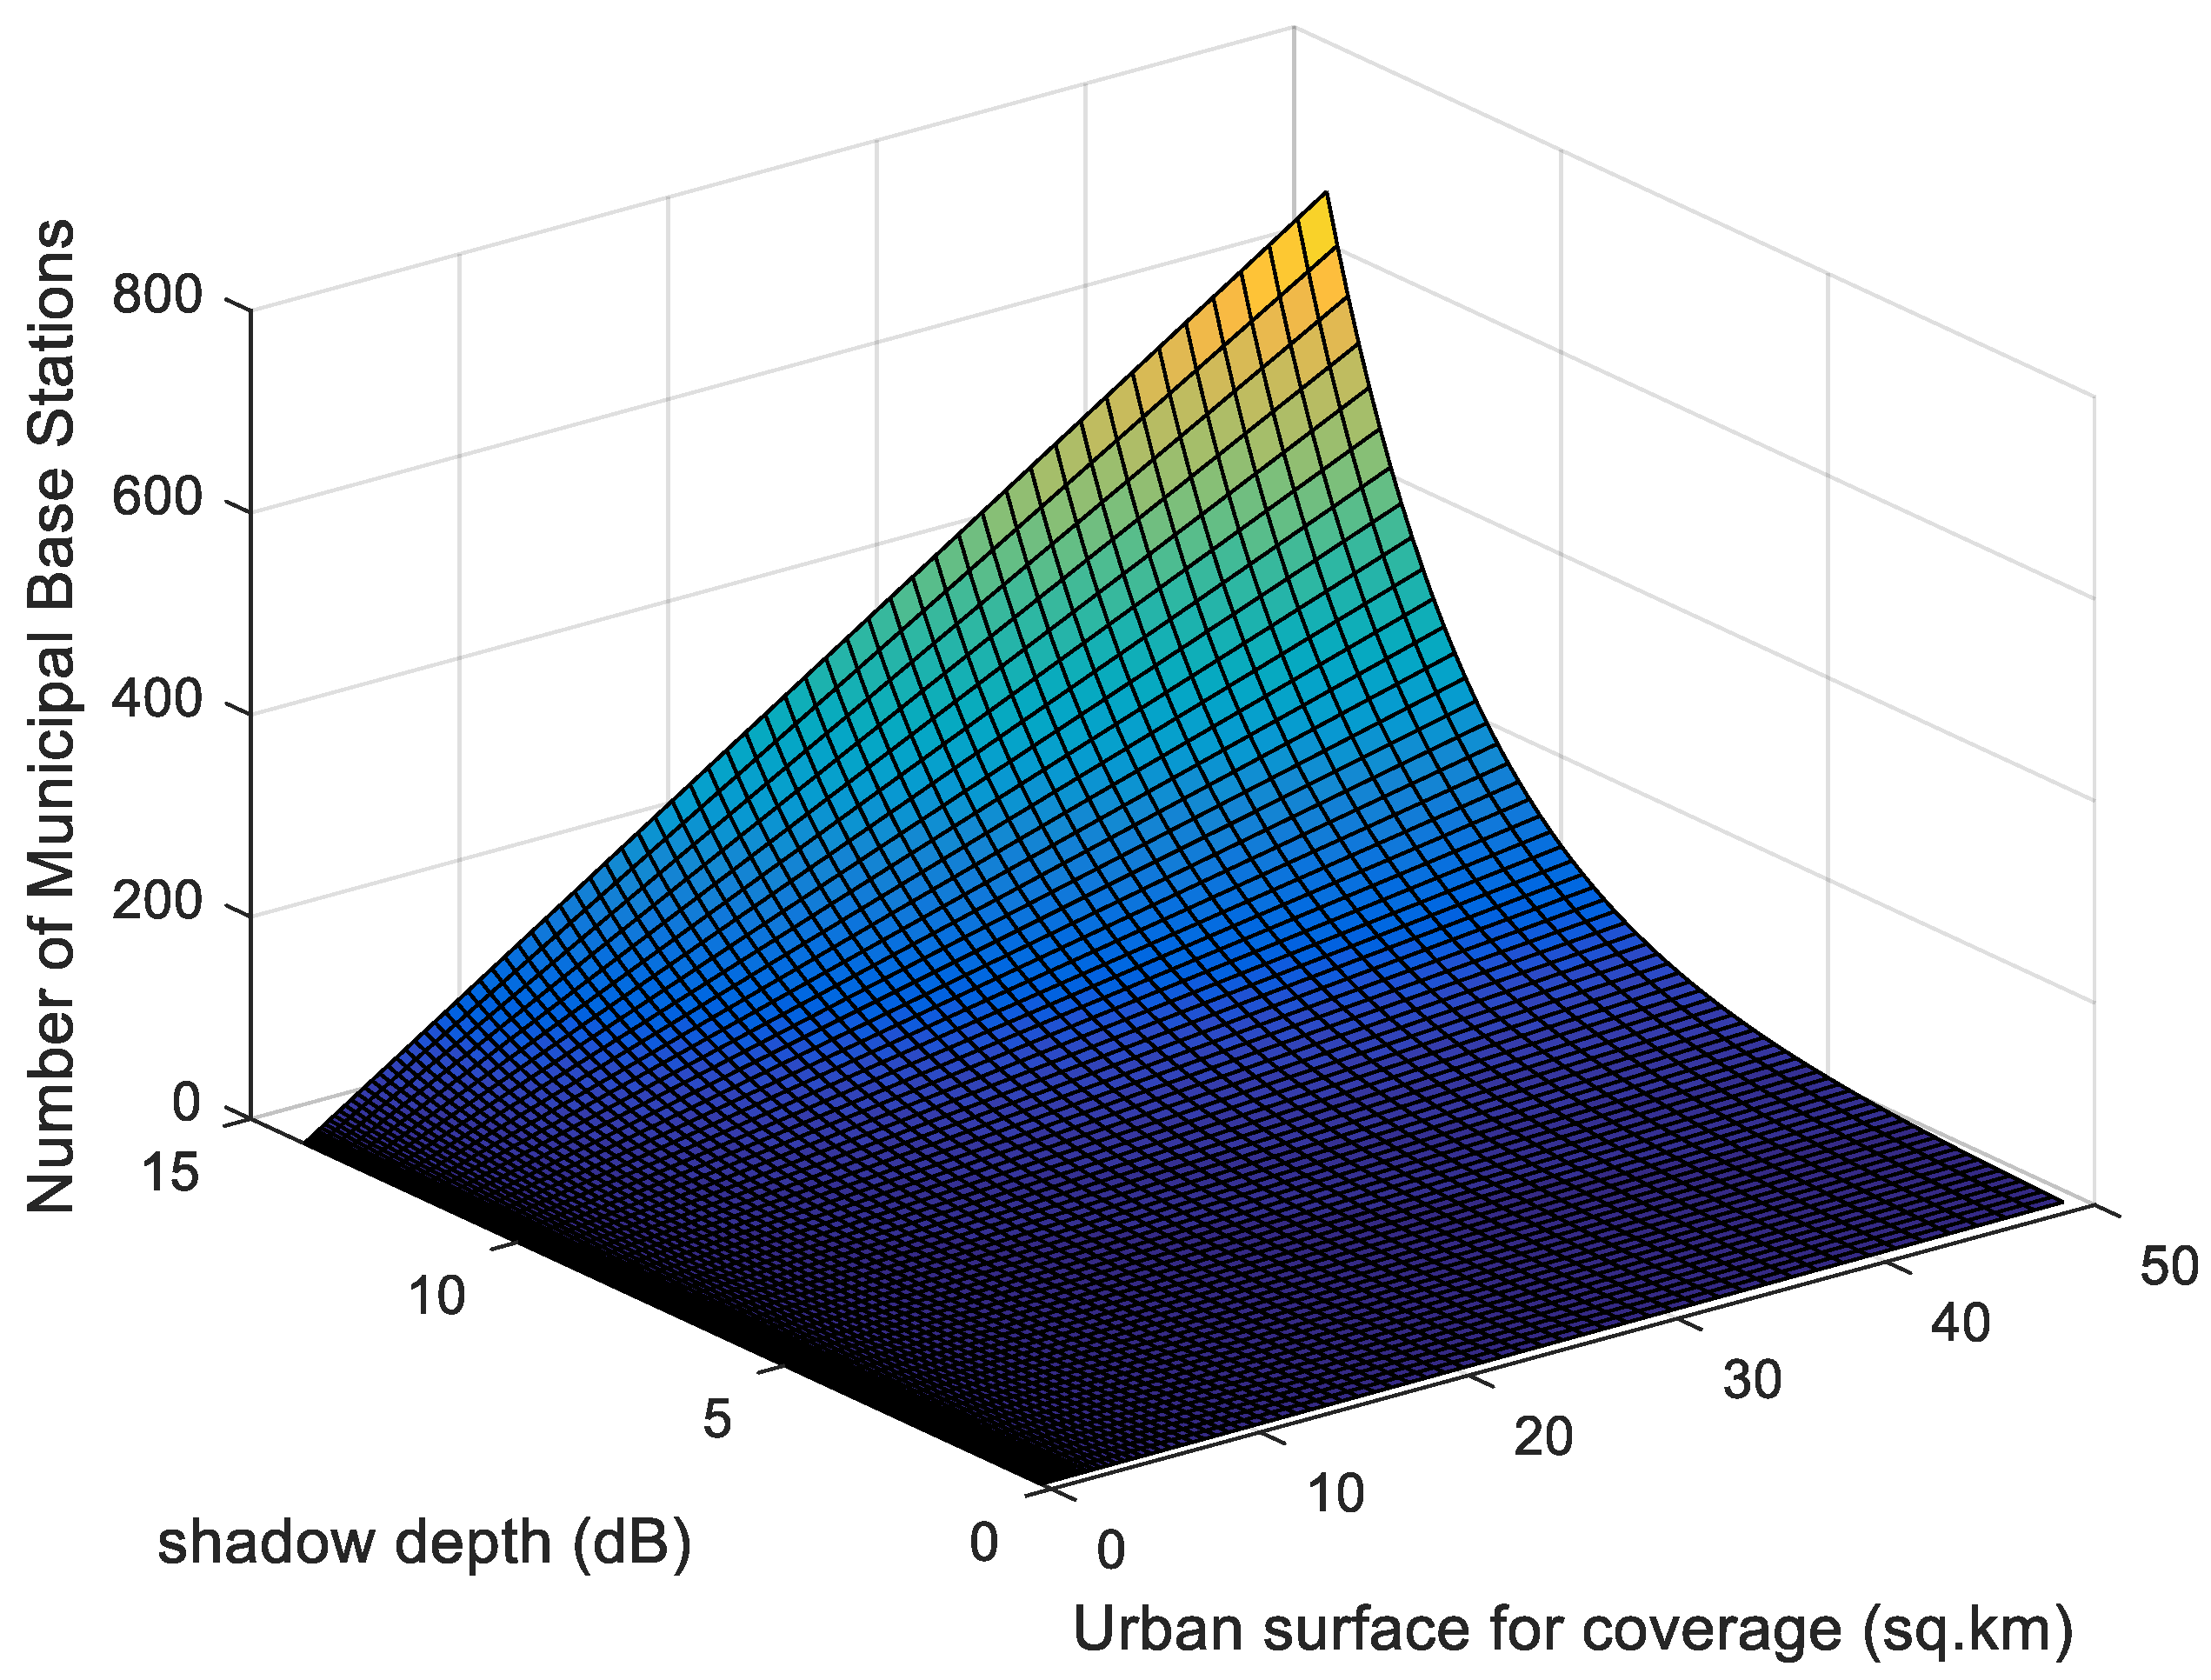
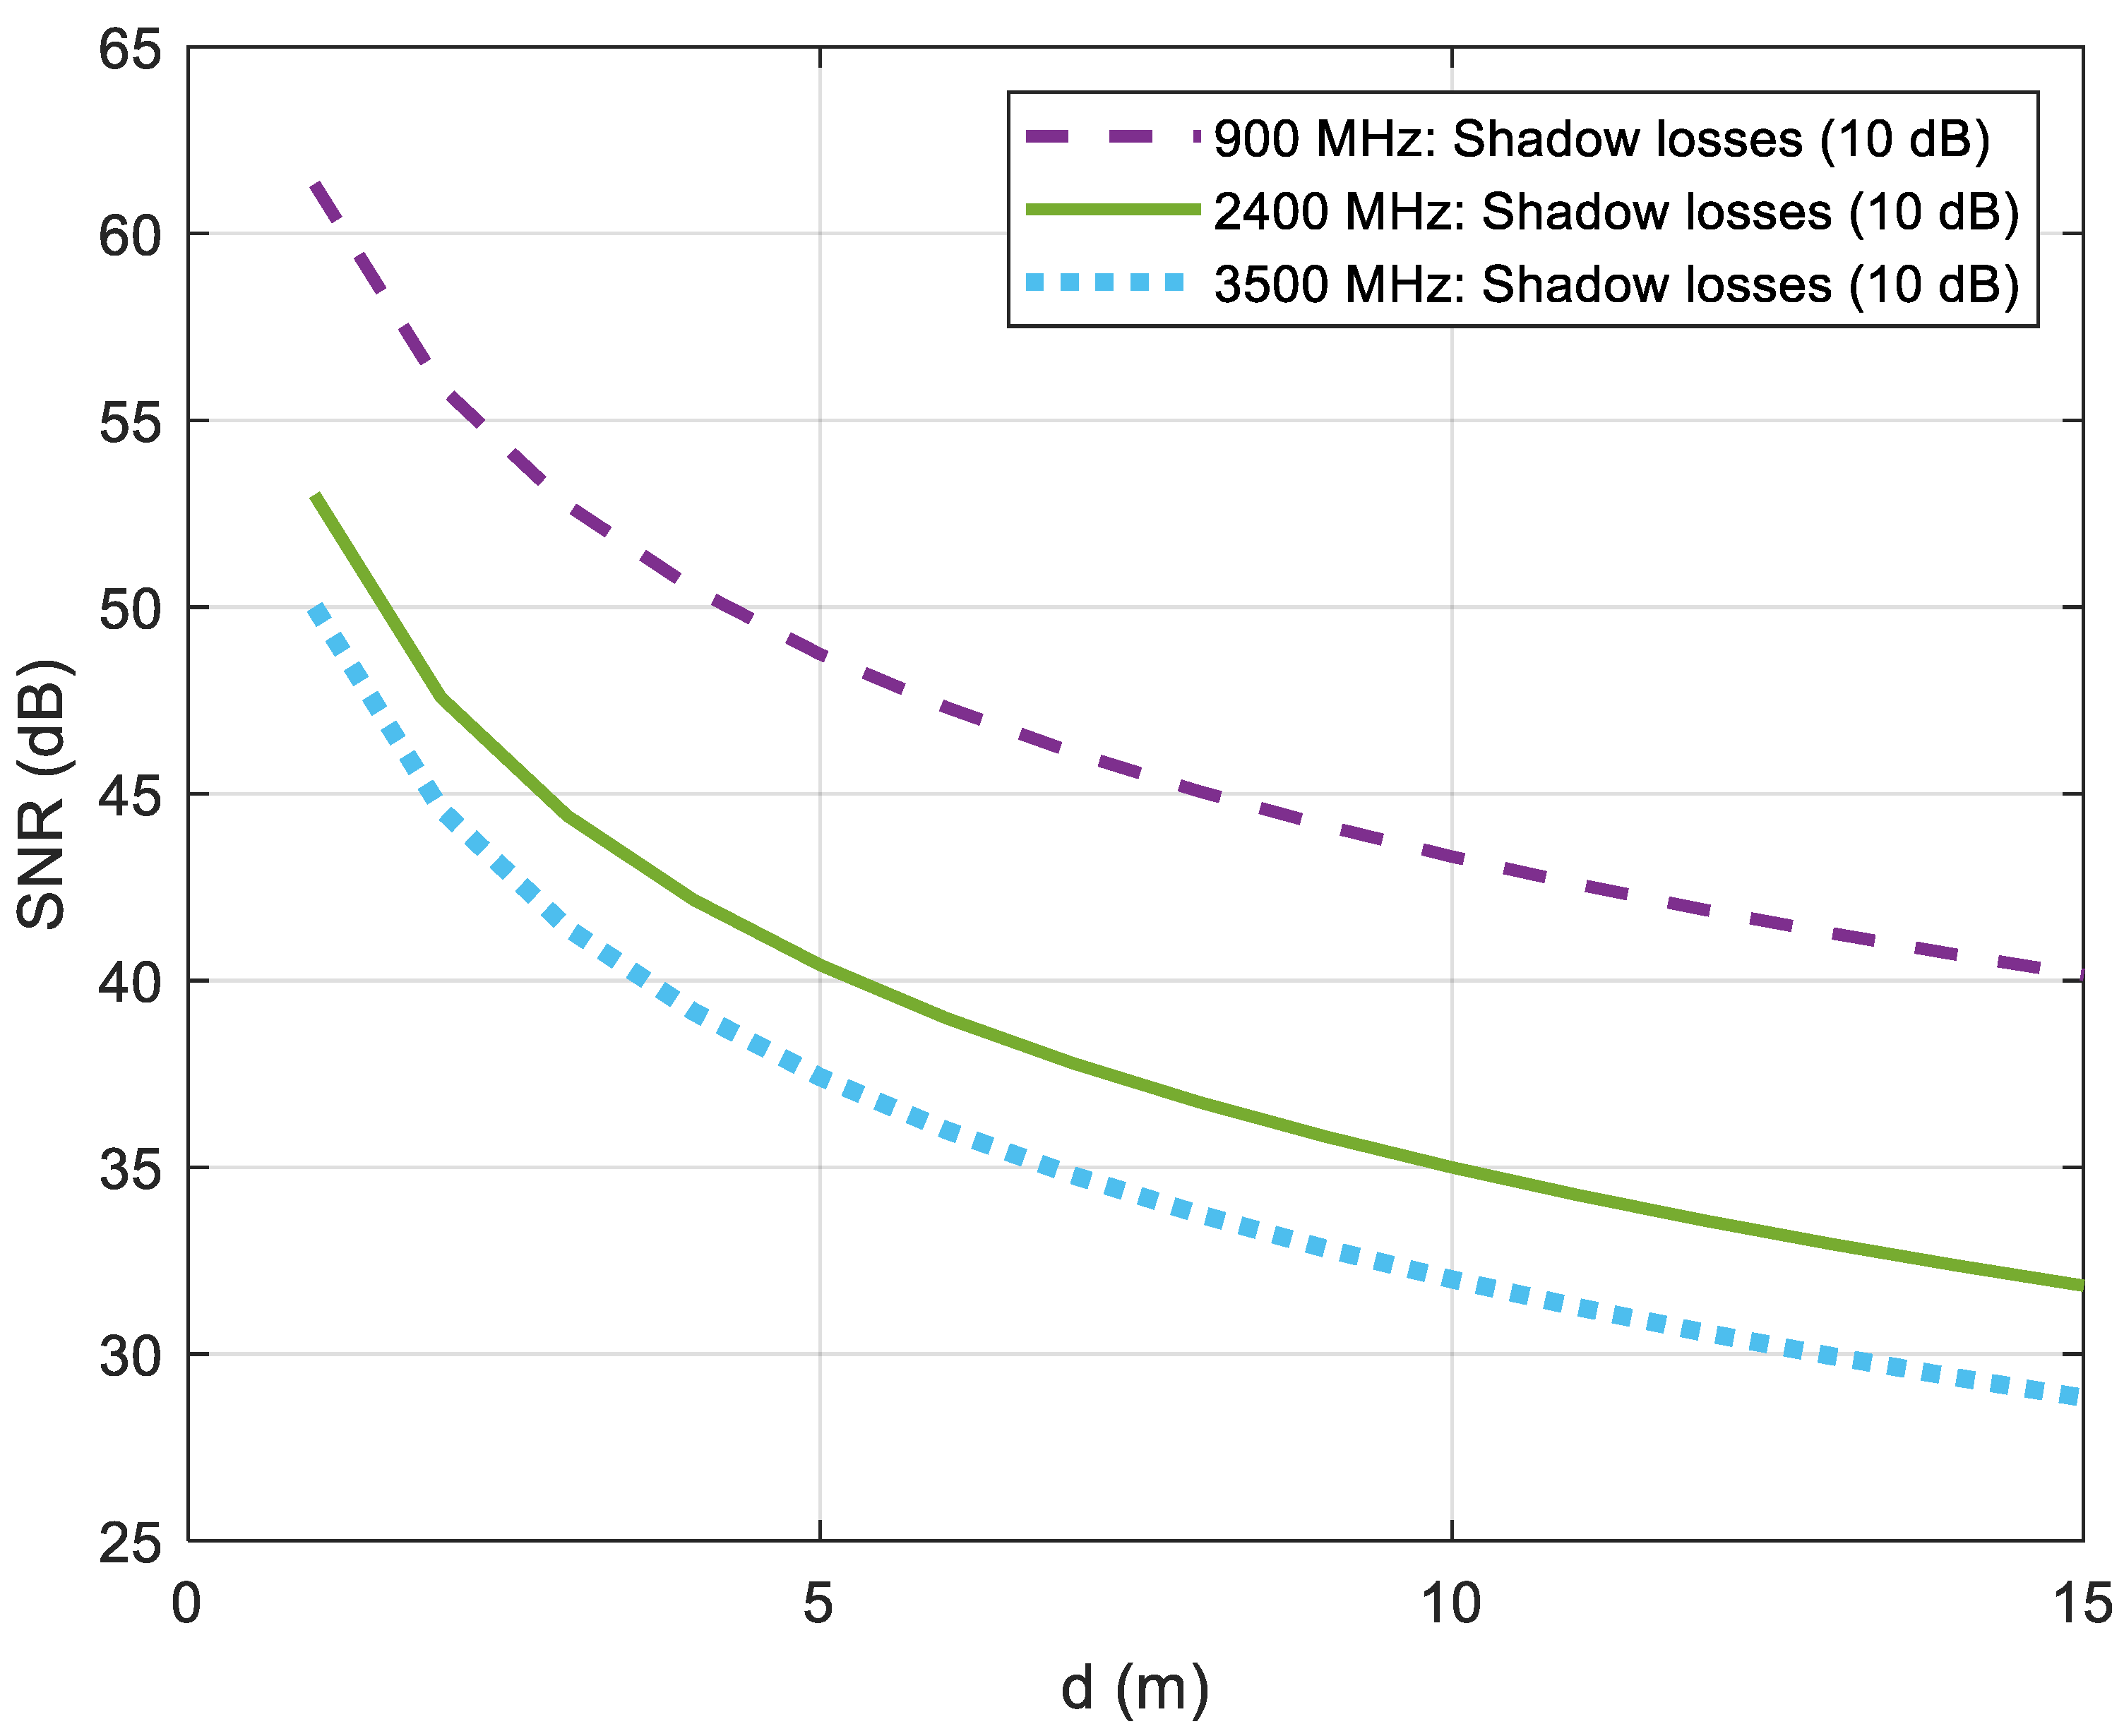
10. Impact of Intrinsic Propagation Characteristics for the Characterization of the Uplink Channel Regarding a Broadband Monitoring Service

In this section, we examine the impact of channel conditions on the choice of modulation scheme and the performance of said modulation scheme for the specific topology at hand in order to provide the proper physical layer scheme for the uplink counterpart of the downlink broadband connectivity of the coverage scenario investigated in Section 9. This uplink channel must take into consideration the specifics of indoor propagation topology, as well as the indoor-to-outdoor penetration losses.
We assume that the citizens are offered a monitoring service measuring a biophysiological metric such as for instance glucose. The biosensor, functioning as an Internet-of-Medical-Things (IoMT) device, records these biophysiological values at regular time intervals, the frequency of which is determined by the memory availability of the biosensor and by the robustness of its ADC component, so that the collected glucose values are converted into a digital baseband signal based on a standard PCM technique [44].
In order to maintain the ultrareliable low-latency communications (URLLCs) specification set by 5G technology, with a maximum transmission delay of 1 ms; then, the transmission rate, Rs (system rate), must assume a minimum value that validates the 1 ms threshold in terms of latency [16].
The transmission delay is the time required to upload all the packet bits on the transmission link. It depends on the size of the data and the rate of the channel (in bps). The formula for the transmission delay is given by [45]:
t = L R s
where L is the length of the packet, and Rs is the transmission (system) rate.
In order to maintain the ultrareliable low-latency communications (URLLCs) specification set by 5G technology, with a maximum transmission delay of 1 ms, the transmission rate, Rs (system rate), sets an upper-bound to the maximum length of information transmitted within that timeframe of 1 ms [16].
We also must consider two different topologies and their respective channel characteristics: indoor topology from the biosensor to the mobile 5G terminal and from the 5G terminal to the outdoor 5G base station (via penetration of the external wall of the apartment building).
The indoor propagation scenario can provide two possible schemes: line-of-sight (LOS) between the biosensor and the mobile 5G terminal, and obstruction of LOS (OLOS/NLOS) in the presence of obstacles.
The indoor-to-outdoor propagation scenario, since there is penetration of the external apartment wall in order to establish a link between the mobile 5G terminal (indoors) and the 5G-enabled municipal smart city antenna (outdoors); the scheme is strictly NLOS, with a severe shadow depth equal to 10 dB [40,41,42].
Therefore, we firstly consider the scenario of wireless data transmission from the biosensor to the 5G mobile terminal within the environment of a room with a maximum range of 15 m. As mentioned, we distinguish two possible propagation conditions; in the first scenario, transmission occurs under ideal conditions, with distance-based losses, i.e., deterministic losses. In practice, this means that we do not consider any obstacle between the transmitter and the receiver, assuming the existence of line-of-sight (LOS) between the two antennas [16].
In the second scenario, we consider a 10 dB shadowing loss due to the fact of obstacles and the overall propagation phenomena that affect and distort the signal, shifting away from the model of ideal wireless propagation [46]. In this case, for a shadowing deviation of 6 dB, a value quite “moderate” for a given presence of obstacles [6], there is a significant drop in the signal level. It is worth noting that a shadowing deviation of 6 dB can also be encountered if a wearable biosensor is temporarily blocked by a piece of fabric from the patient’s clothing. Therefore, it is not unlikely that such shadowing losses can occur even if there are no large obstacles in the room that create a typical LOS obstruction between the two antennas [16]. For this reason, we proceed with the calculation of the SNR results for the second scenario.
To further examine the impact of this more realistic consideration, we produce the results, as illustrated in Figure 4. Three different carrier systems were investigated, as per wireless body area network (WBAN) specifications [46]: 900, 2400, and 3500 MHz. The 900 MHz band, while still in use by some GSM systems, is widely employed for biosensor transmission within a room, as is the ISM band (2.4 GHz). Finally, we considered the possibility that the biosensor transmits to the mobile terminal directly at the 5G 3.5 GHz channel. A noise level of −80 dBm was considered for the 900 MHz and the ISM band, according to the literature [46], whereas for the 3.5 GHz channel, a noise level of −85 dBm was considered, as discussed in Section 9.
Based on the findings shown in Figure 4, even for the worst-case SNR value for the 3.5 GHz channel, the QAM-16 modulation scheme can be employed [16]. This is a modulation scheme used in the 5G protocol as well [6].
Concerning the indoor-to-outdoor propagation link, which as mentioned earlier can only be reliably described as an NLOS channel scenario, the simulation results, conducted in MATLAB for the bit error rate (BER) considering the QAM-16 modulation, are shown in Figure 5. We can see from the plot that the log-normal distribution provides a slightly better fit than the Rayleigh fit. Both distributions comply with an NLOS channel scenario [41,42].
Figure 6 provides the performance of BER vs. Eb/No simulations run for different modulation schemes and varying channel assumptions (Rayleigh vs. AWGN). It should be noted that the AWGN in this context does not negate the mandatory NLOS condition considered for the indoor-to-outdoor propagation topology; it merely prioritizes large-scale fading losses (due to the fact of shadow fading) over small-scale fading (due to the fact of multipath), by allowing a broader fade margin.
This can be the case for quasistatic Rayleigh fading channels, where the channel characteristics remain constant (albeit still providing an NLOS scenario) for the transmission of a whole length of information. We choose to work with a “stricter” modulation scheme in the uplink channel, because in that stream we have the more sensitive biomedical data (digital baseband derived from the biophysical data); therefore, the requirements are higher in terms of robustness and reliability, also conforming to the URLLC specification.
In our case, an Eb/No of 16 dB with a worst-case scenario of 10 dB SNR (from Section 9) can lead up to a rate of 500–600 Kbps for a 2 MHz bandwidth allocated per user within the smart city spectrum of a 5G-enabled network. This leads to roughly 500–600 bits of information length transmitted within the timeframe of URLLC-defined latency of 1 ms.

11. Conclusions

The goal of the “integrated vision” of smart cities is to improve the quality of life of citizens in a sustainable way. It is important to have a very good coordination among different stakeholders in the smart city ecosystem to achieve this goal. The 3G/4G wireless systems cannot support emerging applications services, which seek to provide compelling target experience such as reliability, ultralow latency, and device energy efficiency, as required in the full potential of a smart city vision [47,48].
5G can connect wireless networks to thousands of diverse smart devices, such as cars, home appliances, machines, and mobile device technology. Municipalities can employ smart city technologies, such as connected sensors and data, to deliver services more efficiently and effectively.
5G can transform value chains and enable new opportunities at an unprecedented scale for the successful implementation of smart cities. 5G can enable new opportunities in smart cities by creating employment due to the fact of its own network infrastructure implementation and as a result of enabling new applications because of its deployment. This would result in boosting economic growth, which increases the annual GDP of the city. Unavoidably, we may expect job losses in conventional businesses due to the automation facilitated by 5G, for example, autonomous vehicles replacing drivers, automated parking systems replacing parking attendants, and smart waste management systems replacing sanitation workers.
Smart city operators should ensure that all citizens are in the position to take full advantage of new opportunities and improved services provided by 5G. Such services should be accessible and affordable to all. Clear rules on the acquisition and use of citizens’ data should also be established to prevent mishandling and protect privacy. Smart city operators should also adopt digital inclusion plans to ensure that all community parts of the city benefit equally from the opportunities provided by 5G. The full potential of smart cities can be unlocked by 5G networks, creating jobs and new businesses. 5G-enabled smart cities can drive economic growth and improve services and quality of life for all urban communities.
In this paper, we established a novel method for antenna deployment with the aim of broadband connectivity for a 5G-enabled municipal base station system with the provision of a downlink bit rate towards stay-at-home citizens. Various modulation schemes, ranging from the suboptimal QAM-16 to the generic BPSK (for a base-level broadband connectivity of 2.048 Mbps), can be employed. Extensive noise measurements provide equally realistic SNR values as cell-edge thresholds for the deployment of the antennas.
The uplink stream of the 5G mobile terminal to the base station can make full use of the 2 MHz subcarrier spectrum allocation. For the uplink part of the transmission, QAM-16 modulation was considered. Large-scale fading due to the fact of shadow losses can take priority over multipath fading, thus reducing the energy per bit requirements, while maintaining a very low BER. Thus, for a worst-case “cell-edge” SNR, a fraction of the broadband connectivity is available for signal transmission, leading to limitations in the baseband signaling, to maintain the mandatory URLCC specifications.
The further investigation of user data content, the digital baseband coding, and the passband modulation and transmission specifications in both streams (i.e., uplink–downlink) for realistic channel conditions, within the framework of smart city requirements and emerging new demands, is the aim of immediate future work.

Author Contributions

Conceptualization, T.C., S.G. and A.S.; methodology, T.C.; software, T.C.; validation, T.C., S.G. and A.S.; formal analysis, T.C.; investigation, S.G.; resources, A.S.; data curation, T.C., S.G. and A.S.; writing—original draft preparation, T.C., S.G. and A.S.; writing—review and editing, T.C., S.G. and A.S.; visualization, T.C. and S.G.; supervision, A.S. All authors have read and agreed to the published version of the manuscript.

Funding

This research received no external funding.

Data Availability Statement

The data presented in this study are available on request from the corresponding author. The data are not publicly available due to privacy of on-site RF measurements.

Conflicts of Interest

The authors declare no conflict of interest.

References

  1. MIT Media Lab—City Science. Available online: http://cities.media.mit.edu/projects/examples (accessed on 1 November 2022).
  2. IBM Smart Cities Projects. Available online: http://www.ibm.com/smarterplanet/us/en/smarter_cities/overview/ (accessed on 1 November 2022).
  3. Rao, S.K.; Prasad, R. Impact of 5G Technologies on Smart City Implementation. Wirel. Pers. Commun. 2018, 100, 161–176. [Google Scholar] [CrossRef]
  4. Smart Cities Mission of India. Available online: https://www.india.gov.in/spotlight/smart-cities-mission-step-towards-smart-india (accessed on 15 November 2022).
  5. Chrysikos, T. Lectures on Information Systems; University of Thessaly: Lamia, Greece, 2022. [Google Scholar]
  6. Chrysikos, T.; Galiotos, P.; Kotsopoulos, S.; Dagiuklas, T. Techno-economic analysis for the deployment of PPDR services over 4G/4G+ Networks. In Proceedings of the 2016 International Conference on Telecommunications and Multimedia (TEMU), Heraklion, Greece, 25–27 July 2016; IEEE: Piscataway, NJ, USA, 2016; pp. 1–7. [Google Scholar]
  7. Piro, G.; Cianci, I.; Grieco, L.A.; Boggia, G.; Camarda, P. Information centric services in smart cities. J. Syst. Softw. 2014, 88, 169–188. [Google Scholar] [CrossRef]
  8. Cianci, I.; Piro, G.; Grieco, L.; Boggia, G.; Camarda, P. Content Centric Services in Smart Cities. In Proceedings of the 2012 Sixth International Conference on Next Generation Mobile Applications, Services and Technologies, Paris, France, 12–14 September 2012; pp. 187–192. [Google Scholar] [CrossRef] [Green Version]
  9. Kazmi, A.; Serrano, M.; Lenis, A. Smart Governance of Heterogeneous Internet of Things for Smart Cities. In Proceedings of the 2018 12th International Conference on Sensing Technology (ICST), Limerick, Ireland, 4–6 December 2018; pp. 58–64. [Google Scholar] [CrossRef]
  10. Caragliu, A.; Del Bo, C.; Nijkamp, P. Smart cities in Europe. J. Urban Technol. 2011, 18, 65–82. [Google Scholar] [CrossRef]
  11. Batty, M.; Axhausen, K.W.; Giannotti, F.; Pozdnoukhov, A.; Bazzani, A.; Wachowicz, M.; Ouzounis, G.; Portugali, Y. Smart cities of the future. Eur. Phys. J. Spec. Top. 2012, 214, 481–518. [Google Scholar] [CrossRef] [Green Version]
  12. Harrison, C.; Donnelly, I.A. A theory of smart cities. In Proceedings of the 55th Annual Meeting of the ISSS-2011, Hull, UK, 17–22 July 2011. [Google Scholar]
  13. Letaifa, S.B. How to strategize smart cities: Revealing the SMART model. J. Bus. Res. 2015, 68, 1414–1419. [Google Scholar] [CrossRef]
  14. Chourabi, H.; Nam, T.; Walker, S.; Gil-Garcia, J.R.; Mellouli, S.; Nahon, K.; Pardo, T.A.; Scholl, H.J. Understanding smart cities: An integrative framework. In Proceedings of the 2012 45th Hawaii International Conference on System Sciences, Maui, HI, USA, 4–7 January 2012; IEEE: Piscataway, NJ, USA, 2012. [Google Scholar]
  15. Deakin, M.; Al Waer, H. From intelligent to smart cities. Intell. Build. Int. 2011, 3, 140–152. [Google Scholar] [CrossRef]
  16. Li, Z.; Uusitalo, M.A.; Shariatmadari, H.; Singh, B. 5G URLLC: Design challenges and system concepts. In Proceedings of the 2018 15th International Symposium on Wireless Communication Systems (ISWCS), Lisbon, Portugal, 28–31 August 2018; IEEE: Piscataway, NJ, USA, 2018; pp. 1–6. [Google Scholar]
  17. Minoli, D.; Occhiogrosso, B. Practical aspects for the integration of 5G networks and IoT applications in smart cities environments. Wirel. Commun. Mob. Comput. 2019, 2019, 5710834. [Google Scholar] [CrossRef] [Green Version]
  18. Guevara, L.; Auat Cheein, F. The role of 5G technologies: Challenges in smart cities and intelligent transportation systems. Sustainability 2020, 12, 6469. [Google Scholar] [CrossRef]
  19. Zhao, X.; Askari, H.; Chen, J. Nanogenerators for smart cities in the era of 5G and Internet of Things. Joule 2021, 5, 1391–1431. [Google Scholar] [CrossRef]
  20. Han, T.; Ge, X.; Wang, L.; Kwak, K.S.; Han, Y.; Liu, X. 5G converged cell-less communications in smart cities. IEEE Commun. Mag. 2017, 55, 44–50. [Google Scholar] [CrossRef] [Green Version]
  21. Angelidou, M. Smart cities: A conjuncture of four forces. Cities 2015, 47, 95–106. [Google Scholar] [CrossRef]
  22. Albino, V.; Berardi, U.; Dangelico, R.M. Smart cities: Definitions, dimensions, performance, and initiatives. J. Urban Technol. 2015, 22, 3–21. [Google Scholar] [CrossRef]
  23. Ahvenniemi, H.; Huovila, A.; Pinto-Seppä, I.; Airaksinen, M. What are the differences between sustainable and smart cities? Cities 2017, 60, 234–245. [Google Scholar] [CrossRef]
  24. Lazaroiu, G.C.; Roscia, M. Definition methodology for the smart cities model. Energy 2012, 47, 326–332. [Google Scholar] [CrossRef]
  25. Manville, C.; Cochrane, G.; Jonathan, C.A.; Millard, J.; Pederson, J.K.; Thaarup, R.K.; WiK, A.L.; WiK, M.W. Mapping Smart Cities in the EU; EPRS: Brussels, Belgium, 2014. [Google Scholar]
  26. Zanella, A.; Bui, N.; Castellani, A.; Vangelista, L.; Zorzi, M. Internet of things for smart cities. IEEE Internet Things J. 2014, 1, 22–32. [Google Scholar] [CrossRef]
  27. Mahizhnan, A. Smart cities: The Singapore case. Cities 1999, 16, 13–18. [Google Scholar] [CrossRef]
  28. Available online: https://ajuntament.barcelona.cat/digital/en/digital-innovation/digital-economy/5g-barcelona (accessed on 30 November 2022).
  29. Available online: https://5gbarcelona.org/pilots/5g-interactive-city/ (accessed on 30 November 2022).
  30. Available online: https://www.5gmediahub.eu/5gmediahub-in-smart-city-world-congress-in-barcelona/ (accessed on 30 November 2022).
  31. Available online: https://www.investstratford.com/smart-city (accessed on 30 November 2022).
  32. Available online: https://www.smartcitiesworld.net/4g-and-5g/4g-and-5g/singapore-to-create-testbed-for-maritime-5g-use-cases (accessed on 30 November 2022).
  33. Alfa, A.S.; Maharaj, B.T.; Ghazaleh, H.A.; Awoyemi, B. The role of 5G and IoT in smart cities. In Handbook of Smart Cities; Springer: Cham, Switzerland, 2018; pp. 31–54. [Google Scholar]
  34. Shehab, M.J.; Kassem, I.; Kutty, A.A.; Kucukvar, M.; Onat, N.; Khattab, T. 5G Networks Towards Smart and Sustainable Cities: A Review of Recent Developments, Applications and Future Perspectives. IEEE Access 2021, 10, 2987–3006. [Google Scholar] [CrossRef]
  35. Gohar, A.; Nencioni, G. The role of 5G technologies in a smart city: The case for intelligent transportation system. Sustainability 2021, 13, 5188. [Google Scholar] [CrossRef]
  36. Yin, C.; Xiong, Z.; Chen, H.; Wang, J.; Cooper, D.; David, B. A literature survey on smart cities. Sci. China Inf. Sci. 2015, 58, 1–18. [Google Scholar] [CrossRef]
  37. Al Nuaimi, E.; Al Neyadi, H.; Mohamed, N.; Al-Jaroodi, J. Applications of big data to smart cities. J. Internet Serv. Appl. 2015, 6, 25. [Google Scholar] [CrossRef] [Green Version]
  38. Bellavista, P.; Cardone, G.; Corradi, A.; Foschini, L. Convergence of MANET and WSN in IoT urban scenarios. IEEE Sens. J. 2013, 13, 3558–3567. [Google Scholar] [CrossRef]
  39. Jakes, W.C. (Ed.) Microwave Mobile Communications; Wiley Interscience: New York, NY, USA, 1974. [Google Scholar]
  40. Seybold, J.S. Introduction to RF Propagation; Wiley Interscience: Hoboken, NJ, USA, 2005. [Google Scholar]
  41. Rappaport, T. Wireless Communications: Principles & Practice; Prentice Hall: Upper Saddle River, NJ, USA, 1999. [Google Scholar]
  42. Chrysikos, T.; Kotsopoulos, S. Characterization of large-scale fading for the 2.4 GHz channel in obstacle-dense indoor propagation topologies. In Proceedings of the IEEE Vehicular Technology Conference (VTC-Fall 2012), Quebec City, QC, Canada, 3–6 September 2012. [Google Scholar]
  43. Vieira, P.; Queluz, M.; Rodrigues, A. LTE Multi Antenna Bit Rate Expectation for Urban Macro-cell Networks. In Proceedings of the 7th Ibero-American Congress on Sensors (IBERSENSOR 2010), Lisbon, Portugal, 9–11 November 2010. [Google Scholar]
  44. Available online: https://www.who.int/data/gho/indicator-metadata-registry/imr-details/2380 (accessed on 1 November 2022).
  45. Tanenbaum, A.S. Computer Networks; Prentice Hall: Hoboken, NJ, USA, 2003. [Google Scholar]
  46. Hämäläinen, M.; Taparugssanagorn, A.; Iinatti, J. On the WBAN radio channel modelling for medical applications. In Proceedings of the 5th European Conference on Antennas and Propagation (EUCAP), Rome, Italy, 11–15 April 2011; IEEE: Piscataway, NJ, USA, 2011; pp. 2967–2971. [Google Scholar]
  47. Yigitcanlar, T.; Kamruzzaman, M.; Buys, L.; Ioppolo, G.; Sabatini-Marques, J.; da Costa, E.M.; Yun, J.J. Understanding ‘smart cities’: Intertwining development drivers with desired outcomes in a multidimensional framework. Cities 2018, 81, 145–160. [Google Scholar] [CrossRef]
  48. Kramarz, M.; Dohn, K.; Przybylska, E.; Jonek-Kowalska, I. Smart City: A Holistic Approach. In Urban Logistics in a Digital World; Palgrave Macmillan: Cham, Switzerland, 2022; pp. 1–19. [Google Scholar]
Figure 1. Antenna range vs. shadow depth for a 5G-enabled smart city broadband coverage scenario.
Information 14 00156 g001
Figure 2. Square approximation of circular coverage.
Information 14 00156 g002
Figure 3. Number of municipal base stations required for a 5G-enabled coverage of an urban obstacle-dense propagation topology.
Information 14 00156 g003
Figure 4. Signal-to-noise ratio (SNR) for wireless propagation in a room (15 m area) for a 10 dB shadow loss at 900, 2400, and 3500 MHz.
Information 14 00156 g004
Figure 5. BER simulation results for an NLOS channel employing the QAM-16 modulation scheme: Rayleigh and log-normal fitting curves.
Information 14 00156 g005
Figure 6. BER vs Eb/No simulation results for different modulation schemes and channel condition assumptions.
Information 14 00156 g006
Table 1. Examples of services for 5G-enabled smart cities.
Smart WorldExamples of Services
TransportationIntelligent parking, bicycle management, and ITS (intelligent transport systems)
HealthcareMobile health/mHealth solutions, smart home care systems, remote monitoring systems for the elderly, chronically ill or disabled, and stay-at-home patient monitoring during a pandemic (i.e., COVID-19)
EnergySmart meters for electricity, gas, and water supply, smart grid services, and decentralized energy systems
Building and Housing InfrastructureSmart homes using sensors for heating, air conditioning, lighting, security systems, and other applications
EducationMobile learning applications and remote access
Waste DisposalSmart bins in homes, shopping centers, public buildings, and public spaces
Disclaimer/Publisher’s Note: The statements, opinions and data contained in all publications are solely those of the individual author(s) and contributor(s) and not of MDPI and/or the editor(s). MDPI and/or the editor(s) disclaim responsibility for any injury to people or property resulting from any ideas, methods, instructions or products referred to in the content.

