
Non-Invasive Classification of Blood Glucose Level Based on Photoplethysmography Using Time–Frequency Analysis


Abstract
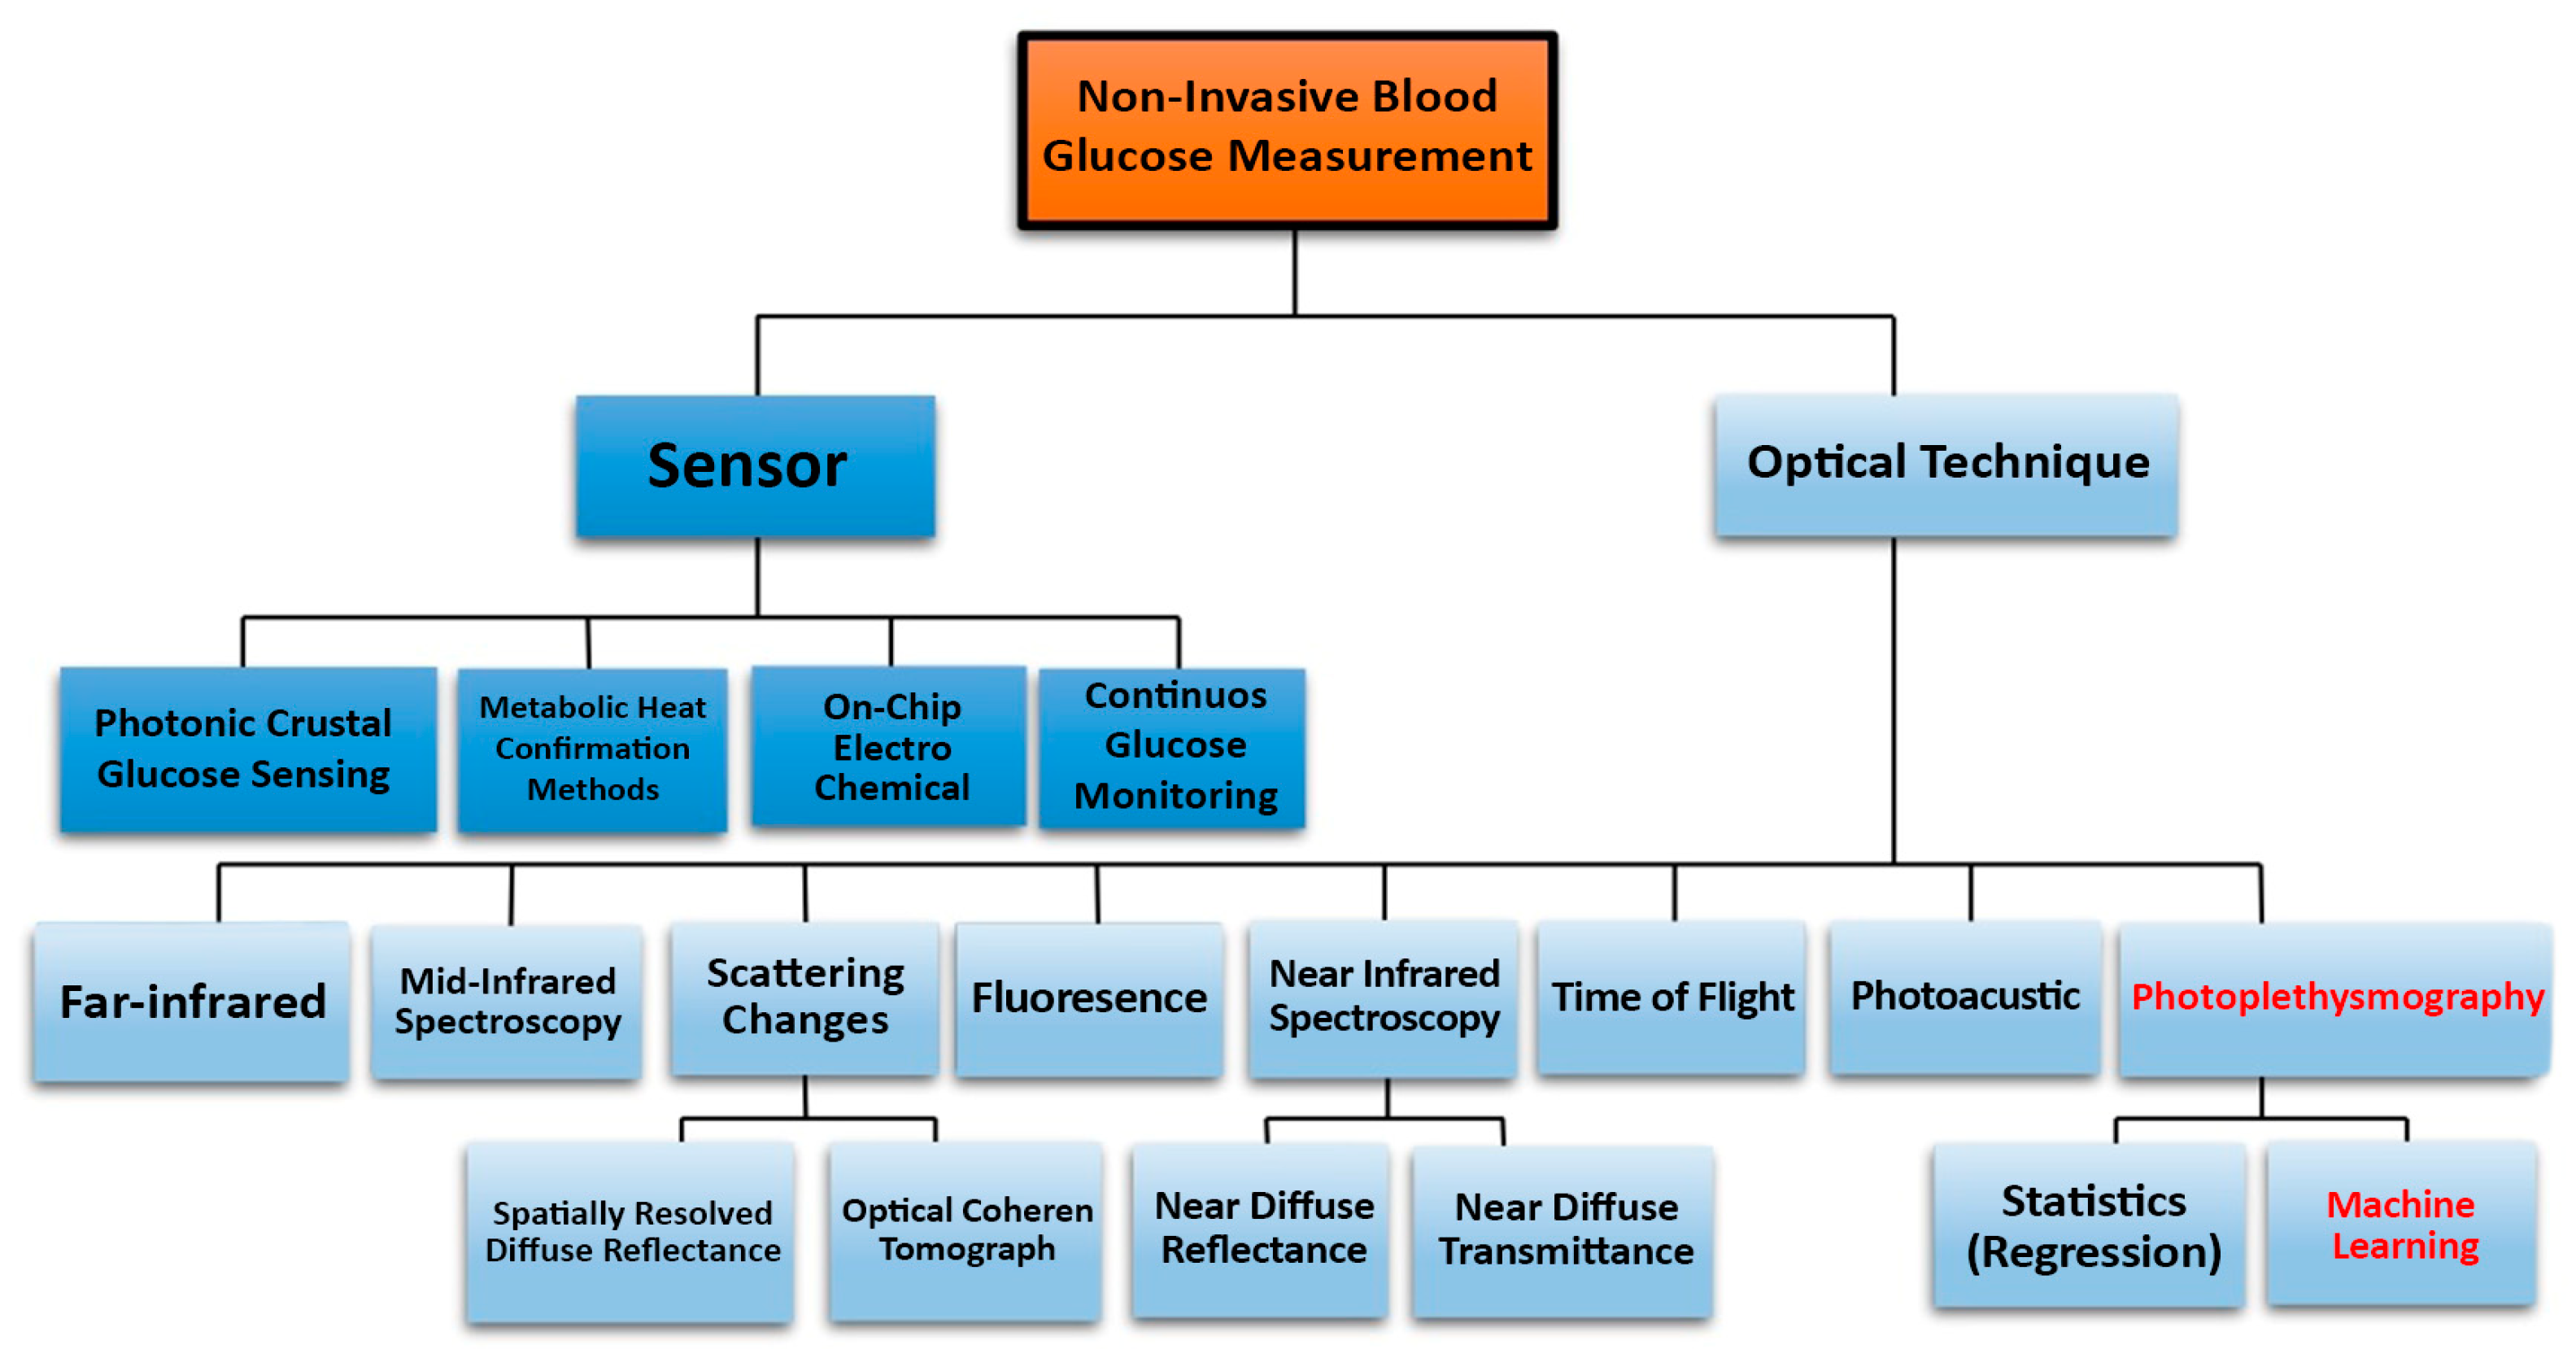
:1. Introduction
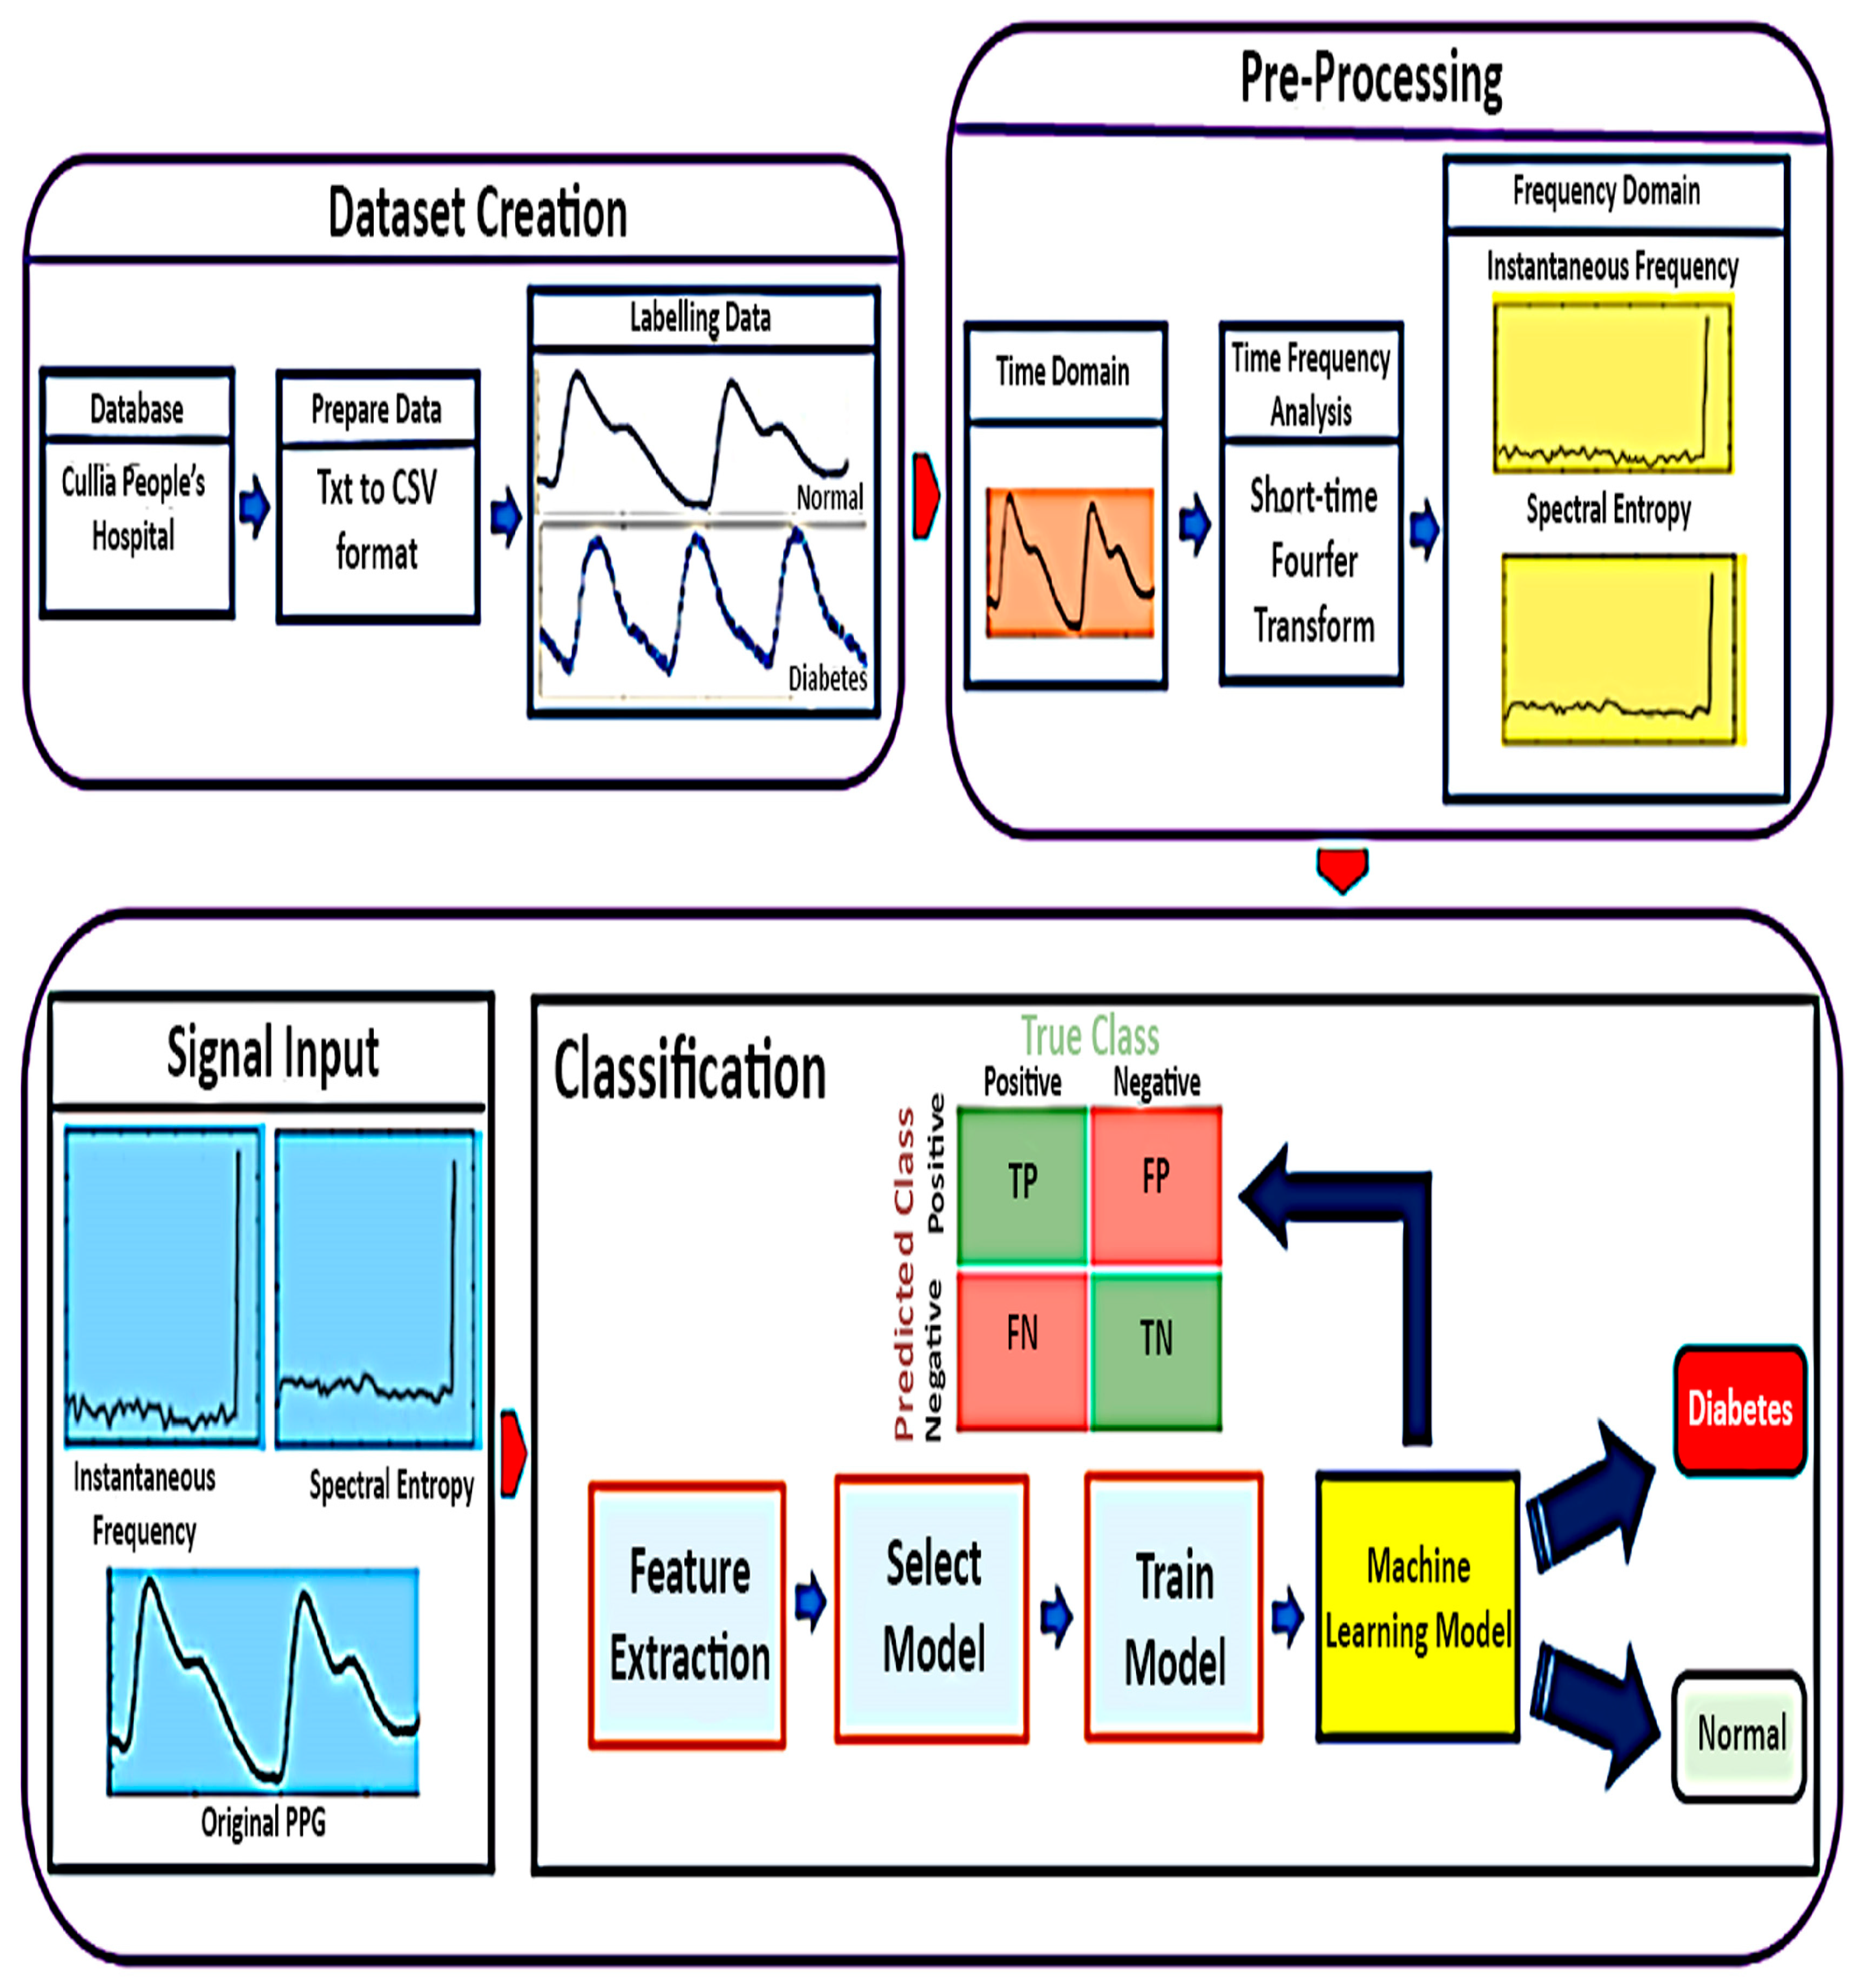
2. Materials and Methods
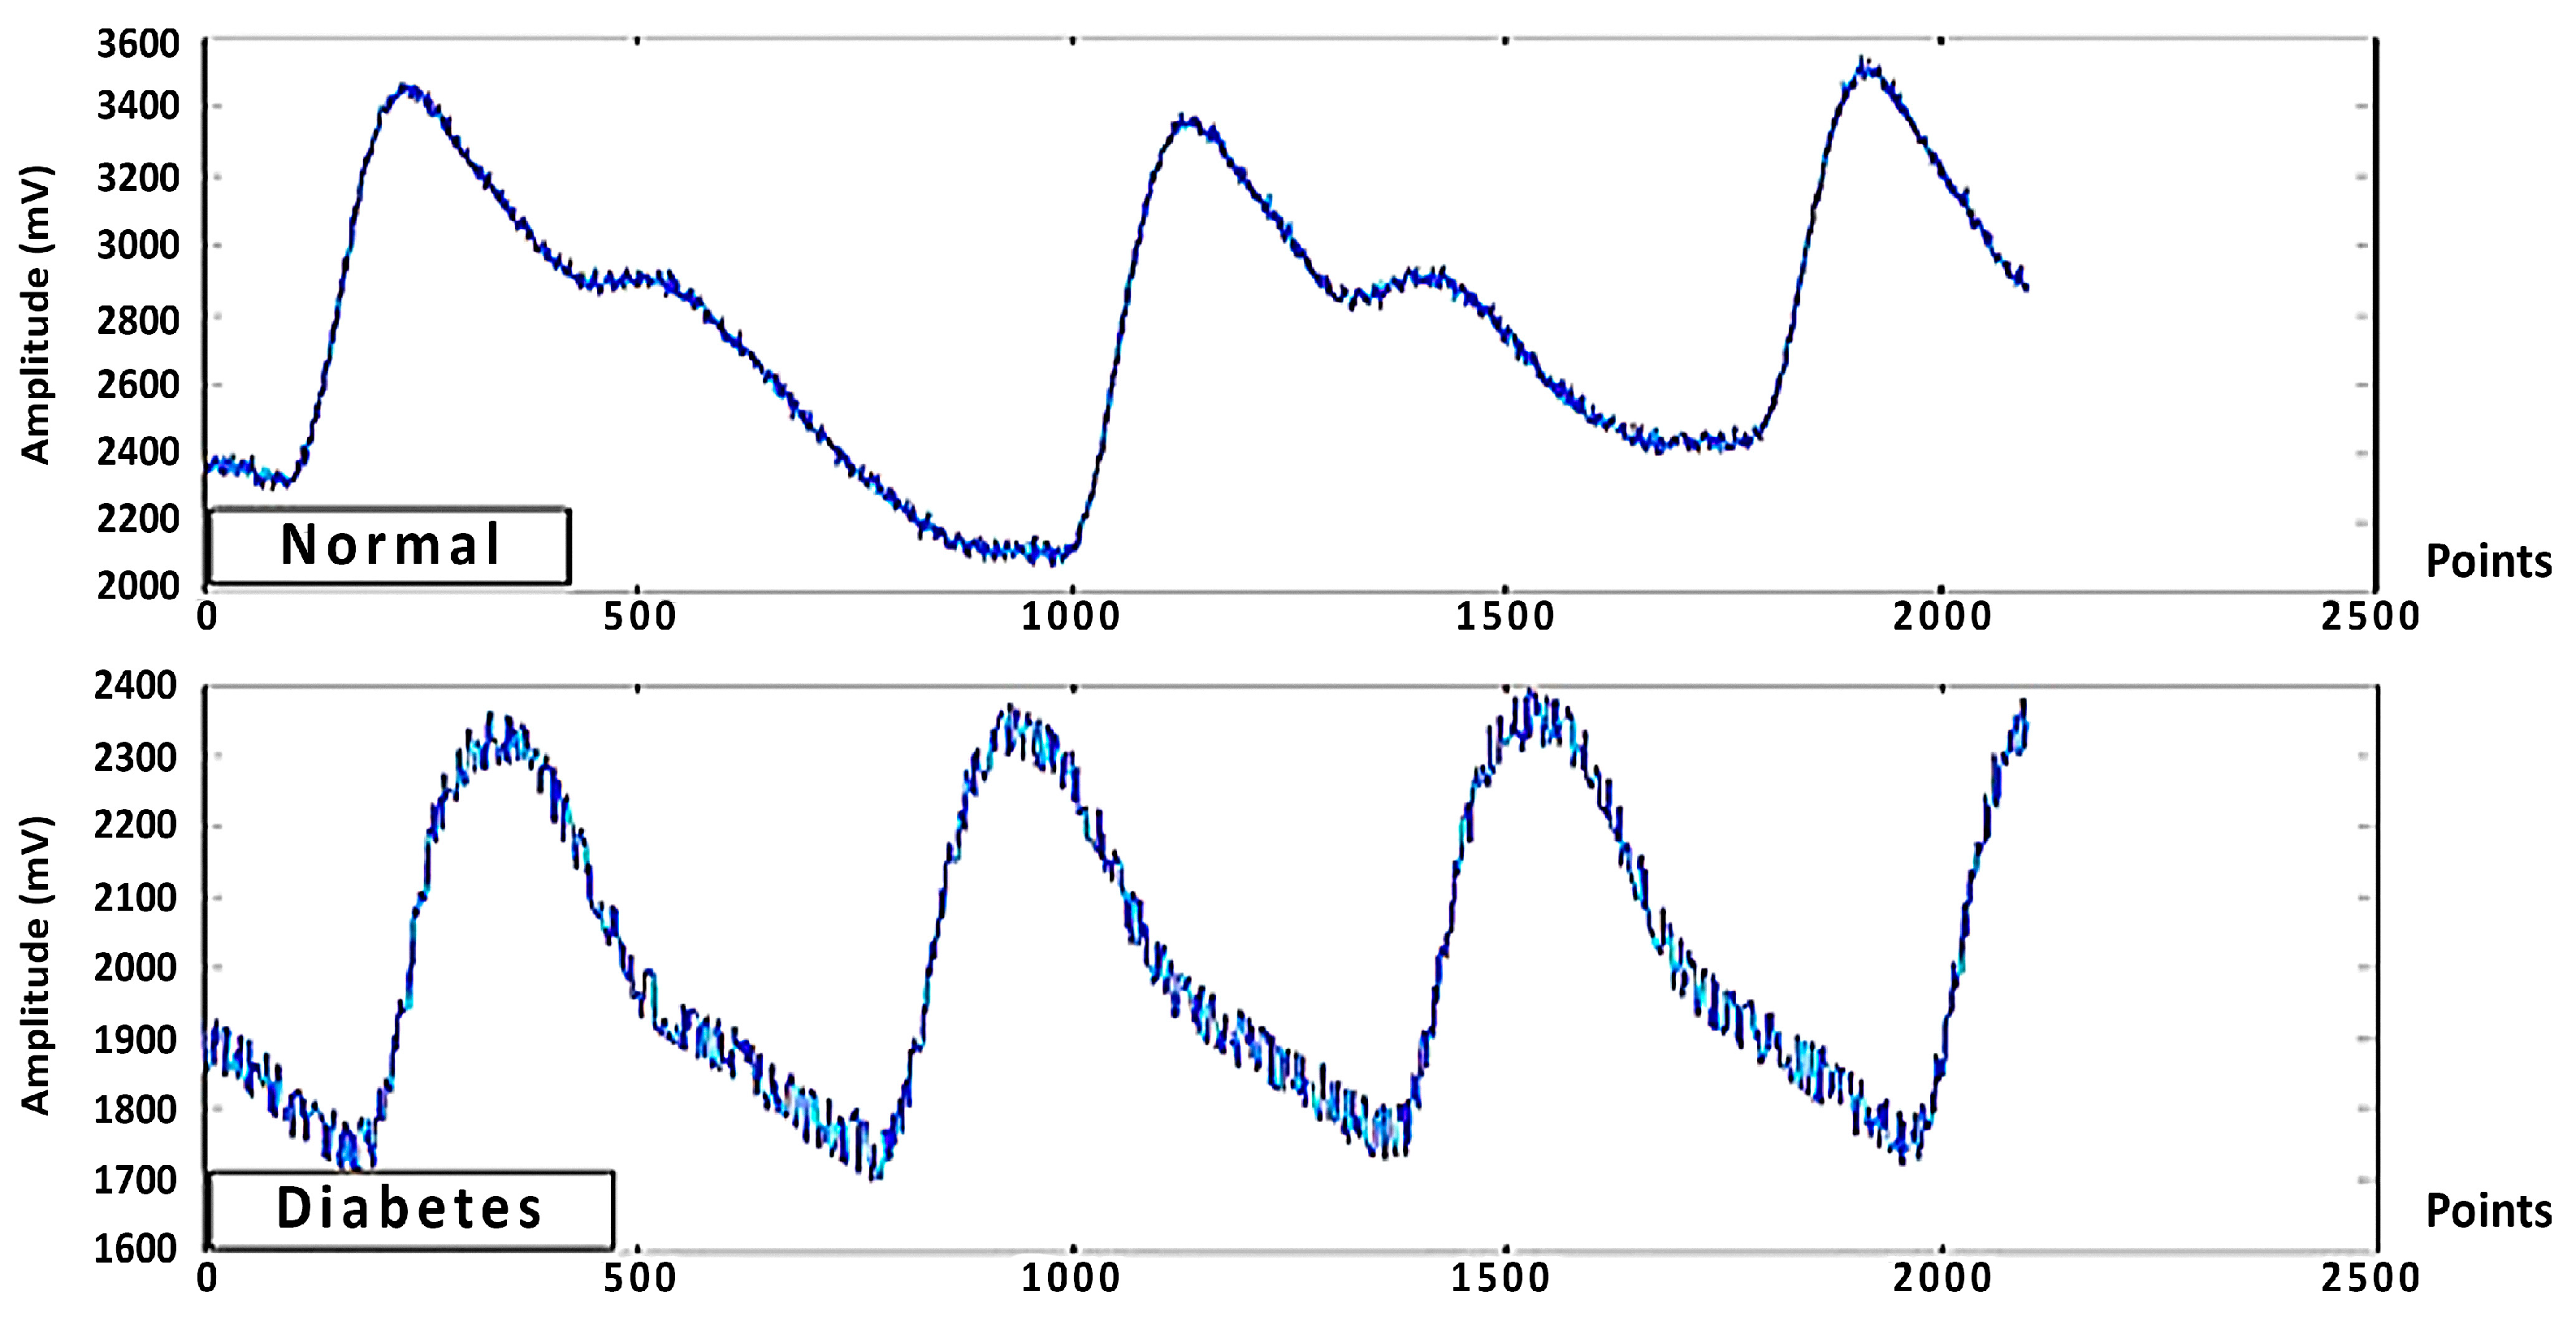
2.1. Data Collection
2.2. Time Frequency Analysis
2.3. Classifier
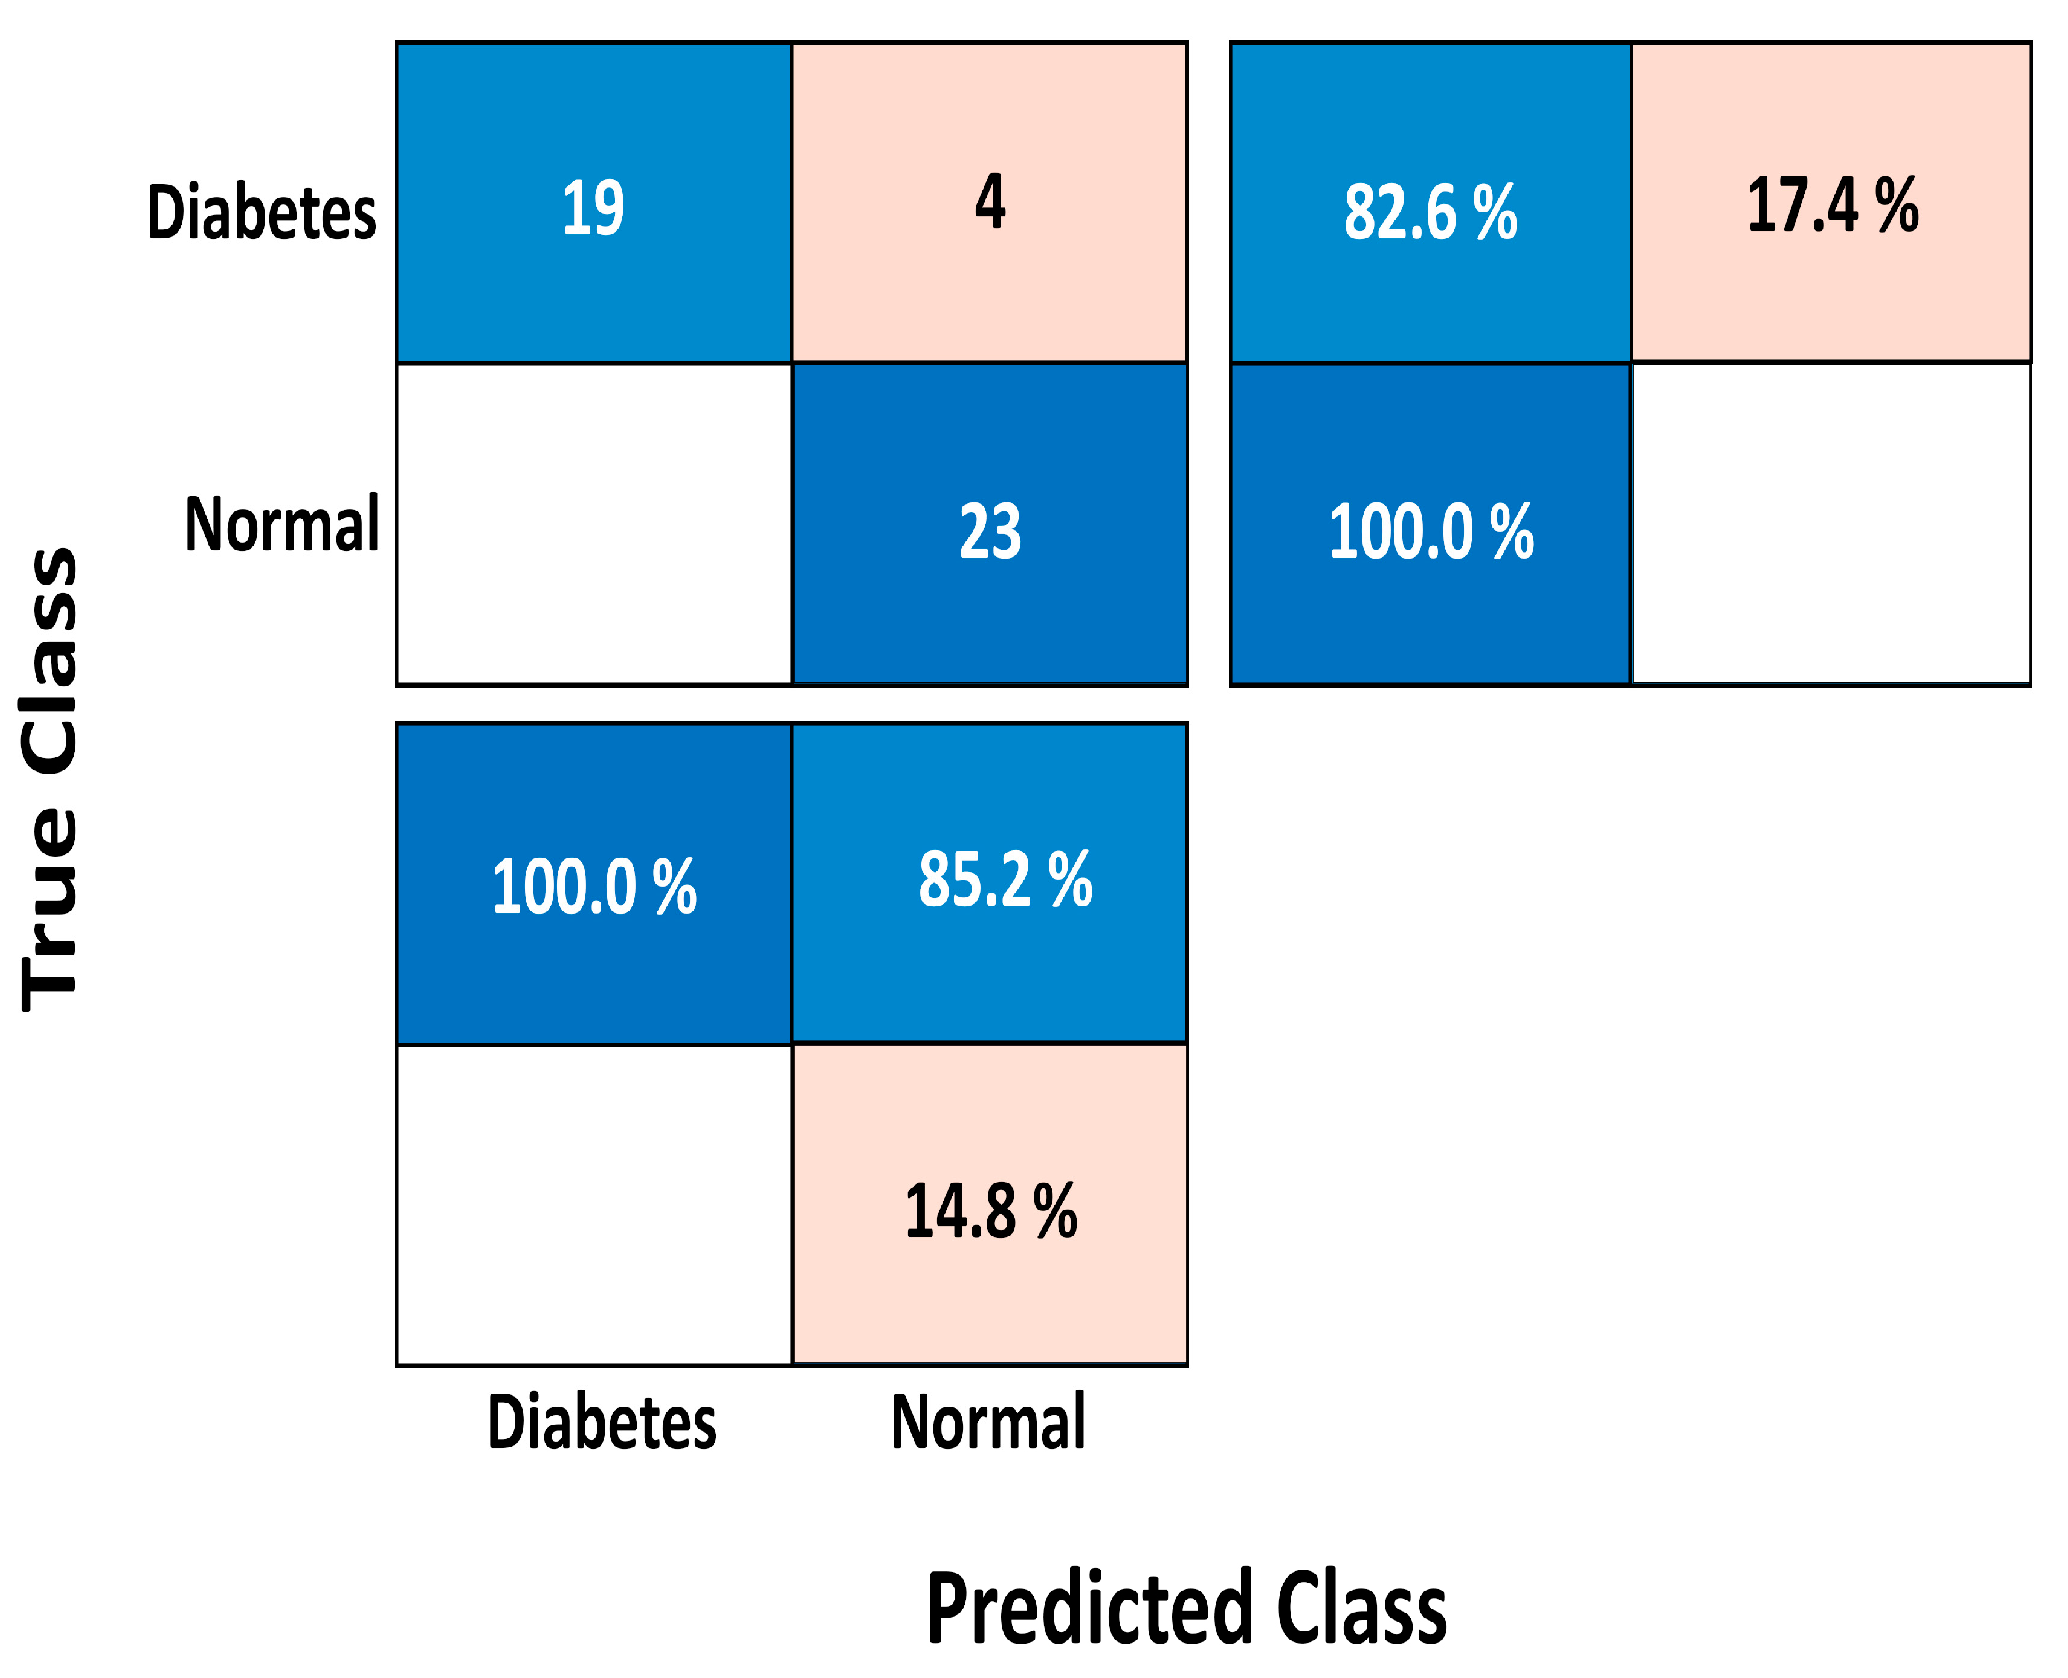
2.4. Confusion Matrix
- True negatives (TN) occur when the actual value and the prediction are both negative, and true positives (TP) occur when the actual value and the prediction are both positive.
- False positives (FP) occur when a positive outcome is predicted but the actual result is negative, also known as a Type 1 error.
- False negatives (FN) are when a negative outcome is predicted but the actual result is positive, sometimes referred to as a type 2 error.
3. Results
3.1. Original PPG
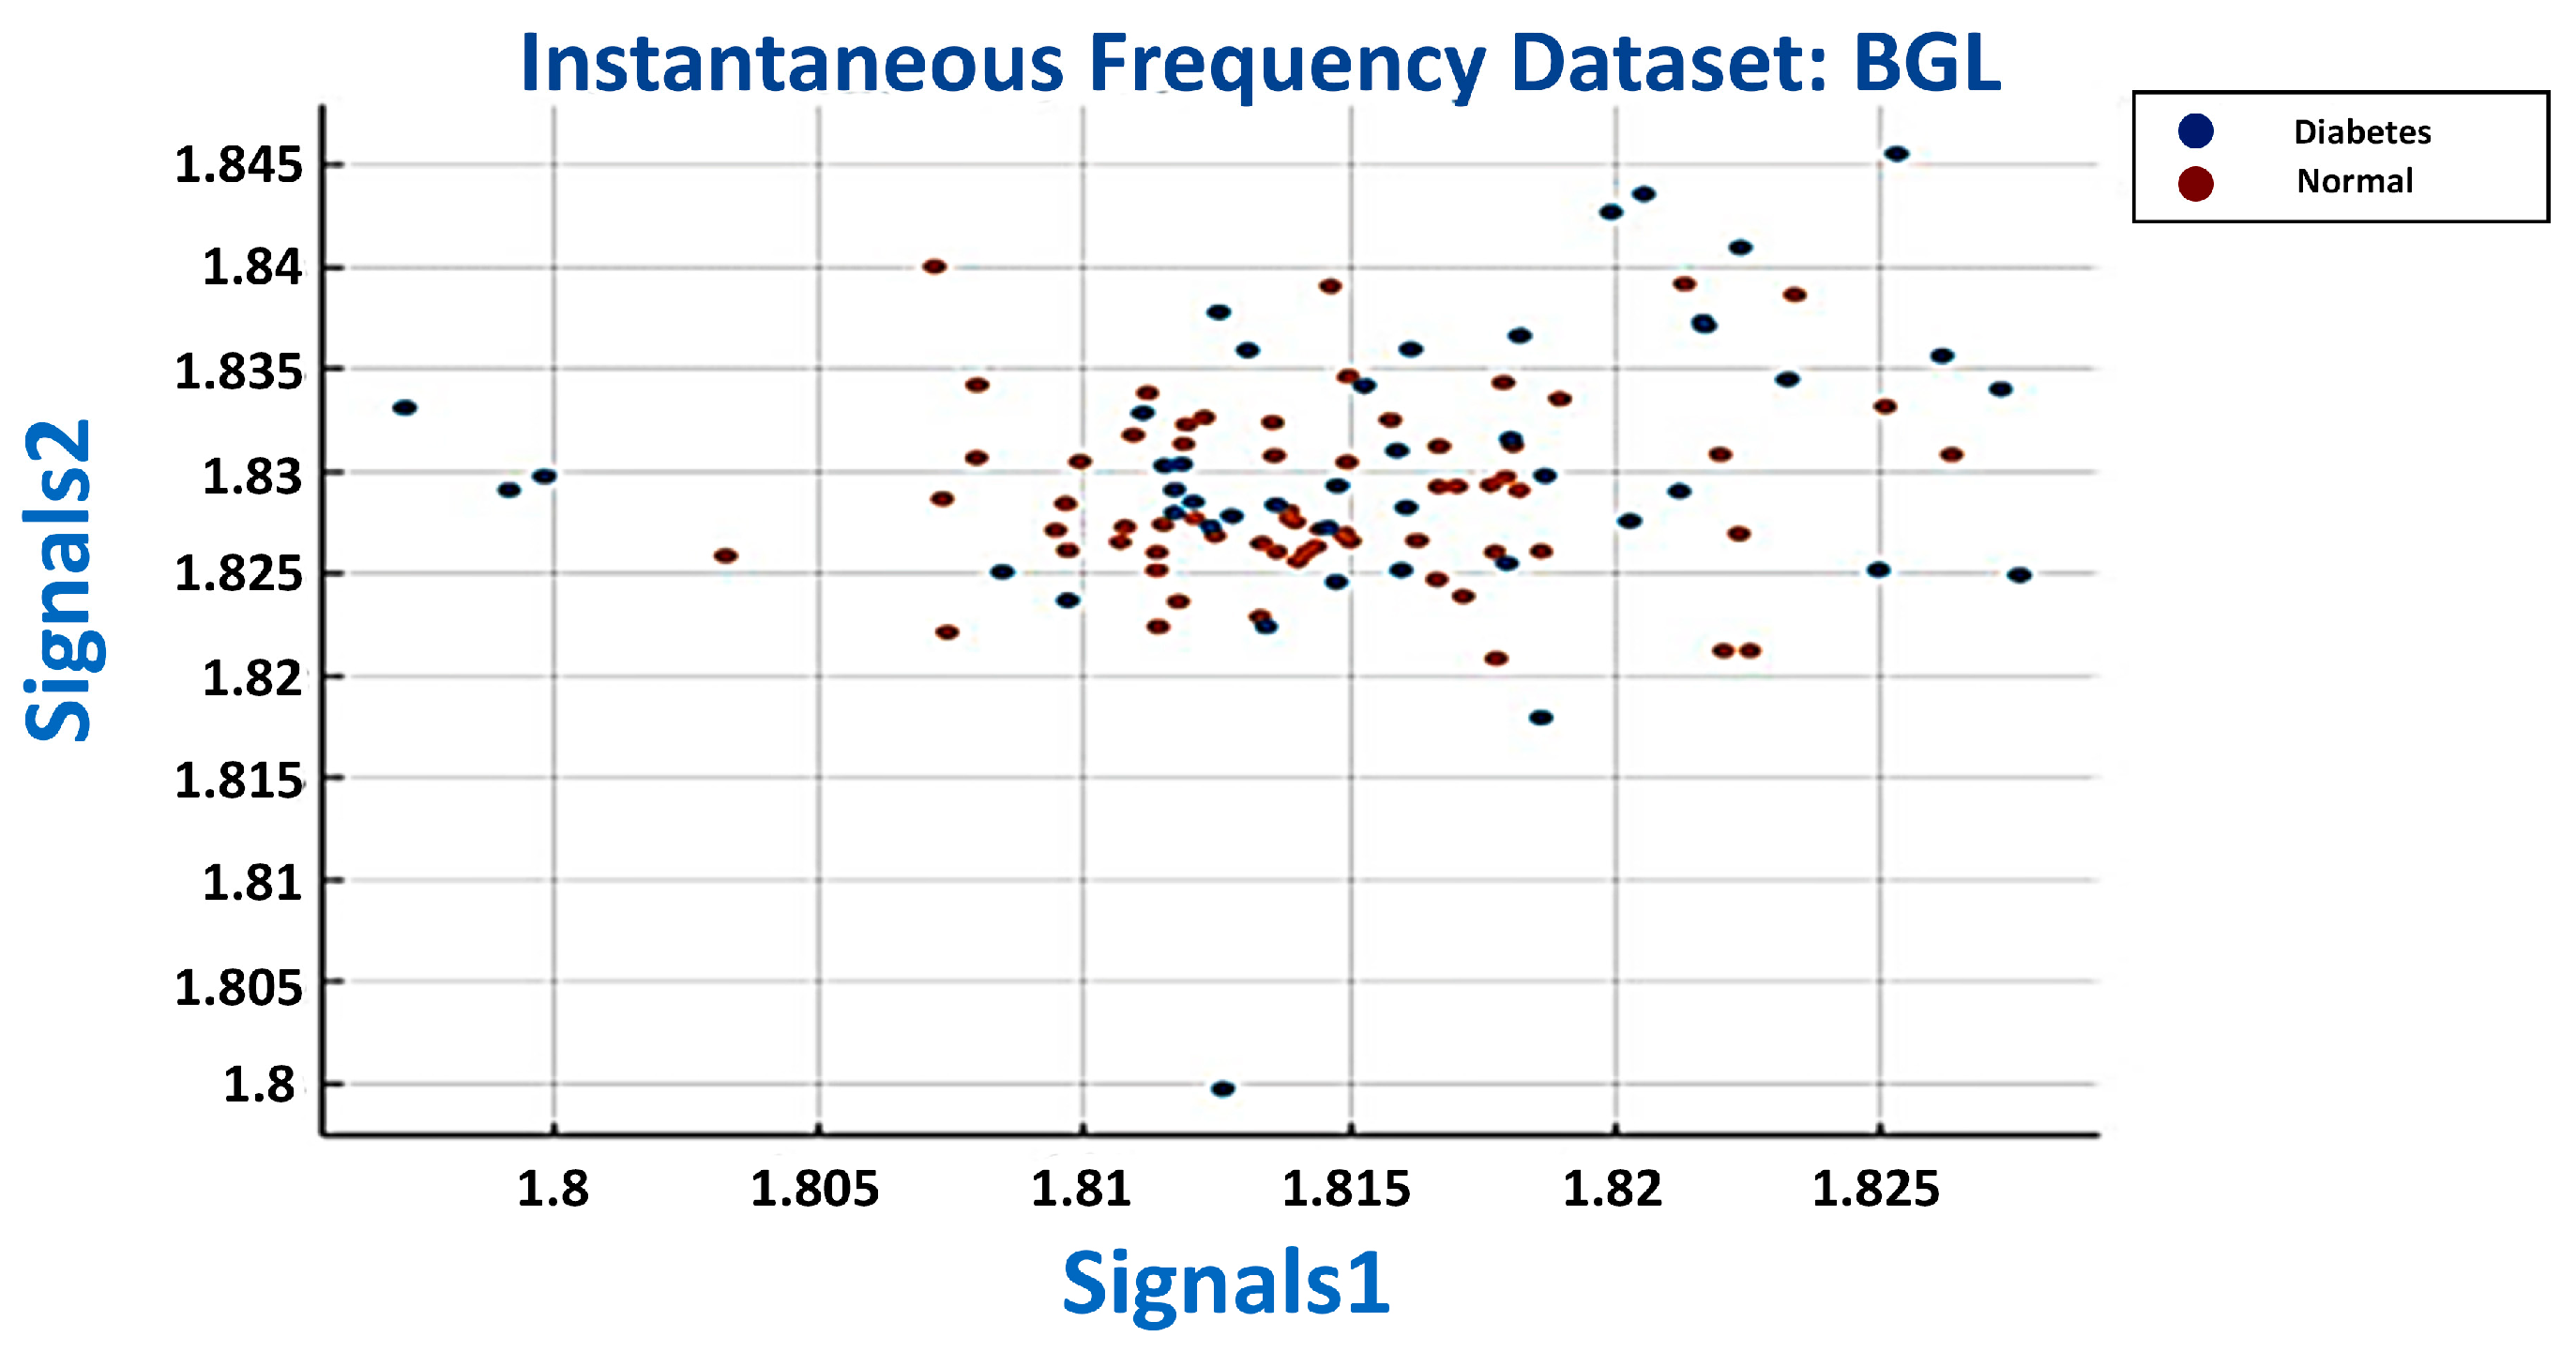
3.2. Instantaneous Frequency
3.3. Spectral Entropy
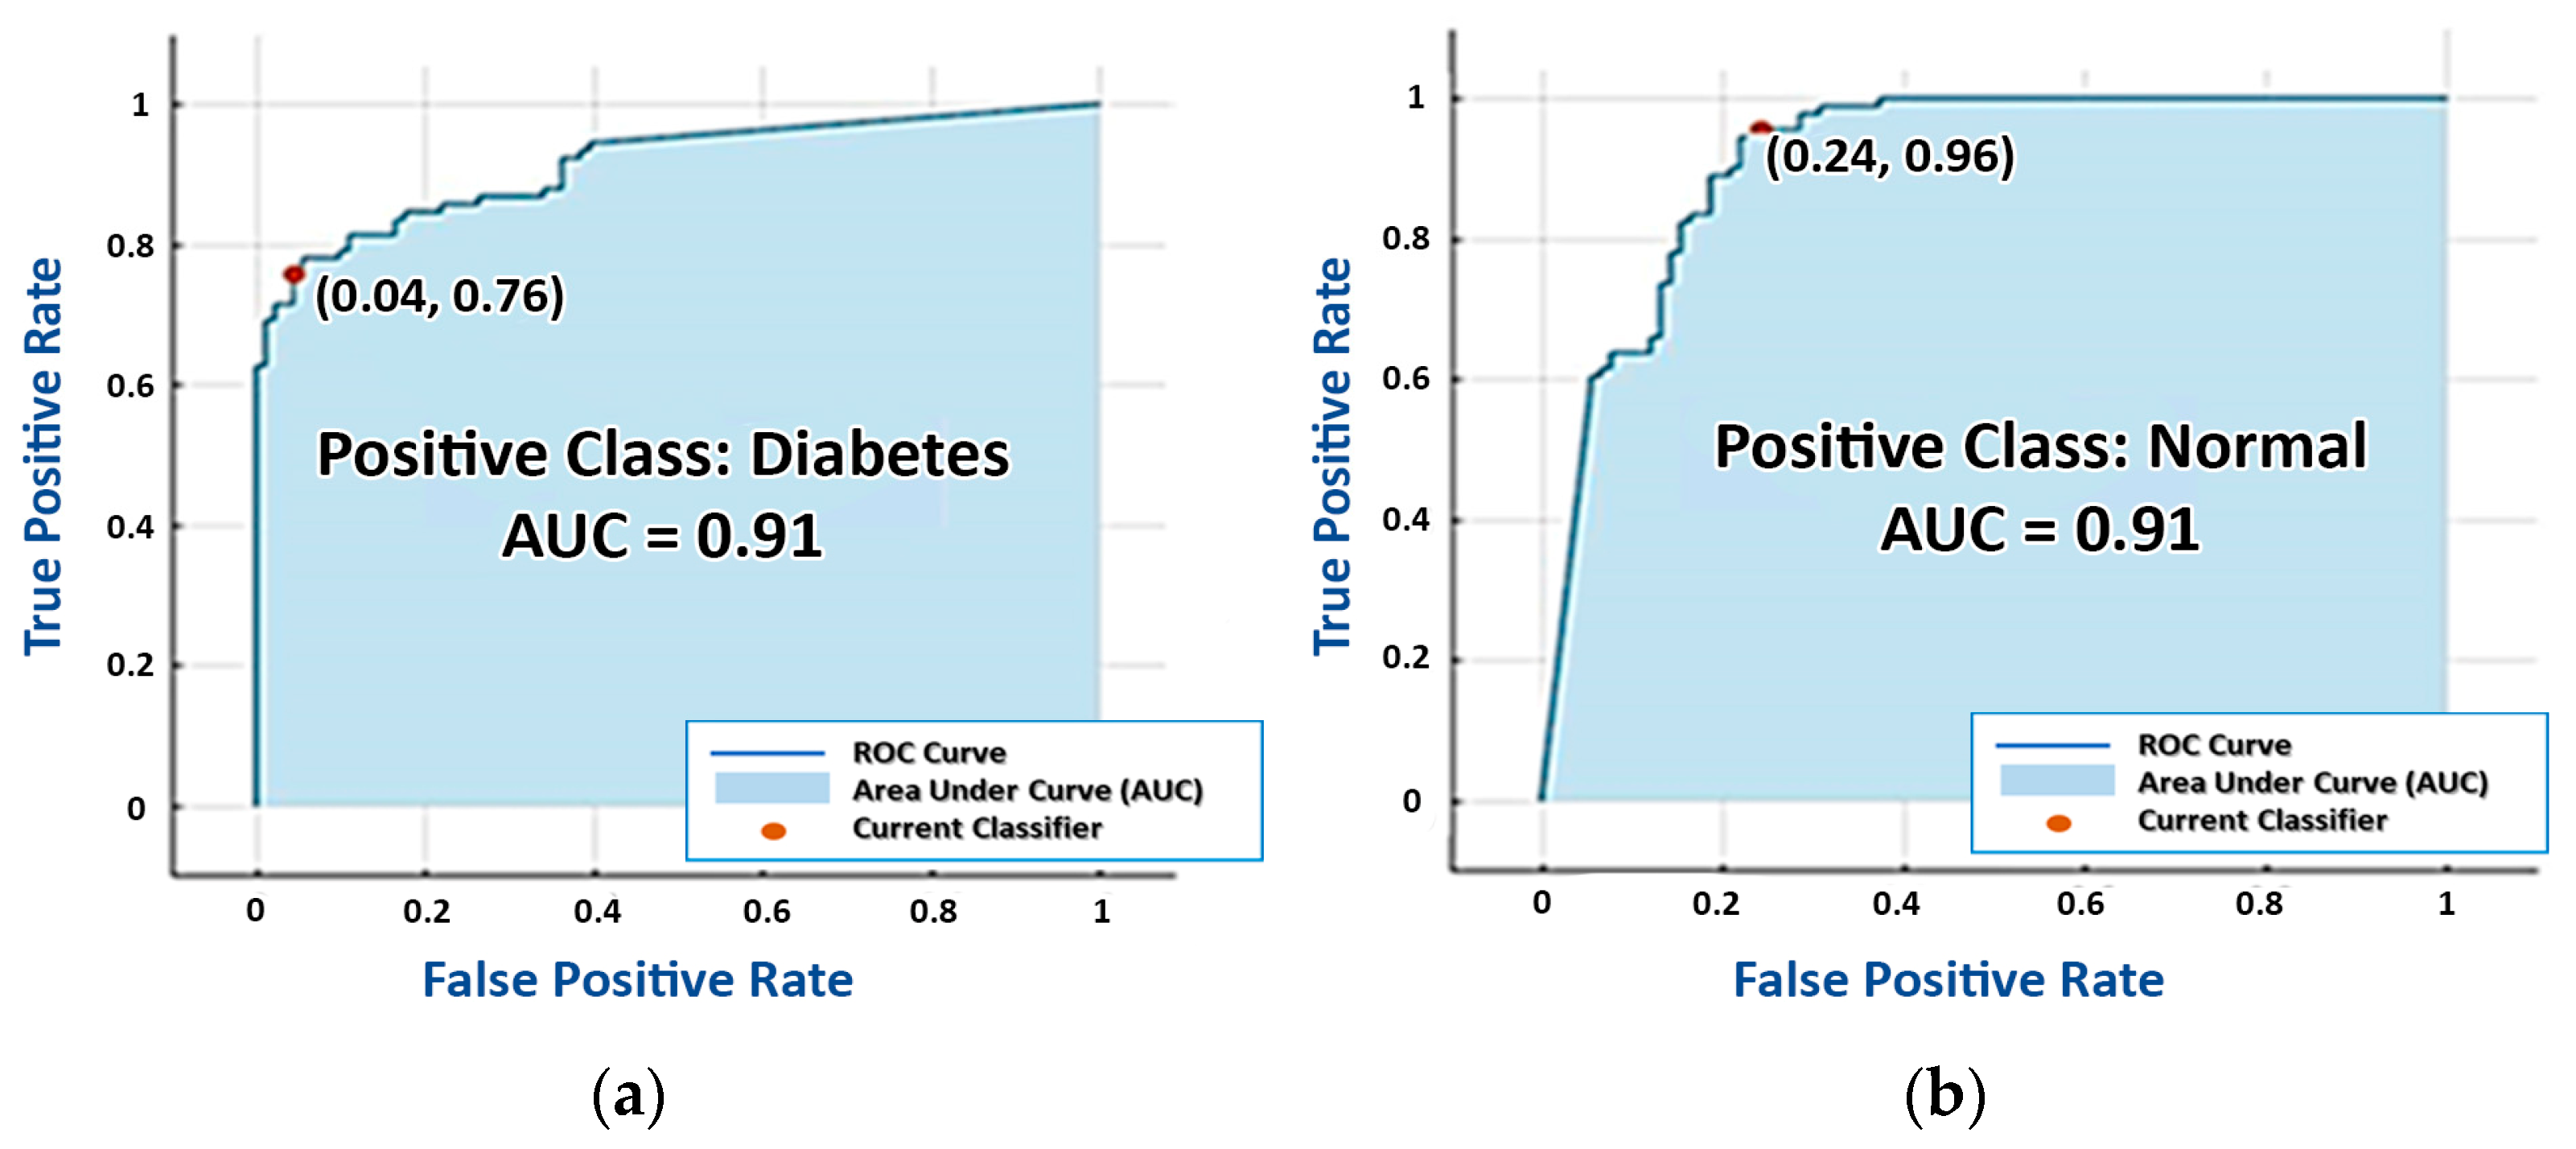
3.4. Final Results
4. Discussion
5. Conclusions
Author Contributions
Funding
Data Availability Statement
Conflicts of Interest
References
- IDF DIABETES ATLAS, Seventh Edition. 2015. Available online: https://www.idf.org/e-library/welcome.html (accessed on 1 February 2023).
- Ahuja, A.; Gupta, R. Diabetes Silent Killer: Medical focus on Food Replacement and Dietary Plans. Adv. Bioresearch 2020, 11, 128–135. [Google Scholar] [CrossRef]
- Carracher, A.M.; Marathe, P.H.; Close, K.L. International Diabetes Federation 2017. J. Diabetes 2018, 10, 353–356. [Google Scholar] [CrossRef] [PubMed] [Green Version]
- Banoo, H.; Nusrat, N.; Nasir, N. Type2 diabetes mellitus: A review of current trends. RAMA Univ. J. Med. Sci. 2015, 1, 50–57. [Google Scholar]
- American Diabetes Association 2. Classification and Diagnosis of Diabetes. Diabetes Care 2015, 38, S8–S16. [Google Scholar] [CrossRef] [Green Version]
- WHO. Global Report on Diabetes; WHO: Geneva, Switzerland, 2016. [Google Scholar]
- Nawaz, A.; Øhlckers, P.; Sælid, S.; Jacobsen, M.; Akram, M.N. Review: Non-Invasive Continuous Blood Glucose Measurement Techniques. J. Bioinform. Diabetes 2016, 1, 1–27. [Google Scholar] [CrossRef] [Green Version]
- Nicholas, D.; Logan, K.A.; Sheng, Y.; Gao, J.; Farrell, S.; Dixon, D.; Callan, B.; McHale, A.P.; Callan, J.F. Rapid paper based colorimetric detection of glucose using a hollow microneedle device. Int. J. Pharm. 2018, 547, 244–249. [Google Scholar] [CrossRef] [PubMed]
- Galaviz, K.I.; Narayan, K.M.V.; Lobelo, F.; Weber, M.B. Lifestyle and the Prevention of Type 2 Diabetes: A Status Report. Am. J. Lifestyle Med. 2015, 12, 4–20. [Google Scholar] [CrossRef]
- Alsunaidi, B.; Althobaiti, M.; Tamal, M.; Albaker, W.; Al-Naib, I. A Review of Non-Invasive Optical Systems for Continuous Blood Glucose Monitoring. Sensors 2021, 21, 6820. [Google Scholar] [CrossRef]
- Villena Gonzales, W.; Mobashsher, A.T.; Abbosh, A. The Progress of Glucose Monitoring—A Review of Invasive to Minimally and Non-Invasive Techniques, Devices and Sensors. Sensors 2019, 19, 800. [Google Scholar] [CrossRef] [Green Version]
- Tang, L.; Chang, S.J.; Chen, C.-J.; Liu, J.-T. Non-Invasive Blood Glucose Monitoring Technology: A Review. Sensors 2020, 20, 6925. [Google Scholar] [CrossRef]
- Cengiz, E.; Tamborlane, W.V. A Tale of Two Compartments: Interstitial Versus Blood Glucose Monitoring. Diabetes Technol. Ther. 2009, 11, S11. [Google Scholar] [CrossRef] [PubMed]
- Monte-Moreno, E. Non-invasive estimate of blood glucose and blood pressure from a photoplethysmograph by means of machine learning techniques. Artif. Intell. Med. 2011, 53, 127–138. [Google Scholar] [CrossRef] [PubMed]
- Allen, J. Photoplethysmography and its application in clinical physiological measurement. Physiol. Meas. 2007, 28, R1–R39. [Google Scholar] [CrossRef] [Green Version]
- Tjahjadi; Ramli, K. Noninvasive Blood Pressure Classification Based on Photoplethysmography Using K-Nearest Neighbors Algorithm: A Feasibility Study. Information 2020, 11, 93. [Google Scholar] [CrossRef] [Green Version]
- Pilt, K.; Meigas, K.; Ferenets, R.; Temitski, K.; Viigimaa, M. Photoplethysmographic signal waveform index for detection of increased arterial stiffness. Physiol. Meas. 2014, 35, 2027–2036. [Google Scholar] [CrossRef] [PubMed] [Green Version]
- Lei, R.; Ling, B.W.-K.; Feng, P.; Chen, J. Estimation of Heart Rate and Respiratory Rate from PPG Signal Using Complementary Ensemble Empirical Mode Decomposition with both Independent Component Analysis and Non-Negative Matrix Factorization. Sensors 2020, 20, 3238. [Google Scholar] [CrossRef] [PubMed]
- Sen Gupta, S.; Kwon, T.-H.; Hossain, S.; Kim, K.-D. Towards non-invasive blood glucose measurement using machine learning: An all-purpose PPG system design. Biomed. Signal Process. Control 2021, 68, 102706. [Google Scholar] [CrossRef]
- Castaneda, D.; Esparza, A.; Ghamari, M.; Soltanpur, C.; Nazeran, H. A review on wearable photoplethysmography sensors and their potential future applications in health care. Int. J. Biosens. Bioelectron. 2018, 4, 195–202. [Google Scholar] [CrossRef] [Green Version]
- Zhang, G.; Mei, Z.; Zhang, Y.; Ma, X.; Lo, B.; Chen, D.; Zhang, Y. A Noninvasive Blood Glucose Monitoring System Based on Smartphone PPG Signal Processing and Machine Learning. IEEE Trans. Ind. Inform. 2020, 16, 7209–7218. [Google Scholar] [CrossRef]
- Tyapochkin, K.; Smorodnikova, E.; Pravdin, P. Smartphone PPG: Signal processing, quality assessment, and impact on HRV parameters. In Proceedings of the 2019 41st Annual International Conference of the IEEE Engineering in Medicine and Biology Society (EMBC), Berlin, Germany, 23–27 July 2019. [Google Scholar] [CrossRef]
- Caizzone, A.; Boukhayma, A.; Enz, C. AC/DC Ratio Enhancement in Photoplethysmography Using a Pinned Photodiode. IEEE Electron Device Lett. 2019, 40, 1828–1831. [Google Scholar] [CrossRef]
- Caizzone, A.; Boukhayma, A.; Enz, C. Comprehensive noise analysis in PPG read-out chains. In Proceedings of the 2017 International Conference on Noise and Fluctuations (ICNF), Vilnius, Lithuania, 20–23 June 2017. [Google Scholar]
- Nara, S.; Kaur, M.; Verma, K.L. Novel Notch Detection Algorithm for Detection of Dicrotic Notch in PPG Signals. Int. J. Comput. Appl. 2014, 86, 36–39. [Google Scholar] [CrossRef]
- Serra, C.; Sestu, A.; Murru, V.; Greco, G.; Vacca, M.; Scuteri, A. Diabetes Affects the Relationship between Heart Rate Variability and Arterial Stiffness in a Gender-Specific Manner. J. Clin. Med. 2022, 11, 4937. [Google Scholar] [CrossRef] [PubMed]
- ChuDuc, H.; NguyenPhan, K.; NguyenViet, D. A Review of Heart Rate Variability and its Applications. APCBEE Procedia 2013, 7, 80–85. [Google Scholar] [CrossRef] [Green Version]
- Benichou, T.; Pereira, B.; Mermillod, M.; Tauveron, I.; Pfabigan, D.; Maqdasy, S.; Dutheil, F. Heart rate variability in type 2 diabetes mellitus: A systematic review and meta–analysis. PLoS ONE 2018, 13, e0195166. [Google Scholar] [CrossRef] [PubMed] [Green Version]
- Lu, G.; Yang, F.; Taylor, J.; Stein, J.F. A comparison of photoplethysmography and ECG recording to analyse heart rate variability in healthy subjects. J. Med. Eng. Technol. 2009, 33, 634–641. Available online: https://www.tandfonline.com/doi/full/10.3109/03091900903150998?scroll=top&needAccess=true (accessed on 1 February 2023). [CrossRef]
- Selvaraj, N.; Jaryal, A.; Santhosh, J.; Deepak, K.K.; Anand, S. Assessment of heart rate variability derived from finger-tip photoplethysmography as compared to electrocardiography. J. Med Eng. Technol. 2008, 32, 479–484. [Google Scholar] [CrossRef]
- Rothberg, L.; Lees, T.; Clifton-Bligh, R.; Lal, S. Association Between Heart Rate Variability Measures and Blood Glucose Levels: Implications for Noninvasive Glucose Monitoring for Diabetes. Diabetes Technol. Ther. 2016, 18, 366–376. [Google Scholar] [CrossRef]
- Alian, A.A.; Shelley, K.H. Photoplethysmography. Best Pr. Res. Clin. Anaesthesiol. 2014, 28, 395–406. [Google Scholar] [CrossRef]
- Vahlsing, T.; Delbeck, S.; Leonhardt, S.; Heise, H.M. Noninvasive Monitoring of Blood Glucose Using Color-Coded Photoplethysmographic Images of the Illuminated Fingertip Within the Visible and Near-Infrared Range: Opportunities and Questions. J. Diabetes Sci. Technol. 2018, 12, 1169–1177. [Google Scholar] [CrossRef] [Green Version]
- Chellappan, K.; Sahathevan, R. Accelerated Aging and Noninvasive Cardiovascular Risk Monitoring. Cerebrovasc. Dis. 2015, 40, 25–27. [Google Scholar]
- Spigulis, J.; Kukulis, I.; Fridenberga, E.; Venckus, G. Potential of advanced photoplethysmography sensing for non-invasive vascular diagnostics and early screening. In The International Society for Optical Engineering; Society of Photo-Optical Instrumentation Engineers (SPIE) Press: San Jose, CA, USA, 2002; Volume 4862, pp. 38–43. [Google Scholar] [CrossRef]
- Hettiarachchi, C.; Chitraranjan, C. A Machine Learning Approach to Predict Diabetes Using Short Recorded Photoplethysmography and Physiological Characteristics. In Proceedings of the 17th Conference on Artificial Intelligence in Medicine, Poznan, Poland, 26–29 June 2019; Science, S.C., Ed.; Elsevier: Amsterdam, The Netherlands, 2019; pp. 322–327. [Google Scholar] [CrossRef]
- Qawqzeh, Y.K.; Bajahzar, A.S.; Jemmali, M.; Otoom, M.M.; Thaljaoui, A. Classification of Diabetes Using Photoplethysmogram (PPG) Waveform Analysis: Logistic Regression Modeling. BioMed Res. Int. 2020, 3764653. [Google Scholar] [CrossRef] [PubMed]
- Hossain, S.; Debnath, B.; Biswas, S.; Al-Hossain, M.J.; Anika, A.; Navid, S.K.Z. Estimation of Blood Glucose from PPG Signal Using Convolutional Neural Network. In Proceedings of the 2019 IEEE International Conference on Biomedical Engineering, Computer and Information Technology for Health, Qingdao, China, 28–30 November 2019. [Google Scholar] [CrossRef]
- Deng, H.; Zhang, L.; Mo, Y.X.S. Research on Estimation of Blood Glucose Based on PPG and Deep Neural Networks. In Proceedings of the 8th Annual International Conference on Geo-Spatial Knowledge and Intelligence, Xi’an, China, 18–19 December 2020. [Google Scholar] [CrossRef]
- Liang, Y.; Chen, Z.; Liu, G.; Elgendi, M. A new, short-recorded photoplethysmogram dataset for blood pressure monitoring in China. Sci. Data 2018, 5, 180020. [Google Scholar] [CrossRef] [PubMed] [Green Version]
- Liang, Y.; Liu, G.; Chen, Z.; Elgendi, M. PPG-BP Database. Figshare. Dataset. Available online: https://figshare.com/articles/dataset/PPG-BP_Database_zip/5459299/5 (accessed on 5 May 2022).
- Elgendi, M. Optimal Signal Quality Index for Photoplethysmogram Signals. Bioengineering 2016, 3, 21. [Google Scholar] [CrossRef] [Green Version]
- Stanković, L.; Djurović, I.; Stanković, S.; Simeunović, M.; Djukanović, S.; Daković, M. Instantaneous frequency in time–frequency analysis: Enhanced concepts and performance of estimation algorithms. Digit. Signal Process. 2014, 35, 1–13. [Google Scholar] [CrossRef]
- Romulus, R. A Comparison Between Instantaneous frequency Estimation Methods of Frequency Modulated Signals Covered with Gaussian Noise. In Proceedings of the 2012 10th International Symposium on Electronics and Telecommunications, Timisoara, Romania, 15–16 November 2012. [Google Scholar] [CrossRef]
- Karimipour, H.; Shandiz, H.T.; Zahedi, E. Diabetic diagnose test based on PPG signal and identification system. J. Biomed. Sci. Eng. 2009, 2, 465–469. [Google Scholar] [CrossRef] [Green Version]
- Moreno, E.M.; Luján, M.J.A.; Rusiñol, M.T.; Fernández, P.J.; Manrique, P.N.; Triviño, C.A.; Miquel, M.P.; Rodríguez, M.A.; Burguillos, M.J.G. Type 2 Diabetes Screening Test by Means of a Pulse Oximeter. IEEE Trans. Biomed. Eng. 2016, 64, 341–351. [Google Scholar] [CrossRef] [Green Version]
- Zhang, Y.; Zhang, Y.; Siddiqui, S.; Kos, A. Non-invasive blood-glucose estimation using smartphone PPG signals and subspace kNN classifier. Elektrotehniski Vestn. 2019, 86, 68–74. [Google Scholar]


| Technology | Wavelength | Measurement Sites | Strengths | Weaknesses |
|---|---|---|---|---|
| Near Infrared Spectroscopy | 750–2500 nm | Tongue, cheek, lip mucosa, forearm, ear lobe, and oral mucosa | Affordable, simple to implement | Humidity, pressure, temperature, the distribution of glucose impact accuracy, and other chemical substances interfere |
| Mid Infrared Spectroscopy | 2500–10,000nm | Finger, skin, and oral mucosa | Very accurate, light, and low scattering | Inadequate skin penetration ability, and water absorption |
| Far Infrared Spectroscopy | 30 µm to 3 mm | Interstitial fluid (ISF) | Daily individual calibration is not required; the scattering is lower when compared to near infrared and mid infrared | It is not easy to differentiate between molecules other than water due to the strong absorption of water |
| Fluorescence | Ultraviolet light, visible light | Tears and human skin | High sensitivity and specificity to the presence of glucose and light scattering have no impact. | Sensitive to changes in oxygen and pH and prone to toxicity issues |
| Photoacoustic Spectroscopy | Ultraviolet light, NIR, and MIR | Aqueous humor, the forearm, and the finger | Unaffected by dispersed particles and resistant to water distortion | Low signal-to-noise ratio and affected by pulsation, acoustic noise, temperature fluctuations, and motion |
| Photoplethysmography | 750–1500 nm | Ear lobe, toe, finger, and forehead | Simple, inexpensive sensor, and can be integrated with wearable devices and smartphone cameras | Unstable with movement and the characteristics of the resulting waves are affected by the conditions of blood circulation |
| Classification Model | Accuracy (%) | Estimation Speed (Observations/s) | Exercise Time (s) |
|---|---|---|---|
| Weighted KNN | 85.7 | 110.41 | |
| Super Vector Machine | 85.2 | 53.18 | |
| Linear Discriminant | 84.1 | 21.53 |
| Trial | TP (%) | FP (%) | TN (%) | FN (%) | Accuracy (%) | Sensitivity (%) | Specificity (%) | Recall (%) | Precision (%) | F1 Score (%) |
|---|---|---|---|---|---|---|---|---|---|---|
| Normal | 100 | 0 | 73.9 | 26.1 | 86.96 | 79.31 | 100.00 | 79.31 | 100.00 | 88.46 |
| Diabetes | 73.9 | 26.1 | 100 | 0 | 86.96 | 100.00 | 79.31 | 100.00 | 73.90 | 84.99 |
| Classification Model | Accuracy (%) | Estimation Speed (Observations/s) | Exercise Time (s) |
|---|---|---|---|
| Super Vector Machine | 89.0 | 1.67 | |
| Naive Bayes | 86.8 | 26.94 | |
| Ensemble Subspace KKN | 82.4 | 26.66 |
| Trial | TP (%) | FP (%) | TN (%) | FN (%) | Accuracy (%) | Sensitivity (%) | Specificity (%) | Recall (%) | Precision (%) | F1 Score (%) |
|---|---|---|---|---|---|---|---|---|---|---|
| Normal | 100 | 0 | 78.3 | 21.7 | 89.15 | 82.17 | 100.00 | 82.17 | 100.00 | 90.21 |
| Diabetes | 78.3 | 21.7 | 100 | 0 | 89.15 | 100.00 | 82..17 | 100.00 | 78.30 | 89.33 |
| Classification Model | Accuracy (%) | Estimation Speed (Observations/s) | Exercise Time (s) |
|---|---|---|---|
| Super Vector Machine | 91.3 | 9.25 | |
| Naive Bayes | 86.8 | 31.22 | |
| KKN | 85.2 | 9.98 |
| Trial | TP (%) | FP (%) | TN (%) | FN (%) | Accuracy (%) | Sensitivity (%) | Specificity (%) | Recall (%) | Precision (%) | F1 Score (%) |
|---|---|---|---|---|---|---|---|---|---|---|
| Normal | 100 | 0 | 82.6 | 17.4 | 91.30 | 85.17 | 100.00 | 85.17 | 100.00 | 91.99 |
| Diabetes | 82.6 | 17.4 | 100 | 0 | 91.30 | 100.00 | 85.17 | 100.00 | 82.60 | 90.47 |
| Data Input | Classification Model | Accuracy (%) | F1 Score (%) | Feature Points | Exercise Time (s) |
|---|---|---|---|---|---|
| Original PPG | Weighted KNN | 86.96 | 88.46 | 2100 | 110 |
| Instantaneous Frequency PPG | Super Vector Machine | 89.15 | 90.21 | 63 | 1.67 |
| Spectral Entropy PPG | Super Vector Machine | 91.30 | 91.99 | 63 | 9.25 |
| Year | PPG Signal | Invasive Methods | Classifier | Features Extraction | Evaluation Metric | Characteristic |
|---|---|---|---|---|---|---|
| 2009 | Finger sensor, H. Karimipour et al. [45] | Not mentioned | Auto-Regressive Moving Average (ARMA) | 24,750 | Sensitivity = 100% | Classification |
| 2017 | Pulse Oximeter, E. M. Moreno et al. [46] | HbA1c Test | Random Forest | 9 | ROC = 0.7 | Classification |
| Gradient Boosting | 9 | ROC = 0.7 | Classification | |||
| Linear Discriminant Analysis | 9 | ROC = 0.6 | Classification | |||
| 2019 | Smartphone Camera, Y. Zhang et al. [47] | Glucose meter | Subspace KNN | 67 | Accuracy = 86.2%. | Classification |
| RUS Boasted Trees | 67 | Accuracy = 85.0% | Classification | |||
| Bagged Trees | 67 | Accuracy = 86.0% | Classification | |||
| Decision Trees | 67 | Accuracy = 80.1% | Classification | |||
| 2020 | Smartphone, G. Zhang et al. [21] | Glucose meter | Gaussian Super Vector Machine (GSVM) | 28 | Accuracy = 81.5% | Classification |
| Bagged Trees | 28 | Accuracy = 74.0% | Classification | |||
| K-Nearest Neighbor | 28 | Accuracy = 71.0% | Classification | |||
| 2022 | Finger sensor | Glucose meter | Weighted KNN | 2100 | Accuracy = 86.96% | Classification |
| Super Vector Machine(Proposed method in this study) | 63 | Accuracy = 91.3% | Classification |
Disclaimer/Publisher’s Note: The statements, opinions and data contained in all publications are solely those of the individual author(s) and contributor(s) and not of MDPI and/or the editor(s). MDPI and/or the editor(s) disclaim responsibility for any injury to people or property resulting from any ideas, methods, instructions or products referred to in the content. |
© 2023 by the authors. Licensee MDPI, Basel, Switzerland. This article is an open access article distributed under the terms and conditions of the Creative Commons Attribution (CC BY) license (https://creativecommons.org/licenses/by/4.0/).
Share and Cite
Susana, E.; Ramli, K.; Purnamasari, P.D.; Apriantoro, N.H. Non-Invasive Classification of Blood Glucose Level Based on Photoplethysmography Using Time–Frequency Analysis. Information 2023, 14, 145. https://doi.org/10.3390/info14030145
Susana E, Ramli K, Purnamasari PD, Apriantoro NH. Non-Invasive Classification of Blood Glucose Level Based on Photoplethysmography Using Time–Frequency Analysis. Information. 2023; 14(3):145. https://doi.org/10.3390/info14030145
Chicago/Turabian StyleSusana, Ernia, Kalamullah Ramli, Prima Dewi Purnamasari, and Nursama Heru Apriantoro. 2023. "Non-Invasive Classification of Blood Glucose Level Based on Photoplethysmography Using Time–Frequency Analysis" Information 14, no. 3: 145. https://doi.org/10.3390/info14030145