Article

Proposal for the Analysis of the State of Learning in University Students with the Inclusion of ICT in the Classroom

by
William Villegas-Ch.
1,*,
Joselin García-Ortiz
2 and
Santiago Sanchez-Viteri
2
1
Escuela de Ingeniería en Tecnologías de la Información, FICA, Universidad de Las Américas, Quito 170125, Ecuador
2
Departamento de Sistemas, Universidad Internacional del Ecuador, Quito 170411, Ecuador
*
Author to whom correspondence should be addressed.
Information 2022, 13(8), 391; https://doi.org/10.3390/info13080391
Submission received: 24 June 2022 / Accepted: 12 August 2022 / Published: 17 August 2022
(This article belongs to the Special Issue Information Technologies in Education, Research and Innovation)

Abstract

:
The inclusion of information and communication technologies in education has become a priority for all universities. To meet this need, there are several research works that have dealt with the subject for several decades. However, for its inclusion, the analysis of each institution is necessary since the needs of the university population and the resources for its application change according to each situation. This work seeks to create a method that allows establishing the needs and doubts of students about the use of educational technologies in the classroom without affecting their performance. For this, a process has been designed that identifies learning needs, through the validation of data obtained from surveys and the monitoring of the academic efficiency and learning of a cohort of students. The follow-up includes a period of four years from 2019 to 2022. This follow-up allowed establishing three different realities, in 2019 the academic data was analyzed in a face-to-face education model, from 2020 to 2021 the follow-up was included in a remote model with the use of technologies as a communication channel and in 2022 these were included as a learning component, which marked an in-depth analysis of student performance and how technology affected their learning.

1. Introduction

Currently, universities have seen the need to update their educational models and offer the population a student-centered education. This update is mainly due to the experiences left by the pandemic caused by the Coronavirus disease 2019 (COVID 19) [1]. During the pandemic, the different governments established long quarantines and isolation to avoid a higher rate of contagion [2,3]. Therefore, during isolation, universities adopted information and communication technologies (ICT) as a channel to continue their academic activities [4]. Even though universities have presented a high percentage of integration with ICT since before the pandemic, this has not been enough to guarantee learning with its application in the classroom. The best example is online education, having academic models with a high index in the use of ICT, since they base their development on methods and techniques based on ICT to generate knowledge. However, this educational model is among those with a higher percentage of student dropout [5,6].
Based on these experiences, universities consider the use of ICT in an integral way throughout the academic process, which includes a commitment from the technological, administrative, academic, and student areas for its proper functioning. Several reviewed works consider that the integration of ICT in the classroom should generate an enriching experience for students where learning is guaranteed with the use of techniques and tools aligned to the new challenges of society. These works identify the variables that affect learning and limit its proper development in certain sectors of society [7,8]. At the university level, they establish that the new needs of students are not contemplated in a traditional study model, where learning focuses on the teacher and it is he or she who establishes the learning method, what to learn and how the students should do it.
To identify the needs of students, a group of works has focused on data collection through surveys related to factors such as the academic environment, the economy, the psychological environment, etc. These works seek to obtain the greatest amount of information from the students and subject the data to analysis which allows them to establish which are the factors that have the most incidence in the development of learning [9]. Generally, in these works the identification of the degree of incidence of the factors is carried out by applying statistical models, such as factor analysis. Factor analysis, even though it is a basic statistical model, is widely used due to its effectiveness and the amount of information it generates in a survey. One of its main characteristics is that by means of the Kaiser, Meyer, and Olkin (KMO) calculations and Bartlett’s sphericity test, it is possible to identify if the factorial model is adequate and define the validity of the survey to respond to the phenomenon of study [10]. In addition, in the reduction of dimensions it is possible to identify the degree of incidence of each question in the discovery of the feelings of the surveyed population [11].
Another group of works focuses on discovering the needs of the students through the analysis of data on the students’ qualifications. To do so, they make use of business intelligence (BI) architectures with the application of data mining algorithms or Big data architectures [12]. Among the main advantages of the application of these architectures is that they can identify patterns in the data and generate knowledge about them [13,14]. In addition, these architectures can extract data from a wide variety of sources and manage large volumes of data. By identifying existing patterns in the data, these can be classified to determine the state of student learning and the impact that each academic activity has on their performance. Data analysis architectures are more robust and can solve various problems of an institution. However, for their applications, it is necessary to have greater economic, technological, and technical resources.
The reviewed works seek to resolve the identification of needs quickly, in such a way that their results contribute to decision-making effectively and efficiently. The methods developed in these works allow identification of the current needs of the students [15,16]. In addition, it is important to consider that after the pandemic and isolation the needs of students have changed. A common example of this is that the pandemic critically affected the economy of several households, which has affected the continuity of the studies of several people or limited the resources available for their learning. Another important factor to establish is the existing motivation by students to use ICT in education [17]. By having this information, universities can establish models of active education, where ICT is considered in the classroom to improve student learning in an interactive environment with technologies [18].
This work took as a source the methods used in the revised works and proposes a data analysis architecture that allow identification of the new needs of students after the pandemic, and, for which purposes, we worked with instruments such as surveys that allowed us to establish the problems and concerns of students in the use of ICT in the classroom [19]. With this information, a data extraction process was applied from the academic sources of the students to later be processed and analyzed through data mining algorithm techniques. The main objective of the analysis was the data of the activities developed in the first quarter of the period 2019 to 2022. These data corresponded to students of a private University in Ecuador and referred to the first part of an educational model where ICTs were applied in the classroom. The results allow the gradual integration of ICT in all university careers and facets and transform its traditional educational model into a model that is aligned with active learning.

2. Materials and Methods

The proposed method for the analysis of academic data was composed of several stages to create a scalable process that allowed constant evaluation and feedback. In Figure 1, the flowchart that follows the proposed method is presented. This consisted of two phases: the first was responsible for the evaluation of the validity of surveys and the second phase was responsible for the analysis of educational data that allowed identification of the level of learning in each group of students.

2.1. Population Identification

The first phase of the method was responsible for the validation of surveys. The use of these instruments aimed to determine what the feeling of the students was regarding the use of ICT in the classroom [20]. To meet this requirement, it was necessary to comply with an initial step, which focused on identifying the study population. The identification of the population in a survey is very important to determine the statistical reasoning group. The method used to select respondents is known as sampling, where specific groups are identified to draw conclusions and make decisions based on their results.
For this work, it was considered necessary to select a study population that was truly representative of the entire population [21]. The target population had to be identified and agreed upon by the areas involved in academic and technological pursuits, since, by integrating their knowledge about the students, it was possible to guarantee the results and largely eliminate any feedback that was considered useless for the study. Defining the most significant population made it possible to build a real image of the target sector using the trends of the results. To determine the most significant population, equation 1 was used:
n = N Z 2 p q e 2 ( N 1 ) + Z 2 p q
where:
  • N = Population size
  • Z = Confidence level (statistical parameter)
  • p = Percentage of the population that had the desired attribute
  • q = Percentage of the population that did not have the desired attribute
  • e = Maximum accepted estimation error

2.2. Survey Preparation

According to the conceptualization of surveys, they are useful to know the attitudes, values, motivations, predispositions, and possible behaviors of many people. Therefore, the instrument is fully valid for the acquisition of data from the most significant population, where the objective is to identify the attitude and predisposition of students towards the use of ICT in the classroom. Once the objective of the survey has been established and with the identification of the sample, its design is passed [22]. To create the structure of the survey, it is important to select the questions to be asked considering the information that you want to obtain. In addition, the information provided on the survey is important, so, therefore, the objective of the research should be included in an initial section.
The next section should include general questions to elicit information from the respondent. This information is important to segment the groups and create a database that allows identifying the population to generate follow-ups and projections of each student group. Generally, the respondents’ information is expected to contain their name, age, marital status, educational level, socioeconomic level, etc. This information may vary depending on the purpose of the study or the data available at the university [23,24] the section of questions, these can be open or closed. Open questions give the respondent the option to answer in their own words. In closed questions, the respondent must choose between some of the established answer options. Closed questions have the advantage of being quickly collected and analyzed compared to open questions. Due to its nature, closed questions were used in this work, even in the answer options numerical values were assigned for data analysis. For example, the type of questions that were included in the survey are presented below. In the answers, the values that these represent for the analysis are placed in parentheses. All the questions presented five response options.
  • How often do you use information technology in your education?
    • Never (1), A few times a day (2), A few times a week (3), Often (4), Every day (5)
  • Which of the following activities do you enjoy the most with information technology?
    • Entertainment (1), Social media (2), Browsing (3), Education (4), Research (5)

2.3. Data Acquisition

The acquisition of data depends on the tools used for the survey. In several studies this collection is done by physical means, which includes there being a digitization process [25]. In this work, the survey was carried out using technological resources and an online tool, for example, Google Forms or the institution’s own tools. Surveys could be included in the learning management system (LMS), which improves data collection and allows surveys to be targeted to target groups.
The extraction of the collected data depends on the tool used, which will generally be found in .xlms or .csv files. If the survey is developed as part of the LMS, the data is accessed from the database, or the download option must be found in the files. To obtain adequate data quality, it is necessary that all questions require a mandatory answer [20]. Configuring the survey in this way does not allow responses to be skipped, which means it is not necessary to create an extensive cleanup and transformation phase. Table 1 presents an example of the type of data obtained from the survey.

2.4. Survey Analysis Process

The data analysis phase seeks to evaluate the effectiveness of the survey, for which it is necessary to analyze the incidence of each variable in the study phenomenon. The proposed method uses factor analysis for survey validation. This widely used statistical analysis identifies the underlying variables or factors that explain the correlation configuration in a set of observed variables. Factor analysis has as its primary objective to analyze the correlation between a series of variables to discover structures that are not directly observable. The analysis seeks a reduction of the information provided by “p” observed variables with the least loss of information possible.
As main components of the factorial analysis to determine the validity of the survey, we used the correlation matrix. This matrix presents the Pearson correlation values that measure the degree of linear relationship between each pair of variables. Correlation values can be between -1 and +1. However, in practice, the items usually have positive correlations. If the two elements tend to increase or decrease at the same time, the correlation value is positive. In the interpretation of the correlation matrix, the strength and direction of the relationship between two elements or variables is evaluated [26]. A high and positive correlation value indicates that the items measure the same skill or characteristic. Table 2 presents an example of the correlation matrix, where all the elements are highly correlated with each other. Item 1 and Item 2 have a positive linear correlation of 0.903. Item 1 and Item 3 have a positive linear correlation of 0.867, while Item 2 and Item 3 have a positive linear correlation of 0.864. Therefore, these items appear to measure the same characteristic.
To assess the goodness of fit or adequacy of the data analyzed to a factorial model, two statistics are necessary, namely, the KMO sample adequacy measure and the Bartlett sphericity test. The KMO is an index that compares the magnitude of the observed correlation coefficients with the magnitude of the partial correlation coefficients. Bartlett’s sphericity test tests the null hypothesis that the observed correlation matrix is an identity matrix. If the data comes from a multivariate normal distribution, the Bartlett statistic is approximately distributed according to the chi-square probability model and is a transformation of the determinant of the correlation matrix. If the critical level (Sig.) is greater than 0.05, the null hypothesis of sphericity cannot be rejected and, consequently, it is not possible to ensure that the factorial model is adequate to explain the data. Table 3 presents an example of the values of KMO and Bartlett’s test. KMO establishes the ranges of the coefficients as a significant set, where it is found that, the closer to 1 the value obtained from the KMO test is implies that the relationship between the variables is high. If KMO ≥ 0.9, the test is very good; notable for KMO ≥ 0.8; the median for KMO ≥ 0.7; low for KMO ≥ 0.6; and very low for KMO < 0.5.
The next component is the total calculation of the explained variance. Table 4 presents an example with values to detail its interpretation. In the analysis of the total percentage of explained variance, it is expected that the minimum accumulated total of the survey explains at least 50% of the phenomenon in some of the components [27]. The example meets this condition, since the variables included in the analysis explain the phenomenon in two components, and the accumulated percentage reaches 56,450%. Therefore, with the results obtained, it is decisive that the instrument can explain the phenomenon.
With the results obtained from the analysis, it is possible to determine if the survey responds to the phenomenon under study. If the value of the total calculation of the explained variance is less than 50%, the process performs feedback and goes back to the survey preparation phase. At this stage, the incidence values of the instrument must be identified, and the questions must be reconsidered to be more objective and clarify the answers without any ambiguity. In the opposite case, if the survey can explain the phenomenon under study, the process goes to the next stage.

2.5. Academic Data Analysis

The analysis of academic data has two important factors to consider, the first is the sources that are included in the analysis and the second factor is the type of analysis to be carried out [28]. Data sources can vary and depend on how the information is structured within the organization. For example, several institutions have academic and financial systems, and, in addition to these sources, the analysis can consider the educational platforms available to the university [29,30]. As platforms, the use of LMS stands out, as well as external platforms that can be serious games, interactive rewards applications, etc.
The proposed method, due to the nature of the data and the type of sources, focused on extracting data from the LMS. The LMS available to the institution participating in this study centralized the data, which allowed managing a single repository. Once the source and the data were acquired, the type of analysis applied to the data was defined [31]. The type of analysis depends on the information that is required, in robust infrastructures that use analysis models, such as BI or Big data, a new instance must be created that covers the analysis of academic data. The use of these architectures is conditioned by the volume of data to be analyzed. With this consideration, the use of Big data architecture was not adequate since it is not common for universities to have such large volumes of data that they require the use of Big data [32]. The opposite occurs with a BI. This architecture is adaptable to the needs of educational institutions and several of them already have this type of architecture. If this is the case, it is necessary to create a new flow for uploading data to a new Data mart. The advantage of using a multidimensional basis is the use of online analytical processing (OLAP) tools. By generating OLAP cubes it is possible to obtain information about the object of study in a fast and simplified way [33].
In addition to these possibilities, there is another smaller scenario, where the application of techniques such as data mining is applied directly to the data. These scenarios are common when required to respond to a phenomenon that is not redundant. For example, if the analysis requires identifying the use of ICT in the use of a procurement process, this is done on a single occasion. In this case, it was not recommended to use a BI or Big data process, since its implementation requires a lot of resources and since it is not a repetitive process, and the costs do not represent the benefits to be obtained. In this case, it was necessary to propose a personalized model that met the needs of the phenomenon and that guarantees the results. This process could be carried out by means of educational data mining (MDE) techniques and algorithms. The MDE explores the academic databases and improves the segmentation of the student population according to the patterns that they present in their academic performance. By analyzing the relationships between parameters, such as age, gender, qualifications, etc., it is possible to guess their behavior and generate personalized educational plans that reduce problems, such as desertion and poor academic quality.

2.6. Academic Data Analysis Process and Presentation of the Information

In the analysis process phase, the data obtained from the record of qualifications stored in the available academic sources is included, which depends on each university. In general, it is advisable to take the data from the LMSs that have their own grade books. By using this data source, it is possible to identify the performance of the students for each activity, and, in addition, it is necessary to include the data corresponding to the assessment of learning [34,35]. Generally, this assessment corresponds to integrative activities and does not require a numerical rating. This means that the integrative activity can include categories such as insufficient, fair, good, and very good. When creating the categories, students must develop the activity considering several criteria that correspond to a rubric. For example, a rubric can include criteria such as innovation, approaches, methodologies, problem solving, etc. The data obtained in learning are contrasted with factors such as academic efficiency, this being the factor that is considered for the approval of a partial or a course that the student takes [36]. Academic effectiveness does not necessarily mean that the student learned a subject. On the contrary, other factors may be involved that require a more granular analysis. if the questions raised are not addressed with data analysis the process returns to the database stage to integrate new sources until they answer the research questions, generating a feedback loop. For the presentation of the information, the use of tools such as Power BI, Tableau, Excel, etc. is considered. With the use of these tools, it is possible to transmit the knowledge acquired in the data analysis graphically. Control boards, dashboards and pivot tables allow information to be presented clearly and concisely for effective decision-making.

3. Results

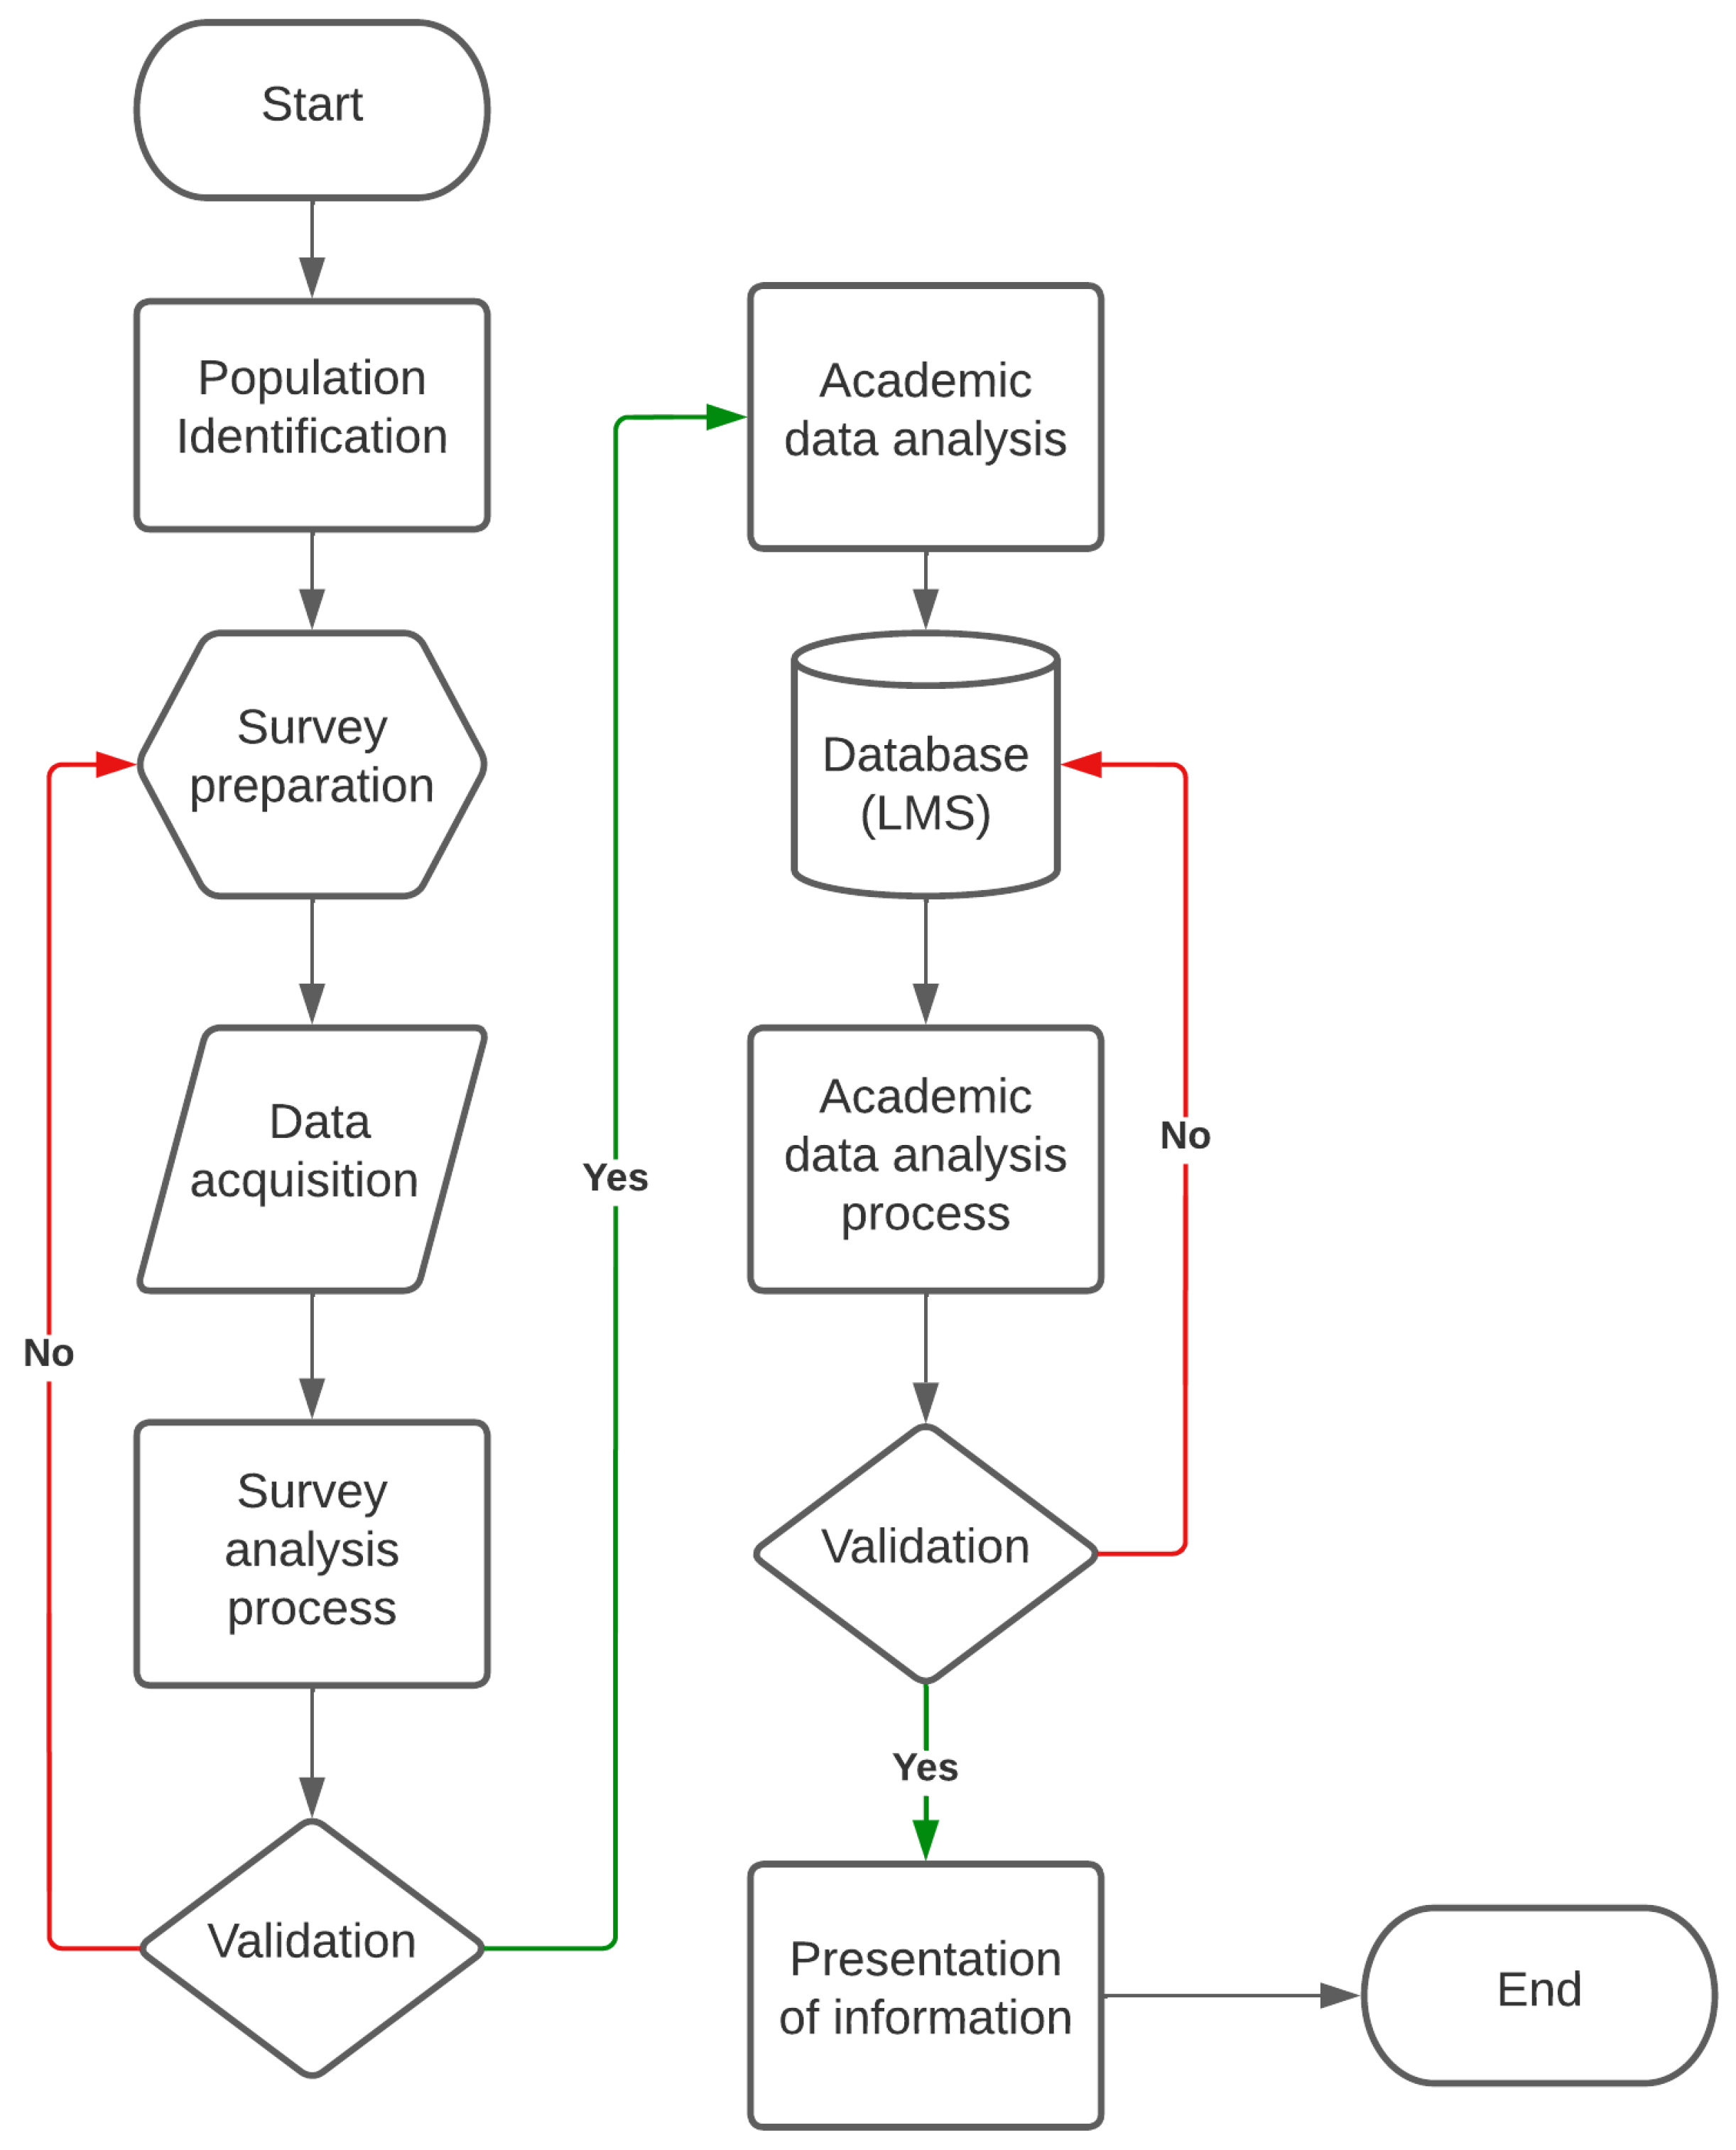
For the presentation of results, the method was applied in a case study to determine the feeling of the students regarding the use of ICT in their learning environment. To do so, a survey was designed, and the results were analyzed to determine the validity of the instrument and the incidence value of each question in relation to the study phenomenon. The results obtained on the experience and use of technological resources identified the acceptance and motivation present in the students before the migration from a traditional educational model to an educational model integrated by ICT. In the second stage of the case study, the analysis of the educational data of a faculty that had integrated ICT as a main component in learning was conducted and the results reflected as part of an educational model aligned to active learning was carried out.

3.1. Population Identification

The population was defined by the university that participated in this study; this university is part of higher education in Ecuador. The university is private, which means that the financing is entirely its own and does not depend on the state. In universities with their own financing, they have the advantage that the application of projects and studies, such as the one developed, do not go through extremely bureaucratic processes, which facilitates their execution. The segmentation of the population considered the total university population of 9400 students and 1500 people teachers and administrative staff. This total population was divided into five faculties, which consisted of several careers offered in person to students. Most careers are made up of eight academic terms, each lasting 16 weeks. The university had considered updating its educational model and methods to include ICT in an environment aligned with active learning. For this reason, a prototype plan had been implemented where a faculty participated with all its careers. The faculty was from the area of administrative sciences and consisted of 5 careers where the number of students was 2800 students, which represented 30% of the total population. This faculty, like the entire university in the pandemic, was forced to continue its academic activities remotely. Therefore, the students had already had some experience in using platforms such as LMS, video conferencing, etc.
For the first stage of the analysis, where the identification of students’ feelings towards ICT in education was proposed, the entire population was considered. However, to validate the survey, there needed to be a minimum number of responses. To determine the minimum number of answers, the calculation of the most representative population with equation 1 exposed in the method was used. The values to work with were:
  • N: 2800
  • Z: 1.960
  • P: 50.00%
  • Q: 50.00%
  • E: 3.00%
As a result, the sample size was 772.85, and, therefore, the minimum number of respondents was 773 students. With this value, the survey could be considered valid, and the results obtained would represent the sentiments of the total population.

3.2. Survey Preparation

For the preparation of the survey, the researchers generally aligned all the questions with a dimension or study variable. For example, if you want to capture people’s trends in the use of public transport, the questions must be objectively and clearly aligned to this topic. There are surveys that seek to solve two dimensions, for example, the use of public transport and citizen security. These surveys must be carried out very precisely, since, when developing the questions, they lose objectivity or can confuse the respondents by generating false information. For the development of this case, we worked with a single dimension, which was the use of ICT in education and the questions that were presented to the students were based on this. The guideline to be followed in the design was that a maximum of ten multiple-choice questions be on the topic and a maximum of three general questions provided basic information about the respondent.
Next, three general questions were presented for the identification of the population. These questions could contain answer types Yes/No or multiple choice:
Gender
  • Man/Woman
Career
  • Business Administration; Agribusiness; Economy; Business intelligence management; Marketing
Age
  • Less than 20; 20-25]; 25-30; 30-35; over 35
For the acquisition of information of the study dimension, the following questions were presented:
The Internet has become a tool that allows access to an infinity of information. How often do you use the Internet appropriately for your learning?
  • Never; Any occasion; Once a week; Regularly; Forever
In what percentage do you consider the influence of ICT favorable in your learning?
  • 0%; between 20% and 40%; between 40% and 60%; between 60% and 80%; between 80% and 100%
What is the mastery of skills you have in handling ICT?
  • Null; Superficial; Enough; Okay; Excellent
Do you consider that the use of ICT in class is:
  • It is an alternative that does not necessarily influence learning; It is a fashion given the technological age in which we live; It is an alternative support tool for teaching; It is an important resource to improve teaching; It is a determining factor in student learning.
Indicate which of the following activities you carry out with the information you obtain with the use of ICT?
  • Listen; Understand; Extract information; Contrast information; Check information
Which of the following options do you consider to be a problem with the use of information technology in education?
  • Availability of equipment and materials; Distractions; Motivation; Time optimization; Specialist teachers
Which of the following activities do you enjoy the most with information technology?
  • Entertainment; Communication; Social networks; Education; Research
Which of the following options do you consider to be a problem with the use of information technology in education?
  • Decrease in manual skills; Isolation; Information reliability; Inappropriate content; Exposure of personal data
How effective has the learning been with the education tools?
  • It has not been effective; Slightly effective; Moderately affective; Highly effective
How do you consider doing homework digitally?
  • Very difficult; Hard; Moderate; Easy; Very easy
Once the survey had been designed with the corresponding questions, it was necessary to identify the execution method. Due to the characteristics and infrastructure available in the university that participated in the study, the implementation was carried out directly in the LMS. This enabled only the faculty of administrative sciences. The student entered the LMS, and it generated a validation. If the student took the survey, they were redirected to the main classroom page. If the student did not take the survey, it redirected him or her to the survey to press for answers. The time for the survey to be developed was a period of seven days.

3.3. Data Acquisition

After executing the survey, 2260 surveys were obtained, surpassing the most representative population that, according to the calculation, was established at 773 people. By applying the survey through the LMS, the redundancy of responses from a single user was avoided, which improved the quality of the data obtained. The data obtained from the surveys were text-type answers, just as proposed in its design. The data to be analyzed had to be transformed into numerical values. Table 5 presents a summary of the results obtained. To maintain the format of the document, only 25 records and six columns have been added. The complete sources are available in the journal repository. Similarly, the headings have been replaced by letters that represent the questions, for example, Q1 = Gender; Q2 = race, etc., and the ID column only presents the identifier of the records obtained, it does not refer to data that needs to be analyzed.
Table 6 shows the transformation of the data to be analyzed. The replacement of values was considered maintaining a scale from 1 to 5; these values were configured depending on the degree of importance established in the design. This replacement was done in the order in which the possible answers appeared in the preparation section of the survey. For example, in question two the answer options and their equivalents were:
  • Business Administration                             (1)
  • Agribusiness                                                 (2)
  • Economy                                                    (3)
  • Business intelligence management            (4)
  • Marketing                                                     (5)
This transformation was carried out in all the questions, except in question one (gender). This question did not enter the analysis. However, it was used to determine important information once the validity of the survey was established. In the table, the first 25 records were considered and. due to the format, they include the 13 questions.

3.4. Survey Analysis Process

The validation analysis of the survey was carried out using SPSS, where the reduction of dimensions was applied through the factor. To determine the validity of the survey as an instrument, the analysis focused on the KMO matrix and Bartlett’s test. The results obtained from Table 7 determined that the KMO value was very low. However, the sphericity test indicated that, if Sig. (p-value) < 0.05, we accepted H0 (null hypothesis), and, therefore, factor analysis could be applied.
The following analysis was the one generated in the anti-image matrix of Table 8 that calculated the covariance and correlation to define the relationship between the questions of the survey. When reviewing the diagonals of the covariance, it was expected that the values would be close to 1. In the calculation of the correlation the values of the diagonal must be as close as possible to the resulting KMO, which was 0.5. This condition was met in most of the questions and those that did not reach this value, such as Q4, Q5, Q10 and Q11, were kept under observation in the analysis.
Table 9 shows the total explained variance. According to the results obtained, the survey could respond to the study phenomenon in six components with an accumulated percentage of 58,263%. This result allowed defining that the tool was fully valid, and that the data collected could respond to the phenomenon. Therefore, it was possible to analyze the data to identify the influence of each question in relation to the problem posed.
To identify the degree of influence of each question, the matrix of rotated components was generated. Table 10 presents the results obtained from the analysis, where it was expected that there would be only one dimension, since all the questions evaluated a single phenomenon. The generated matrix was composed of six components or factors, where it was observed that only one had three questions, (Q7, Q12 and Q13). For a factor to be given as valid, it had to influence at least three questions, so, in this case, we had other dimensions that did not meet this condition. To improve the existing relationship, the questions that uniquely fed the different factors could be separated.
In Table 11, the results are presented separating five questions. These were Q2, Q4, Q8, Q10 and Q13. When separating them from the analysis, two factors with greater incidence were obtained, where the questions that had the greatest influence re:
Factor 1 = ICT in the classroom
Q7: Do you consider that the use of ICT in class is:
Q9: Which of the following options do you consider to be a problem with the use of information technology in education?
Q11: Which of the following options do you consider to be a problem with the use of information technologies in education?
Q12: How effective has the learning been with the education tools?
Factor 2 = skills in the use of ICT
Q3: Age
Q5: In what percentage do you consider that the influence of ICT is favorable in your learning?
Q6: What is the domain of skills you have in handling ICT
The questions that have been separated from the analysis have less influence according to the feelings of the students, therefore, these questions should focus on defining a specific factor, such as, for example, development of activities with ICT. Factor analysis allows these relationships to be established and the questions of each survey to be improved to determine the needs of the target population.
For this work, the survey was considered adequate as an instrument for data acquisition and the raw results could be presented and related in each sector identified in the survey. For example, the survey was undertaken by 2260 students, of which 953 people were men and there were 1307 women. Table 12 shows the breakdown of students by major and by gender. In addition, the age ranges of the students are included. These data correspond to the general questions and in this way, it was possible to establish what the feeling of the students regarding the integration of ICT in their education was.
The advantage of the survey results is that they can be presented by question and segmented by age or gender, and everything depends on the objective outlined in the study. The information that was considered relevant in this work corresponded to the questions identified with the greatest influence in the study. With this review, Table 13 presents the results of question 12. The results were not as expected, considering that in 2020 and 2021 ICT was used as a channel to continue education. Therefore, the expected results focused on greater acceptance in the use of ICT. However, if the answers were slightly or moderately then it had not been effective. 929 respondents did not yet accept ICT in education. These results will be contrasted with the analysis of academic data in the following sections.
Q12 = How effective has learning been with ICT in education?

3.5. Academic Data Analysis

For the analysis of academic data, the data generated from the students of the 2019 cohort was taken. This segmentation aimed to establish a stage where the students did not use ICT and focused on a purely traditional model, and this period was 2019. The second cut of data had, as a reference, the use of ICT during the pandemic (2020–2021) and finally the data for the period 2022 was added. In this period the university that participated in this study used ICT with an active learning perspective. In all the periods the data corresponding to the first partial were selected. The university manages the academic period in two partials, each one composed of seven weeks, plus one of evaluation. During the seven weeks, students must develop one activity in class and one autonomously per session; that is, there are 14 activities evaluated, a cumulative evaluation and an integrative work. The integrative work aims to measure the level of learning, this activity is not evaluated through a traditional qualification. This is evaluated by means of indicators, insufficient, regular, good, and very good, even when the teacher adds a grade out of 10, this, to the academic system, is transformed into the criteria. The integrative activity does not influence the passing grade of the course, it focuses on identifying learning.
The axis evaluated belongs to complementary subjects, for example, office automation, databases, digital tools, etc. In the 2019 cohort, 75 students entered, the follow-up was carried out in the first period of each year, and, therefore, there were 56 activities evaluated by each student corresponding to the periods 2019–2022 and four integrating projects. The activities were evaluated on 10 points. The minimum grade for approval was 6/10 and this was the reference with which the data was analyzed. In addition, the weights of the activities in the corresponding partial had the following distribution:
  • Class activities = 25%
  • Autonomous activities = 35%
  • Evaluation = 40%
  • Integrative project = 0%
With the exposed weights, the average is calculated that allows establishing the approval of a course and the integrating project measures the level of learning with which it passes to the next level.

3.6. Information Analysis and Presentation Process

The analysis process seeks to identify the learning level of each group of students. To do so, the average of the activities in the classroom, the average of the activities at home, the partial evaluation, etc. are considered. 
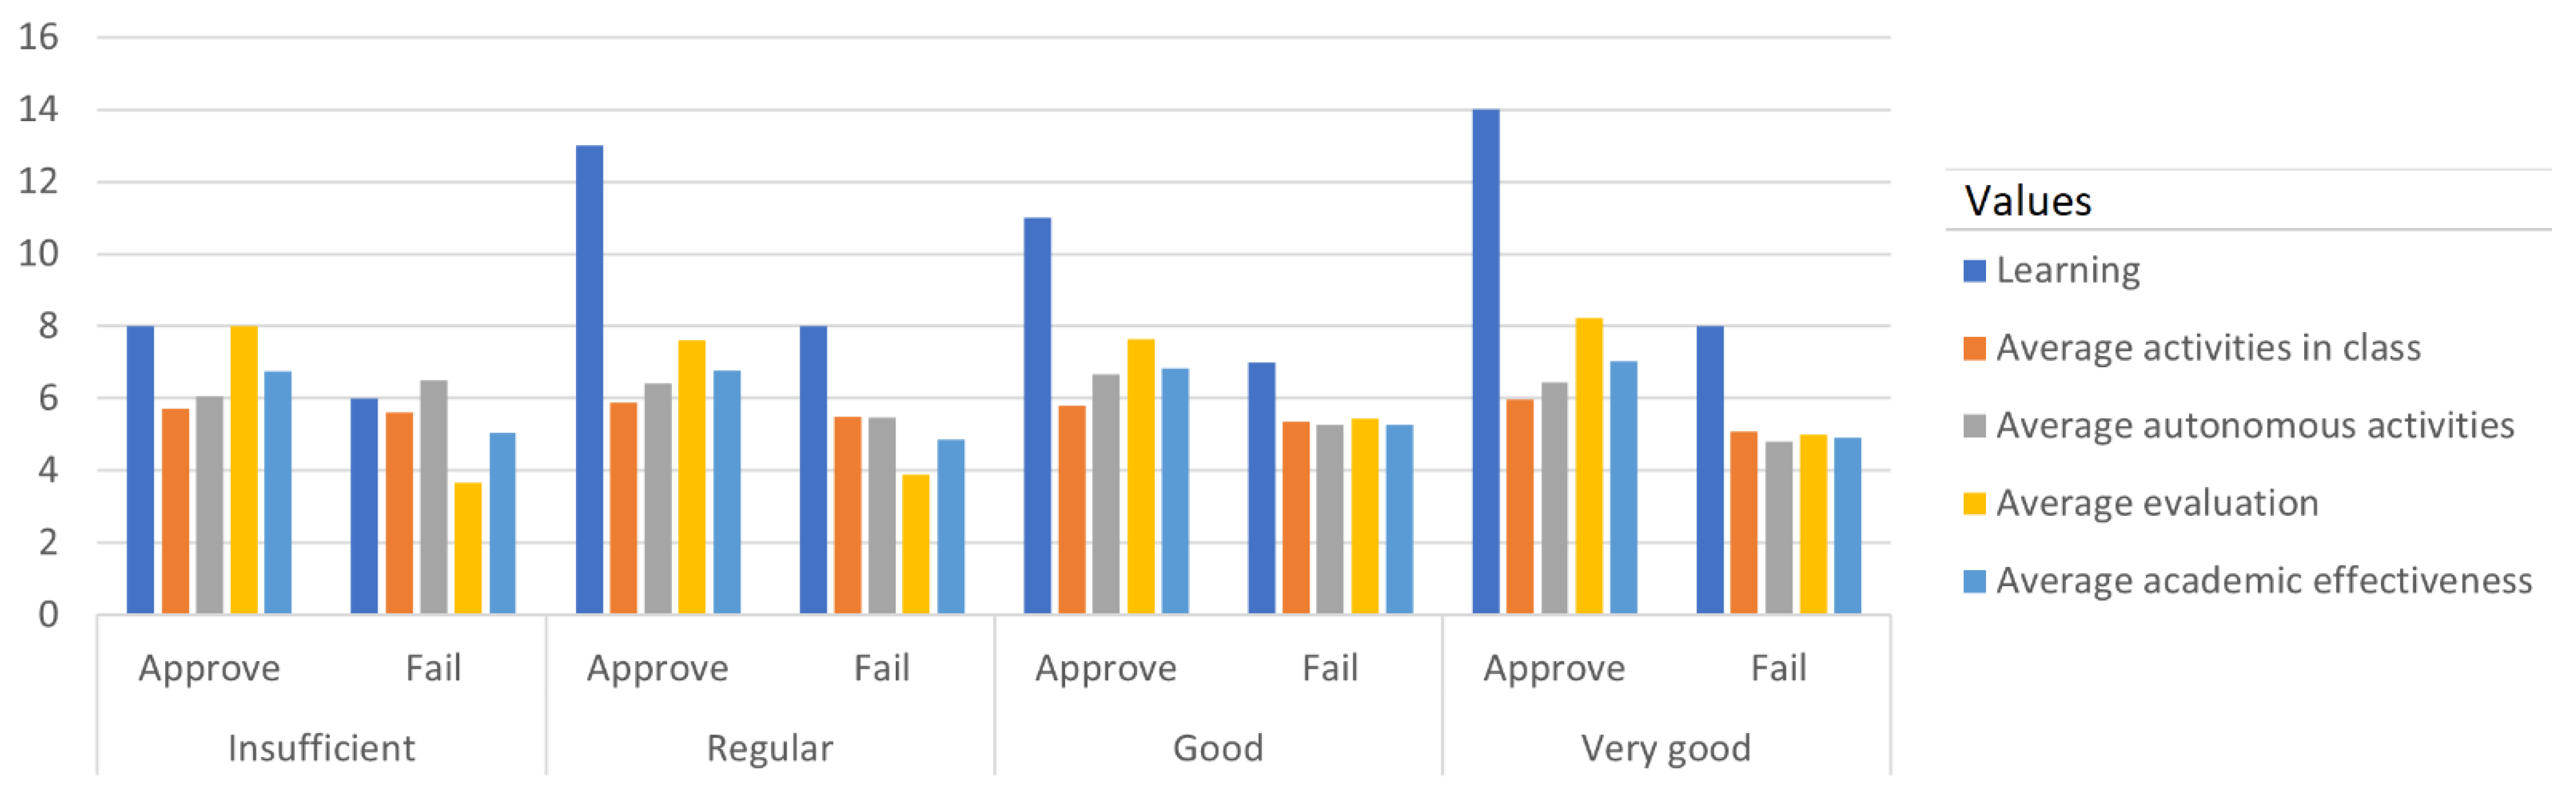
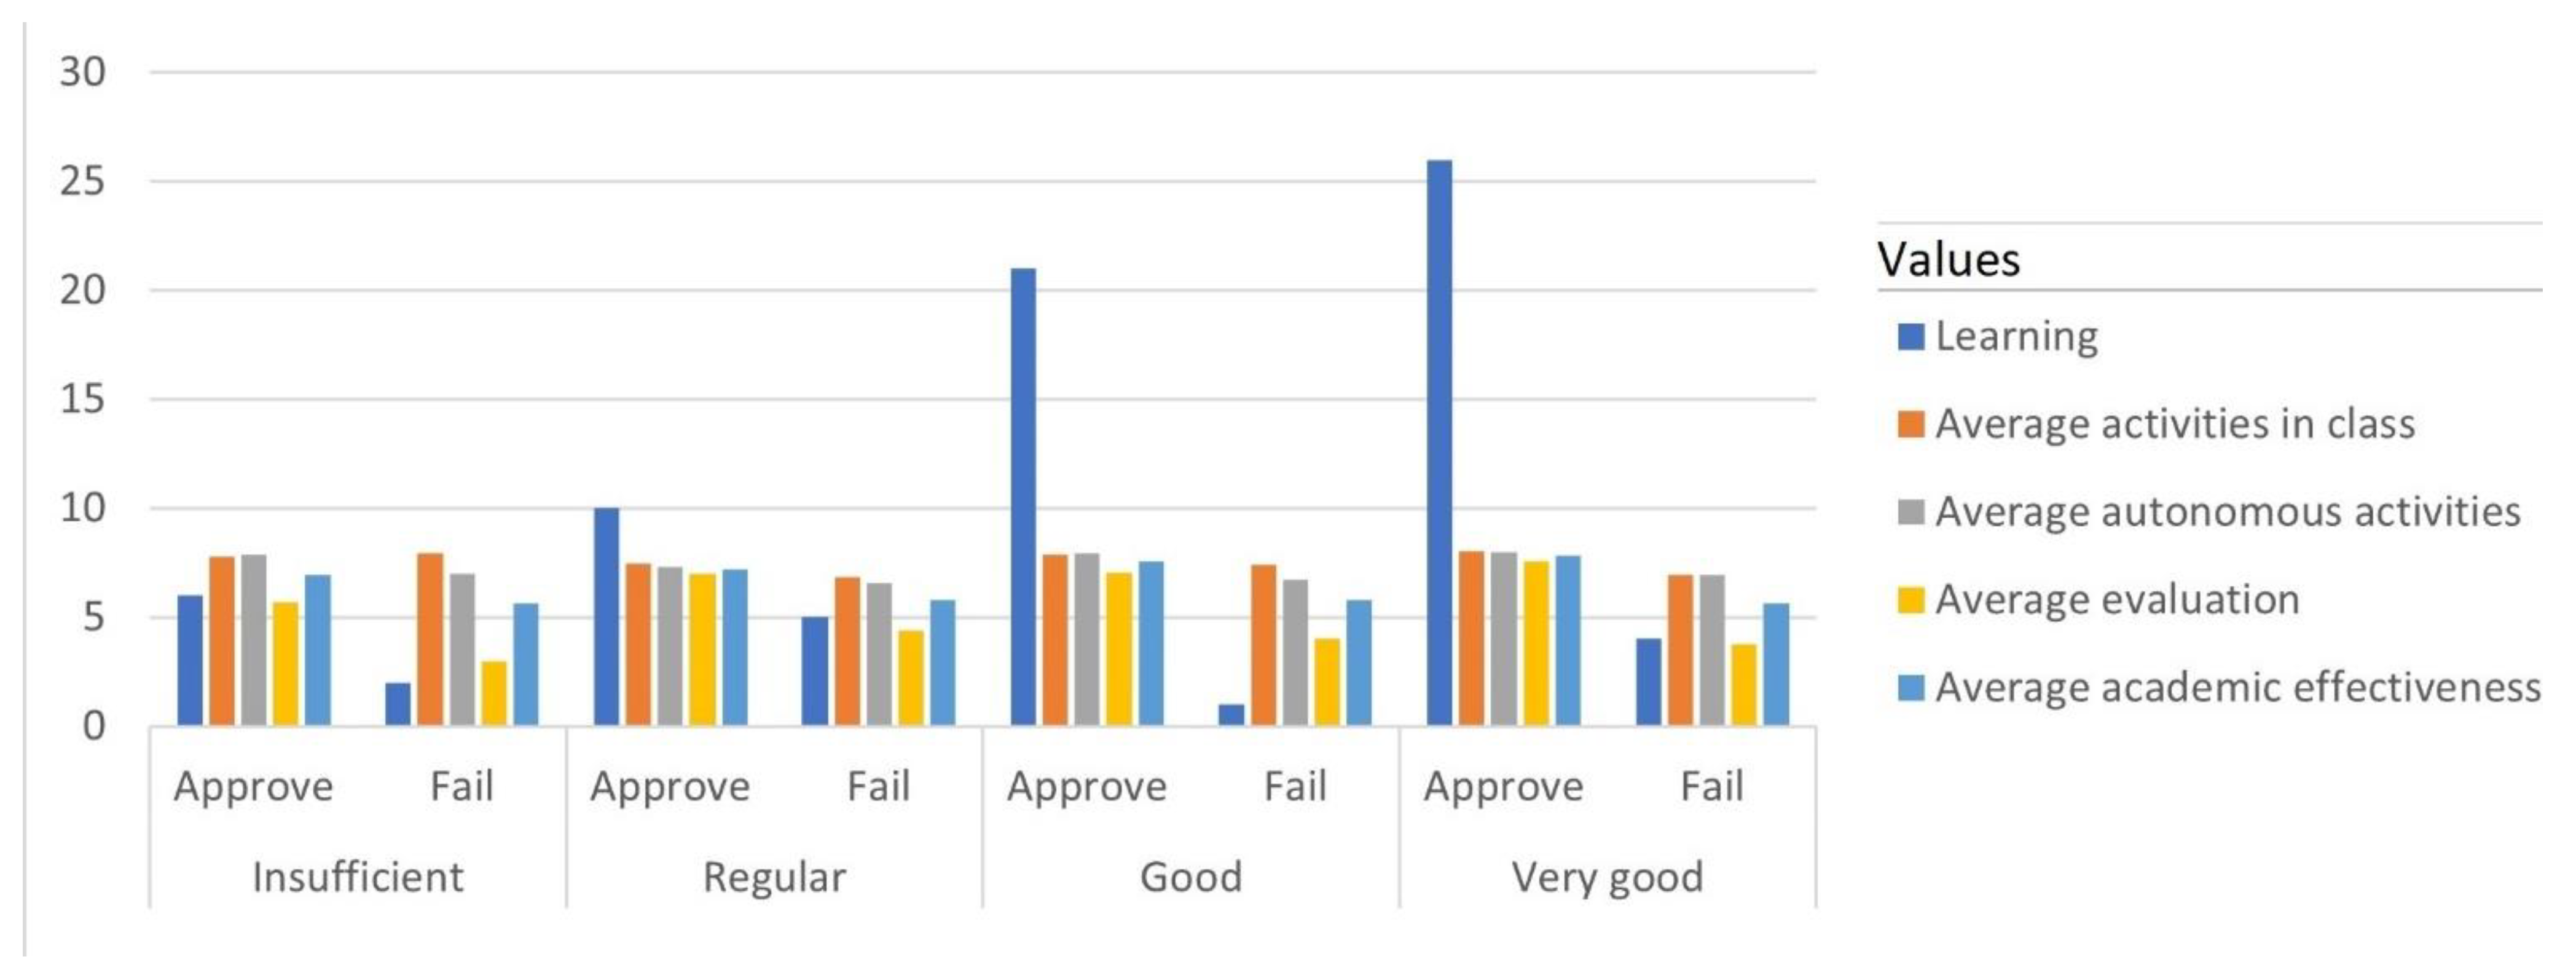
Table 14 presents the results obtained in 2019. In the first column, the evaluation of learning is presented with the four criteria (insufficient, regular, good, very good). Within each learning category, the range of pass or fail is included, in the second column the number of students is counted for each record evaluated.
As mentioned in previous sections, the evaluation period corresponded to the first partial. This condition is important because, even when the results obtained appear in the condition of passing or failing, this is not necessarily maintained until the end, since the average of the second part has not been evaluated. Therefore, it was found that 46 students passed the midterm by obtaining an effective average grade equal to or greater than 6/10. An unexpected result was that the grades were the factor that determined the approval of a partial and later the approval of a subject. However, this did not imply that the student necessarily learnt a subject. As shown by the results, where, of the 14 students who had reflected insufficient learning, eight passed the midterm with an average grade of 6.7 and only 6 students failed the midterm. All categories had students who passed and failed, with the total number of failed students being 29. When reviewing the very good learning status, it was found that 8 students failed even though their learning level was the highest. The total average of the group in its effectiveness was 6.1, a value that, according to previous analyses and the experience of the academic quality departments, is a normal value in partial 1 in a residential model.
In Figure 2 the data of the previous table is presented graphically. In this it is clearly observed that the categories with the highest incidence in learning were regular with 13 students and very good with 14 students. One of the factors that most influenced student performance was evaluation; this activity was not averaged with another activity and the weight given by the university was 40%. In-class and autonomous activities, in addition to having a lower weight (25% and 35% respectively), were the average of 7 activities in each category.
In 
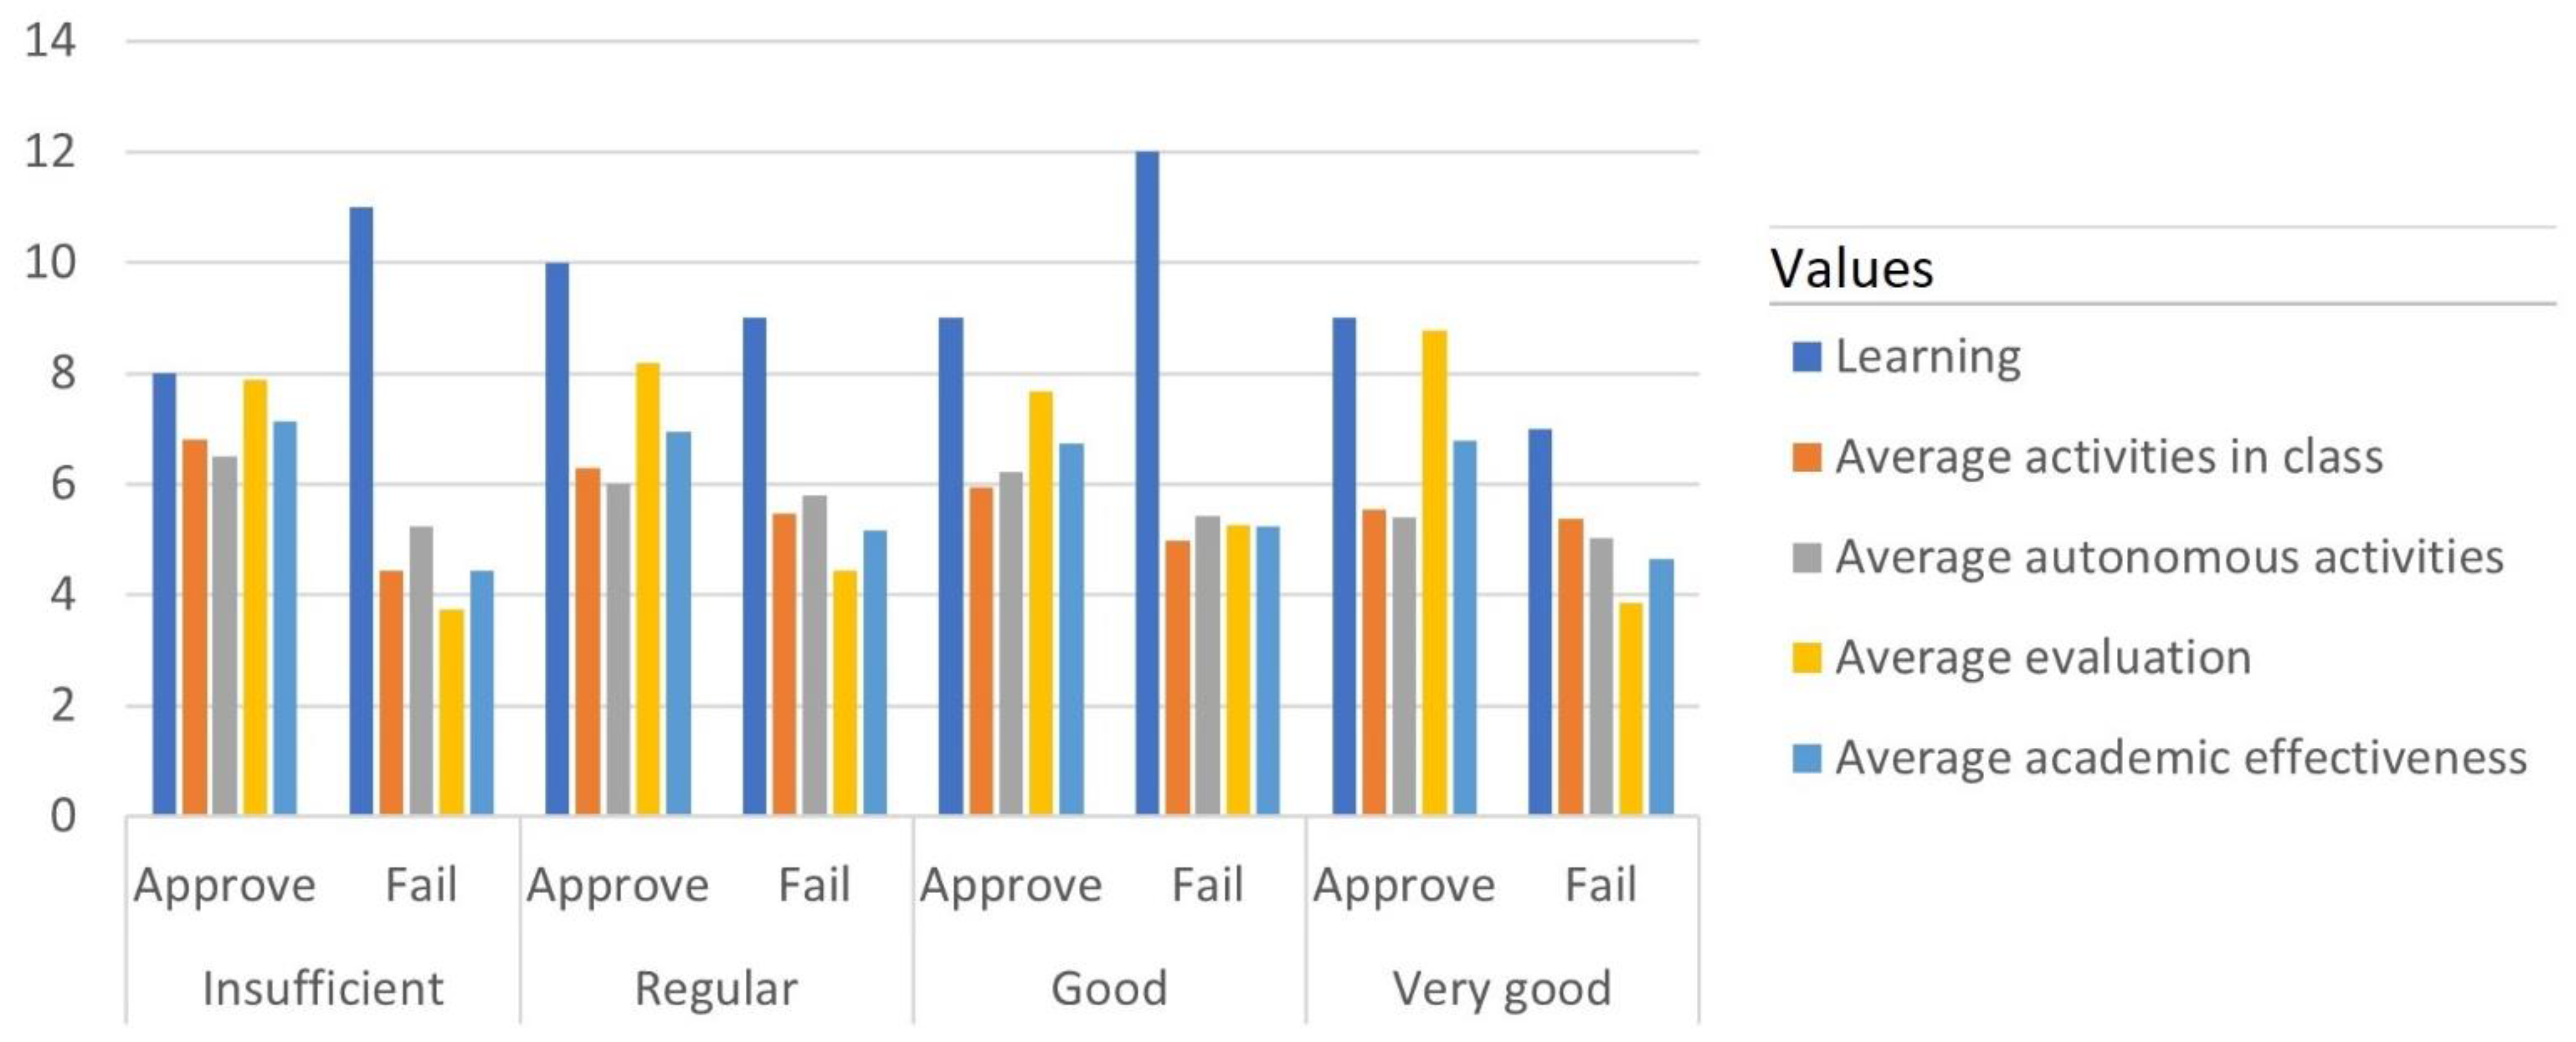
Table 15, the total values of the averages of the activities and the total number of students who passed the first part are presented, being the 36 approved and 39 students failed students. This number of students in the failed category rose to 52%, which represented a high value compared to the 2019 period. The average effectiveness dropped two points, standing at 5.9, and the activities that it involved lost between 2 and 4 points. On the other hand, among the expected results, it was found that the number of students who presented a learning between sufficient and regular was 38, of which 20 failed the partial 1. A figure contrary to what happened in the previous year.
In Figure 3, the data of the students in the year 2020 is presented. It was in this period that the pandemic began, and the educational modality went from face-to-face to remote. The first striking feature in the figure is that learning decreased drastically. Only the category having regular and very good levels of learning exceeded the number of approved students. In the analysis it was also found that there was a certain relationship between the activities developed in class with the autonomous ones and evaluation remained the factor with the greatest weight in academic effectiveness.
In 
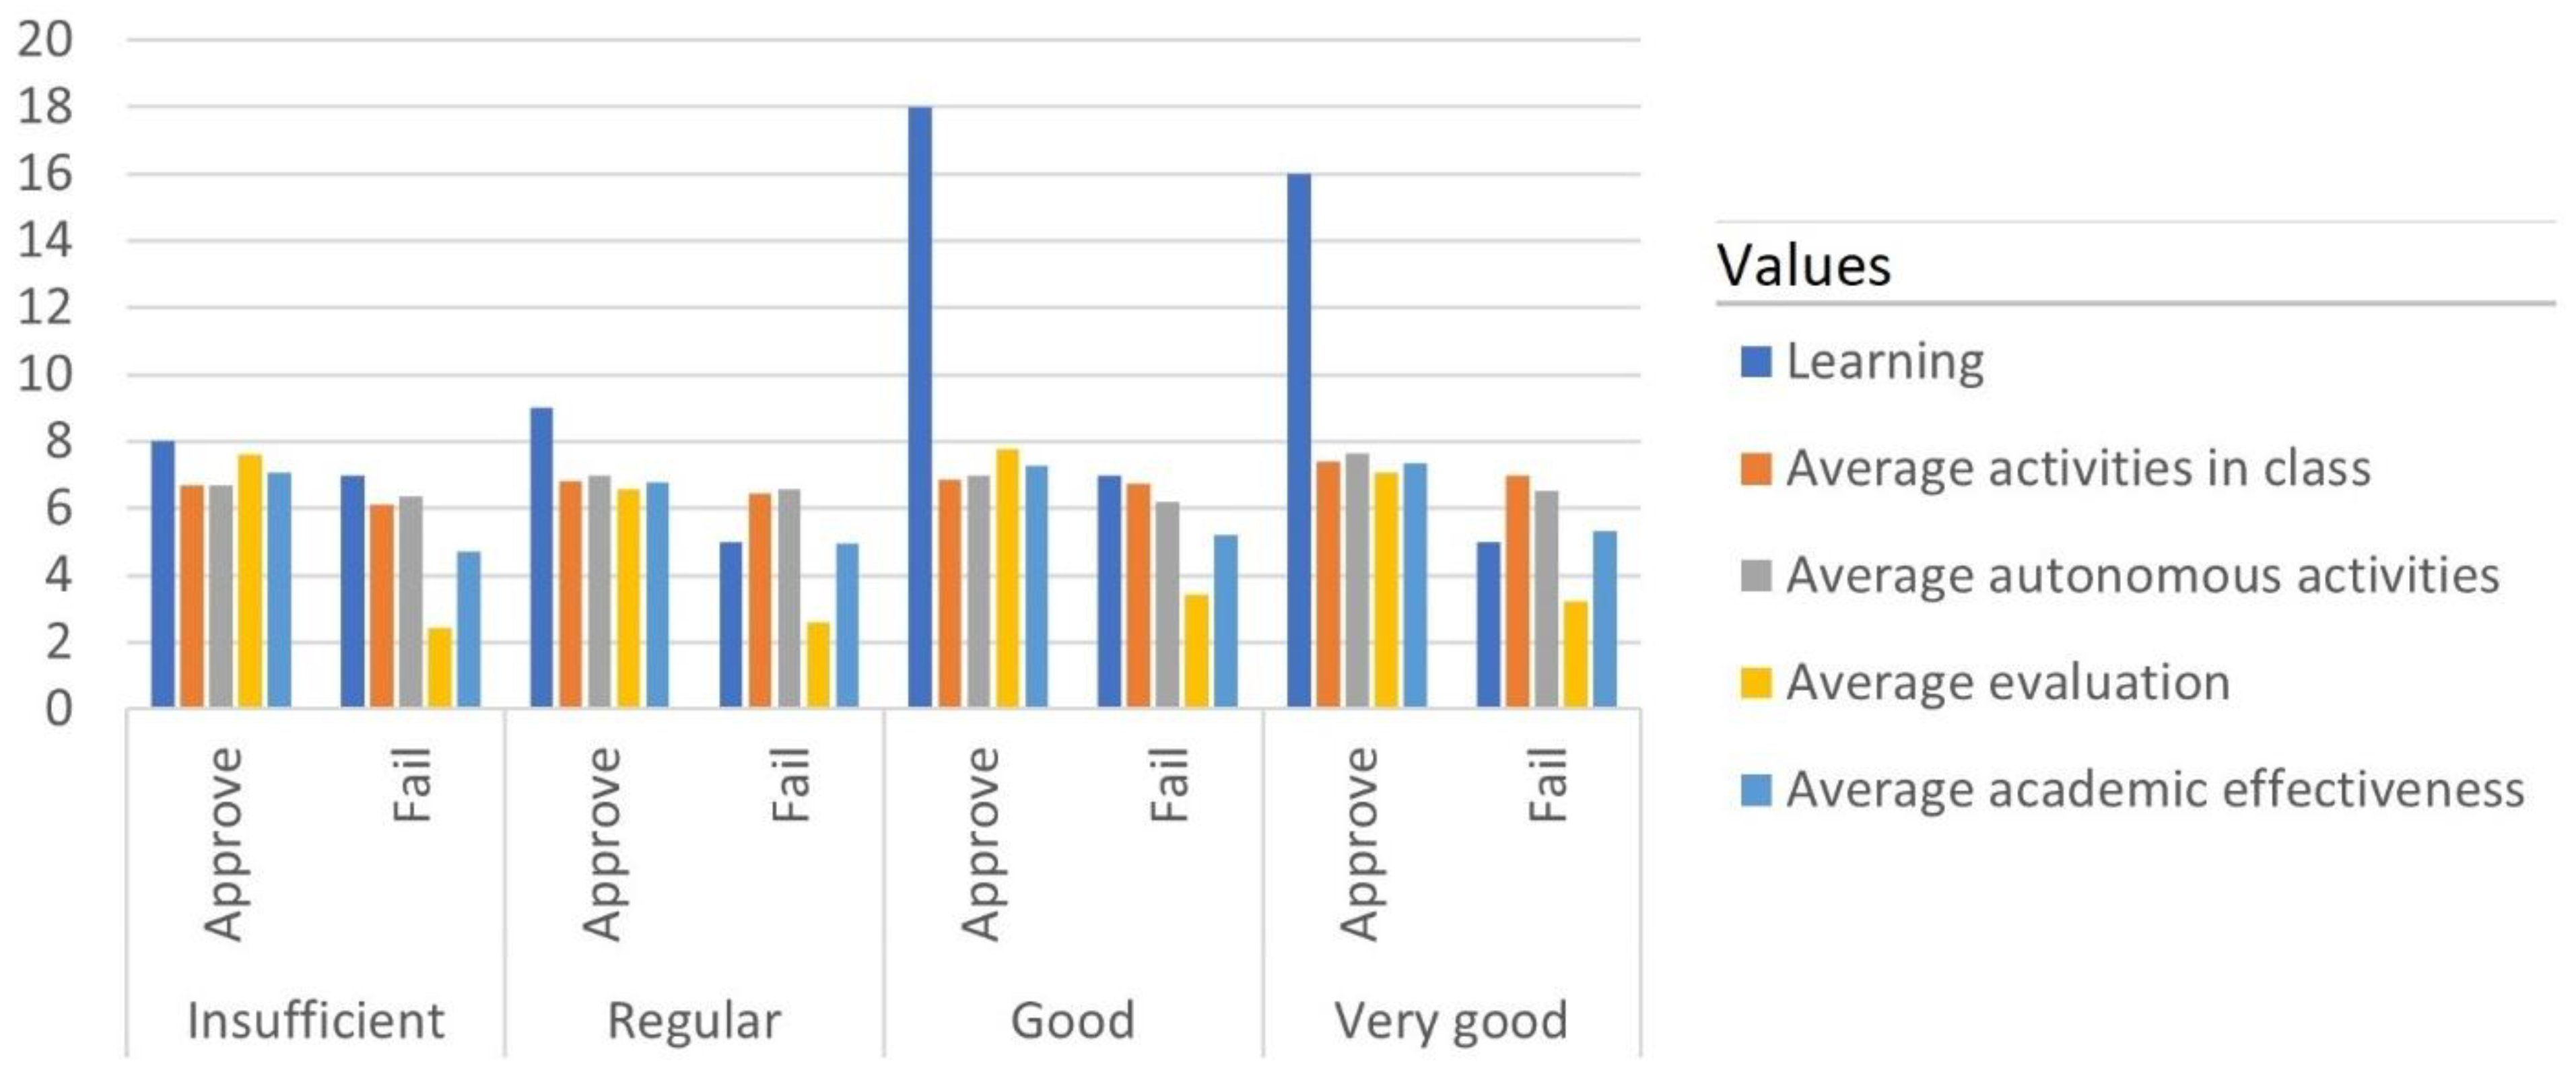
Table 16, the information corresponding to 2021 is presented. In the results it was identified that there were 29 students with an insufficient and regular level of learning. In this period remote communication was maintained. However, the universities began to modify the educational model, focusing it on the needs of students with an adequate use of ICT. In the same way, the number of failed this year began to decrease with 24 students, which was especially important because the activities in class and autonomous activities had improved the average. Therefore, the students in this period found these activities to be important for the highest score, which improved academic effectiveness. In this period, an unexpected result was obtained in the evaluation average, which was higher in the 2020 period, which opens the possibility of generating an analysis model that determines the causes of this change.
Figure 4 graphically presents the results found in the 2021 period. In the good and very good learning category, learning was high, and the evaluation punished students who failed. Another important factor to highlight in the results is that there was a certain relationship between classroom and autonomous activities in all learning categories.
Table 17 presents the results for the 2022 period, in which the universities returned to attendance. The university that participated in this study in this period integrated ICT directly into its educational model. The activities that they developed in classroom environments and autonomously were the main ones in which ICTs were integrated. According to the results in this period, 63 students passed and 12 failed. The general average of each component was higher than that of the previous periods. In addition, 23 students were categorized with insufficient and regular learning.
Figure 5 presents the results for the 2022 period, in which it was observed that the growth trend in learning that began in the previous period was accentuated in the current one. In the very good learning category, there were 26 students, something that had not been seen even in the 2019 period, where a face-to-face model was implemented.
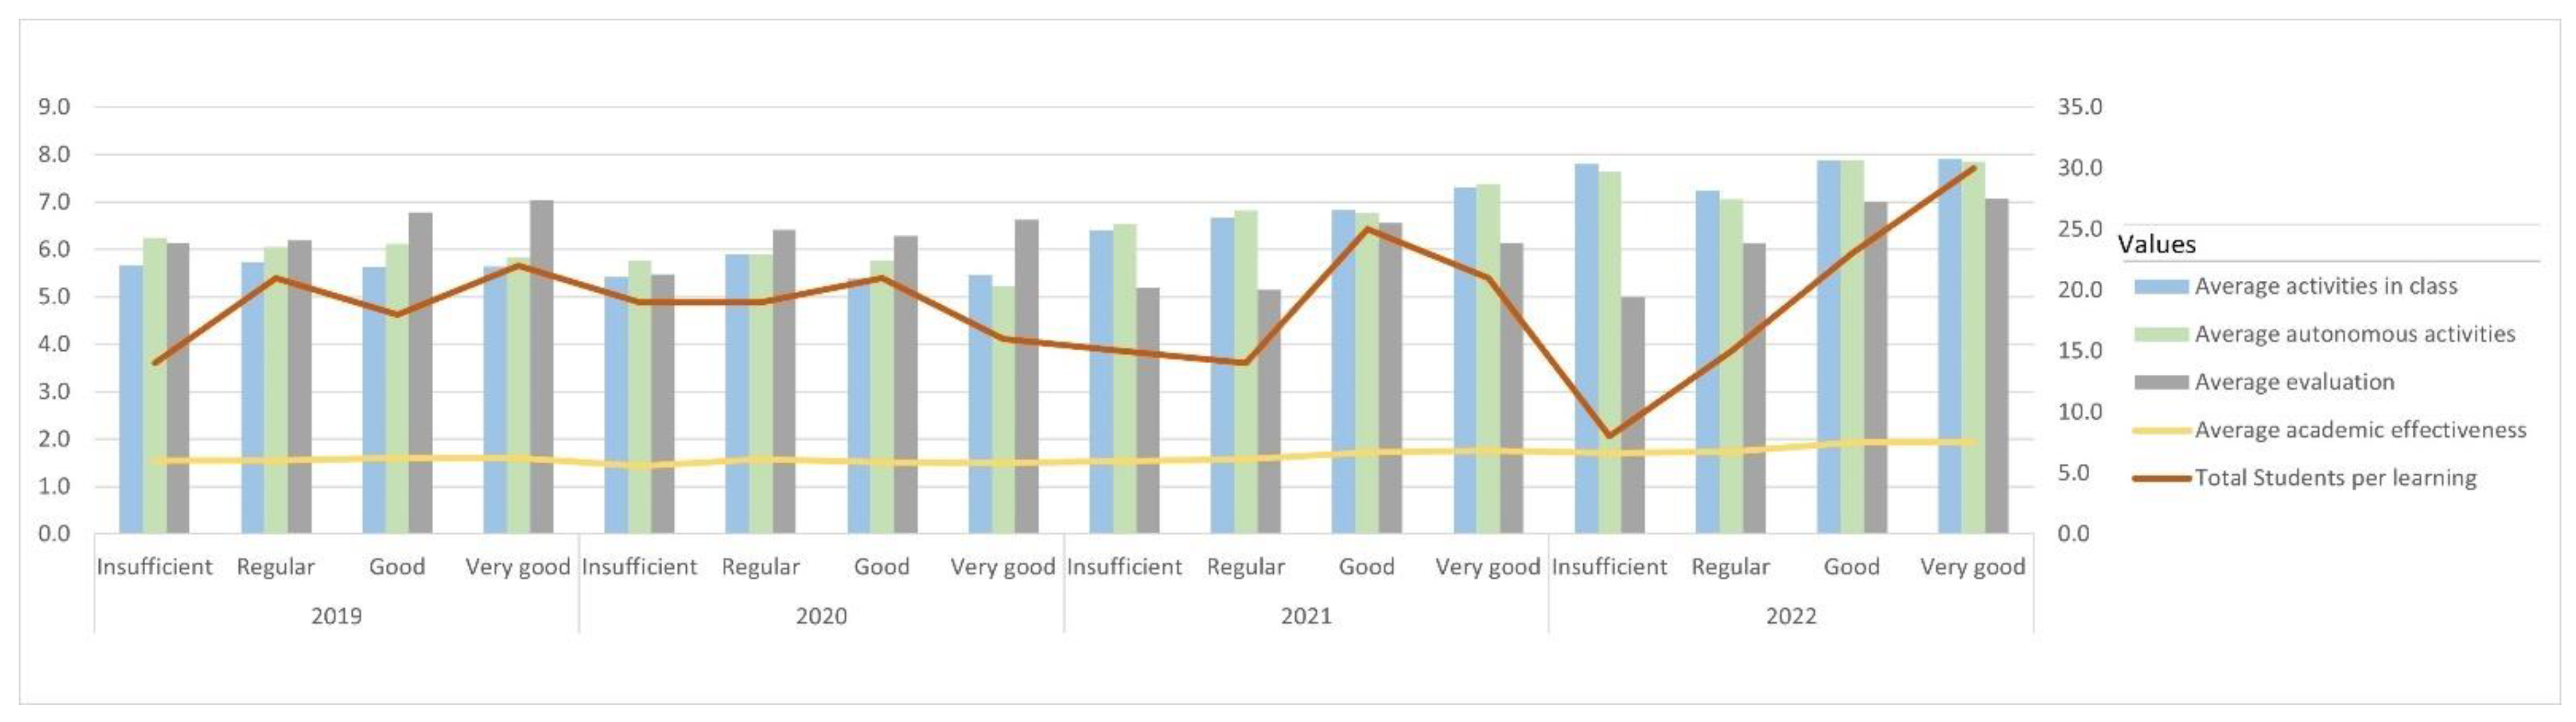
Figure 6 presents the comparison of all the factors included in the analysis throughout the four periods evaluated. The trend lines represent academic effectiveness versus learning. The trend line was stable over time, there were no sharp falls or rises, which was mainly because the students of the 2019 and 2020 periods supported their affectivity in the evaluation considering that it had a weight of 40% of the total. On the other hand, in the period 2021 and 2022 the effectiveness of the students focused with greater emphasis on the development of activities in class and autonomously, these having an additional factor and that is that in these periods the institution focused on the use of ICT in the classroom.
The trend line corresponding to learning was not stable and varied with time. In 2019, learning was low, within a face-to-face modality with a traditional method, that is, learning depending expressly on the teacher. In 2020, learning was even lower than in the previous year, which was specifically due to the beginning of the use of ICT, but in a remote model, marked by the start of the pandemic and in isolation from society. In 2021, the trend began to make positive leaps, considering that there were fewer students with insufficient and regular learning. The learning level with the highest number of students was focused on the “good” learning category and was even higher than the students who managed to obtain “very good” learning. This period had the characteristic that the use of ICT was already a factor in which students and teachers had already acquired experience and proper use, which improved the level of learning. In the evaluated period of 2022, students with “insufficient” learning decreased considerably and the trend rose to the point that the greatest number of students were at a good and very good level of learning. In this period, learning techniques based on the use of ICT had been applied, where the importance of motivation, research and innovation in the proposed activities was determined. These parameters had even lowered the percentage of interest of students in obtaining higher grades in the evaluation, as their success was focused on the development of classroom and autonomous activities that had been aligned to the use of ICT.

4. Discussion

In the application of the proposed method, several results have been obtained that were expected as improvement of learning with the inclusion of ICT in the classroom. However, this result was limited by the answers obtained in the surveys where a considerable number of students showed a certain feeling of uncertainty regarding the use of these tools [37,38]. Therefore, it is considered that the method in its two stages is fully applicable to universities that are creating processes to update their educational methods. In the first stage, the validation of surveys is proposed, considering that currently these instruments are the most used in obtaining data that seek to identify the sentiment of an objective population. In the second stage, an analysis of the academic data of a university is proposed to determine the academic effectiveness in relation to student learning.
Reviewed works on the management and analysis of data extracted from surveys do not deal with a statistical model that validates the design of the instrument [39]. Far fewer perform an analysis for each question to identify the degree of incidence in responding to a study phenomenon. The work carried out is not only responsible for the design of the survey, but it does also follow a process that goes from the identification of the problem to its validation [40,41]. In the survey design process, a representative sample is established that must be met as the first filter to validate the information received. This leads to the following difference in relation to the reviewed works, which is validation, for which a statistical method, such as factor analysis, is used. This statistical model can be considered as an old mechanism; however, its results are effective when generating a validation process, through calculations of variance, covariance, etc. This model has even made it possible to identify the incidence of questions in response to the proposed phenomenon [42]. This undoubtedly allows improvement of the instruments used for data acquisition, and this point, in addition, is a strength of the method, since it determines if the questions evaluate the dimension.
The proposed data analysis is related to works that have established data analysis models to determine the effectiveness of the use of ICT in education during COVID-19 [43,44]. However, this proposal considers an analysis where three environments intervene in a period that goes from 2019 to 2022. During these years, the institution that participated in this study went through a face-to-face study modality in 2019 in a traditional way [45,46]. In 2020 and 2021, due to the pandemic, the educational model became remote where ICTs supported education with learning and communication platforms. In the 2022 period, the university-maintained ICTs, but changed the application model and integrated them into the educational method [47,48]. These three scenarios allow a clear vision on the improvement of learning with the use of ICT.

5. Conclusions

The proposed method has been an aid in obtaining and validating information for the university that participated in this study. At present, surveys have become the most used instruments to identify the feelings of people before an object of study. With this precedent, having a process that is responsible for the validity of the survey and how the questions included respond to a phenomenon, is undoubtedly a contribution to the processes of academic quality. In addition, generating test environments that allow an analysis of the functioning of ICT is something that will allow a total inclusion of technologies in the classroom. This is how the different areas of the university that have received the results of this work have considered it.
In the use of computer tools, the advantage of universities is that they have a wide variety of them. This facilitates the implementation of processes capable of analyzing different data sources and generating knowledge for more assertive decision-making. Statistical tools such as SPSS have been used in this work and the Microsoft SQL Integration and Analysis package has been used in the analysis. The versatility of these tools allows them to be integrated into a wide variety of data sources and other tools, which allows the generation of a consolidated and comprehensive process. This advantage can be used to generate continuous processes that are not limited to responding to a single phenomenon. On the contrary, this process be integrated as an academic monitoring tool.
In the results obtained, certain information is easy to detect, and it is not necessary to generate a complicated process. However, this work has the purpose of establishing trends in the effectiveness and learning of students in a period that covers four years. This has been the condition that contributed to our work. During the analysis, the difference between effectiveness and learning was identified. Thus, in the 2019 and 2021 periods, the student data showed that their main objective was to pass the midterm, and, therefore, their efforts were aligned to obtaining the highest grades in the evaluations. On the contrary, in the period 2021 and, especially, in 2022, when the university added ICT as learning instruments, the student’s conceptions changed. In these periods, students focused more on the development of activities, both in class and autonomously, in such a way that their learning grew percentagewise. Even in these periods, the performance in the evaluations was leveled with the grades obtained in the other activities, which meant a significant improvement in their learning using ICT.

Author Contributions

W.V.-C. contributed to the following: the conception and design of the study, acquisition of data, analysis, and interpretation of data, drafting the article, and approval of the submitted version. The author J.G.-O. contributed to the study by design, conception, interpretation of data, and critical revision. S.S.-V. made the following contributions to the study: analysis and interpretation of data, approval of the submitted version. All authors have read and agreed to the published version of the manuscript.

Funding

This research received no external funding.

Institutional Review Board Statement

Not applicable.

Informed Consent Statement

Not applicable.

Data Availability Statement

The data presented in this study are available on request from the corresponding author.

Conflicts of Interest

The authors declare no conflict of interest.

References

  1. Appolloni, A.; Colasanti, N.; Fantauzzi, C.; Fiorani, G.; Frondizi, R. Distance Learning as a Resilience Strategy during COVID-19: An Analysis of the Italian Context. Sustainability 2021, 13, 1388. [Google Scholar] [CrossRef]
  2. Sidpra, J.; Gaier, C.; Reddy, N.; Kumar, N.; Mirsky, D.; Mankad, K. Sustaining Education in the Age of COVID-19: A Survey of Synchronous Web-Based Platforms. Quant. Imaging Med. Surg. 2020, 10, 1422–1427. [Google Scholar] [CrossRef]
  3. Troyer, E.A.; Kohn, J.N.; Hong, S. Are We Facing a Crashing Wave of Neuropsychiatric Sequelae of COVID-19? Neuropsychiatric Symptoms and Potential Immunologic Mechanisms. Brain Behav. Immun. 2020, 87, 34–39. [Google Scholar] [CrossRef]
  4. Rios-Campos, C.; Campos, P.R.; Delgado, F.C.; Ramírez, I.M.; Hubeck, J.A.; Fernández, C.J.; Vega, Y.C.; Méndez, M.C. COVID-19 and Universities in Latin America. South Fla. J. Dev. 2021, 2, 577–585. [Google Scholar] [CrossRef]
  5. Pattanayak, S.; Mohapatra, S.; Mohanty, S.; Choudhury, T. Empowering of ICT-Based Education System Using Cloud Computing. In Innovations in Computer Science and Engineering; Springer: Berlin/Heidelberg, Germany, 2019; pp. 113–120. [Google Scholar]
  6. Popoola, S.I.; Atayero, A.A.; Okanlawon, T.T.; Omopariola, B.I.; Takpor, O.A. Smart Campus: Data on Energy Consumption in an ICT-Driven University. Data Brief 2018, 16, 780–793. [Google Scholar] [CrossRef]
  7. Lee, D.; Watson, S.L.; Watson, W.R. The Relationships between Self-Efficacy, Task Value, and Self-Regulated Learning Strategies in Massive Open Online Courses. Int. Rev. Res. Open Distance Learn. 2020, 21, 23–39. [Google Scholar] [CrossRef]
  8. Pirrone, C.; Varrasi, S.; Platania, G.A.; Castellano, S. Face-to-Face and Online Learning: The Role of Technology in Students’ Metacognition. In Proceedings of the CEUR Workshop Proceedings, Foggia, Italy, 21–22 January 2021; Volume 2817. [Google Scholar]
  9. Fernández-Gutiérrez, M.; Gimenez, G.; Calero, J. Is the Use of ICT in Education Leading to Higher Student Outcomes? Analysis from the Spanish Autonomous Communities. Comput. Educ. 2020, 157, 103969. [Google Scholar] [CrossRef]
  10. Albright, J.; Pirrone, C.; di Corrado, D.; Privitera, A.; Castellano, S.; Varrasi, S. Students’ Mathematics Anxiety at Distance and In-Person Learning Conditions during COVID-19 Pandemic: Are There Any Differences? An Exploratory Study. Educ. Sci. 2022, 12, 379. [Google Scholar] [CrossRef]
  11. Shenfeld, O.Z.; Goldfarb, H.; Zvidat, S.; Gera, S.; Golan, I.; Gdor, Y.; Pode, D. 128: A Prospective Survay of Patients’ Satisfaction with Urethral Reconstructive Surgery. J. Urol. 2005, 173, 35. [Google Scholar] [CrossRef]
  12. Villegas-Ch, W.; Luján-Mora, S.; Buenaño-Fernandez, D.; Palacios-Pacheco, X. Big Data, the next Step in the Evolution of Educational Data Analysis. In Advances in Intelligent Systems and Computing, Proceedings of the Advances in Intelligent Systems and Computing, Libertad City, Ecuador, 10–12 January 2018; Springer: Cham, Switzerland, 2018; Volume 721, pp. 138–147. [Google Scholar]
  13. Cheng, L.; Cheng, P. Integration: Knowledge Management and Business Intelligence. In Proceedings of the 2011 Fourth International Conference on Business Intelligence and Financial Engineering (BIFE), Wuhan, China, 17–18 October 2011; pp. 307–310. [Google Scholar]
  14. Apraxine, D.; Stylianou, E. Business Intelligence in a Higher Educational. In Proceedings of the 2017 IEEE Global Engineering Education Conference (EDUCON), Athens, Greece, 25–28 April 2017; pp. 1735–1746. [Google Scholar]
  15. Soh, J.; Singh, P. Introduction to Azure Machine Learning. In Data Science Solutions on Azure; Professional and Applied Computing; Soh, J., Singh, P., Eds.; Apress: Berkeley, CA, USA, 2020; pp. 117–148. ISBN 978-1-4842-6405-8. [Google Scholar]
  16. Dziuban, C.; Graham, C.R.; Moskal, P.D.; Norberg, A.; Sicilia, N. Blended Learning: The New Normal and Emerging Technologies. Int. J. Educ. Technol. High. Educ. 2018, 15, 1–16. [Google Scholar] [CrossRef]
  17. Chen, C. Personalized E-Learning System with Self-Regulated Learning Assisted Mechanisms for Promoting Learning Performance. Expert Syst. Appl. 2009, 36, 8816–8829. [Google Scholar] [CrossRef]
  18. Bryson, J.R.; Andres, L. COVID-19 and Rapid Adoption and Improvisation of Online Teaching: Curating Resources for Extensive versus Intensive Online Learning Experiences. J. Geogr. High. Educ. 2020, 44, 608–623. [Google Scholar] [CrossRef]
  19. Müller, C.; Mildenberger, T. Facilitating Flexible Learning by Replacing Classroom Time with an Online Learning Environment: A Systematic Review of Blended Learning in Higher Education. Educ. Res. Rev. 2021, 34, 100394. [Google Scholar] [CrossRef]
  20. Akopova, E.; Przhedetskaya, N.; Bogoviz, A.V.; Ragulina, J.; Alekseev, A. Formation of Remote Education as a Means of Restoration of Russian Recessive Regions’ Economy. Int. J. Educ. Manag. 2019, 33, 438–445. [Google Scholar] [CrossRef]
  21. Noordzij, M.; Dekker, F.W.; Zoccali, C.; Jager, K.J. Sample Size Calculations. Nephron-Clin. Pract. 2011, 118, c319–c323. [Google Scholar] [CrossRef]
  22. Medhat, W.; Hassan, A.; Korashy, H. Sentiment Analysis Algorithms and Applications: A Survey. Ain Shams Eng. J. 2014, 5, 1093–1113. [Google Scholar] [CrossRef]
  23. Janssen, M.; van der Voort, H.; Wahyudi, A. Factors Influencing Big Data Decision-Making Quality. J. Bus. Res. 2017, 70, 338–345. [Google Scholar] [CrossRef]
  24. Hill, J.R.; Hannafin, M.J. Teaching and Learning in Digital Environments: The Resurgence of Resource-Based Learning. Educ. Technol. Res. Dev. 2001, 49, 37–52. [Google Scholar] [CrossRef]
  25. Villegas-Ch, W.; Luján-Mora, S. Analysis of Data Mining Techniques Applied to LMS for Personalized Education. In Proceedings of the IEEE World Engineering Education Conference (EDUNINE), Santos, Brazil, 19–22 March 2017; pp. 85–89. [Google Scholar]
  26. Jiang, Y.; Zhao, L.; Beer, M.; Wang, L.; Zhang, J. Dominant Failure Mode Analysis Using Representative Samples Obtained by Multiple Response Surfaces Method. Probabilistic Eng. Mech. 2020, 59, 103005. [Google Scholar] [CrossRef]
  27. Bengel, A.; Shawki, A.; Aggarwal, D. Simplifying Web Analytics for Digital Marketing. In Proceedings of the 2015 IEEE International Conference on Big Data (Big Data), Santa Clara, CA, USA, 29 October–1 November 2015; pp. 1917–1918. [Google Scholar]
  28. Villegas-Ch, W.; Luján-Mora, S.; Buenaño-Fernandez, D. Data Mining Toolkit for Extraction of Knowledge from LMS. In Proceedings of the ACM International Conference Proceeding Series, Barcelona, Spain, 20–22 December 2017; pp. 31–35. [Google Scholar]
  29. Husár, J.; Dupláková, D. Evaluation of Foreign Languages Teaching in LMS Conditions by Facility and Discrimination Index. TEM J. 2016, 5, 44–49. [Google Scholar] [CrossRef]
  30. Villegas-Ch, W.; Luján-Mora, S. Systematic Review of Evidence on Data Mining Applied to LMS Platforms for Improving E-Learning. In Proceedings of the International Technology, Education and Development Conference, Valencia, Spain, 6–8 March 2017; Chova, L.G., Martinez, A.L., Torres, I., Eds.; INTED: Valencia, Spain, 2017; pp. 6537–6545. [Google Scholar]
  31. Villegas-Ch, W.; Luján-Mora, S. Análisis de Las Herramientas de Minería de Datos Para La Mejora Del E-Learning En Plataformas LMS. In TIC Actualizadas Para una Nueva Docencia Universitaria; McGraw-Hill: New York, NY, USA, 2016; pp. 761–774. ISBN 9788448612658. [Google Scholar]
  32. Villegas-Ch, W.; Palacios-Pacheco, X.; Buenaño-Fernández, D.; Luján-Mora, S. Comprehensive Learning System Based on the Analysis of Data and the Recommendation of Activities in a Distance Education Environment. Int. J. Eng. Educ. 2019, 35, 1316–1325. [Google Scholar]
  33. Buenaño-Fernandez, D.; Villegas-Ch, W.; Luján-Mora, S. The Use of Tools of Data Mining to Decision Making in Engineering Education—A Systematic Mapping Study. Comput. Appl. Eng. Educ. 2019, 27, 744–758. [Google Scholar] [CrossRef]
  34. Jones, D.R.W. Problem-Based Learning: Description, Advantages, Disadvantages, Scenarios and Facilitation. Anaesth. Intensive Care 2006, 34, 485–488. [Google Scholar] [CrossRef] [PubMed]
  35. Jethro, O.O.; Grace, A.M.; Thomas, A.K. E-Learning and Its Effects on Teaching and Learning in a Global Age. Int. J. Acad. Res. Bus. Soc. Sci. 2012, 2, 203–210. [Google Scholar]
  36. Swilling, M.; Hajer, M.; Baynes, T.; Bergesen, J.; Labbé, F.; Musango, J.K.; Ramaswami, A.; Robinson, B.; Salat, S.; Suh, S.; et al. The Weight of Cities Resource Requirements of Future Urbanization; United Nations Environment Programme International Resource Panel: París, France, 2018; ISBN 9789280736991. [Google Scholar]
  37. Villegas-Ch., W.; García-Ortiz, J.; Román-Cañizares, M.; Sánchez-Viteri, S. Proposal of a Remote Education Model with the Integration of an ICT Architecture to Improve Learning Management. PeerJ Comput. Sci. 2021, 7, e781. [Google Scholar] [CrossRef]
  38. Villegas-Ch, W.; Palacios-Pacheco, X.; Roman-Cañizares, M.; Luján-Mora, S. Analysis of Educational Data in the Current State of University Learning for the Transition to a Hybrid Education Model. Appl. Sci. 2021, 11, 68. [Google Scholar] [CrossRef]
  39. Villegas-Ch, W.; Roman-Cañizares, M.; Sánchez-Viteri, S.; García-Ortiz, J.; Gaibor-Naranjo, W. Analysis of the State of Learning in University Students with the Use of a Hadoop Framework. Future Internet 2021, 13, 140. [Google Scholar] [CrossRef]
  40. Yong, M.; Garegrat, N.; Mohan, S. Towards a Resource Aware Scheduler in Hadoop. In Proceedings of the ICWS, Mackinac Island, MI, USA, 21 December 2009; pp. 1–10. [Google Scholar]
  41. Pagliaro, F.; Mattoni, B.; Gugliermenti, F.; Bisegna, F.; Azzaro, B.; Tomei, F.; Catucci, S. A Roadmap toward the Development of Sapienza Smart Campus. In Proceedings of the International Conference on Environment and Electrical Engineering, Florence, Italy, 7–10 June 2016; pp. 1–6. [Google Scholar]
  42. Tavani, H.T. Informational Privacy, Data Mining, and the Internet. Ethics Inf. Technol. 1999, 39, 137–145. [Google Scholar] [CrossRef]
  43. Bologna, E.; Lopomo, N.; Marchiori, G.; Zingales, M. A Non-Linear Stochastic Approach of Ligaments and Tendons Fractional-Order Hereditariness. Probabilistic Eng. Mech. 2020, 60, 103034. [Google Scholar] [CrossRef]
  44. International Monetary Fund. World Economic Outlook, October 2020 (Spanish Edition): A Long and Difficult Ascent; International Monetary Fund: Washington, DC, USA, 2021; ISBN 9781513561868. [Google Scholar]
  45. Wu, K.K.; Chan, S.K.; Ma, T.M. Posttraumatic Stress, Anxiety, and Depression in Survivors of Severe Acute Respiratory Syndrome (SARS). J. Trauma. Stress 2005, 18, 39–42. [Google Scholar] [CrossRef]
  46. Sønderskov, K.M.; Dinesen, P.T.; Santini, Z.I.; Østergaard, S.D. The Depressive State of Denmark during the COVID-19 Pandemic. Acta Neuropsychiatr. 2020, 32, 226–228. [Google Scholar] [CrossRef] [PubMed]
  47. Gogtay, N.J.; Thatte, U.M. Principles of Correlation Analysis. J. Assoc. Physicians India 2017, 65, 78–81. [Google Scholar] [PubMed]
  48. Lin, P.-Y.; Chai, C.-S.; Jong, M.S.-Y.; Dai, Y.; Guo, Y.; Qin, J. Modeling the Structural Relationship among Primary Students’ Motivation to Learn Artificial Intelligence. Comput. Educ. Artif. Intell. 2021, 2, 100006. [Google Scholar] [CrossRef]
Figure 1. Flowchart for the creation of a survey validation method and data analysis.
Information 13 00391 g001
Figure 2. Graph of the trend analysis for the 2019 period.
Information 13 00391 g002
Figure 3. Graph of the trend analysis for the 2020 period.
Information 13 00391 g003
Figure 4. Graph of the trend analysis for the 2021 period.
Information 13 00391 g004
Figure 5. Graph of the trend analysis for the 2022 period.
Information 13 00391 g005
Figure 6. Comparison of the development of activities and registered trends in academic effectiveness and learning in the periods that go from 2019 to 2022.
Information 13 00391 g006
Table 1. Example of responses obtained in a traditional survey.
IdQuestion 1Question 2Question 3Question 4Question 5Question 6
140–50Very difficultBassNeverAnyFalse information
220–30Very difficultMediumEverLittleexposure
340–50EasyBassAlwaysSomethingExposition
450–60HardHighNeverSomethingRisk
550–60HardMediumEverAnyFalse information
Table 2. Example of a correlation matrix with three items and their correspondence values.
Item 1Item 2
CorrelationItem 20.903
Item 30.8670.864
Table 3. Example of KMO and Bartlett values to verify partial correlations between variables.
Kaiser-Meyer-Olkin Measure of Sampling Adequacy0.751
Bartlett’s Test of SphericityApprox. Chi-Square2148.251
Df19
Sig.0.000
Table 4. Example of percentage of explained variance.
Initial EigenvaluesExtraction Sums of Squared Loading
ComponentTotal% of VarianceCumulative %Total% of VarianceCumulate %
11.06736.67036.6701.06736.67026.670
20.99854.45051.6241.98756.45056.450
30.99051.75776.380
40.94552.360100.000
Extraction Method: Principal Component Analysis.
Table 5. Sample of the data obtained from the survey carried out on 2260 students, 6 columns of 14 are maintained to maintain the format of the table.
IdQuestion 1Question 2Question 3Question 4Question 5
1MenBusiness AdministrationBetween, 20–25Foreverbetween 60% and 80%
2WomanEconomyBetween, 20–25Neverbetween 60% and 80%
3WomanMarketingBetween, 20–25Any occasionbetween 60% and 80%
4MenBusiness intelligence managementBetween, 25–30Once a weekbetween 40% and 60%
5WomanEconomyBetween, 25–30Neverbetween 80% and 100%
6WomanMarketingover 35Regularlybetween 40% and 60%
7MenMarketingBetween, 25–30Once a weekbetween 20% and 40%
8WomanBusiness AdministrationBetween, 25–30Foreverbetween 80% and 100%
9WomanMarketingBetween, 20–25Once a weekbetween 60% and 80%
10WomanBusiness AdministrationBetween, 30–35Any occasionbetween 40% and 60%
11MenBusiness intelligence managementover 35Any occasionbetween 80% and 100%
12Menagribusinessover 35Foreverbetween 80% and 100%
13MenBusiness intelligence managementBetween, 20–25Regularlybetween 60% and 80%
14WomanBusiness intelligence managementover 35Neverbetween 60% and 80%
15MenEconomyover 35Once a weekbetween 40% and 60%
16MenMarketingBetween, 30–35Neverbetween 20% and 40%
17MenagribusinessBetween, 30–35Regularlybetween 40% and 60%
18WomanMarketingBetween, 20–25Foreverbetween 60% and 80%
19WomanBusiness intelligence managementBetween, 25–30Neverbetween 20% and 40%
20MenEconomyBetween, 20–25Neverbetween 80% and 100%
21MenBusiness AdministrationBetween, 30–35Neverbetween 20% and 40%
22MenBusiness intelligence managementBetween, 20–25Any occasionbetween 40% and 60%
23MenagribusinessBetween, 30–35Regularlybetween 60% and 80%
24MenBusiness intelligence managementBetween, 25–30Any occasionbetween 20% and 40%
25MenMarketingBetween, 20–25Regularlybetween 60% and 80%
Table 6. Sample of the transformed data from the survey of 2260 students, with 14 columns.
Id.Q1Q2Q3Q4Q5Q6Q7Q8Q9Q10Q11Q12Q13
11125453534121
22321444354532
32522452223123
41433354552552
52331515443443
62554354534135
71533233322514
82135535453151
92523412553323
102142323423441
111452535434553
121255513332153
131424435545223
142451445445333
151353353332314
161541234234215
171244342554213
182525433222411
192431215422241
201321524552541
211141243435323
221422354254425
231244453254445
241432224424434
251524433225245
Table 7. KMO values to determine the validity of the survey.
Kaiser-Meyer-Olkin Measure of Sampling Adequacy. 0.500
Bartlett’s Test of SphericityApprox. Chi-Square92.281
df55
Sig.0.001
Table 8. Anti-image matrix that identifies the covariance and correlation values for each question.
Q 4Q 5Q 6Q 7Q 8Q 9Q 10Q 11Q 12Q 13Q 3
Anti-image CovarianceQ 40.9930.048−0.0190.0150.0460.0180.027−0.023−0.002−0.022−0.011
Q 50.0480.990−0.056−0.001−0.0280.047−0.003−0.0210.025−0.015−0.003
Q 6−0.019−0.0560.9950.0060.000−0.003−0.0140.0010.016−0.026−0.001
Q 70.015−0.0010.0060.991−0.043−0.0390.006−0.006−0.040−0.053−0.002
Q 80.046−0.0280.000−0.0430.987−0.0310.021−0.0060.012−0.011−0.076
Q 90.0180.047−0.003−0.039−0.0310.989−0.040−0.040−0.0440.0300.010
Q 100.027−0.003−0.0140.0060.021−0.0400.996−0.001−0.004−0.034−0.009
Q 11−0.023−0.0210.001−0.006−0.006−0.040−0.0010.996−0.0130.027−0.003
Q12−0.0020.0250.016−0.0400.012−0.044−0.004−0.0130.994−0.024−0.008
Q13−0.022−0.015−0.026−0.053−0.0110.030−0.0340.027−0.0240.992−0.005
Q3−0.011−0.003−0.001−0.002−0.0760.010−0.009−0.003−0.008−0.0050.994
Anti-image CorrelationQ 40.487 a0.048−0.0190.0150.0470.0180.027−0.023−0.002−0.022−0.011
Q 50.0480.499 a−0.057−0.001−0.0280.048−0.003−0.0210.025−0.015−0.003
Q 6−0.019−0.0570.500 a0.0060.000−0.003−0.0140.0010.016−0.026−0.001
Q 70.015−0.0010.0060.519 a−0.043−0.0400.006−0.006−0.040−0.054−0.002
Q 80.047−0.0280.000−0.0430.503 a−0.0320.021−0.0060.012−0.011−0.077
Q 90.0180.048−0.003−0.040−0.0320.500 a−0.040−0.040−0.0440.0310.010
Q 100.027−0.003−0.0140.0060.021−0.0400.475 a−0.001−0.004−0.034−0.009
Q 11−0.023−0.0210.001−0.006−0.006−0.040−0.0010.488 a−0.0130.028−0.003
Q12−0.0020.0250.016−0.0400.012−0.044−0.004−0.0130.526 a−0.024−0.008
Q13−0.022−0.015−0.026−0.054−0.0110.031−0.0340.028−0.0240.489 a−0.005
Q3−0.011−0.003−0.001−0.002−0.0770.010−0.009−0.003−0.008−0.0050.493 a
a. Measures of Sampling Adequacy (MSA).
Table 9. Calculation of the total explained variance with two components in an accumulated percentage of 58.263%.
Initial EigenvaluesExtraction Sums of Squared LoadingsRotation Sums of Squared Loadings
ComponentTotal% of VarianceCumulative %Total% of VarianceCumulate %Total% of VarianceCumulate %
11.14110.37210.3721.14110.37210.3721.0949.9449.944
21.11810.16220.5351.11810.16220.5351.0839.84219.786
31.0699.71530.2491.0699.71530.2491.0799.80629.592
41.0459.50239.7511.0459.50239.7511.0659.68439.276
51.0319.36949.1201.0319.36949.1201.0559.59248.869
61.0069.14358.2631.0069.14358.2631.0339.39458.263
70.9678.78867.051
80.9558.68675.736
90.9078.25083.986
100.8888.07292.058
110.8747.942100.000
Extraction Method: Principal Component Analysis.
Table 10. Matrix of rotated components to obtain values for each question and their incidence in 6 components.
Component
123456
Q70.701
Q120.527
Q130.485 −0.463
Q5 0.682
Q6 0.644
Q3 0.797
Q8 0.655
Q11 0.724
Q9 0.544 0.343
Q4 0.825
Q10 0.868
Extraction Method: Principal Component Analysis, Rotation Method: Varimax with Kaiser Normalization.
Table 11. Matrix of rotated components excluding the questions with less incidence in responding to the phenomenon under study.
Component
12
Q90.644
Q120.501
Q70.462
Q110.433
Q3 0.695
Q5 0.684
Q6 0.652
Extraction Method: Principal Component Analysis, Rotation Method: Varimax with Kaiser Normalization.
Table 12. Table with general data of the surveyed population, with segmentation by age, gender, and career to which they belong.
Old StudentsBusiness AdministrationAgribusinessEconomyBusiness Intelligence ManagementMarketingTotal
Men183189192210179953
under 20131514161169
Between, 20–254441424335205
Between, 25–303640385849221
Between, 30–354549604342239
Over 354544385042219
Woman2652422533002471307
under 2024171816984
Between, 20–256450727358317
Between, 25–305758667263316
Between, 30–356147606463295
Over 355970377554295
Total4484314455104262260
Table 13. Sentiment identified in a survey on the use of ICT in education.
How Effective Has Learning Been with ICT in Education?Number of Students per Answer
Effective504
Slightly effective510
Moderately affective506
Highly effective527
It has not been effective213
Total2260
Table 14. Analysis of the data obtained from the 2019 period with the establishment of the categories of learning and academic effectiveness.
Learning/EfficiencyTotalAverage Activities in ClassAverage Autonomous ActivitiesAverage EvaluationAverage Academic Effectiveness
Insufficient145.76.26.16.0
Approve85.76.18.06.7
Fail65.66.53.75.1
Regular215.76.16.26.0
Approve135.96.47.66.8
Fail85.55.53.94.9
Good185.66.16.86.2
Approve115.86.77.66.8
Fail75.45.35.45.3
Very good225.65.87.06.3
Approve146.06.48.27.0
Fail85.14.85.04.9
Total755.76.06.66.1
Table 15. Analysis of the data obtained from the 2020 period with the establishment of the categories of learning and academic effectiveness.
Learning/EfficiencyTotalAverage Activities in ClassAverage Autonomous ActivitiesAverage EvaluationAverage Academic Effectiveness
Insufficient195.45.85.55.6
Approve86.86.57.97.1
Fail114.45.23.74.4
Regular195.95.96.46.1
Approve106.36.08.27.0
Fail95.55.84.45.2
Good215.45.86.35.9
Approve95.96.27.76.7
Fail125.05.45.35.2
Very good165.55.26.65.8
Approve95.55.48.86.8
Fail75.45.03.94.6
Total755.55.76.25.9
Table 16. Analysis of the data obtained from the 2021 period with the establishment of the categories of learning and academic effectiveness.
Learning/EfficiencyTotalAverage Activities in ClassAverage Autonomous ActivitiesAverage EvaluationAverage Academic Effectiveness
Insufficient156.46.55.26.0
Approve86.76.77.67.1
Fail76.16.42.44.7
Regular146.76.85.16.1
Approve96.87.06.66.8
Fail56.46.62.64.9
Good256.86.86.66.7
Approve186.97.07.87.3
Fail76.86.23.45.2
Very good217.37.46.16.9
Approve167.47.67.17.4
Fail57.06.53.25.3
Total756.96.95.96.5
Table 17. Analysis of the data obtained from the 2022 period with the establishment of the categories of learning and academic effectiveness.
Learning/EfficiencyTotalAverage Activities in ClassAverage Autonomous ActivitiesAverage EvaluationAverage Academic Effectiveness
Insufficient87.87.65.06.6
Approve67.87.95.77.0
Fail27.97.03.05.6
Regular157.27.16.16.7
Approve107.47.37.07.2
Fail56.96.64.45.8
Good227.97.96.97.5
Approve217.97.97.07.6
Fail17.46.74.05.8
Very good307.97.97.17.6
Approve268.08.07.67.8
Fail47.06.93.85.7
Total757.87.76.67.3
Publisher’s Note: MDPI stays neutral with regard to jurisdictional claims in published maps and institutional affiliations.

