2. Literature Review and Proposed Method
There are many types of employee leaves of absence, including short-term and long-term disability, workers’ compensation, family and medical leave, and military leave. Additionally, there is evidence that companies with low morale suffer from higher rates and costs of unscheduled absences. Based on the 2005 CCH Survey, only 35% of unscheduled absences are attributed to personal illness, while 65% are attributed to other reasons, including family concerns (21%), personal needs (18%), entitlement attitude (14%), and stress (12%) [
7]. Tunceli et al. [
8] found that male employees with diabetes have a 7.1% lower likelihood of working and female employees with diabetes have a 4.4% lower likelihood of working than those without diabetes. Furthermore, the study conducted by Halpern et al. showed that smoking policies in the workplace affect absenteeism and productivity, concluding that smokers are more likely to be absent from work than former smokers and nonsmokers [
9]. Researchers have increasingly used artificial intelligence (AI)-based methods in recent years to model absenteeism problems that have a detrimental impact on the company’s infrastructure. Using Naive Bayes, Decision Trees, and Multilayer Perceptrons, Gayathri predicted absenteeism at the workplace and recommended multilayer perceptrons on the basis of validation score [
10]. Using a multilayer perceptron with the error back-propagation algorithm, Martiniano et al. proposed a neuro-fuzzy network to predict workplace absenteeism [
11].
In a recent study, Skorikov et al. [
12] compared six different data mining techniques to predict multiclass absenteeism at work, concluding that KNN classifiers with the Chebyshev distance metric performed the best. Although the authors divided absenteeism into different degrees, all models showed significantly lower prediction power. Furthermore, the authors did not follow the recommended performance metric guideline [
13] when comparing methods for imbalanced data.
Thus, we have utilized most of the current absenteeism research and followed the methodology of Cognitive Analytics Management (CAM) theory in order to examine absenteeism issues in the workplace. CAM theory, which was proposed Osman et al., consists of the following three steps [
14]:
- (a)
Cognitive process: acquire a thorough understanding of a problem, identifying the attributes and relationships that align with the desired goals and objectives determined in coordination with executive authorities.
- (b)
Analytical process: determine the most appropriate analytical models and methods for addressing the identified challenge and achieving the desired objectives, then validate the outcomes and convey the findings to executive authorities.
- (c)
Management process: A critical component of the CAM theory that is essential for the successful commencement and completion of any analytical project.
As part of the cognitive process, we preprocessed the data and explored the factors related to absenteeism through the use of ANOVA F-values and Random Forest feature selection. In the analytical process, we trained different machine learning classification models based on the attributes selected during the cognitive process, then determined the most significant model by comparing their performance metrics.
Furthermore, human resource managers may not have sufficient knowledge of the data mining techniques that used in existing models. In order to resolve this issue, we propose an automated decision support tool guided by the final stage (management process) of the CAM theory. For example, Delen, Sharda, & Kumar [
15] developed an automated web-based tool integrating prediction models to provide Hollywood producers with a way of classifying a movie into one of nine success categories, ranging from flops to blockbusters. Simsek et al. [
16] have developed an automated tool that uses artificial neural networks (ANN) to identify point velocity profiles on rivers with an accuracy level of 0.46.
Figure 1 provides an overview of how the web-based interactive tool proposed here was developed and how it can be utilized. This tool ensures that the end-user does not need to know anything about machine learning in order to make predictions about absenteeism; they must simply input data into the tool and click ”predict”.
The methodology in this paper is organized as follows. To begin, we preprocess the data by performing feature selection and scaling, one-hot encoding, and classification of absenteeism hours. We use the Synthetic Minority Over-Sampling Technique (SMOTE) to improve the performance of the classification models. In the next step, we split the data into training and testing sets, train four models (MLR, SVM, ANN, and RF) using the training data, and predict absenteeism classes using the testing data. Utilizing performance metrics, we compare and choose the most suitable model, then integrate the selected model into a proposed web-based interactive tool. Last, we provide a brief description of how the user can access the interactive tool.
2.1. Preprocessing and Cross-Validation
The dataset for this study was obtained from the UCI Machine Learning Repository and provided by Martiniano, Ferreira, Sassi & Affonso [
11]. This database was created using absenteeism records from a Brazilian courier company from July 2007 to July 2010. The dataset consists of 740 instances and 21 attributes. For more detailed information regarding the dataset, please see Skorikov et al. [
12]. In accordance with information provided by the data source (UCI Machine Learning Repository) and authors [
11], the dataset permits several kinds of attributes to be combined and excluded, and permits modification of the type of attributes (categorical, integer, or real) depending on the purpose of research.
There are several categorical attributes in the Absenteeism dataset (month of absence, day of the week, season, and more). In machine learning models, it is assumed that two numbers that are very close will appear to be more similar than two numbers that are further apart. However, this is not always the case for categorical attributes [
17]. With One-Hot-Encoding, the machine learning algorithm does not assume that larger numbers are more significant. Thus, we applied One-Hot-Encoding (by creating a binary column) to the categorical attributes [
18]. An important step in the development of a machine learning model is to determine the importance of features. A number of features are redundant or do not contain useful information. Features can be selected appropriately based on their importance. We utilized ANOVA- F-value attribute selection (ANOVA-FS) and Random Forest attribute importance (RFFI) to determine the feature importance. In ANOVA, each attribute is ranked by calculating the ratio of variances between and within groups [
19]. Based on this ratio, it can be determined how strongly the
i-th attribute is related to the group attribute [
20].
During a Random Forest training process, the significance of each attribute is quantitatively measured by the Gini index (error rate). In this way, the importance of each attribute can be ranked [
21]. Further information about random forest attributes can be found in Sarelaa et al. [
22].
We have listed the significant attributes for each of the methods in
Table 1 with a checkmark. For the RFFI method, we set a significant level of 0.025 for all attributes; thus, any attributes with an importance level less than 0.025 were considered to have insufficient predictive power. The ANOVA-FS and RFFI both select ten attributes, although the selected attributes within each model are not identical. We selected the attributes from the union set of ANOVA-FS and RFFI.
As outlined in our proposed study,
absenteeism in hours is a variable of interest. The absenteeism rate is divided into three categories:
none means that an employee is never absent;
moderate involves employees who are absent for 1 to 15 h per month; and
excessive refers to employees who are absent for 16 to 120 h per month. For simplicity, we refer to these three groups as
,
, and
, respectively. Skorikov et al. [
12] introduced the concept of the classification of absenteeism data, which is helpful when comparing groups within an organization. Furthermore, these predefined classes provide an opportunity to compare our findings with existing results.
We trained multiple classification models using selected attributes from each method and the dependent attribute
absenteeism in hours. Moreover, we applied five-fold stratified cross validation before training with the absenteeism dataset in order to evaluate model performance. Five-fold stratified cross-validation involves randomly dividing the dataset into five equal folds, each of which contains the same number of classification classes. The test set consists of one fold and the training set consists of four folds. The test set changes every time, and the remaining four subsets are used as training sets to produce a total of five models. We considered the average of five performance metrics across five models [
23,
24]. Furthermore, due to the categorization of
absenteeism in hours, three imbalanced classes were formed (
). Therefore, in order to increase the performance of the models, we only applied SMOTE to the training dataset, leaving the testing dataset unchanged. A major objective of SMOTE is to create data for the minority class to support the balance between classes. This process generates new data points using the k-nearest neighbors algorithm [
25].
Having applied all of the above techniques to the dataset, we trained multiple models; for brevity, we included only the four best-performing models (SVM, MLR, ANN, and RF) in this study. The following section provides a brief description of each of the classification models.
4. Results and Model Comparison
In this article, we explored four popular machine learning algorithms for predicting employee absenteeism. We used different methods of selecting the most significant set of attributes, as discussed in
Section 2.1. Our primary objective was to determine the most appropriate model using performance metrics and develop a decision support tool for human resource managers. We employed four different classification models across three different sets of attributes. In comparing the results shown in
Table 2, we found that the AUC score for the attribute set selected by ANOVA-FS ∪ RFFI was the highest of all models. Therefore, SVM and MLR had the highest AUC scores overall compared to other models. It should be noted that as concerns predictions, there is no universally accepted best method that is applicable in all problems. Trial and error and experimentation are required in order to find the best model for each scenario [
42]. Furthermore, Delen et al. recommend incorporating the knowledge of multiple experts in the development and training of a model [
15]. To develop an appropriate model, companies should consult with experts in the relevant field and choose the appropriate attributes based on their experience and geographic location. Saidene et al., for instance, investigated the factors leading to work absenteeism in Tunisia and concluded that excessive work hours, poor posture, workplace stress, and insufficient rest time are significant attributes leading to absenteeism [
43].
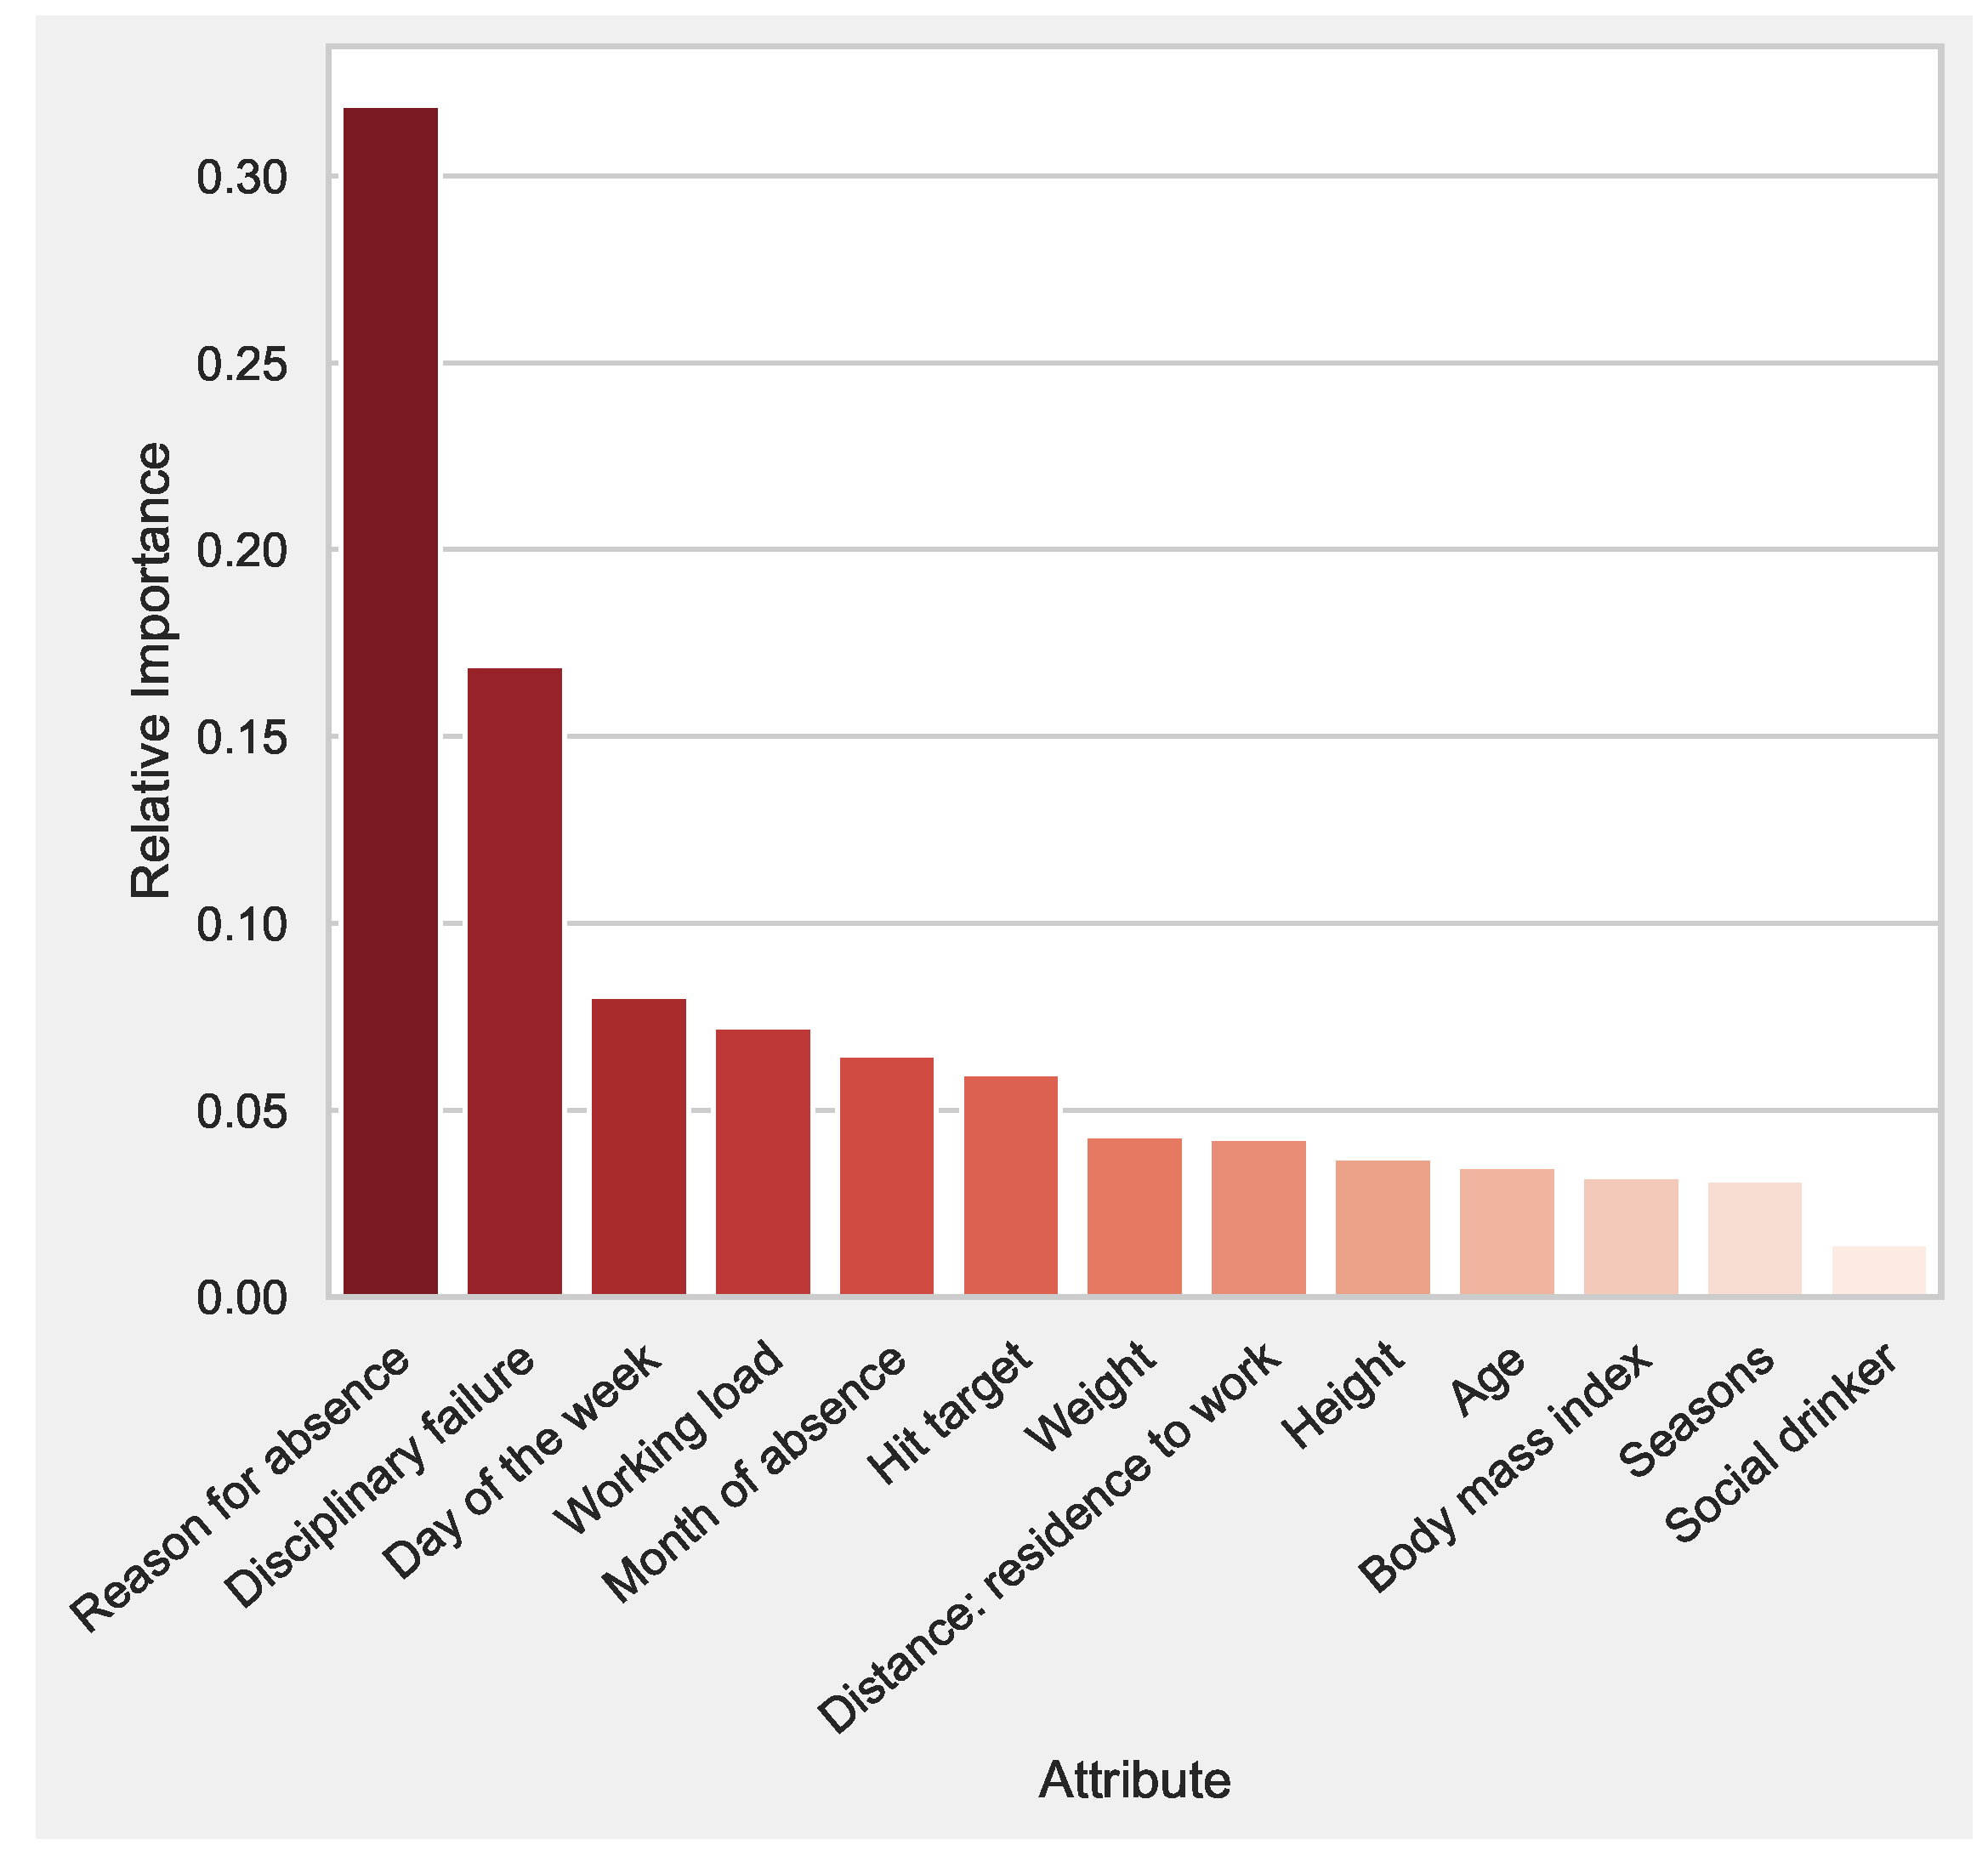
As the ANOVA-FS ∪ RFFI set provided the overall best performance, we selected these thirteen attributes for the final model. The relative importance of the attribute set is presented in
Figure 4. It can be seen that
reason for absence has the highest importance compared to others. Almost all levels of
reason for absence are caused by health-related absences. The establishment of an exercise center at the workplace may be one solution to reducing absenteeism. In an analysis of 517 employees selected randomly, Baun et al. explored the differences between exercisers and non-exercisers in terms of health care costs and absenteeism [
44]. They found that exercise reduced illness absence among exercisers and increased illness absence among nonexercisers. The findings of our study are therefore consistent with those of their experiments, demonstrating a significant association between illness and absenteeism at work. In addition, Dula et al. conducted an experimental study of absenteeism among medical staff at Arba Minch General Hospital and concluded that workload has a positive relationship with absenteeism [
45]. From
Figure 4, it can be seen that
workload is an important factor. In this case, a practical solution would be to decrease workload by hiring more employees. Moreover, as identifying the maximum workload for an employee is a critical decision, our proposed web-based tool can help managers in finding possible maximum workloads; this issue is discussed in detail in the next section.
Categorizing employees’ absenteeism in hours generates imbalanced classes. Numerous suggestions have been made as to how to overcome the negative effects of such an imbalance on performance metrics (for further details, see Luque, Carrasco, Martin & Heras [
46]). On the basis of our experimental results, and as suggested by Johnson, Halbesleben, Marilyn & Khoshgoftaar [
47] and Simsek et al. [
6], we determined the best model based on the AUC score and confusion matrix. In
Table 2, we report the accuracy, weighted F1-score, weighted precision, and the one-versus-one macro ROC AUC scores. A previous approach Skorikov et al. [
12] proposed a KNN classifier with a Chebyshev distance metric that achieved an AUC score of only 0.69.
Table 2 demonstrates that, under all of the scenarios assessed, our models performed better than their proposed model. This may be due to the fact that we applied One-Hot-Encoding to the categorize attributes and standardized the continuous attributes before using them to train the models.
We selected SVM for the web-based supporting tool because of its accuracy, which was 100% for class
, 85% for class
is 85%, and 77% for class
, the best overall performance in comparison to the other models. Skorikov et al. proposed KNN classifiers with the Chebyshev distance metric, obtaining an accuracy of 67% for class
, 92% for class
, and 8.3% for class
[
12]. Thus, our proposed model for absenteeism data shows a substantial improvement in terms of both AUC score and confusion matrix.
5. Absenteeism Interactive Tool
As discussed earlier, this study followed the CAM theory and current research on absenteeism to identify the factors that are significantly associated with absenteeism at work. In this study, we predicted absenteeism classes using these factors in order to explore possible ways for organizations to reduce absenteeism. Here, we propose an interactive web application for absenteeism classification guided by the final step of CAM theory, namely, the management process.
It can be difficult for a human resource manager or project manager to predict employee absenteeism classes using a machine learning algorithm, especially if he or she lacks programming expertise. Our proposed interactive web-based tool enables human resource or project managers to predict absenteeism by analyzing all current employees and estimating how many will be absent, allowing them to make appropriate adjustments and preparations ahead of time. In addition, managers will be able to save significant amounts of time by eliminating the need to train a machine learning algorithm. We present a prototype of the proposed tool based on a publicly available open-access dataset collected by Martiniano, Ferreira, Sassi & Affonso [
11] from a Brazilian courier company in 2012. This dataset is widely used, and there has been a significant amount of research published on absenteeism using this dataset. A prototype of our proposed web-based tool is accessible at the following link:
https://share.streamlit.io/gopalnath1926/app_absenteeism_new/main/app_absenteeism.py (accessed on 24 June 2022).
It is important to note that this dataset represents specific human behaviors from the area in which it was collected. Related behaviors may be different in other areas of the world [
48] or in different companies. Therefore, companies should consult with experts and select appropriate attributes (possibly based on internal data from their own company) for training the model and developing an effective version of the proposed web-based tool for human resources and project managers in order to improve workplace absenteeism problems.
It should be noted that this prototype is presented only for the benefit of the reader as a demonstration of the proposed tool. One of the referees remarked that this prototype tool, having been trained by the Brazilian courier dataset, may not be applicable or useful to other organizations. Perhaps a fully implemented version of the tool could streamline this process by allowing a company to upload its absentee data, automatically develop a model based on the process proposed in this study, and quickly create a unique version of the tool for their own human resource or projects managers.
Furthermore, based on the performance analysis discussed in the previous section, SVM was chosen for the prototype. We developed the prototype using the Streamlit, an open-source Python framework for developing web applications. By collecting an employee’s information, the end-user can then input all of the information and, by clicking on the predict button, predict the class of the employee. The end-user does not need to know anything about machine learning to make predictions; they simply input data into the tool and click predict. As shown in
Figure 5, the output (predicted) class for the desired candidate is
on a scale of
, indicating that this particular employee has a high degree of sincerity in the workplace and is less likely to miss work. Furthermore, as a follow-up to the problem we mentioned above, Dula et al. concluded that workload was a significant factor in predicting absenteeism in an experimental study on medical staff at Arba Minch General Hospital [
45]. Our proposed interactive tool can help significantly in adjusting the workload of an employee. According to
Figure 5, if we change the
workload average/day from 70 to 73, the prediction class changes from
to
, assuming that all other attributes remain constant. Therefore, human resources or project managers can determine the maximum workload an employee can handle based on all of the input information, thereby avoiding absenteeism. Moreover, we conclude that there is a positive association between workload and absenteeism, which is consistent with the experimental results of Dula et al.
Author Contributions
Data curation, G.N.; formal analysis, G.N.; methodology, G.N.; software, G.N.; validation, G.N., Y.W., A.C., S.P. and S.S.; writing—original draft, G.N.; writing—review and editing, G.N., Y.W., A.C., K.K.S., S.P. and S.S. All authors have read and agreed to the published version of the manuscript.
Funding
This research received no external funding.
Data Availability Statement
Conflicts of Interest
The authors declare no conflict of interest.
References
- Kocakulah, M.C.; Kelley, A.G.; Mitchell, K.M.; Ruggieri, M.P. Absenteeism problems and costs: Causes, effects and cures. Int. Bus. Econ. Res. J. (IBER) 2016, 15, 89–96. [Google Scholar] [CrossRef] [Green Version]
- Prater, T.; Smith, K. Underlying Factors Contributing To Presenteeism And Absenteeism. J. Bus. Econ. Res. 2011, 9, 1–14. [Google Scholar] [CrossRef] [Green Version]
- Simpson, I. Ailing and Overweight Americans Cost Billions in Productivity. Reuters. Available online: https://www.reuters.com/article/us-absenteeism-idUSTRE79G17X20111017 (accessed on 20 November 2021).
- Kim, J.; Sorhaindo, B.; Garman, E.T. Relationship between Financial Stress and Workplace Absenteeism of Credit Counseling Clients. J. Fam. Econ. 2006, 27, 458–478. [Google Scholar] [CrossRef]
- Halbesleben, R.B.H.; Whitman, M.V.; Crawford, W.S. A dialectical theory of the decision to go to work: Bringing together absenteeism and presenteeism. Hum. Resour. Manag. Rev. 2014, 24, 172–192. [Google Scholar] [CrossRef]
- Simsek, S.; Albizri, A.; Johnson, M.; Custis, T.; Weikert, S. Predictive data analytics for contract renewals: A decision support tool for managerial decision-making. J. Enterp. Inf. Manag. 2021, 34, 718–732. [Google Scholar] [CrossRef]
- Navarro, C.; Bass, C. The Cost of Employee Absenteeism. Sage J. 2016, 38, 26–30. [Google Scholar] [CrossRef] [Green Version]
- Tunceli, K.; Bradley, C.J.; Nerenz, D.; Williams, L.K.; Pladevall, M.; Lafata, J.E. The impact of diabetes on employment and work productivity. Diabetes Care 2005, 28, 2662–2667. [Google Scholar] [CrossRef] [Green Version]
- Halpern, M.T.; Shikiar, R.; Rentz, A.M.; Khan, Z.M. Impact of smoking status on workplace absenteeism and productivity. Tob. Control 2001, 10, 233–238. [Google Scholar] [CrossRef]
- Gayathri, T. Data mining of absentee data to increase productivity. Int. J. Eng. Tech. 2018, 4, 478–480. [Google Scholar]
- Martiniano, A.; Ferreira, R.P.; Sassi, R.J.; Affonso, C. Application of a neuro fuzzy network in prediction of absenteeism at work. In Proceedings of the 7th Iberian Conference on Information Systems and Technologies (CISTI 2012), Madrid, Spain, 20–23 June 2012; pp. 1–4. [Google Scholar]
- Skorikov, M.; Hussain, M.R.; Akbar, M.K.; Momen, S.; Mohammed, N.; Nashin, T. Prediction of absenteeism at work using data mining techniques. In Proceedings of the 2020 5th International Conference on Information Technology Research (ICITR), Moratuwa, Sri Lanka, 2–4 December 2020; pp. 1–6. [Google Scholar] [CrossRef]
- Williams, D.P.; Myers, V.; Silvious, M.S. Mine Classification with Imbalanced Data. EEE Geosci. Remote Sens. Lett. 2009, 6, 528–532. [Google Scholar] [CrossRef]
- Osman, I.H.; Anouze, A.L.; Irani, Z.; Lee, H.; Medeni, T.D.; Weerakkod, V. A cognitive analytics management framework for the transformation of electronic government services from users’ perspective to create sustainable shared values. Eur. J. Oper. Res. 2021, 278, 514–532. [Google Scholar] [CrossRef]
- Delen, D.; Sharda, R.; Kumar, P. Movie forecast guru: A web-based DSS for hollywood managers. Decis. Support Syst. 2007, 43, 1151–1170. [Google Scholar] [CrossRef]
- Simsek, S.; Genc, O.; Albizri, A.; Dinc, S.; Gonen, B. Artificial neural network incorporated decision support tool for point velocity prediction. J. Bus. Anal. 2020, 3, 67–78. [Google Scholar] [CrossRef]
- Zhang, H.; Zheng, G.; Xu, X.; Yao, X. Research on the Construction and Realization of Data Pipeline in Machine Learning Regression Prediction. Math. Probl. Eng. 2022, 2022, 7924335. [Google Scholar] [CrossRef]
- Imran, A.A.; Amin, M.N.; Rifat, M.R.; Mehreen, S. Deep Neural Network Approach for predicting the productivity of garment employees. In Proceedings of the IEEE, 6th International Conference on Control, Decision and Information Technologies (CoDIT), Paris, France, 23–26 April 2019; pp. 1402–1407. [Google Scholar] [CrossRef]
- Johnson, J.K.; Synovec, R.E. Pattern recognition of jet fuels: Comprehensive GC × GC with ANOVA-based feature selection and principal component analysis. Chemom. Intell. Lab. Syst. 2002, 60, 225–237. [Google Scholar] [CrossRef]
- Nasiri, H.; Alavi, S.A. A Novel Framework Based on Deep Learning and ANOVA Feature Selection Method for Diagnosis of COVID-19 Cases from Chest X-ray Images. Comput. Intell. Neurosci. 2021, 2022, 4694567. [Google Scholar] [CrossRef]
- Fei, H.; Fan, Z.; Wang, C.; Zhang, N.; Wang, T.; Chen, R.; Bai, T. Cotton Classification Method at the County Scale Based on Multi-Features and Random Forest Feature Selection Algorithm and Classifier. Remote Sens. 2022, 14, 829. [Google Scholar] [CrossRef]
- Saarela, M.; Jauhiainen, S. Comparison of feature importance measures as explanations for classification models. SN Appl. Sci. 2021, 3, 272. [Google Scholar] [CrossRef]
- Jiang, H.J.; Huang, Y.; You, Z.H. Predicting Drug-Disease Associations via Using Gaussian Interaction Profile and Kernel-Based Autoencoder. BioMed Res. Int. 2019, 2019, 11. [Google Scholar] [CrossRef]
- May, R.J.; Maier, H.R.; Dandy, G.C. Data splitting for artificial neural networks using SOM-based stratified sampling. Neural Netw. 2010, 23, 283–294. [Google Scholar] [CrossRef]
- Chawla, N.V.; Bower, K.; Hall, L.; Kegelmeyer, W.P. SMOTE: Synthetic Minority Over-sampling Technique. J. Artif. Intell. Res. 2002, 16, 321–357. [Google Scholar] [CrossRef]
- Cervantes, J.; Lamont, G.F.; Mazahua, R.M.A.L.; Lopez, A. A comprehensive survey on support vector machine classification: Applications, challenges and trends. Neurocomputing 2020, 408, 189–215. [Google Scholar] [CrossRef]
- Vapnik, V.N. The Nature of Statistical Learning Theory, 2nd ed.; Springer: New York, NY, USA, 2000; pp. 1–314. ISBN 978-0-387-98780-4. [Google Scholar]
- Agresti, A. Categorical Data Analysis, 2nd ed.; John Wiley & Sons: Hoboken, NJ, USA, 2002; pp. 1–372. ISBN 978-0-471-22618-5. [Google Scholar]
- Abiodun, O.I.; Jantan, A.; Omolara, A.E.; Dada, K.V.; Mohamed, N.A.; Arshad, H. State-of-the-art in artificial neural network applications: A survey. Heliyon 2018, 4, 1–41. [Google Scholar] [CrossRef] [PubMed] [Green Version]
- Yadav, A.M.; Chaurasia, R.C.; Suresh, N.; Gajbhiye, P. Application of artificial neural networks and response surface methodology approaches for the prediction of oil agglomeration process. Fuel 2018, 220, 826–836. [Google Scholar] [CrossRef]
- Hallinan, S.J. Computational Intelligence in the Design of Synthetic Microbial Genetic Systems; Harwood, C., Wipat, A., Eds.; Elsevier: Amsterdam, The Netherlands, 2013; Volume 40, pp. 1–37. ISBN 978-0-1241-7029-2. [Google Scholar]
- Young, W.A., II; Bihl, T.J.; Weckman, G.R. Artificial Neural Networks for Business Analytics. Encycl. Bus. Anal. Optim. 2014, 40, 193–208. [Google Scholar] [CrossRef] [Green Version]
- Kim, J.; Hong, J.; Park, H. Prospects of deep learning for medical imaging. Precis. Future Med. 2018, 2, 37–52. [Google Scholar] [CrossRef]
- Suthaharan, S. A cognitive random forest: An intra- and intercognitive computing for big data classification under cune condition. Handb. Stat. 2016, 35, 207–227. [Google Scholar] [CrossRef]
- Sarica, A.; Cerasa, A.; Quattrone, A. Random forest algorithm for the classification of neuroimaging data in Alzheimer’s disease: A systematic review. Front. Aging Neurosci. 2017, 9, 329. [Google Scholar] [CrossRef]
- Kulkarni, A.; Chong, D.; Batarseh, F.A. Foundations of Data Imbalance and Solutions for a Data Democracy; Batarseh, F.A., Yang, R., Eds.; Academic Press: Cambridge, MA, USA, 2020; pp. 83–106. ISBN 978-0-1281-8366-3. [Google Scholar]
- Leonard, L.C. Web-based behavioral modeling for continuous user authentication (CUA). Adv. Comput. 2017, 105, 1–44. [Google Scholar] [CrossRef]
- Sun, J.; Li, H.; Fujita, H.; Fu, B.; Ai, W. Class-imbalanced dynamic financial distress prediction based on adaboost-SVM ensemble combined with SMOTE and time weighting. Inf. Fusion 2020, 54, 128–144. [Google Scholar] [CrossRef]
- Zhang, K.; Su, H.; Dou, Y. Beyond AP: A new evaluation index for multiclass classification task accuracy. Appl. Intell. 2021, 51, 7166–7176. [Google Scholar] [CrossRef]
- Hanley, J.A.; McNeil, B.J. The meaning and use of the area under a receiver operating characteristic (ROC) curve. Radiology 1982, 143, 29–36. [Google Scholar] [CrossRef] [PubMed] [Green Version]
- Fawcett, T. An introduction to ROC analysis. Pattern Recognit. Lett. 2006, 27, 861–874. [Google Scholar] [CrossRef]
- Ruiz, E.; Nieto, F.H. A note on linear combination of predictors. Stat. Probab. Lett. 2000, 47, 351–356. [Google Scholar] [CrossRef]
- Saidane, O.; Mahmoud, I.; Gafsi, L.; Houda, A.; Tekaya, R.; Abdelmoula, L. Factors leading to work absenteeism in Tunisian ankylosing spondylitis patients. Egypt. Rheumatol. 2017, 40, 183–185. [Google Scholar] [CrossRef]
- Baun, W.B.; Bernacki, E.J.; Tsai, S.P. A Preliminary Investigation: Effect of a Corporate Fitness Program on Absenteeism and Health Care Cost. J. Occup. Med. 1986, 28, 18–22. [Google Scholar] [CrossRef]
- Dula, T.; Abara, G.; Reddy, P.A.K. The Assessment of Causes and Consequences of Medical Staff Absenteeism and Turnover in Arba Minch General Hospital. J. Health Med. Nurs. 2018, 57, 64–71. [Google Scholar]
- Luque, A.; Carrasco, A.; Martin, A.; Heras, A. The impact of class imbalance in classification performance metrics based on the binary confusion matrix. Pattern Recognit. 2019, 91, 216–231. [Google Scholar] [CrossRef]
- Johnson, J.M.; Khoshgoftaar, T.M. Survey on deep learning with class imbalance. J. Big Data 2019, 6, 27. [Google Scholar] [CrossRef]
- Shah, S.A.A.; Uddin, I.; Aziz, F.; Ahmad, S.; Al-Khasawneh, M.A.; Sharaf, M. An enhanced deep neural network for predicting workplace absenteeism. Complexity 2020, 2020, 5843932. [Google Scholar] [CrossRef] [Green Version]
| Publisher’s Note: MDPI stays neutral with regard to jurisdictional claims in published maps and institutional affiliations. |
© 2022 by the authors. Licensee MDPI, Basel, Switzerland. This article is an open access article distributed under the terms and conditions of the Creative Commons Attribution (CC BY) license (https://creativecommons.org/licenses/by/4.0/).


 ,
, 


