1. Introduction
Today, during the fourth industrial revolution, also known as Industry 4.0, closely linked with the Internet of Things (IoT) forming its core, more and more data are being produced, collected, processed and analyzed [
1]. These data, which may be critical for decision-making, forecasting, marketing-related competition etc., are exposed to constant dangers. The data are not only a lucrative target for criminals, but they are also of high desirability in industrial espionage specialized in the tapping and manipulating of company data [
2]. However, the threats to companies and research institutions are complex. Therefore, the protection of these data is an essential factor not only for IT departments but for the whole entity, i.e., a company or research institution. In particular, security goals of protecting against unauthorized access and data manipulation are essential for all organizations. These and other security objectives are often endangered by breaches of the facility’s IT infrastructure. Therefore, the main objective of each security department is to prevent intrusion into the IT infrastructure.
Employees of organizations are in constant contact with the respective systems—they work with them and are generally the most important source of added value in organizations. However, at the same time, they are a great threat to data and systems they deal with. The use of weak passwords, unsafe and/or insecure hardware and software, unthought-through behavior, etc., are the most common sources of IT security problems. Therefore, people, as the central interface of the IT systems of an organization, are potentially also the greatest risk and even threat. In order to improve IT security of organizations, all people involved should, and even must, be aware of the potential dangers in advance.
Today, the term of big data in our perception is typically related to data management, i.e., the production or collection of data and their further use, with potential derivation of benefit from their reuse. However, in addition to a variety of value-adding analyses, big data technologies can also be used for safety-related calculations/activities [
3]. In general, the term big data refers to valuable, complex and poorly structured and/or fast-changing data sets, particularly in the corporate environment [
4]. More precisely, big data is typically described as data compliant with an nV set of properties, where n is the number of those properties, which can vary. Models 3V and 5V are generally accepted and widely used, and they describe big data with a set of features, such as volume, velocity, variety, veracity and value. They are also characterized by multifaceted interpretation, where big data covers different areas, such as technologies, analytical methods, modeling and design processes, commercial concepts and legal frameworks [
5].
Big data analytics is perhaps one of the most obvious big data-related areas of research, attracting both practitioners and researchers. Their advantages are widely recognized in different areas. Furthermore, big data, and more precisely big data analytics techniques, are also seen as a tool to help in crisis management and combating epidemics and pandemics, such as the current COVID-19 pandemic, and are characterized by a great capacity to predict, map, track, monitor and raise awareness of these emergencies. Here, one of the recent studies [
6,
7] found that the main sources of data come from social media and internet search engines. This applies to both the identification of first “signs” of emergency, as the first news of COVID-19 was found in Twitter messages, and combating it. The latter relates to the most common techniques for analyzing these data, which involve the use of statistics, such as correlation and regression, combined with other techniques, which can potentially (and have already proved to be such) play a key role in combating the emergency and crisis management, allowing for a variety of studies and experiments that have not been conceived until now. This makes big data very attractive to health and (bio)medical areas.
However, big data storage is also known for its lower level of data protection and considerably higher interest from attackers [
8]. More precisely, NoSQL databases often have a large number of data leaks.
Due to the importance of security and the potential of big data with respect to this issue, our paper aims to develop a prototype to improve the security of IT systems by means of big data analysis methods. The prototype focuses on the systematic detection of threats and attacks on data, using machine learning (ML) with the help of big data technologies. In particular, the open-source big data analysis framework Apache Spark is used to develop an intrusion detection system. It is not a secret that current security information and event management systems (SIEM) already sometimes use big data analytics technologies [
9]. Using these multidimensional security analyses, organizations can automatically define the “normal state” of their data or network, thereby comparing individual actions with this “base” and thus recognizing potential risks and threats. Thus, we explore and demonstrate the capabilities provided by Apache products and services and draw conclusions on their appropriateness for pattern-based analyses utilizing unsupervised machine learning aimed at improving protection of databases in use. This is conducted on the basis of covering these approaches and presenting the prototype developed based on them. This is followed by the validation of the tool by applying it to the real systems and assessing the results.
To meet these aims, the paper is structured as follows:
Section 2 refers to the background and provides the reader with the general understanding on the topic;
Section 3 covers materials and methods used;
Section 4 provides description of the solution provided; while
Section 5 and
Section 6 provide discussion and results.
3. Materials and Methods: Big Data Approach with Apache Spark and MLlib
Apache Spark is an open-source big data analysis framework that allows computing of huge amounts of data [
21]. Spark is able to process databases that are distributed across a large number of machines. This project was launched in 2010 at the University of California, Berkeley, and became an Apache project in 2013. Since then, Spark has proliferated and evolved immensely. In the meantime, Apache Spark has developed into a de facto open-source standard in the big data world and is traded as a successor to Apache Hadoop MapReduce technology, mainly due to its outstanding processing speed [
22]. With advanced resource management and resource utilization (such as in-memory computing), Apache Spark enables this world-class speed. In addition, it can also be easily integrated into existing Apache Hadoop systems; for example, native support for the Hadoop Distributed File System (HDFS) is built into Spark [
23].
Another benefit and key for success of the Spark framework is the fact that it provides interface to a variety of programing languages, including Java, Python and R, while Apache Spark itself has been developed in Scala. Therefore, for pragmatic reasons, the source code of the prototype proposed in this study has also been developed in Scala. In addition, the Scala programing language offers a variety of contemporary and easy-to-implement concepts, such as optional parameters, immutable objects, pattern-based searches, etc. In particular, anonymous functions are widespread in Scala and are also widely used in this work. Scala programs—and thus Spark—are compiled in Java bytecode and executed in the Java Runtime Environment.
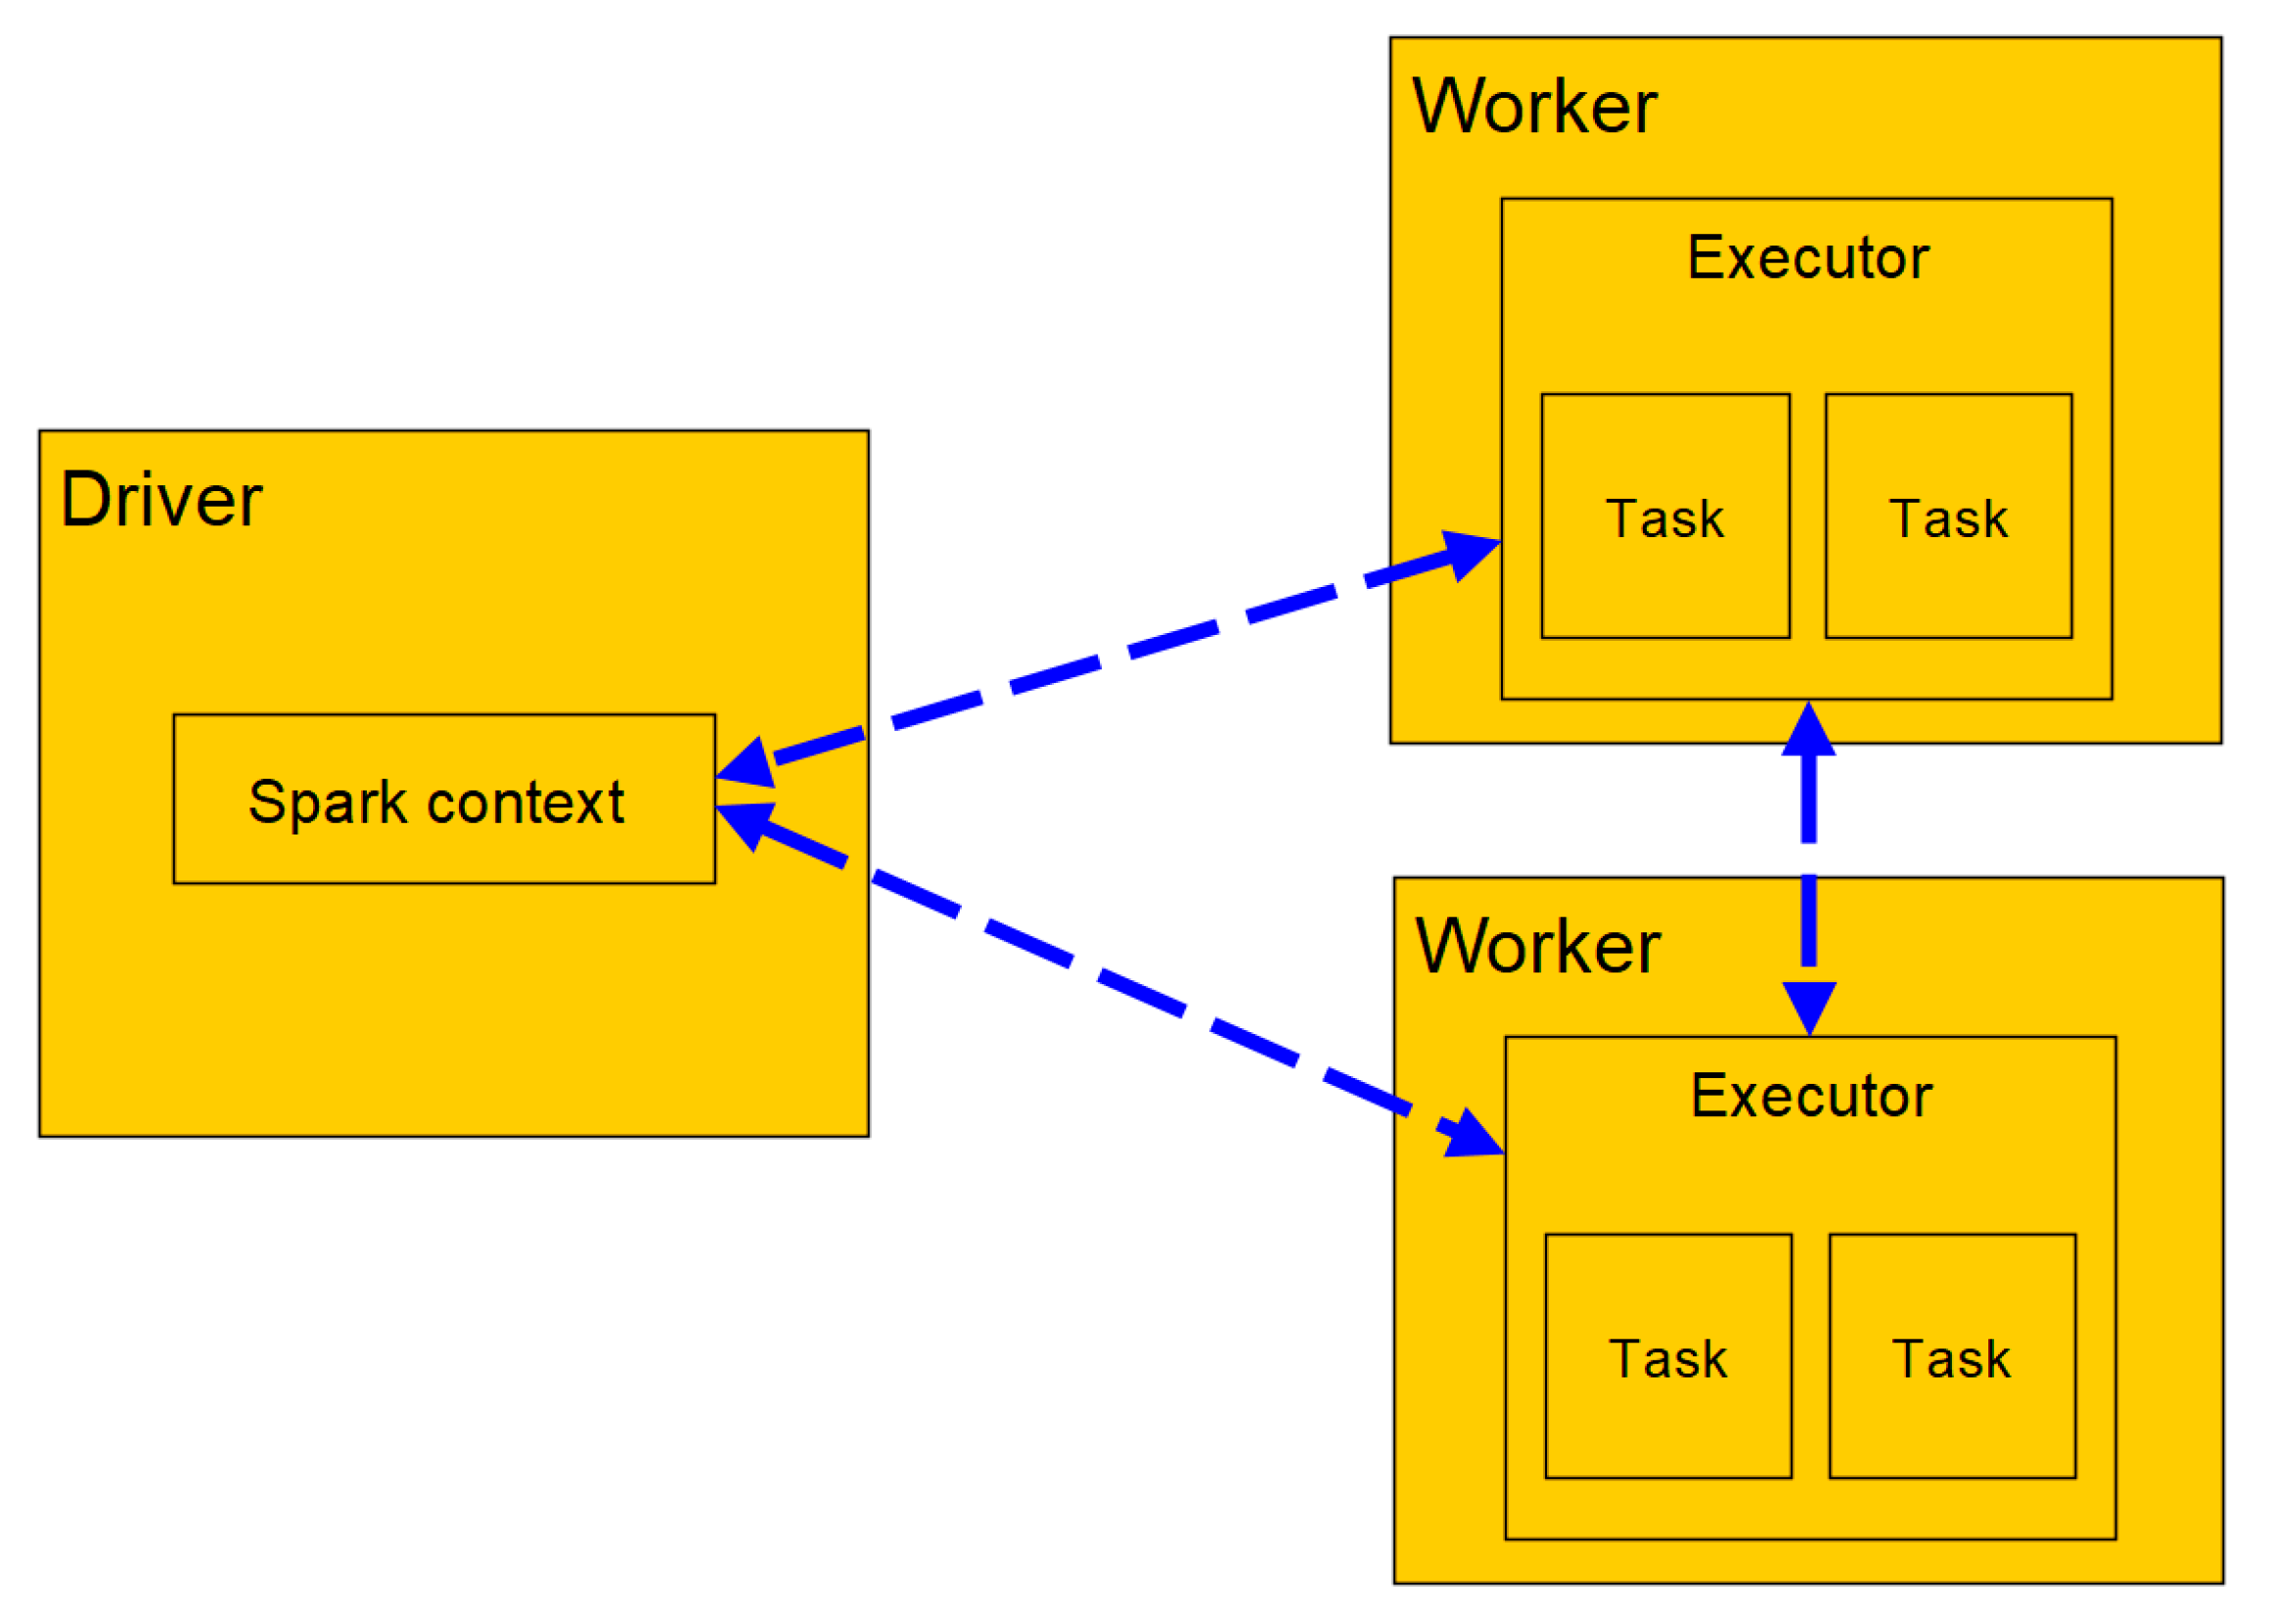
Each Spark application consists of a driver program that starts and manages various parallel operations on a computer network. The driver includes the main function and defines data records distributed by the SparkContext instance, on which arithmetic operations are then carried out. These operations are divided into individual tasks and are processed by executors on nodes in the computer network.
Figure 1 shows general relationships of the components for the distributed execution in Spark.
An essential core element and one of the most fundamental data structures of Spark is the Resilient Distributed Dataset (RDD) [
24]. This is an abstraction of a database that is partitioned and therefore redistributable over a computer network. All data, e.g., data from log files or network streams, are converted to a generic RDD, which in turn is used by Spark as a processing medium. This layer of abstraction allows developers to keep data in the cluster node’s memory during their processing. In this way, the costs of recalculating or outsourcing to slow data carriers can be avoided in the subsequent analysis. Thus, Spark can be considered sufficiently flexible and fault tolerant. For example, computer network node’s failures or memory bottlenecks are automatically recognized during calculation and treated with different strategies without interrupting processing [
25].
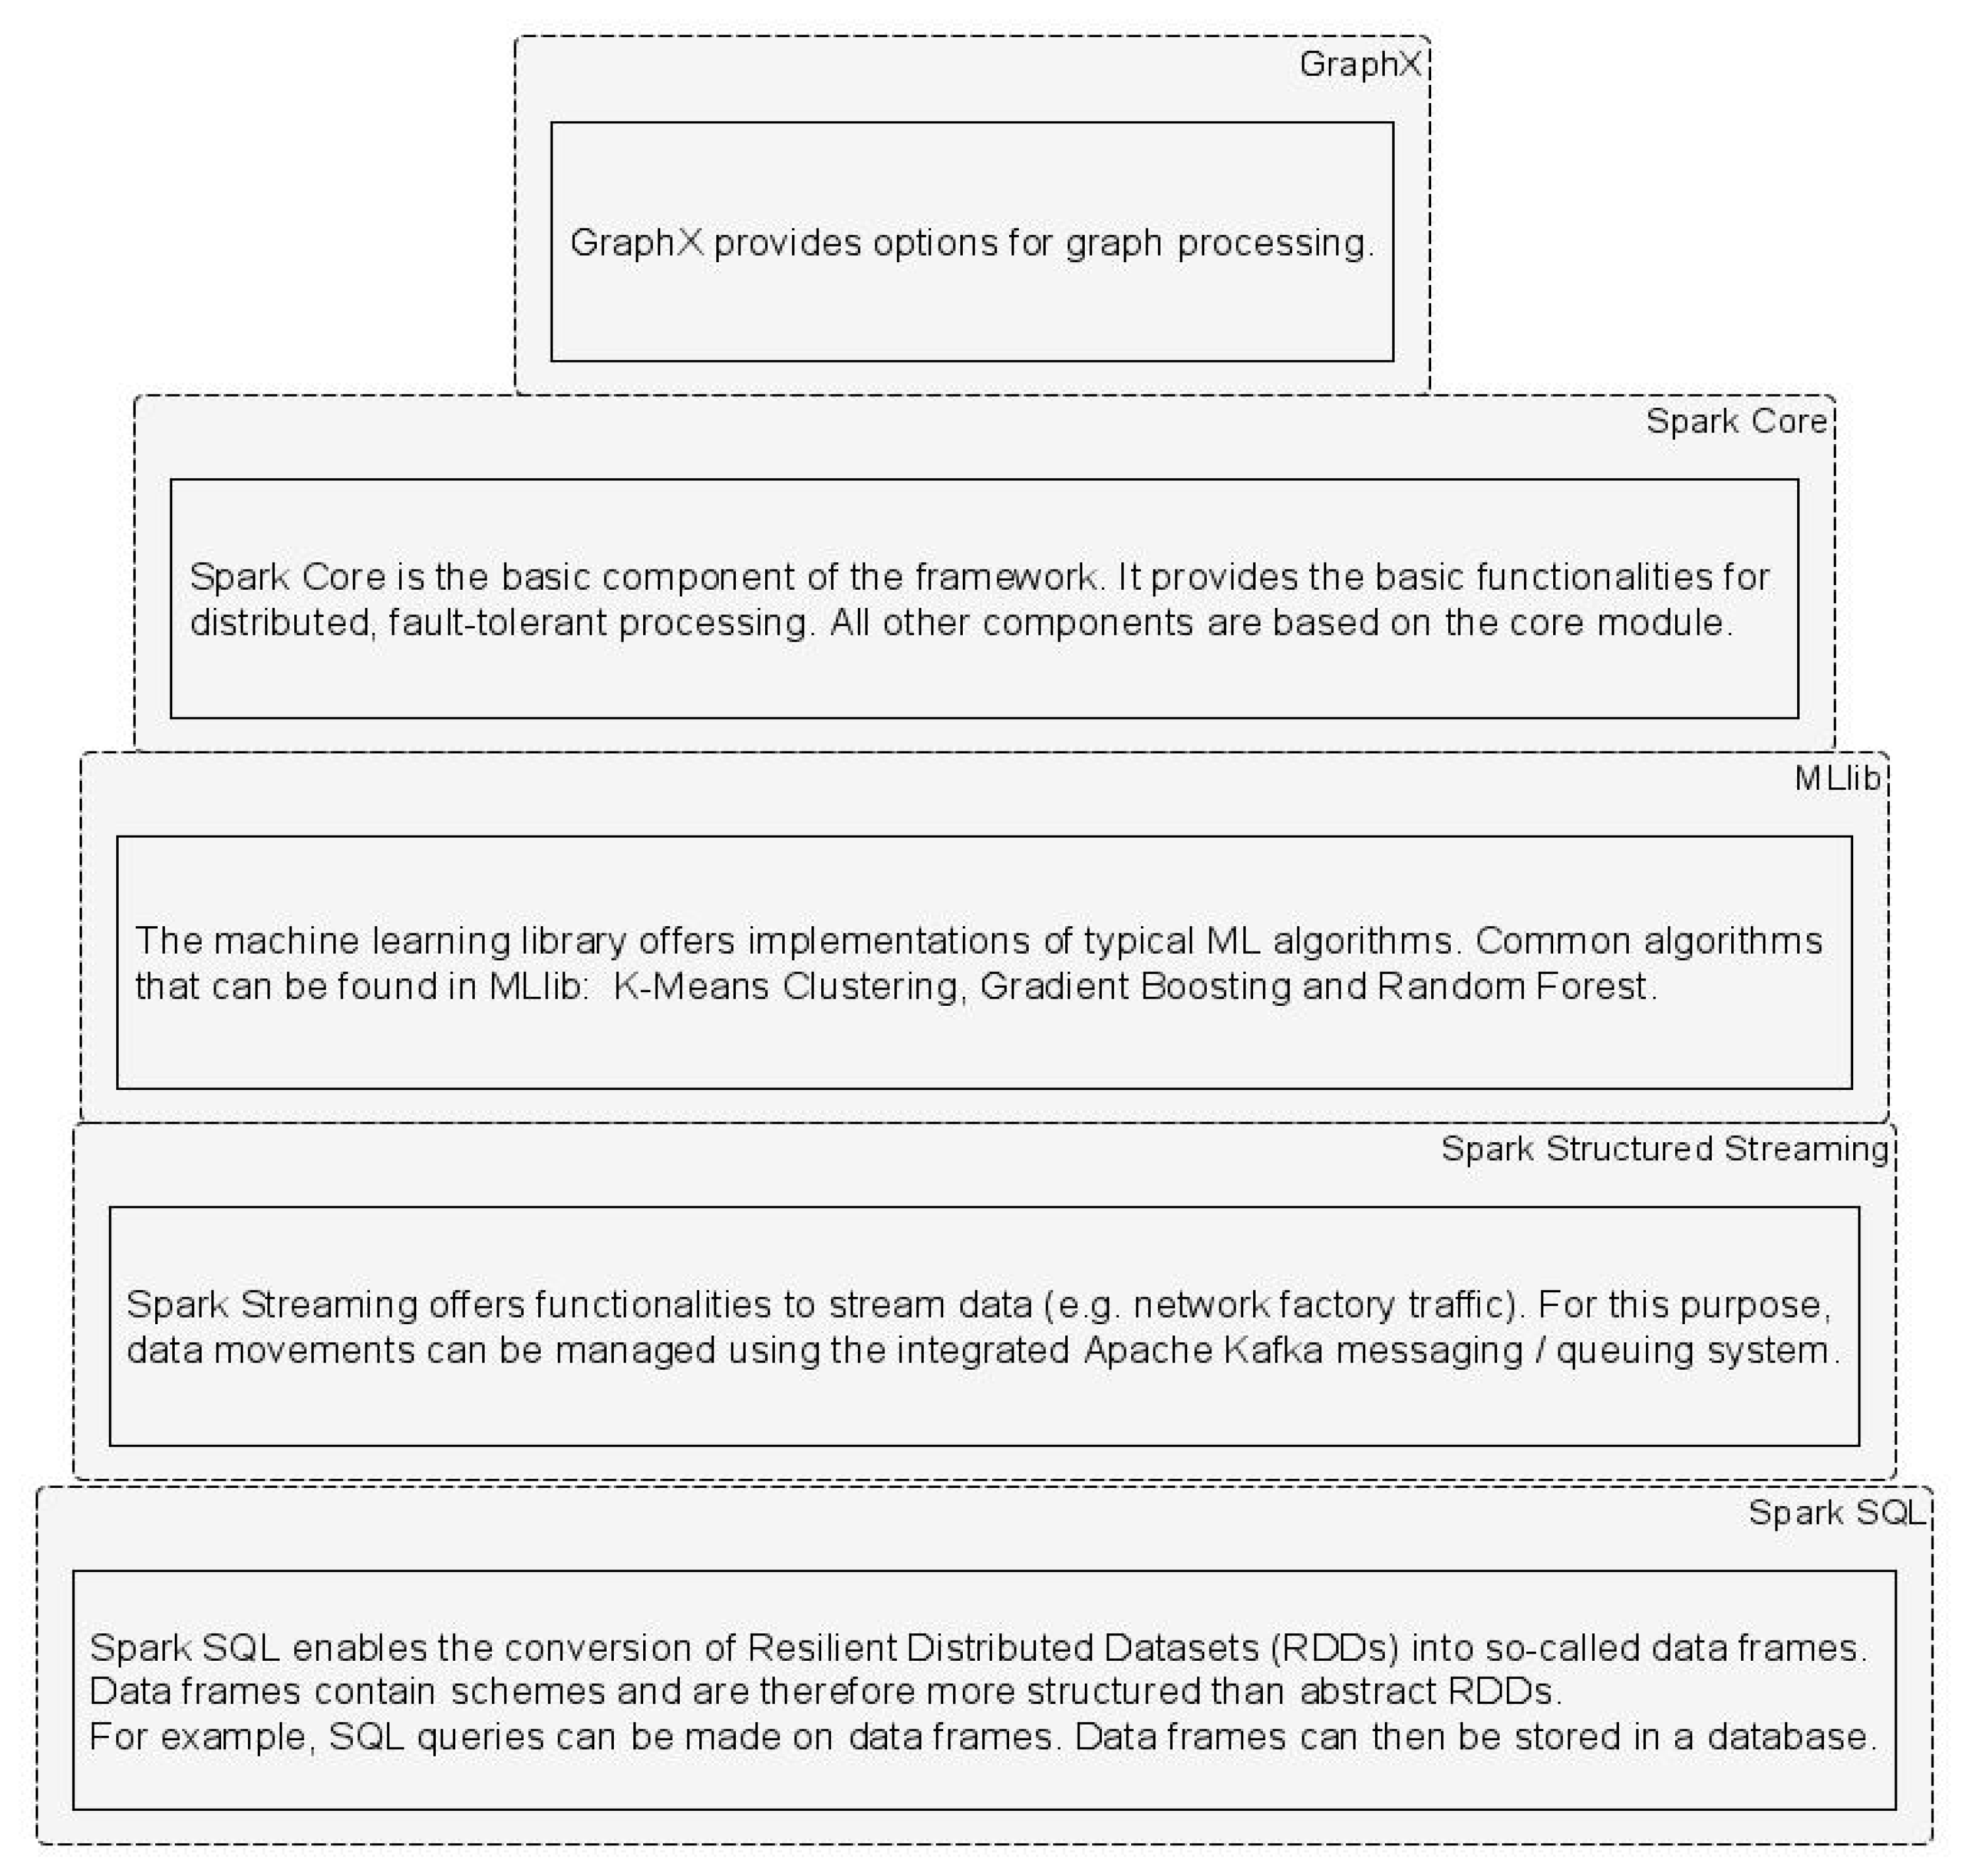
Another component recognized as important and beneficial for developers is Spark Machine Learning Library (MLlib). MLlib is a machine learning (ML) library optimized for use in a cluster [
26]. MLlib aims to implement ML algorithms and techniques in a scalable and simple manner in Spark applications [
27]. It has many pre-implemented ML algorithms, including classification, regression, clustering and others, to be re-used in developed Spark applications. Generally, the Spark Framework consists of five components, as shown in
Figure 2. In light of the objectives of our paper, we are focusing and further using Spark Core and MLlib.
In computer science, machine learning (ML) is known as the sub-discipline of the generation of synthetic/artificial knowledge from data. The artificial knowledge gained allows the ML systems to make certain predictions. There are various ML algorithms that, once learned, are able to distinguish between normal/ordinary and uncommon data. If it is known in a data record or set which entries are considered “normal”, and the system is informed that training can take place, for example in the form of a flag, this is called “supervised learning”. The used algorithm is assigned to work in a specific predefined manner, based on known input and output data. This process is also known as training in the context of ML. Statistical classification methods are mainly used in this form of machine learning. With this method, the algorithm is able to develop decision trees to be able to prepare predictions for new data with similar patterns by means of regression analysis. Most algorithms that make predictions are based on classification and regression.
At the same time, there are data sets for which it is previously not known which data should be considered normal or ordinary. For example, if new types of attack attempts are identified in the data, attack patterns may not be known. In this case, it is not possible to apply classification in advance. The system should rather use input data to identify independently which patterns are represented in a data record and thus evaluate which data do not match these patterns. “Unsupervised learning” can be a solution to these kinds of problems. In other words, unsupervised learning techniques are not trained on the basis of defined target data, as they are not available during the learning process. Rather, unsupervised learning algorithms capture structures in data and find groups of similar inputs or determine and learn which types of inputs might occur and which might not. Thus, in light of this, the intrusion detection system to be developed will be developed on the basis of unsupervised learning, by using the k-means clustering method implemented in MLlib from Spark.
The k-means clustering method is probably the best-researched and most widely used method of unsupervised learning. In this context, the term “cluster” should not be confused with the computer network. Cluster analysis tends to identify similarities in structures in large databases, where object groups or records that are structurally similar are called clusters. Clusters created from input data can then be used to compare new or unknown data with existing clusters. If the data to be checked exceeds a certain distance from the given clusters, i.e., the threshold value for the distance to existing clusters is exceeded, this data is referred to as an anomaly.
4. Results: Prototype of Apache Spark and MLlib-Based Intrusion Detection System from A to Z
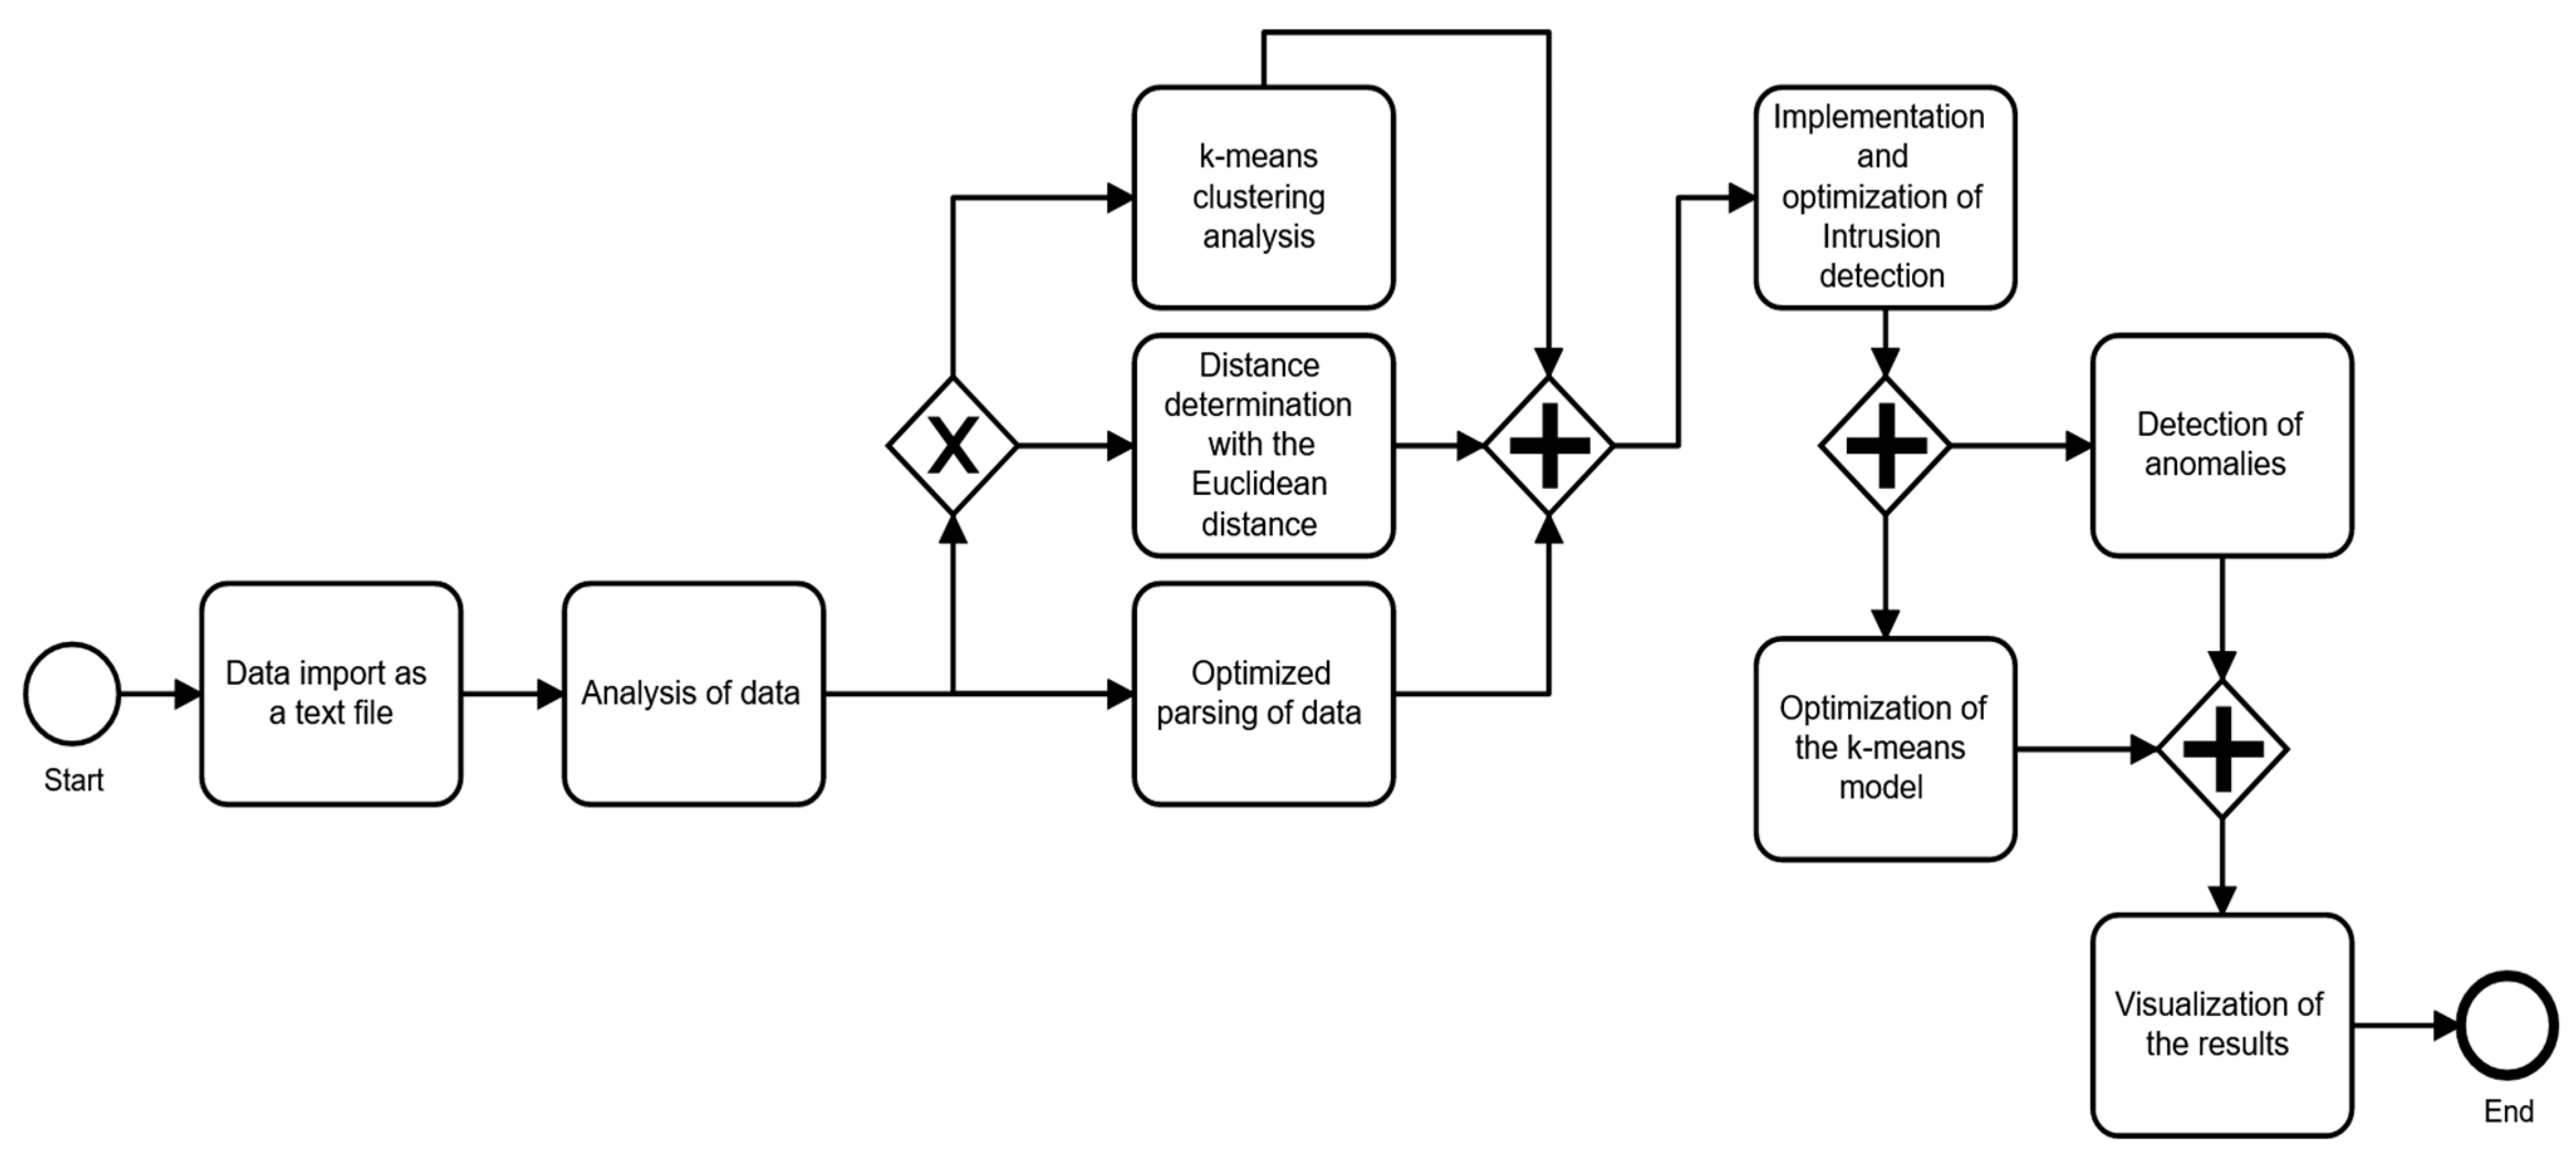
In contrast to signature-based IDS solutions that prevail in the market, the prototype solution developed in this article is based on machine learning with the help of the big data cluster framework Apache Spark.
Figure 3 shows a system framework diagram modeled in Business Process Model and Notation (BPMN) to understand the overall image of the actions performed in the system. In short, the developed system should be able to determine from the data set used, which parts of the data set are to be classified as harmless or regular, and which are conspicuous or irregular, and can quickly identify anomalies in the data. The k-means algorithm is used for cluster analysis, which is implemented in the Sparks MLlib component. The anomalies can be intentional or involuntary. The premeditated ones are malicious, and it is important to identify and discover them. The causes of anomalies vary, and if the anomaly was alerted in the solution, clustering techniques are used to perform the action that ML algorithms, such as K-means, use to divide data into groups. Instances far from all groups are identified as outliers.
For the purposes of our experiments, we have created a database, in which we have created our own computer network for Spark and Hadoop applications. The cluster consists of a total of 24 processors and is equipped with 96 gigabytes of RAM. Spark version 1.3 is installed on the cluster. The database is available as a text file researchdatacup.data, which part is made available at
https://github.com/OtmaneAzeroualDZHW/IDS-prototype/blob/main/researchdatacup.data (accessed on 20 December 2022). It is over 700 megabytes and consists of almost five million data records. Each data record consists of 42 attributes, with one data record per line, separated by commas (in a CSV-like format). The database used is sufficient both for building a rapid prototyping and as a big data example, since processing this database requires a large number of gigabytes of RAM. For this reason, a large part of the calculations was carried out within the computer cluster. In addition, feature names and feature types are listed in a further text file (researchdatacup.names). Interestingly, the organizers of the research data cup identified the type of connection or attack in each data set. There are labels such as buffer_overflow, smurf or normal. This marking could serve as a target definition of a supervised learning method. However, the main focus of the prototype under development is on detecting anomalies and potentially unknown attacks. Therefore, a method of independent, unsupervised learning is used, and the characteristics of the type of attack are deliberately ignored for actual processing. In the course of this paper, it will also be found that some connections in the database are considered normal and are marked as such, but they represent anomalies in the sense of the analysis and are therefore to be classified as potentially dangerous.
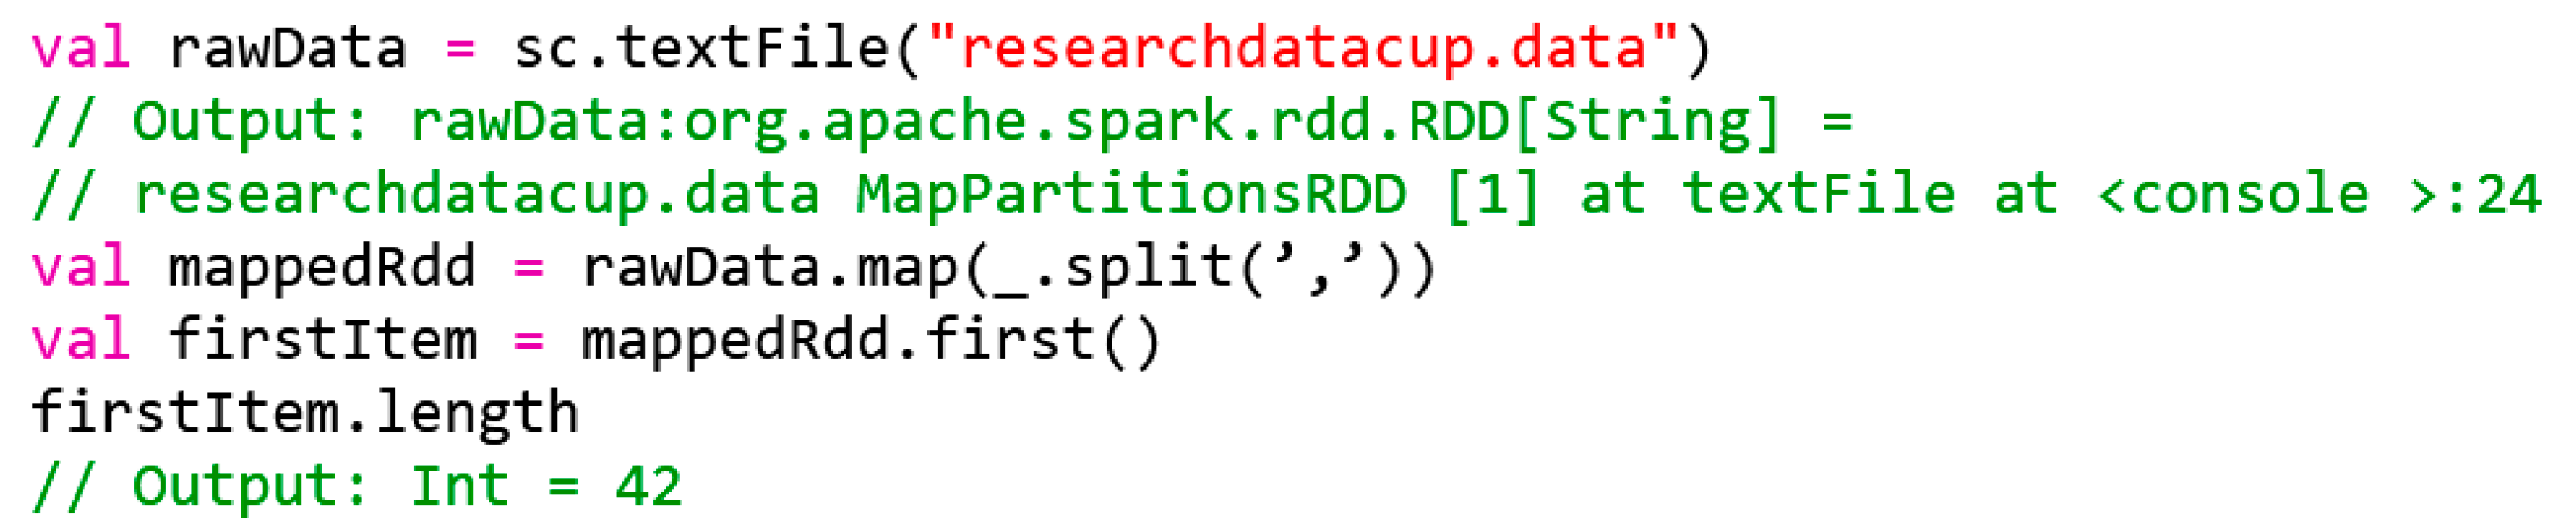
In almost all cases of analysis, it is necessary to adapt the input data to a certain extent, so that the analysis system can process these data adequately. This process is called transformation. Therefore, the first step of any analysis is to review the data. For this purpose, we have used the Spark Shell, which offers a convenient tool for quick initial database analysis. It initializes the Spark context, which is essential for calculations (instance of the
SparkContext class). In the following examples, the Spark Framework should be equipped with at least eight gigabytes of RAM. Therefore, Spark Shell is used on a Unix-like operating system with a parameter—
driver-memory 8 g. Once the Spark context (identified in the following by the variable
sc) is available, the data record may be read into an RDD (see
Figure 4).
In the first line of the code provided in
Figure 4, the data record is read in as RDD and in the unchangeable variable
rawData, while line four transforms an array of strings of each comma-separated data record. The
map() function of the RDD class is used here, which expects a function that is applied to each data record as a parameter. It should be noted that the mapped variable references a new RDD instance and that the
map() method has not yet processed the data. When using RDDs, there are typically two types of instructions—transformations and actions.
Transformations enrich abstract RDD with meta-information, such as how RDD should be converted. However, only if there is an action Spark performs an actual, distributed calculation on an RDD and then takes into account and optimizes the previously defined transformations. The map() is a transformation (“convert every data set using the following function”), while the first() method is an action (“return the first line of a calculated RDD”). Therefore, only when first() is called in line seven the RDD is actually transformed, and the first data record of the transformed RDD is returned.
The first data set extracted by first() reveals the TCP connection to the HTTP service. In this particular case, 215 bytes were sent, and 45,076 bytes were received. All other features are listed in the researchdatacup.names text file.
Using the length method, we can determine that the data record in firstItem consists of 42 elements (also called columns, parameters). These 42 columns will be used as 42-dimensional vector features for clustering in the following steps. It is also important to note that the elements are not only numeric, i.e., some features are represented in Boolean (as 0 or 1), some take real values between 0 and 1, while others are symbolic (e.g., tcp).
As we have briefly mentioned above,
map() expects a definition of the function. Here, we use a method provided in line four of the code provided in
Figure 1, where the shortened notation for the definition of the
map() is given. Such a notation is possible due to the flexible Scala syntax and combines the concepts of anonymous functions and an implied parameter (_). Both concepts are widespread in the Scala world and can save a lot of programing code—but mostly at the expense of legibility. The fourth line corresponds to the call provided in the code shown in
Figure 5.
In the code of
Figure 5, an anonymous function is transferred to
map() (line = >line.split(‘,’)). The underscore in the code available in
Figure 1, line four, on the other hand, is implicitly interpreted by Scala as a line parameter and thus, in turn, shortens the long form of the anonymous function.
In the database analysis, data records were transformed into the RDD, separated by commas. However, this is not enough to process the data in a meaningful way, i.e., symbolic features must be converted into numeric ones. The reason for this is that the later calculation of the distances between feature values and clusters can only be performed using numerical values. For this reason, the parsing of the data records must be optimized by encoding categorical (symbolic) features into numerical ones. For example, to find out which symbolic values the
protocol_type feature assumes, the following Spark statement available in
Figure 6 can be used.
The expression _.split(‘,’)(1) splits as before using a comma and takes only the second column (index (1)), while the countByValue() action counts all occurrences. It can be seen here that protocol_type takes on the values Transmission Control Protocol (TCP), User Datagram Protocol (UDP) and Internet Control Message Protocol (ICMP). One-hot coding is used here to numerically represent these characteristic values. Due to the one-hot coding, each categorical characteristic takes on n possible numerical characteristics, with a value for each placeholder of 0 or 1. In the case of the log type or data type, the feature may have three different values, hence n = 3. For example, if a data record has a TCP log type, the one-hot representation is “1,0,0”—analogously “0,1,0” for UDP and “0,0,1” for ICMP. Features two through four are categorical; they are transformed into one-hot. It should be noted that in order to do this, all possible value options need to be known beforehand.
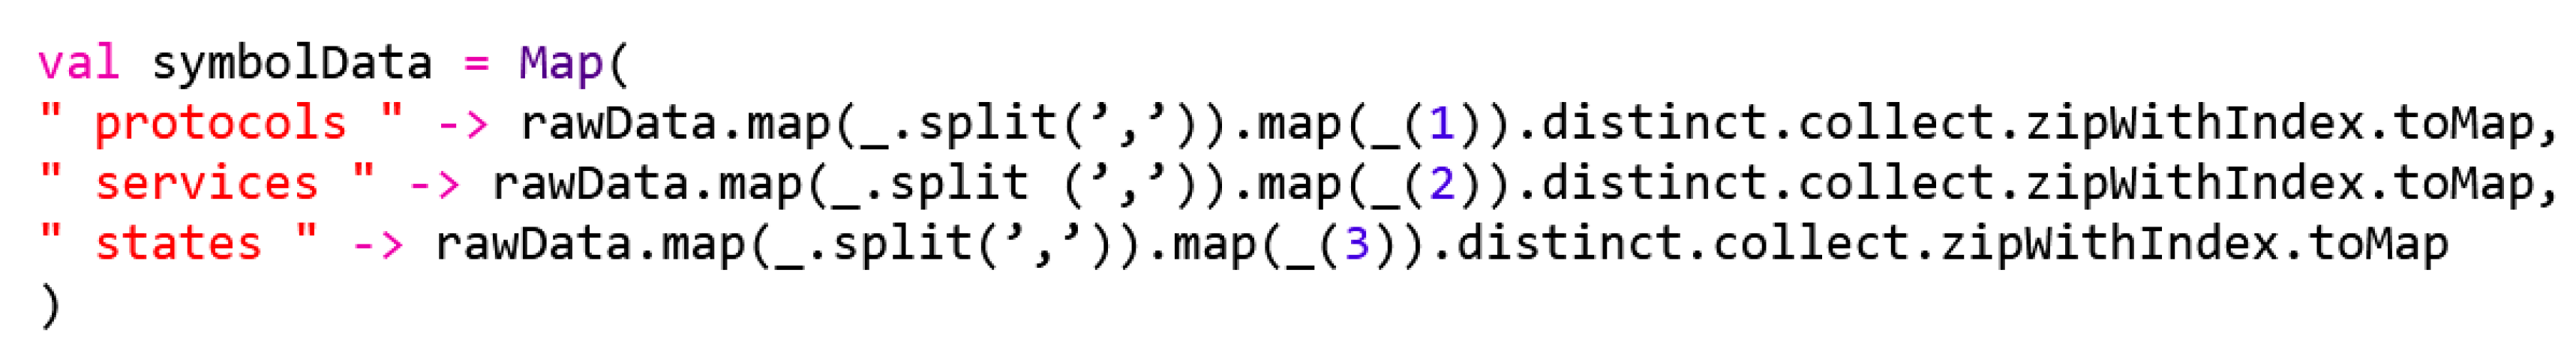
After the calculation performed by Spark, the
symbolData variable references an instance of the Map type, which itself references three Map instances (see
Figure 7). In Scala, Map is an iterable collection consisting of key–value pairs (see dictionaries or hashes in other programing languages).
symbolData(“protocols”),
symbolData(“services”) and
symbolData(“states”) contain
[String, Int]-maps with all possible occurrences of value variants assigned to the index. The
distinct method returns only one-time occurrences, while
collect returns all (calculated) elements.
zipWithIndex creates a tuple with a value and an index number for each element, and
toMap converts the array to a map. A representation of
symbolData(“services”) output shows the exemplary result of the transformation. Using this information, the numerical feature vectors can then be developed.
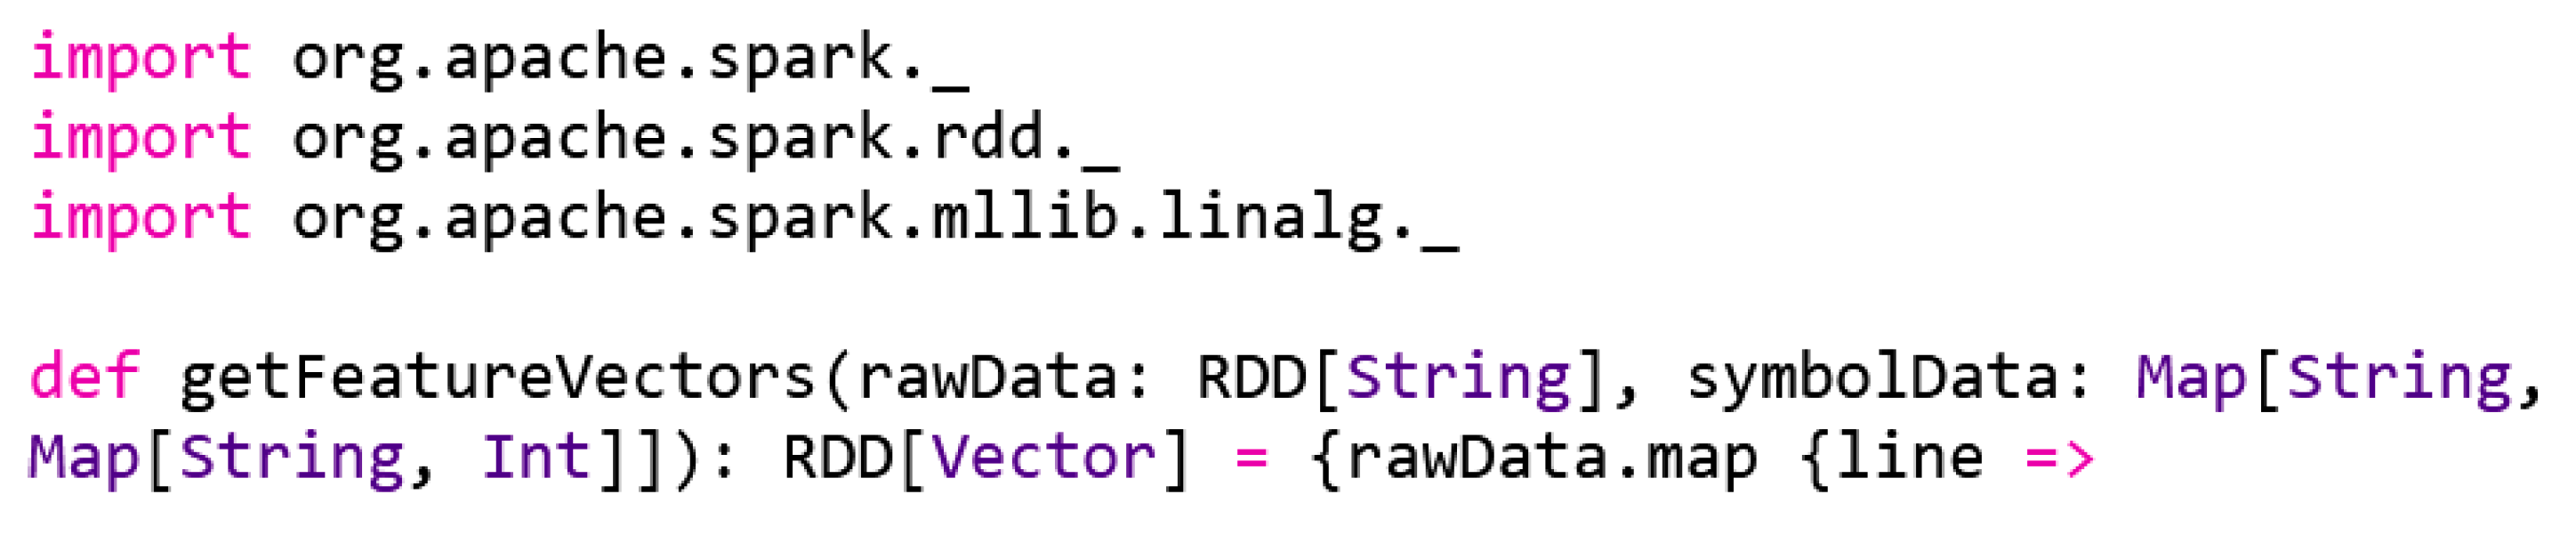
The
getFeatureVectors() function in provided in
Figure 8 transforms
rawData and the data from
symbolData into an RDD of feature vectors with exclusively numerical values. In order to increase the performance of the program,
symbolData is not recalculated every time this function is called but is instead transferred as a parameter because
symbolData can, for example, be transferred to all cluster nodes (via
sc.broadcast()) to avoid time-consuming recalculations.
It should be noted that getFeatureVectors() supplies an RDD from vector instances required for the k-means algorithm. In general, the getFeatureVectors() function parses a database from rawData together with the data from symbolData, which can be used for further processing in the form of an RDD from the feature vectors.
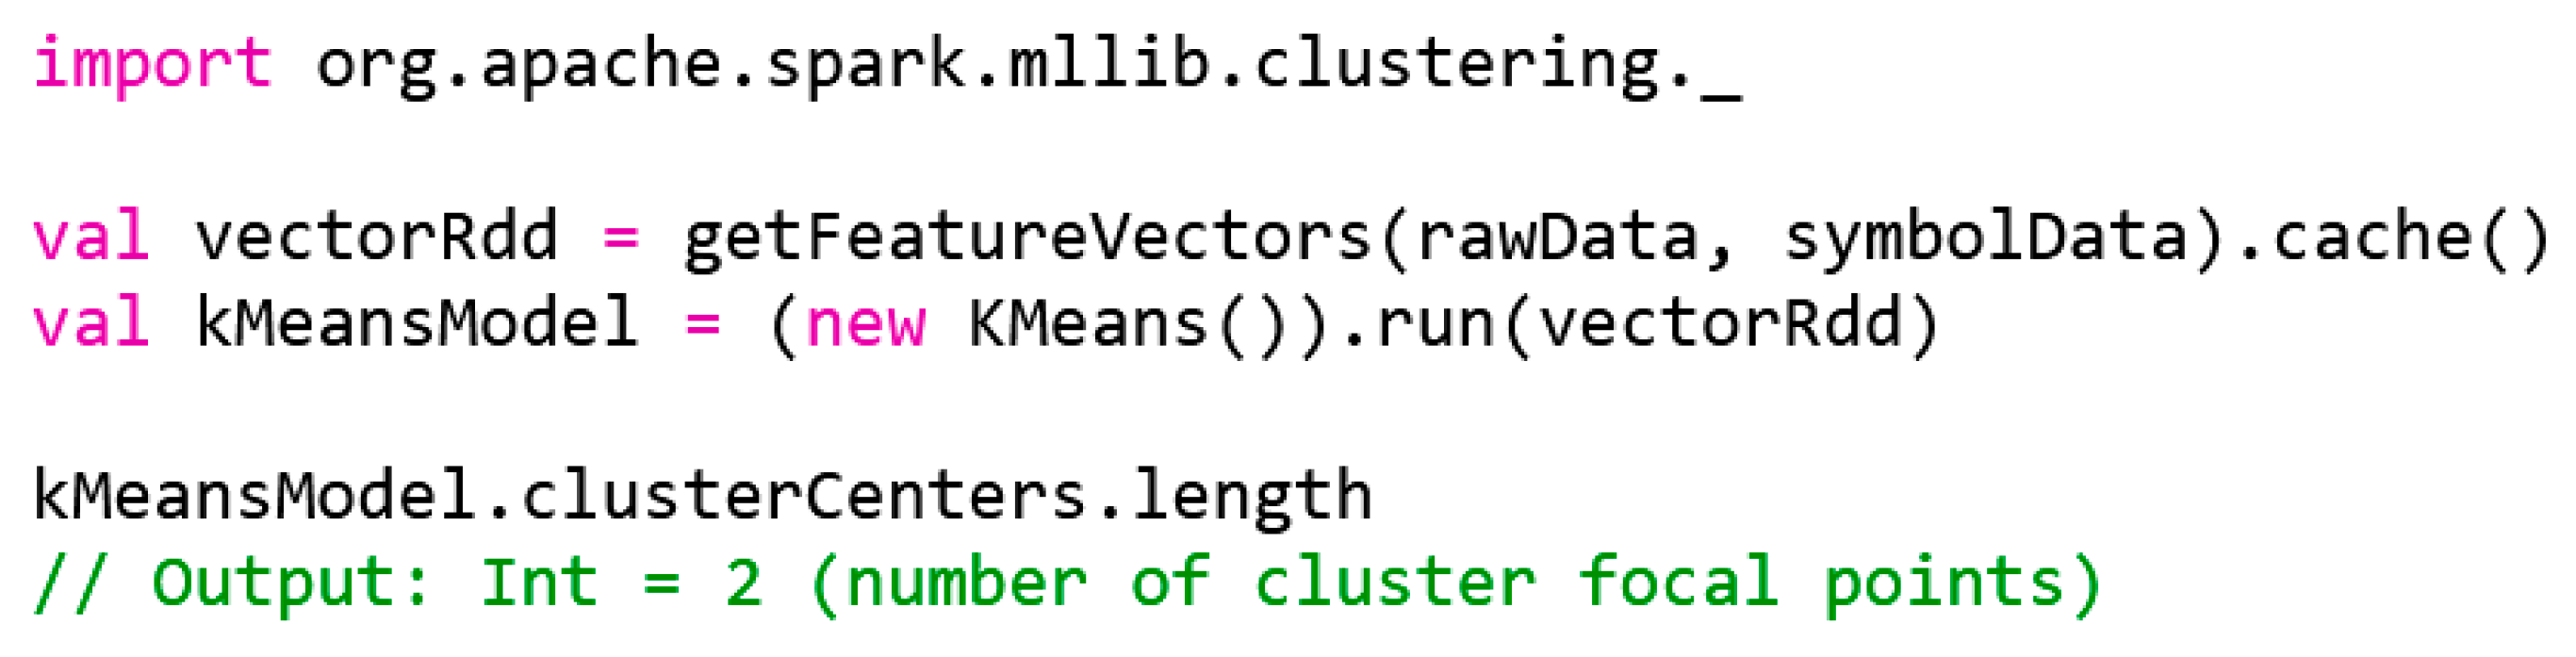
The k-means algorithm is already implemented in Apache Spark, and the first model can be created with lines of source code. The first k-means model is developed using the code provided in
Figure 9.
The RDD from feature vectors in line two (
Figure 9) is cached with the
cache() function after the first action has been carried out. This can be performance enhancing if Spark would recalculate the RDD internally in later use, for example, when calculating the k-means cluster. With
cache() the state of the RDD is explicitly recorded after the next action. In this first model,
kMeansModel, the number of clusters is k = 2. In order to achieve good results by means of k-means, it is essential to choose the value for k that is appropriate for the database. However, the number of possible connection types is significantly higher than 2, so the value for k is not yet optimal.
After the next cluster focus has been assigned to a feature vector of a data record, and the distance between these vectors has been calculated, possible attacks or intrusions may be detected. However, the k-means model used should be optimized to be able to achieve the most accurate anomaly detection possible.
Potentially suspicious data deviate from previously trained patterns. The distance between the data points of unnatural connection attempts exceeds the distance of ordinary connections—the distance threshold is exceeded. If the feature vector exceeds the threshold value, an anomaly is identified. However, the optimal threshold is determined by referring to the average distance to cluster centers (see
Figure 10).
It should be noted that distanceThreshold depends on the calculated k-means model (particularly the number of clusters, i.e., k) and can also deviate from the above-mentioned value (around 3423) with k = 2. The reason is that when the k-means model is initialized, randomly selected cluster priorities are set that are only adjusted by real values in the course of the calculation. The anomalies can now be calculated immediately.
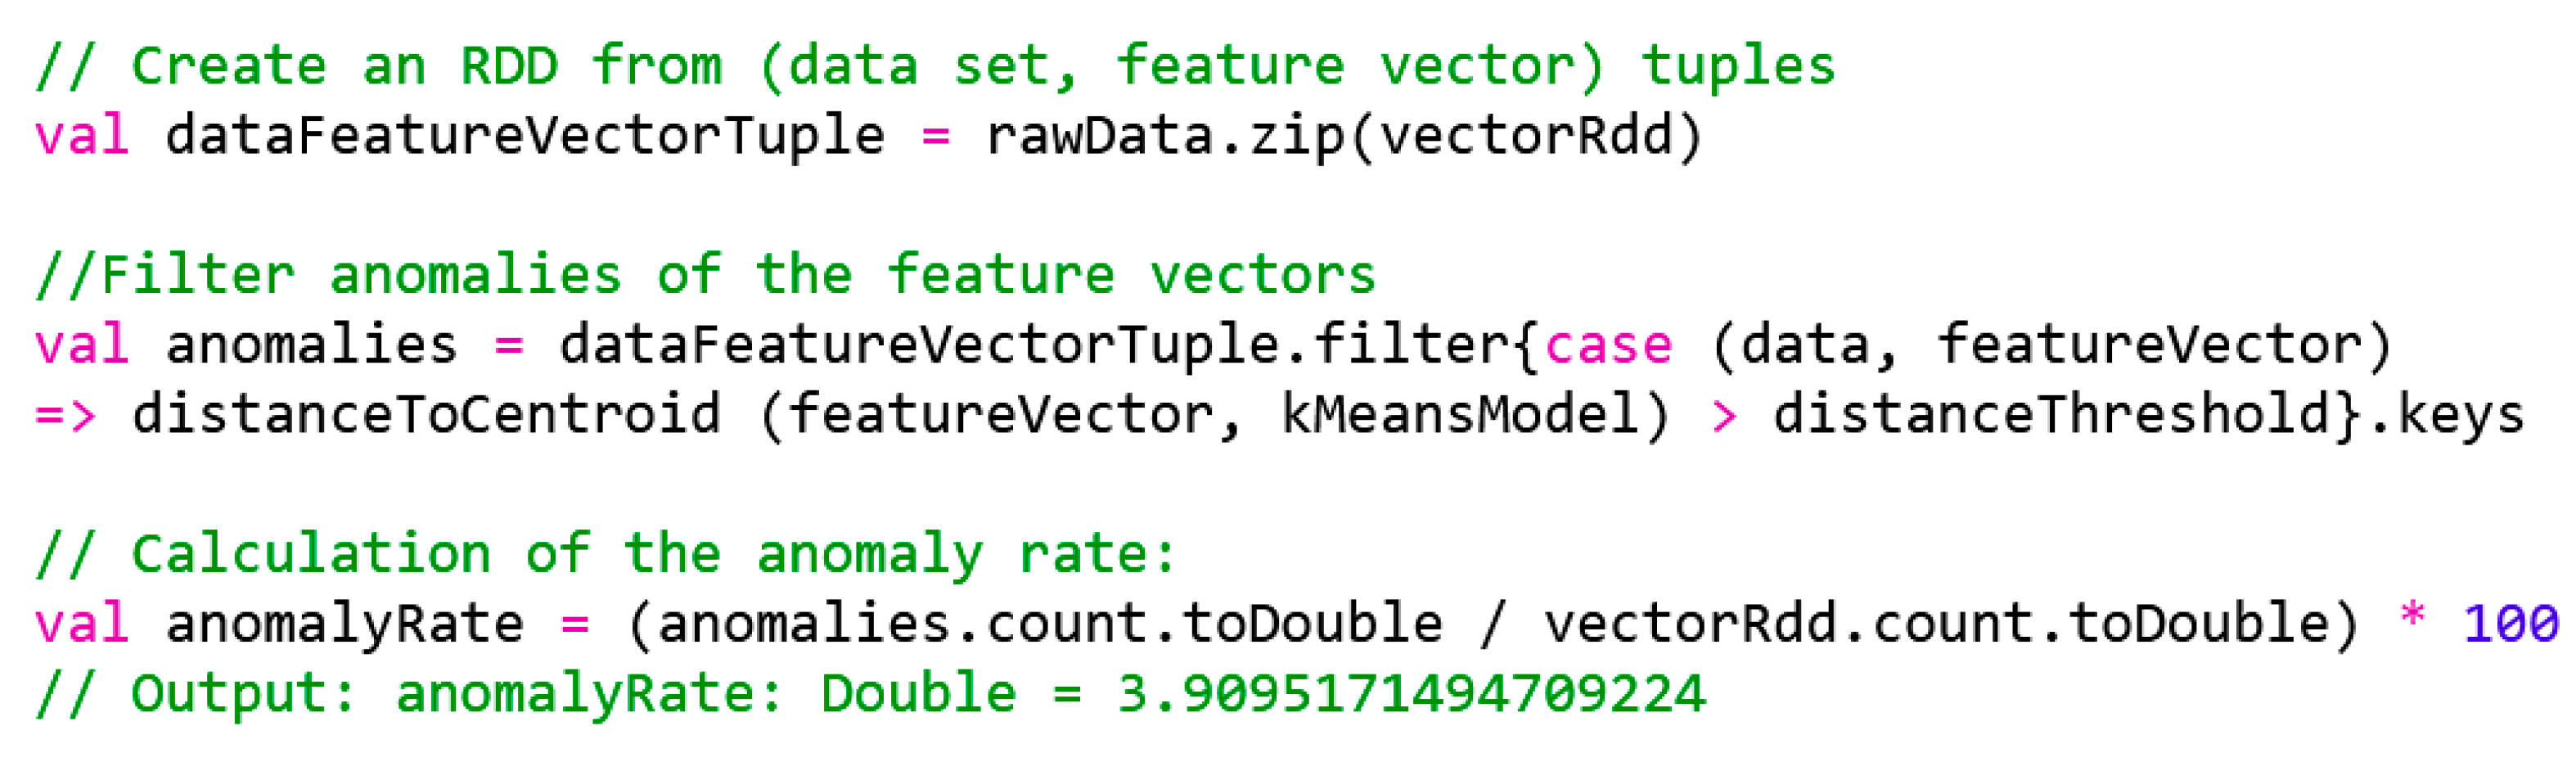
In the code provided in
Figure 11, an RDD is created with tuples of the original data records and their respective feature vectors. This RDD is then filtered using the feature vectors that exceed the distance threshold. Using Scala’s pattern-matching mechanism (case
(data, featureVector)), an RDD can be elegantly filtered from the tuples using individual tuple objects. Since we are interested in only the anomalies in original data sets, mapping ends with the keys method, which in turn discards the feature vectors of the tuple RDD. The anomaly rate is calculated as a percentage, where, on the basis of the given k-means model, around four percent (4%) of the database can be assessed as abnormal, i.e., having anomalies.
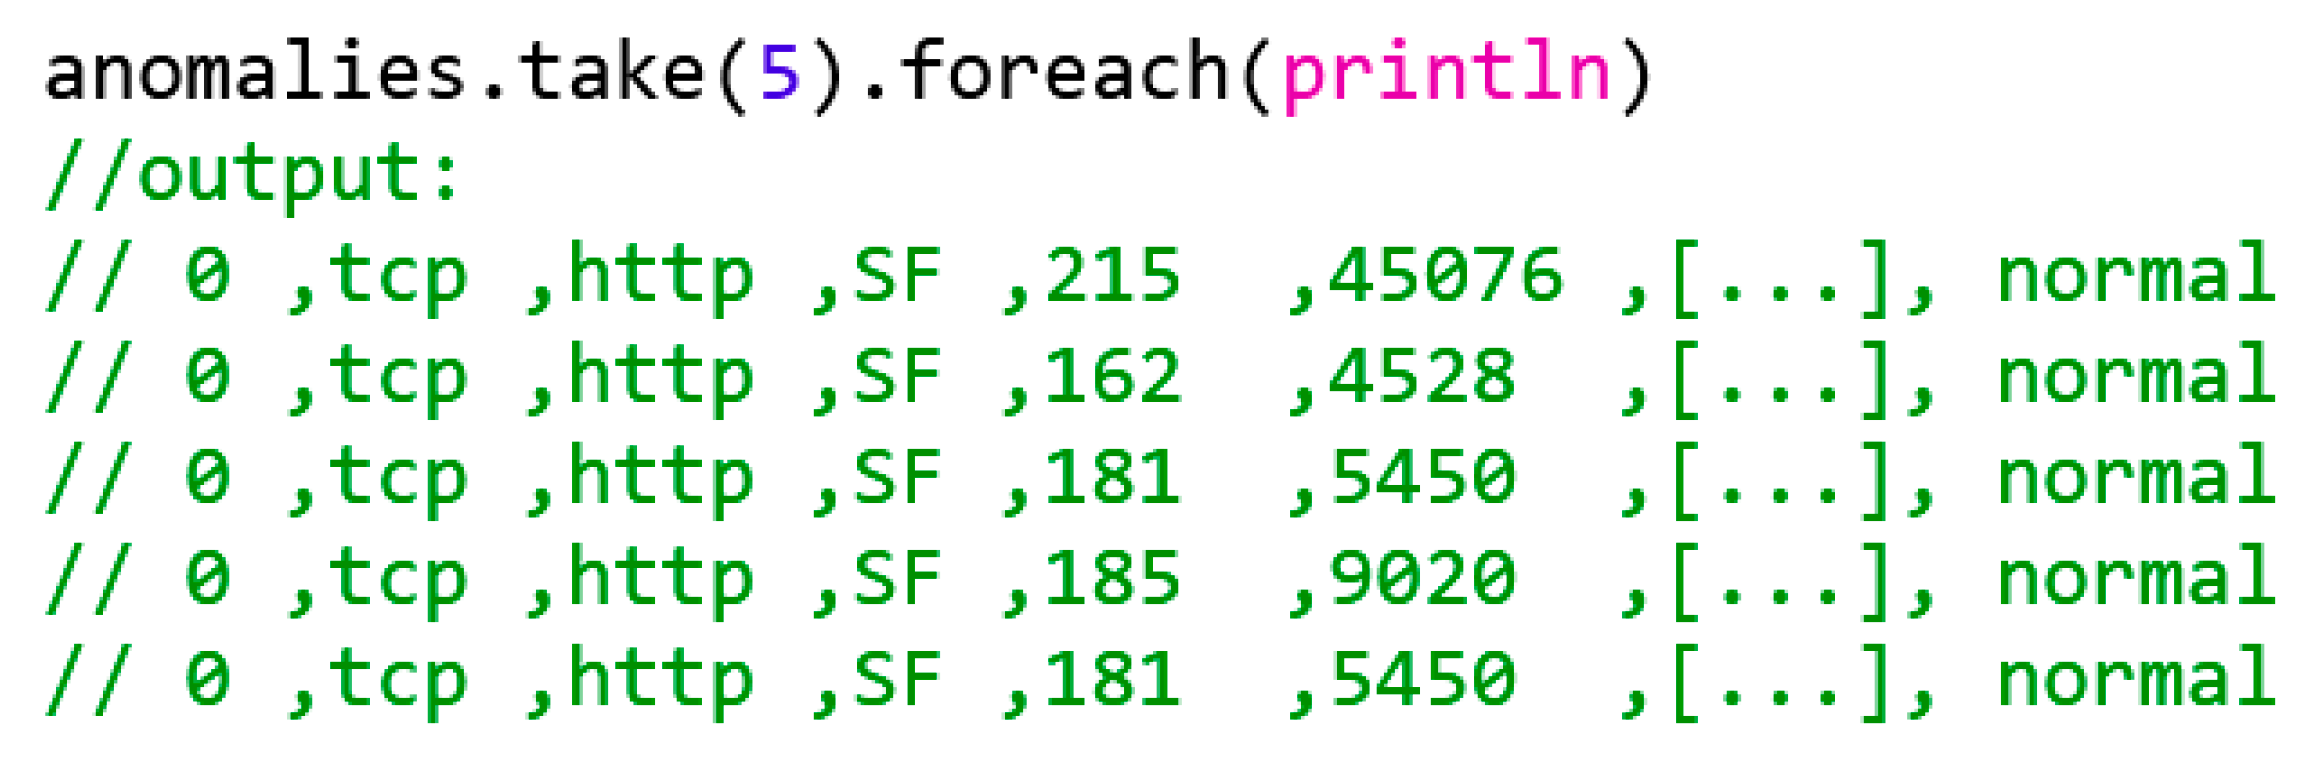
Figure 12 shows the code to be used to get an overview of detected anomalies.
What we have identified here is that the connections with the categorical characteristic normal were clearly identified as anomalies. These relationships may refer to attacks that are not known during categorization or false identifications due to the unoptimized k-means model.
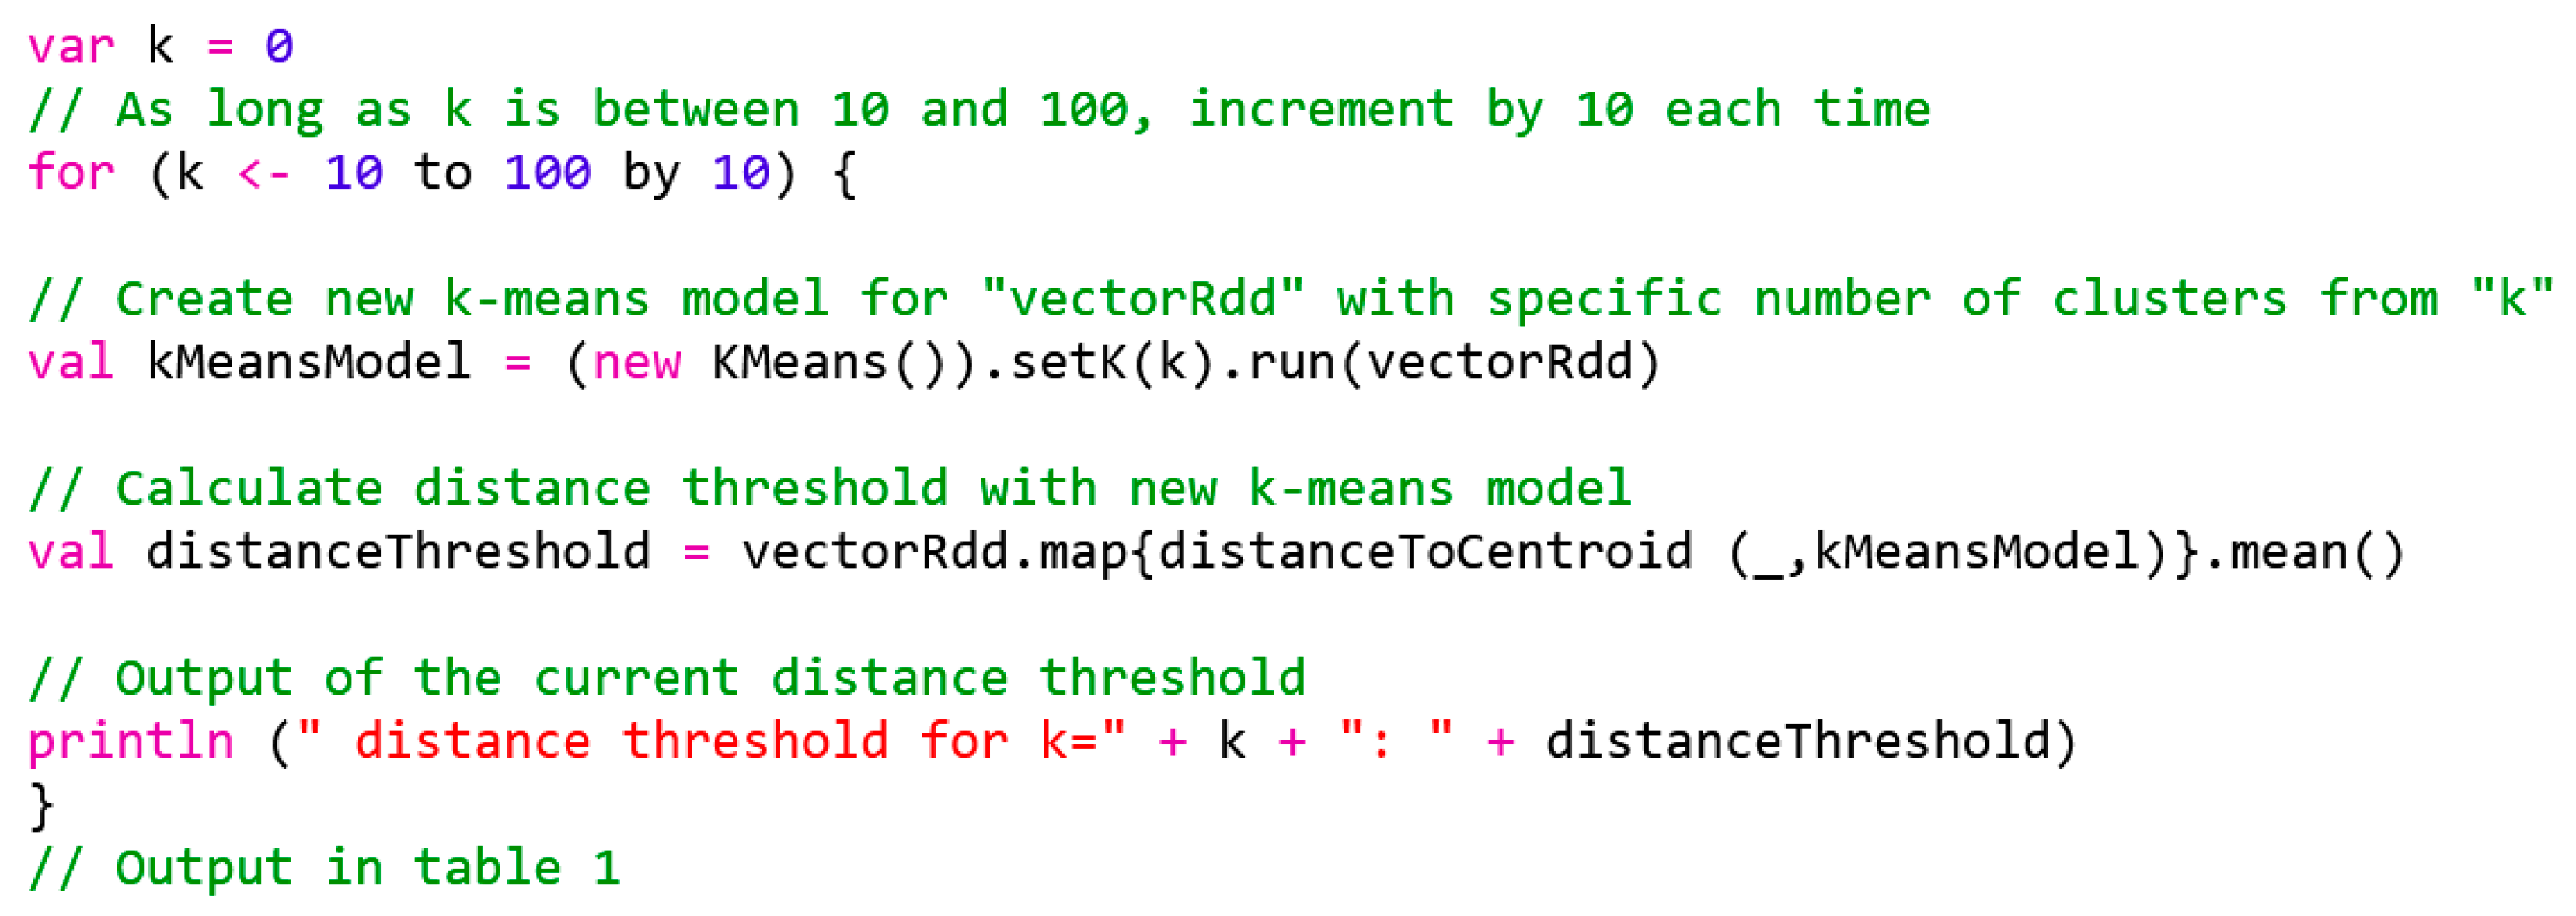
For the latter case, in order to optimize the number k of clusters in the model, a clustering analysis can be rated as sufficient if each data point is relatively close to the assigned cluster center of gravity. To determine an improved k-value, a number of different k-means models are created, and the resulting average distance thresholds are compared with each other.
For this purpose, the code provided in
Figure 13 is used, which output is shown in
Table 1.
It can be seen that the increase in clusters’ numbers leads to a decrease in the average distance threshold, i.e., an improvement in the result. However, the k should not be too large, as otherwise, a meaningful clustering analysis cannot be performed. For example, if k is set to the number of data records (rawData.count), the distance will shrink to 0 because each data record will form its own cluster. What is more, the output shows that the distance thresholds do not change proportionally to k. In addition, the result with k = 50, for example, is worse than that with k = 40. This result, which is something unexpected, is also justified by the fact that the k-means method uses random initial clusters. Therefore, the choice of the number of clusters can be further improved if the model for a specific k is created several times with different random initial clusters, and then the best model resulting therefrom is adopted. The Apache Spark Framework offers the setRuns() method for objects of the k-means type for this purpose. Another potential improvement to the model is the lengthening of the iteration of the algorithm. K-means uses a threshold value that controls from when the movement of the cluster centers of gravity is considered to have converged, and the cluster centers of gravity therefore change. This threshold value can be adjusted with the setEpsilon() method.
Table 2 provides the results of this action, i.e., the values of the distance threshold with the adjusted parameters for the number of runs and epsilon. In this case, the runs were set to 10 (default: 1) and epsilon was set to 1.0 × 10
−7 (default: 1.0 × 10
−4), used as a sample. What is important here is that experiments with multiple different values should be carried out to achieve better results.
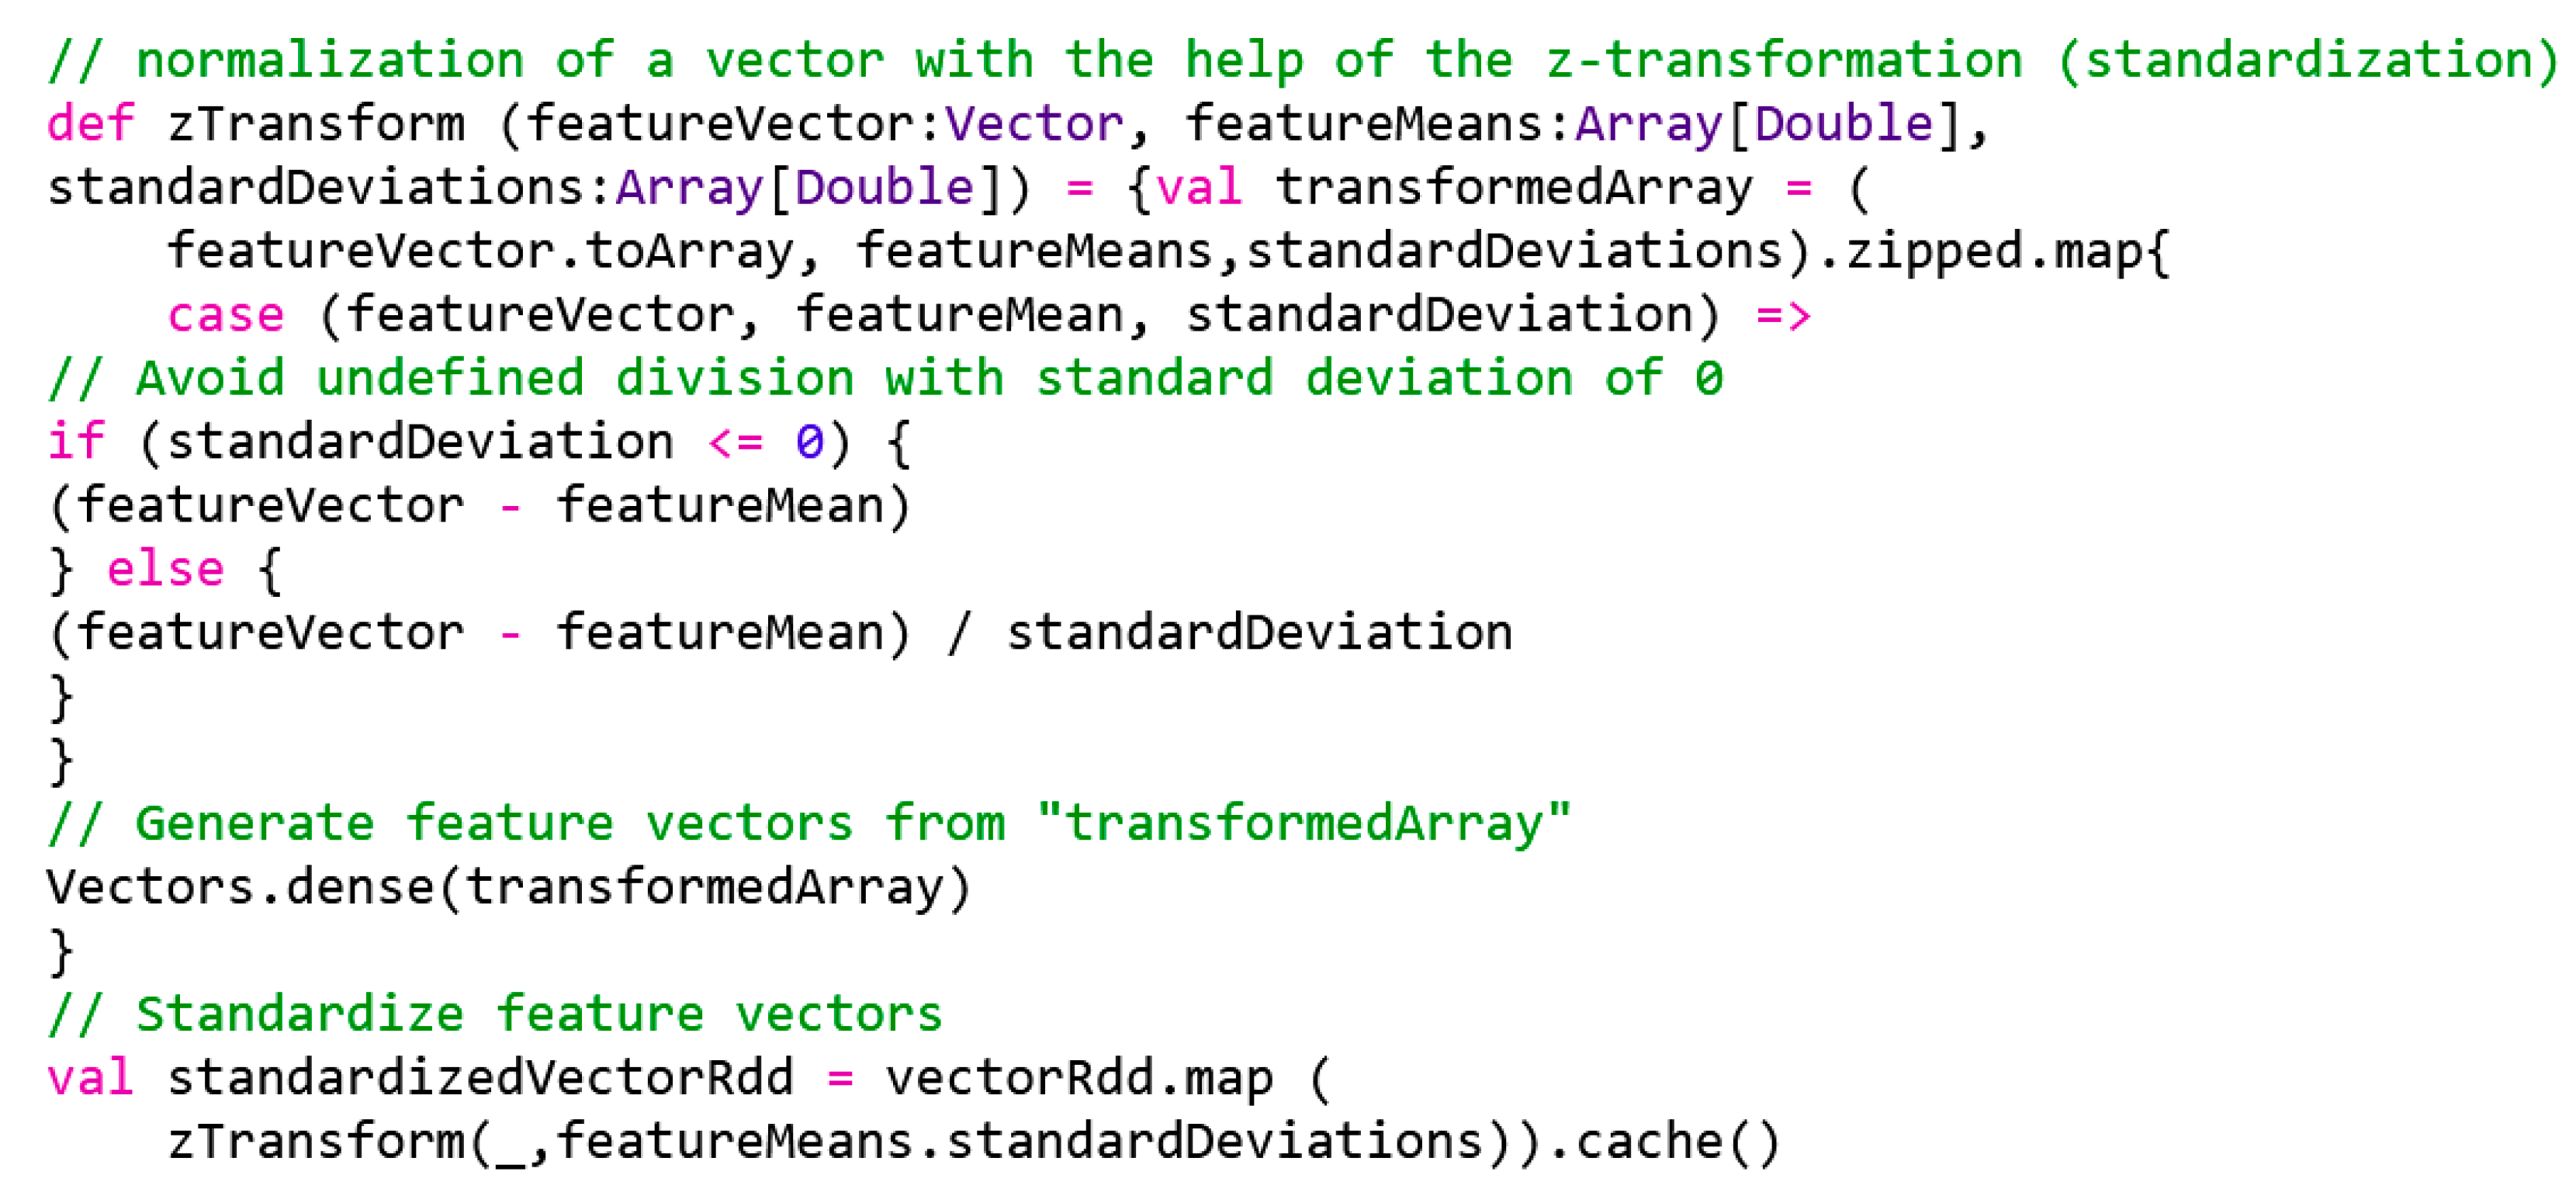
Here we can observe an improvement compared to standard. In addition, this time the values are constantly decreasing the higher the parameter k is selected. Further optimization can be achieved by normalizing each feature through standardization (also known as z-transformation), which is a statistical function typically used when differently distributed random variables, e.g., the values of the characteristics, should be compared [
28]. The z-transformation is given by the following function:
Equation (1). Z-transformation.
Z-transformation shall be carried out following the formula provided in Equation (1), where Zi is the z-transformed sample; Xi is the original value of the sample; μi is the mean value of the sample; and σi is the standard deviation of the sample. In the case of a feature, the feature is standardized by subtracting the feature value with the arithmetically average mean value of the feature and dividing the result by the standard deviation.
The generation of k-means models from
Figure 14 with the
epsilon and
runs parameters, specified in
Table 2 on the feature vectors
standardizedVectorRdd (instead of
vectorRdd), allows for achieving better distance threshold values. At first glance, they differ significantly from the values given in
Table 2. This is due to z-transformation but does not have a negative effect on the accuracy of detection of anomaly; rather, it improves the result of their recognition, if standardized feature vectors are also used.
Table 3 shows that the standardized distance thresholds continuously improve up to k = 175. Thus, the above optimizations can now be incorporated into the anomaly detection. The following results have now been calculated.
As can be seen in
Table 4, even after adapting the k-means models and applying normalization, there is a certain amount of leeway for interpretation and improvement. From the data we have obtained, it is possible to predict volumes of data arose from attacks based on the anomaly rates, where the arithmetic mean of the anomaly rates is 16.4 percent, with the median of 18.9 percent. There is, therefore, sufficient evidence that 15 to 20 percent of the entire database can be attributed to the attempted attacks. This means that the parameters of IDS in production, in which we suppose the proposed solution to be in-built, should always be adjusted with the following monitoring of the results, particularly in the introductory phase.
Figure 15 illustrates an abbreviated extract of detected anomalies with a k = 100 model.
The sample() function returns a random sample of an RDD. Since no replacement is to be made, the first parameter is set to false. The second parameter, however, defines the size of the sample, i.e., in this case, 0.00001 of all anomalies should be detected.
Sufficiently high result is also possible using the randomized initial clusters of the k-means algorithm, but a relatively precise approximation is certainly possible. In the end, the question always remains: which connections are to be classified as irregular and potentially dangerous and which are to be classified as normal? The algorithm cannot make a final decision, but it can support decision makers. However, an optimization of the k-means models is necessary in any case, to avoid very falsified results, as in
Figure 8. In addition, it is important to monitor the detection of anomalies and to carefully investigate possible outliers.
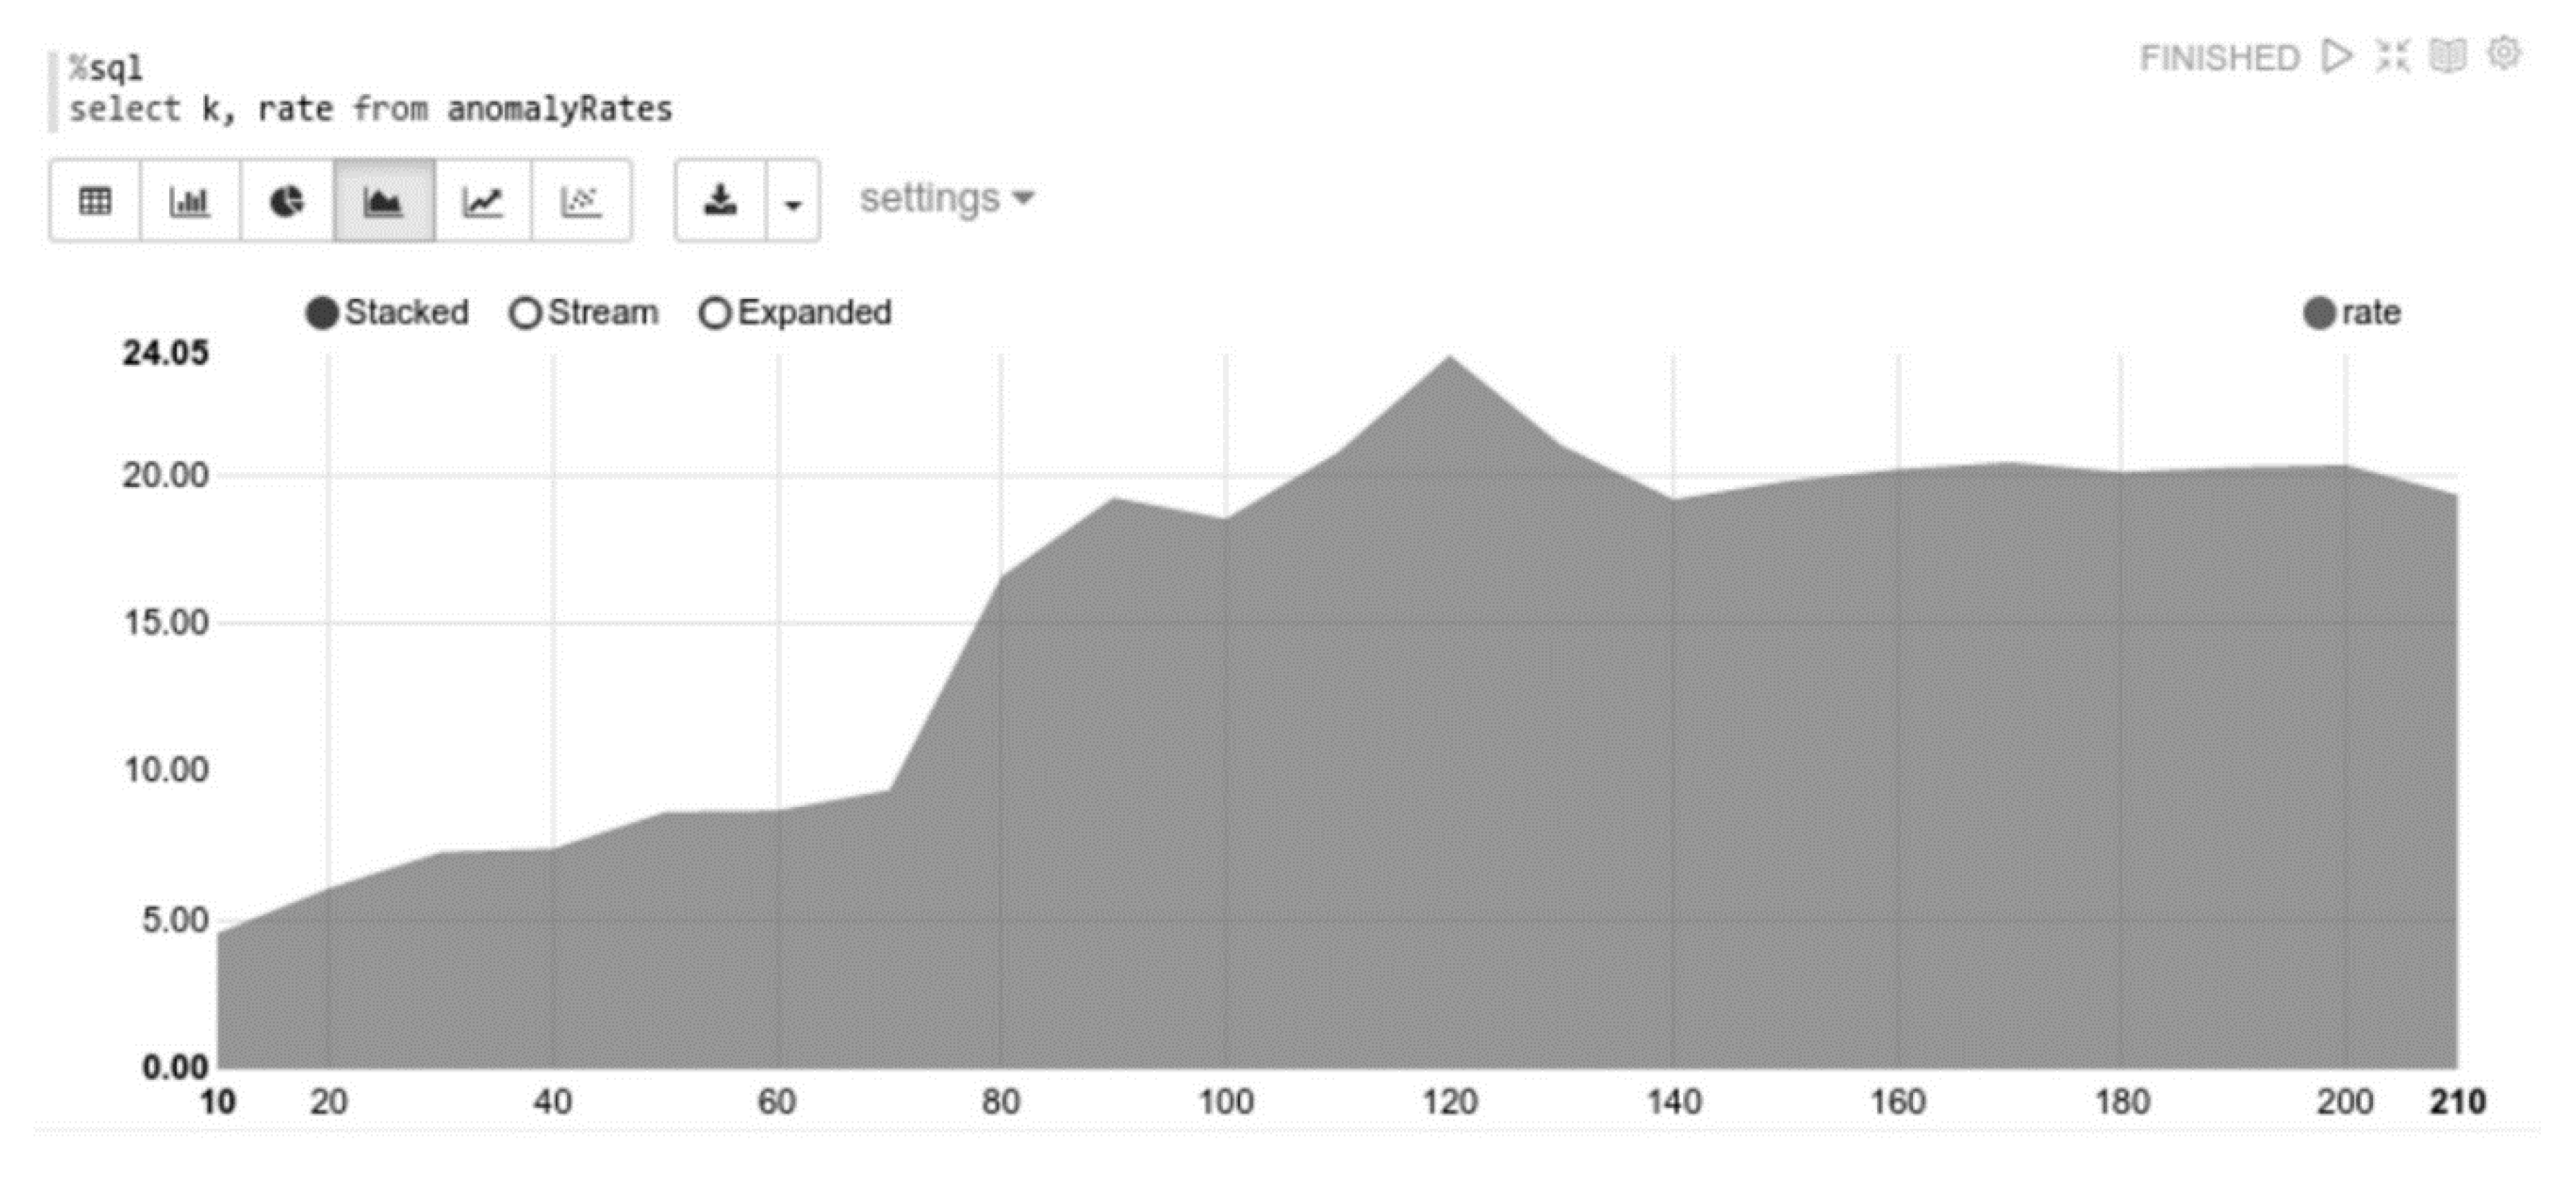
To this end, visualized results may be an opportunity for simple monitoring. Apache Spark does not provide libraries for visualizing results; other tools should be used to create representations. We, however, have used Apache Zeppelin, and
Figure 16 shows visualized anomaly rates from
Table 4 using Apache Zeppelin. Although the export of the results from Spark and their visualization using something akin to R
3 is also an option, in practice, when selecting an adequate k-means model, anomalies could be represented in data sets.
The anomaly rates are included in an RDD
anomalyRates, which consists of (k, Rate)-tuples, and are converted to a Spark Data Frame. The data frame is based on the RDDs but also has a scheme. The scheme (see
Figure 16) is defined by the class rates. Unlike simple RDDs, data frames can be easily queried using Spark SQL. Zeppelin is able to visualize result sets directly from Spark SQL queries.


