Article

Analysis of the Impact of Age, Education and Gender on Individuals’ Perception of Label Efficacy for Online Content

by
Matthew Spradling
1,* and
Jeremy Straub
2,*
1
College of Innovation and Technology, University of Michigan-Flint, Flint, MI 48502, USA
2
Department of Computer Science, North Dakota State University, Fargo, ND 58105, USA
*
Authors to whom correspondence should be addressed.
Information 2022, 13(11), 516; https://doi.org/10.3390/info13110516
Submission received: 13 September 2022 / Revised: 25 October 2022 / Accepted: 25 October 2022 / Published: 28 October 2022
(This article belongs to the Special Issue Digital Privacy and Security)

Abstract

:
Online content is consumed by most Americans and is a primary source of their news information. It impacts millions’ perception of the world around them. Problematically, individuals who seek to deceive or manipulate the public can use targeted online content to do so and this content is readily consumed and believed by many. The use of labeling as a way to alert consumers of potential deceptive content has been proposed. This paper looks at factors which impact its perceived trustworthiness and, thus, potential use by Americans and analyzes these factors based on age, education level and gender. This analysis shows that, while labeling and all label types enjoy broad support, the level of support and uncertainty about labeling varies by age and education level with different labels outperforming for given age and education levels. Gender, alternately, was not shown to have a tremendous impact on respondents’ perspectives regarding labeling; however, females where shown to support labeling more, on average, but also report more uncertainty.

1. Introduction

The internet has been a powerful force to connect the world. It has provided a voice for those without access to traditional forms of mass communications and a means for dissidents to organize against governments that they consider to be oppressive. It provides everyone connected to it the potential to communicate with the masses. However, the same mechanisms that provide these benefits also can create problems, when used for nefarious means.
A growing number of incidents show the power of online content to manipulate the public—for political and other purposes—with misinformation and disinformation. Deceptive online content has been blamed for interference with the 2016 U.S. presidential election [1], the Brexit vote [2] and elections in other countries around the world [3]. It has driven physical violence, such as an armed standoff in a pizza parlor [4], and has been used by multiple foreign influence campaigns [5].
The threat here is significant. Keys [6] has termed the current era as being one of “post-truth” while Lee [7] has described fake news as a “sinister force” that is a threat to democracy. Tong et al. [8] contend that a “weaponization of fake news” has occurred. With 55% of Americans indicating that they get at least some of their news from social media [9] and 75% indicating that they have believed fake headlines [10,11], the scope of the problem is pronounced.
Labeling has been proposed as a possible solution to this issue. Fuhr et al. [12] proposed a nutrition-style label which Lespagnol et al. [13], Vincentius et al. [14], and others have proposed additions to. Prior work has analyzed the need for online content labeling [15] and the perception of labeling data by university community members [16]. A broader study, using a United States population representative sample, has also been analyzed to assess American’s perspectives with regard to online labeling [17]. U.S. population representative data has also been analyzed to assess consumers’ perception of labeling efficacy, based on their income level, party affiliation and level of internet usage [18] and to assess how factors impact content trustworthiness differently, based on age, education and gender [19].
This paper builds on this prior work by looking at how age, education and gender impact the perception of online content labeling efficacy. It continues, in Section 2, with a discussion of prior work that informs the work presented herein. Section 3 presents data regarding the study instrument used to collect the data analyzed herein and respondents’ demographics. Section 4, Section 5 and Section 6 present analysis for three types of labels (informational, warning and supplemental information) and Section 7 analyzes broader trends across the data presented for specific labels. The paper concludes and discusses potential areas of future work, in Section 8.

2. Background

This section provides a review of prior work in three areas which serve as a foundation for the work presented herein. First, a discussion of online deceptive content and the problems it poses is presented. Then, product labeling is discussed, in Section 2.2. Finally, labeling’s potential use for combatting deceptive online content is reviewed, in Section 2.3.

2.1. Online Deceptive Content and Its Impact

At one point, the term ‘fake news’ was used to refer to content that publishers and readers knew was comedically false [20]. While the content might have been presented in a similar format to news content, it was not designed to fool people (though it sometimes did [21]). More recently, the term has been used to refer to deliberately deceptive content which is designed to be manipulative [22].
For many, the term fake news became well known during the 2016 U.S. presidential election. Grinberg et al. [23] estimated that 6% of news content was fake during this time period and Lazer et al. [24] estimated that Americans had, on average, consumed between one and three fake articles. Bovet and Makse [25] determined that, during the election, a quarter of tweets were “fake or extremely biased news” Fake news was also prevalent in the Brexit movement [2,5] and in least 20 other countries [3].
The impact of fake news spans across society. College students, for example, indicated that they expected social media news to be inaccurate [26]; however, despite this, individuals in the 18 to 29 year-old age group use social media more frequently than others and indicate trusting it more [26,27]. Fake news can confuse members of the public of all ages [28], has started an armed standoff [29] and has even been used to circulate inaccurate and potentially dangerous health information [30].

2.2. Product Labeling

Warning and information labels are used on numerous products. Information labels, such as the nutrition facts labels placed on food items (shown in Figure 1a) and energy labels (shown in Figure 1b) placed on electronic devices, seek to provide consumers with information in a standardized format to allow them to make decisions and comparisons between products. Warning labels are also placed on products, such as alcohol and tobacco, to promote healthy consumption decisions. However, the goal of warning labels is typically to limit consumption of the product, either in general or by a potentially vulnerable subgroup.
Tobacco warning labels have been shown to be effective at communicating how dangerous the product is and preventing youth from starting smoking [33]. The current cigarette packaging labels in the United States date back to 1984 [34] and carry a text-based surgeon general’s warning [35]. Labels containing images have been shown to have more impact than text warnings. The FDA proposed “graphic” labels [36] (an example of which is shown in Figure 2); however, these labels were not implemented due to objections from tobacco companies [37], which were upheld by the courts [37,38] which found that the packaging requirements violated the First Amendment of the United States Constitution [39].
The FDA proposed new labels, in 2019 [39] (examples of which are shown in Figure 3), which were planned to launch in June of 2021. These labels build upon the graphical approach shown in Figure 1. Their required use has been delayed several times [41]. Similar efforts have been undertaken by other countries. New Zealand’s Smoke-free Environments Regulations of 1999, for example, require tobacco products to include a graphic health warning [42]. While the law was challenged by the tobacco industry, it was ultimately adopted and had significant support from the public [42].
Labeling has also been implemented, in the United States, for movies, television and music. MPAA rating labels are placed on movies and V-Chip ratings [44,45,46] are assigned to television programs. Some music, with explicit lyrics, carries a warning label to that effect [47]. Many movies also carry an anti-piracy warning from the U.S. Federal Bureau of Investigation which warns consumers about the risks of piracy to attempt to deter it [48]. All of these content labeling systems involved government coordination and collaboration with industry, to varying degrees.

2.3. Online Content Labeling

Labeling may be similarly valuable for online content to aid in information consumption decision-making. Lazer et al. [24] suggested that consumers could be aided by both preventing their exposure to deceptive content and helping them evaluate it.
Deceptive content hosting websites, though, may be uninterested in self-regulation and resistant to industry and government labeling. These sites may prefer that consumers consume their misinformation due to ideological [49] or advertising revenue generation [50] goals. Government mandated online content labeling, in the United States, may face considerable legal challenges. The decision preventing the FDA from requiring graphic health cigarette warnings was due to free speech concerns [39] of a potentially less protected nature (product sales [51]) than online content.
U.S. law is not the only consideration, of course, as online deceptive content is inherently an international challenge. In the United States, government required content labeling may face constitutional challenges as an infringement upon publishers’ free speech rights [52]. Numerous other countries have their own regulations that must also be considered. The People’s Republic of China, for example, has a law, the Information Network and Internet Security, Protection and Management Regulations of 1997, which proscribes “making falsehoods or distorting the truth, spreading rumors, destroying the order of society” which may dictate the removal of misinformation. If information is censored by the government content labeling may be unneeded as the content will no longer be available for others’ viewing [53].
Ethiopia, Cote d’Ivoire and Malawi also have laws that proscribe publishing false information [54]. Bangladesh created a law “to control the spread of online misinformation” [55] and Indonesian laws threaten jail sentences, of up to a decade, for “spreading false information or news that intentionally causes public disorder” [56]. Alternately, the European Union has created a framework for “digital platforms’ self-regulation” [56]. Other countries’ laws vary. Yadav et al. [57] identified and analyzed over 100 national laws which have different requirements and scopes.
While online content labeling can draw from several sources, it presents numerous challenges. A key challenge is how to determine what label to assign to a given article.
Deceptive content must first be identified before it can be labeled with a warning. Numerous techniques are possible (see [58,59]). Approaches can be manual, automatic or combine both. Articles’ style, authors and distributors, and even network analysis can be used to identify deceptive content [60]. Wang demonstrated an automated approach, using machine learning with manually annotations. Automated technique examples include machine learning techniques with and without manual annotations [61], natural language processing [62], deep [63], mixed graph [64] and graph-attention [65] neural networks and neural stacking [66]. Techniques which analyze social networks [67], signal detection [68], and emotion cognizance [69] have also been proposed. Shao et al. suggested [70] that a multi-modal ensemble approach may provide the benefits of both single mode and multi-modal analysis and outperform other approaches. Rapti et al. [71], have also proposed a model for considering fake news using a “disinformation blueprint” which may allow deceptive content to be identified more holistically.
Approaches to identifying deceptive content using influence analysis [72,73] have been proposed, such as Budak, Agrawal and Abbadi’s [74] “competing cascades dissipating in a network” method, and the use of a heuristic based on degree centrality [74]. Suchia et al. [75] proposed an approach to detect rumors that piggyback alongside legitimate news stories but add incorrect information. Fairbanks et al. [76], noting the prevalence of politically charged deceptive content, created a technique that classifies text as containing “liberal words”, “conservative words”, and “fake news words”. The fake news words category, though, was shown to be unreliable.
Taxonomies for labeling have been proposed by Tandoc, Lim and Ling [10] (who developed a system including “satire”, “parody”, “fabrication”, “manipulation”, “propaganda”, and “advertising”) and Bakir and McStay [77]. Online content publishers have also created their own systems. Twitter introduced Birdwatch, which is based on manual evaluation of Twitter posts by other users [78]. Wikipedia has published a list of news sources that includes reliability information (https://en.wikipedia.org/wiki/Wikipedia:Reliable_sources/Perennial_sources) (accessed on 26 October 2022).

3. Survey and Respondents

A survey was conducted with a goal of understanding Americans’ news content consumption decision making perceptions. The survey instrument and the data collection process are discussed in Section 3.1 and the labels whose efficacy was evaluated are discussed in Section 3.2. Respondent demographics are discussed in Section 3.3. Finally, Section 3.4 discusses the analysis methodology used herein.

3.1. Survey Instrument and Data Collection

The survey utilized in [16] was modified for use for this study. It was edited to reduce the target response time to 15 min and to combine the three surveys, which were administered independently for [16]. Questions which were redundant between the surveys were removed and the revised survey was reviewed by the authors and Qualtrics staff. As part of Qualtrics standard procedure, a limited pilot was used to validate the instrument. As no issues were detected during the pilot study, the pilot responses were included in the dataset, based on Qualtrics’ standard practices.
For each proposed label type, respondents were presented with the label and description of how it would appear when browsing social media. For each label, participants were asked the same five questions regarding the its helpfulness: whether or not they found it annoying, whether they would use it, whether they believed other people would use it, and whether they believed it would be helpful in judging the trustworthiness of news articles. These question categories and the text of the questions from the survey instrument are presented in Table 1.
By asking “would you find this label helpful”, the survey identified the general positive or negative attitude of the participant towards using the label, without asking specifically where this sentiment comments from. The remaining questions help to establish the source of this perception. For example, a participant may find the label to be useful for judging trustworthiness yet find it annoying and unlikely to be utilized in practice. This could suggest a problem with the design of the label rather than the type of information being presented in it. Some label styles present a larger amount of information than others, providing more details at the cost of being larger. Responses regarding “usefulness for judging trustworthiness” can be compared to perceptions of “annoyingness” to observe trade-off between brevity and verbosity. All of this information helps to inform the design of future labeling mechanisms.
The specific topic presented in the labels, “Trouble at High Speed West Middle School”, was chosen to be an apolitical topic which would not influence respondents’ attitude toward the label. While sounding news-like, it avoids addressing a real-world issue and uses a fictitious school name. The headline is meant to avoid distracting from the label design itself and thus biasing responses. Were the headline to focus on a particular news item (for example, about the 2020 US presidential election), respondents’ responses may be confounded by being based on both their opinions regarding the topic and the label design. A key area for future work will involve testing the efficacy of labels in a real-world setting with real instances of legitimate news and misinformation. This study seeks to characterize attitudes towards the label instruments themselves without such confounding concerns.
The data analyzed herein was collected by Qualtrics International Inc. using a quota-based stratified sampling technique using the survey instrument modified from [16]. The recruiting plan was targeted to obtain population proportionate participation, based on gender, age, income level and political affiliation.
The survey was administered in October of 2021 and approximately 550 responses were collected. Of these, 500 are part of the population representative sample. As respondents were offered a completion-based incentive, most responses are complete. In this paper, all responses which answer the relevant demographic and response questions are included in the analysis.

3.2. News Article Labels

The informational labels in the study, which are discussed in Section 4, utilize the labeling categories (title, author, authority, etc.) originally proposed by Fuhr et al. [12], as discussed in [16]. Informational labels 1 and 2 each provide the label categories and their values without any further explanation. These can be seen as ‘pure’ informational labels, where the user must interpret the information, as no interpretation is provided by the label.
Informational labels 1 and 3 also include the article’s original headline, image, and introductory text. This preserves more of the original article’s elements which are intended to be attractive to the user and draw them into clicking the link and viewing the article. This is similar to how nutrition facts are added to the side of a container while still including the product’s branding information and imagery. Informational label 3 provides additional supporting information for each label category, helping the user to interpret it.
Unlike informational labels 1 and 3, informational label 2 appears as a pop-up, covering some of the original article’s elements. Relevant information, such as the title is retained; but the article’s image and summary text are not visible. Like the cigarette labeling design, shown in Figure 2, this style of label blocks potentially attractive advertising elements for the article, such as the image. The goal of this is to allow the user to make a decision without being emotionally persuaded by factors other than the information about the article.
Warning labels 1, 2, and 3 alert the user that “The information in this article is advertised as fact. However, the information has not been verified by any trustworthy sources”. This goes further than the informational labels, warning the user to be on guard, should they decide to view the article. In each case, the user can still allowed to proceed by clicking the forward button.
Warning label 1 appears as a pop-up, preventing the user from seeing the article’s elements (similar to how the cigarette warnings in Figure 2 block half of the front of the carton). Warning label 2 appears beneath the normal headline elements of the article, making it less intrusive. Warning label 3 is presented as an intermediary webpage which is displayed after clicking on an article but before viewing its contents. This is similar to the intermediary page generated by some web browsers when clicking an unsafe link (e.g., one which may lead to computer viruses).
Finally, a supplemental informational label is presented. This style of label provides specific supporting fact-checked information which is directly related to the claims of the article. Rather than making any statement as to the veracity of the article’s claims, it simply makes it easier for the user to compare those claims to facts from trusted sources. This style of label is similar to those used by Twitter and YouTube during the 2020 US presidential election, where tweets or videos making claims about the election results would sometimes be augmented with links to supplementary information from well-known news sources [15].

3.3. Respondent Demographics

Due to the population representativeness goal, respondents are well distributed across demographic groups. Approximately 51% were female and 49% were male. Only a small number of respondents indicated a non-binary gender (less than 1%). Because of the small sample size, non-binary gender’s impact could not be analyzed further.
Respondents from ten age groups (starting at 18 years of age) were included in the study. The breakdown of respondents amongst these age groups is presented in Table 2.
Respondents from seven educational levels participated in this study. The distribution of respondents between education levels is presented in Table 3. High school graduates, who have not completed a college degree, comprised just under 50% of the study population. Nearly a quarter of respondents held a bachelor’s degree. Associate’s and master’s degree holders each comprised just over 10% of respondents. High school graduates without collegiate education and doctoral degree holders also comprised small parts (less than 5% each) of the survey population.

3.4. Analysis Methodology

The Qualtrics online system and Microsoft Excel software were used to perform data analysis. Each question was analyzed in terms of three demographic characteristics (age, education and gender) to ascertain the extent to which each demographic characteristic impacted respondents’ perceptions of each label. This data is presented and analyzed in Section 4, Section 5 and Section 6. Section 7 considers trends present across the multiple demographic groups and questions.

4. Informational Label Related Data and Analysis

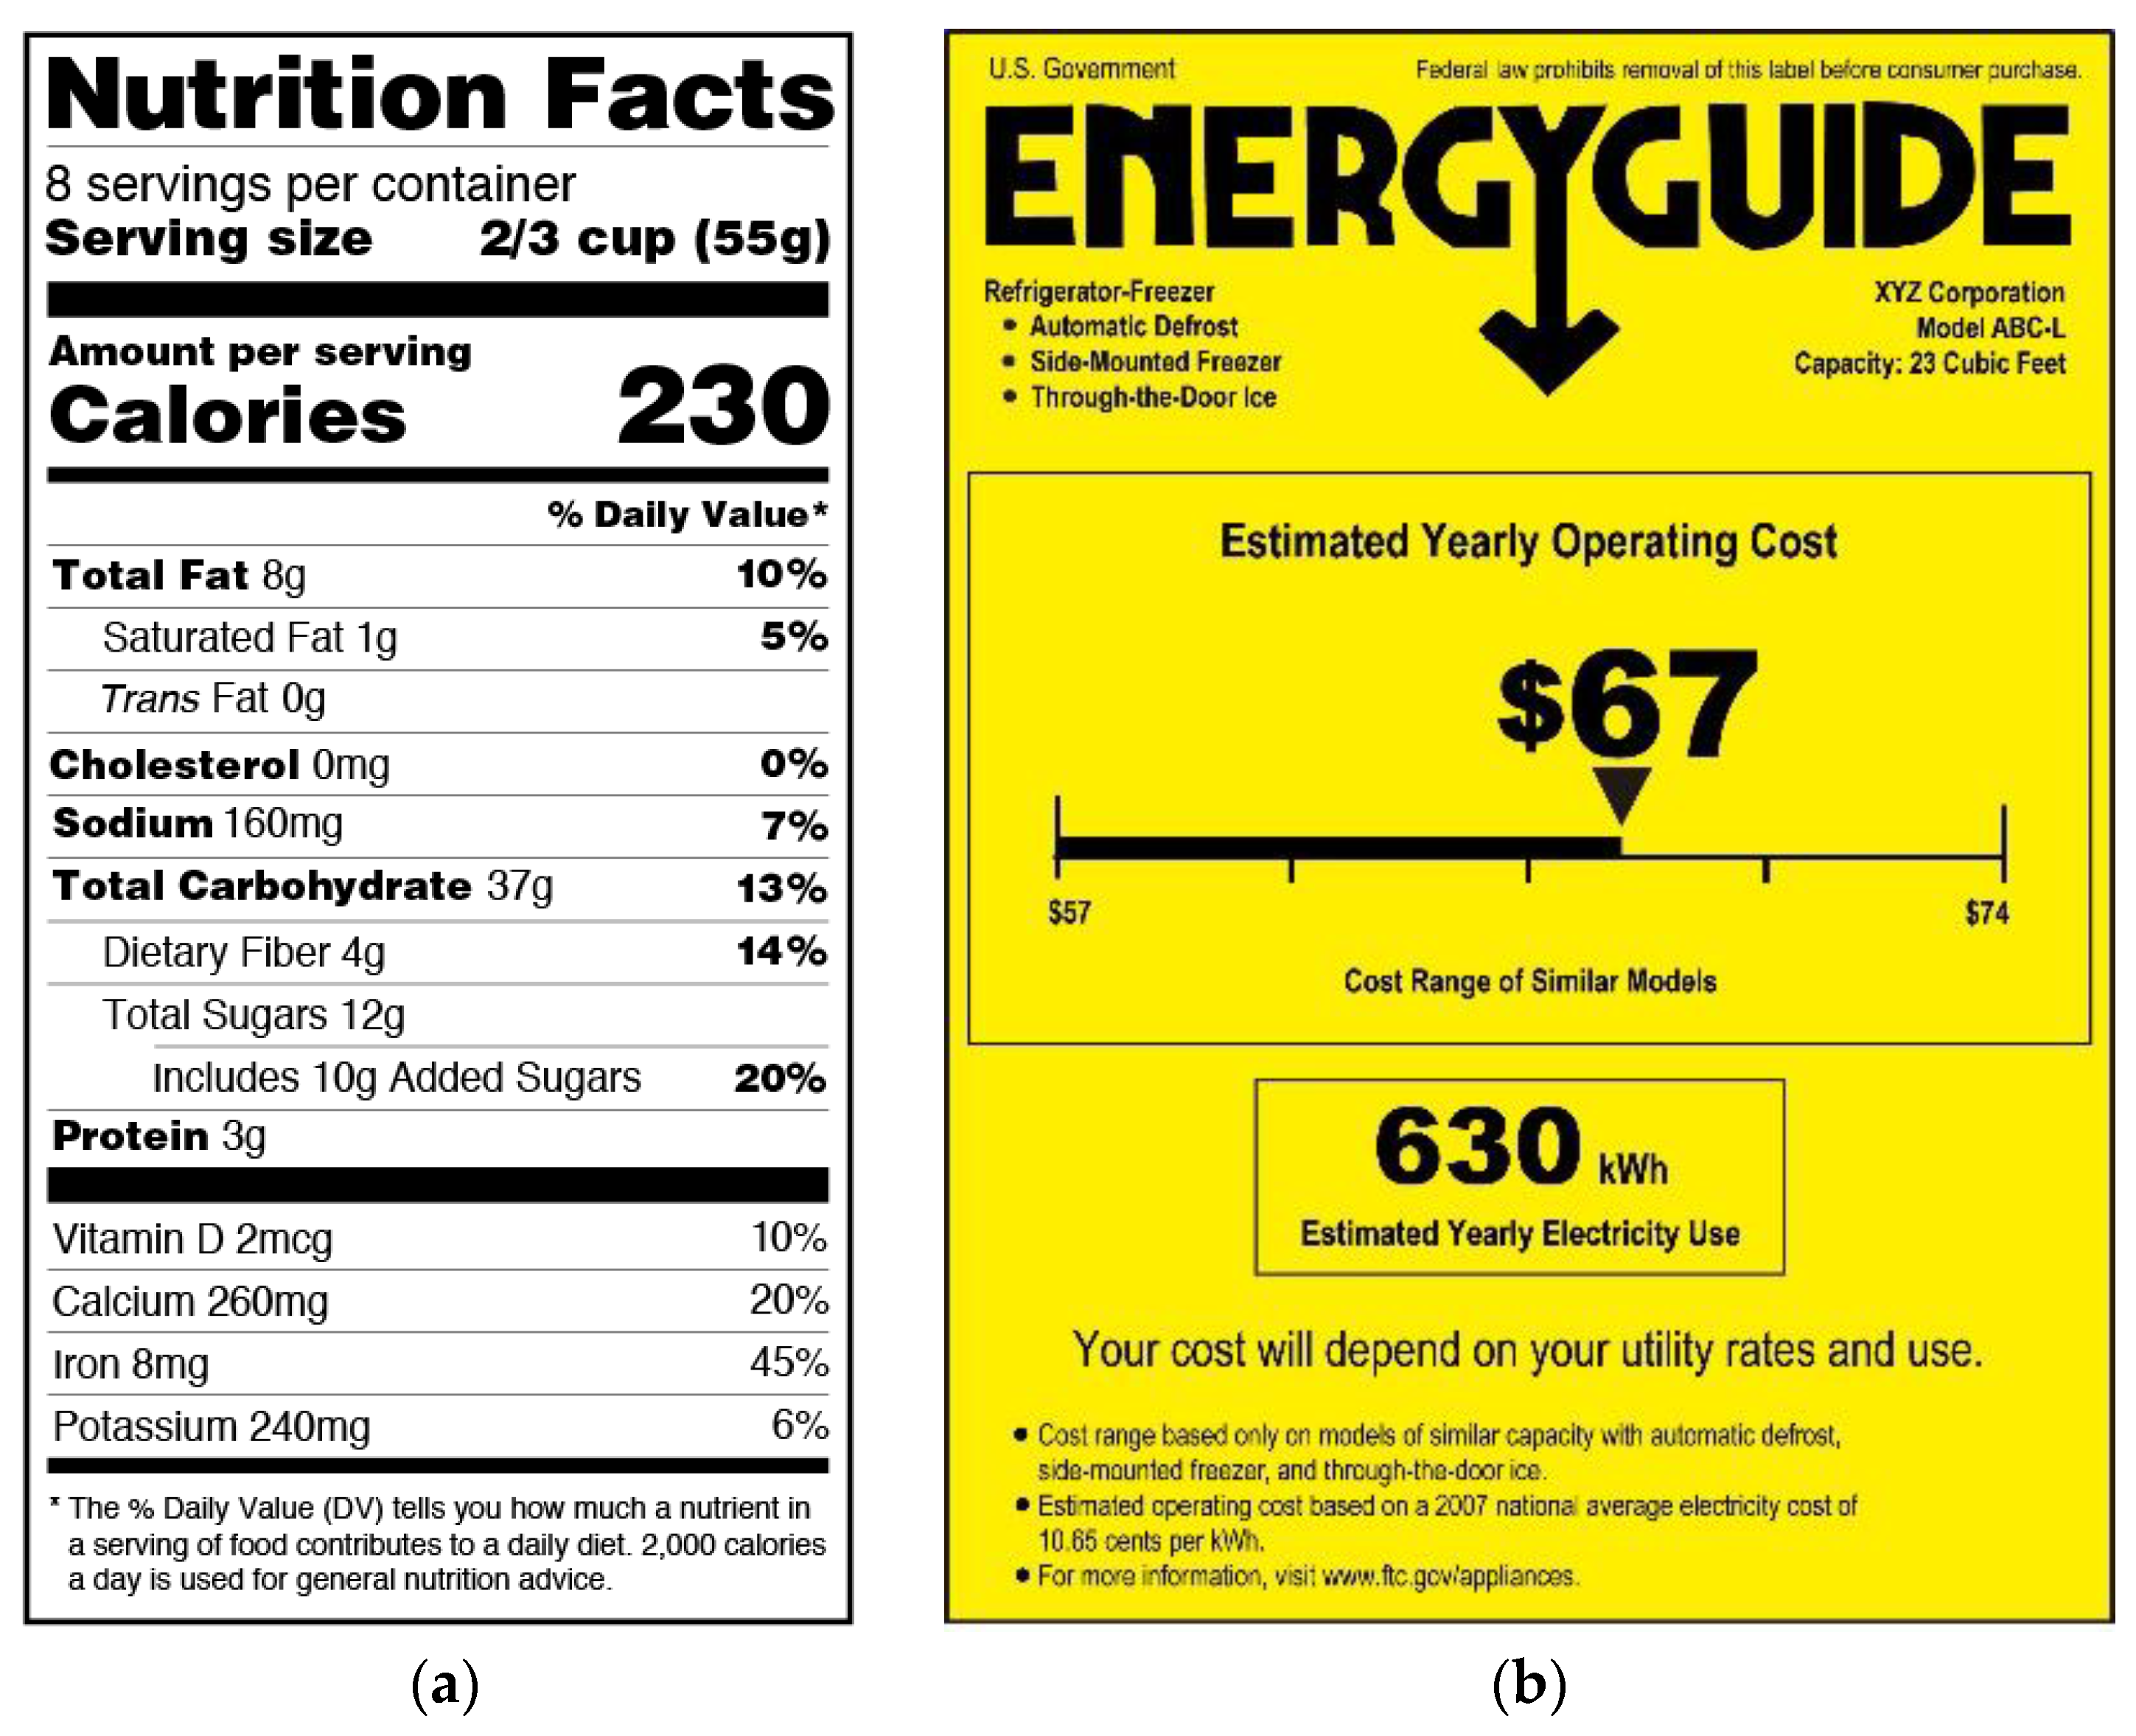
This section presents and analyzes data regarding informational labels. These labels present details in a manner similar to food nutrition fact labels and are designed to allow viewers to consider the relevant information and then to decide whether they want to consume the content or not. For each label, five types of data were collected and are analyzed in terms of three metrics. Respondents were asked about each label’s helpfulness, annoyingness, whether they would use the label, whether others would use the label and whether the label would help in assessing article trustworthiness. Respondents could answer yes, no or unsure. The data from these questions is analyzed, in this section, in terms of respondents’ age, education level and gender.
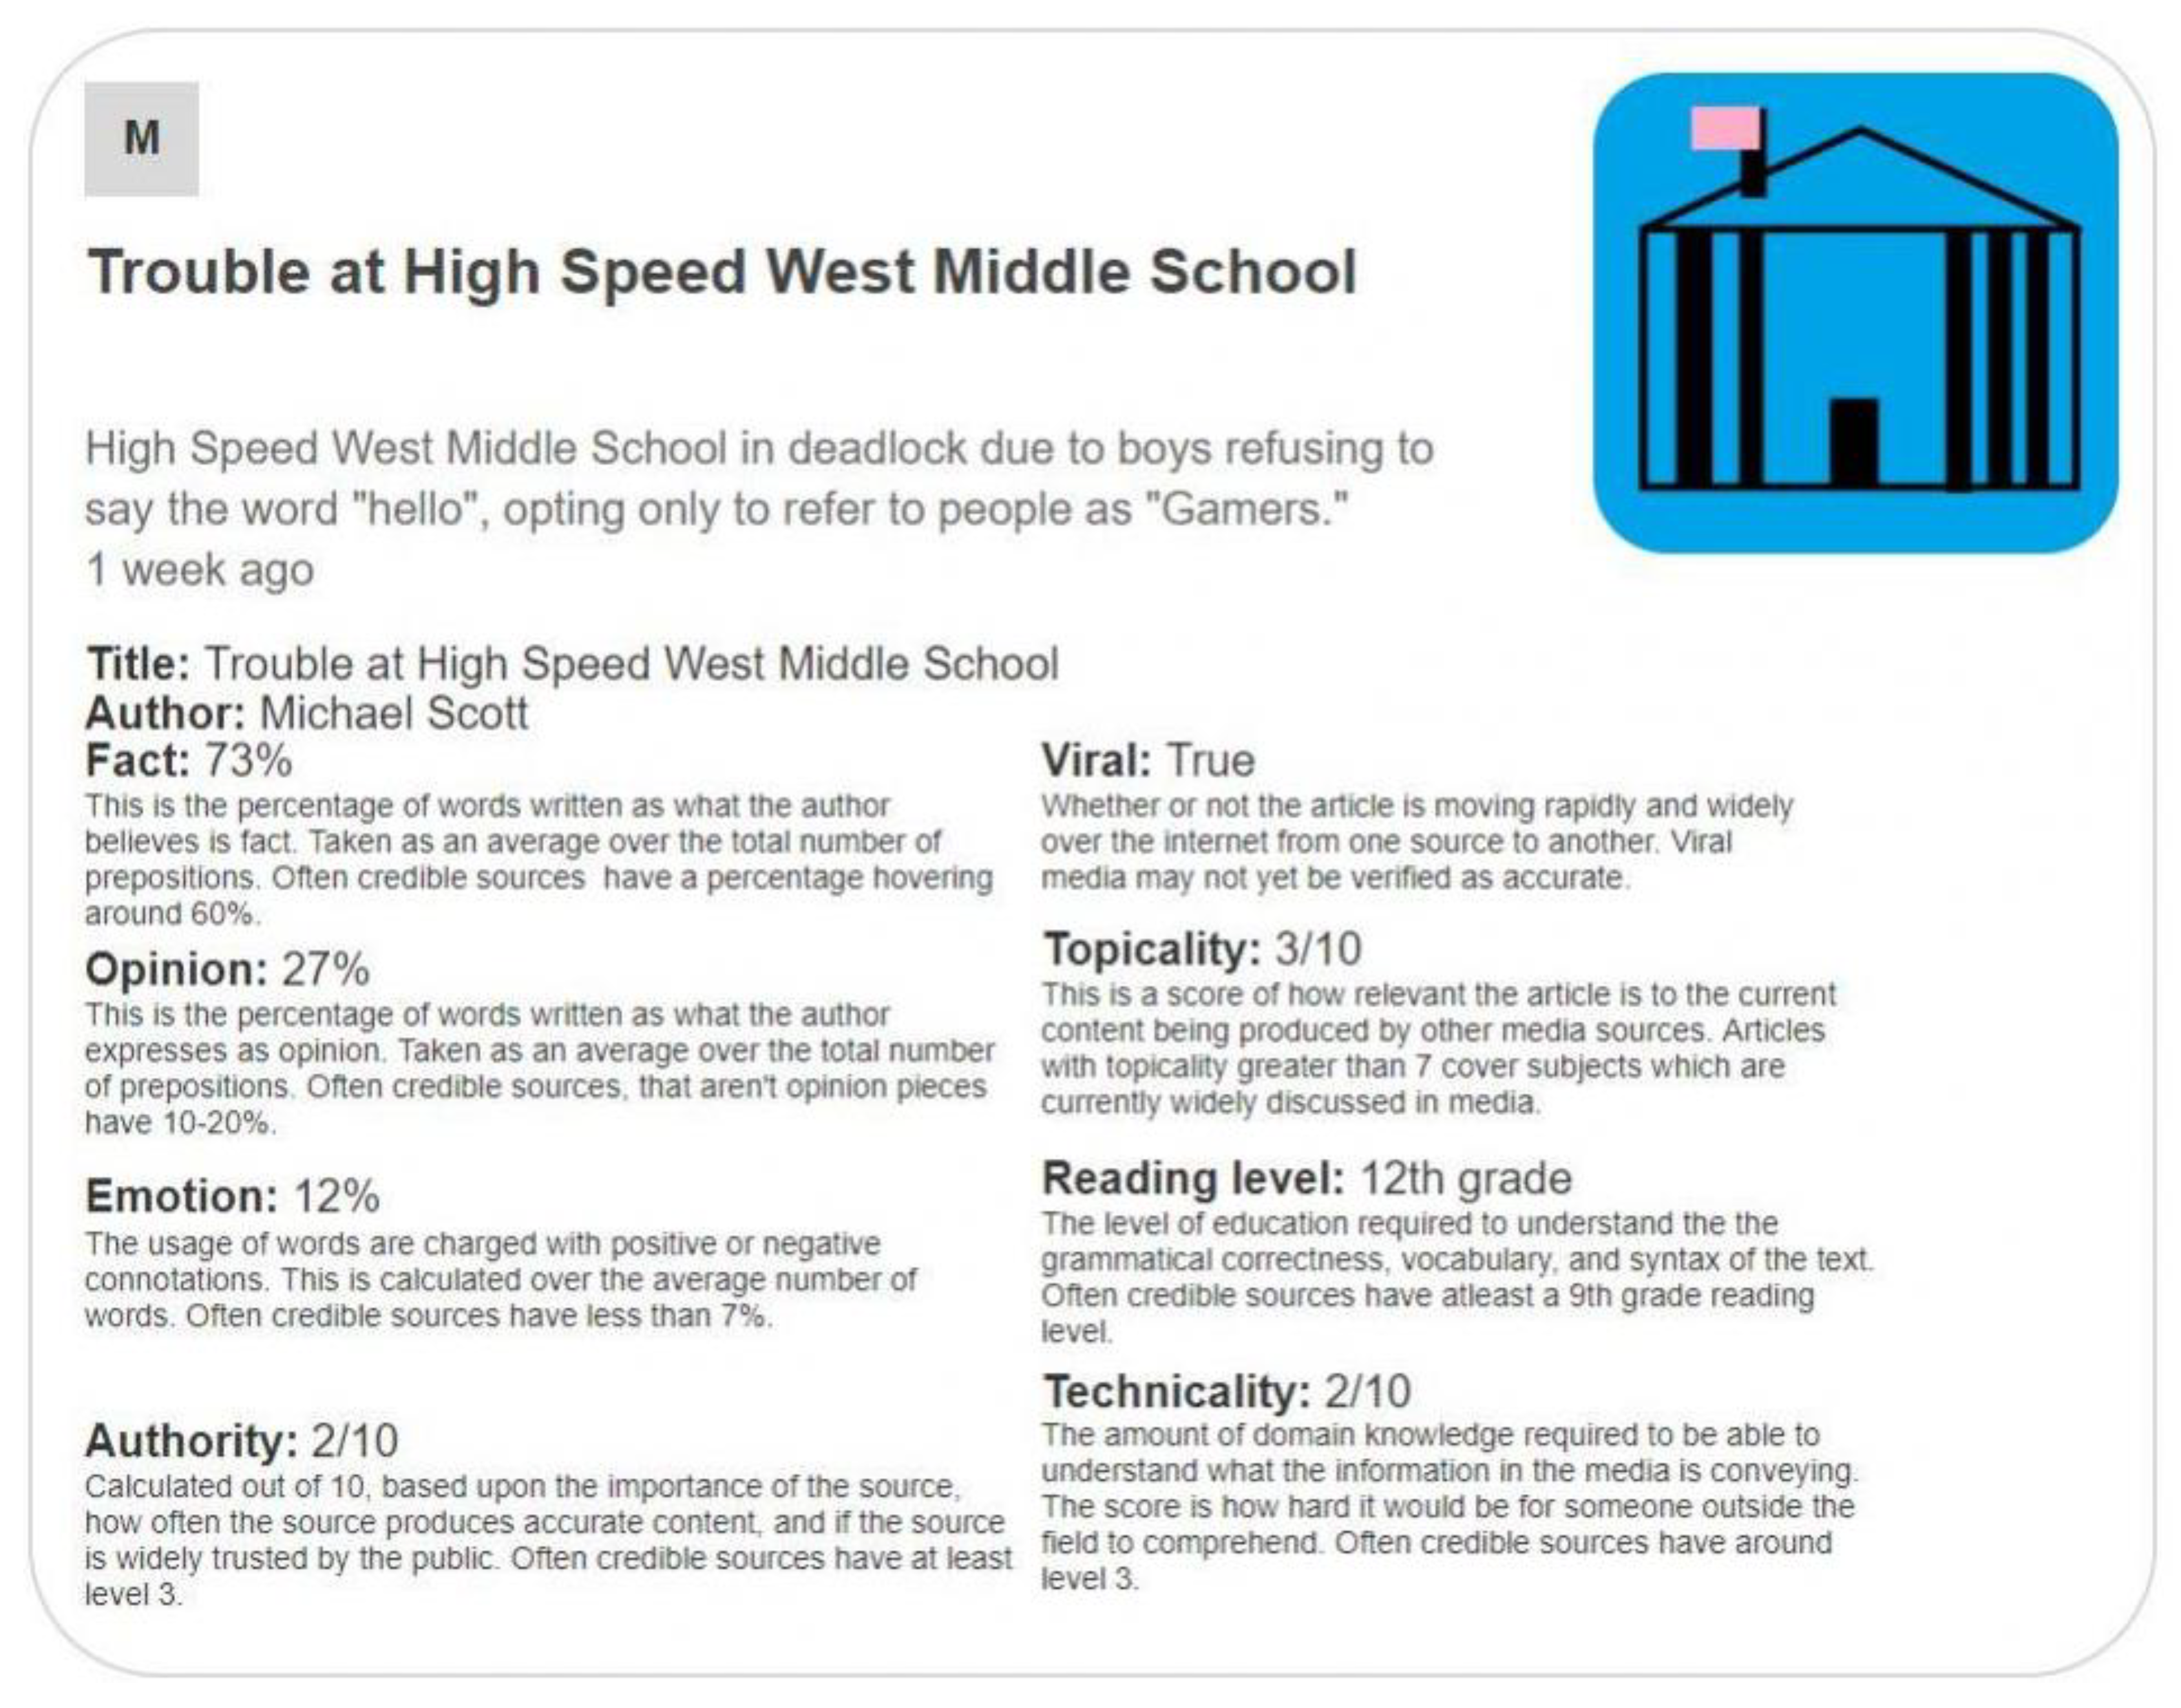
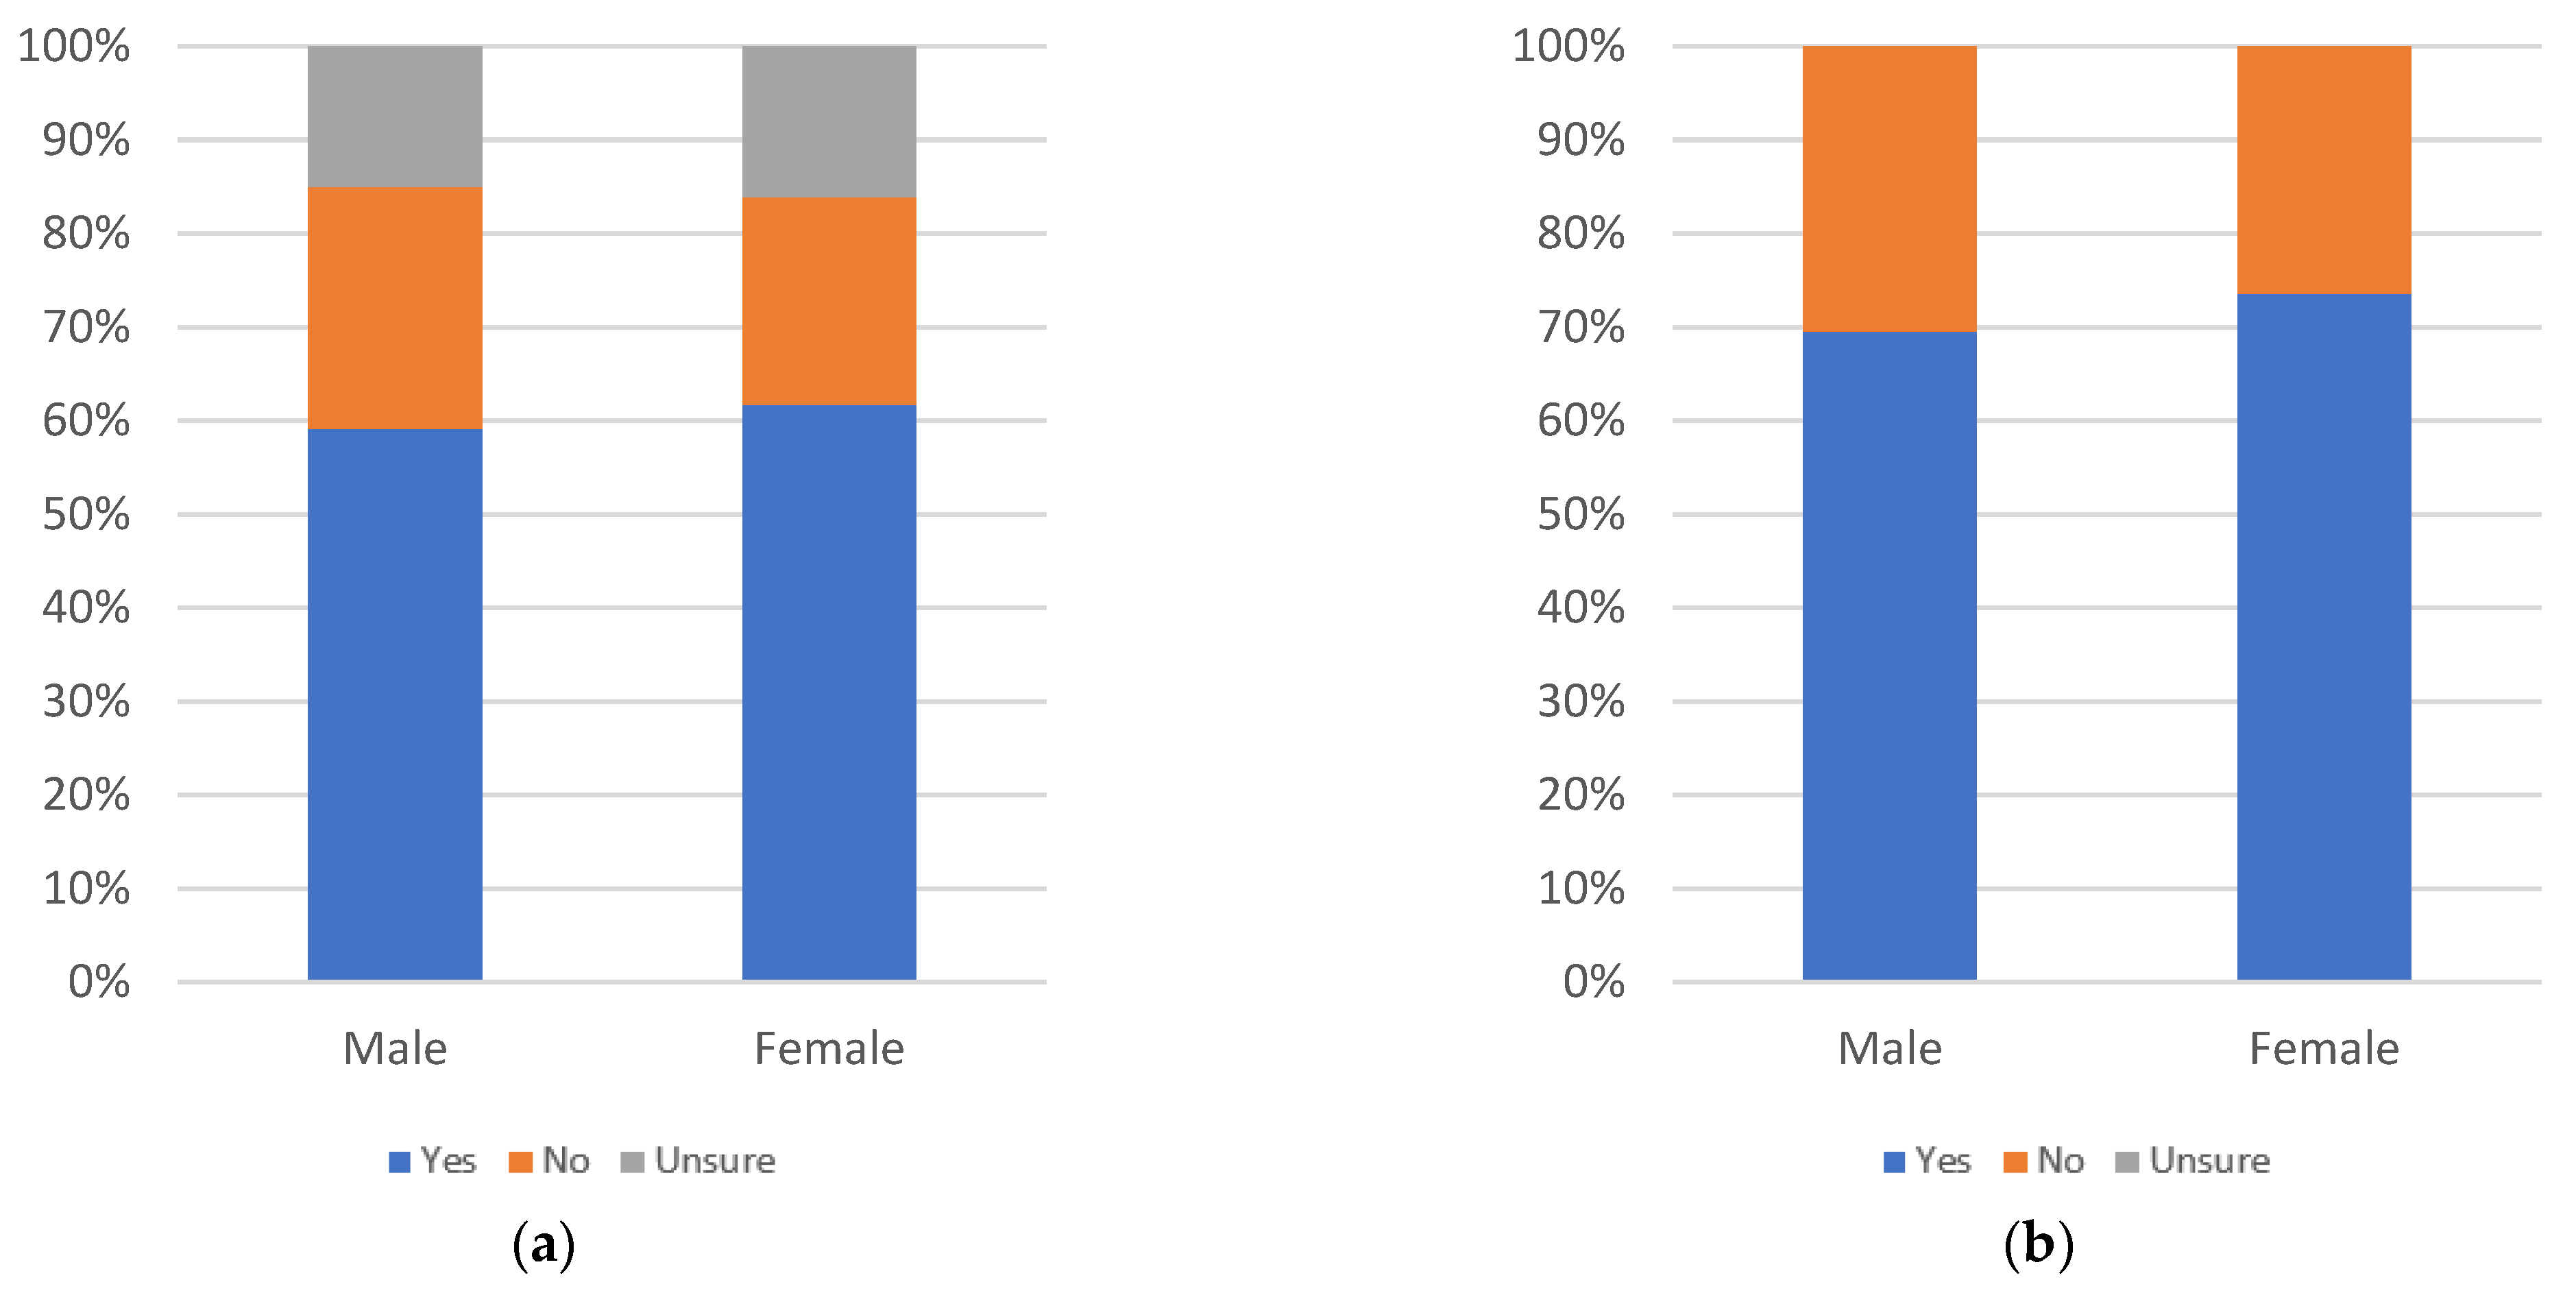
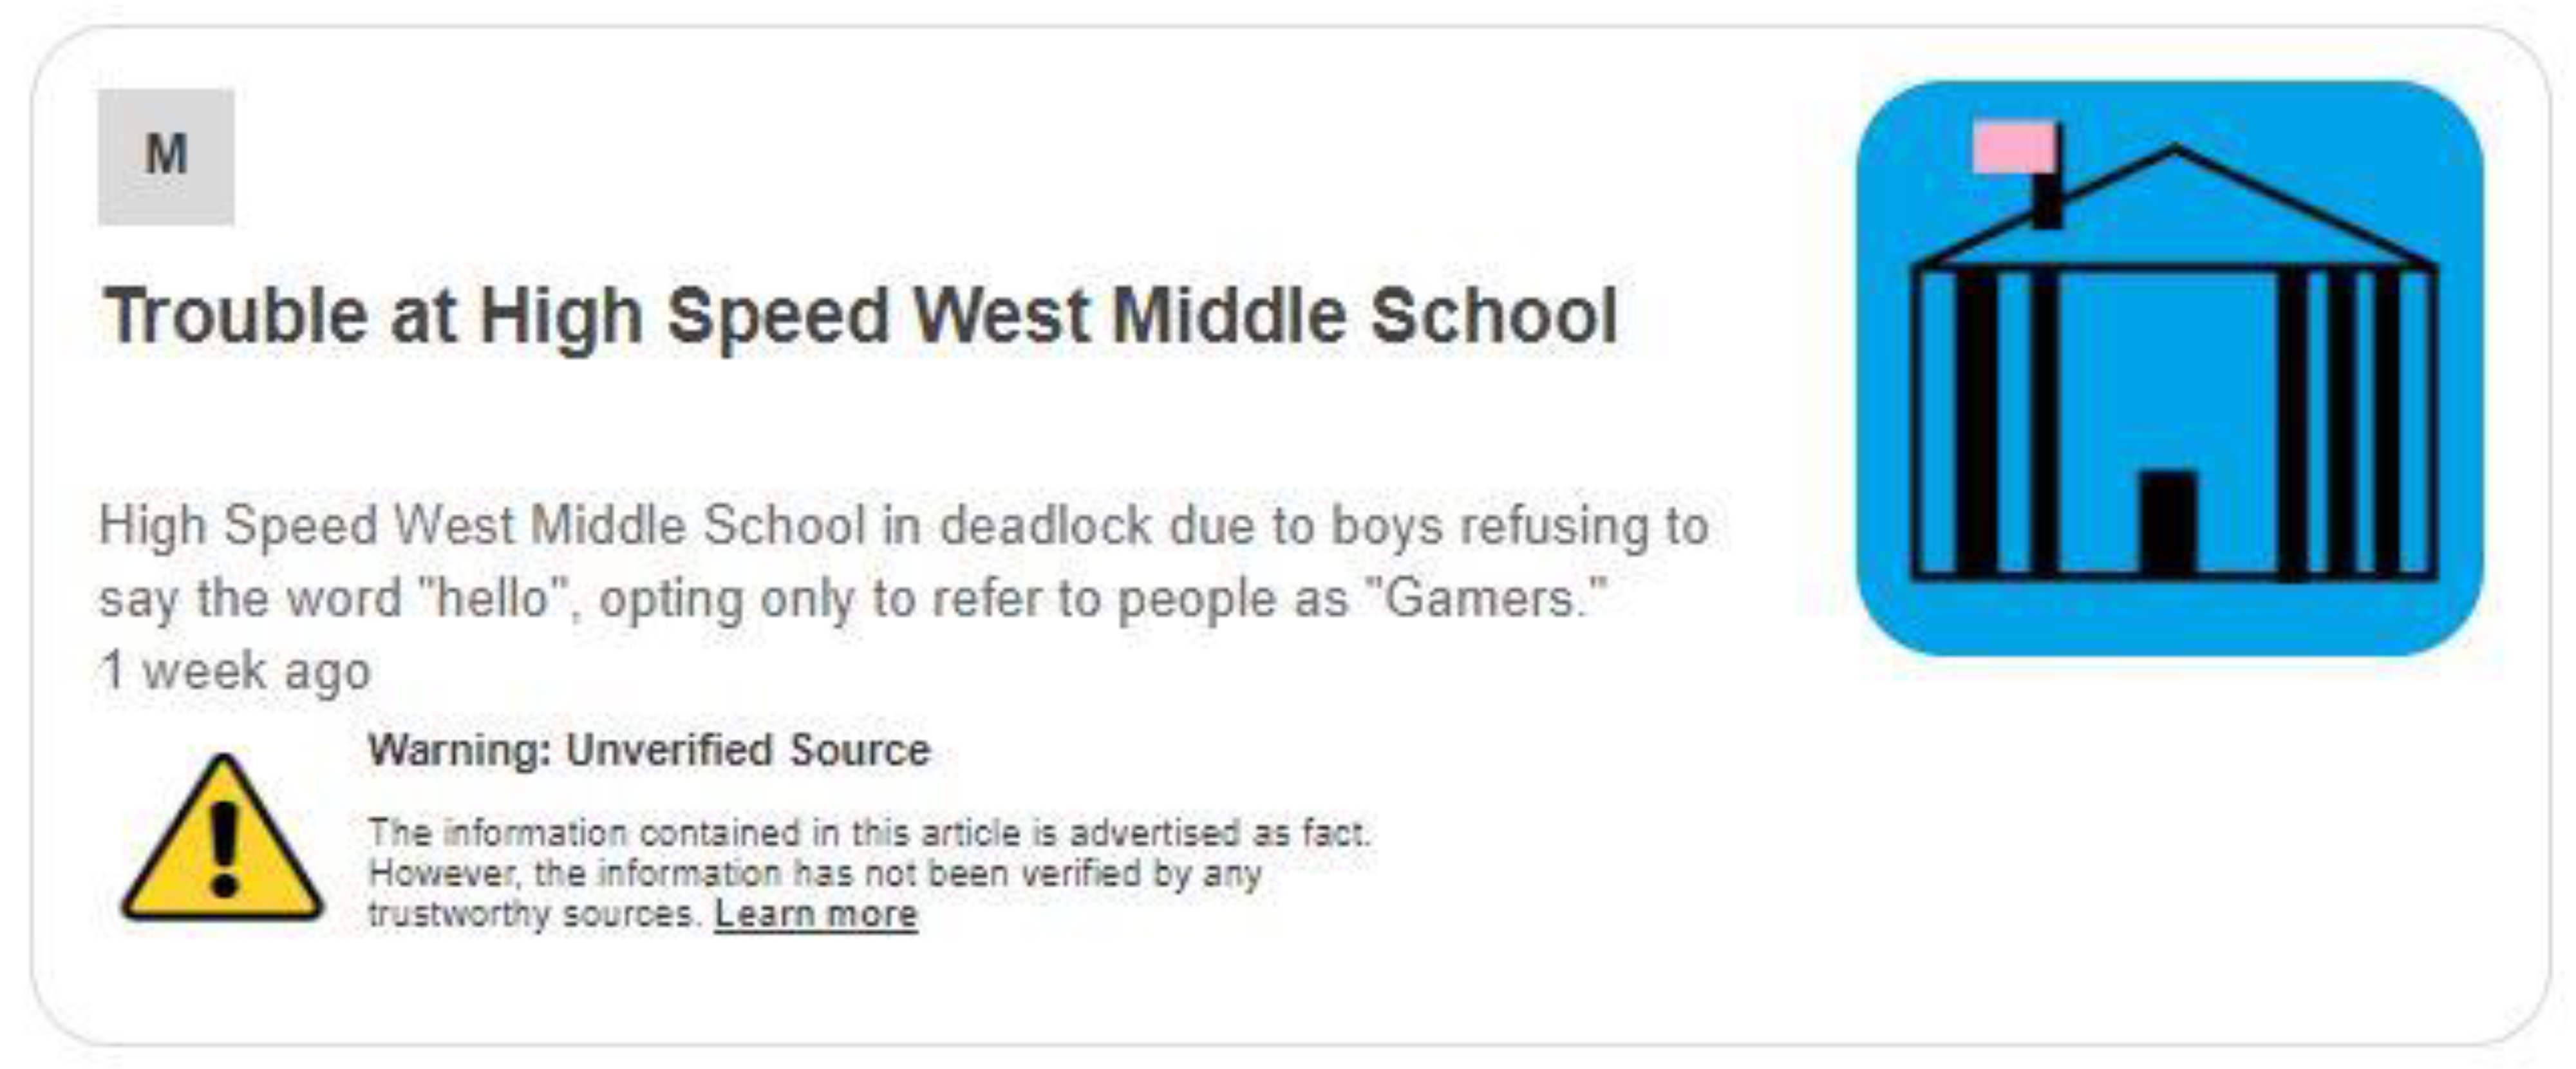
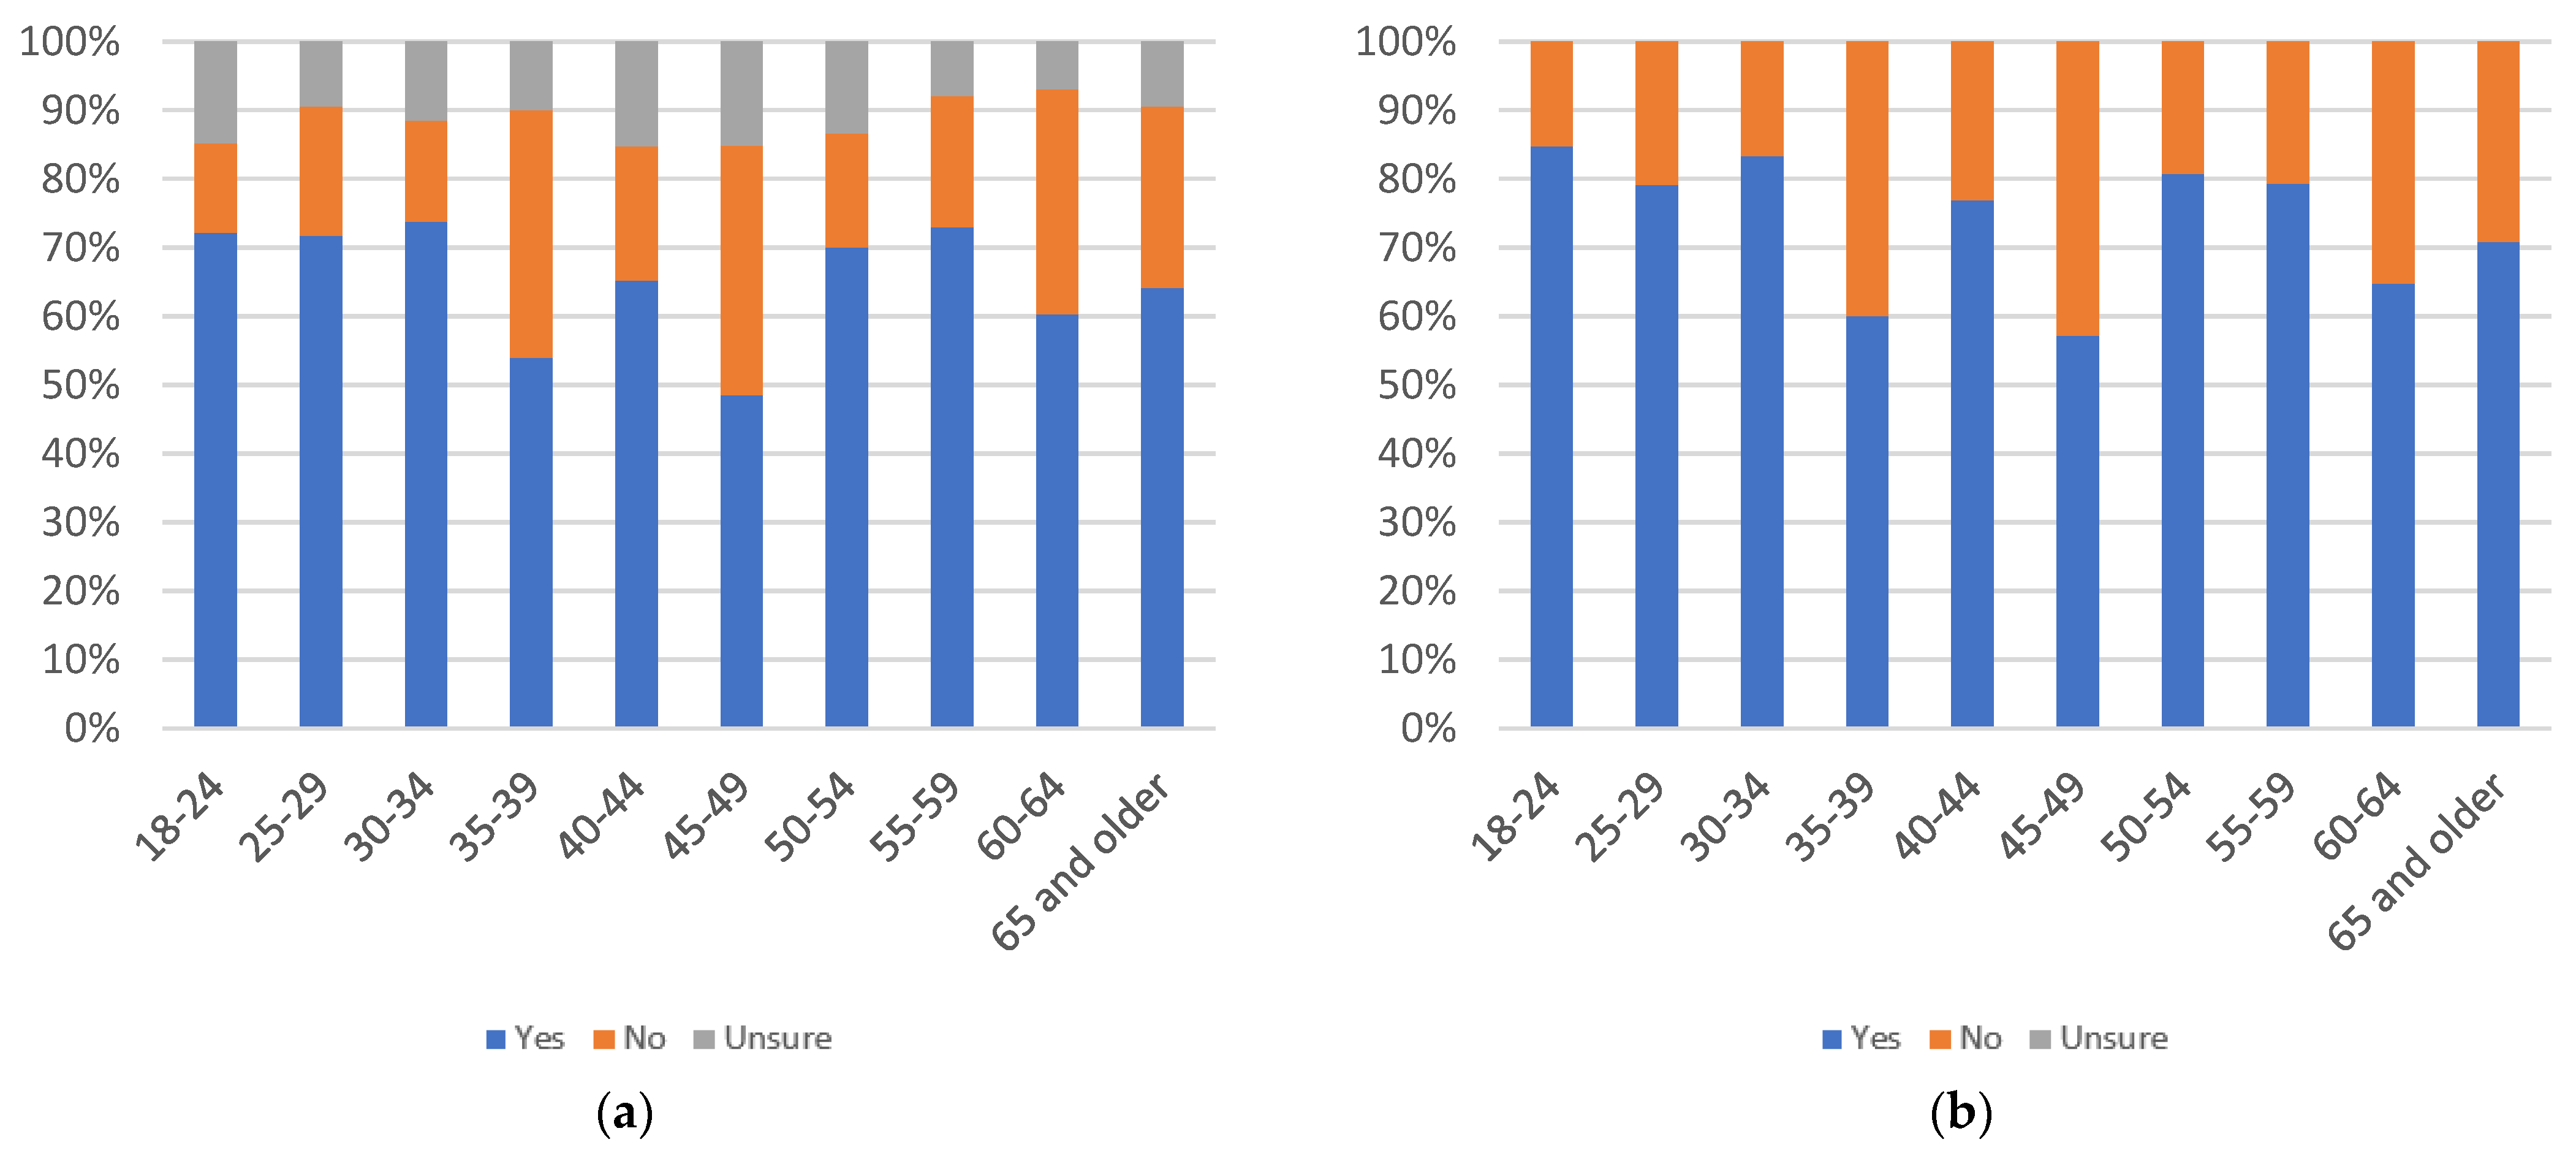
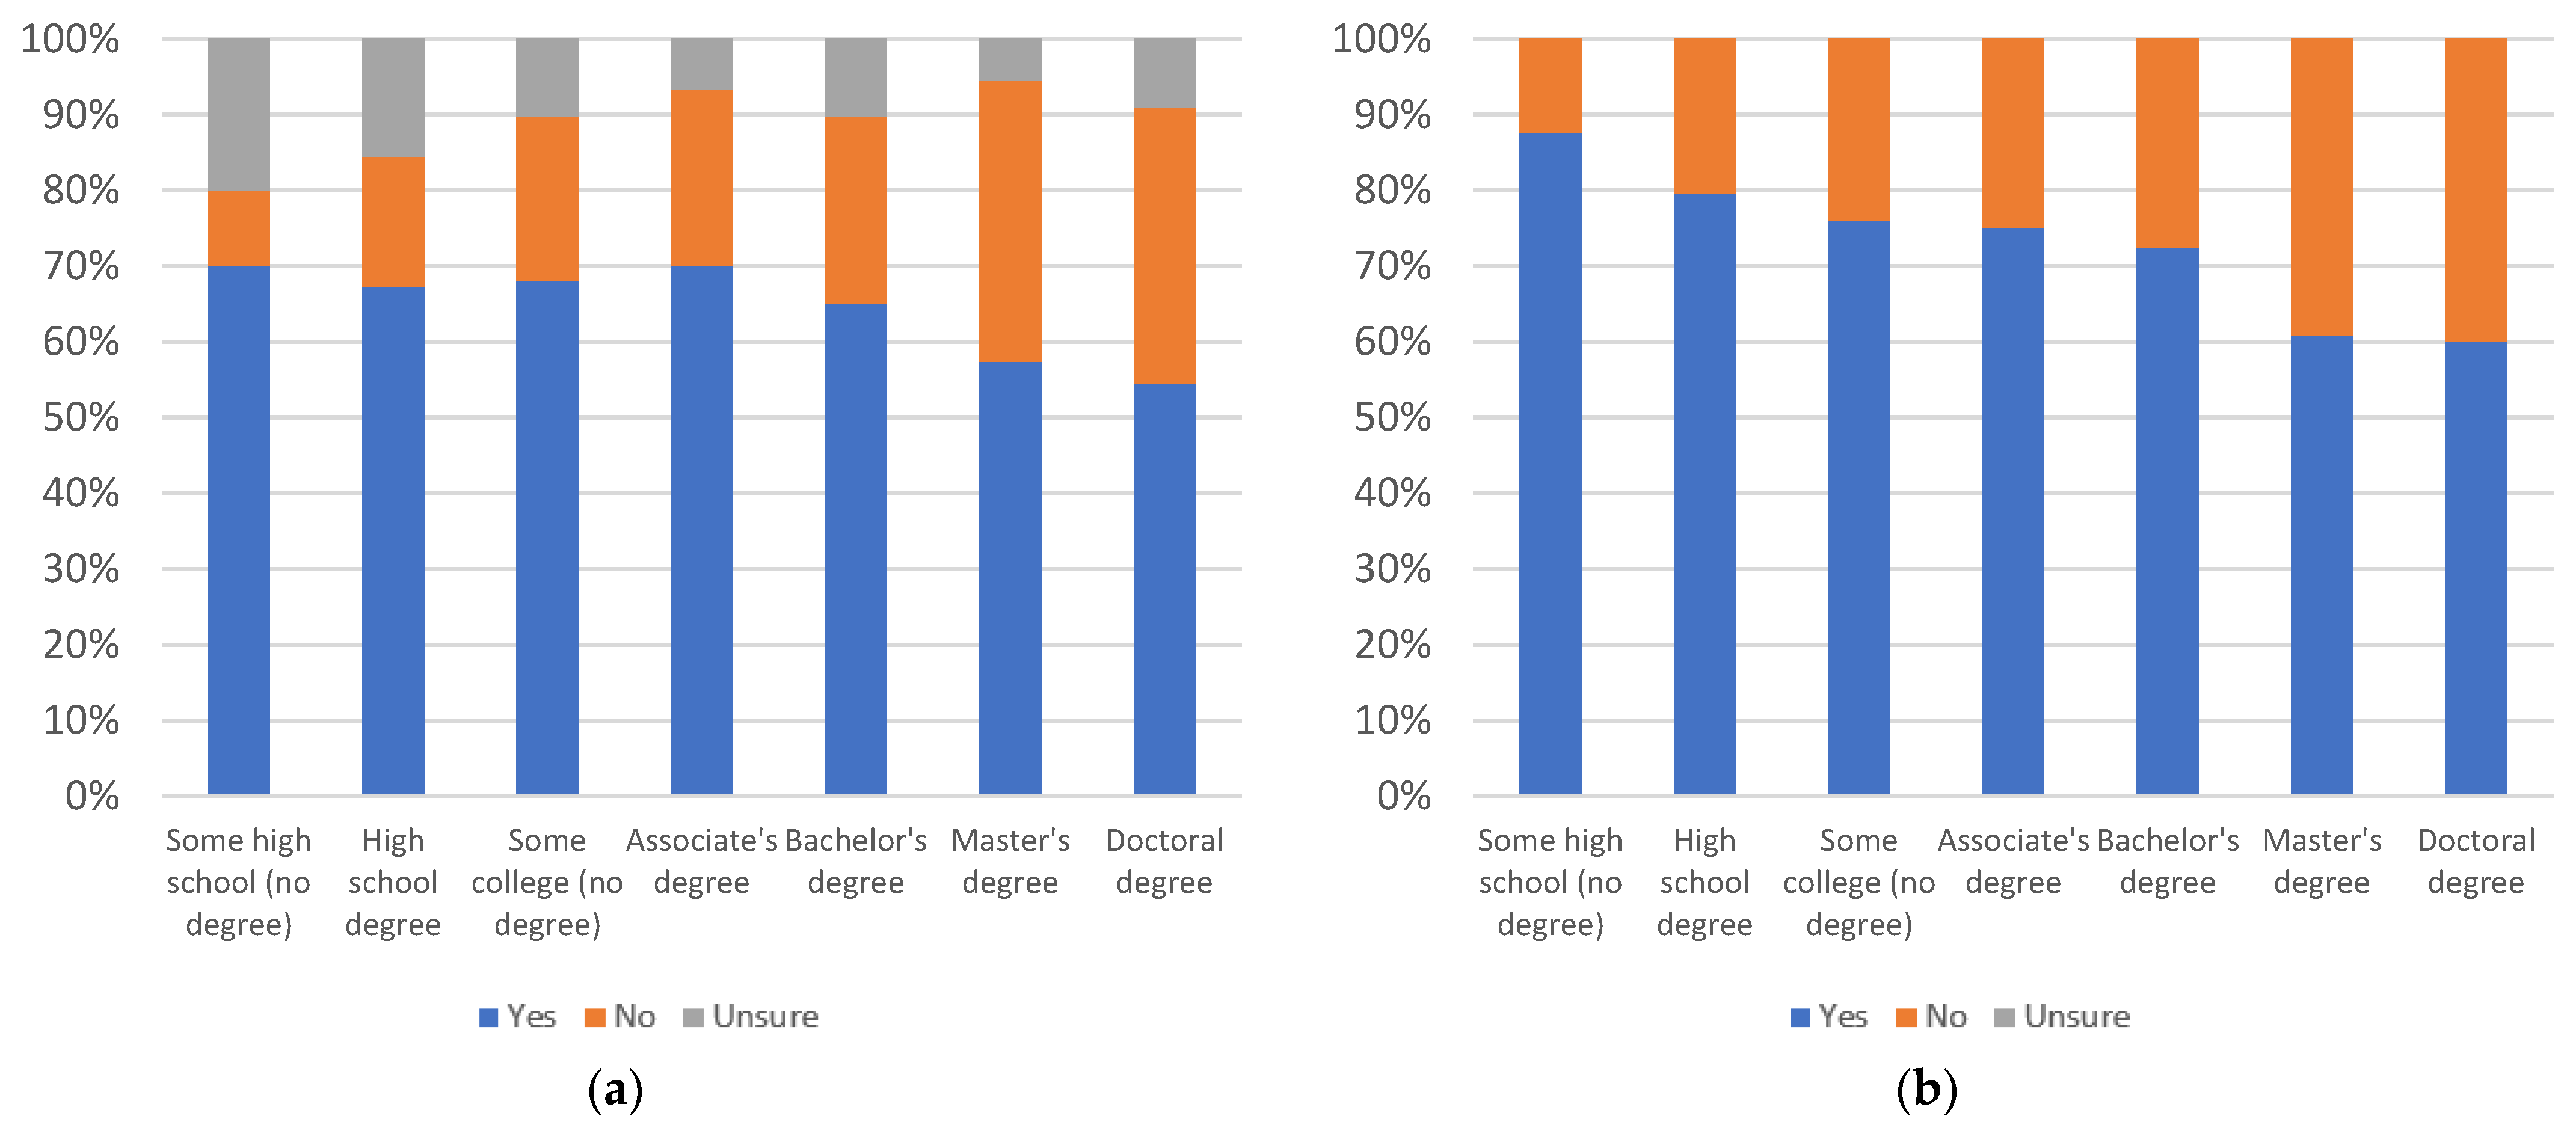
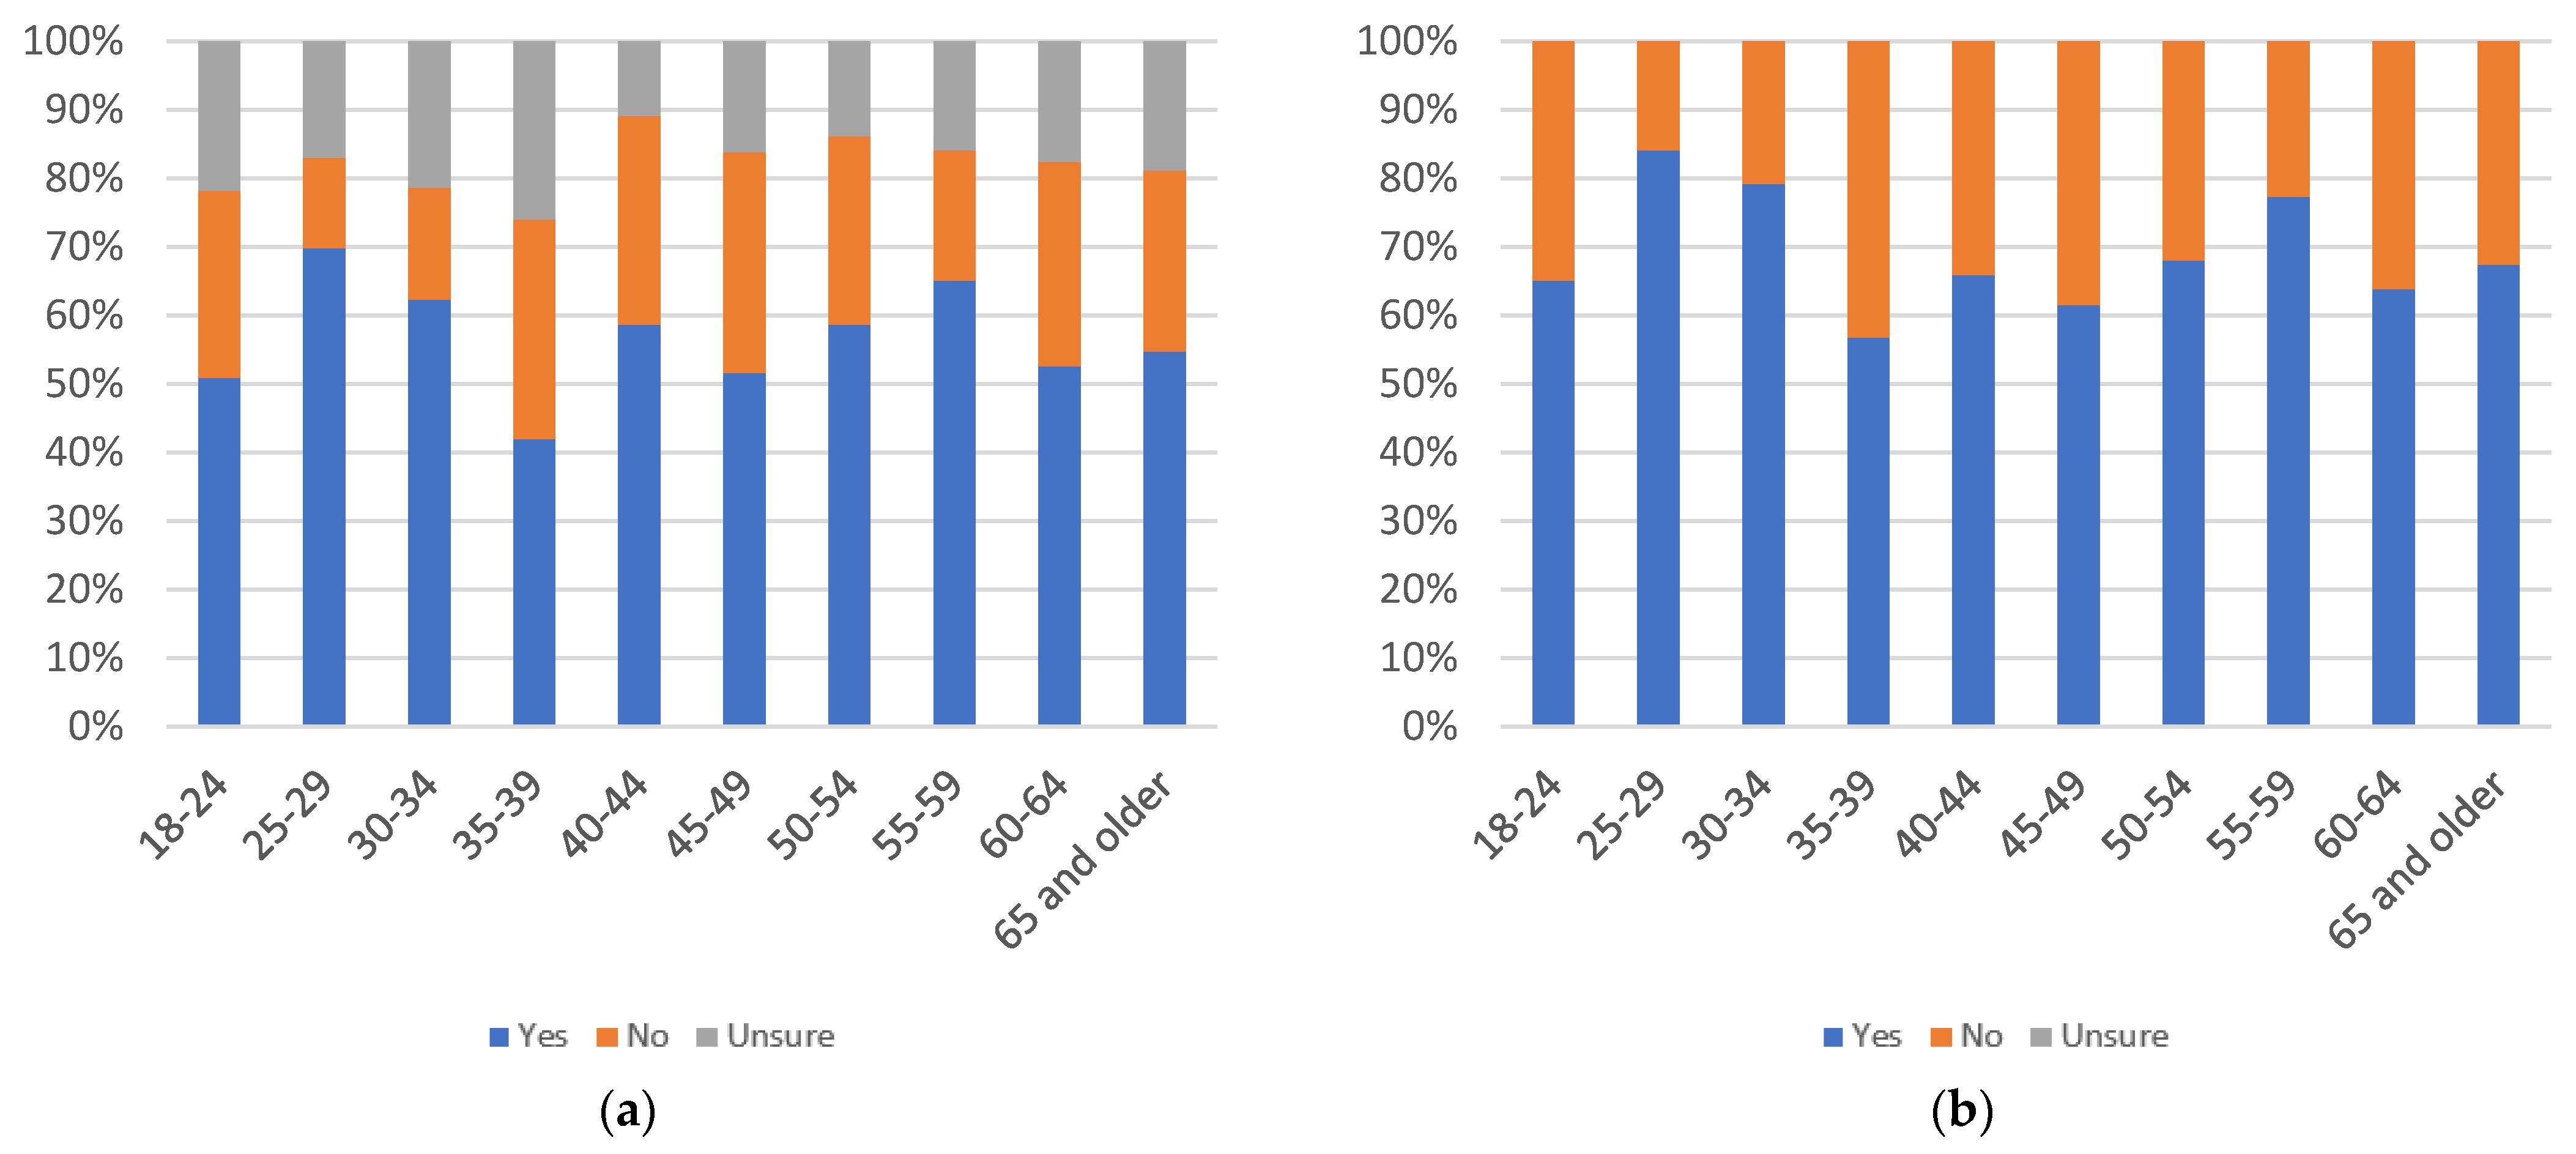
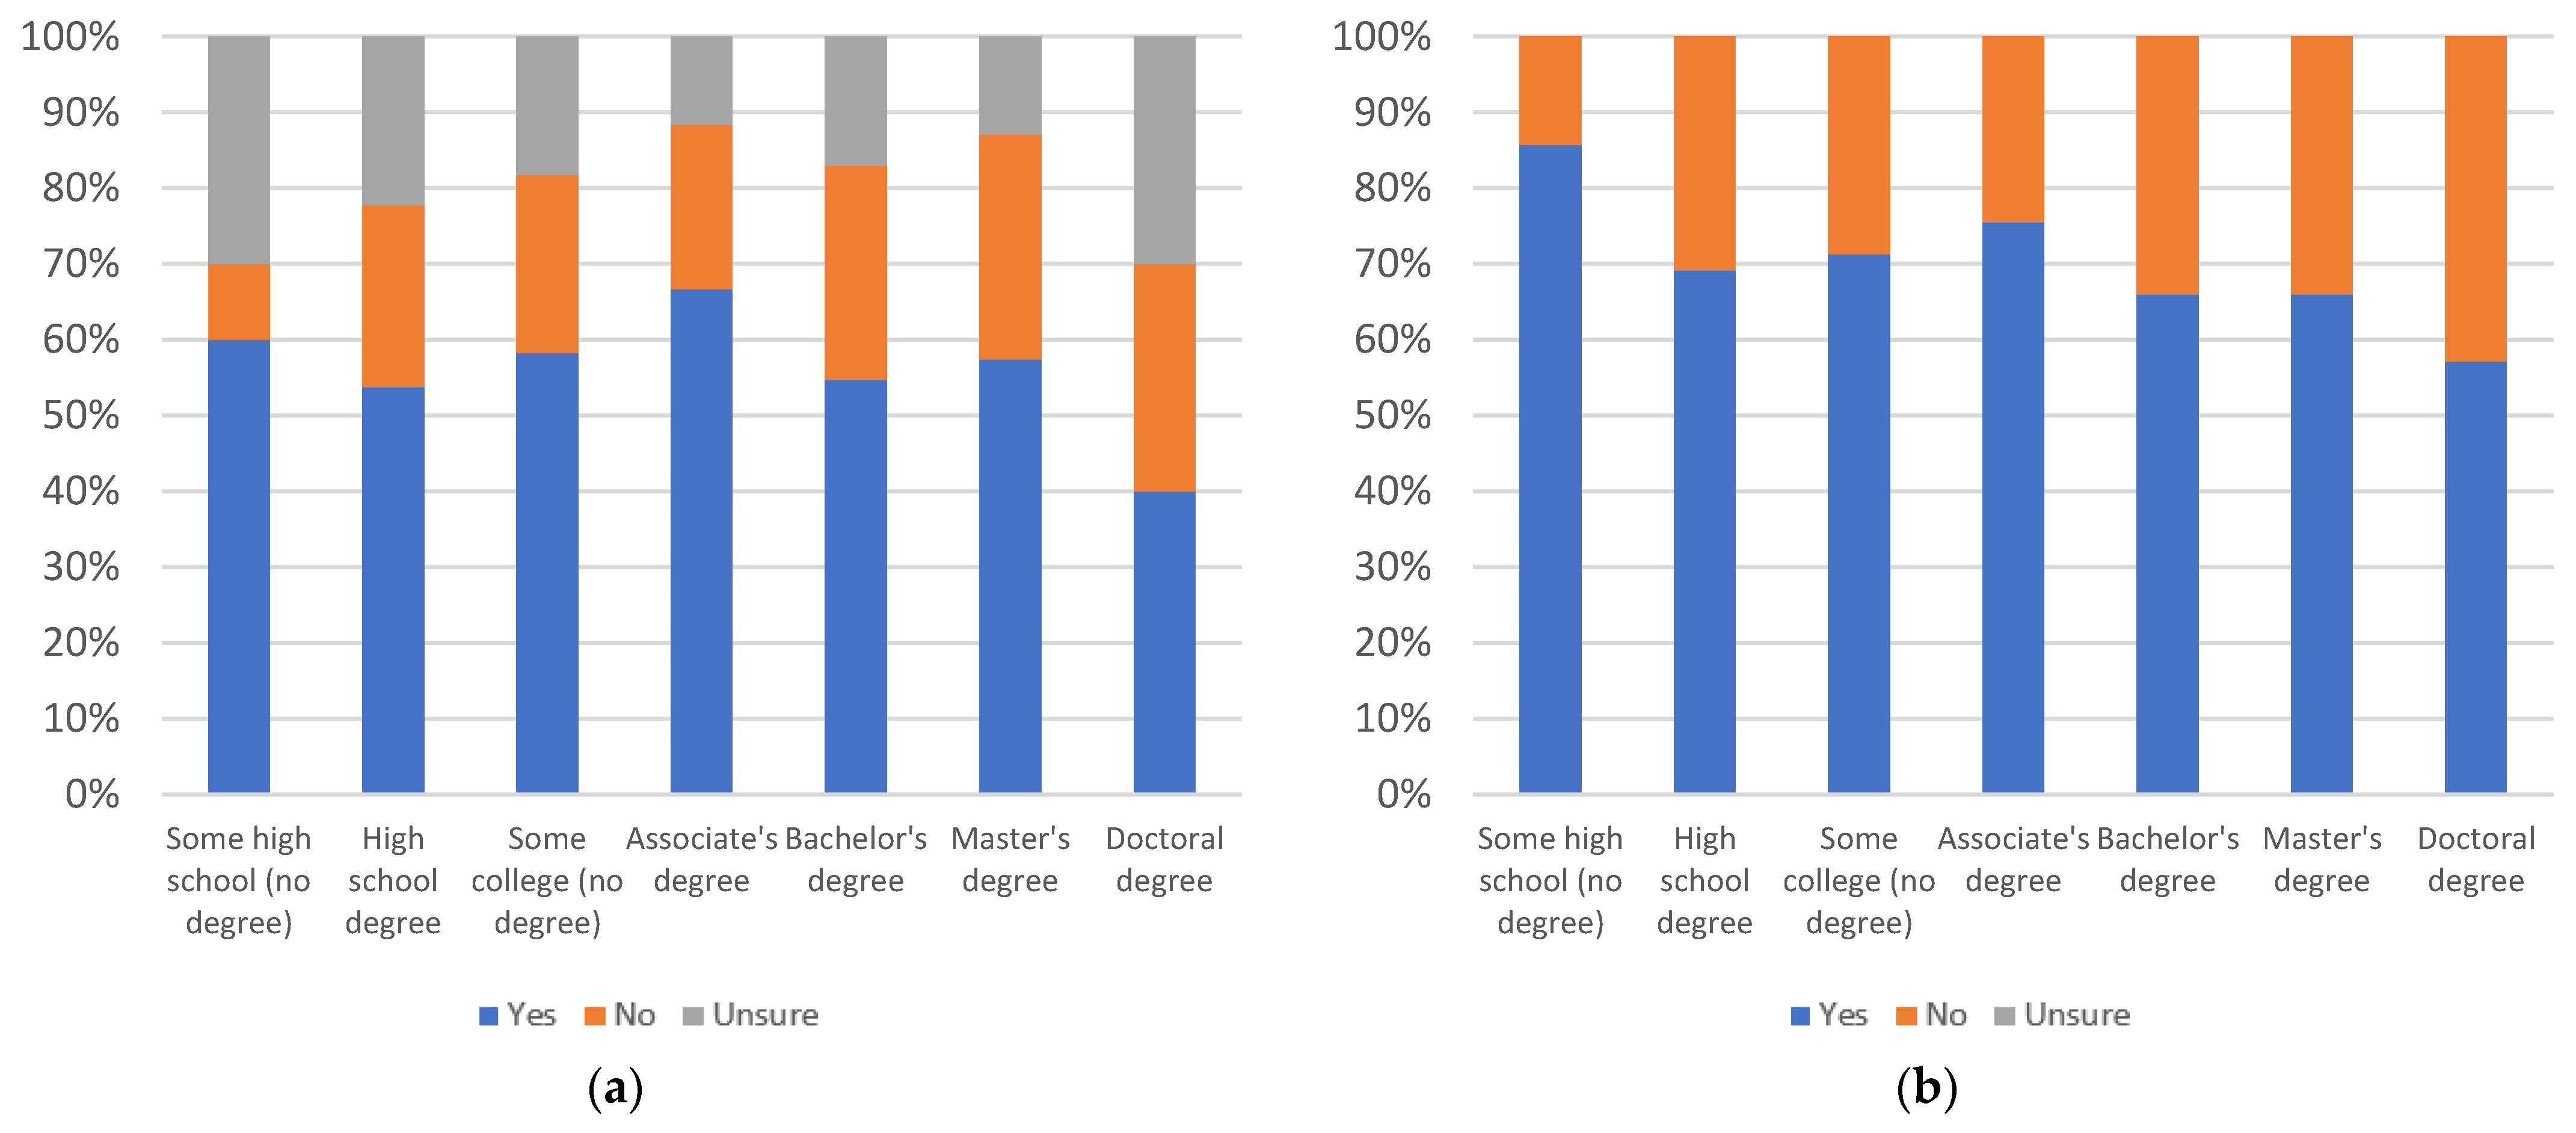
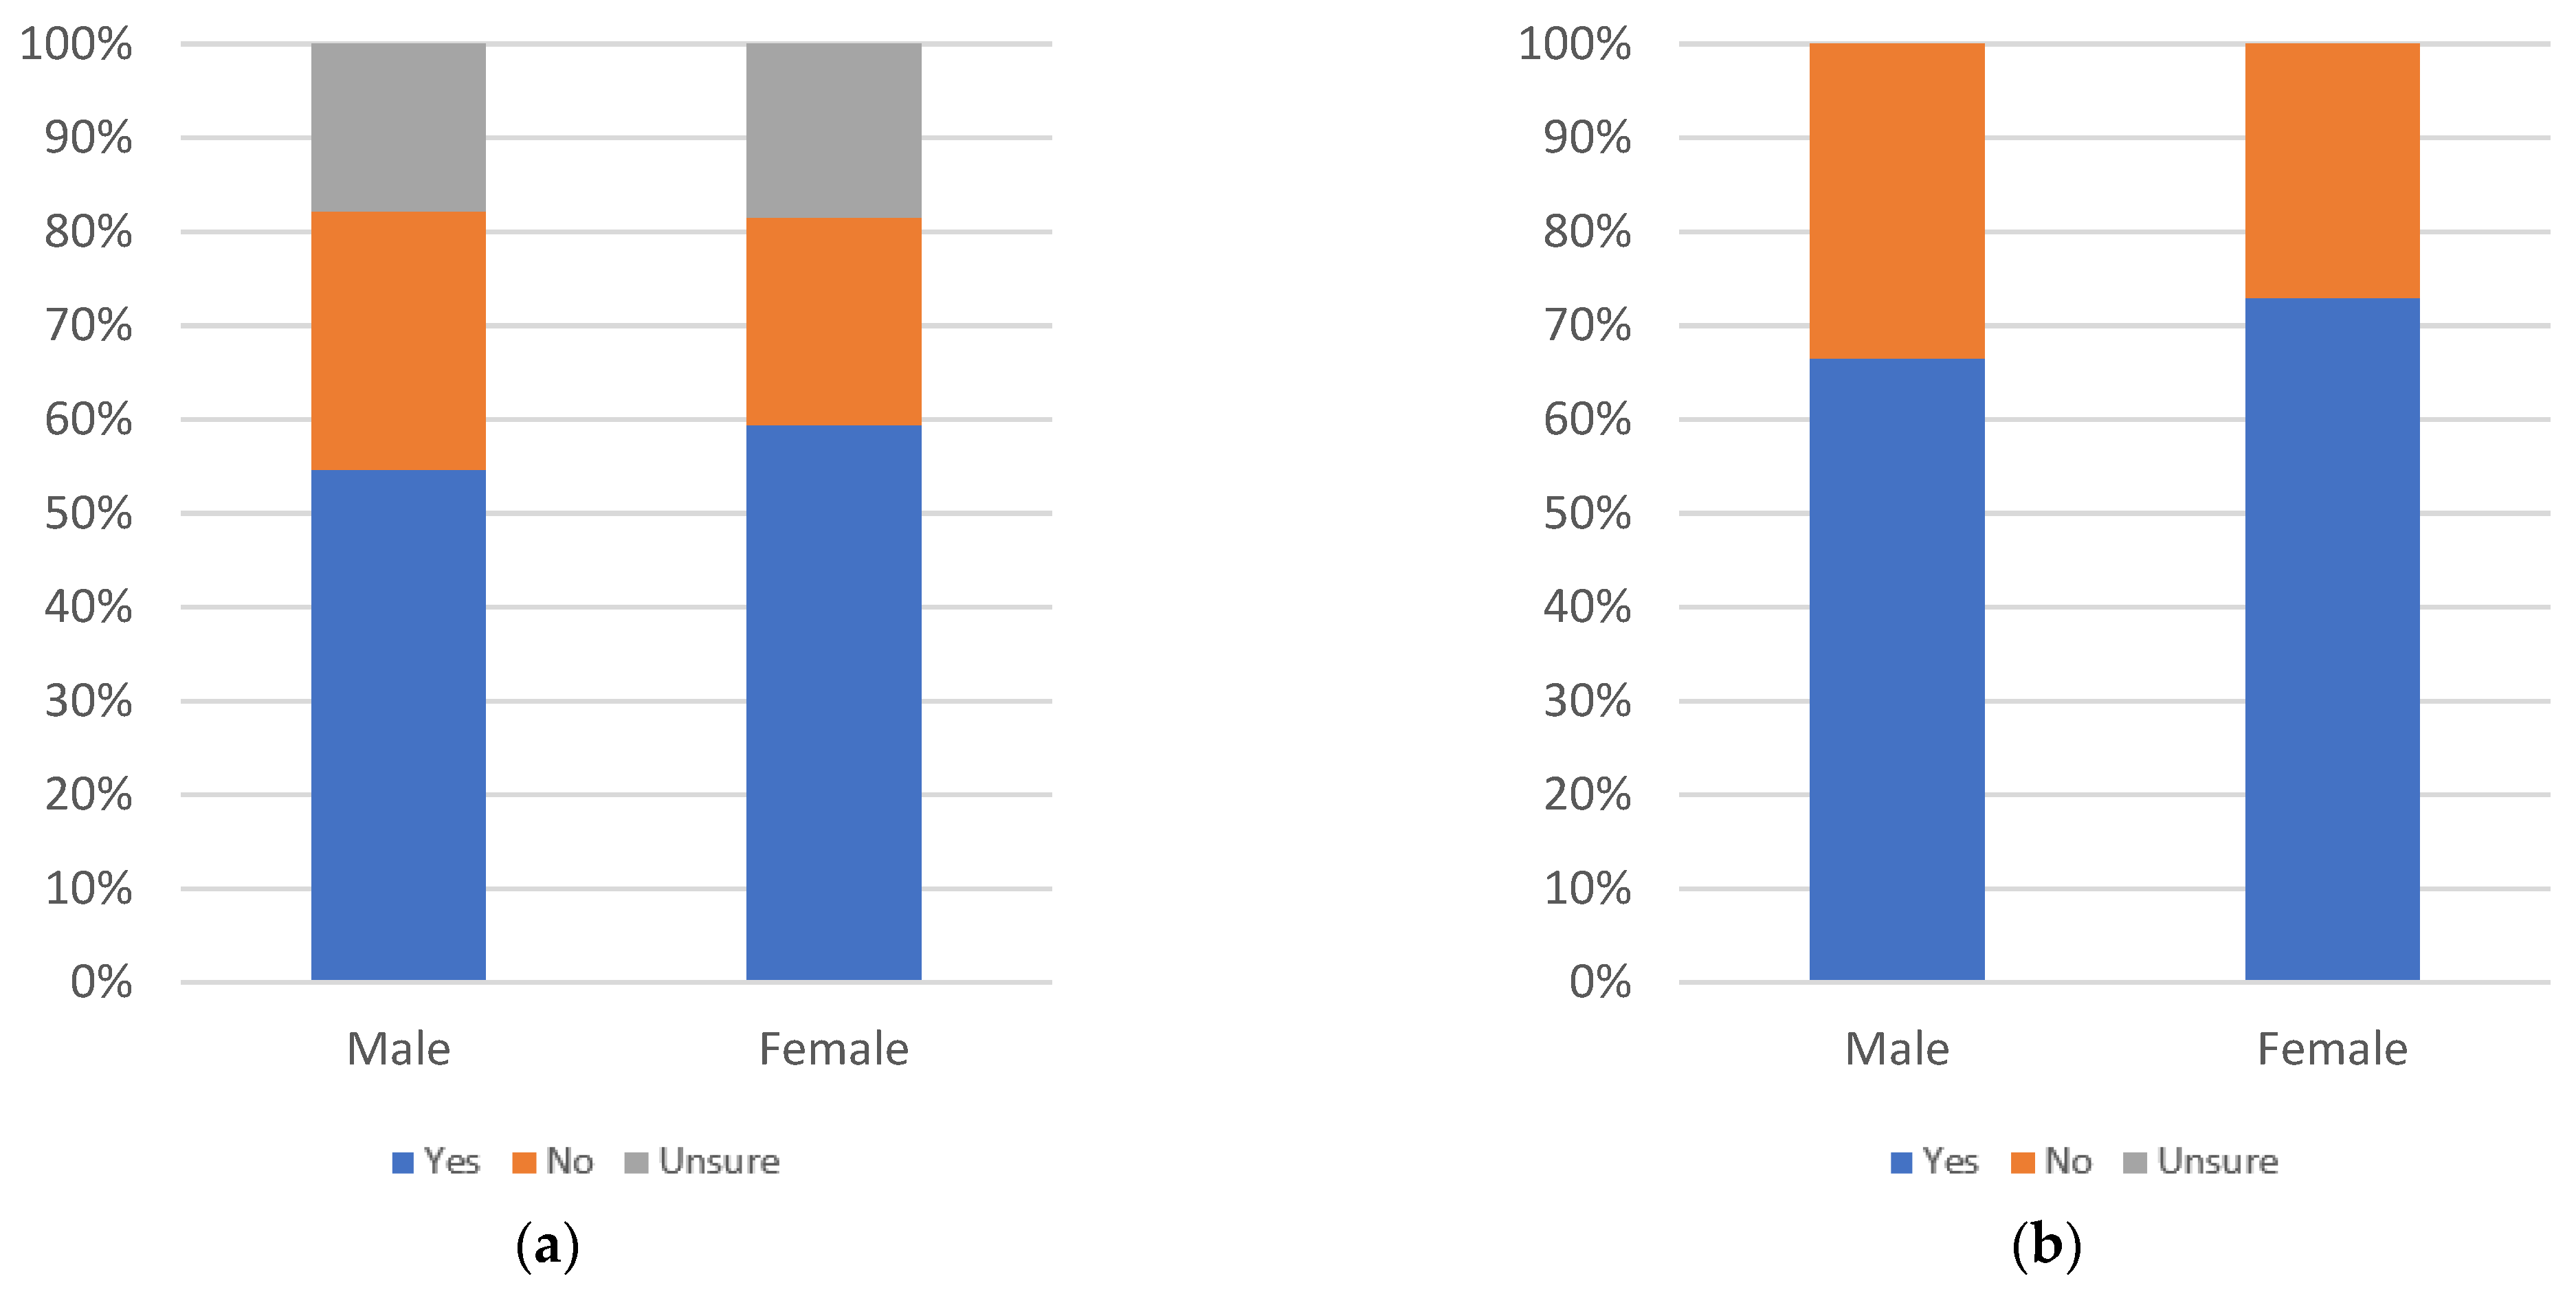
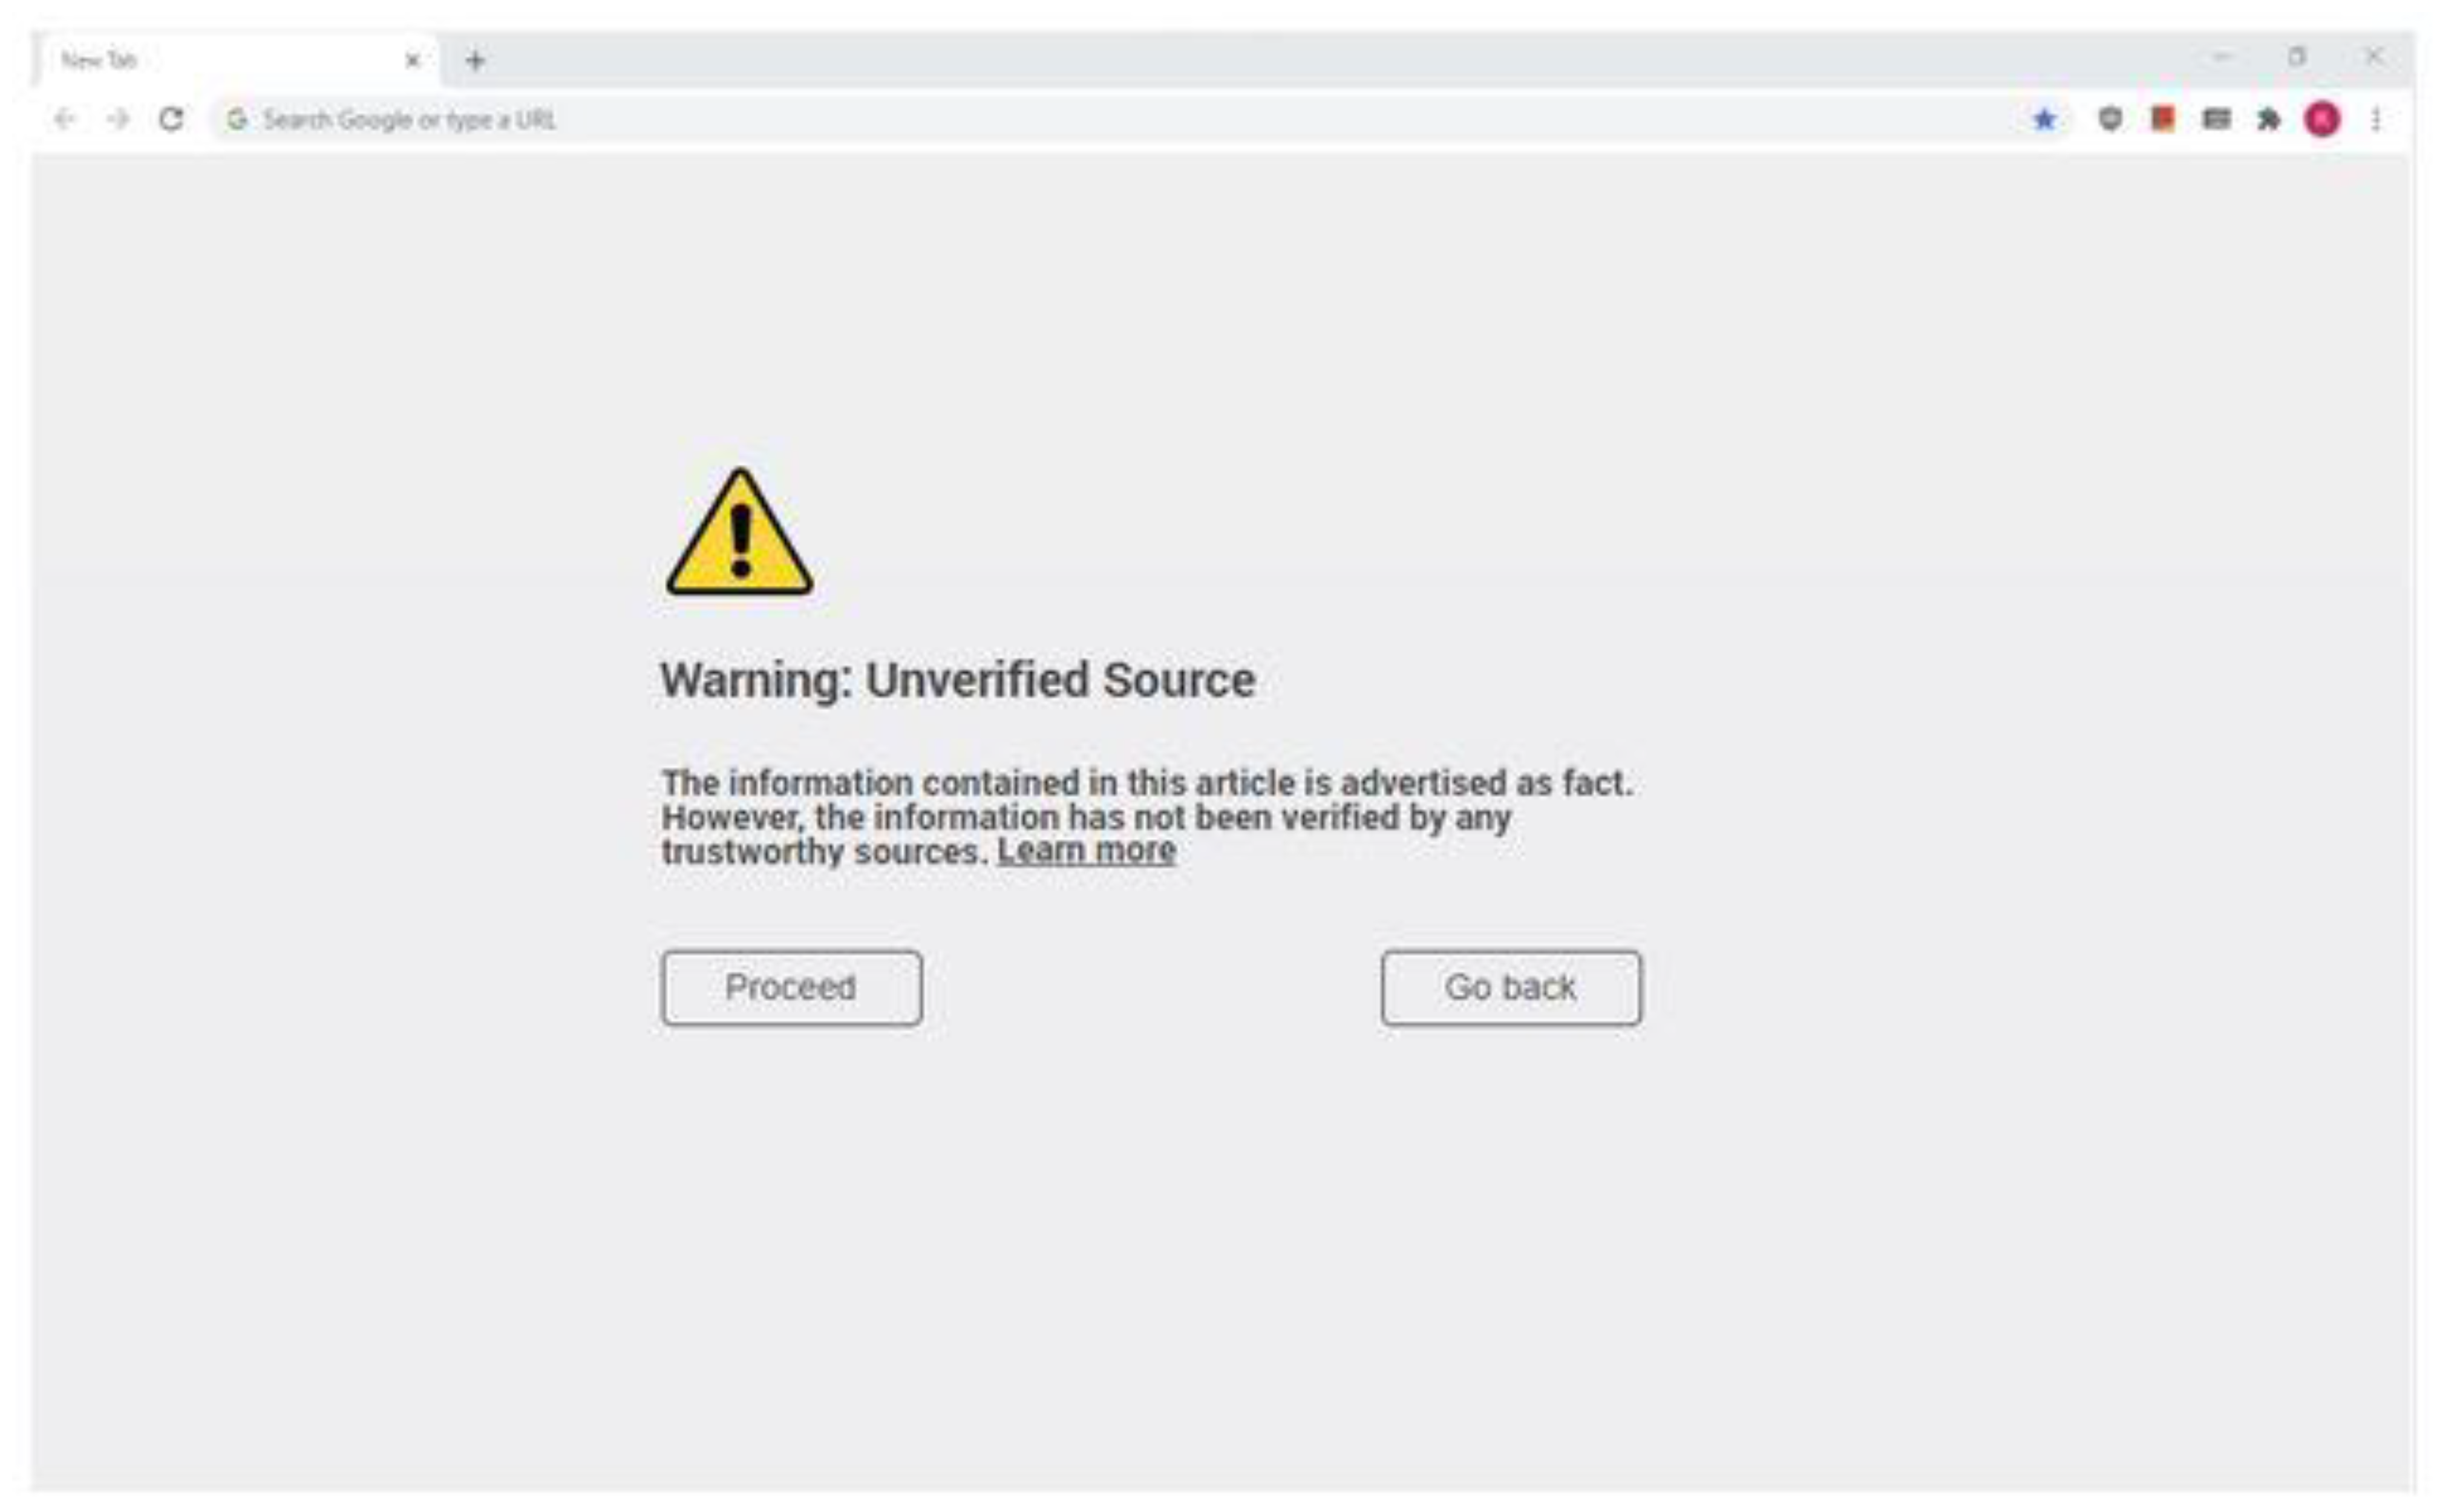
The helpfulness of informational label 1 (shown in Figure 4), when it appears underneath a news article automatically, is considered in Figure 5, Figure 6 and 
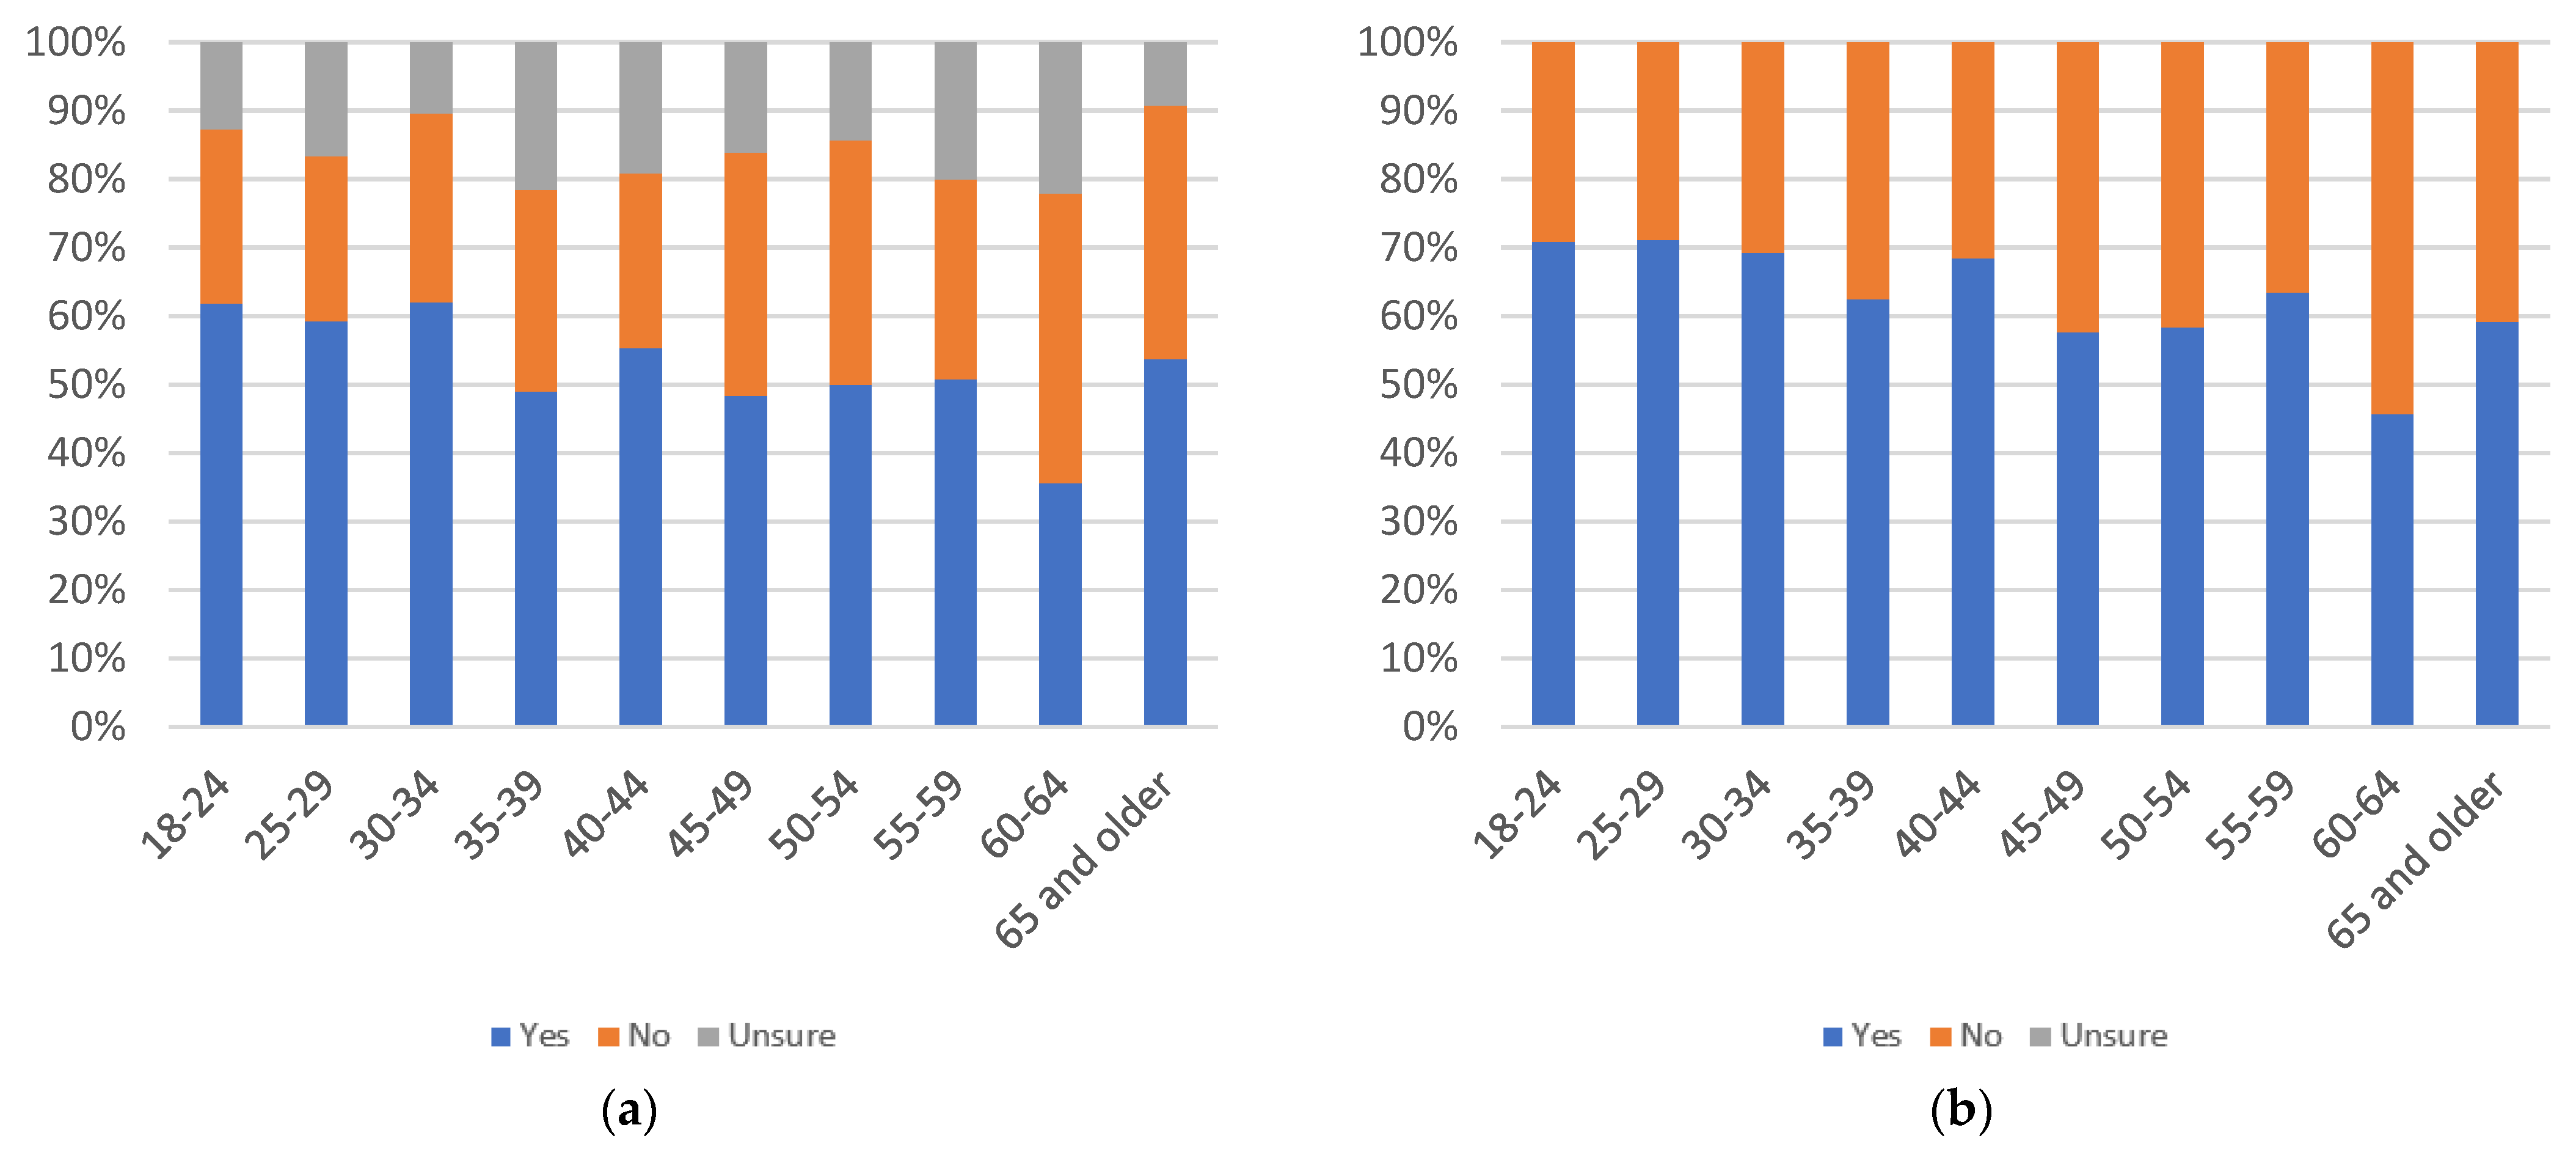
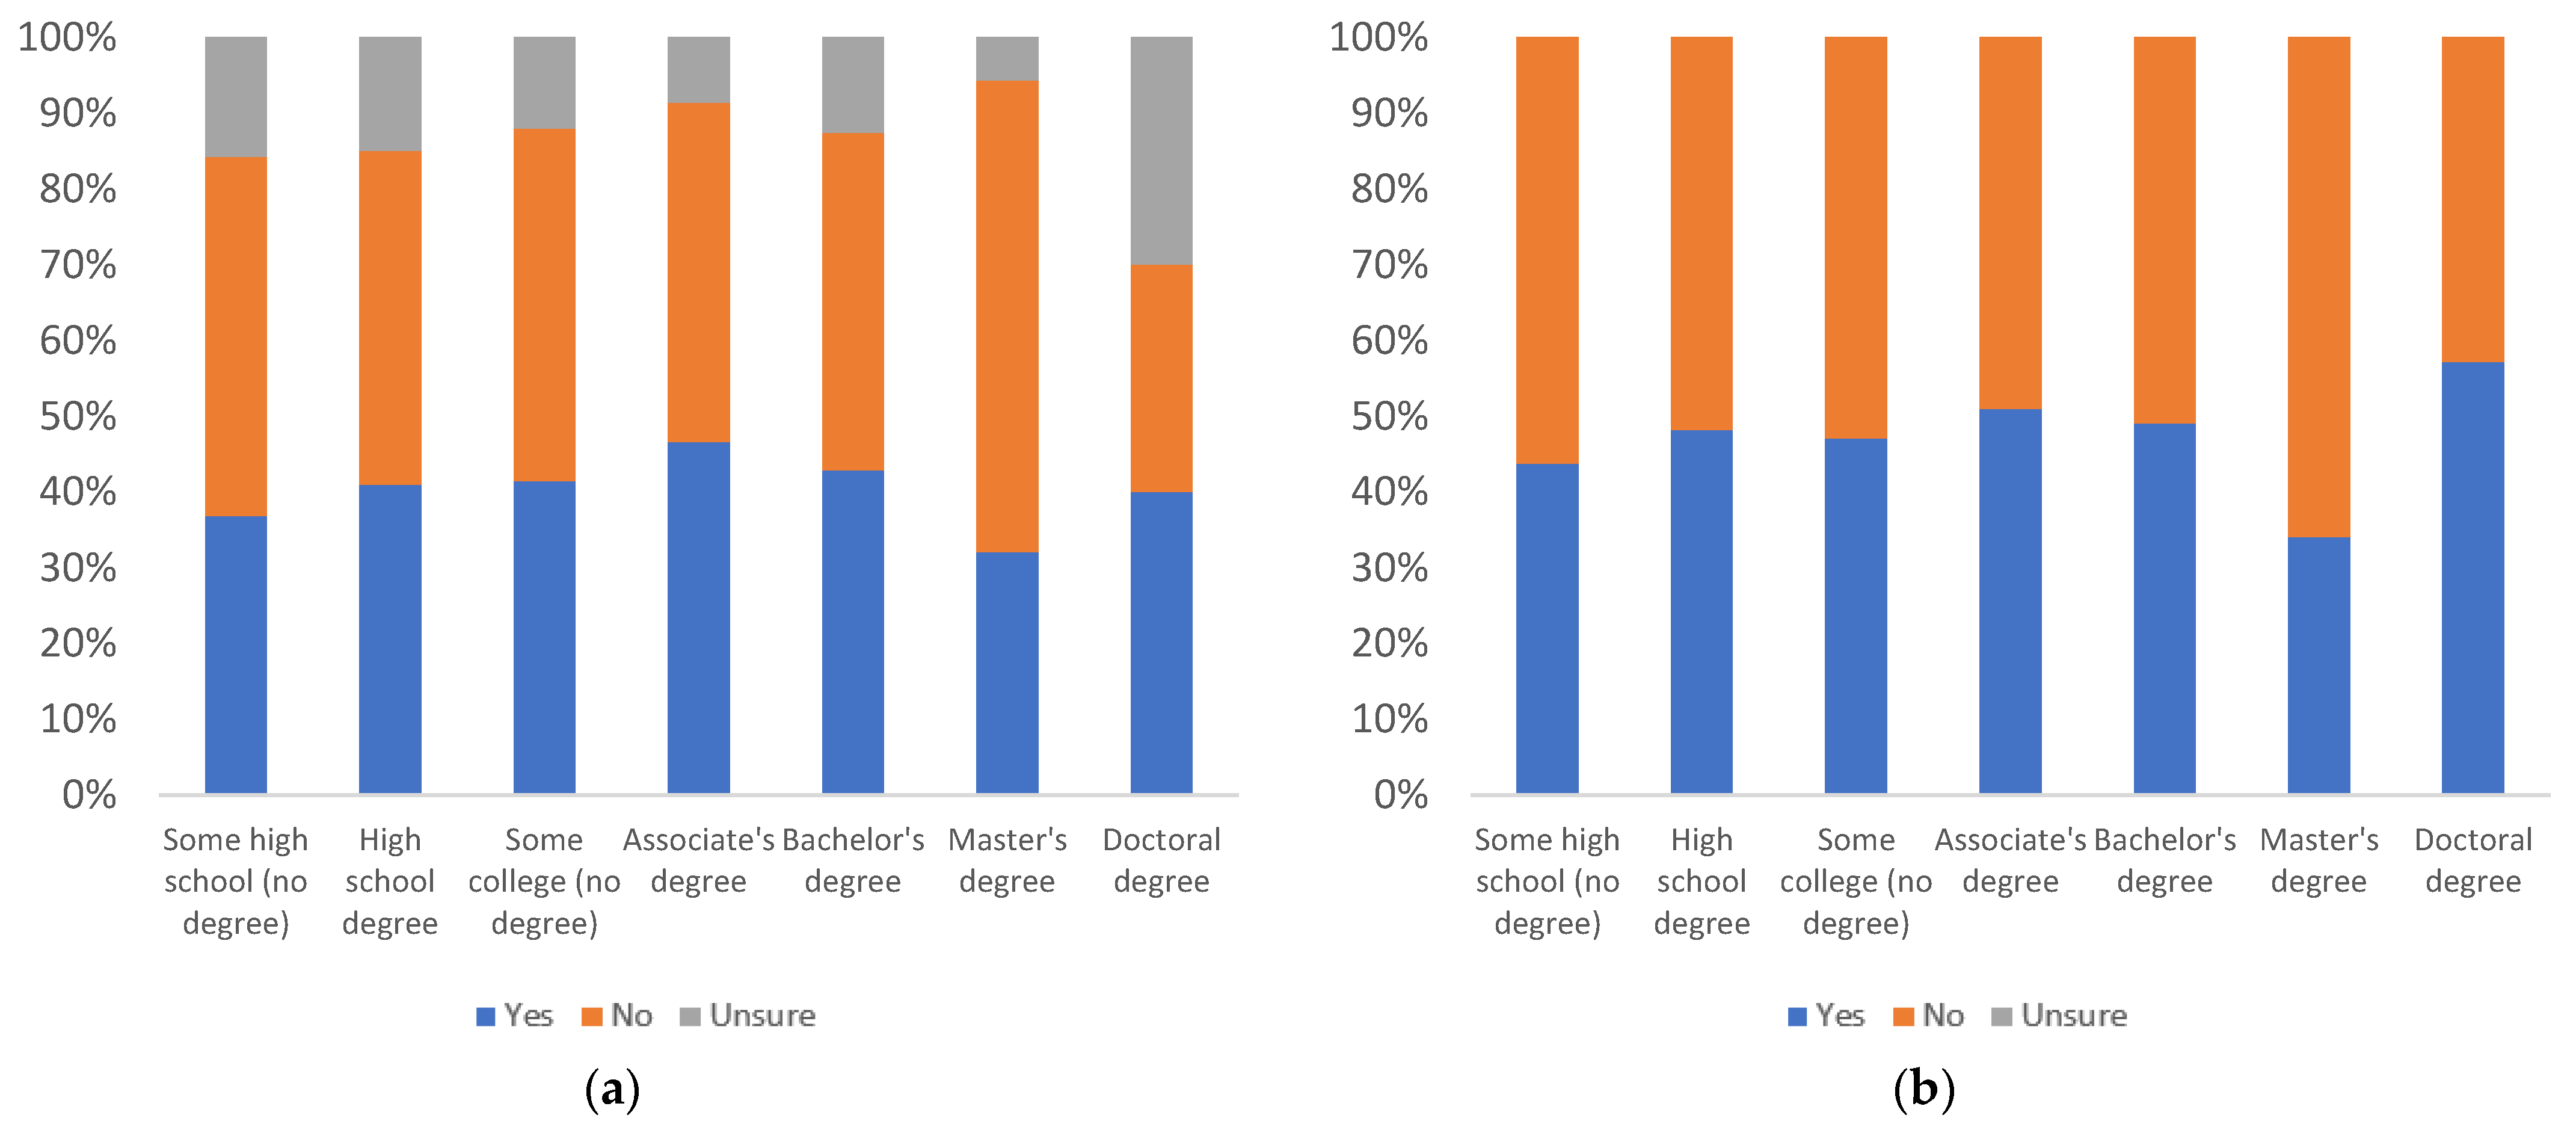
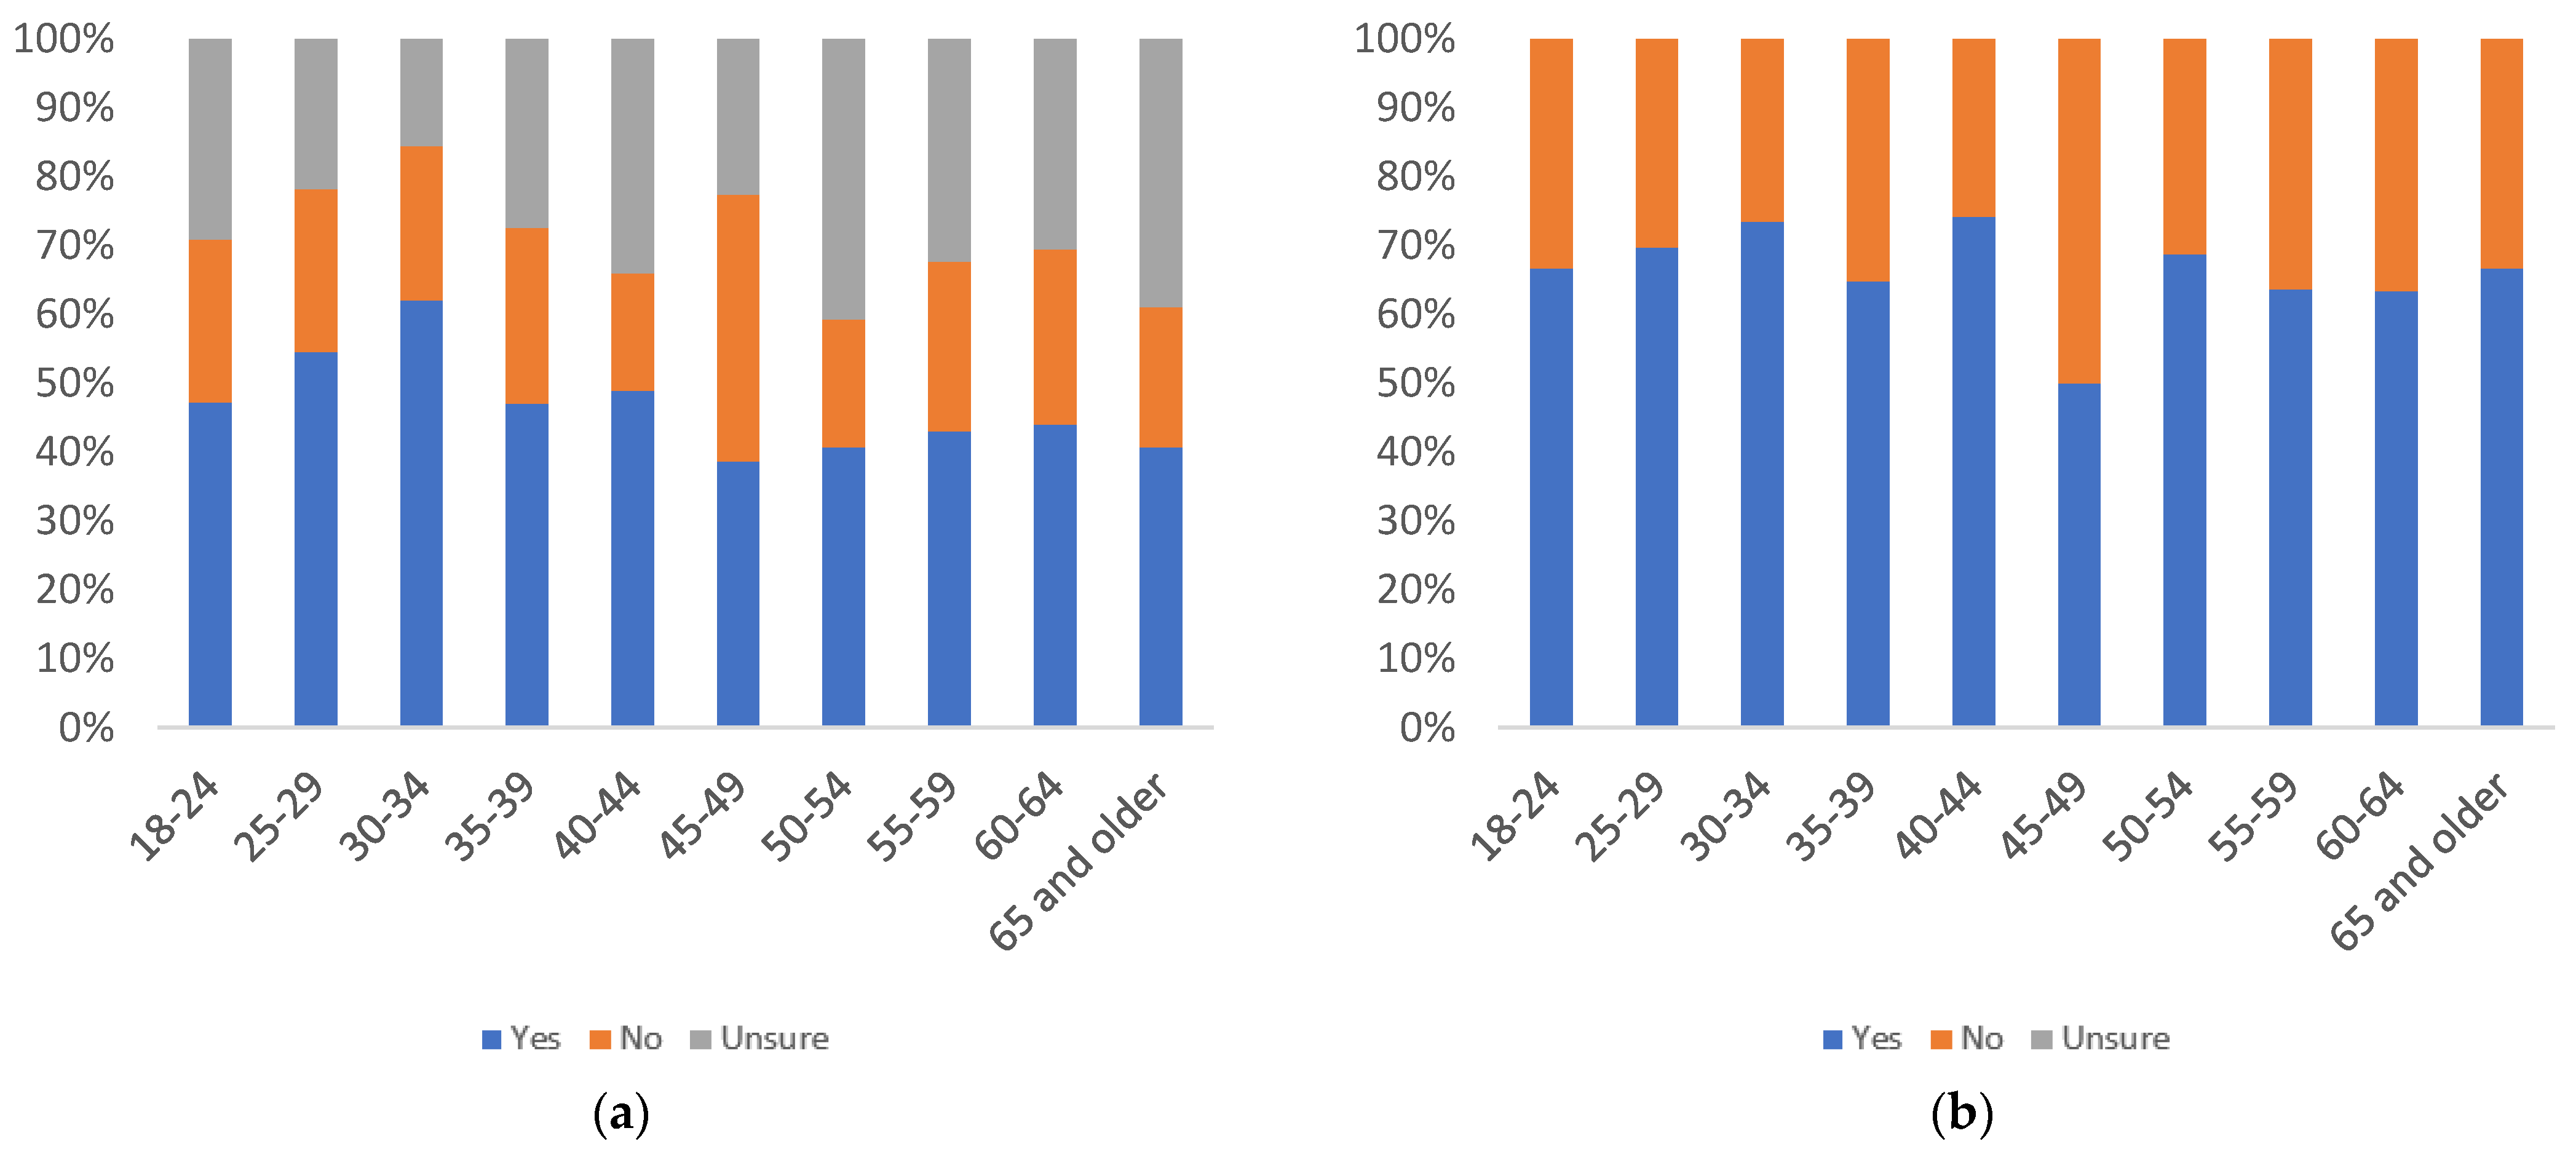
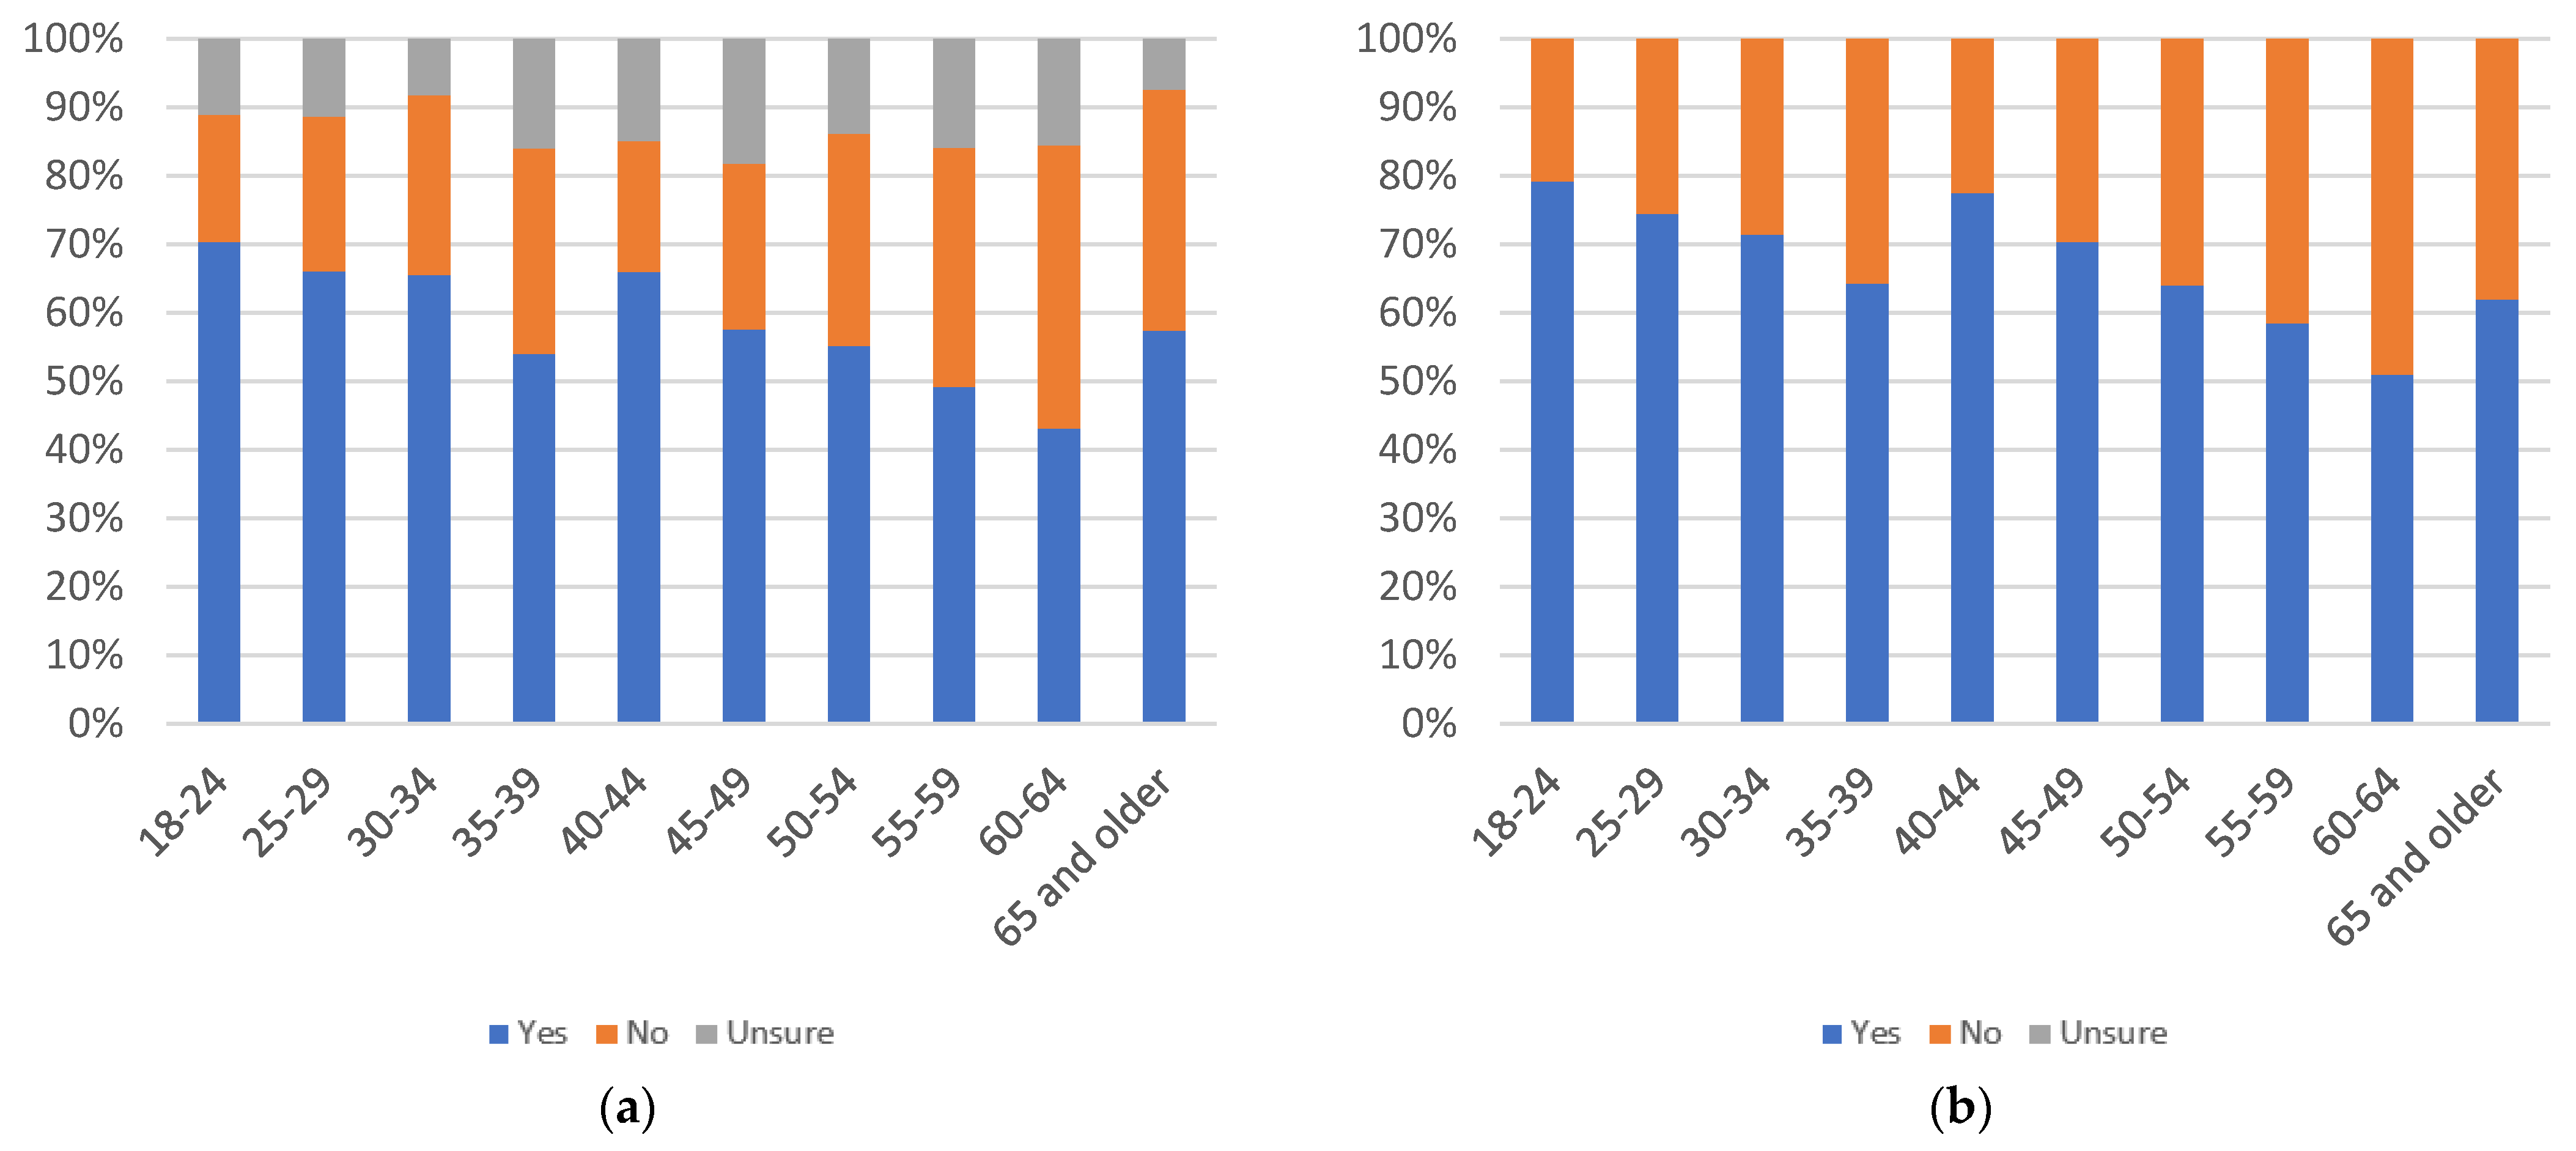
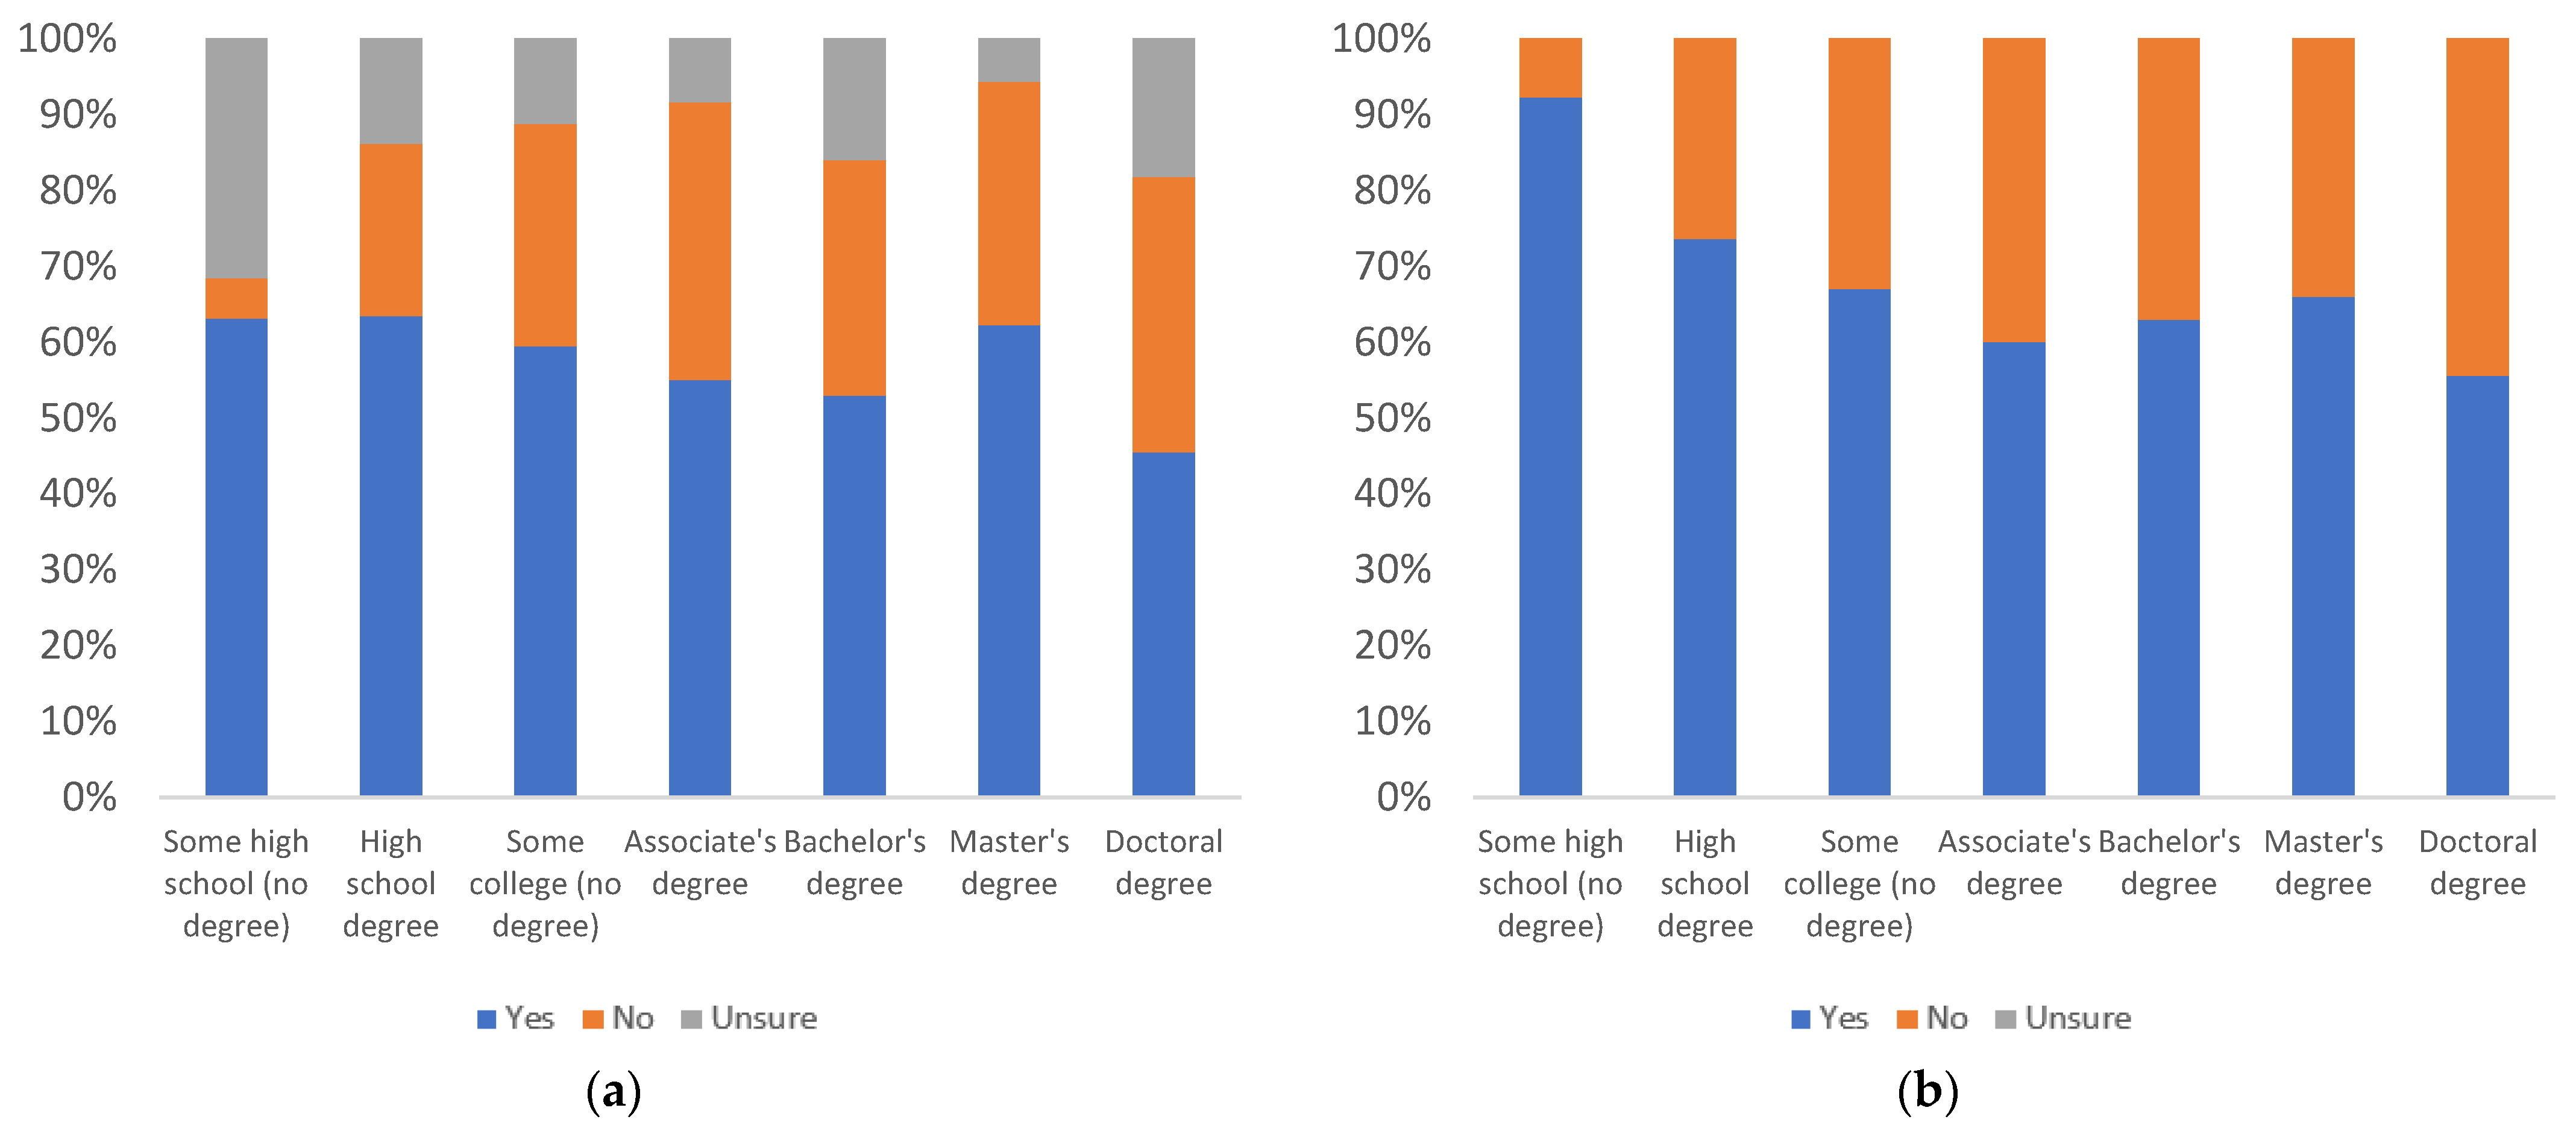
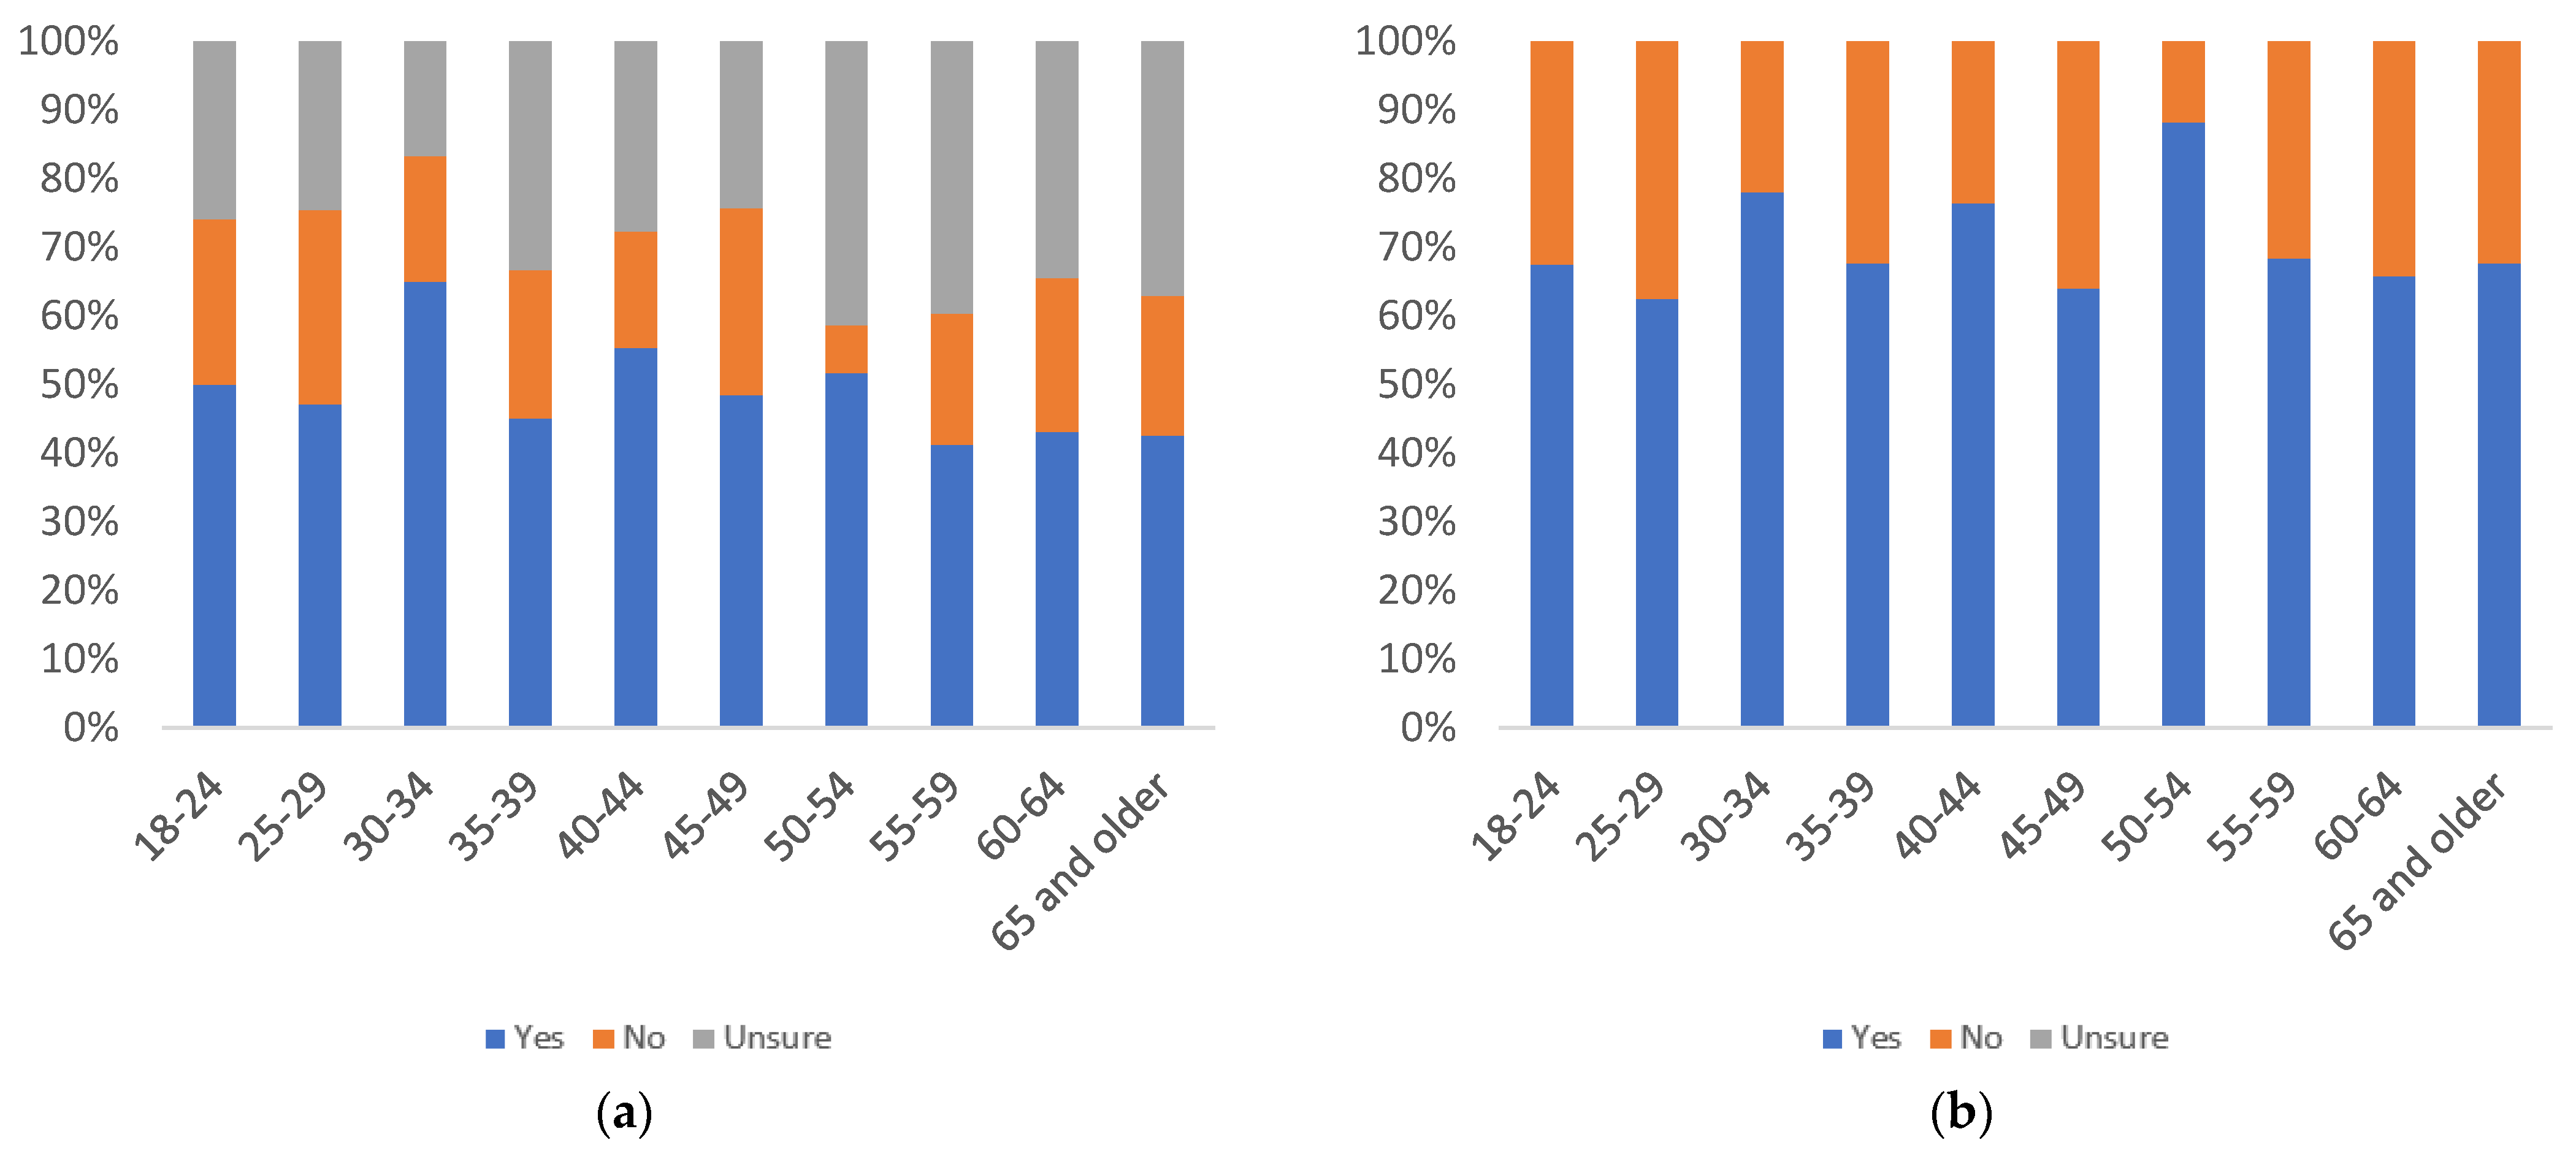
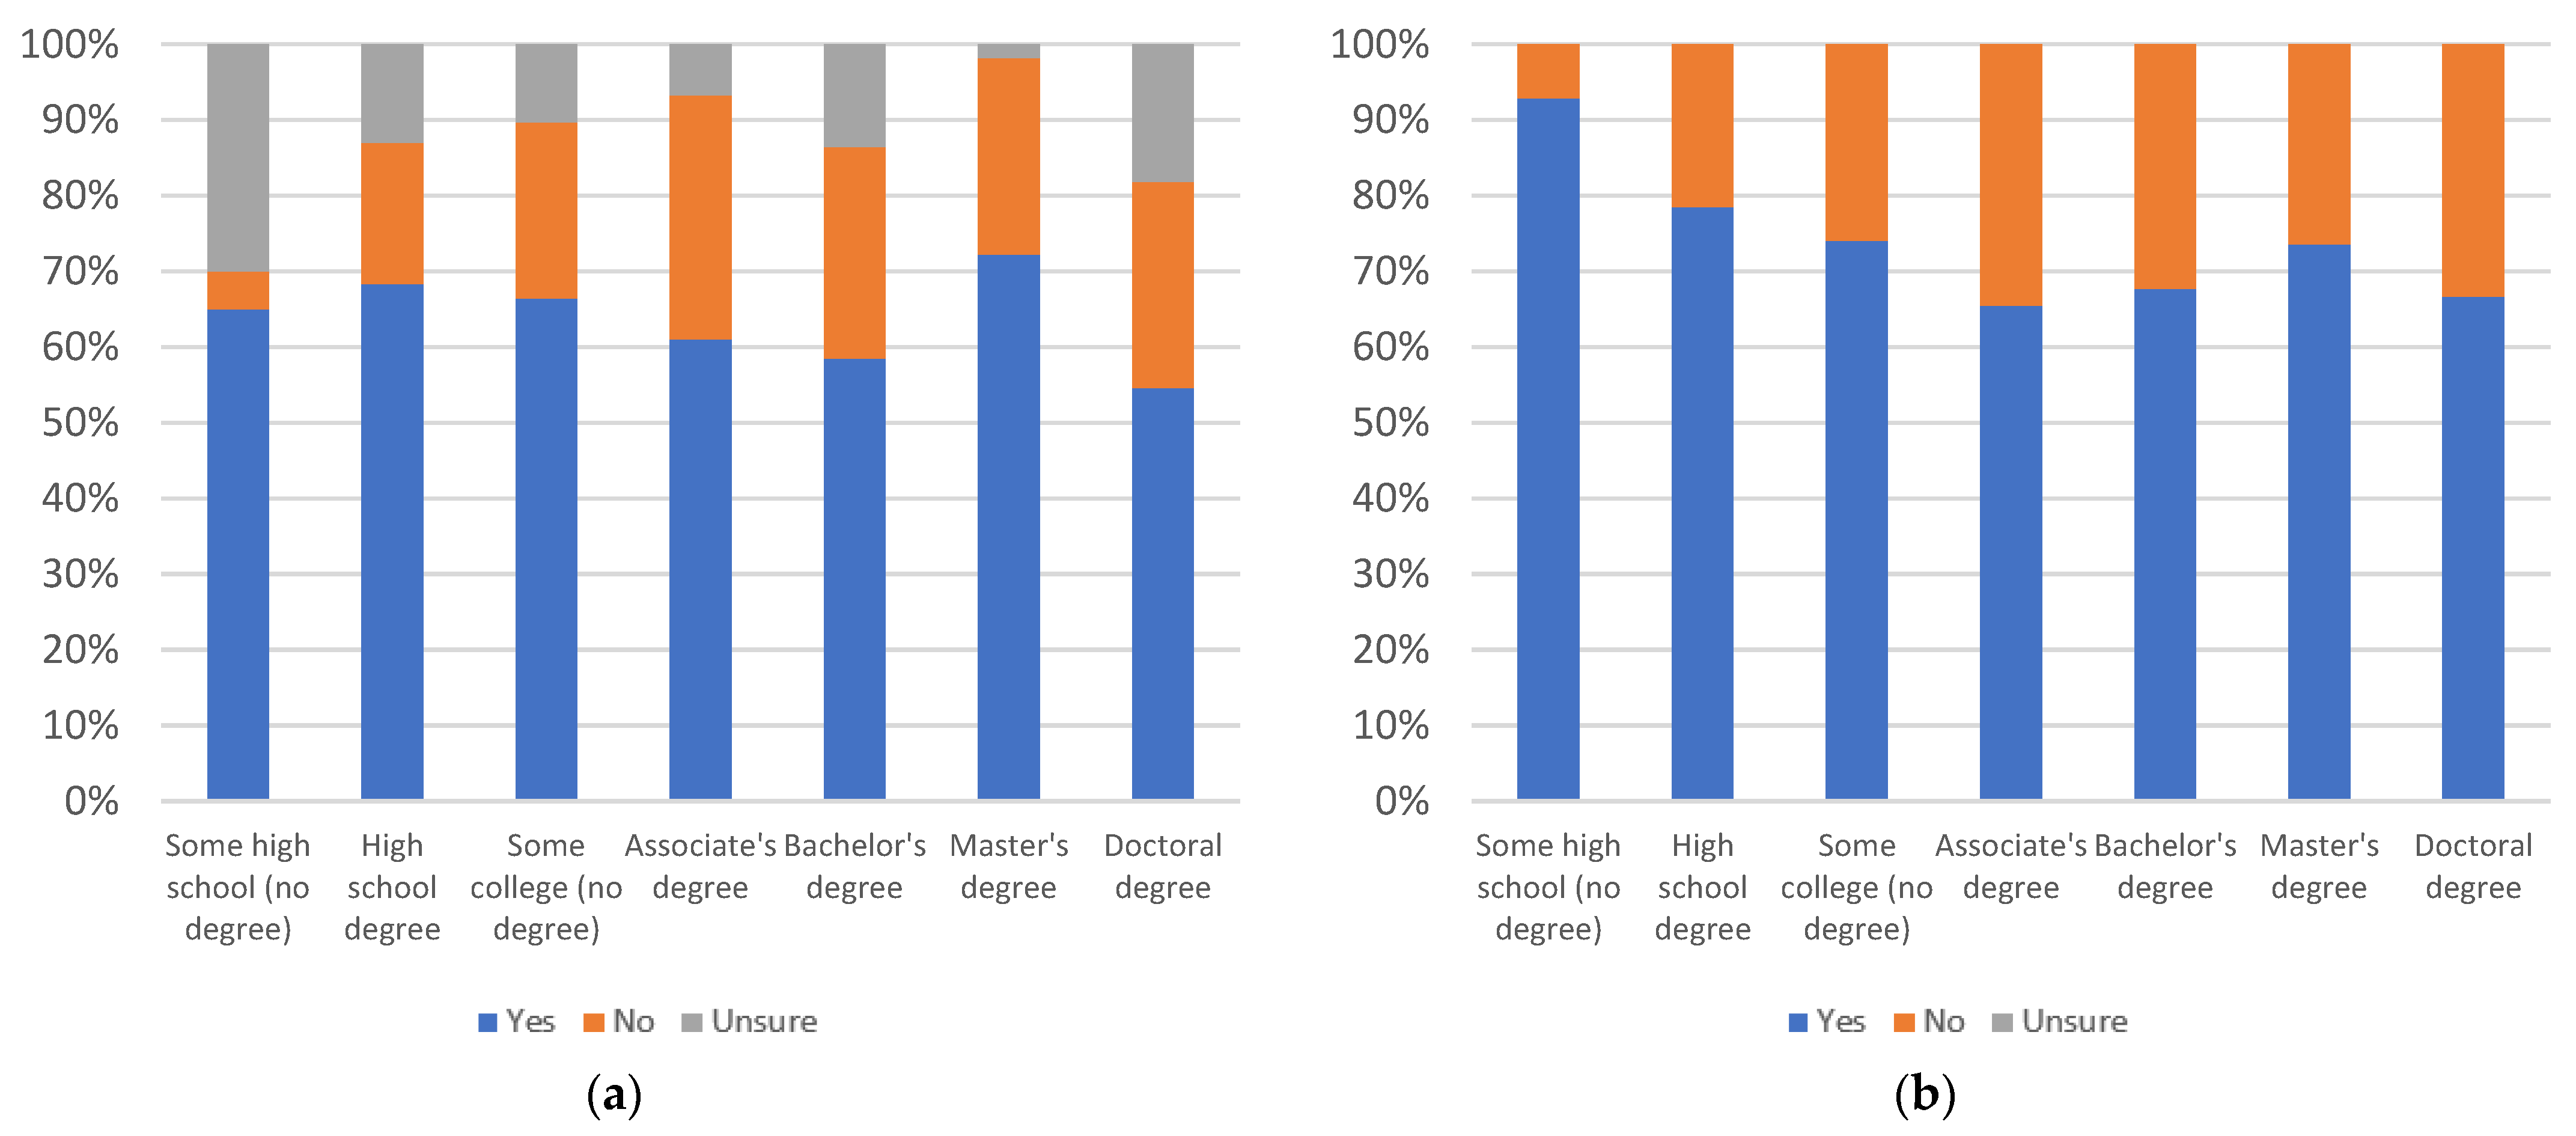
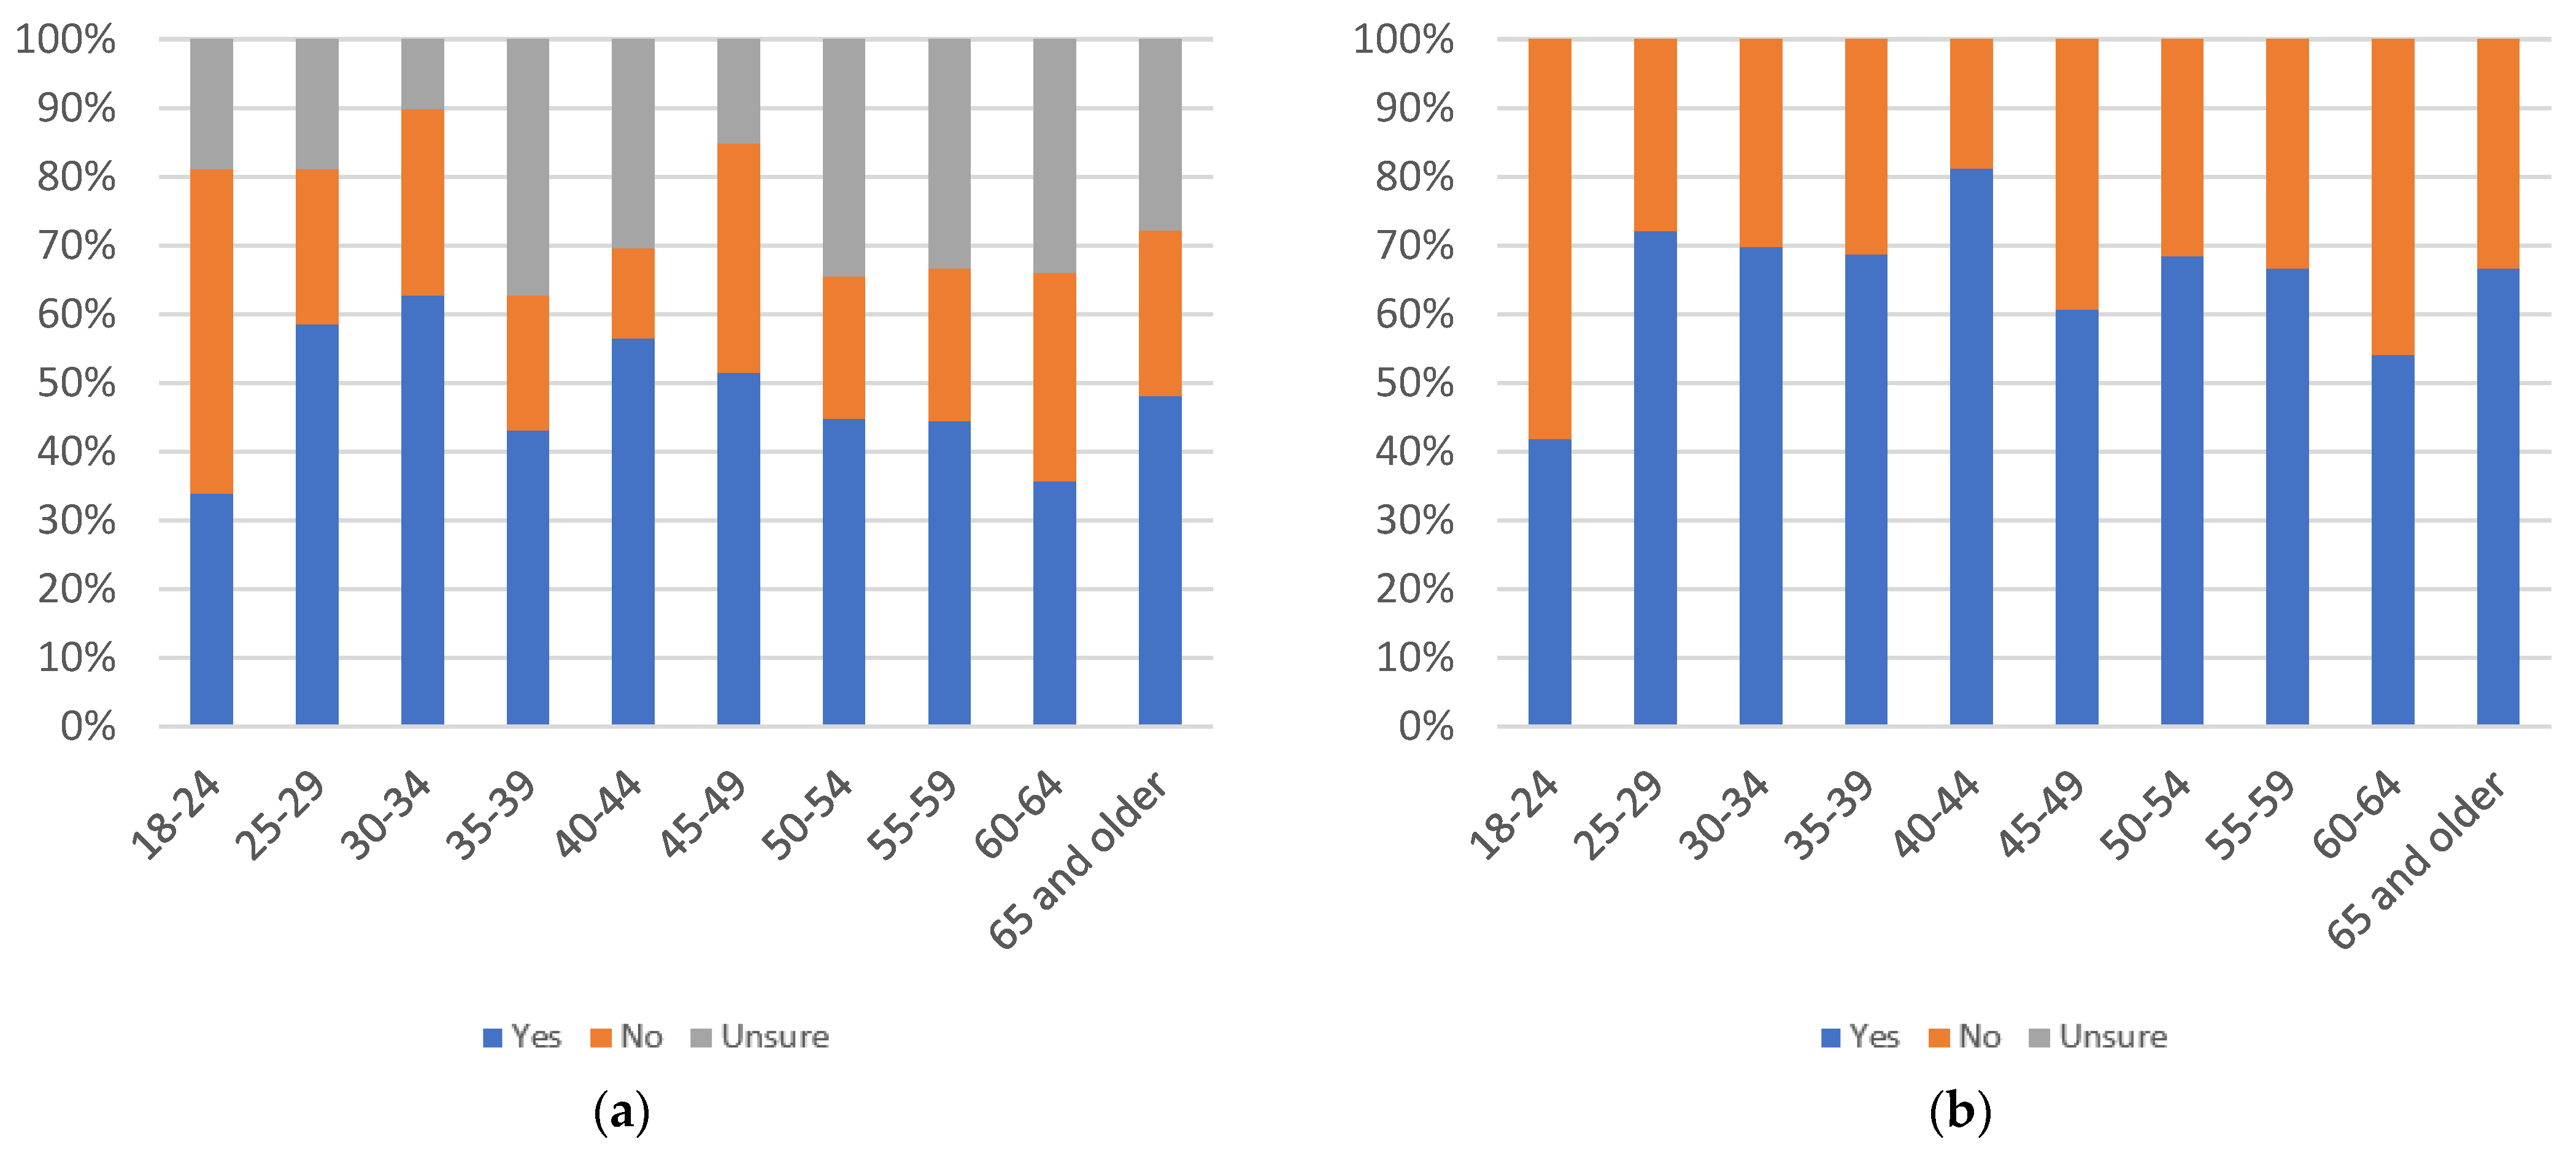
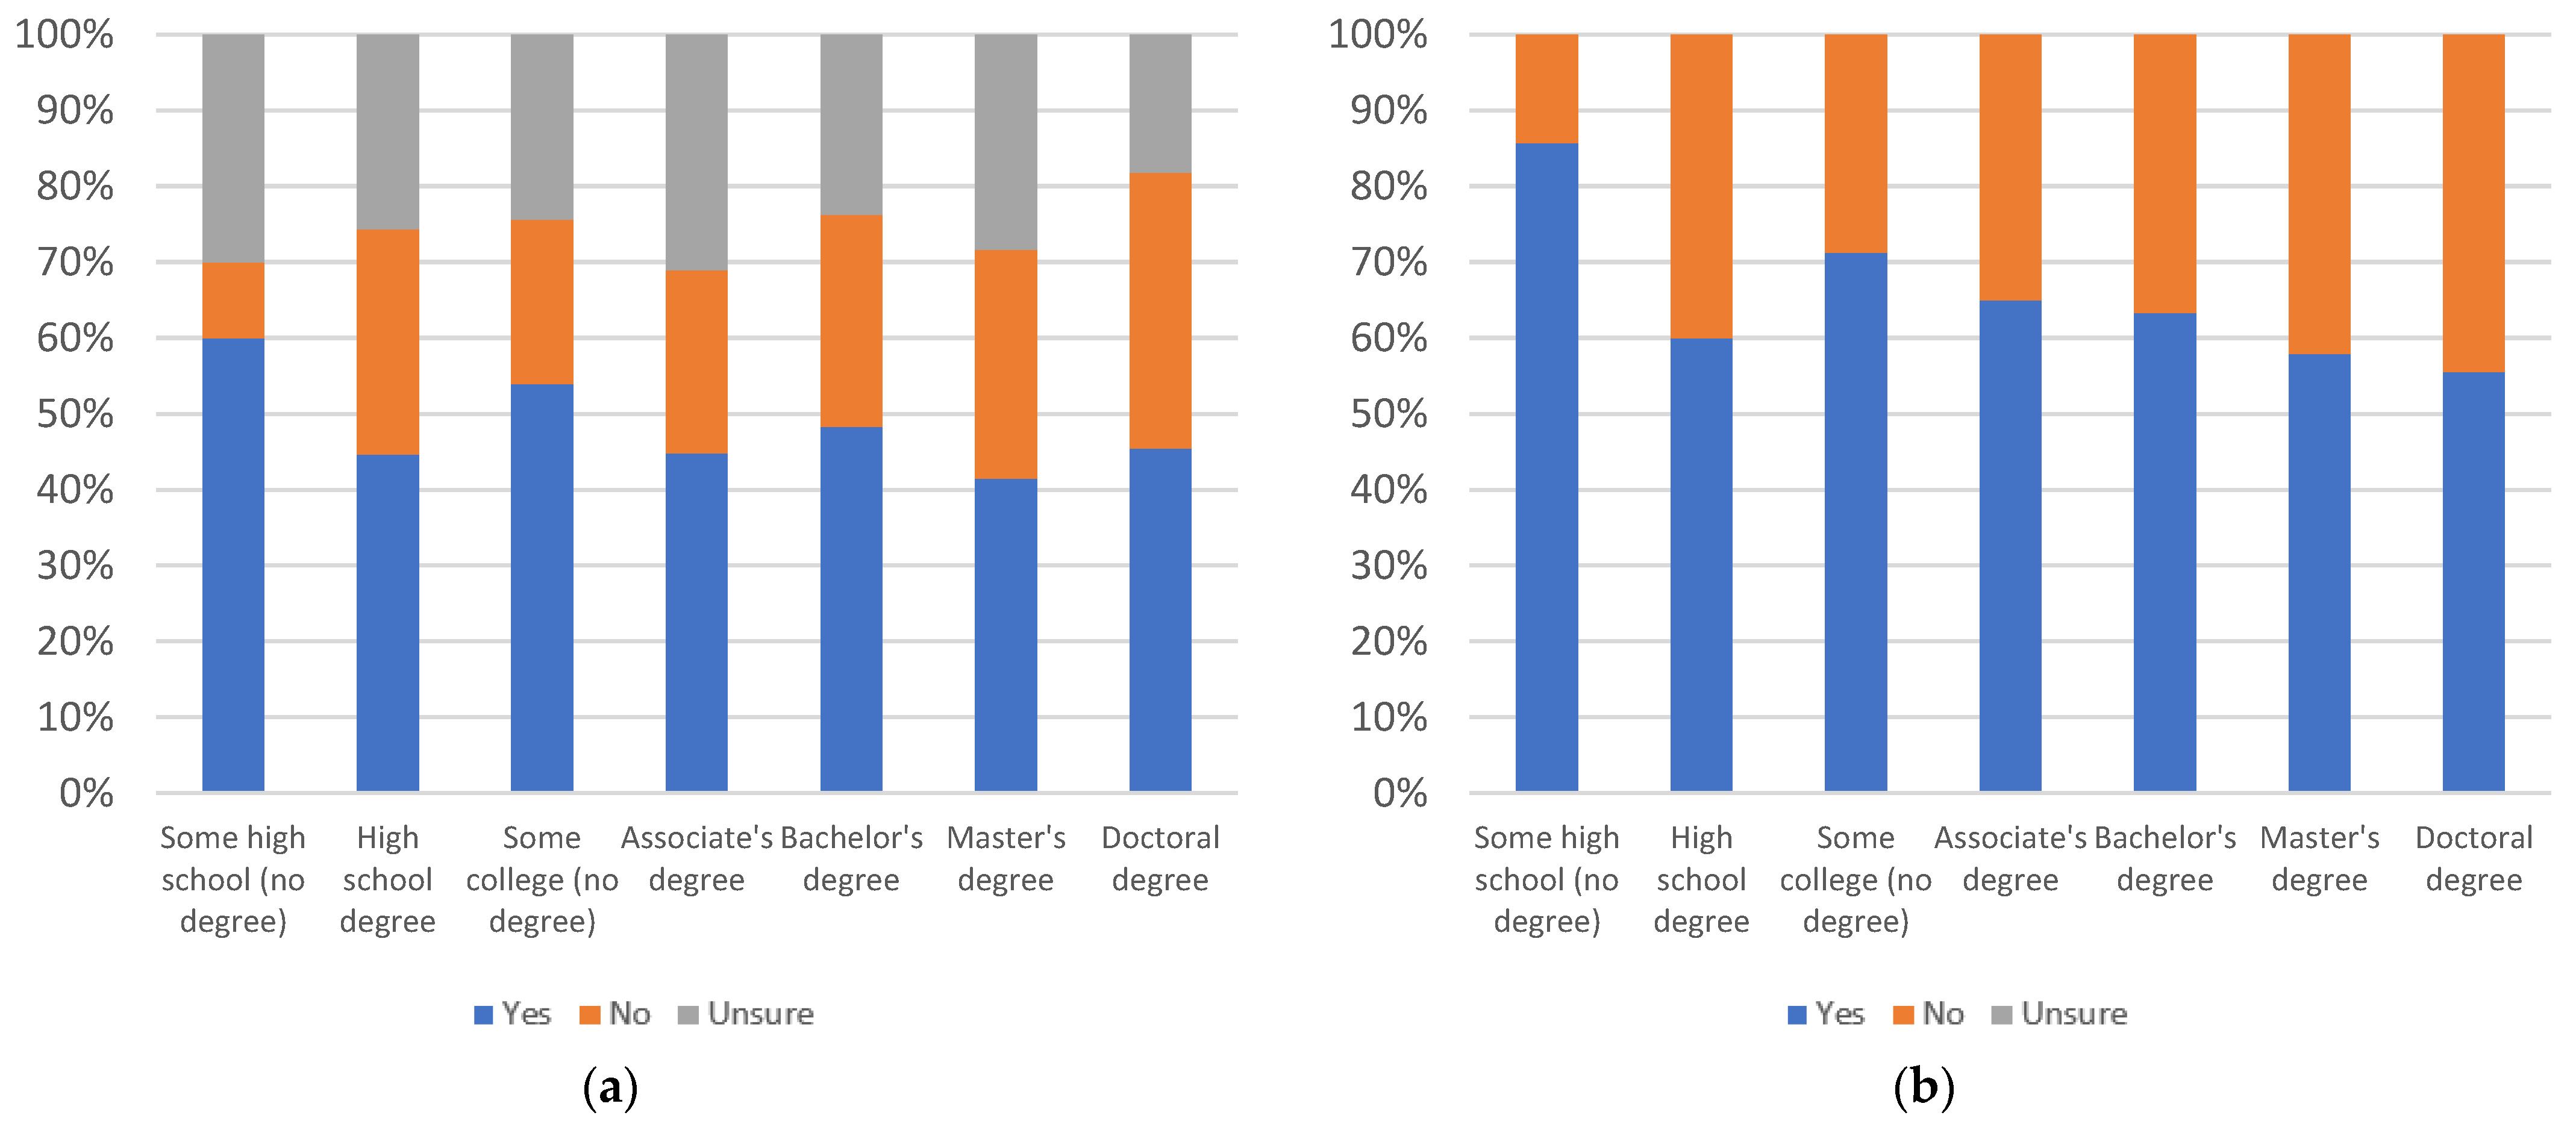
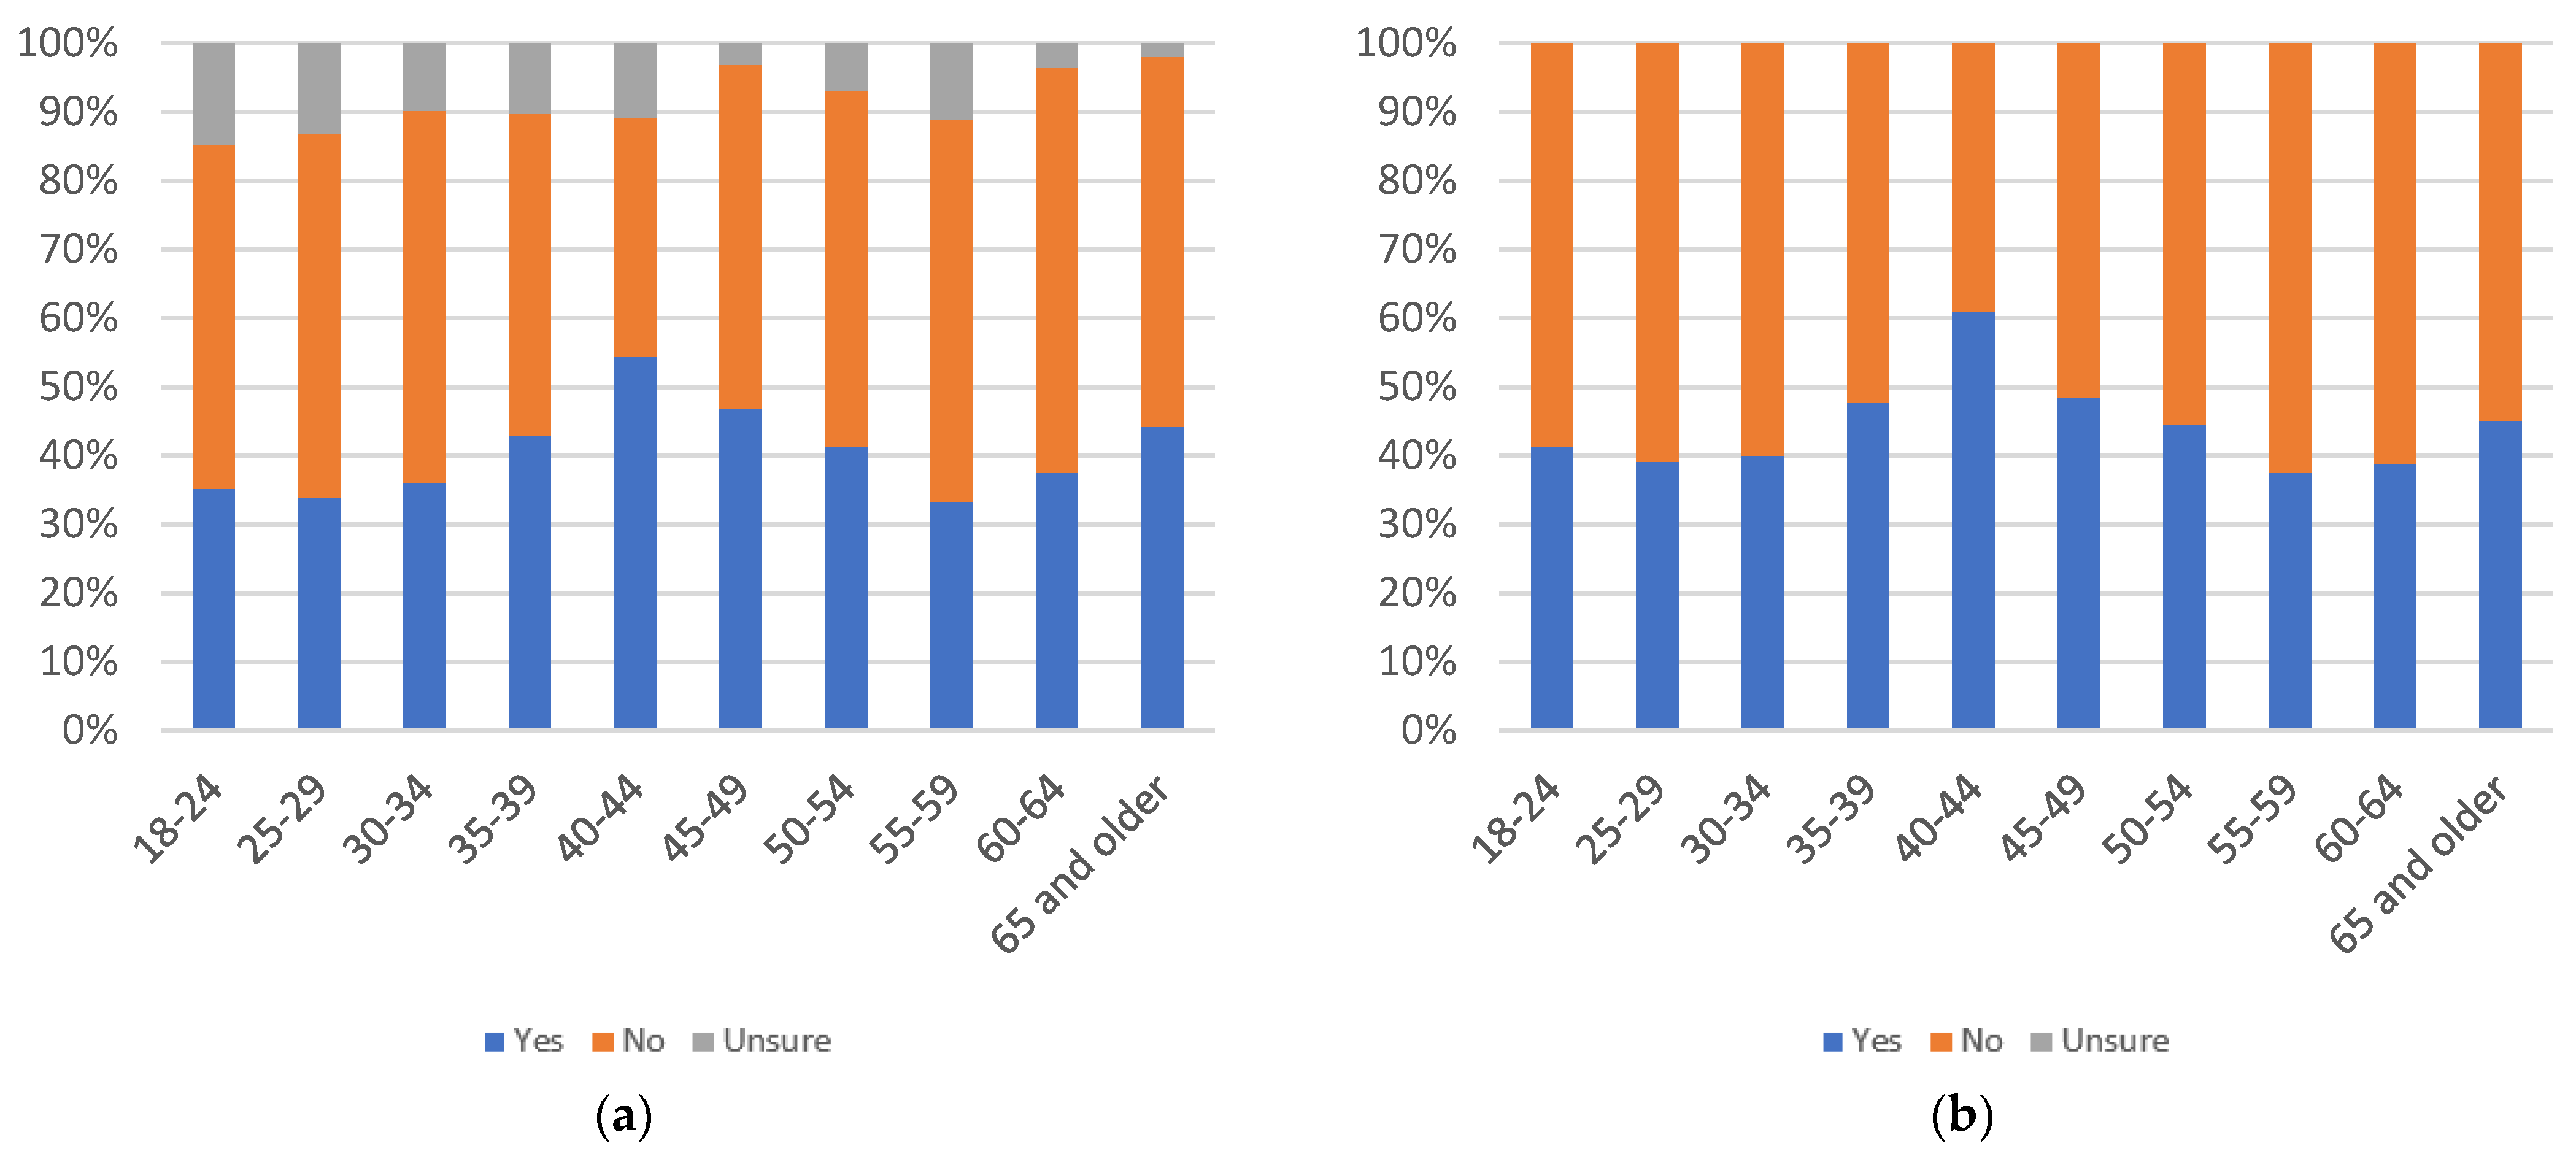
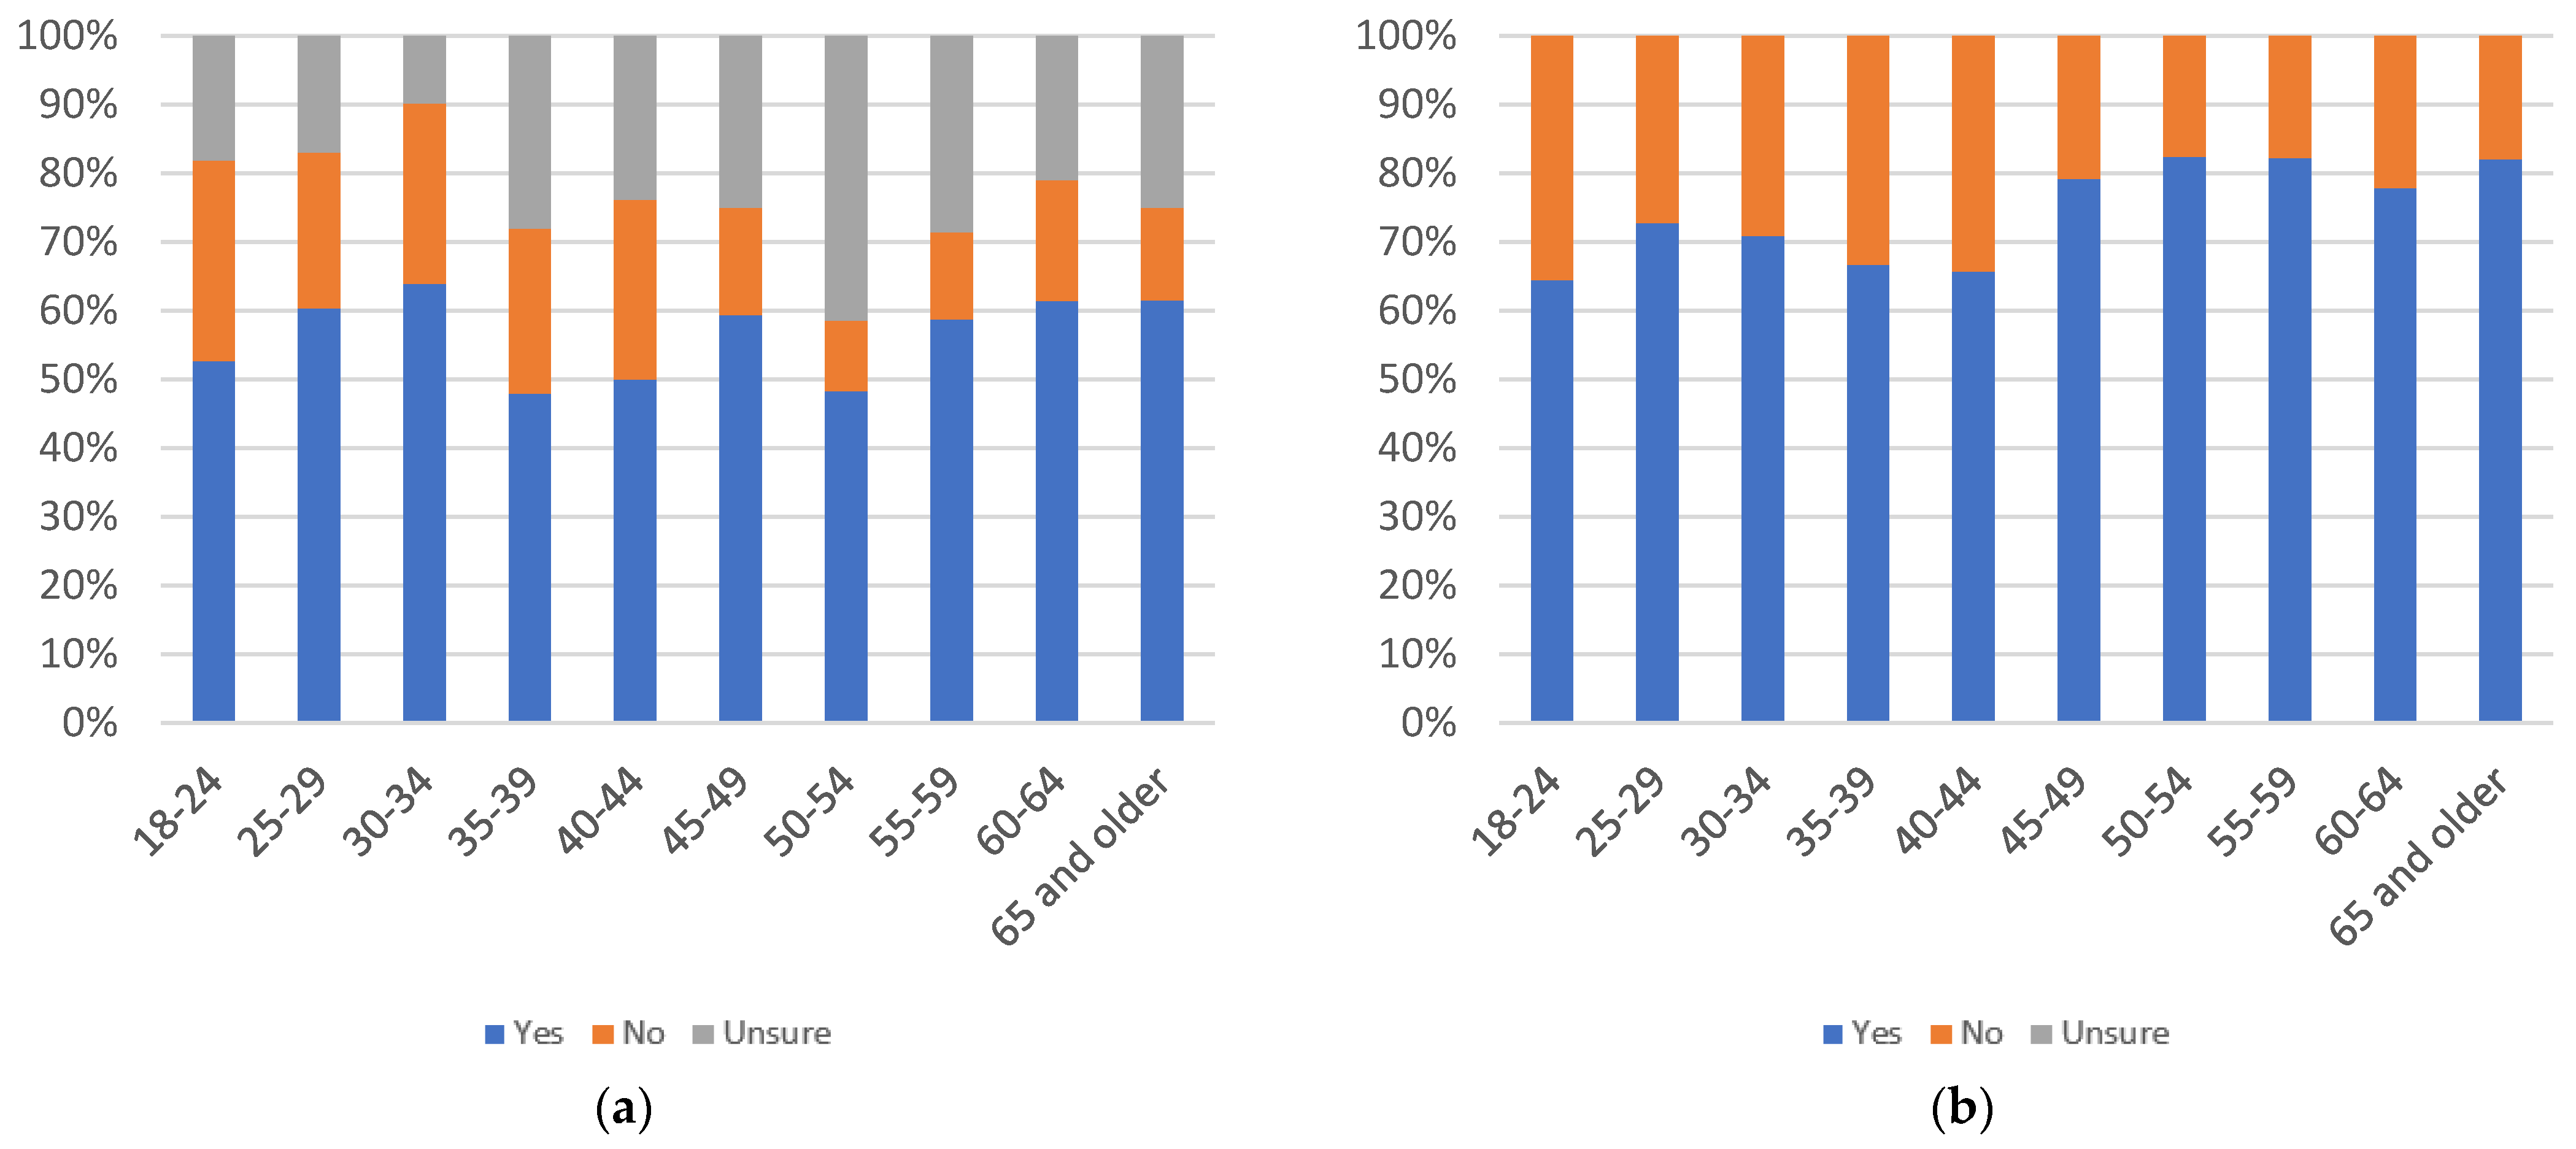
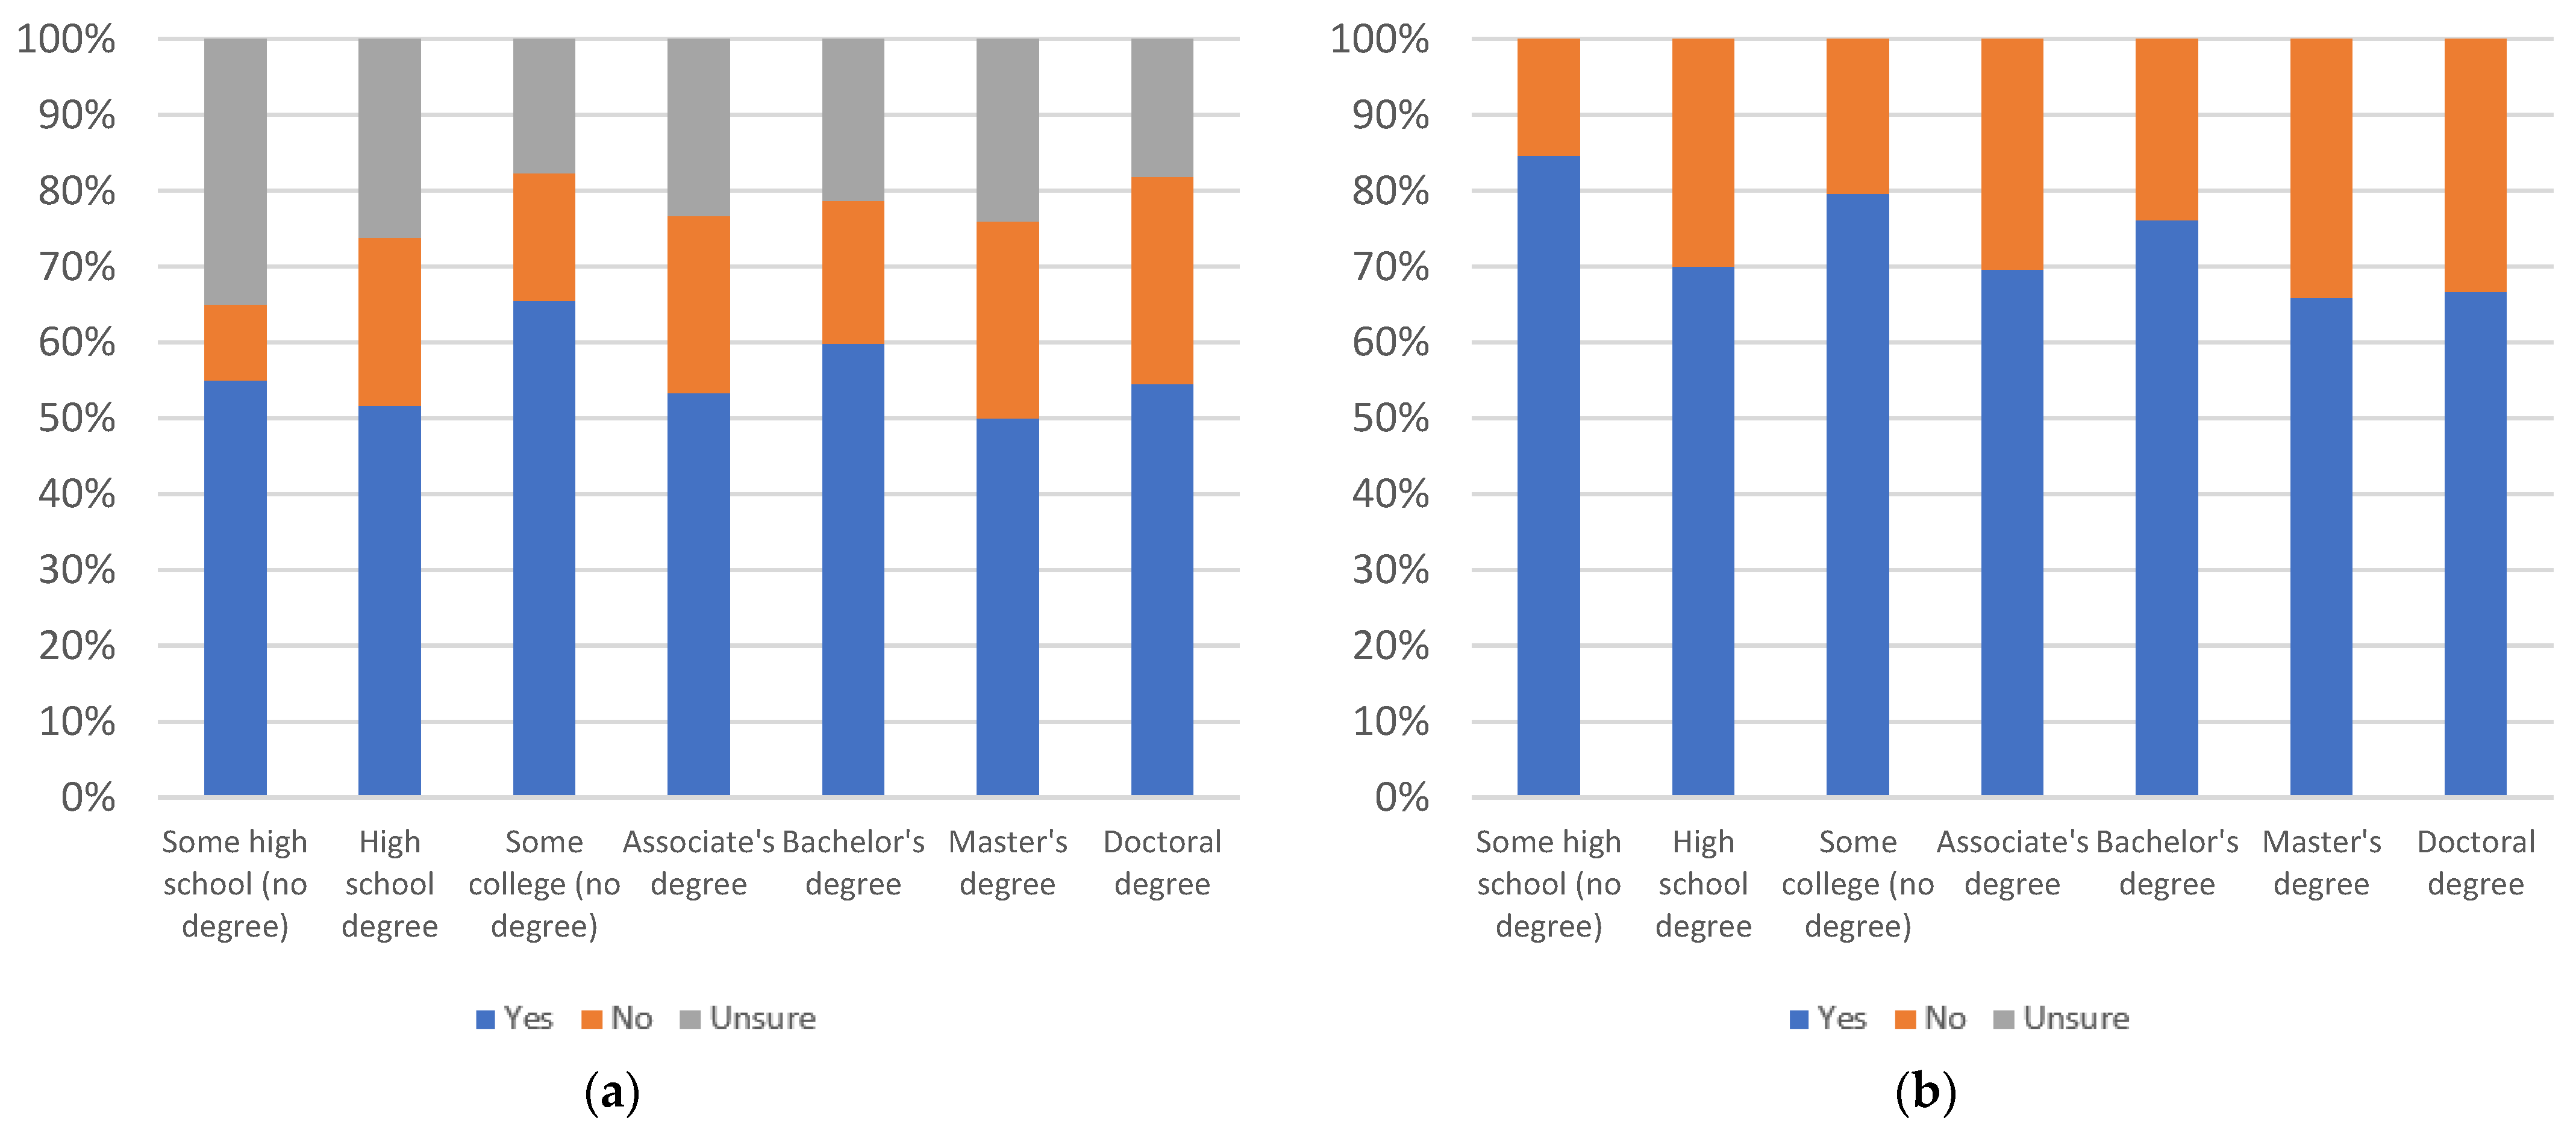
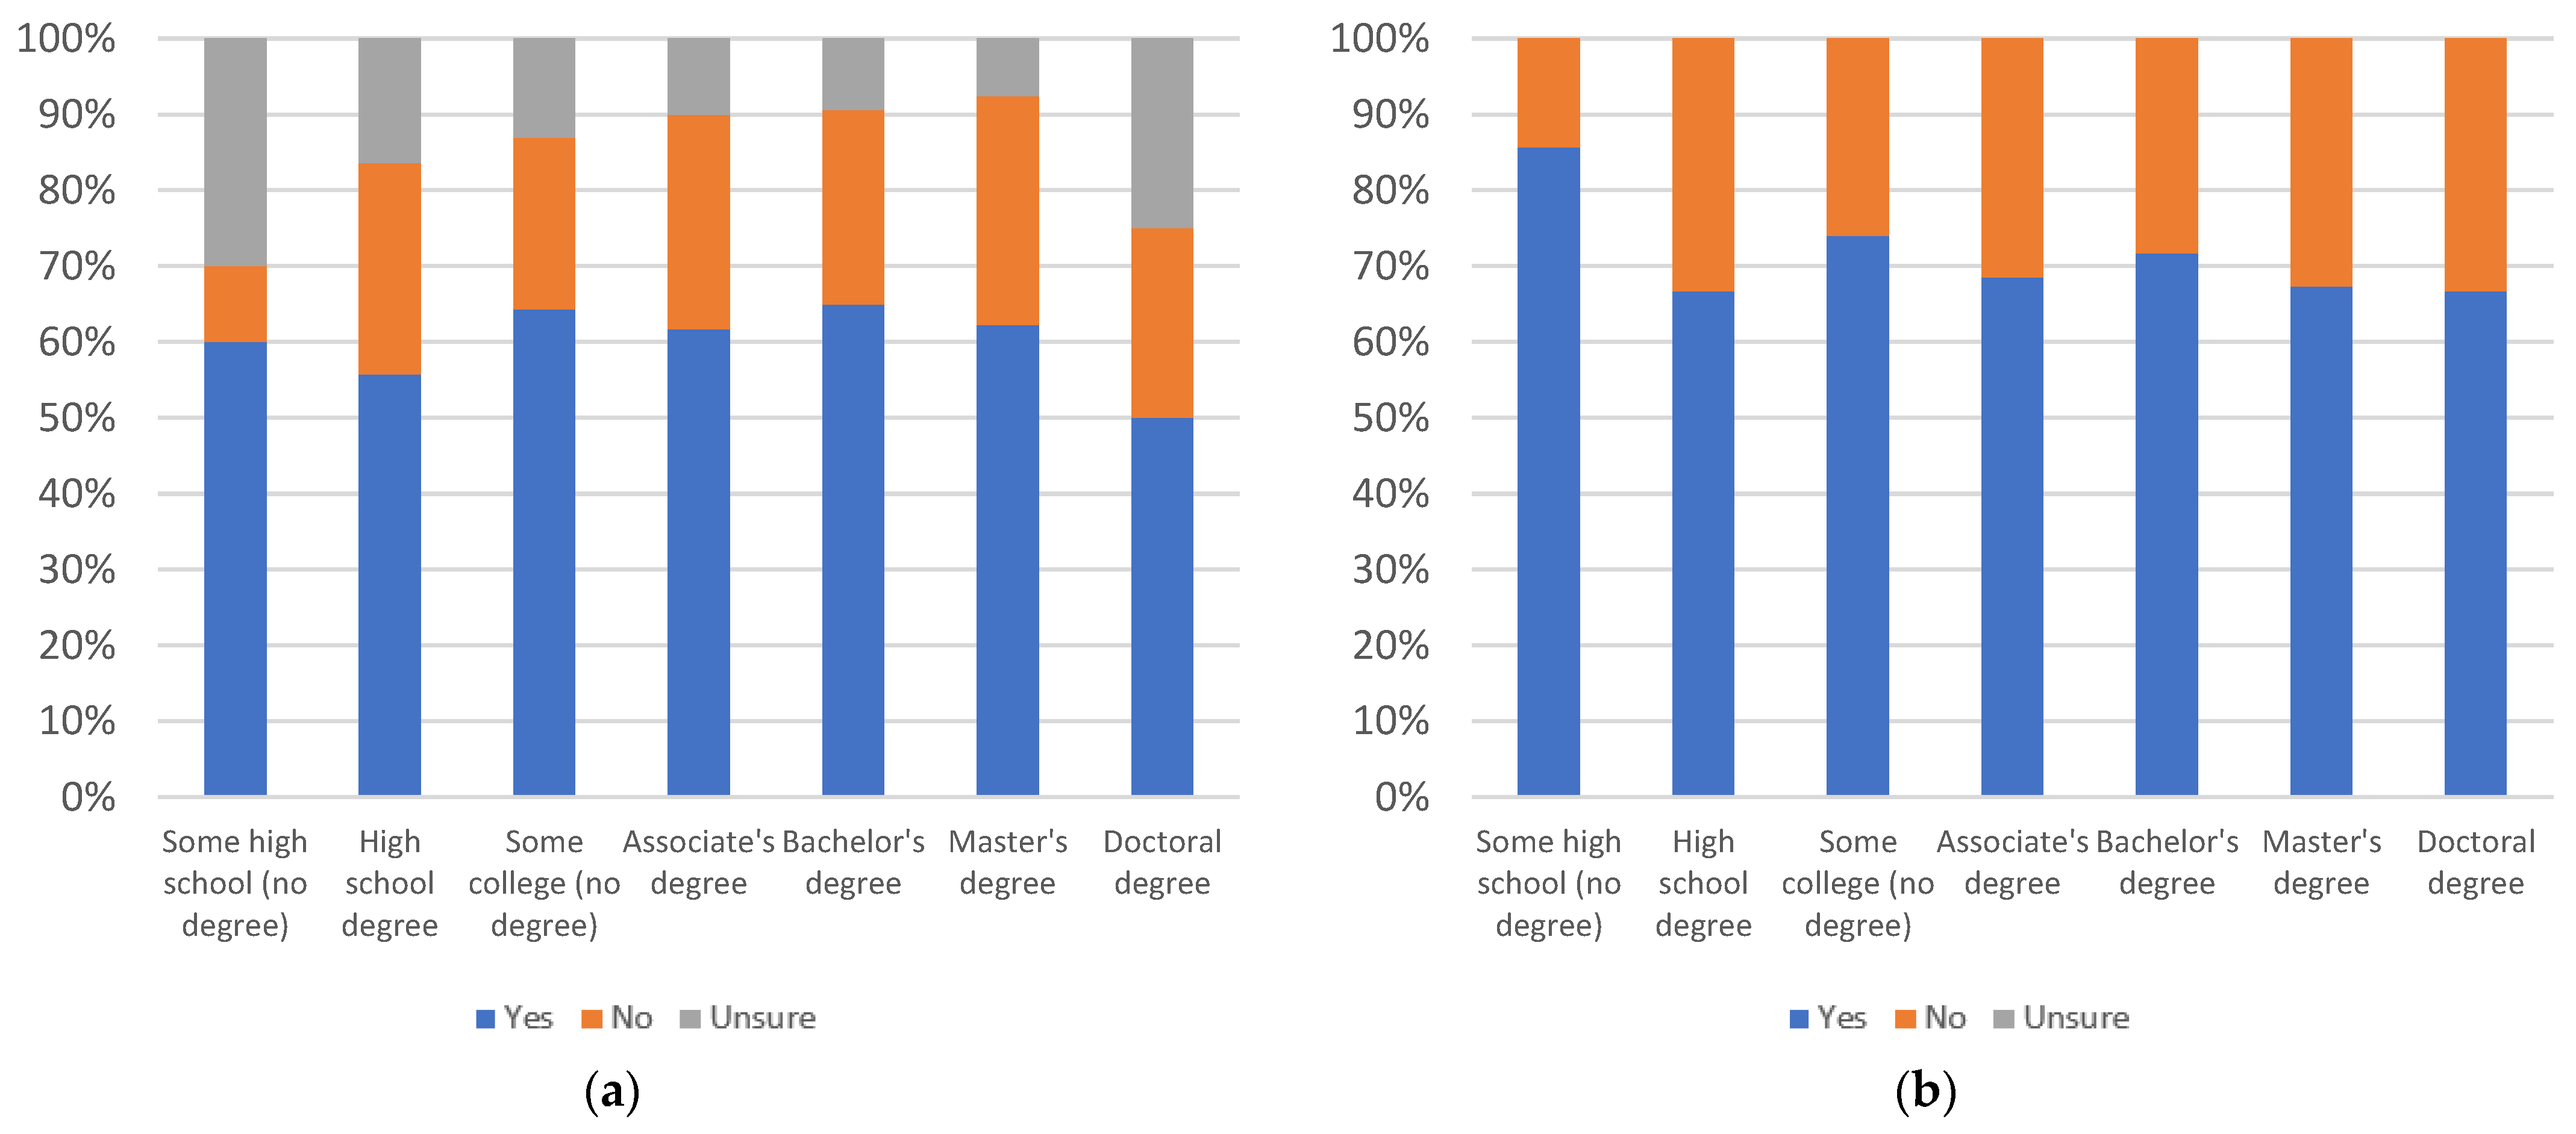
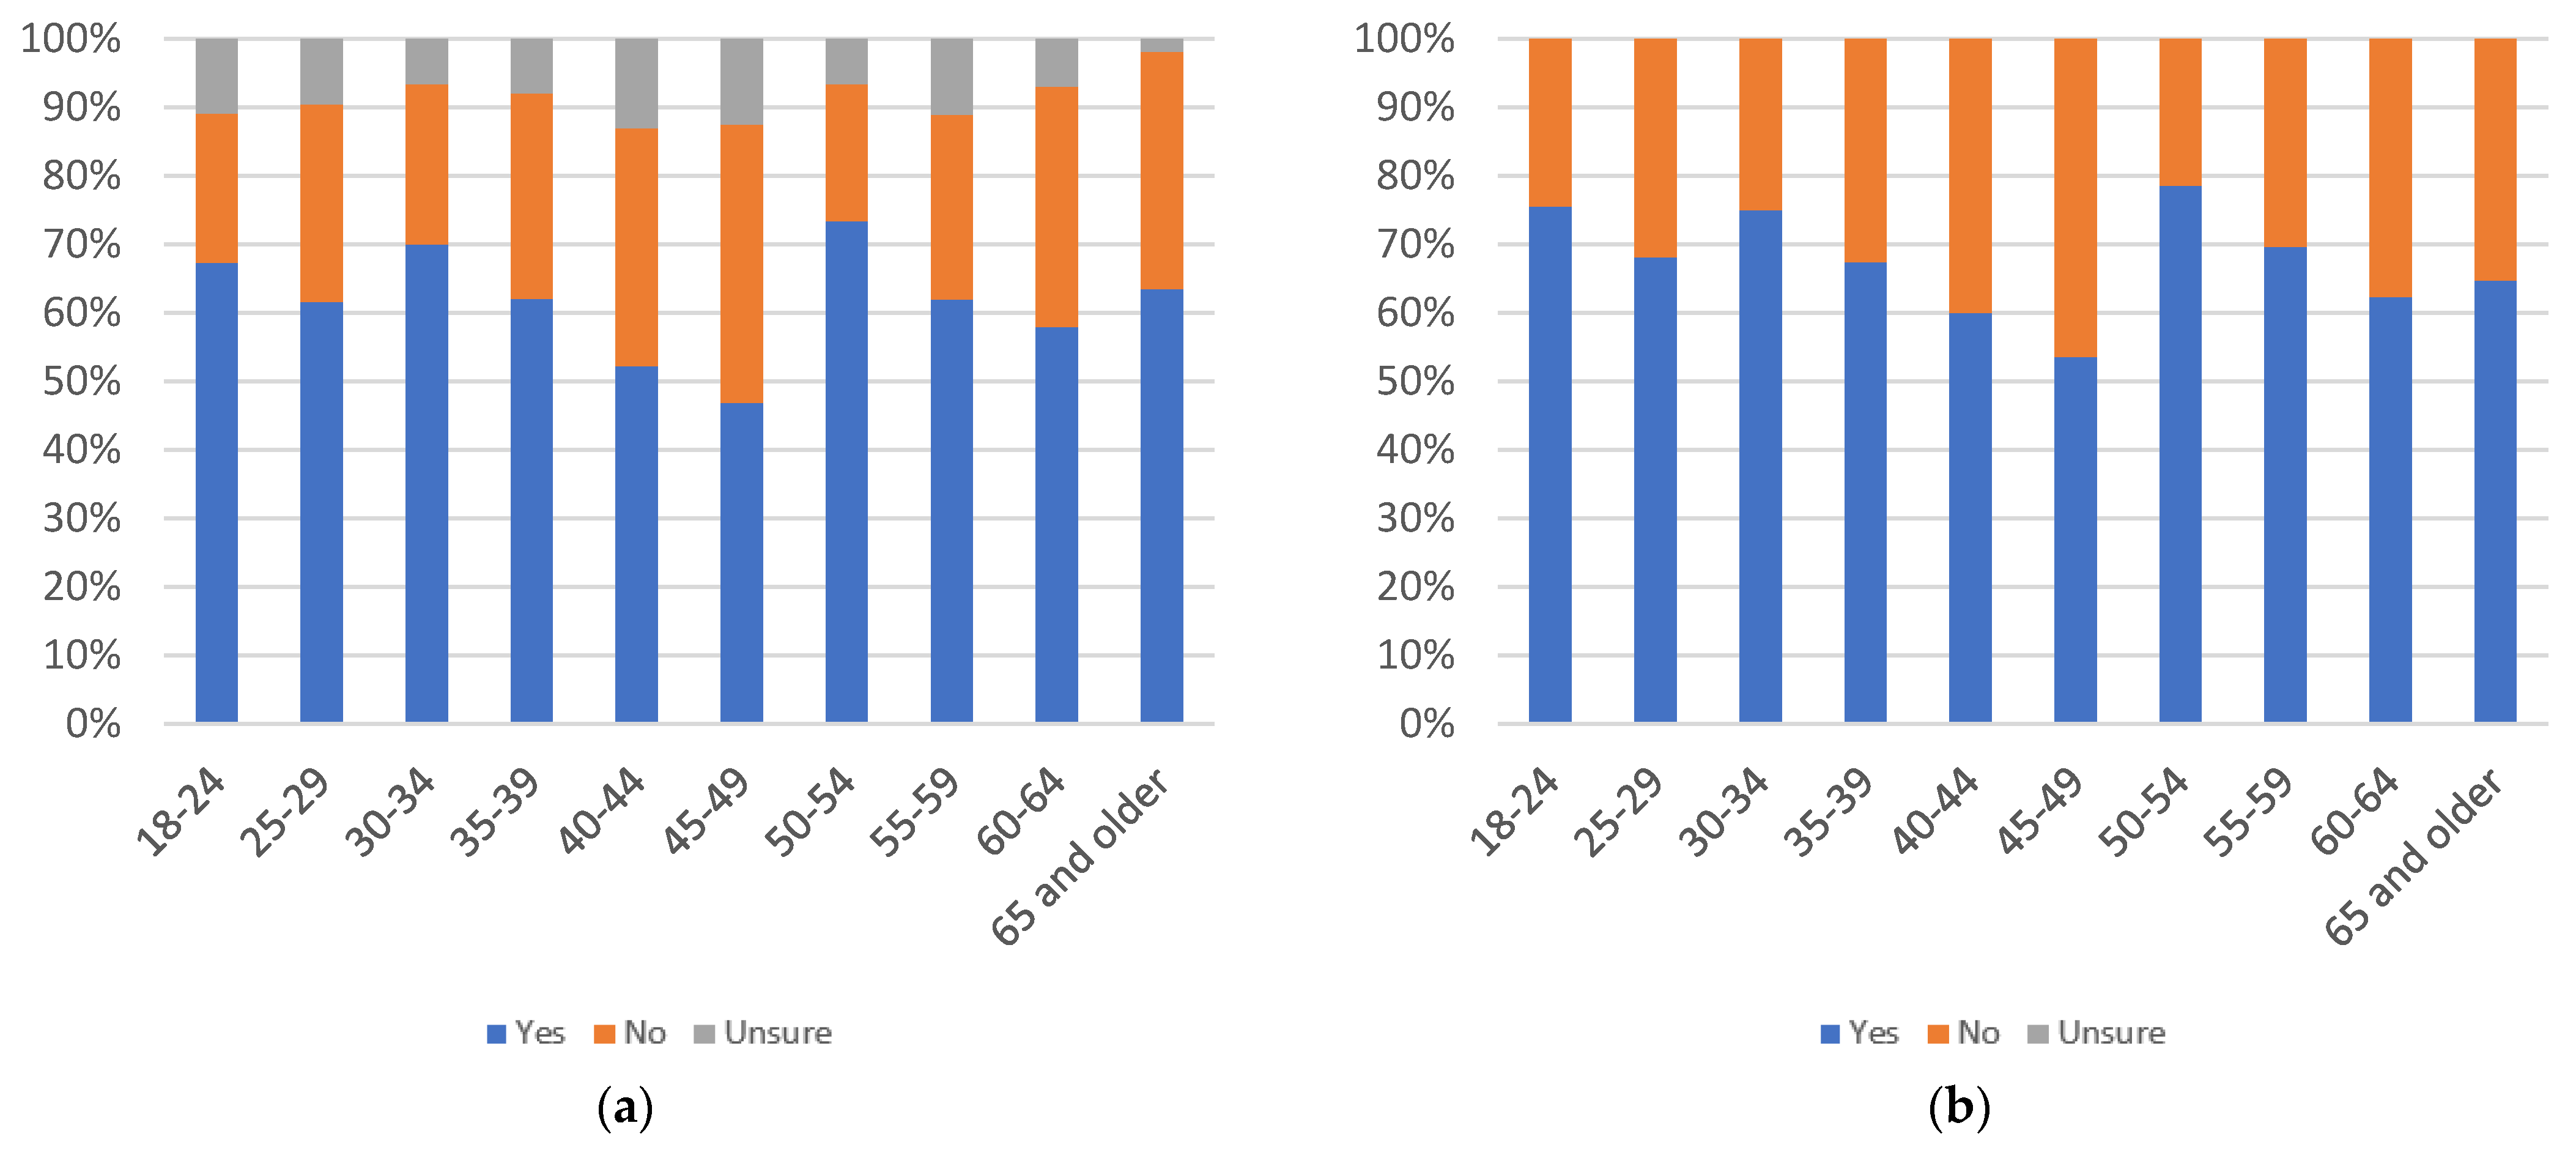
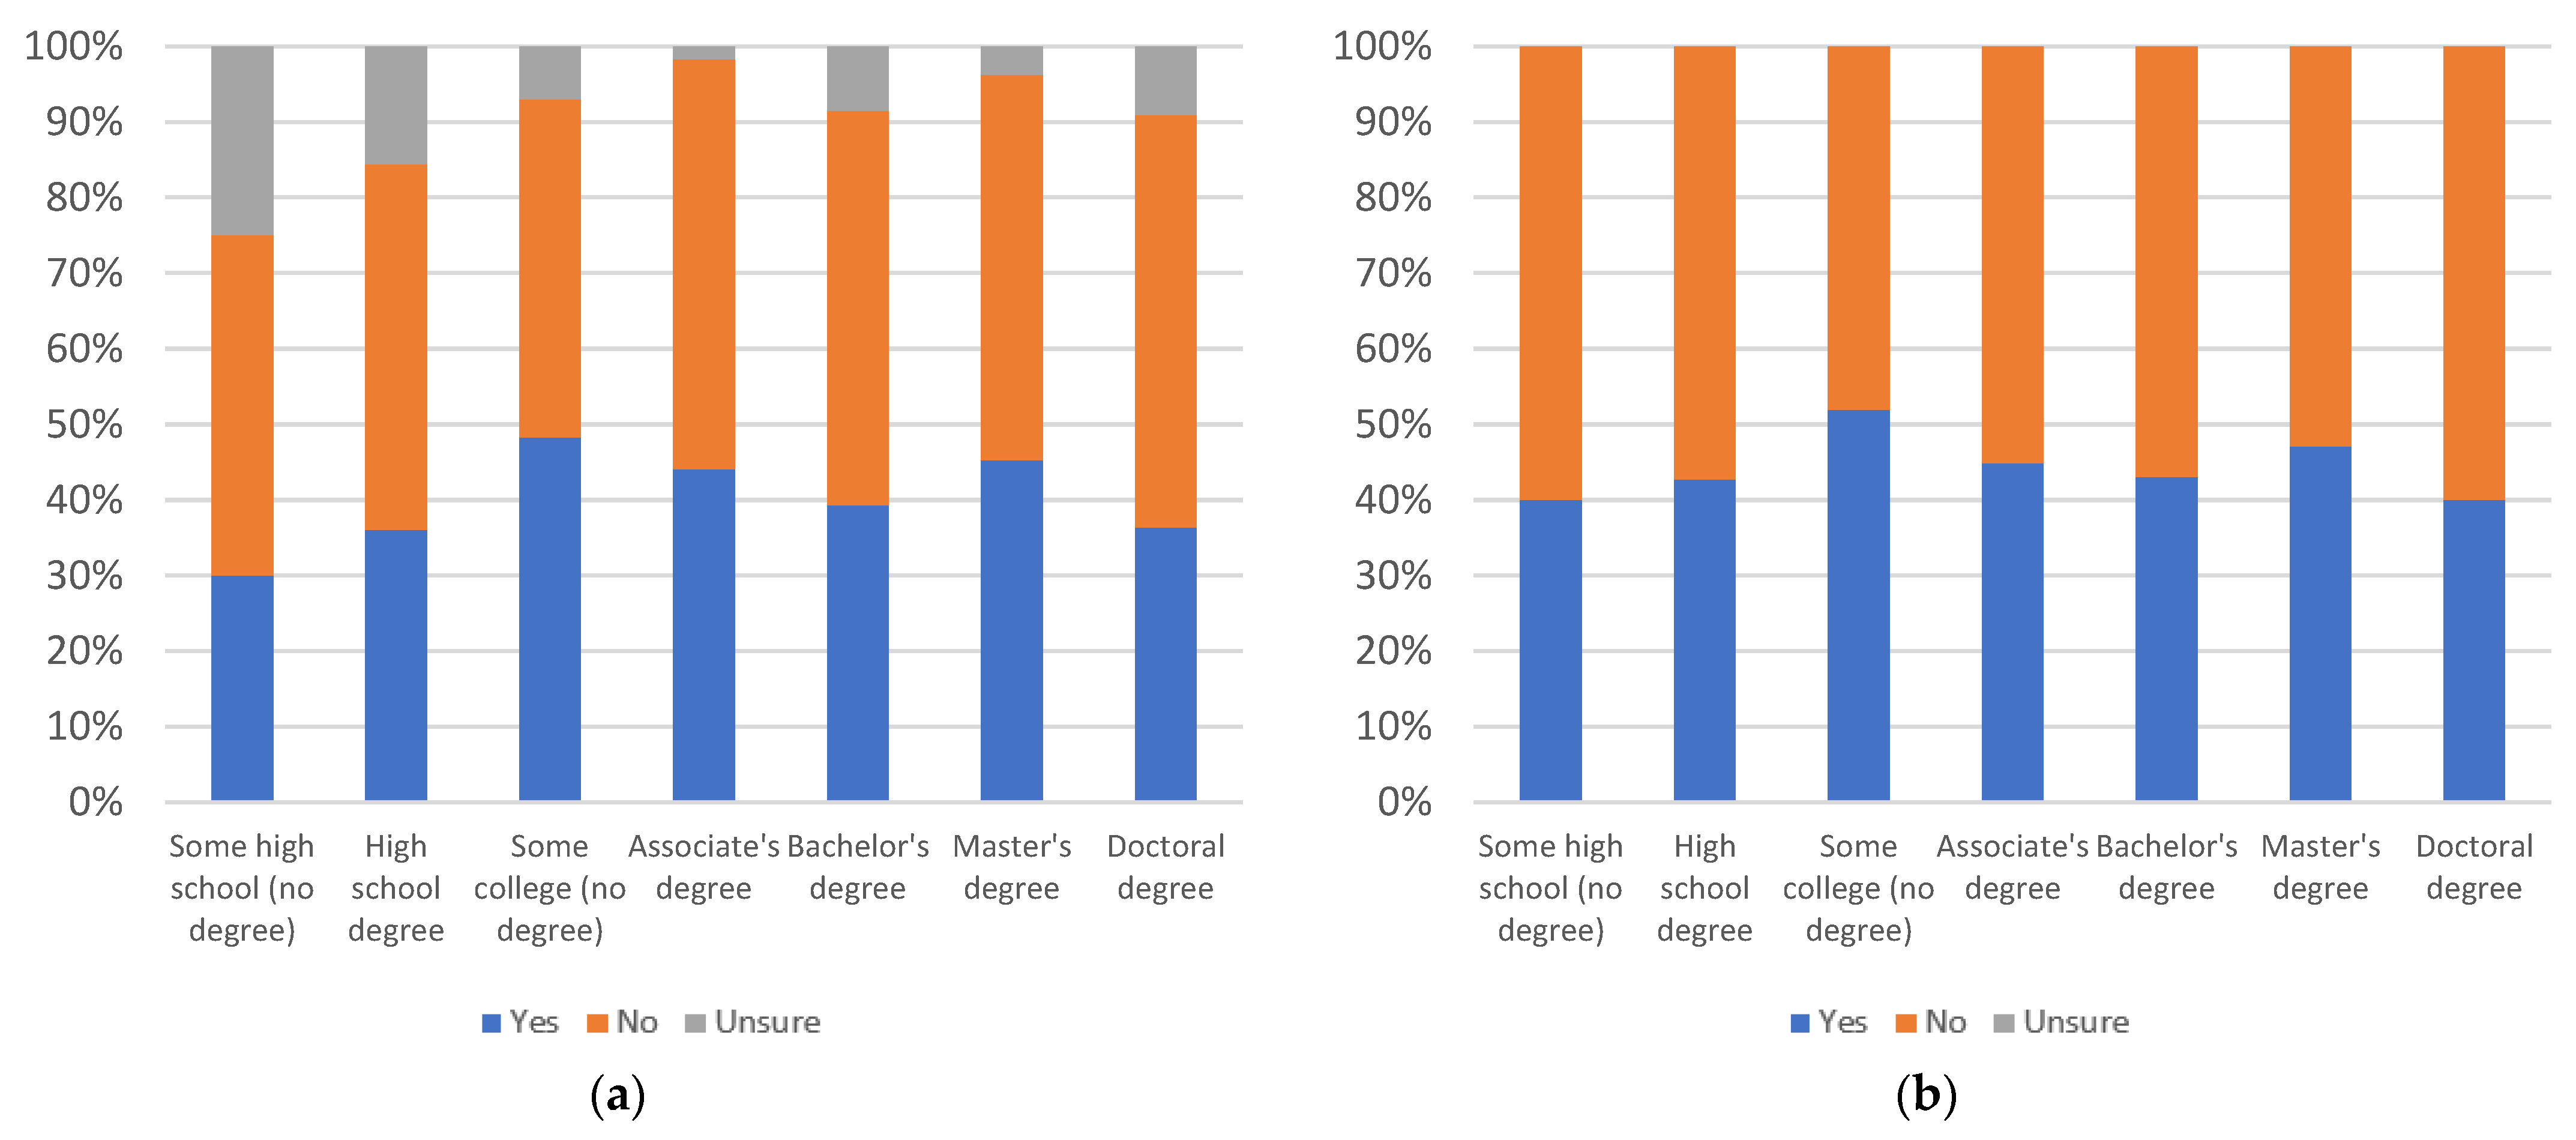
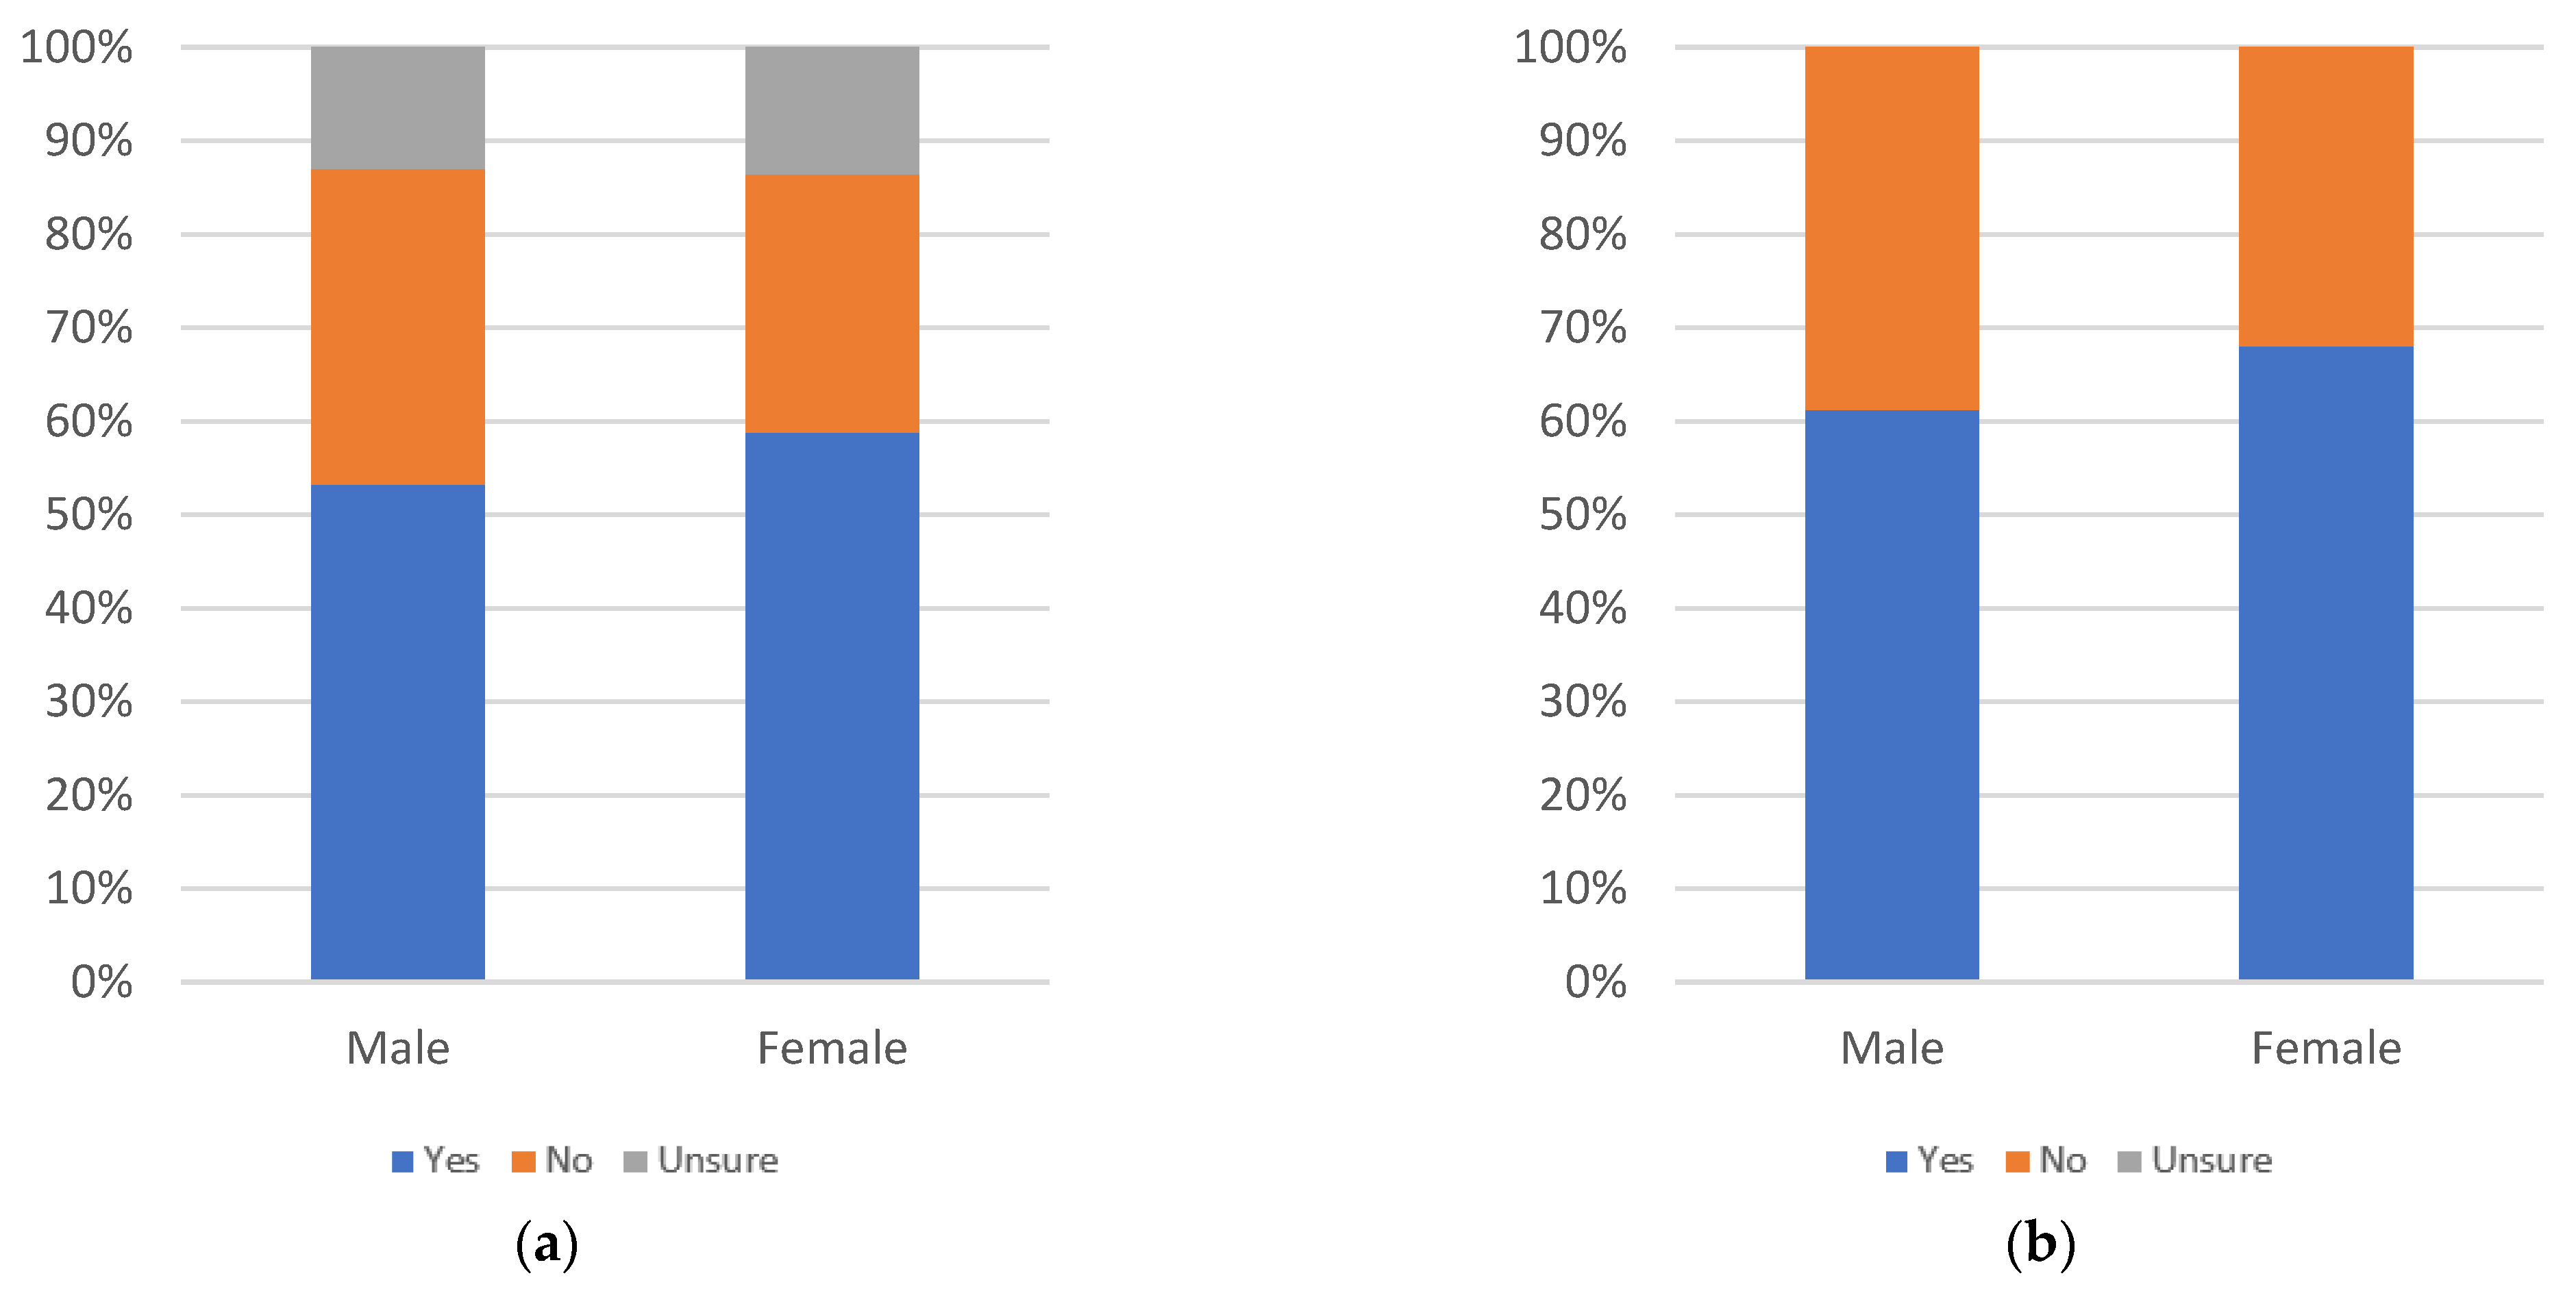
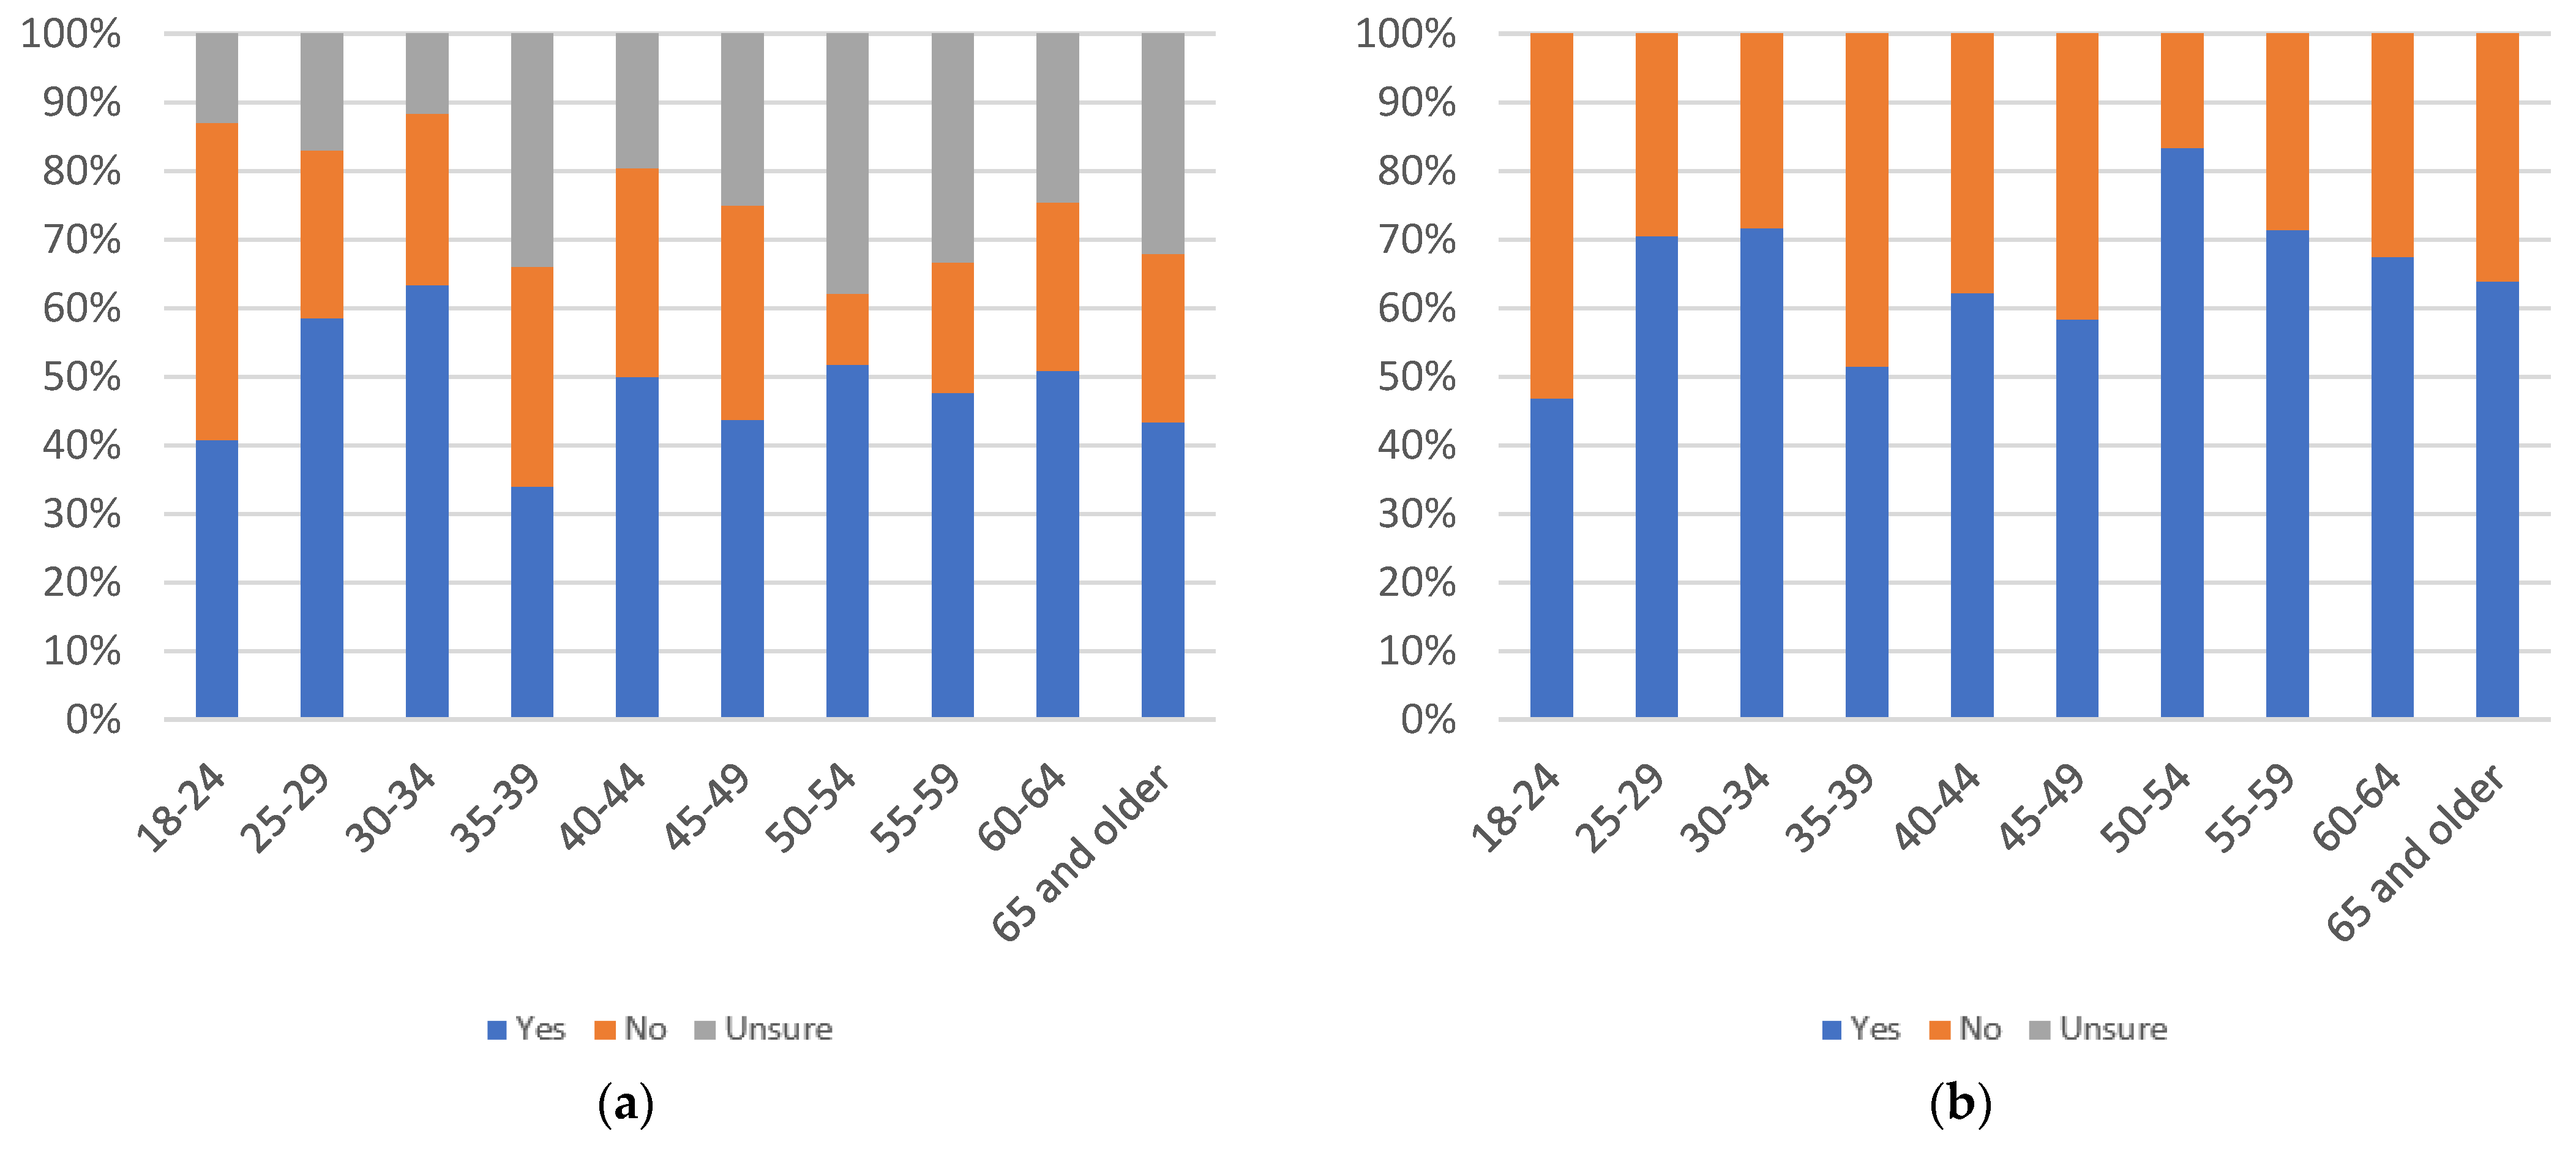
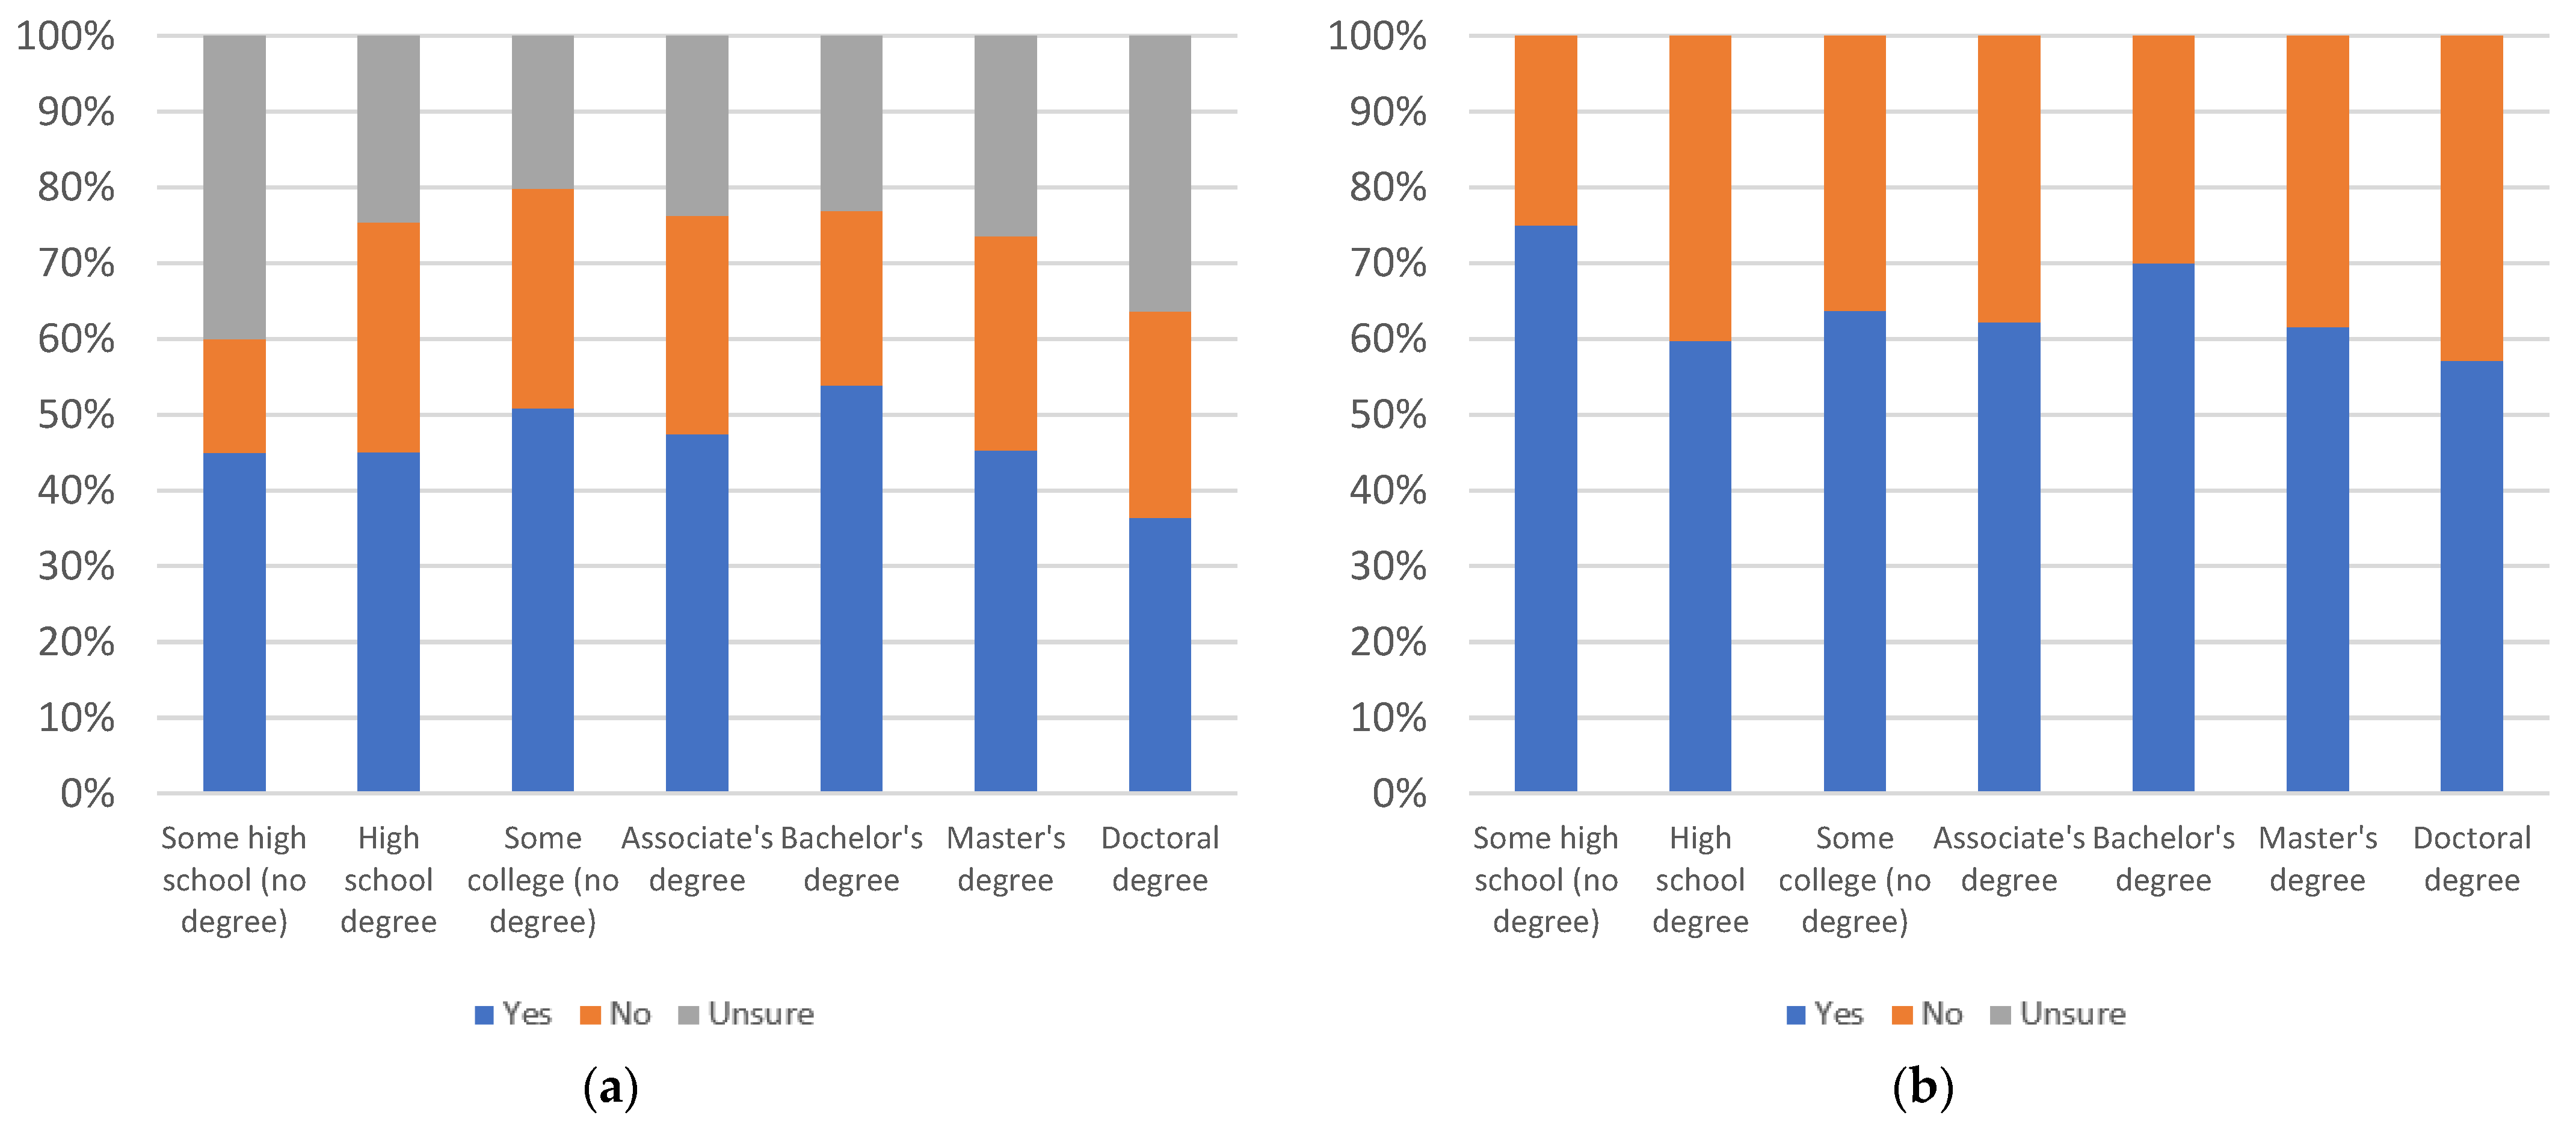
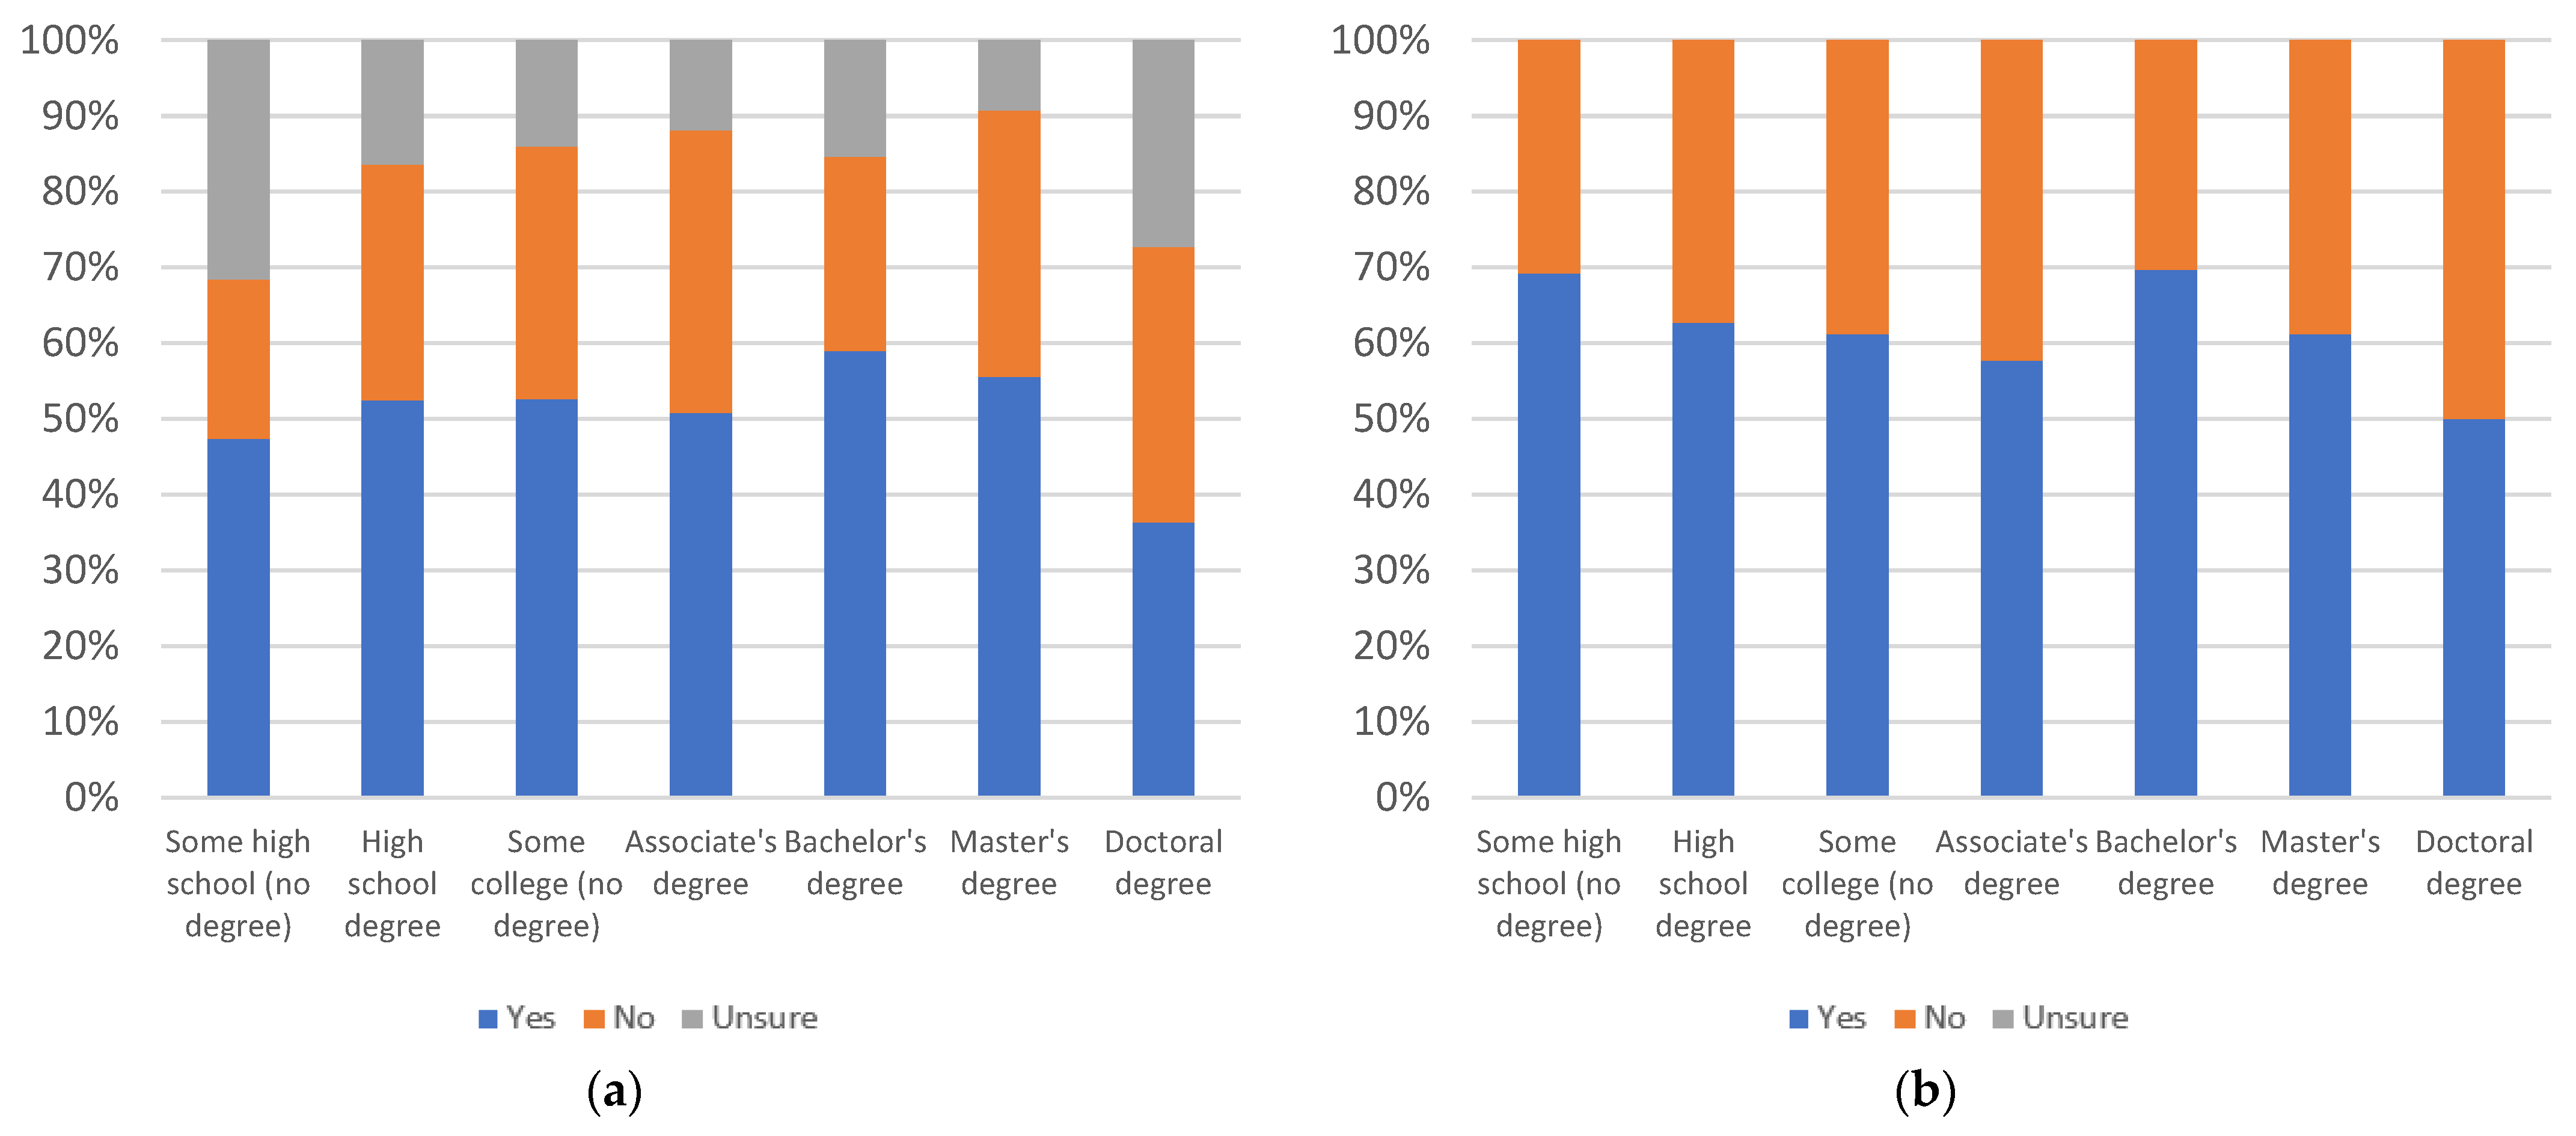
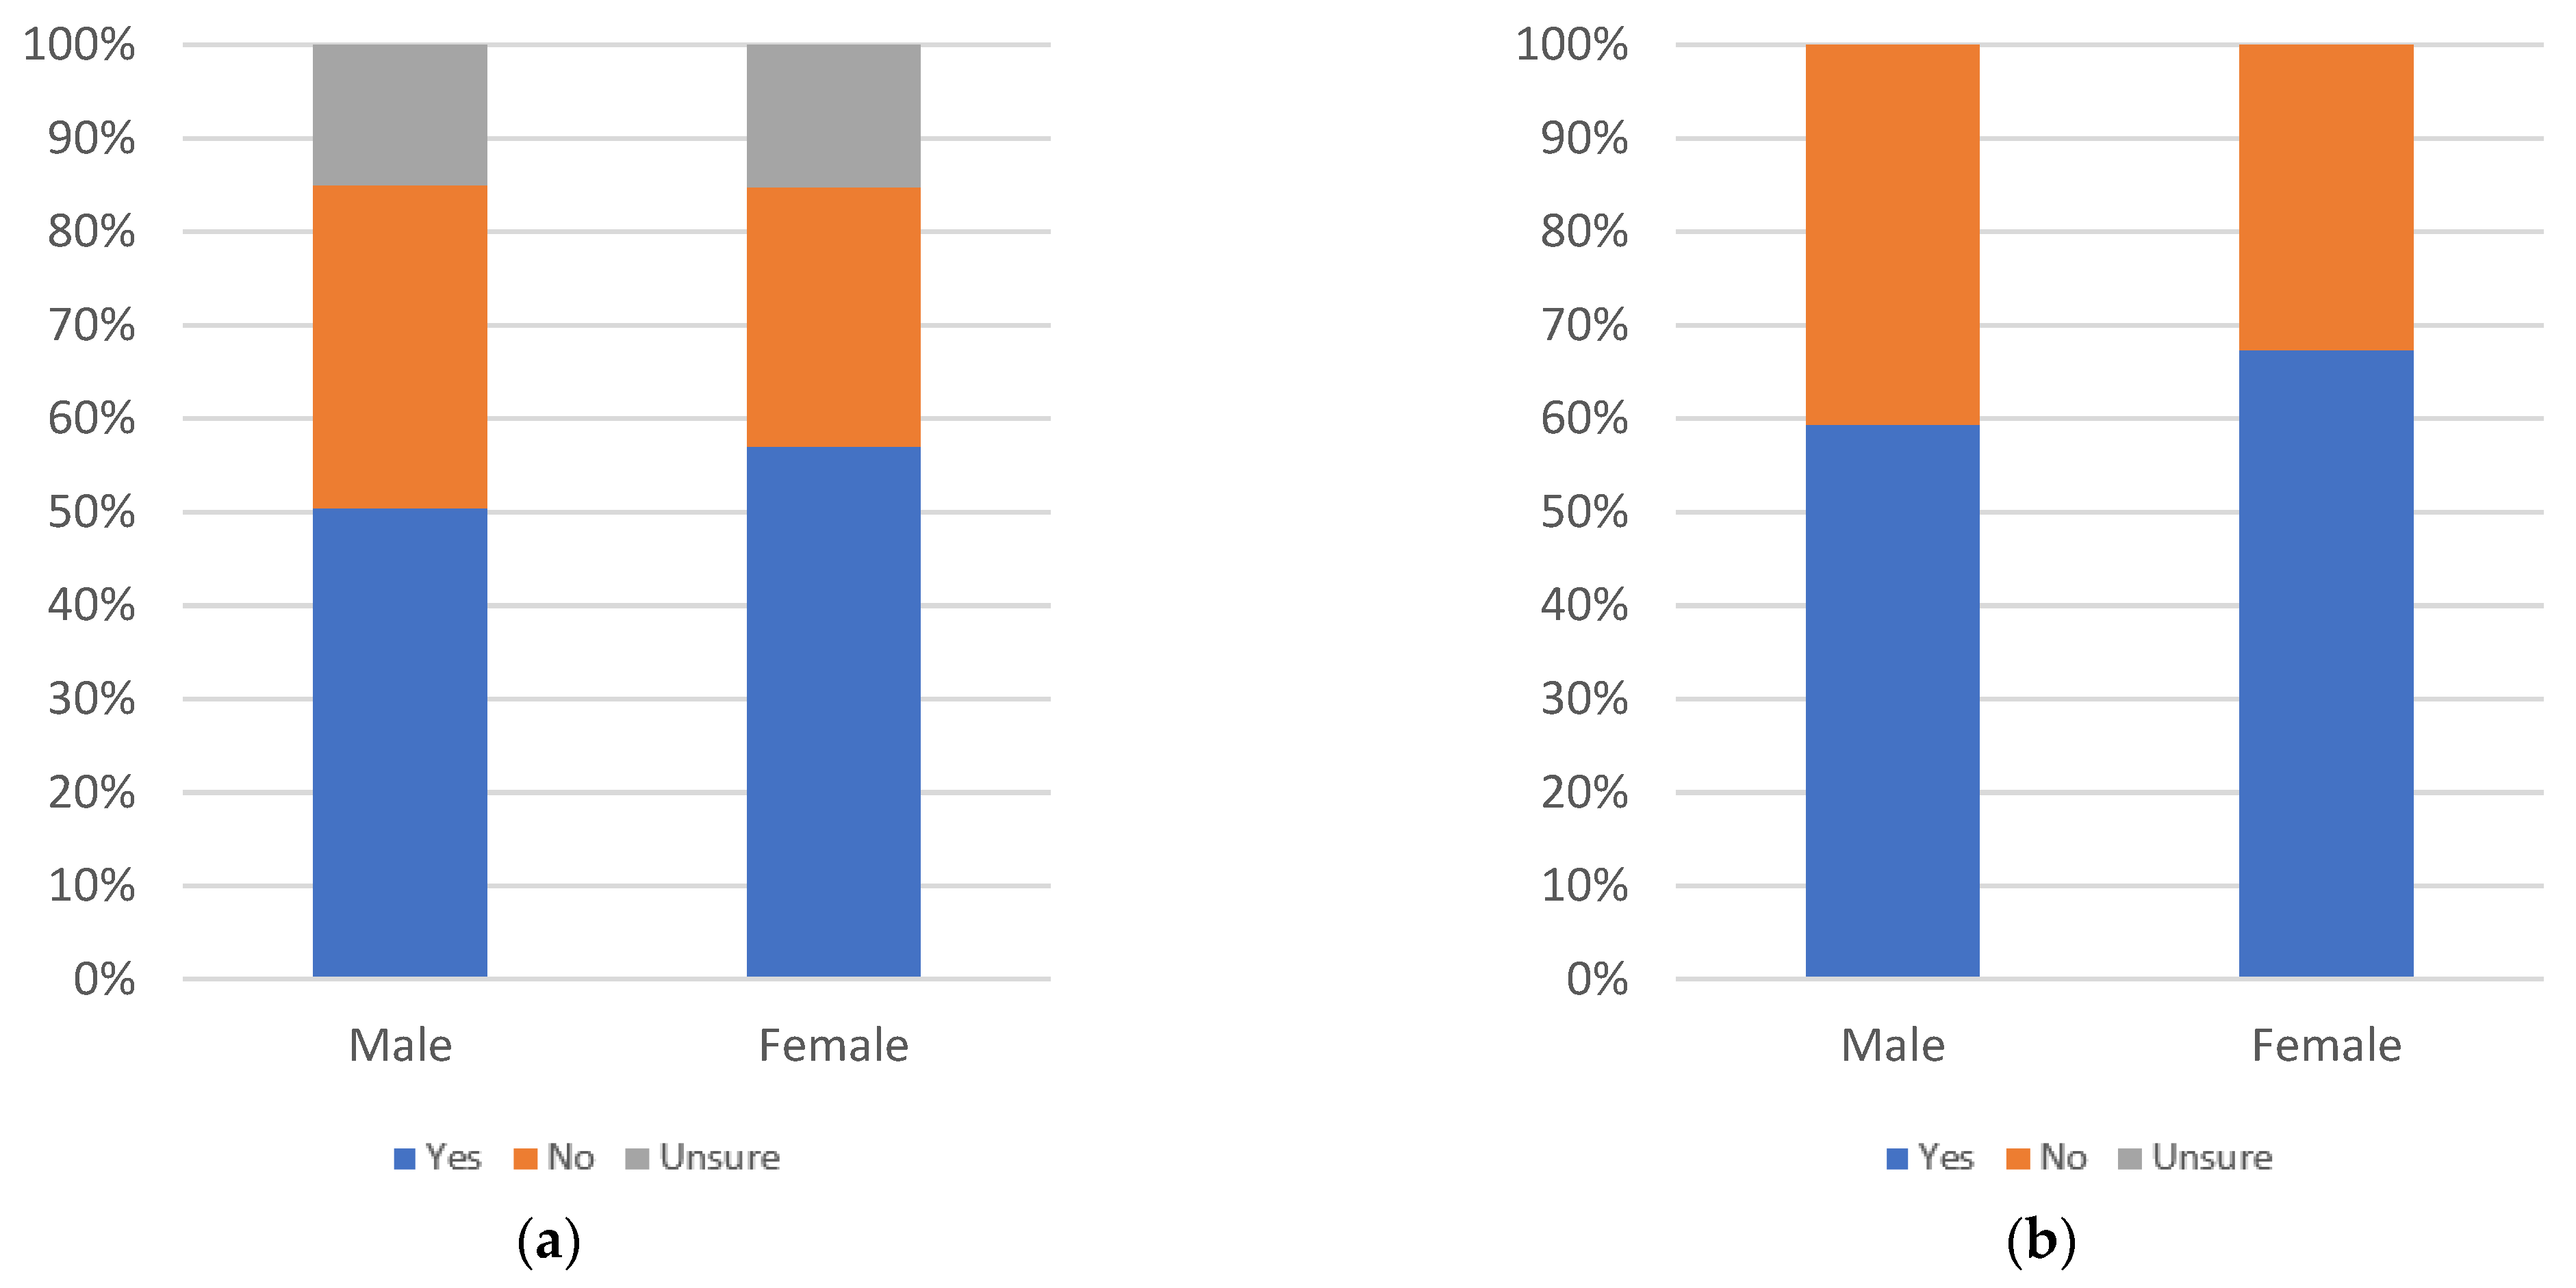
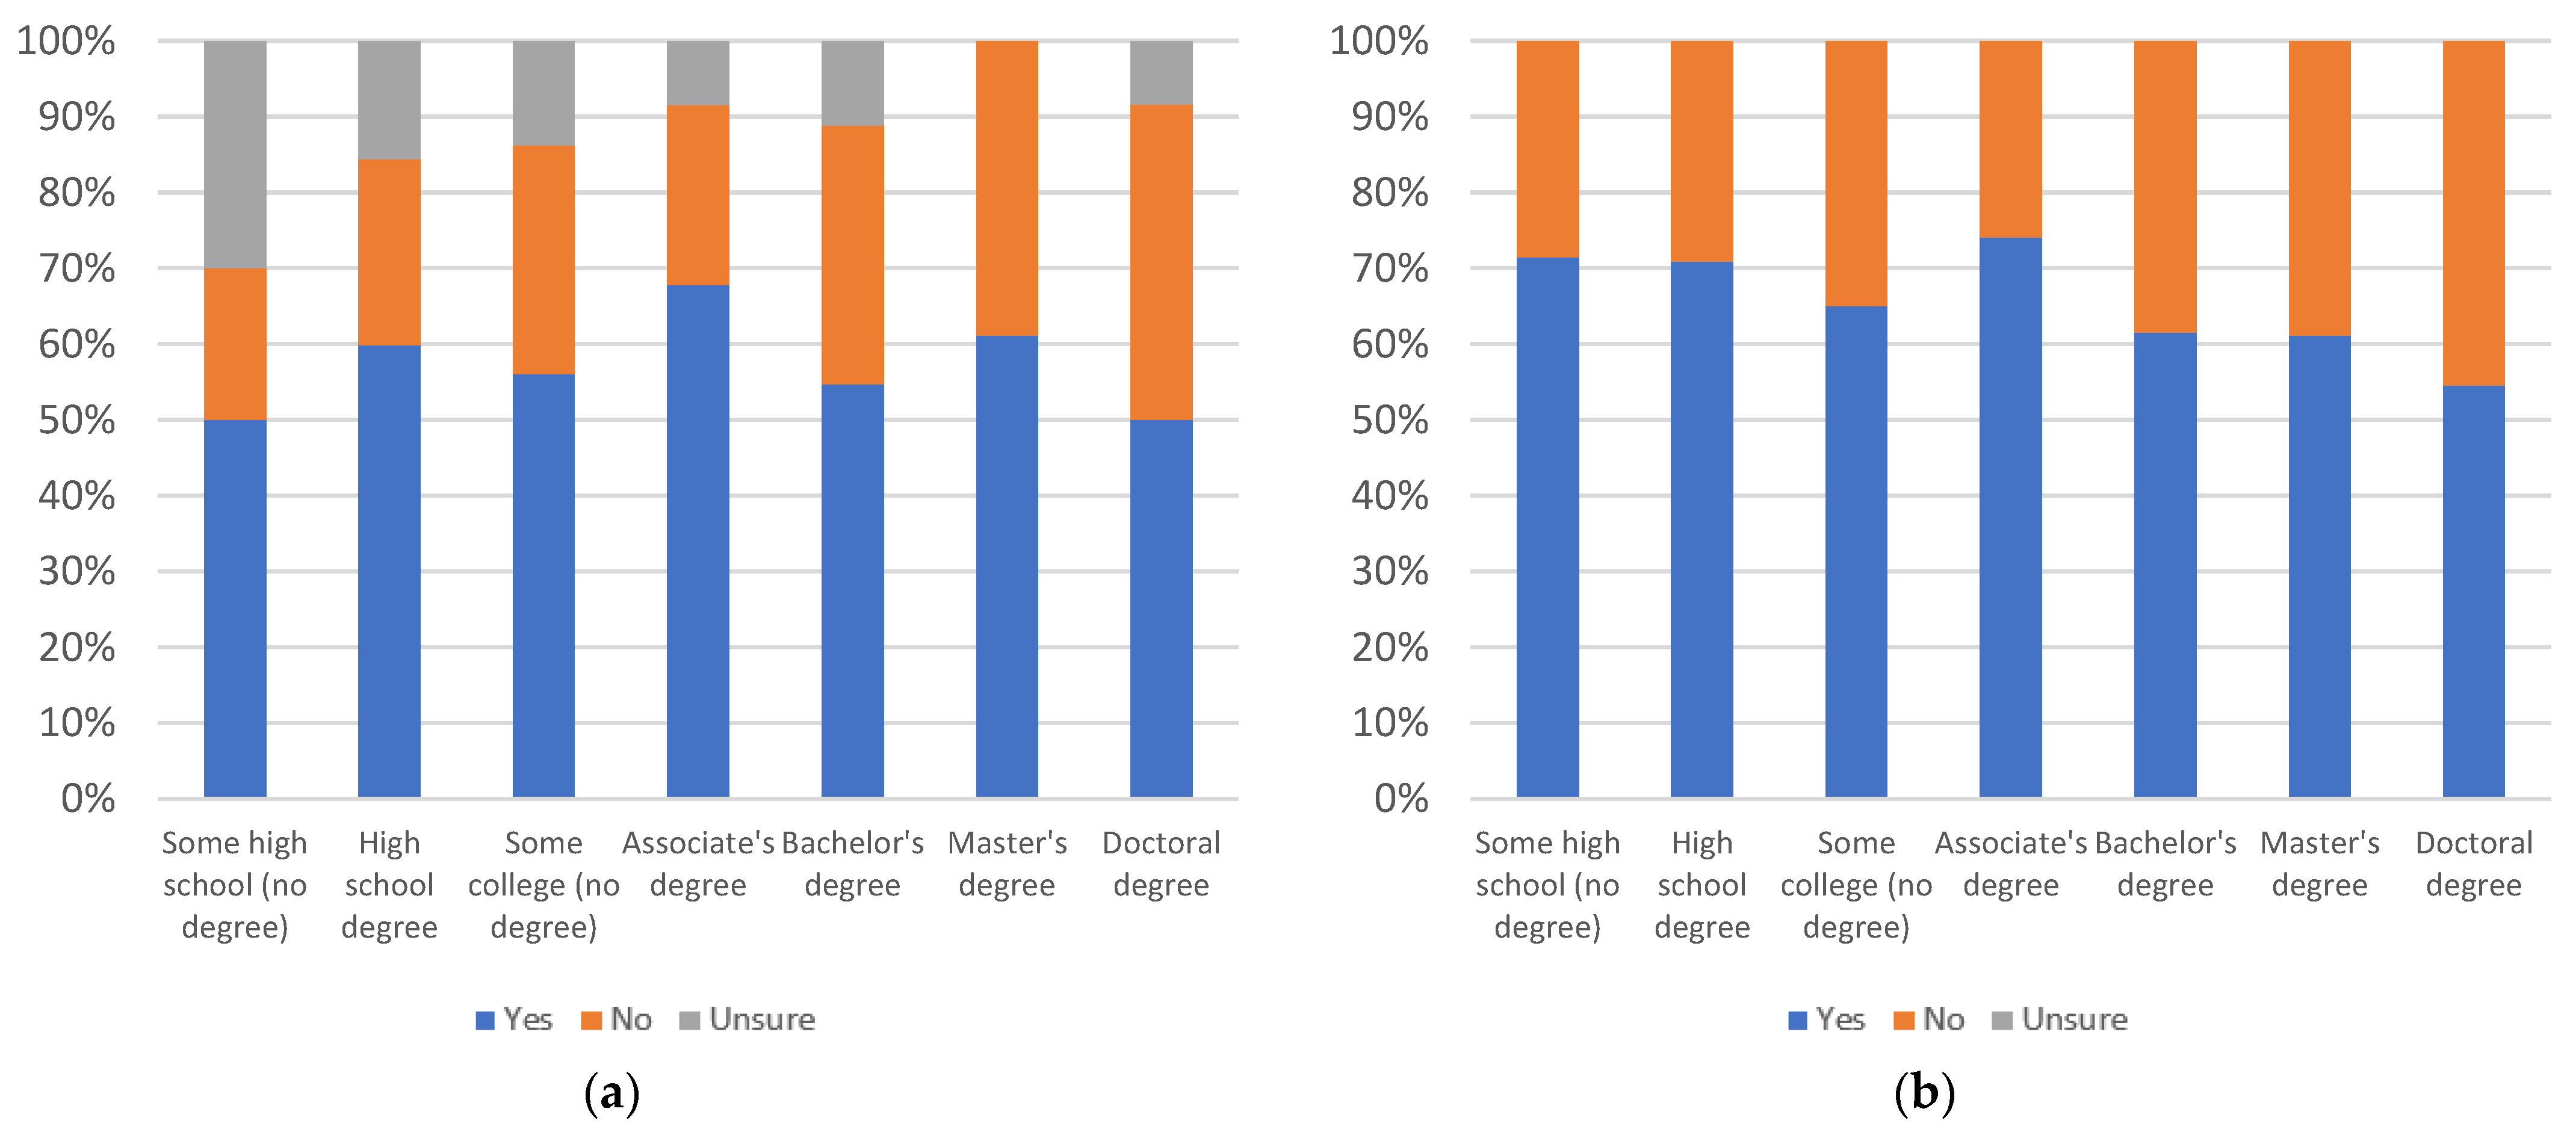
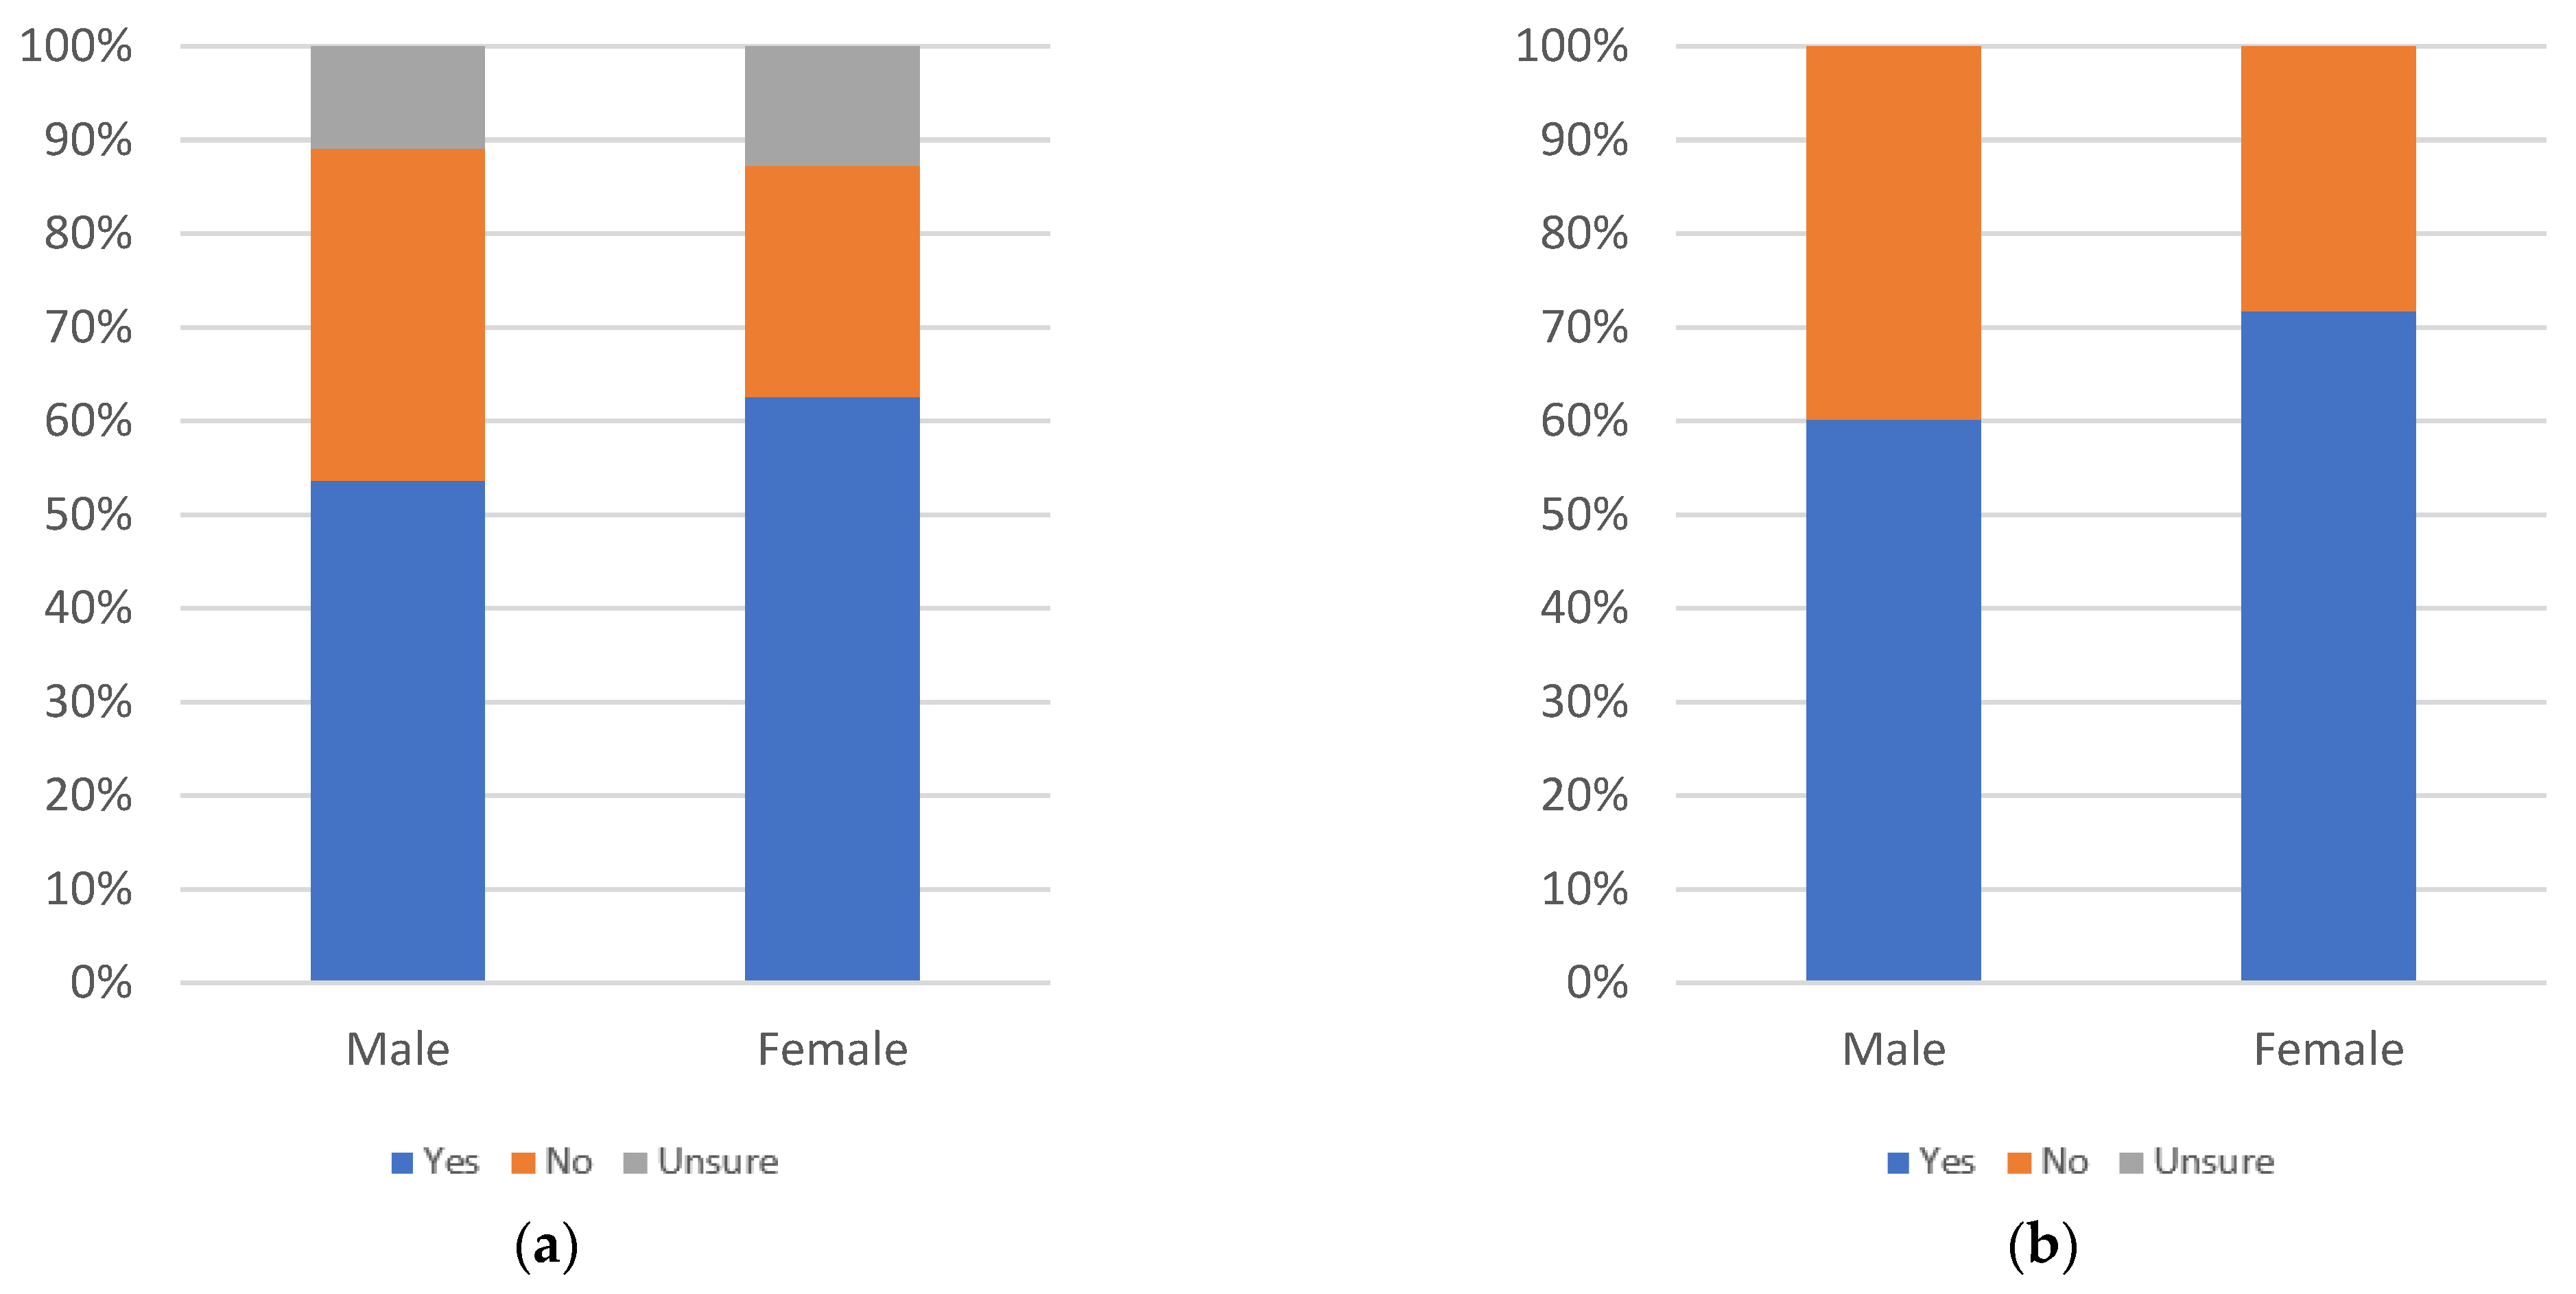
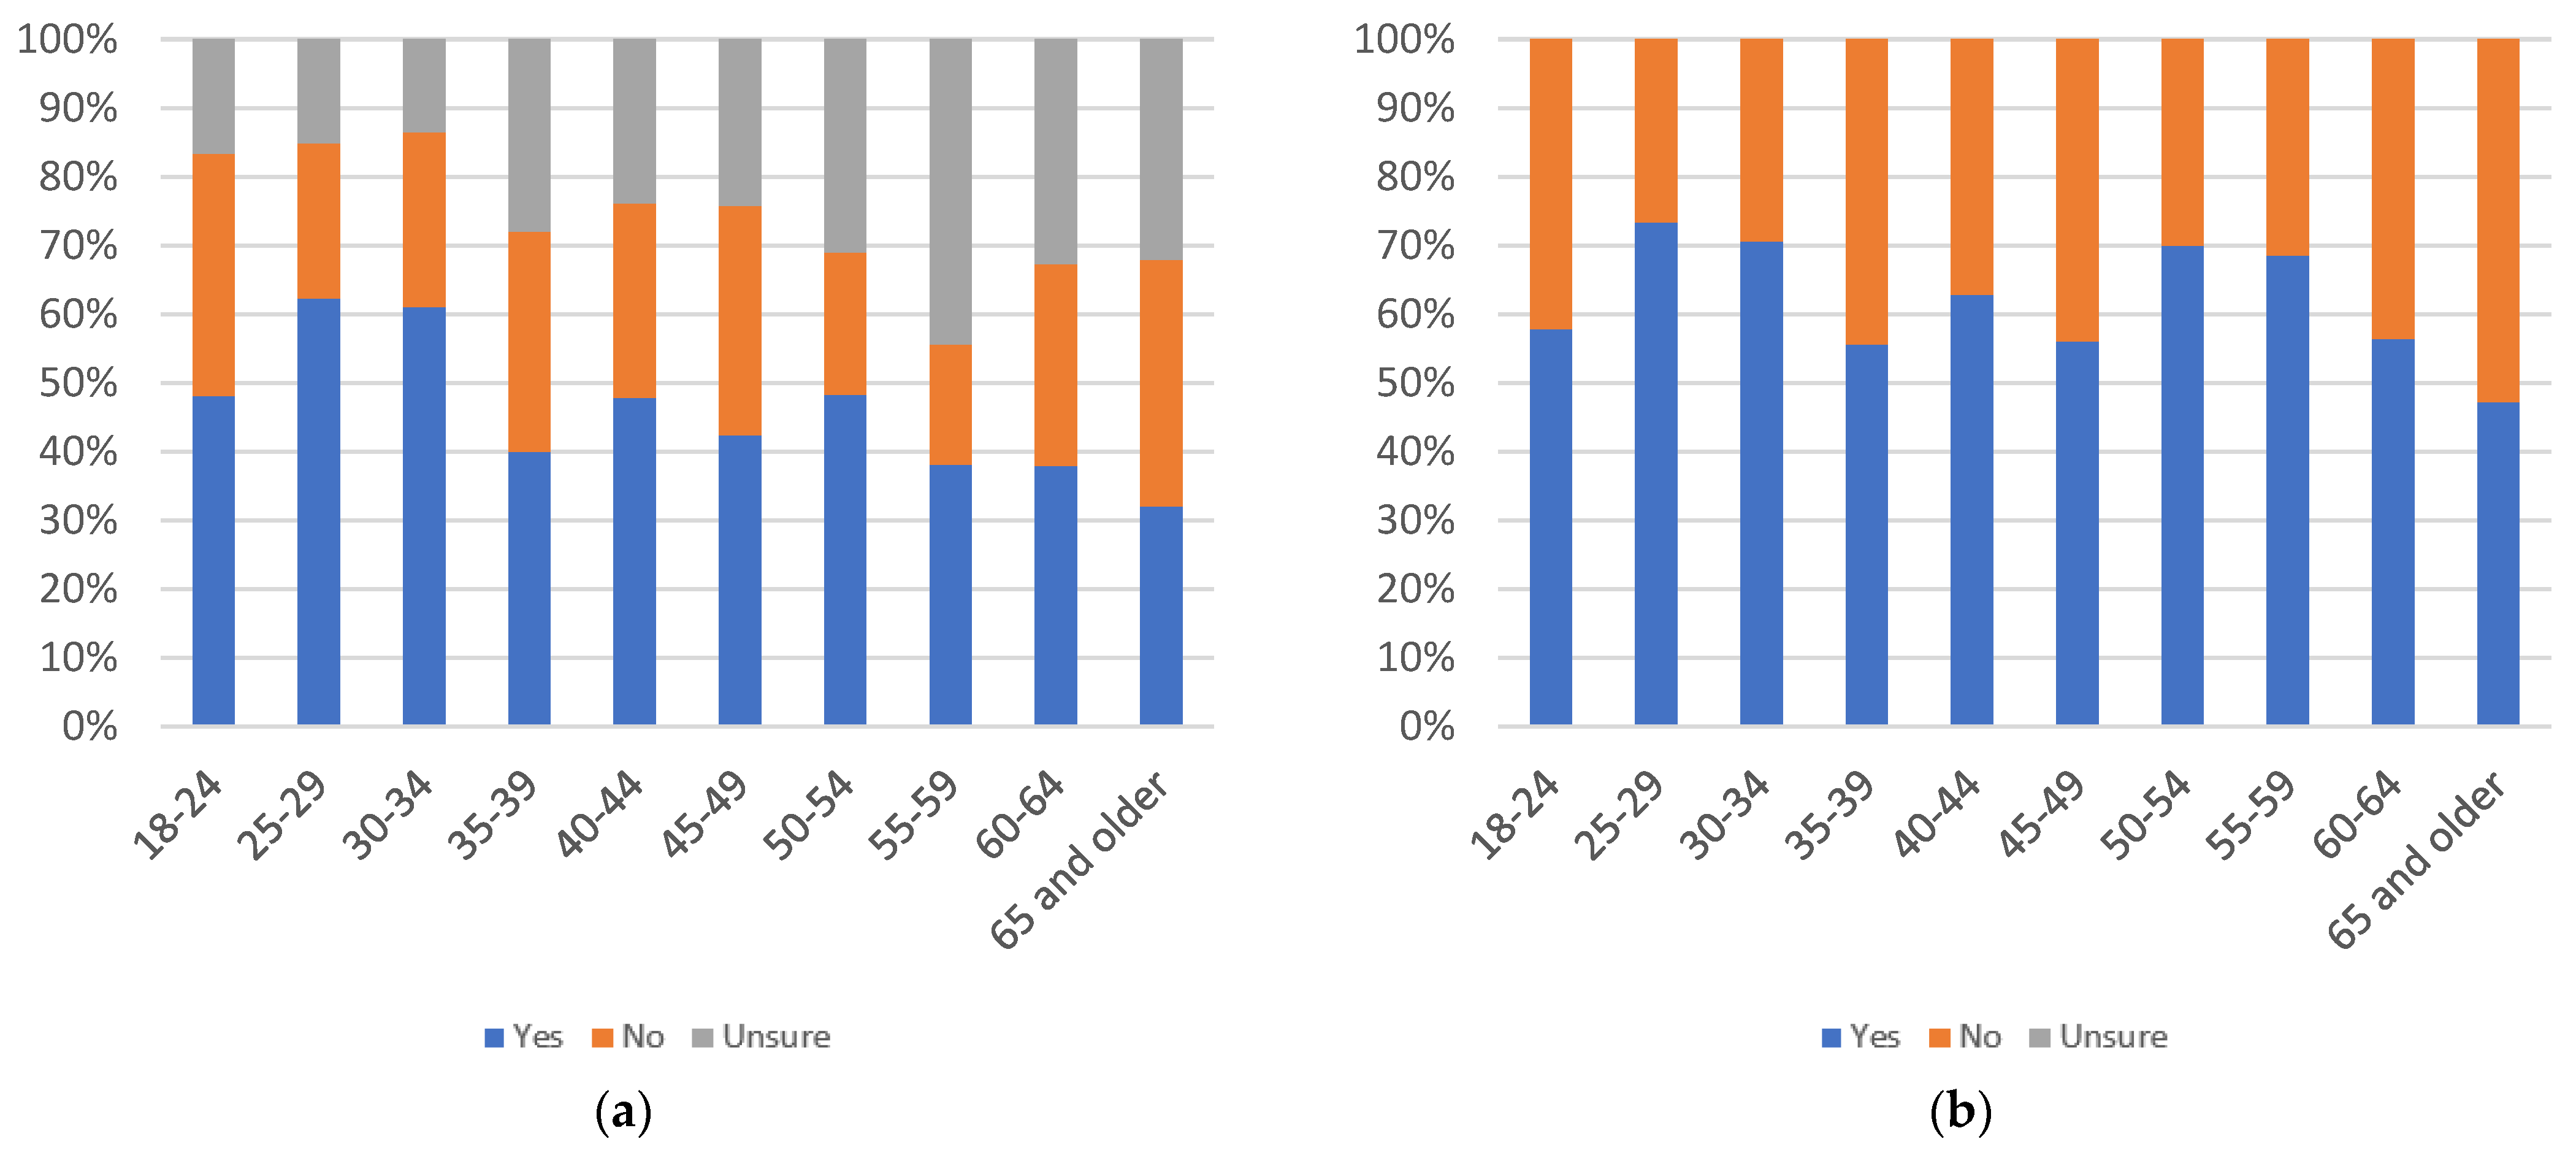
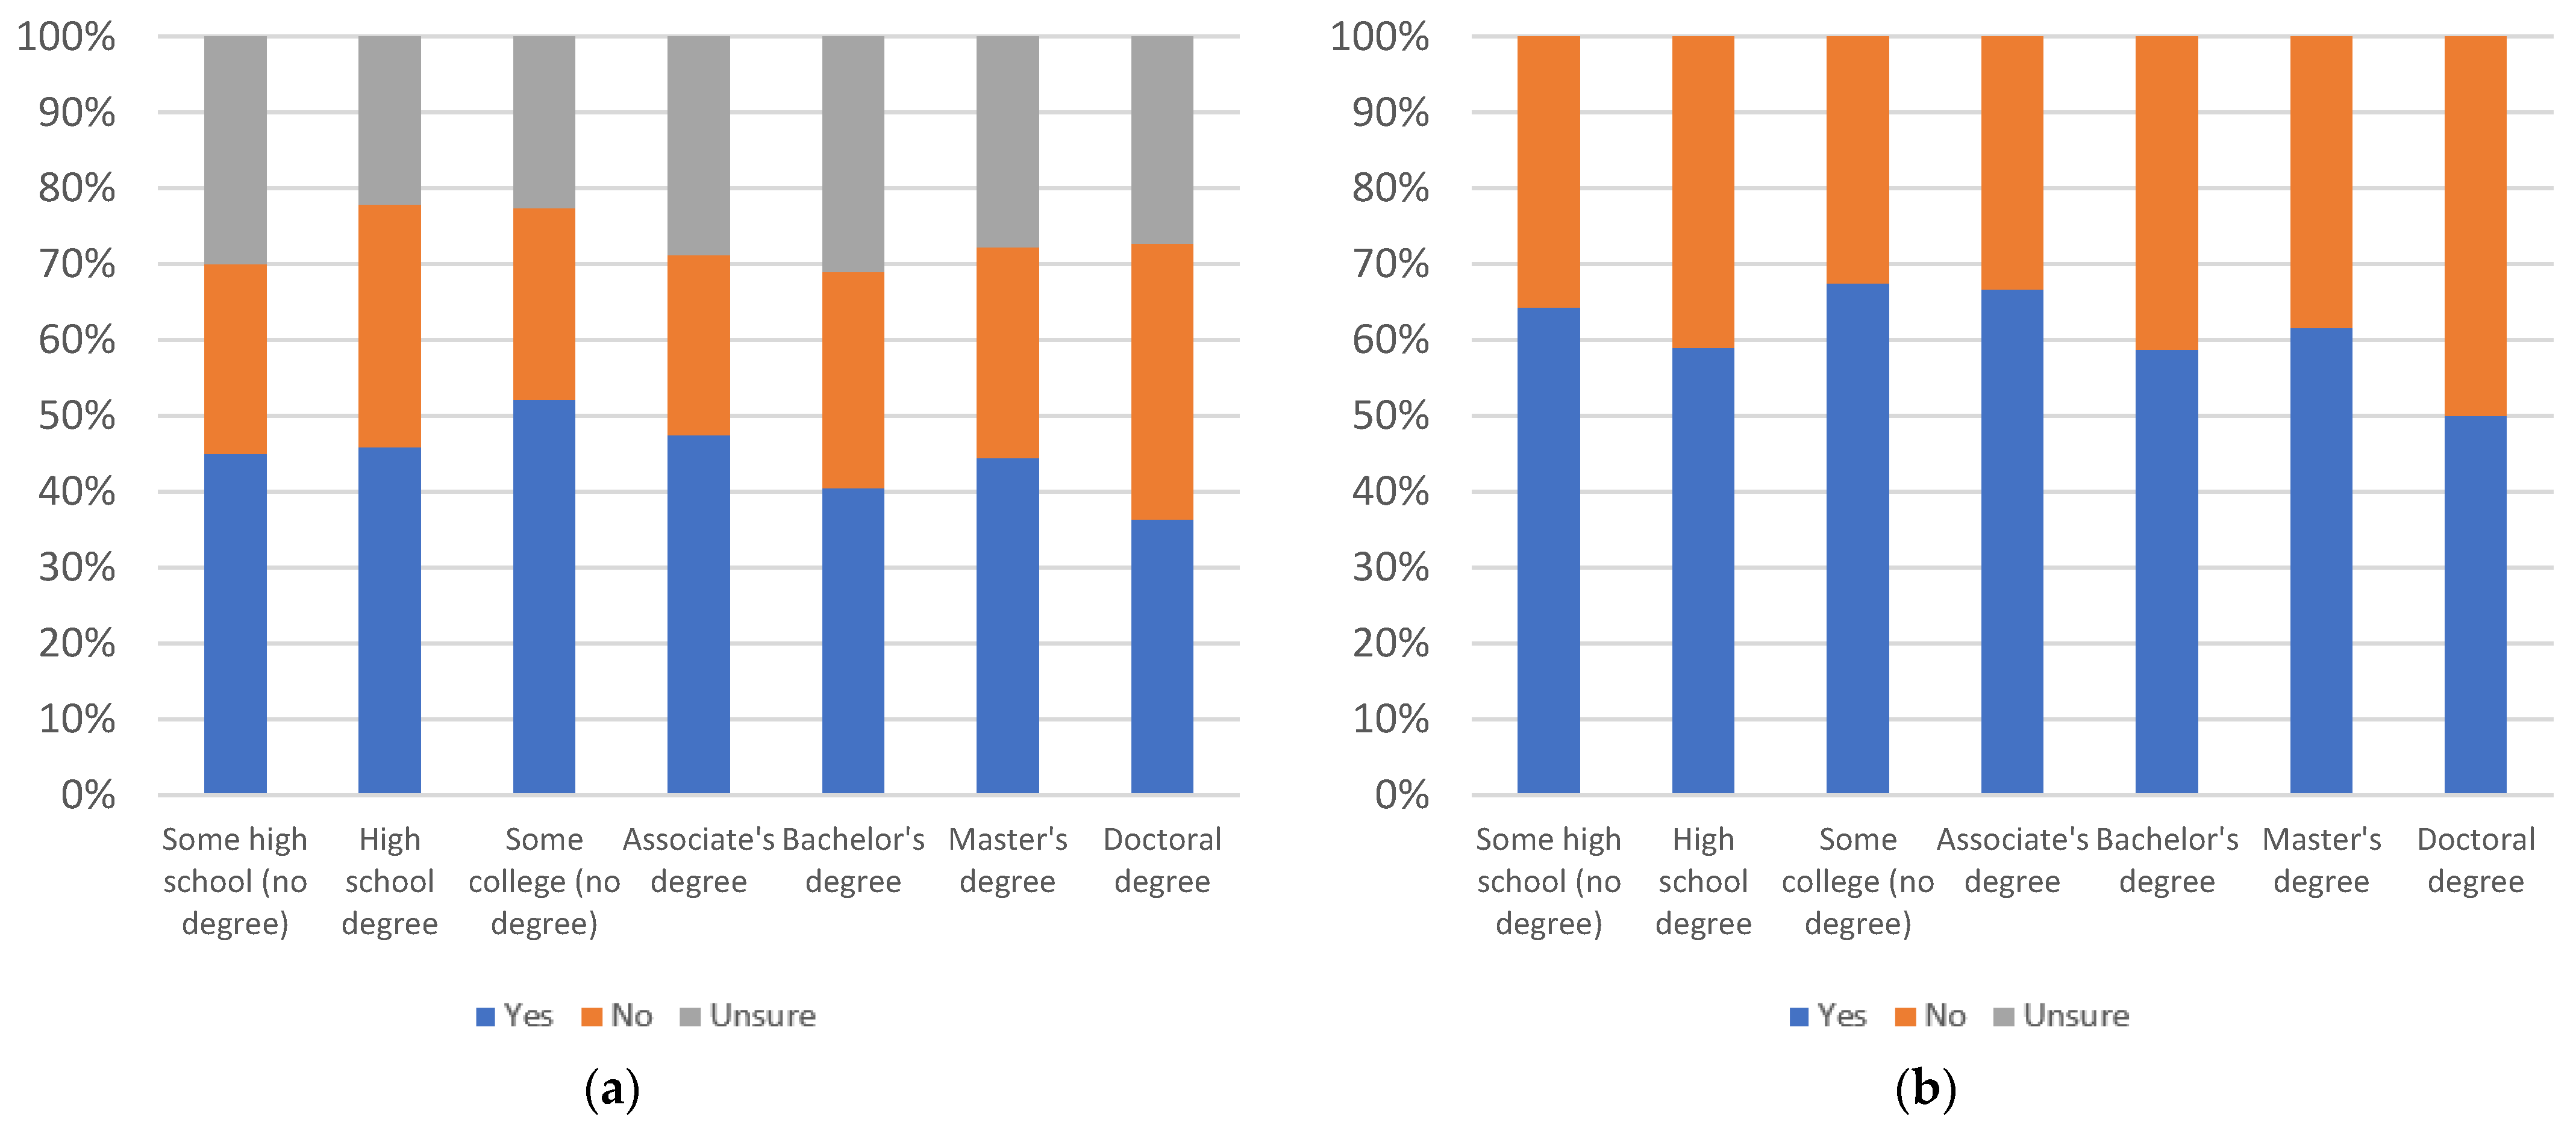
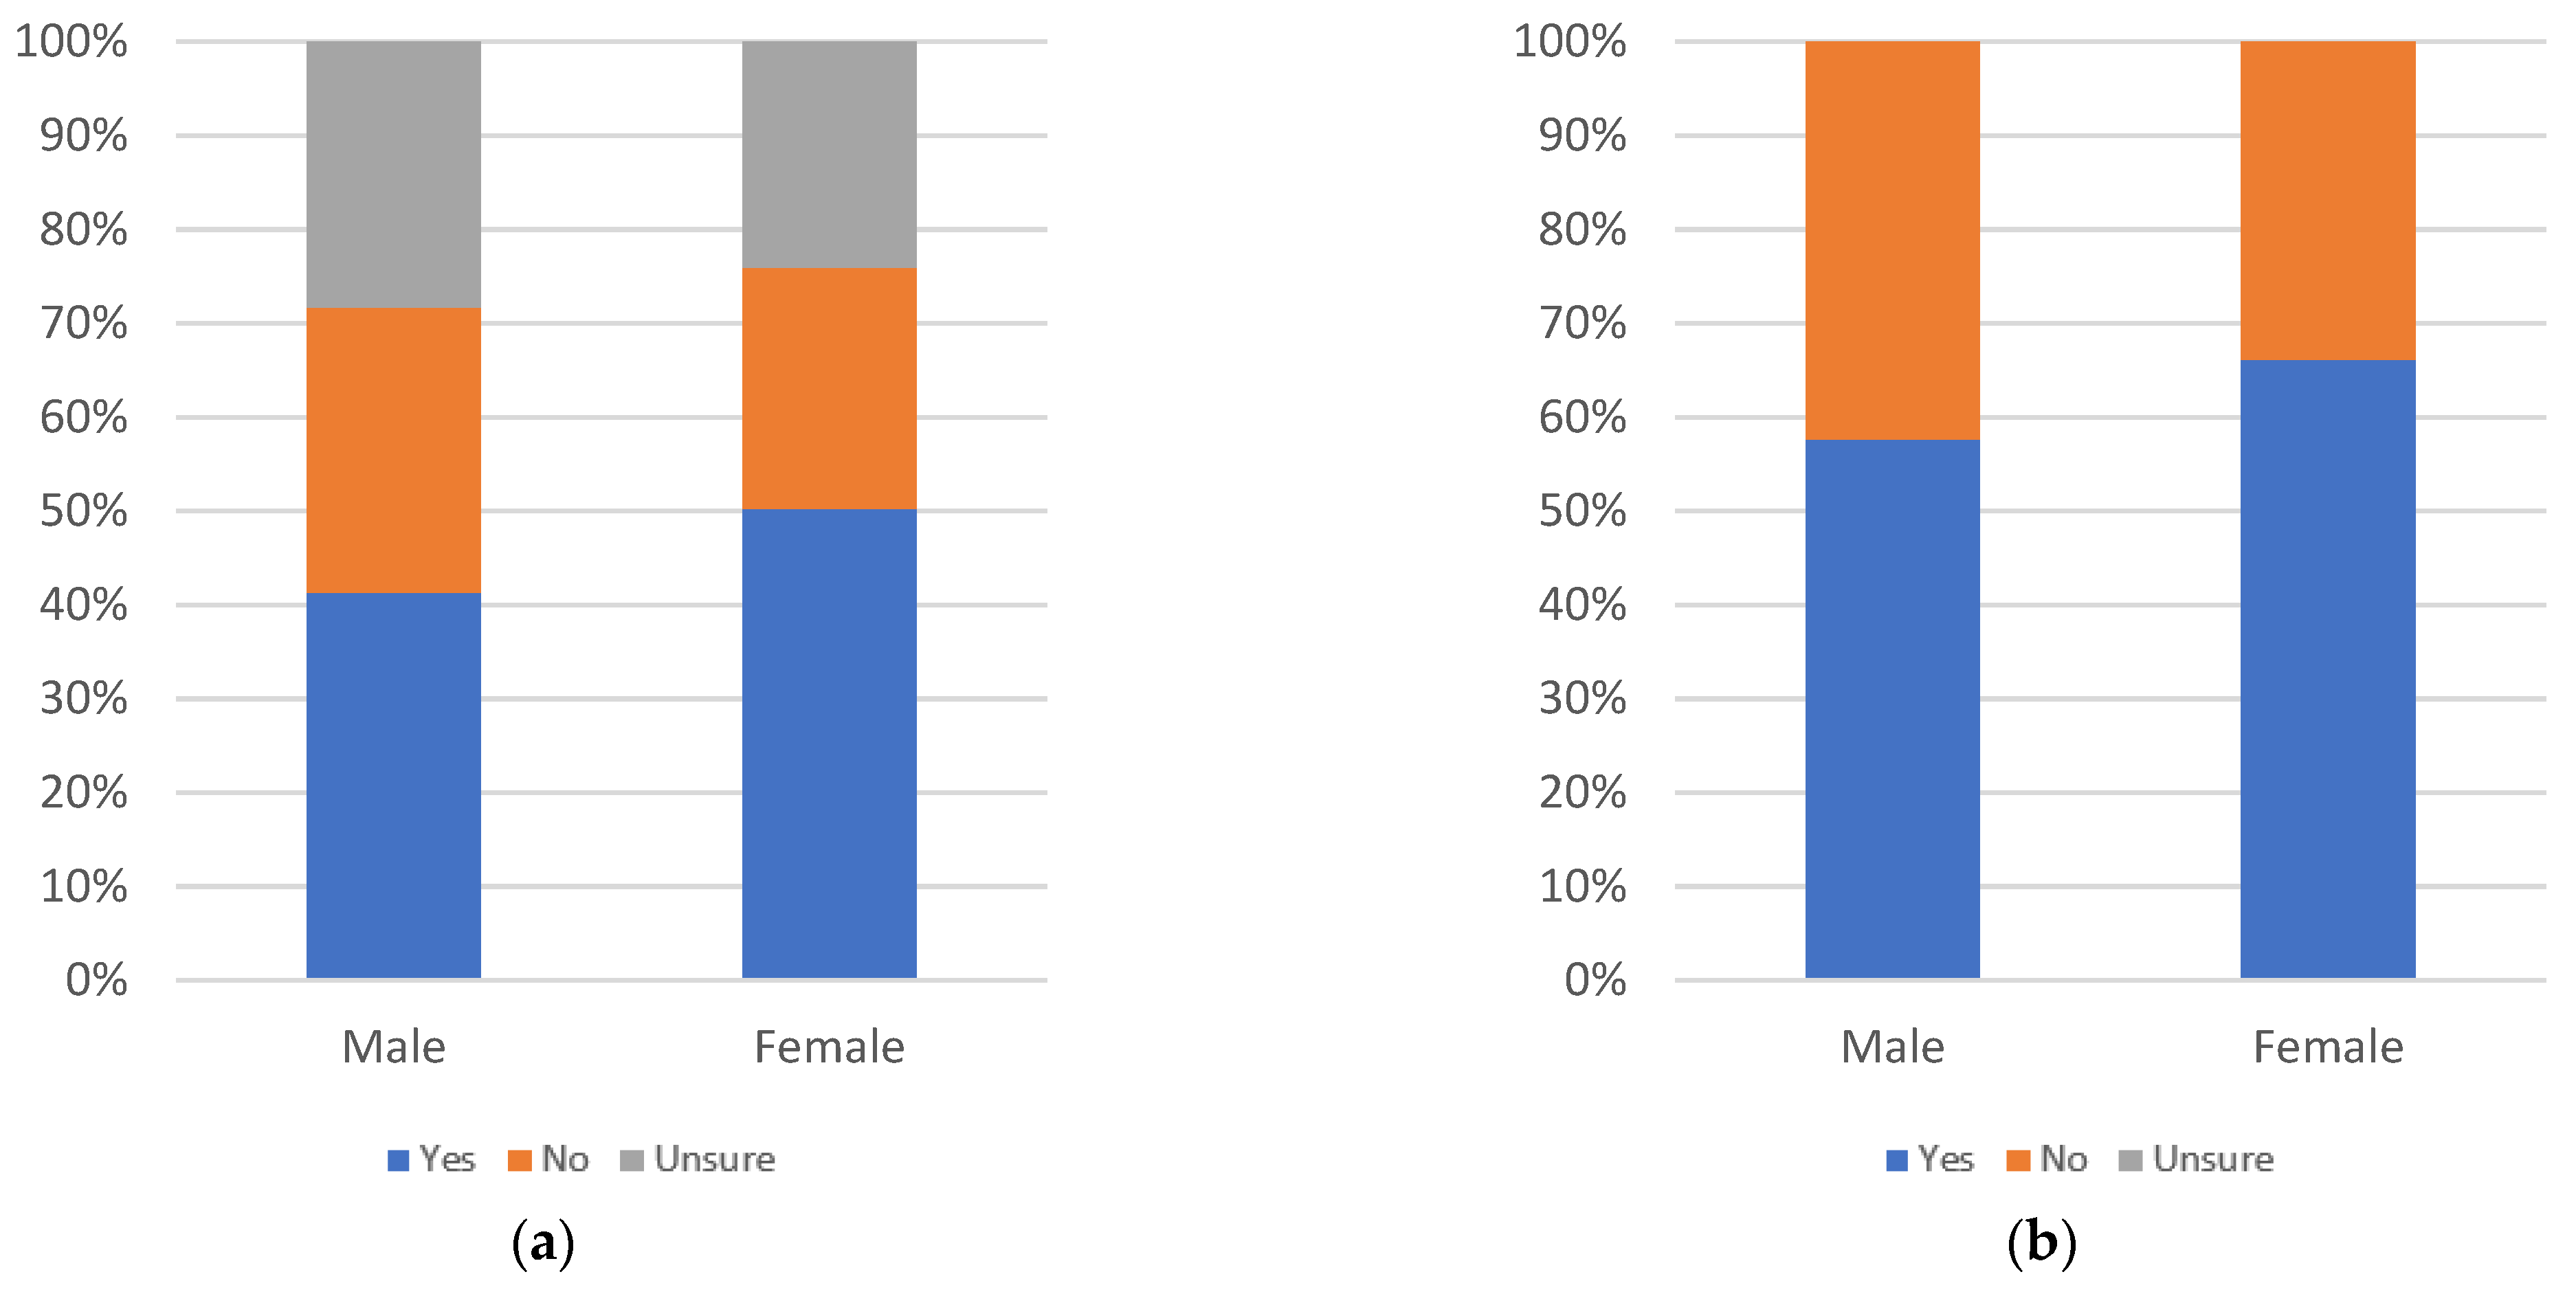
Figure 7. Respondents answered the question “would you find this label helpful?”.
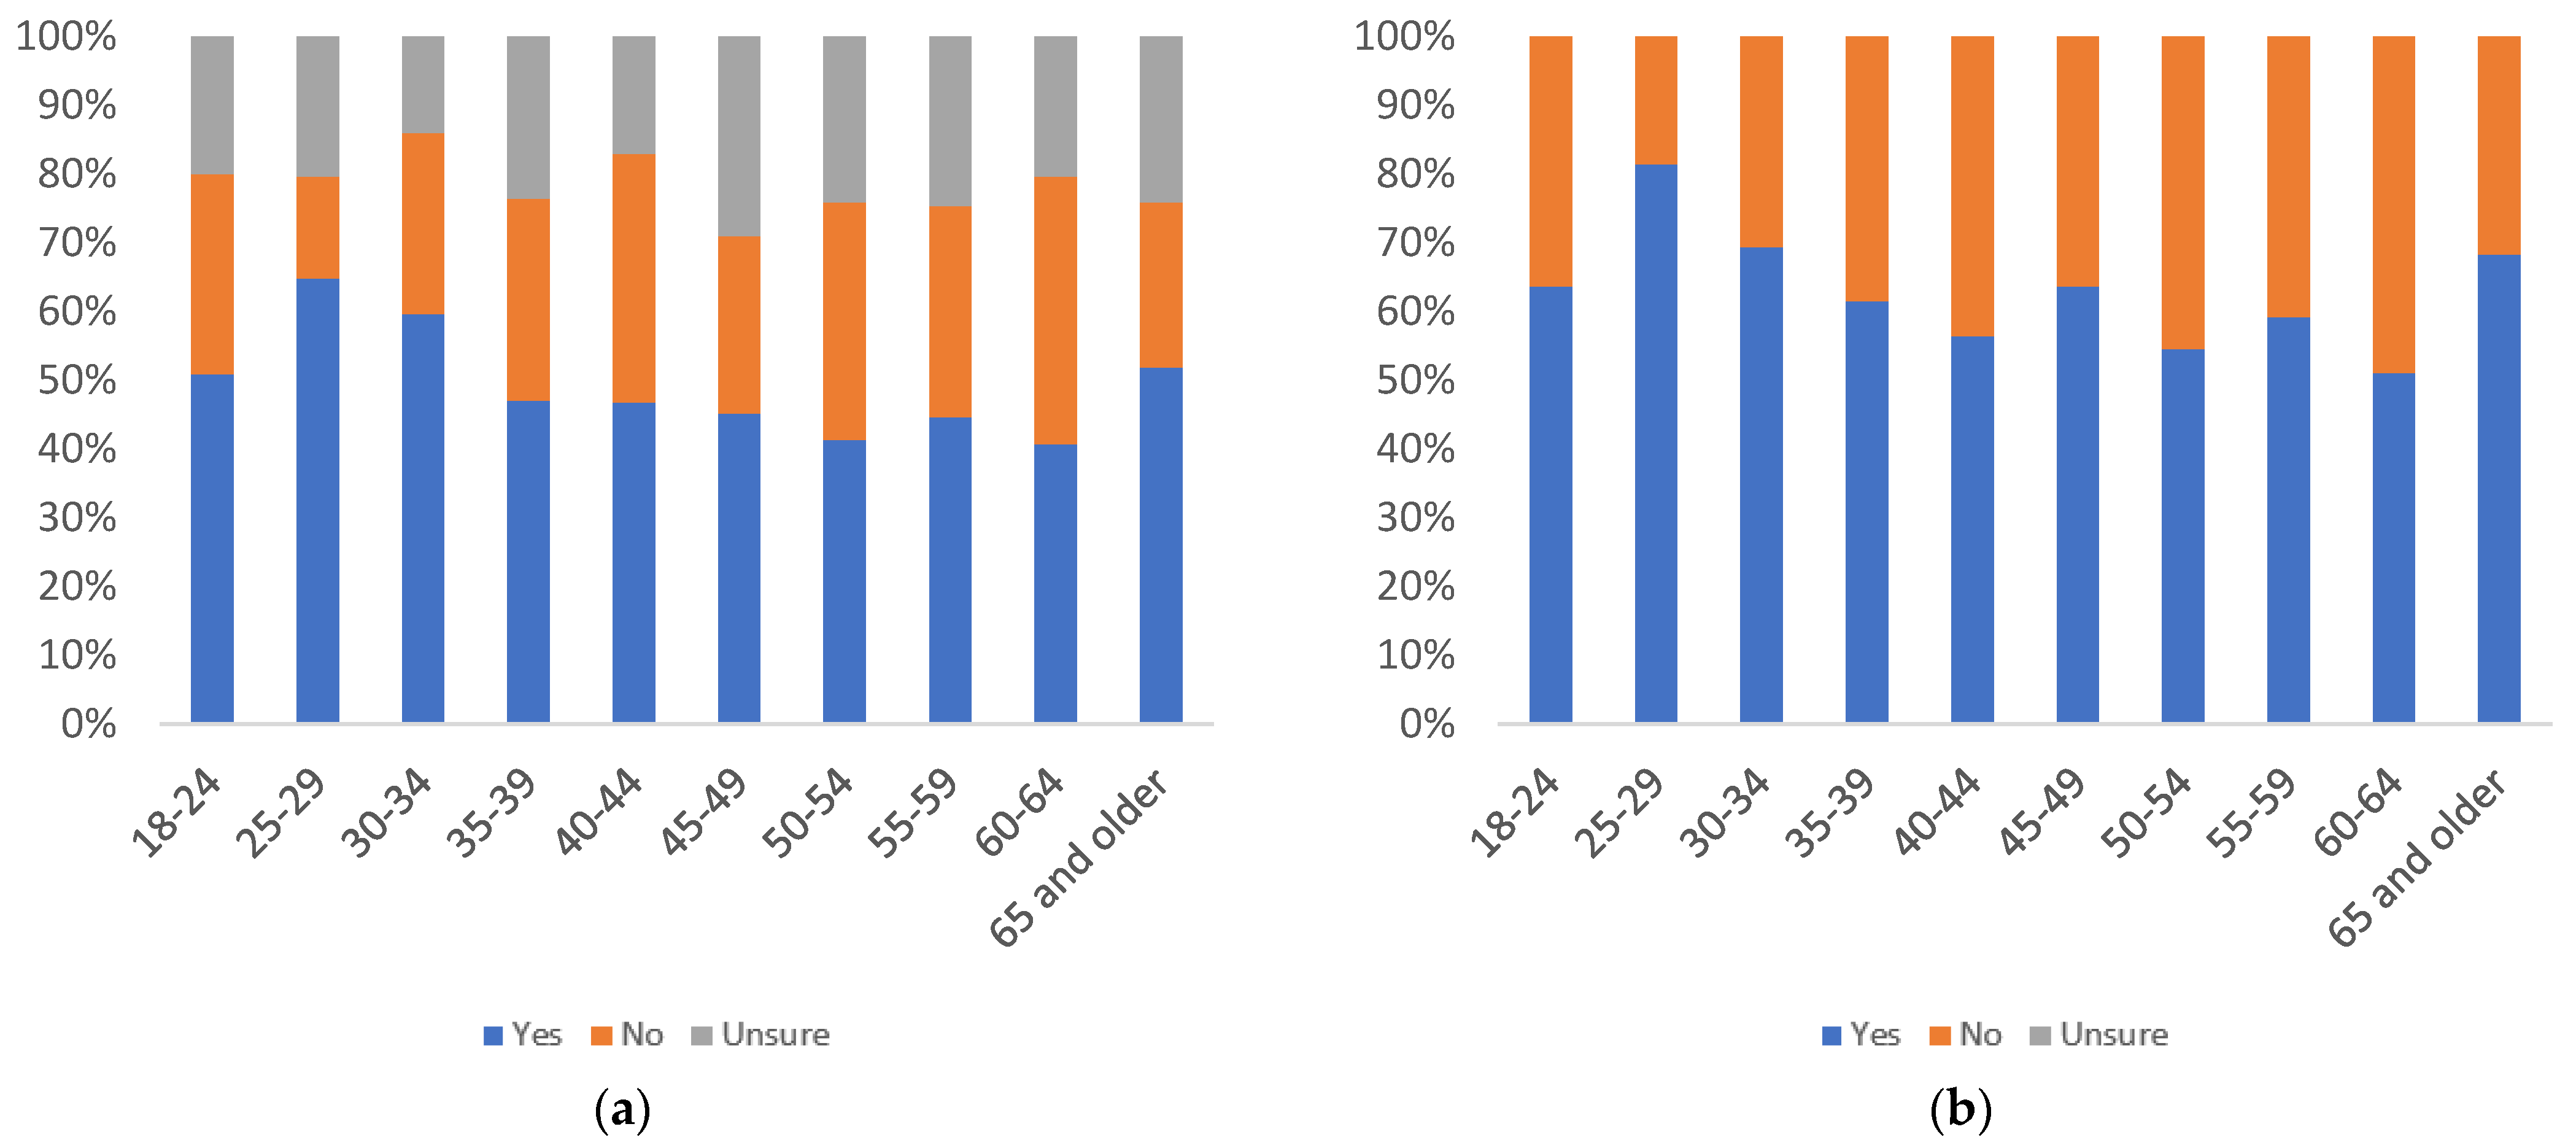
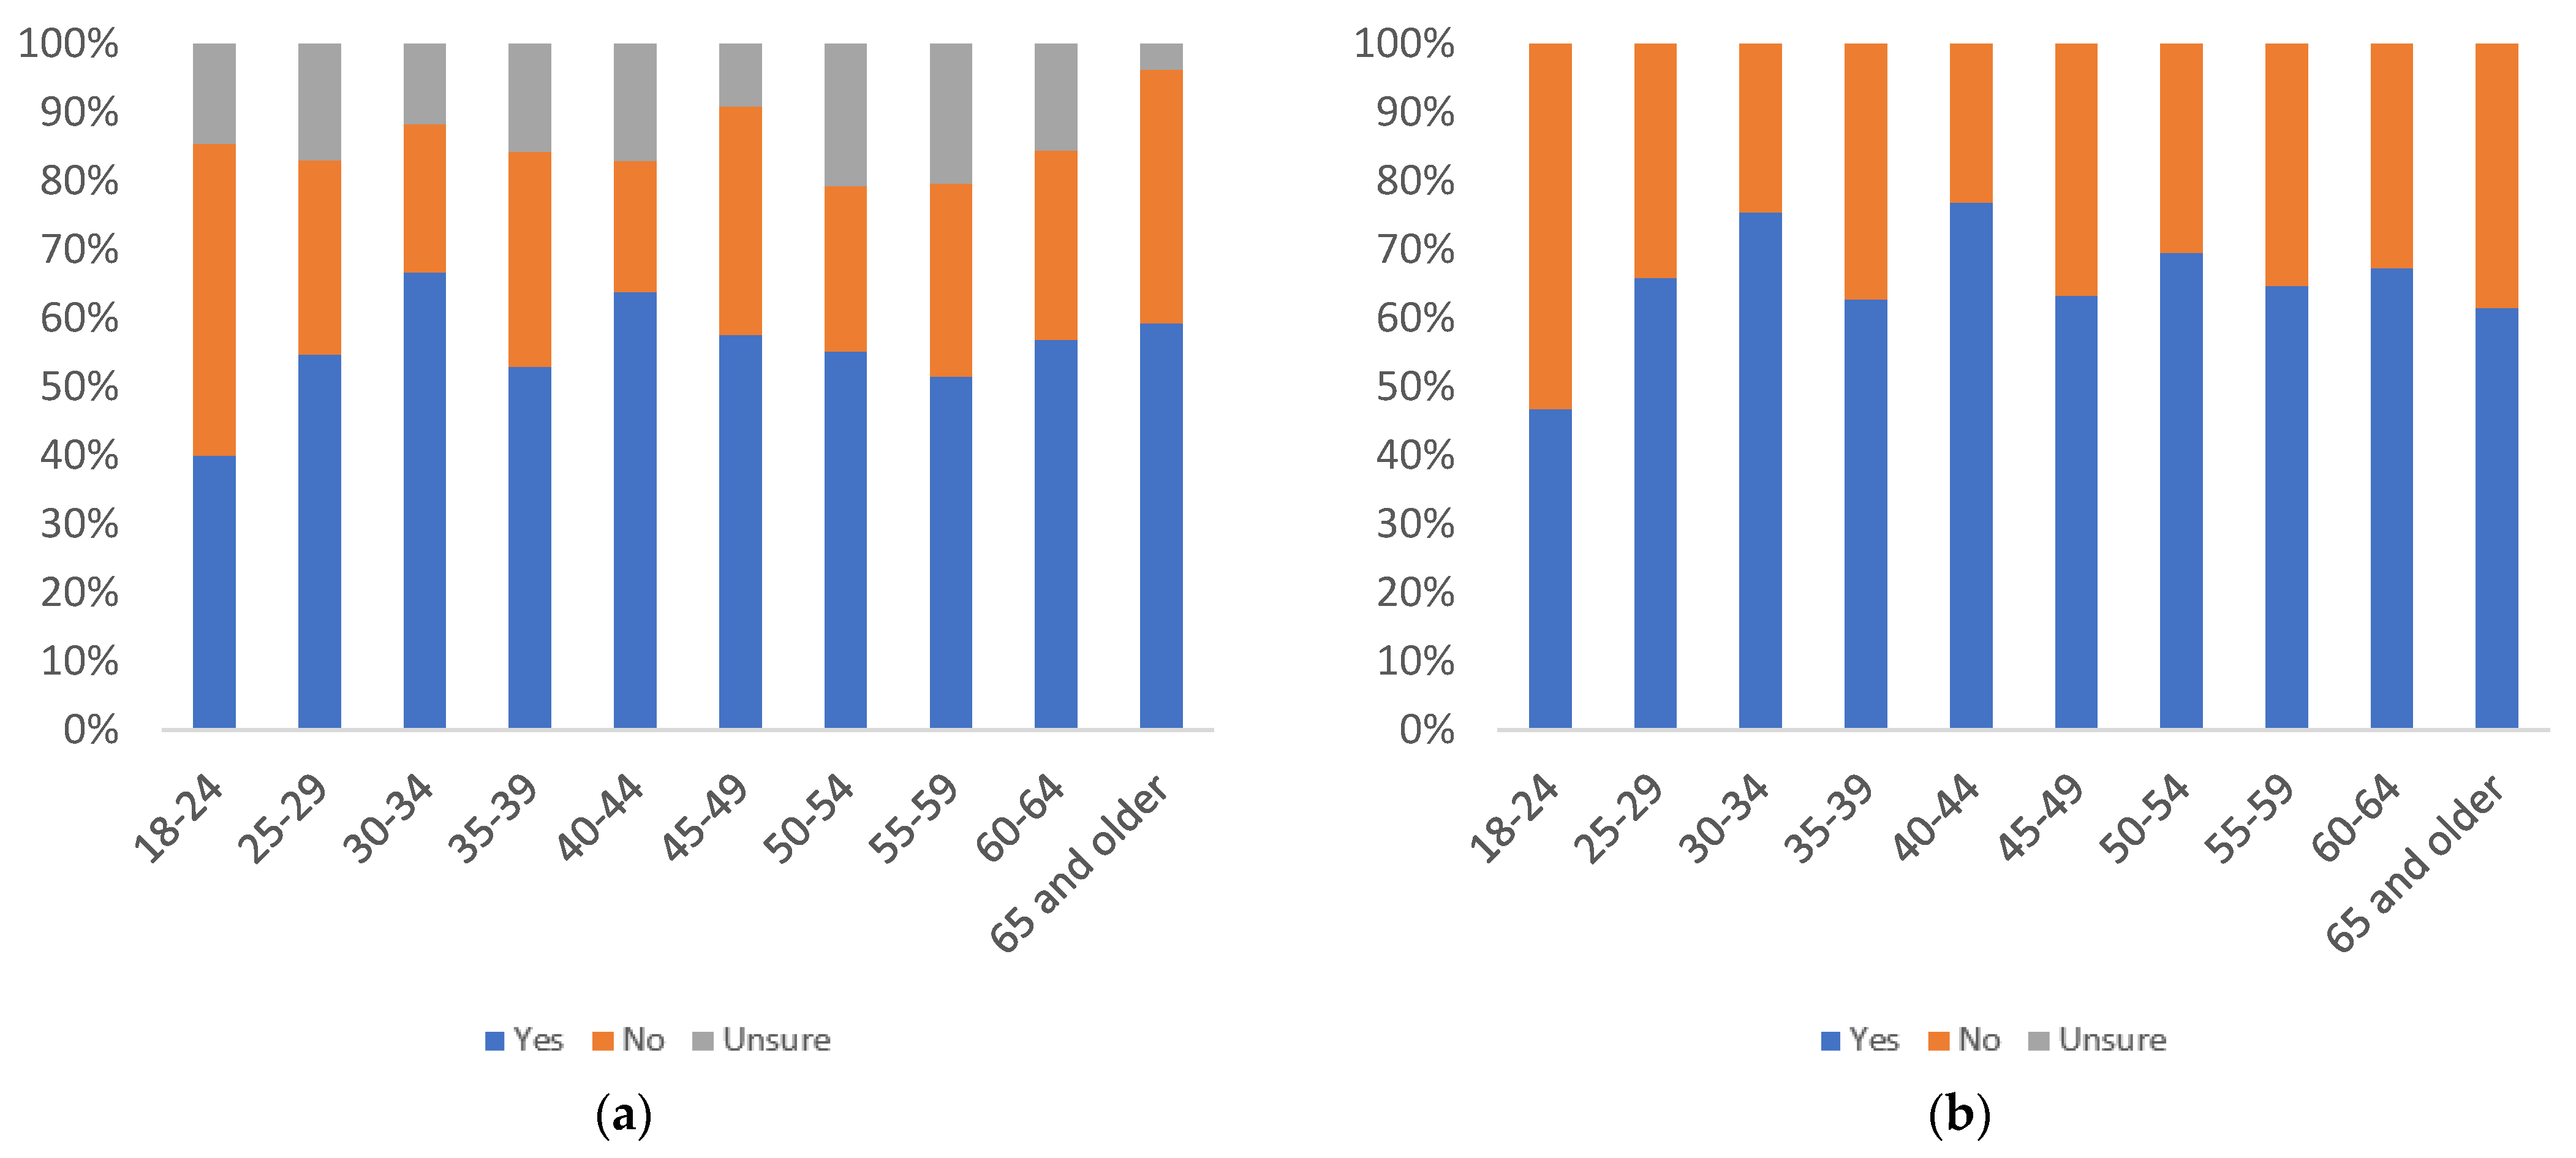
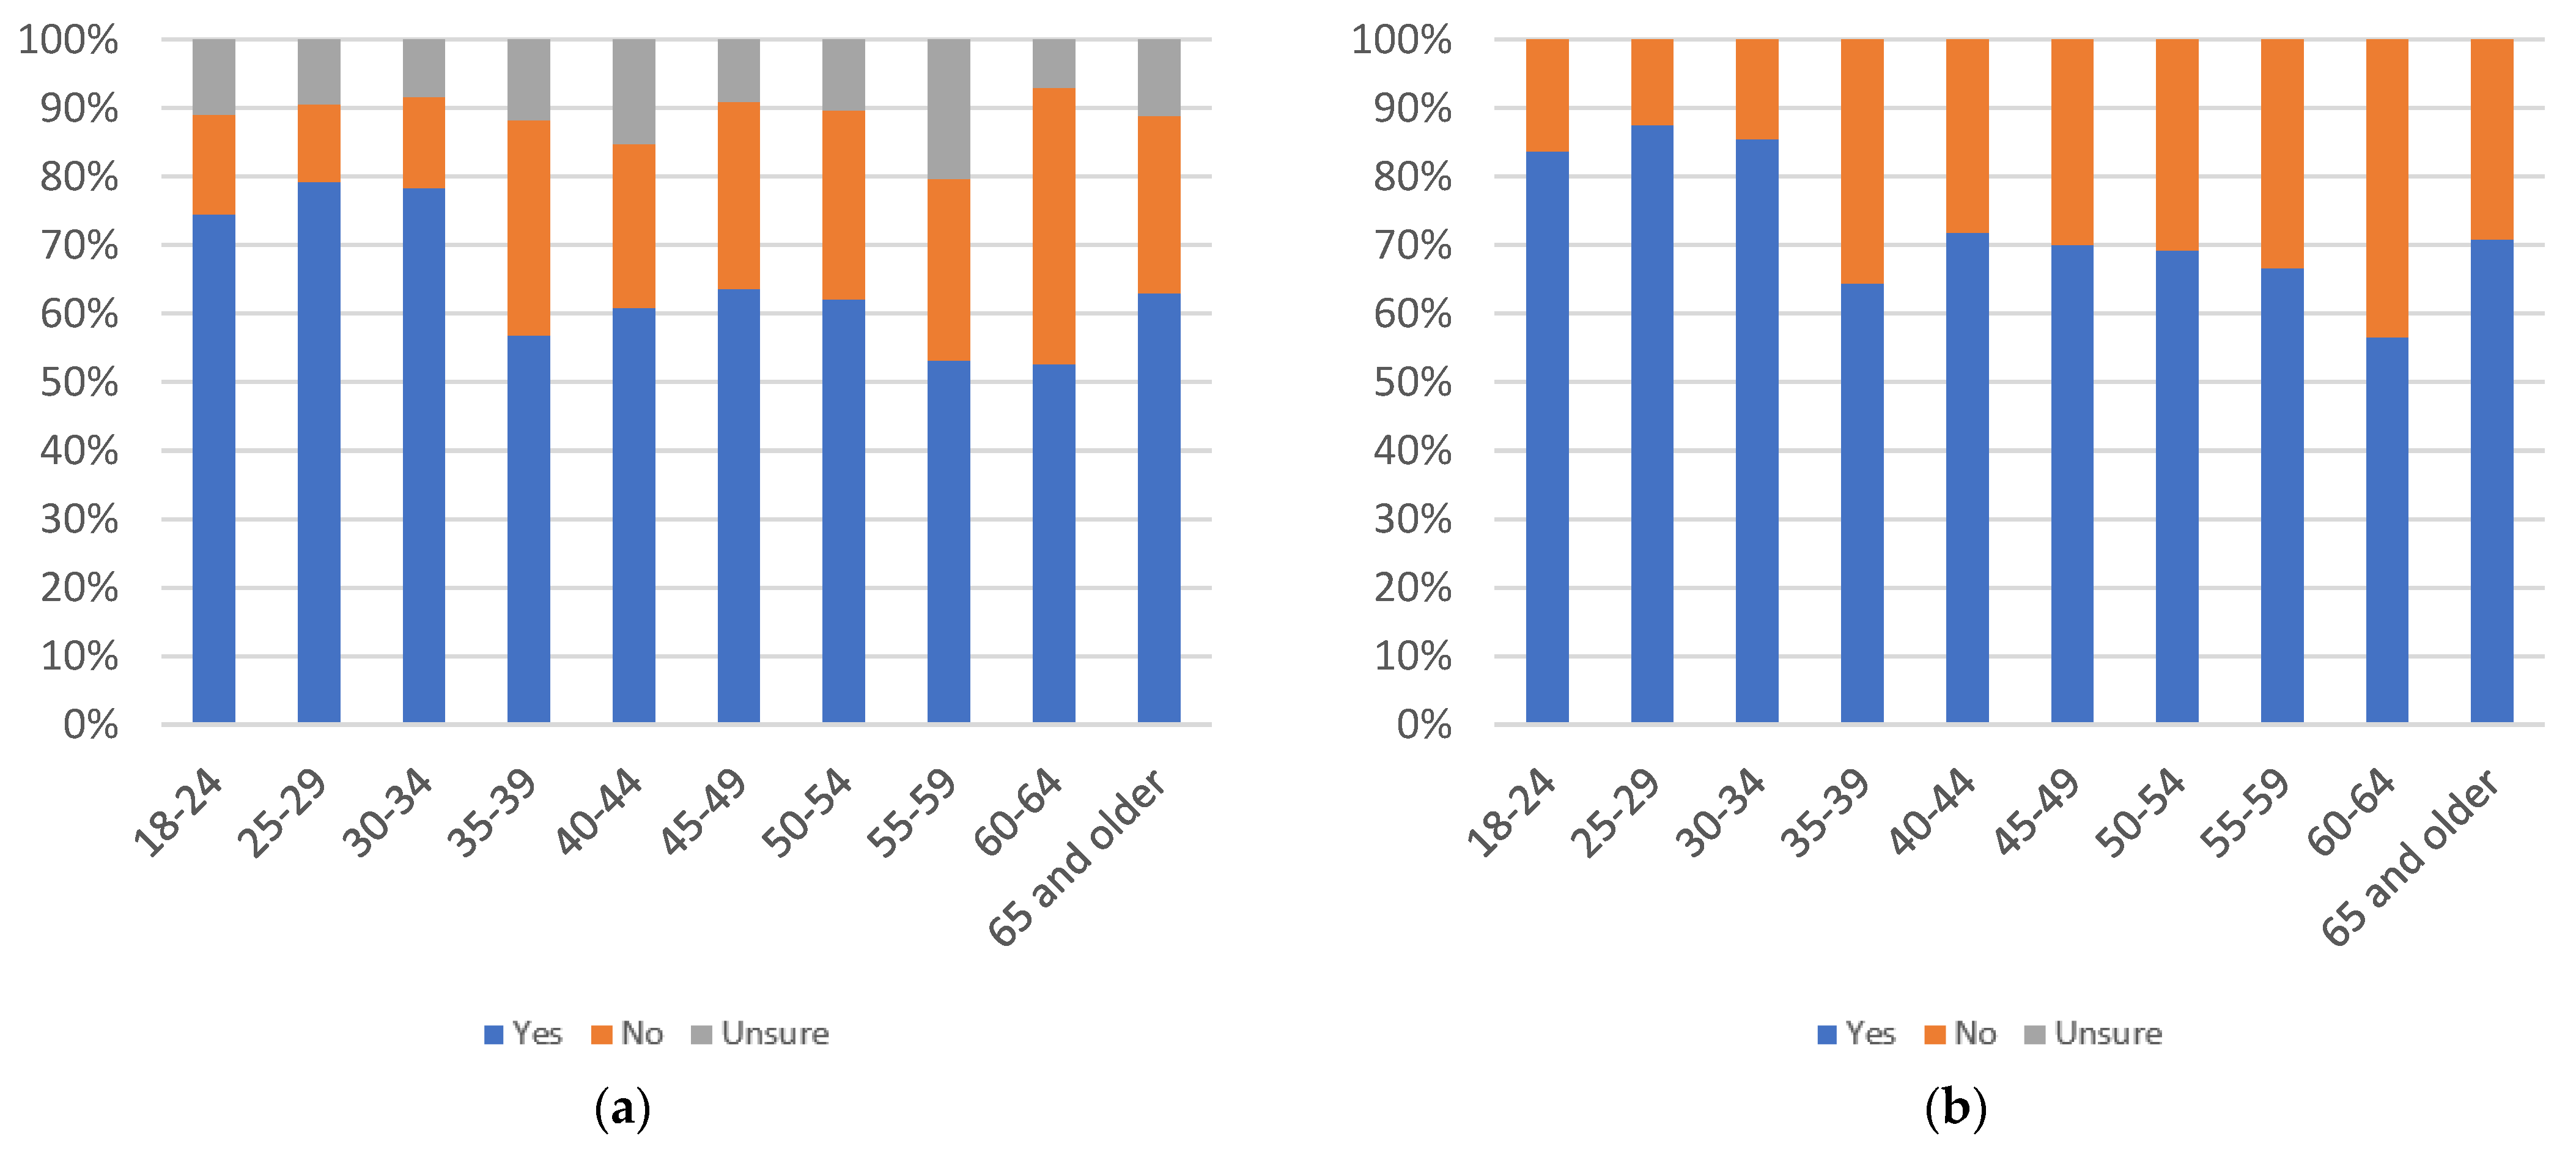
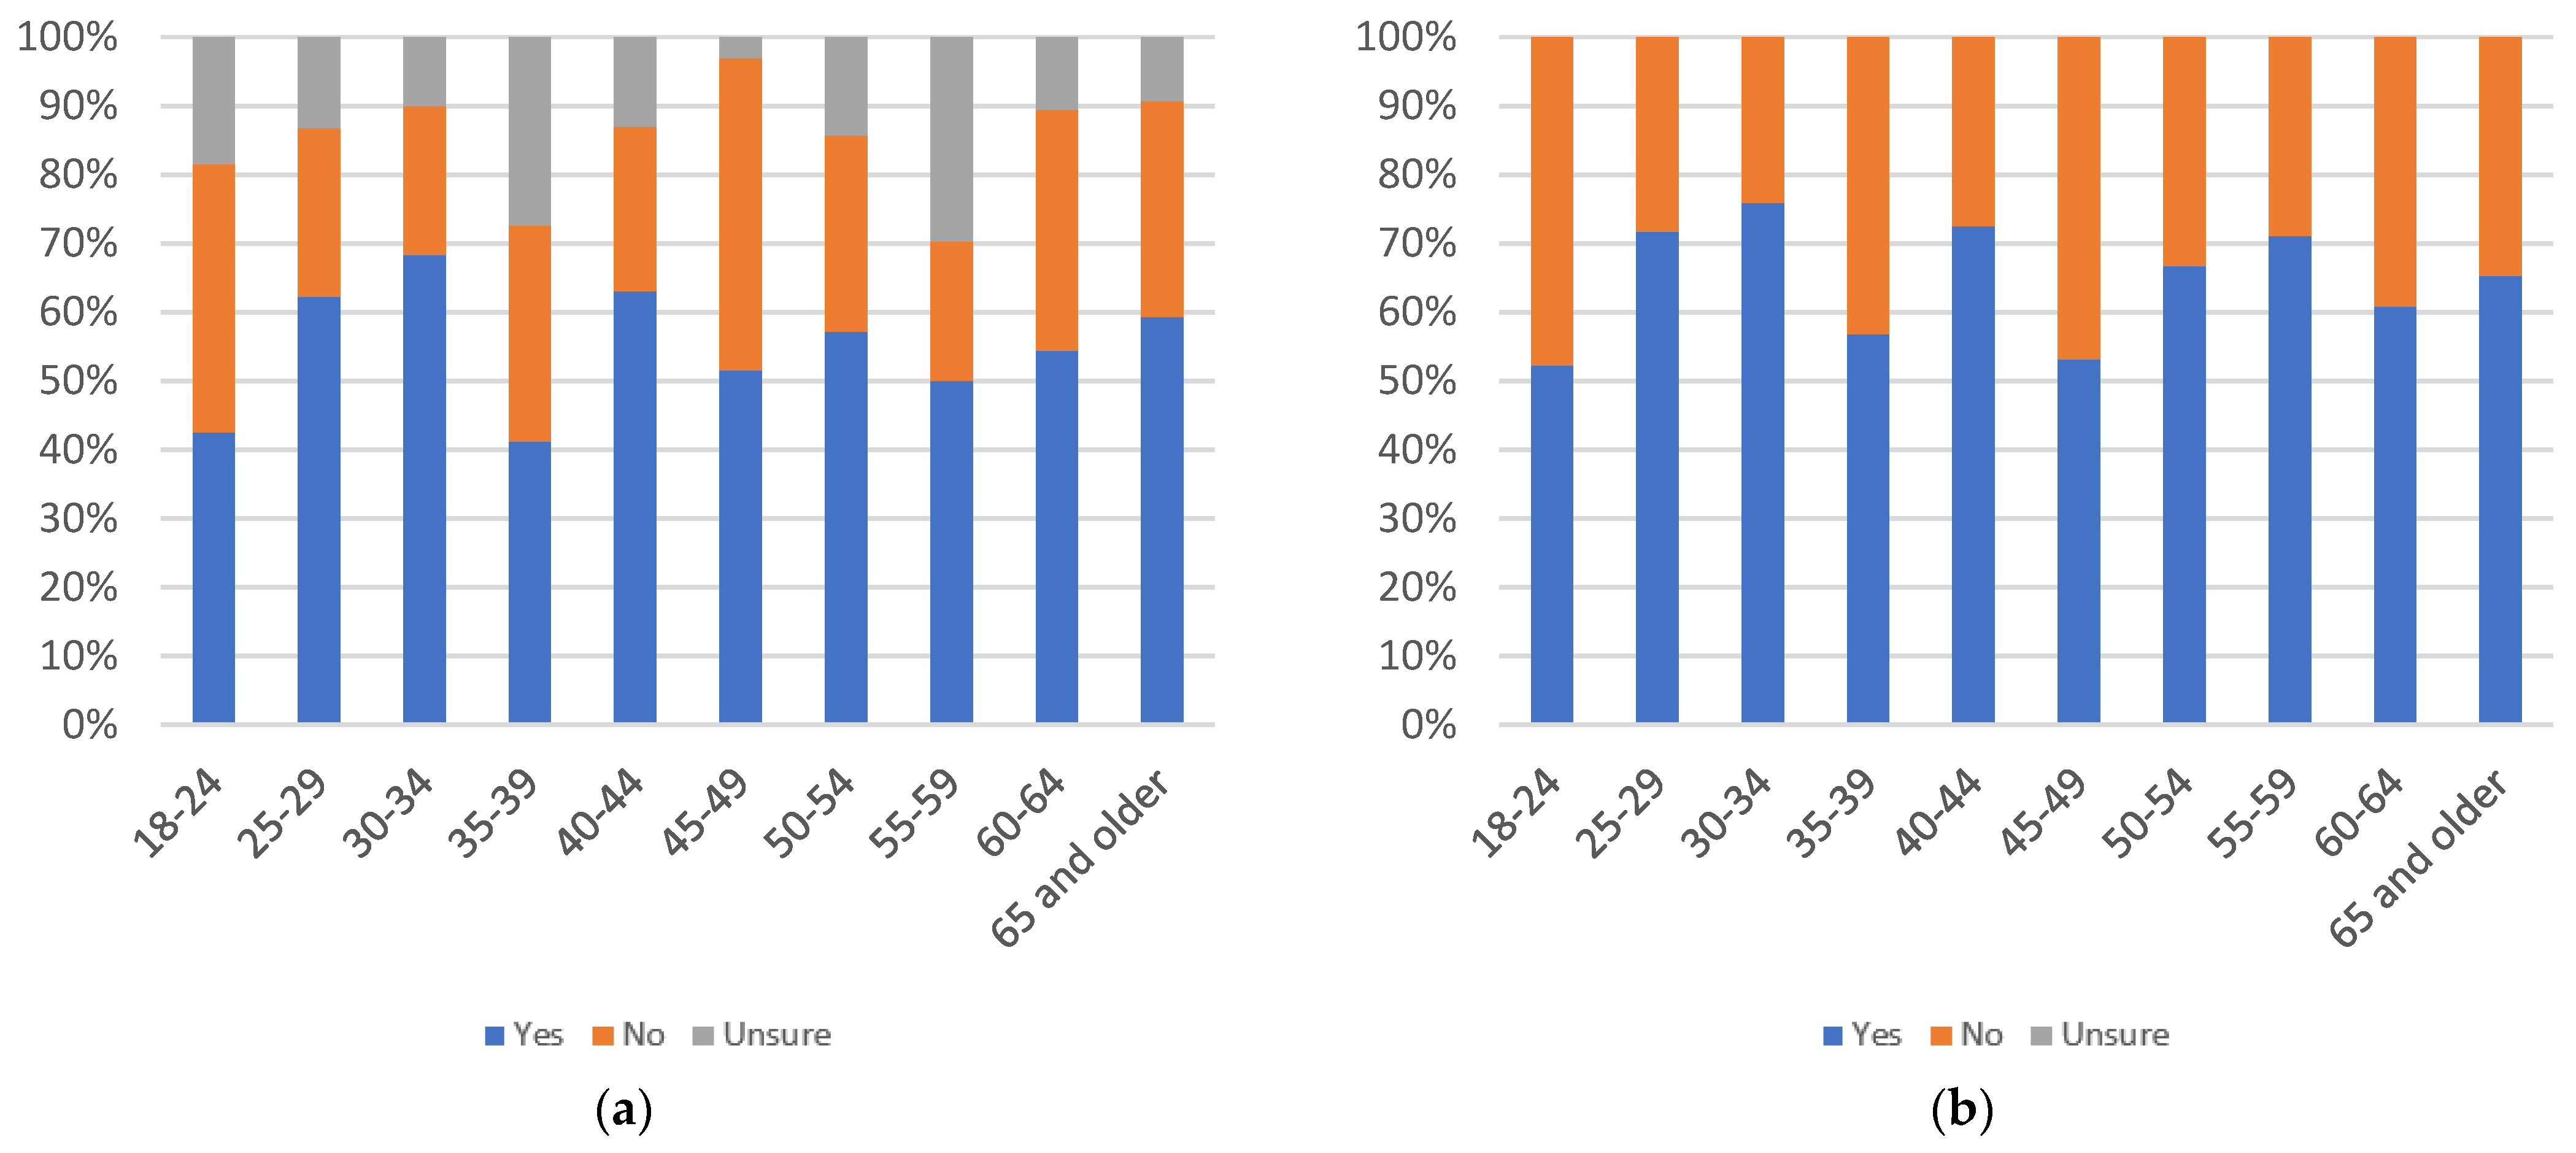
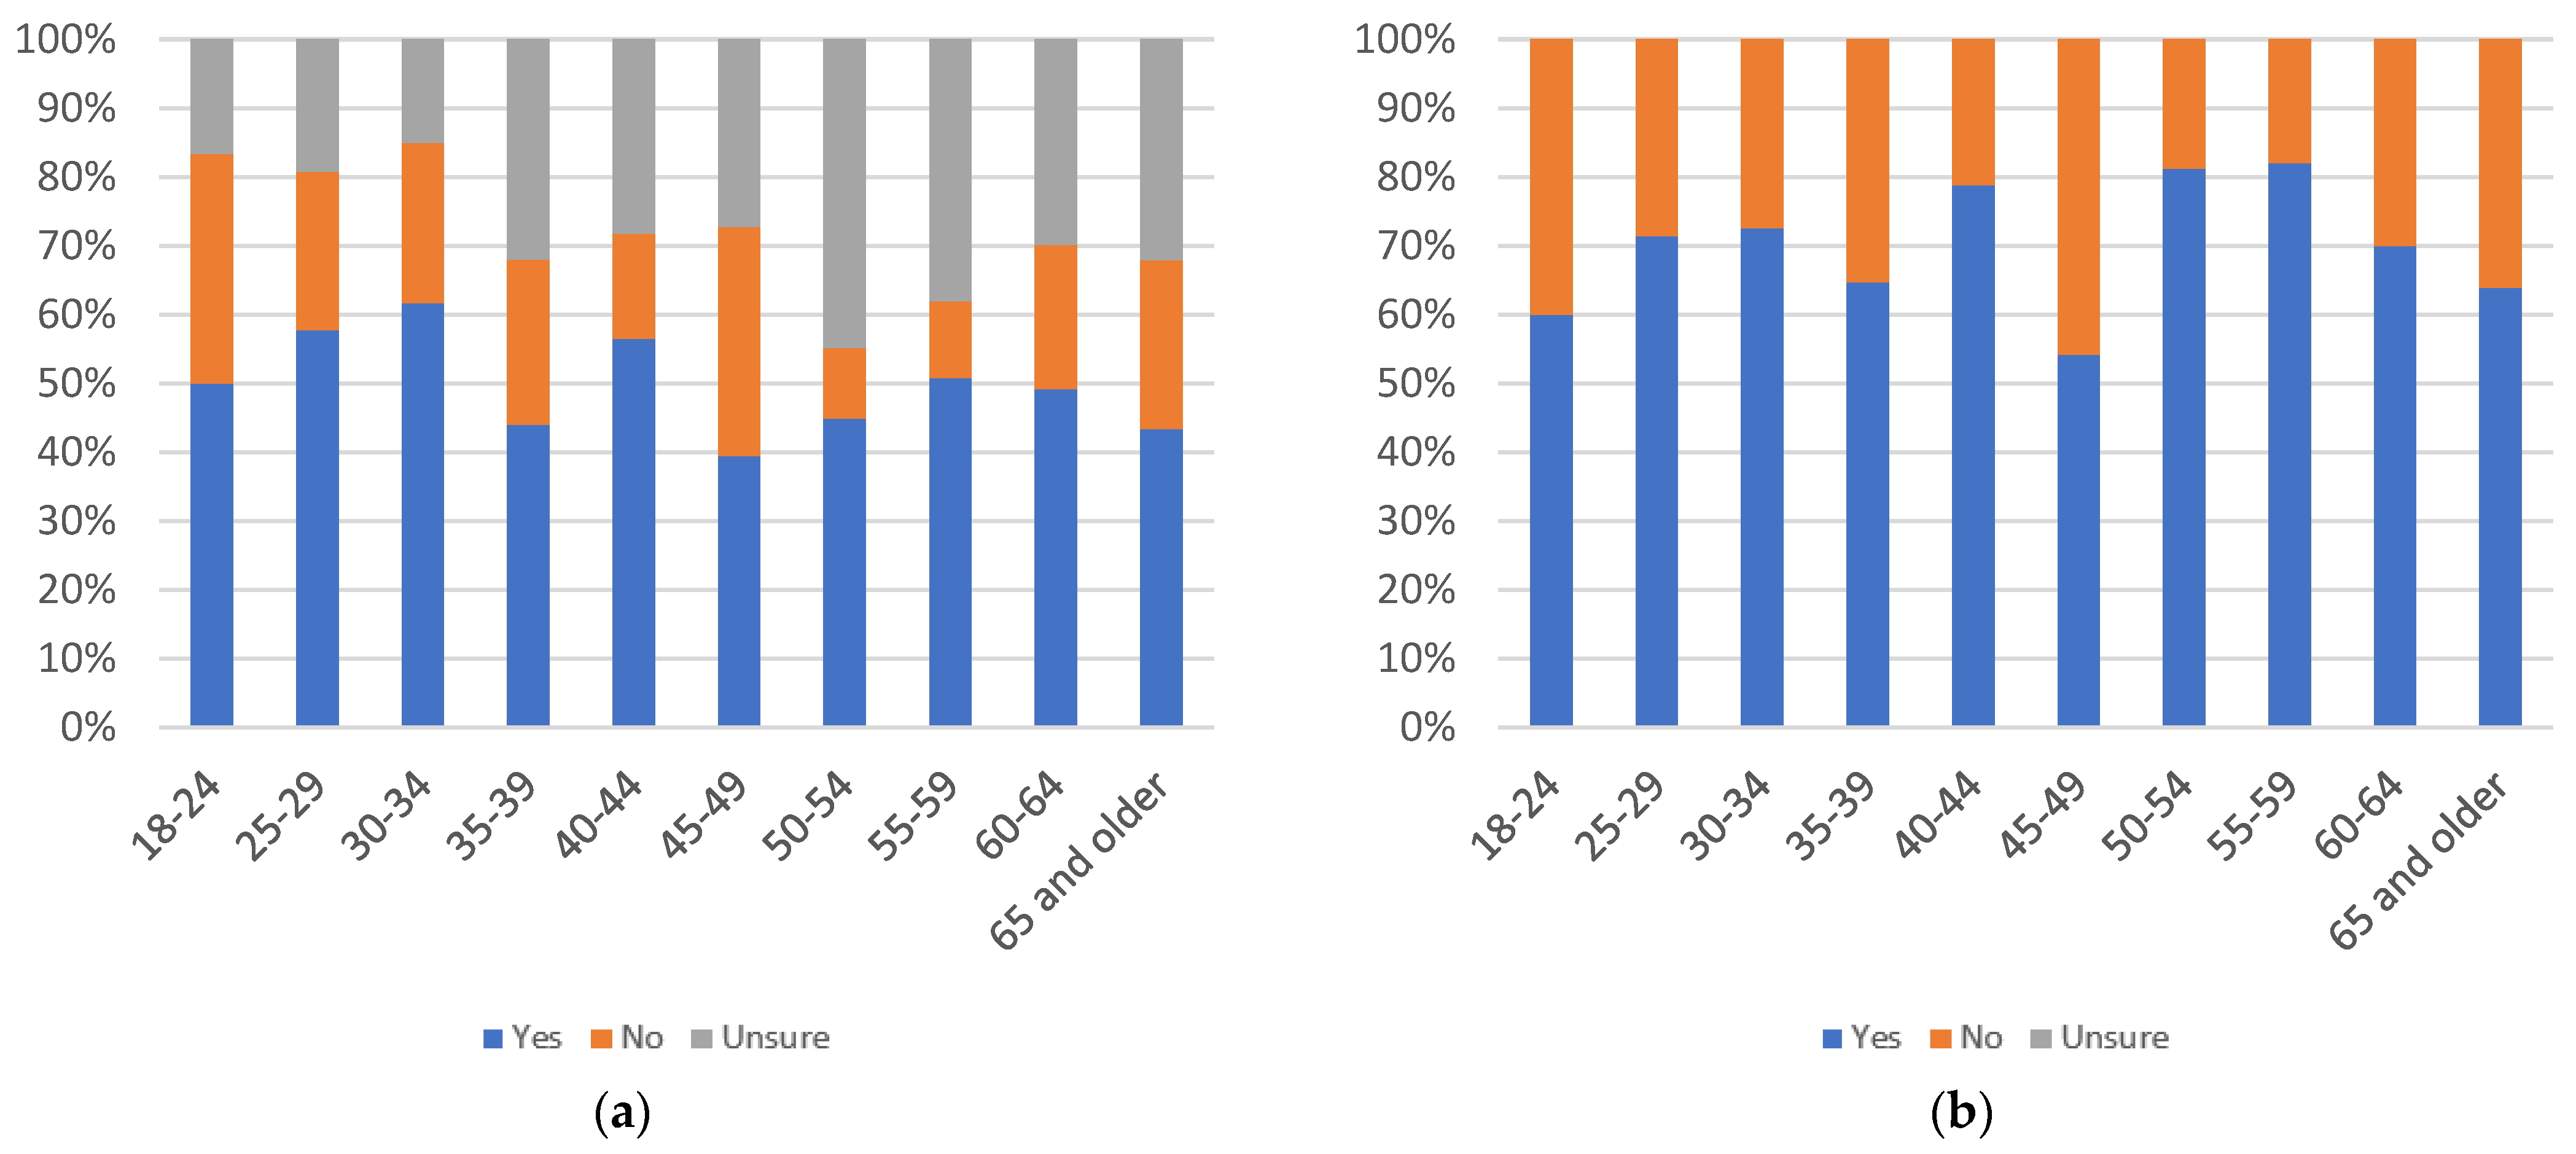
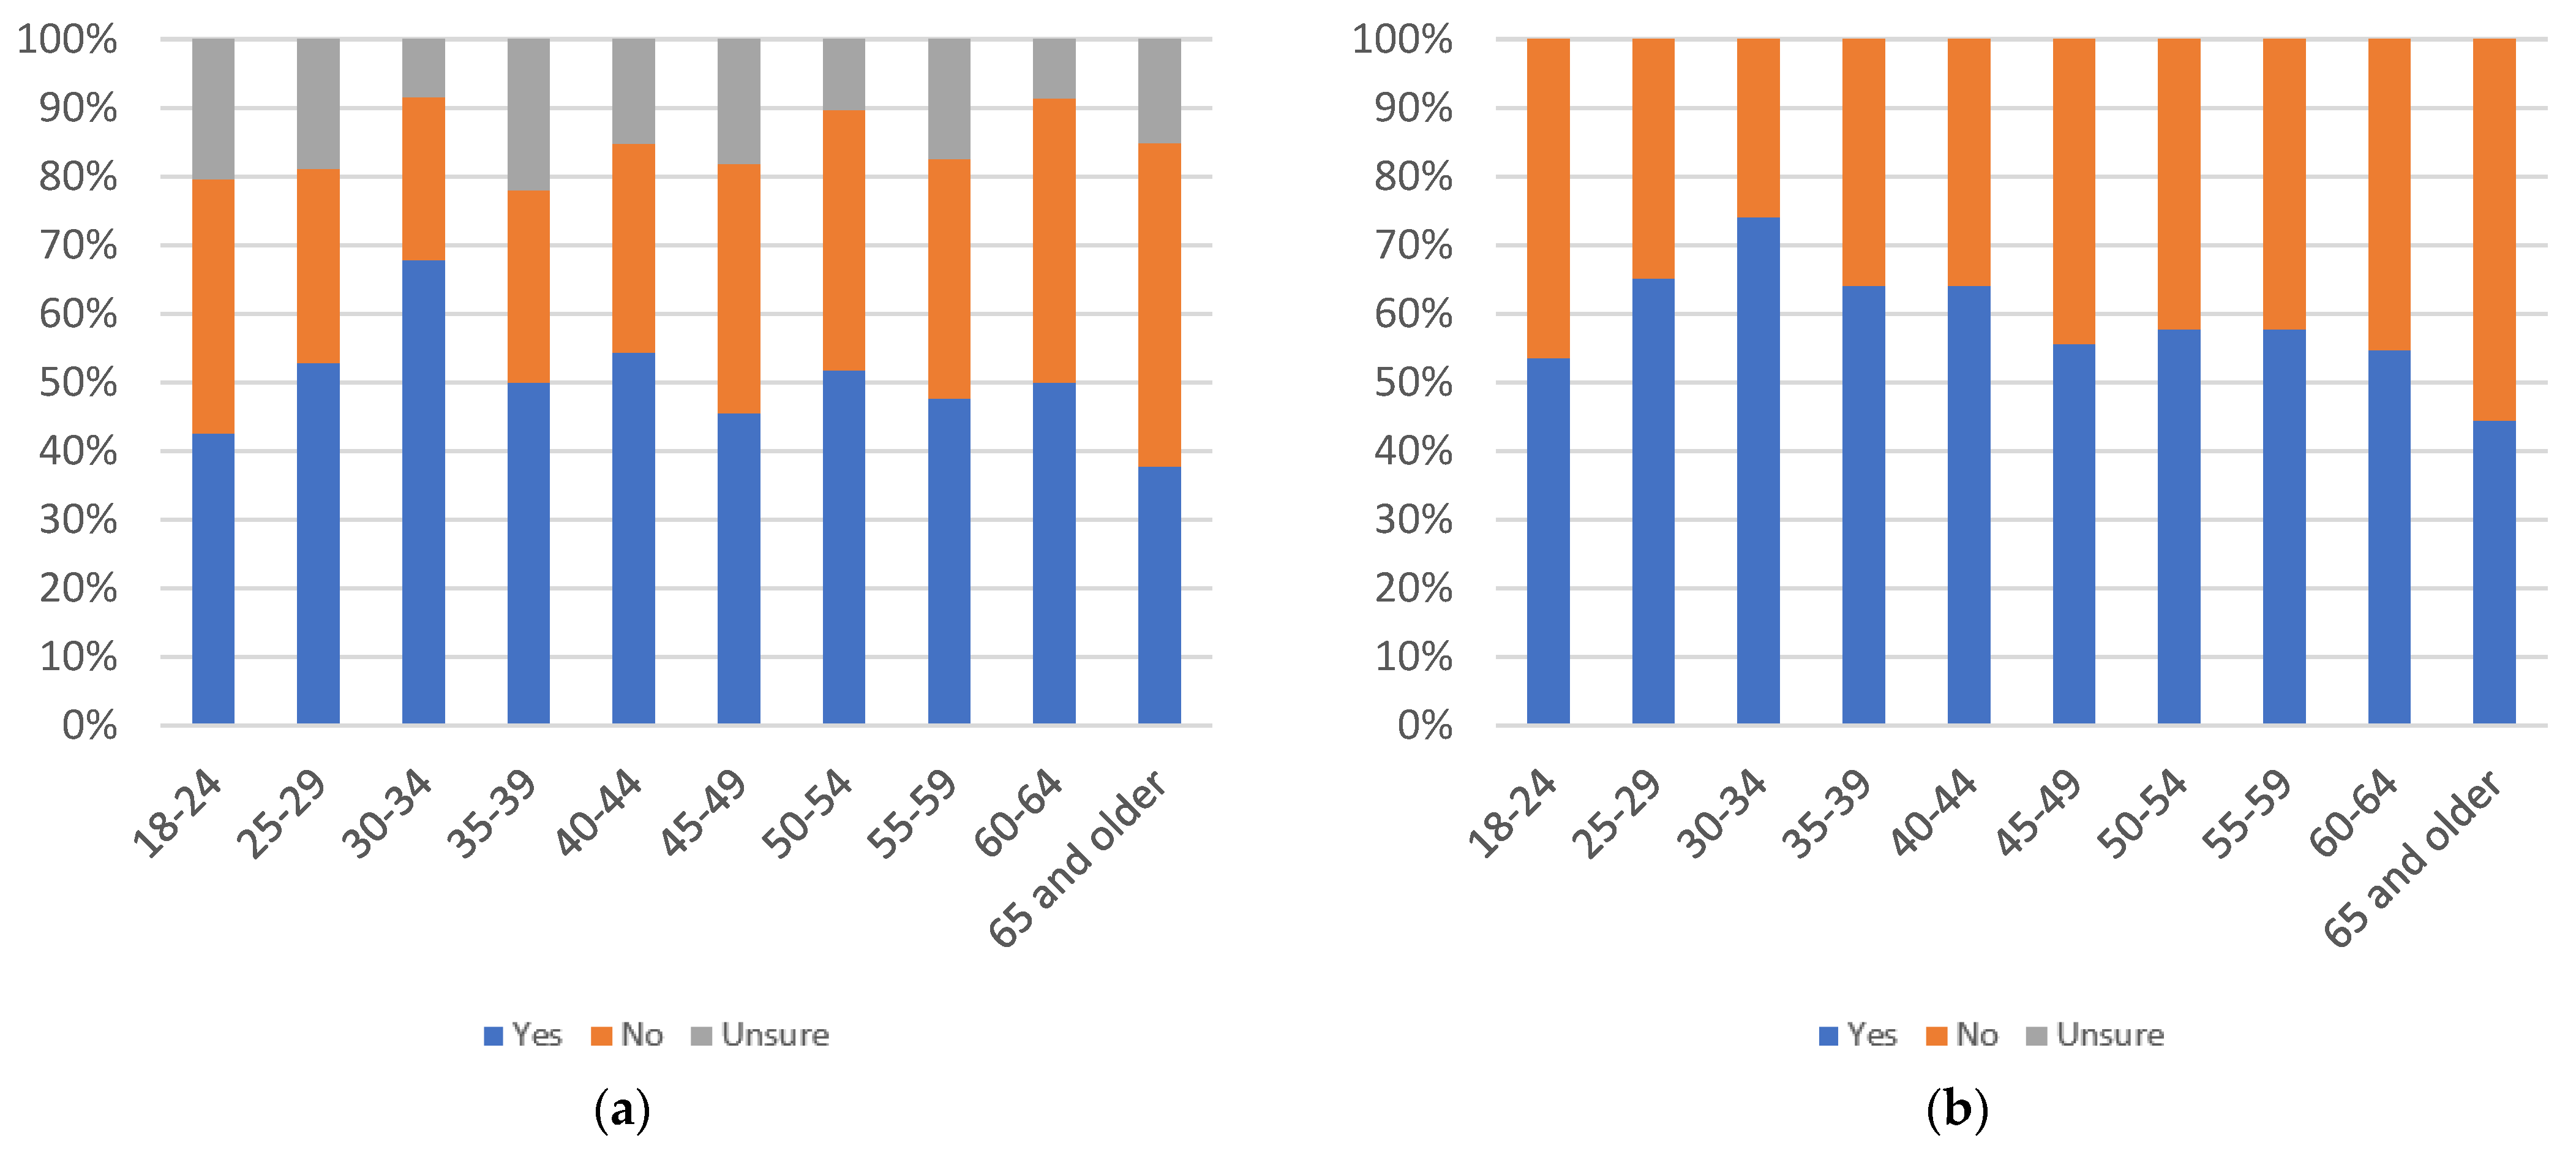
In terms of age, there is a decline in perceived helpfulness as age increases. There are slight spikes in yes responses at the 40–44, 55–59, and 65 and older age groups. The number of uncertain responses shows no discernible pattern. Age groups other than 35–39, 45–49, and 60–64 show at least 50% answering yes even when uncertainty is factored in. When uncertainty is not considered, only the 60–64 age group maintains less than 50% yes responses.
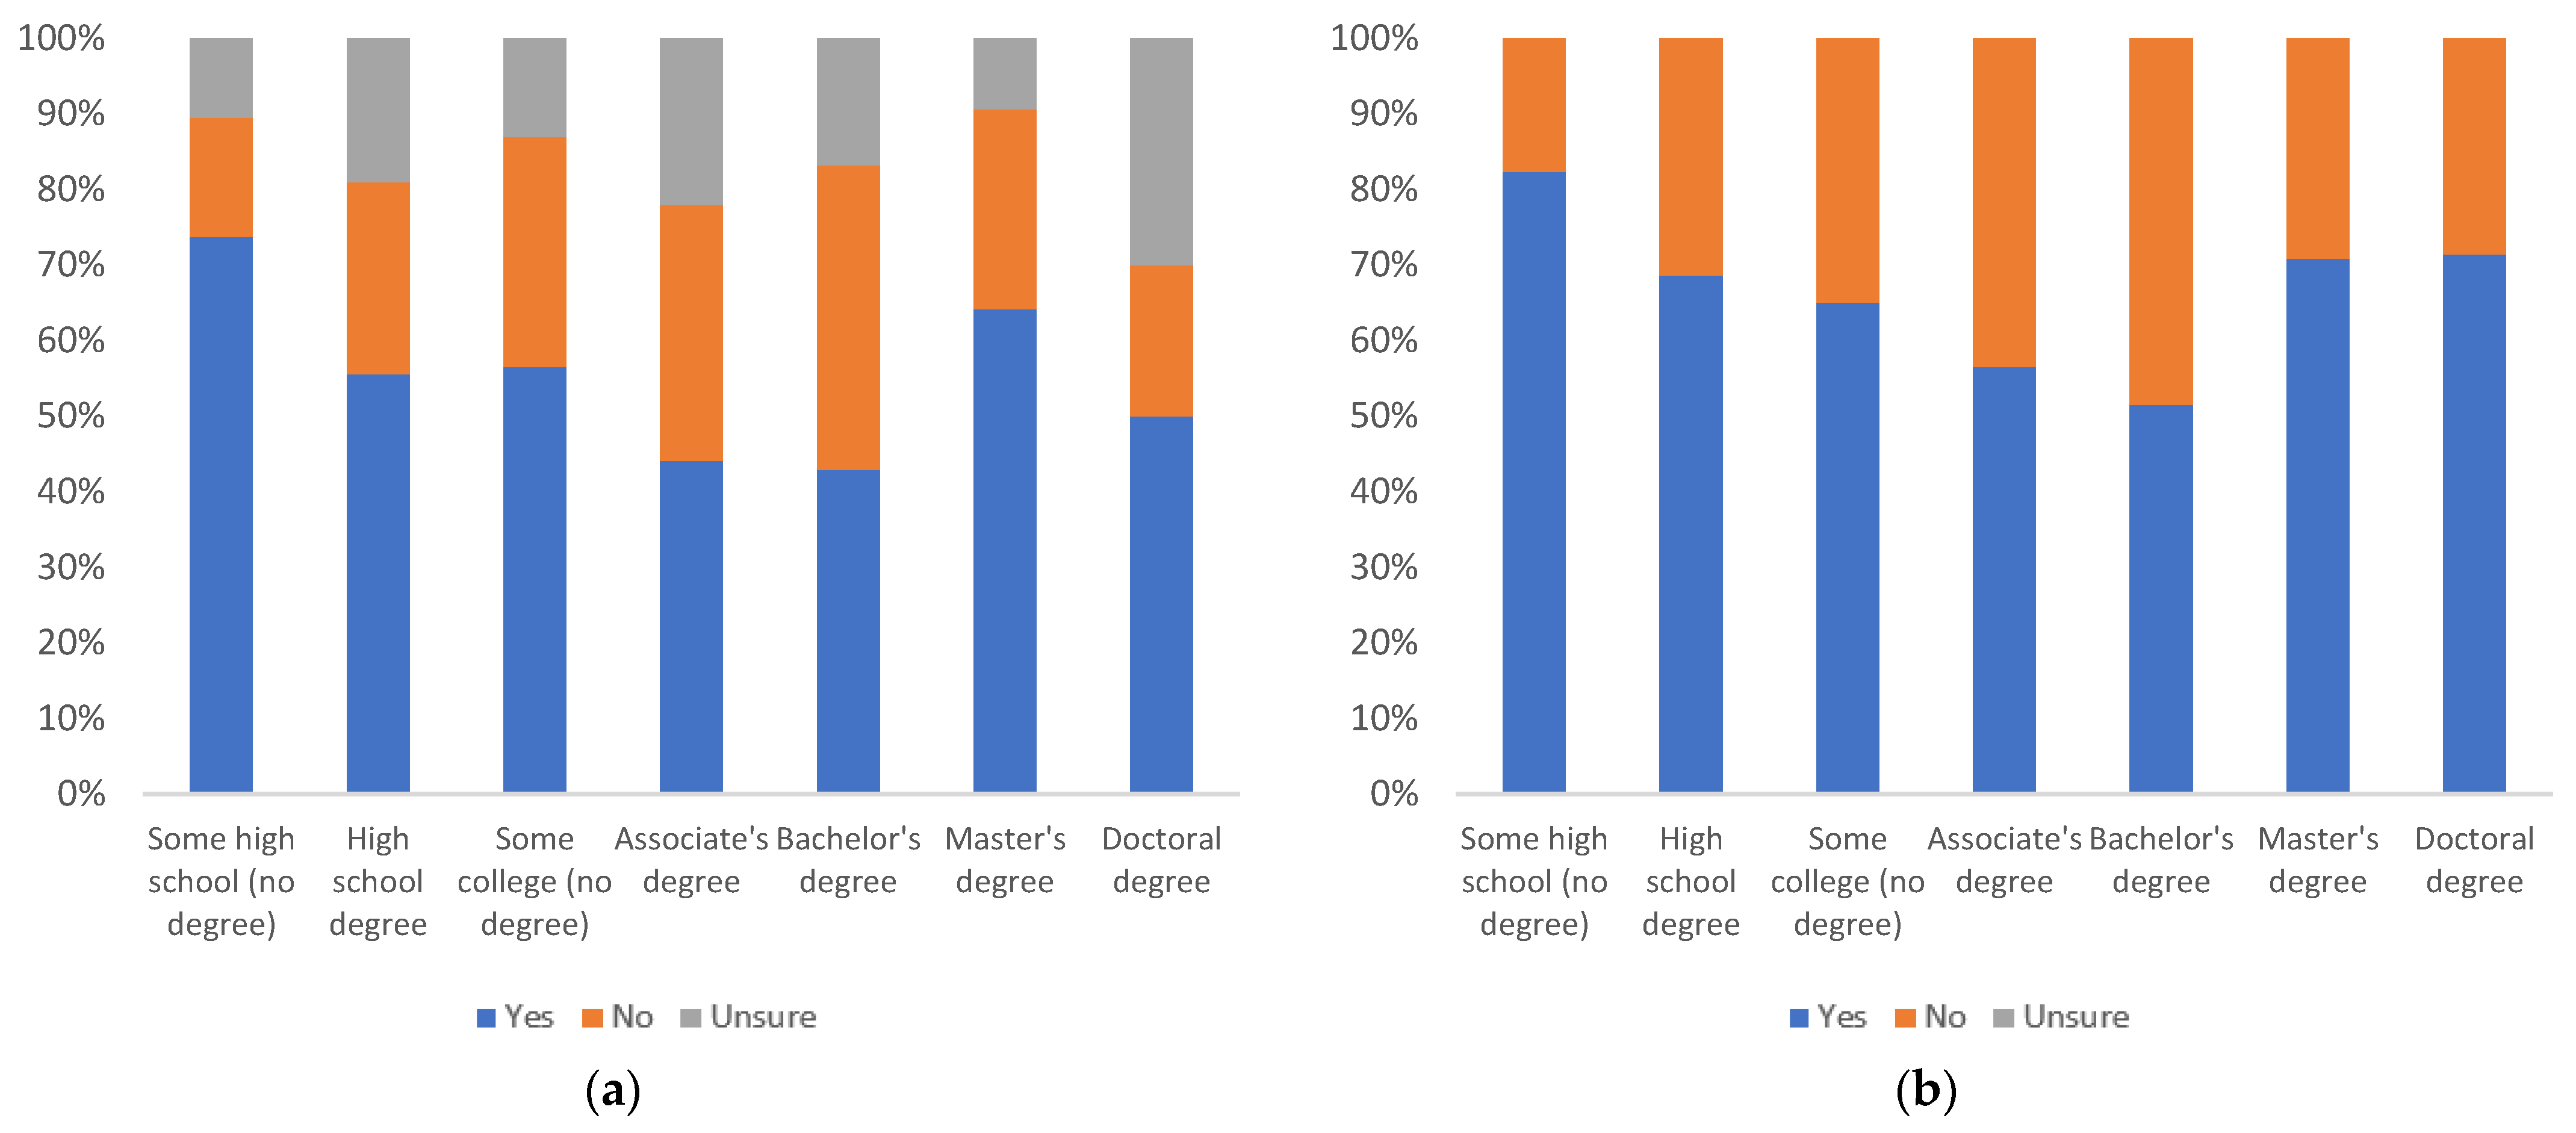
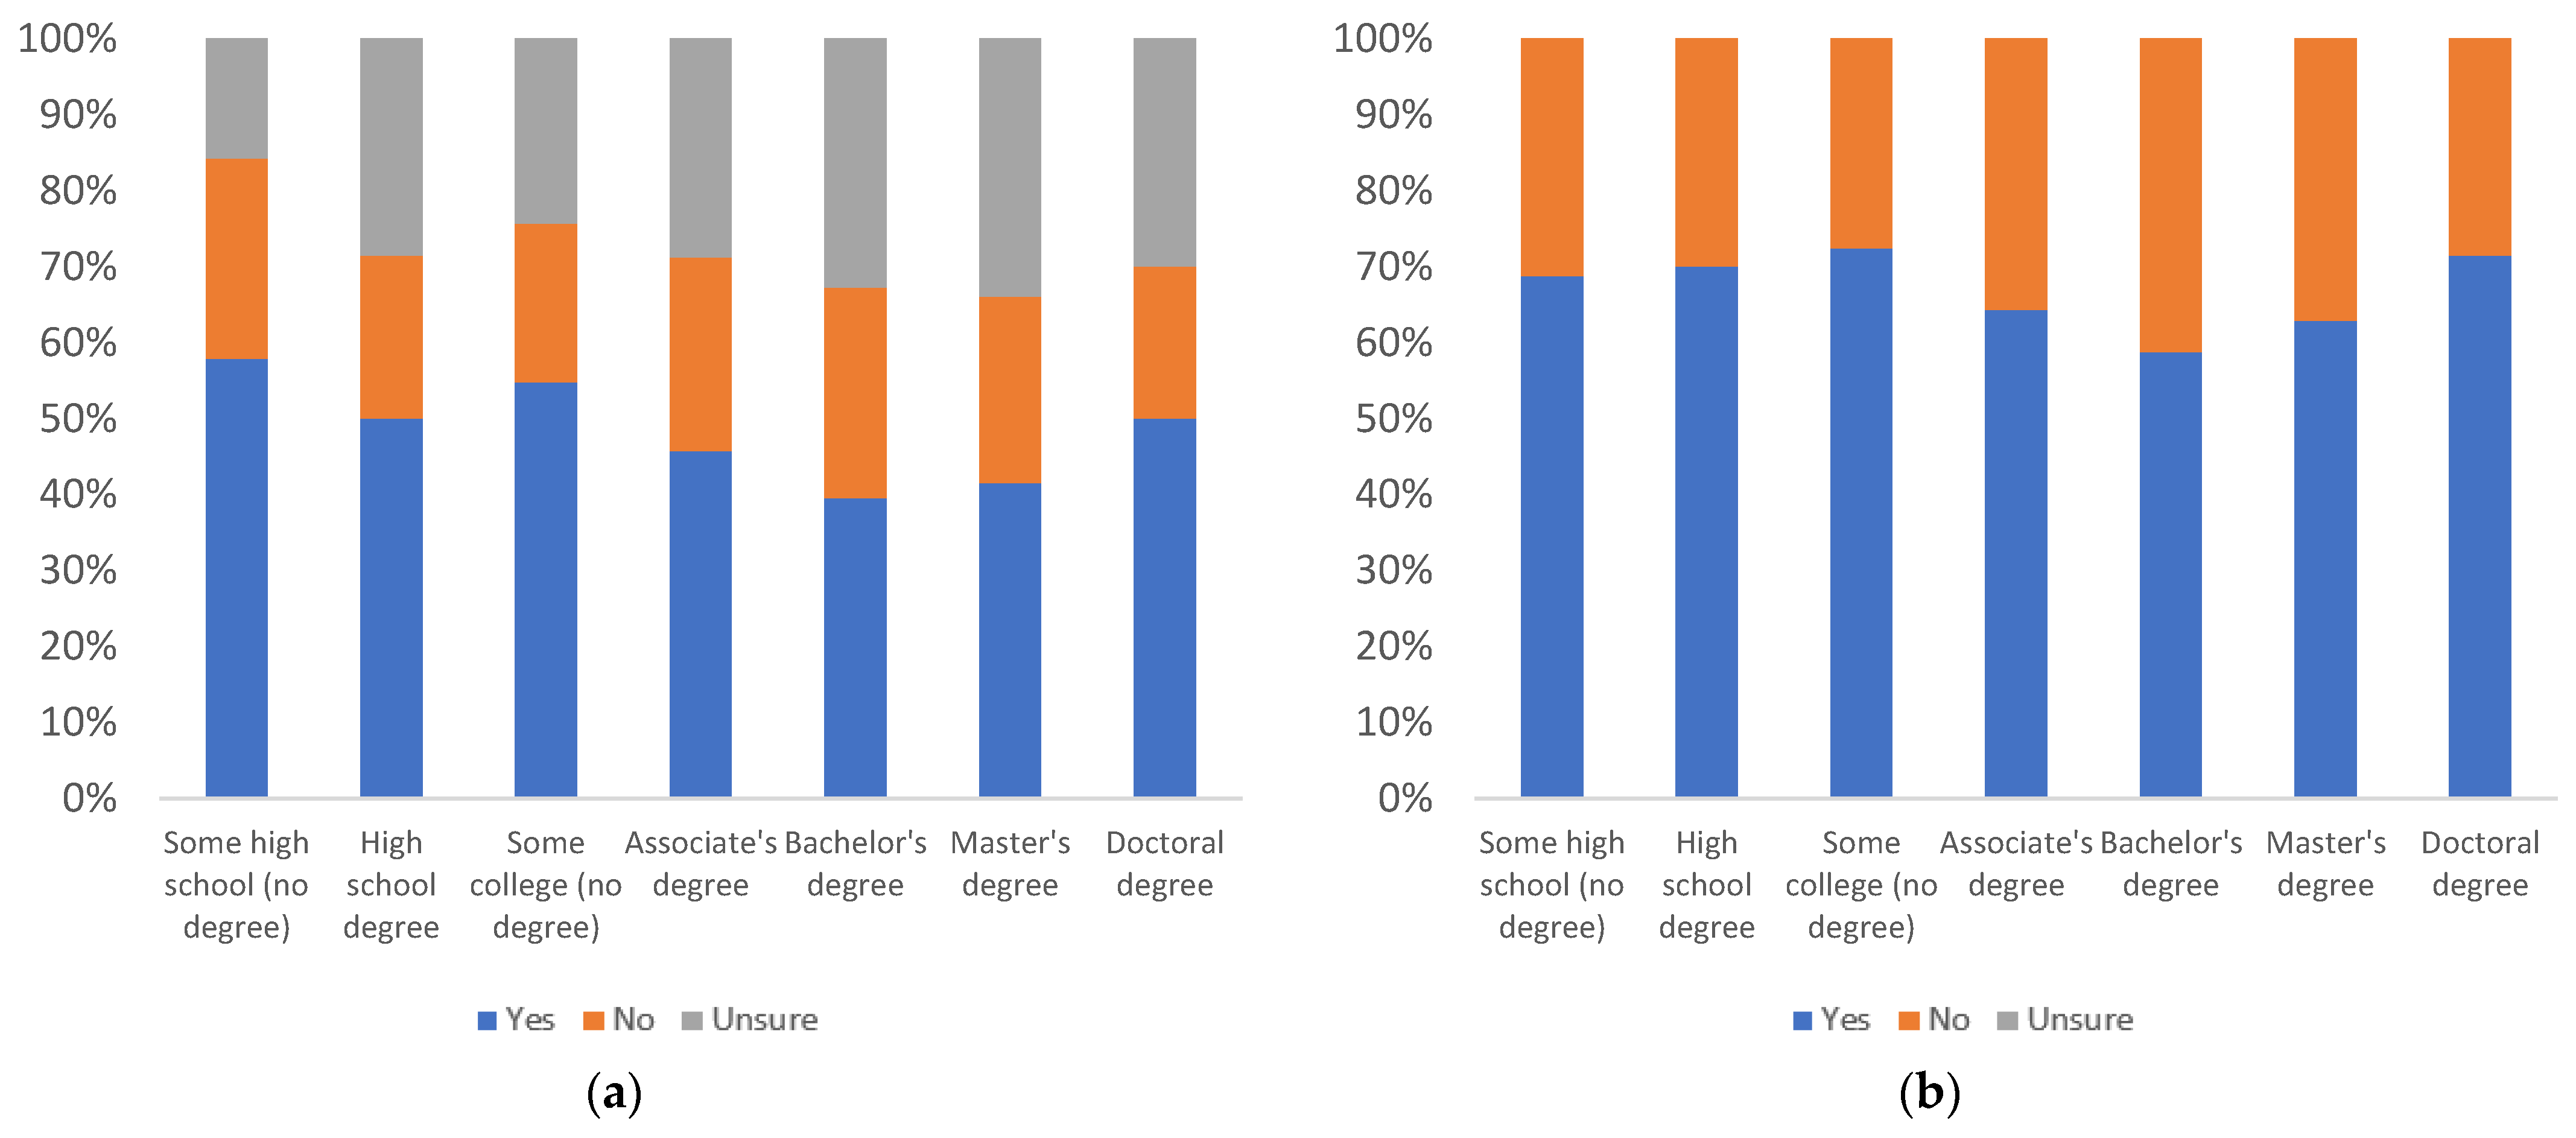
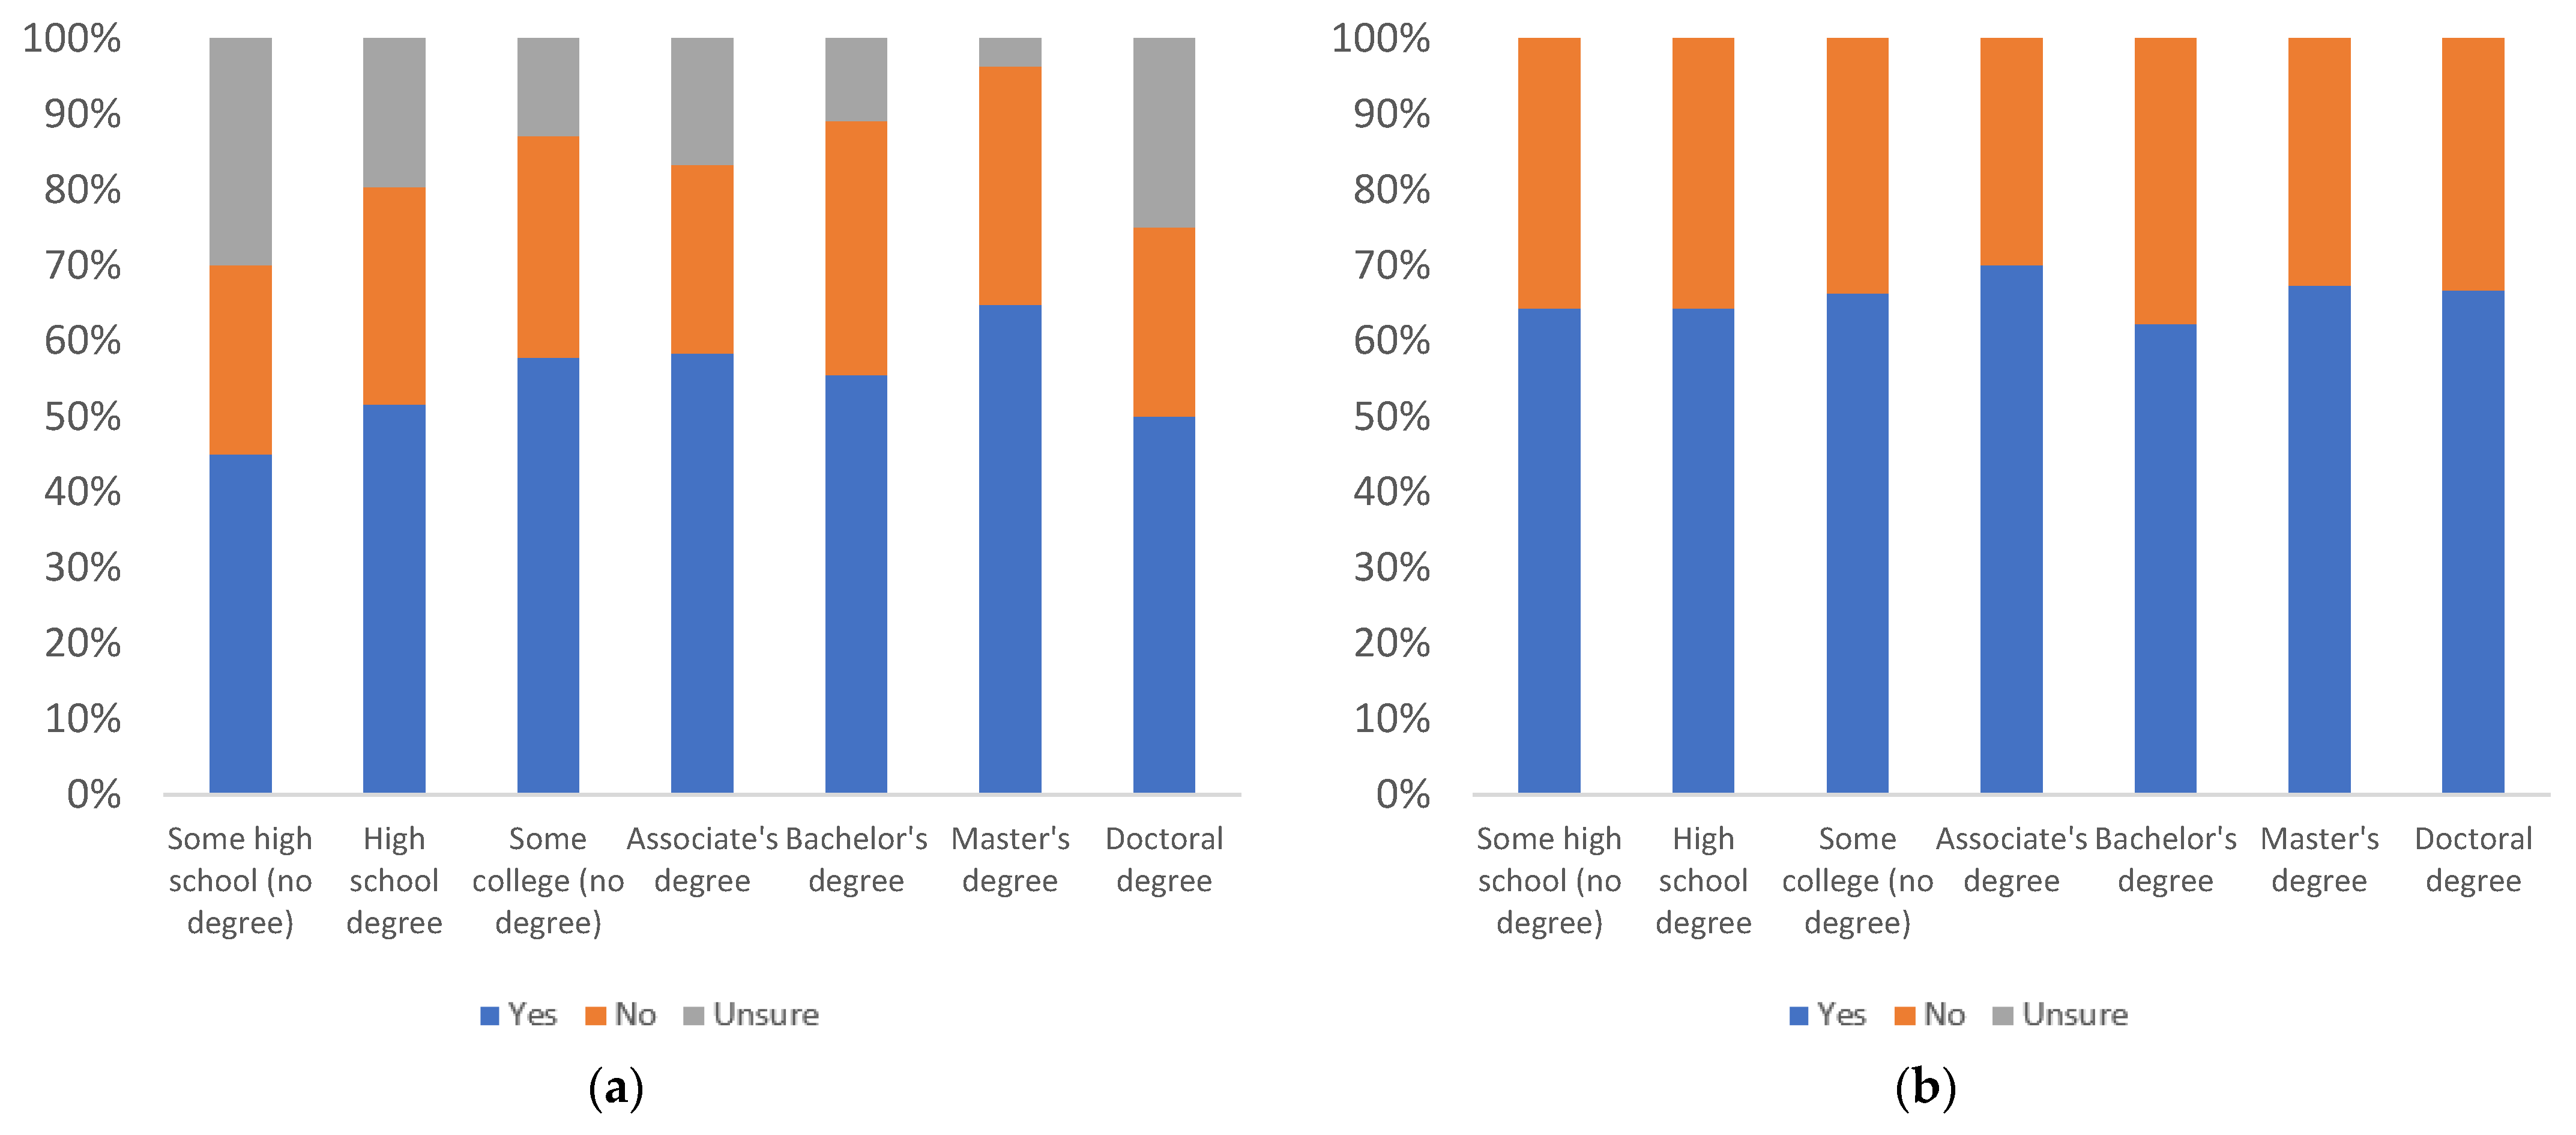
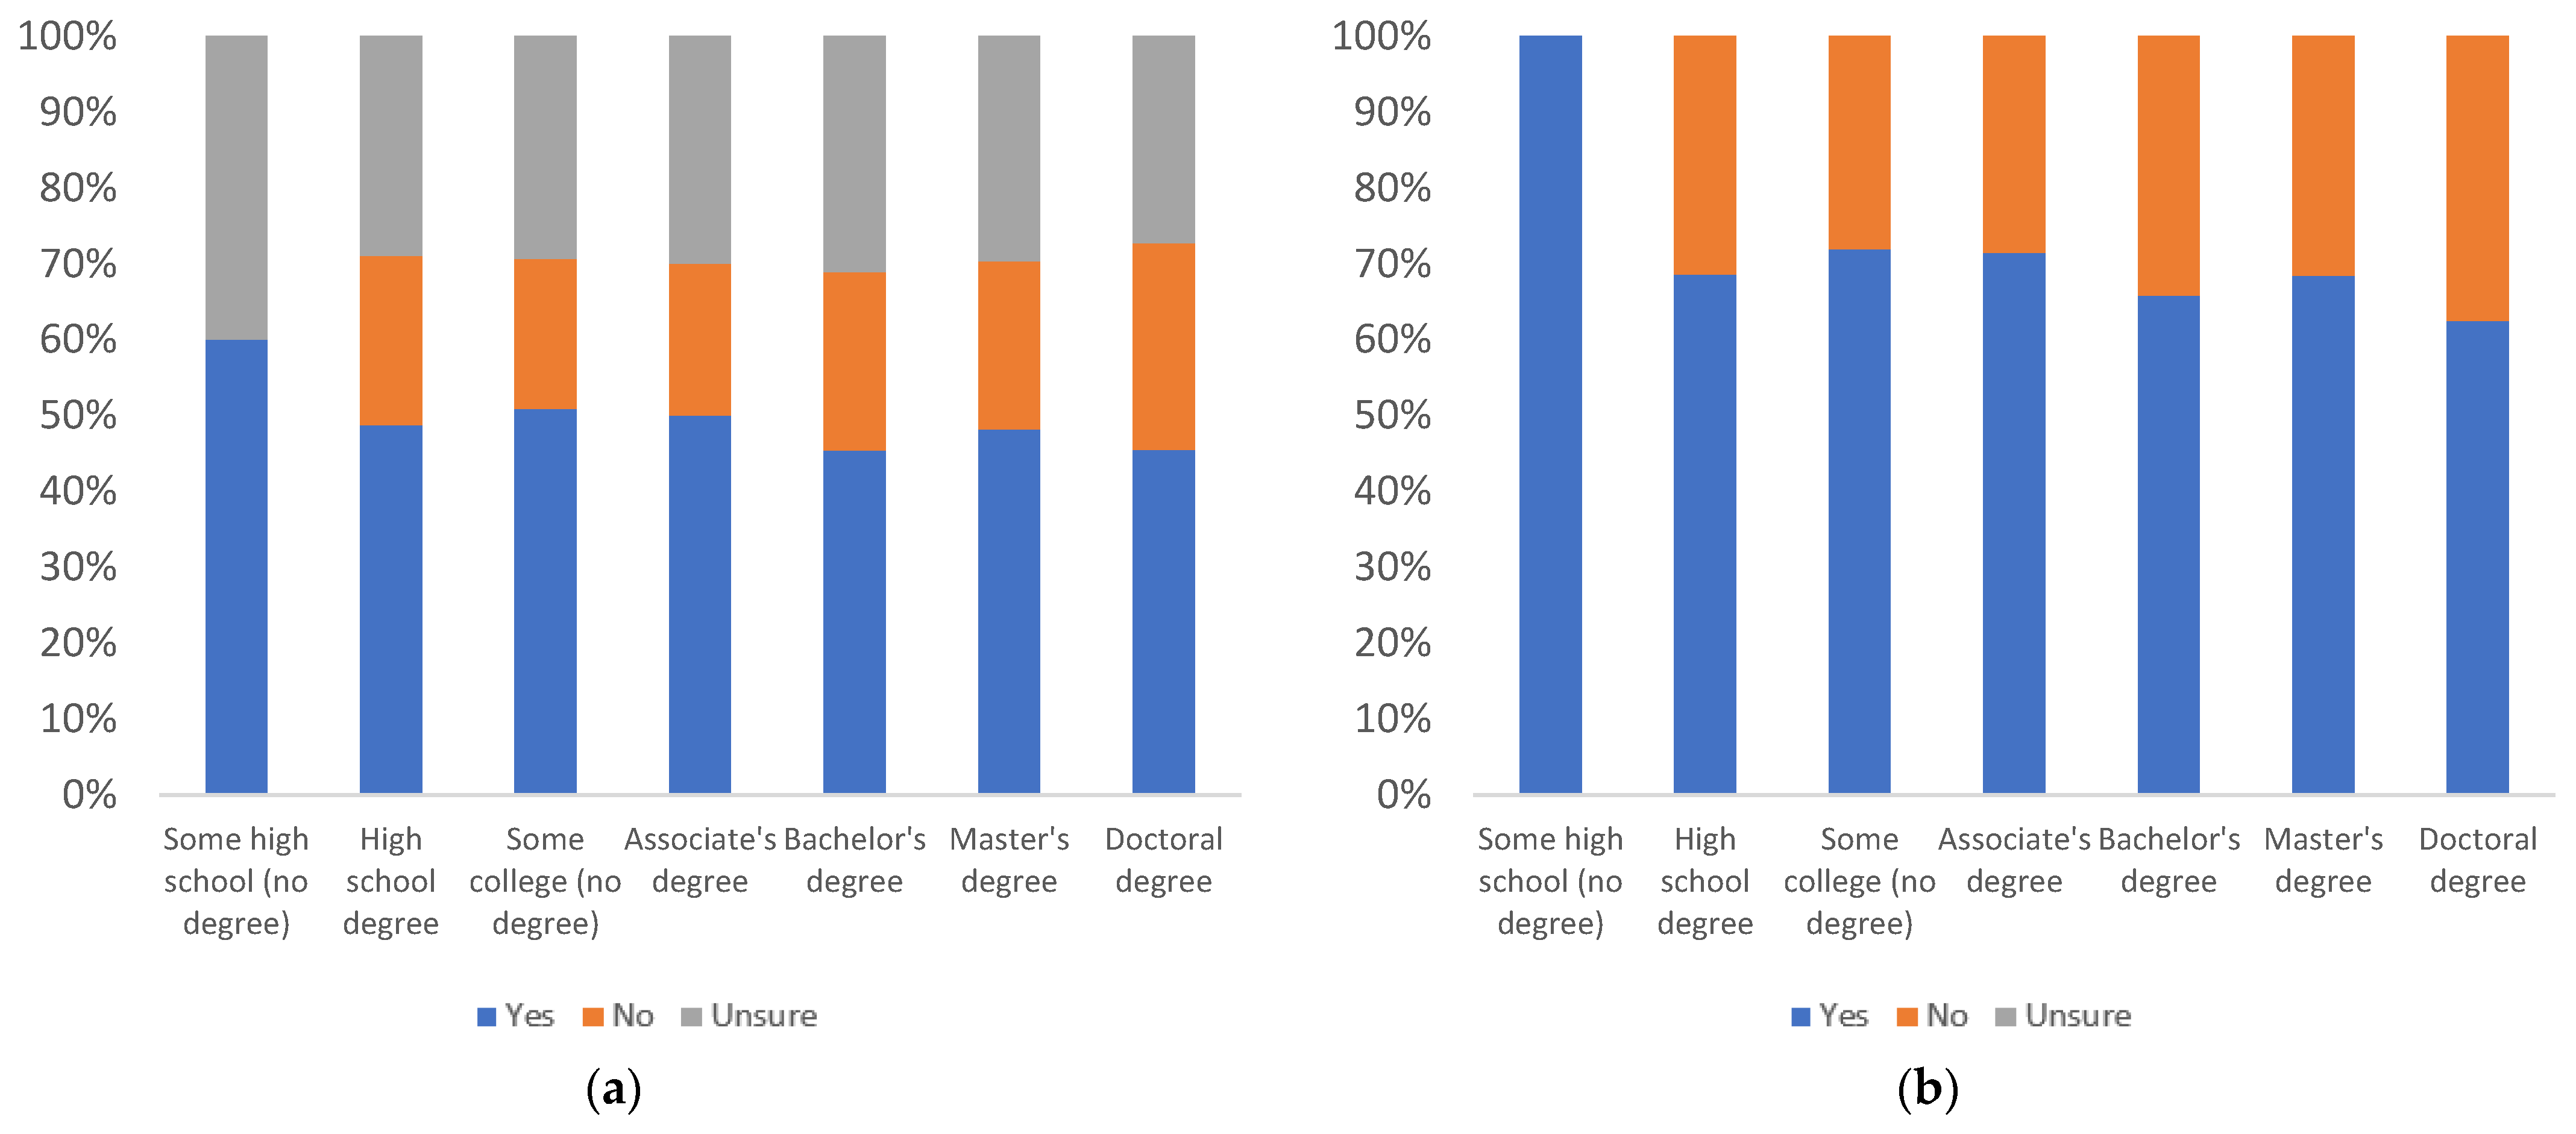
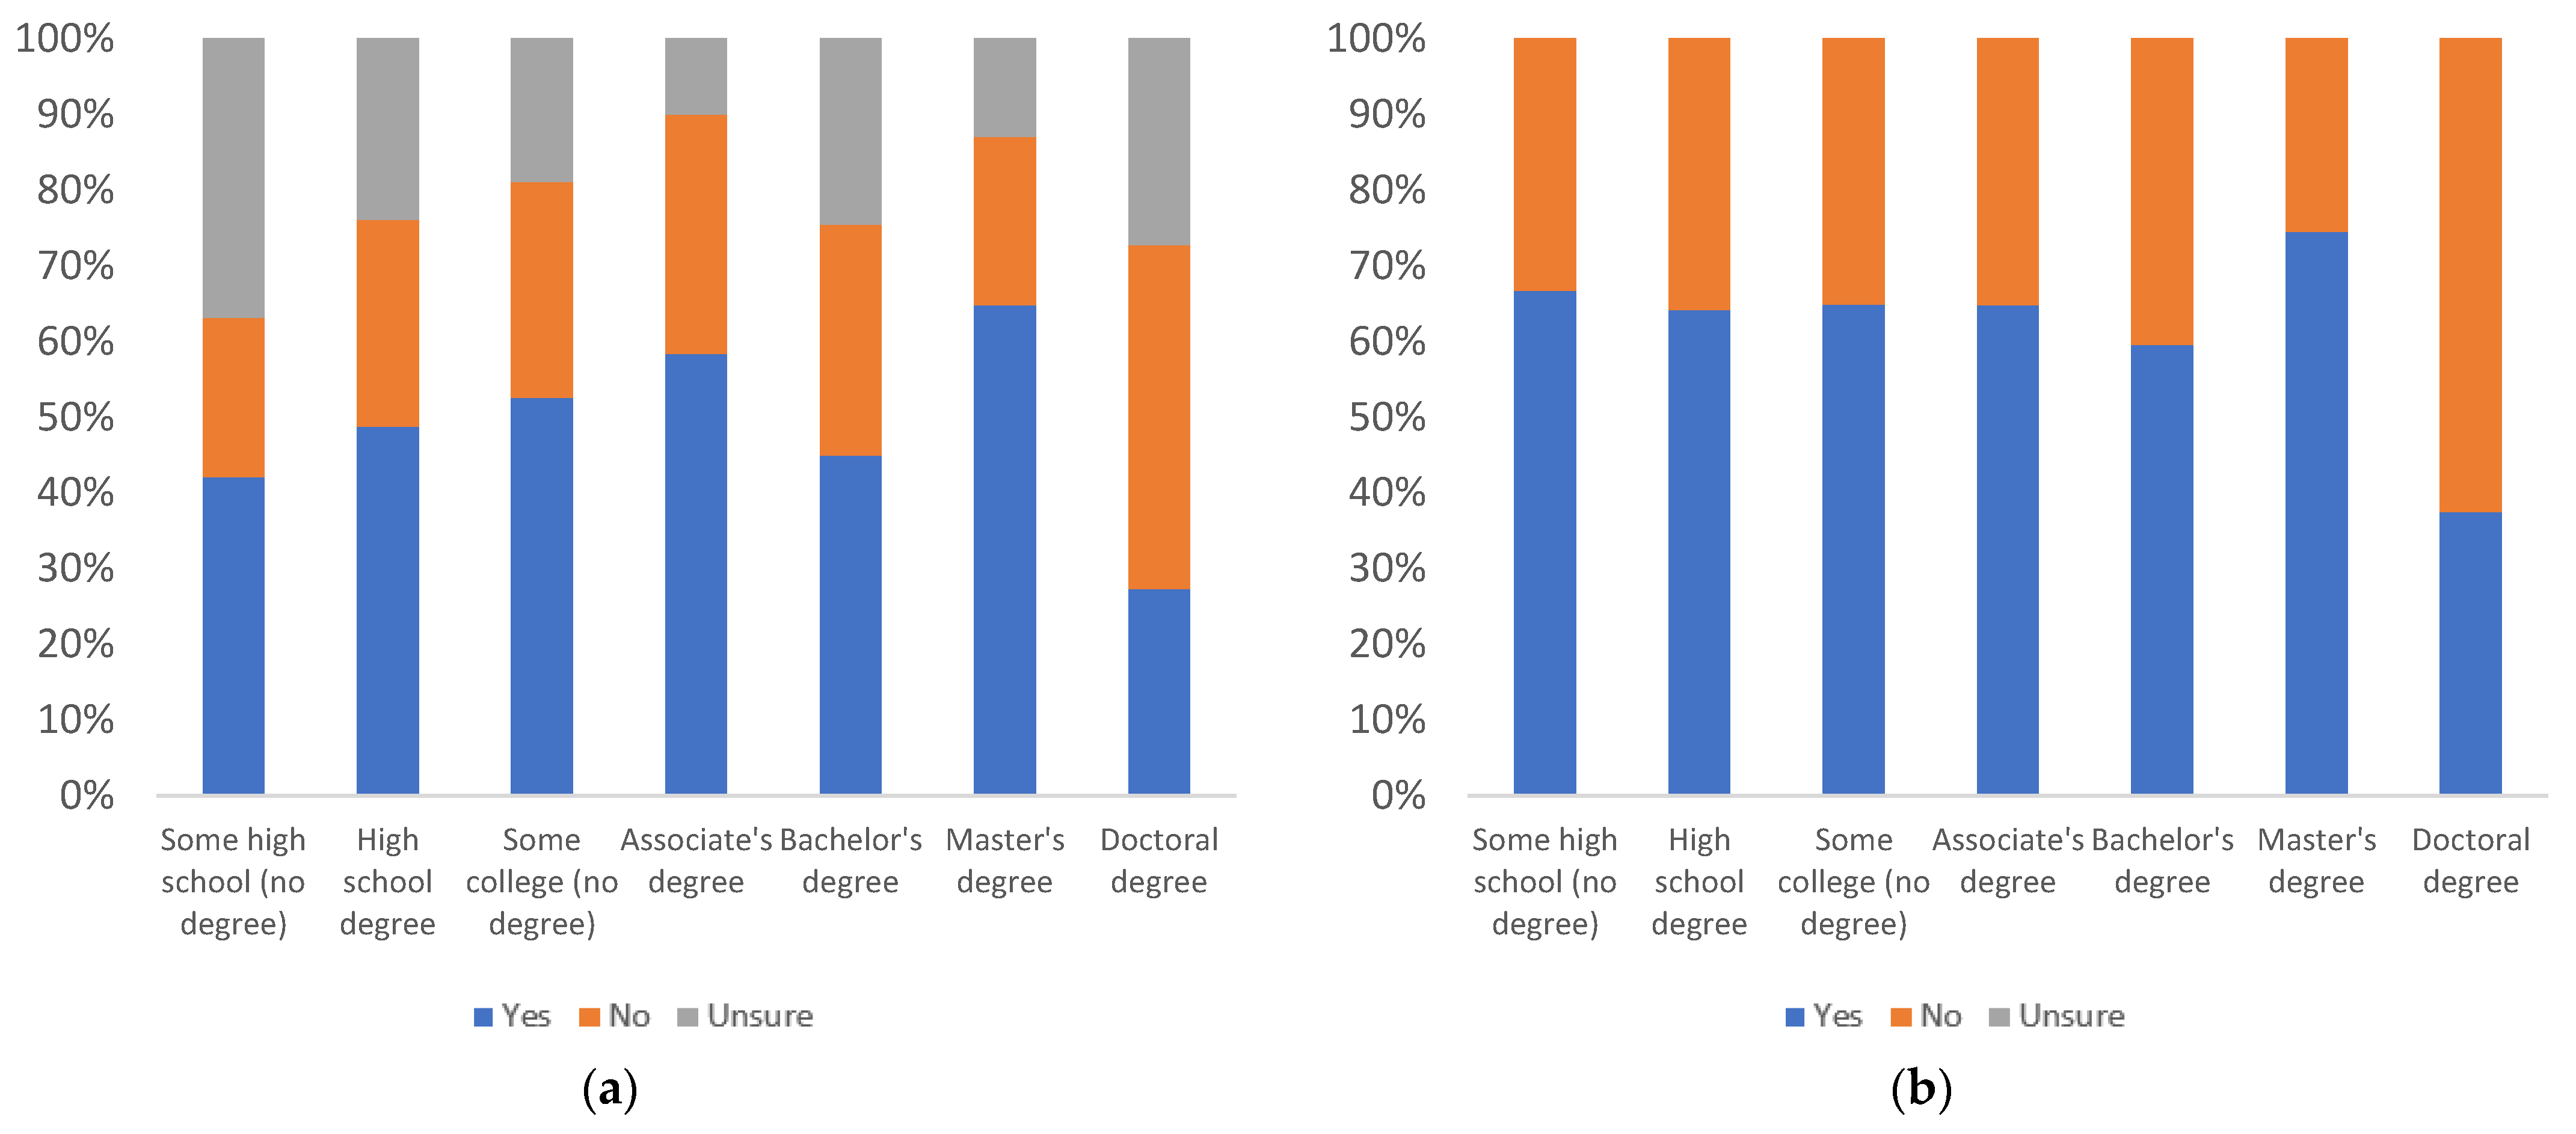
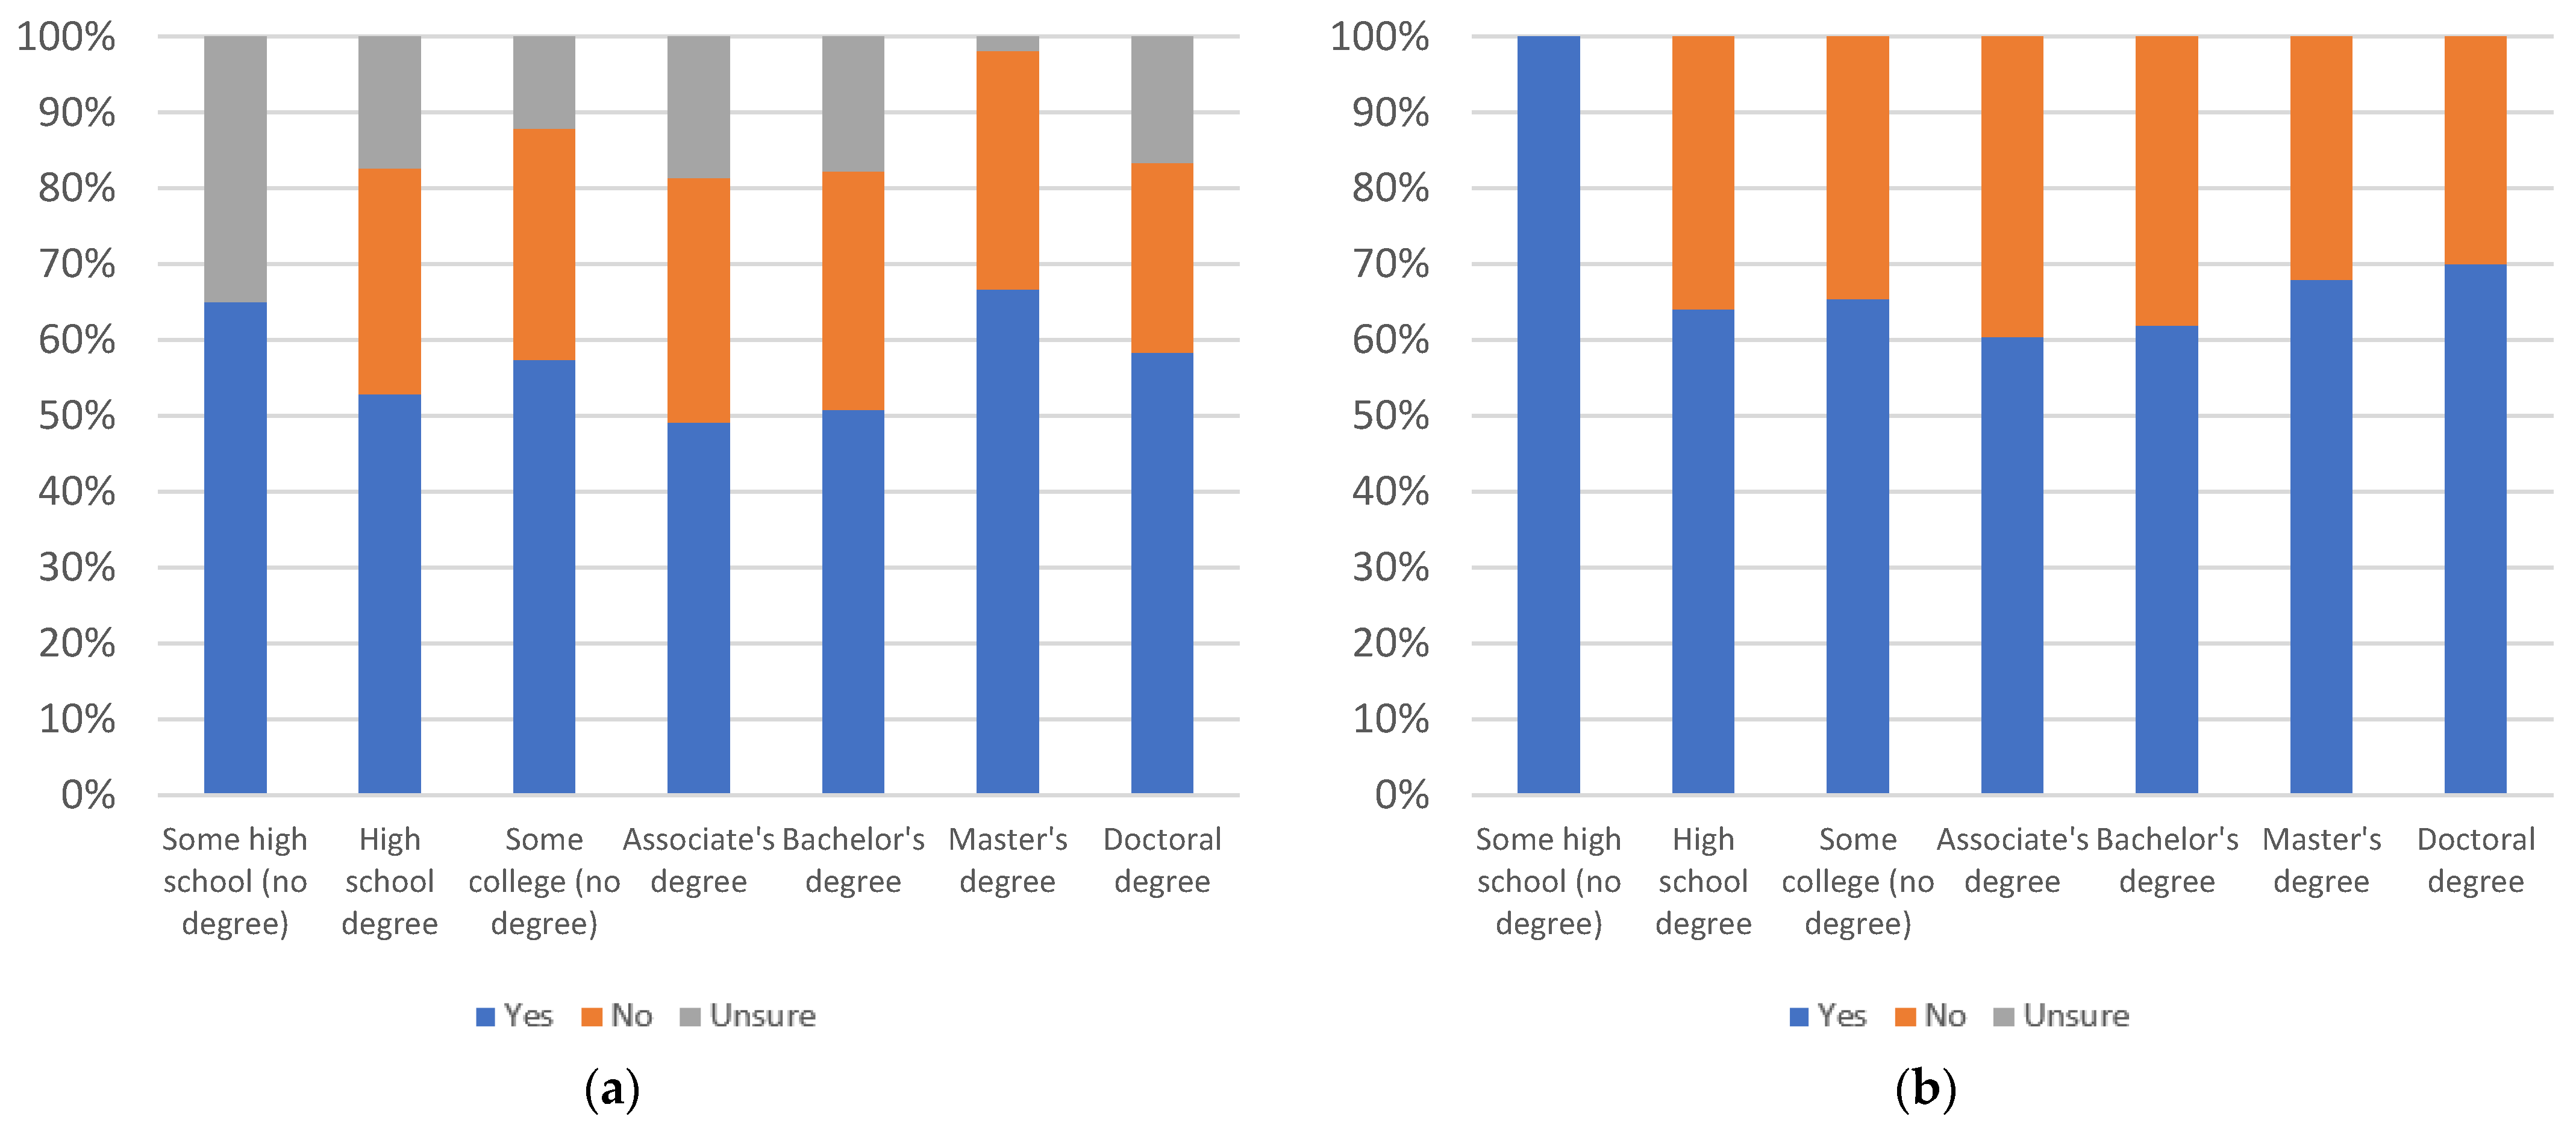
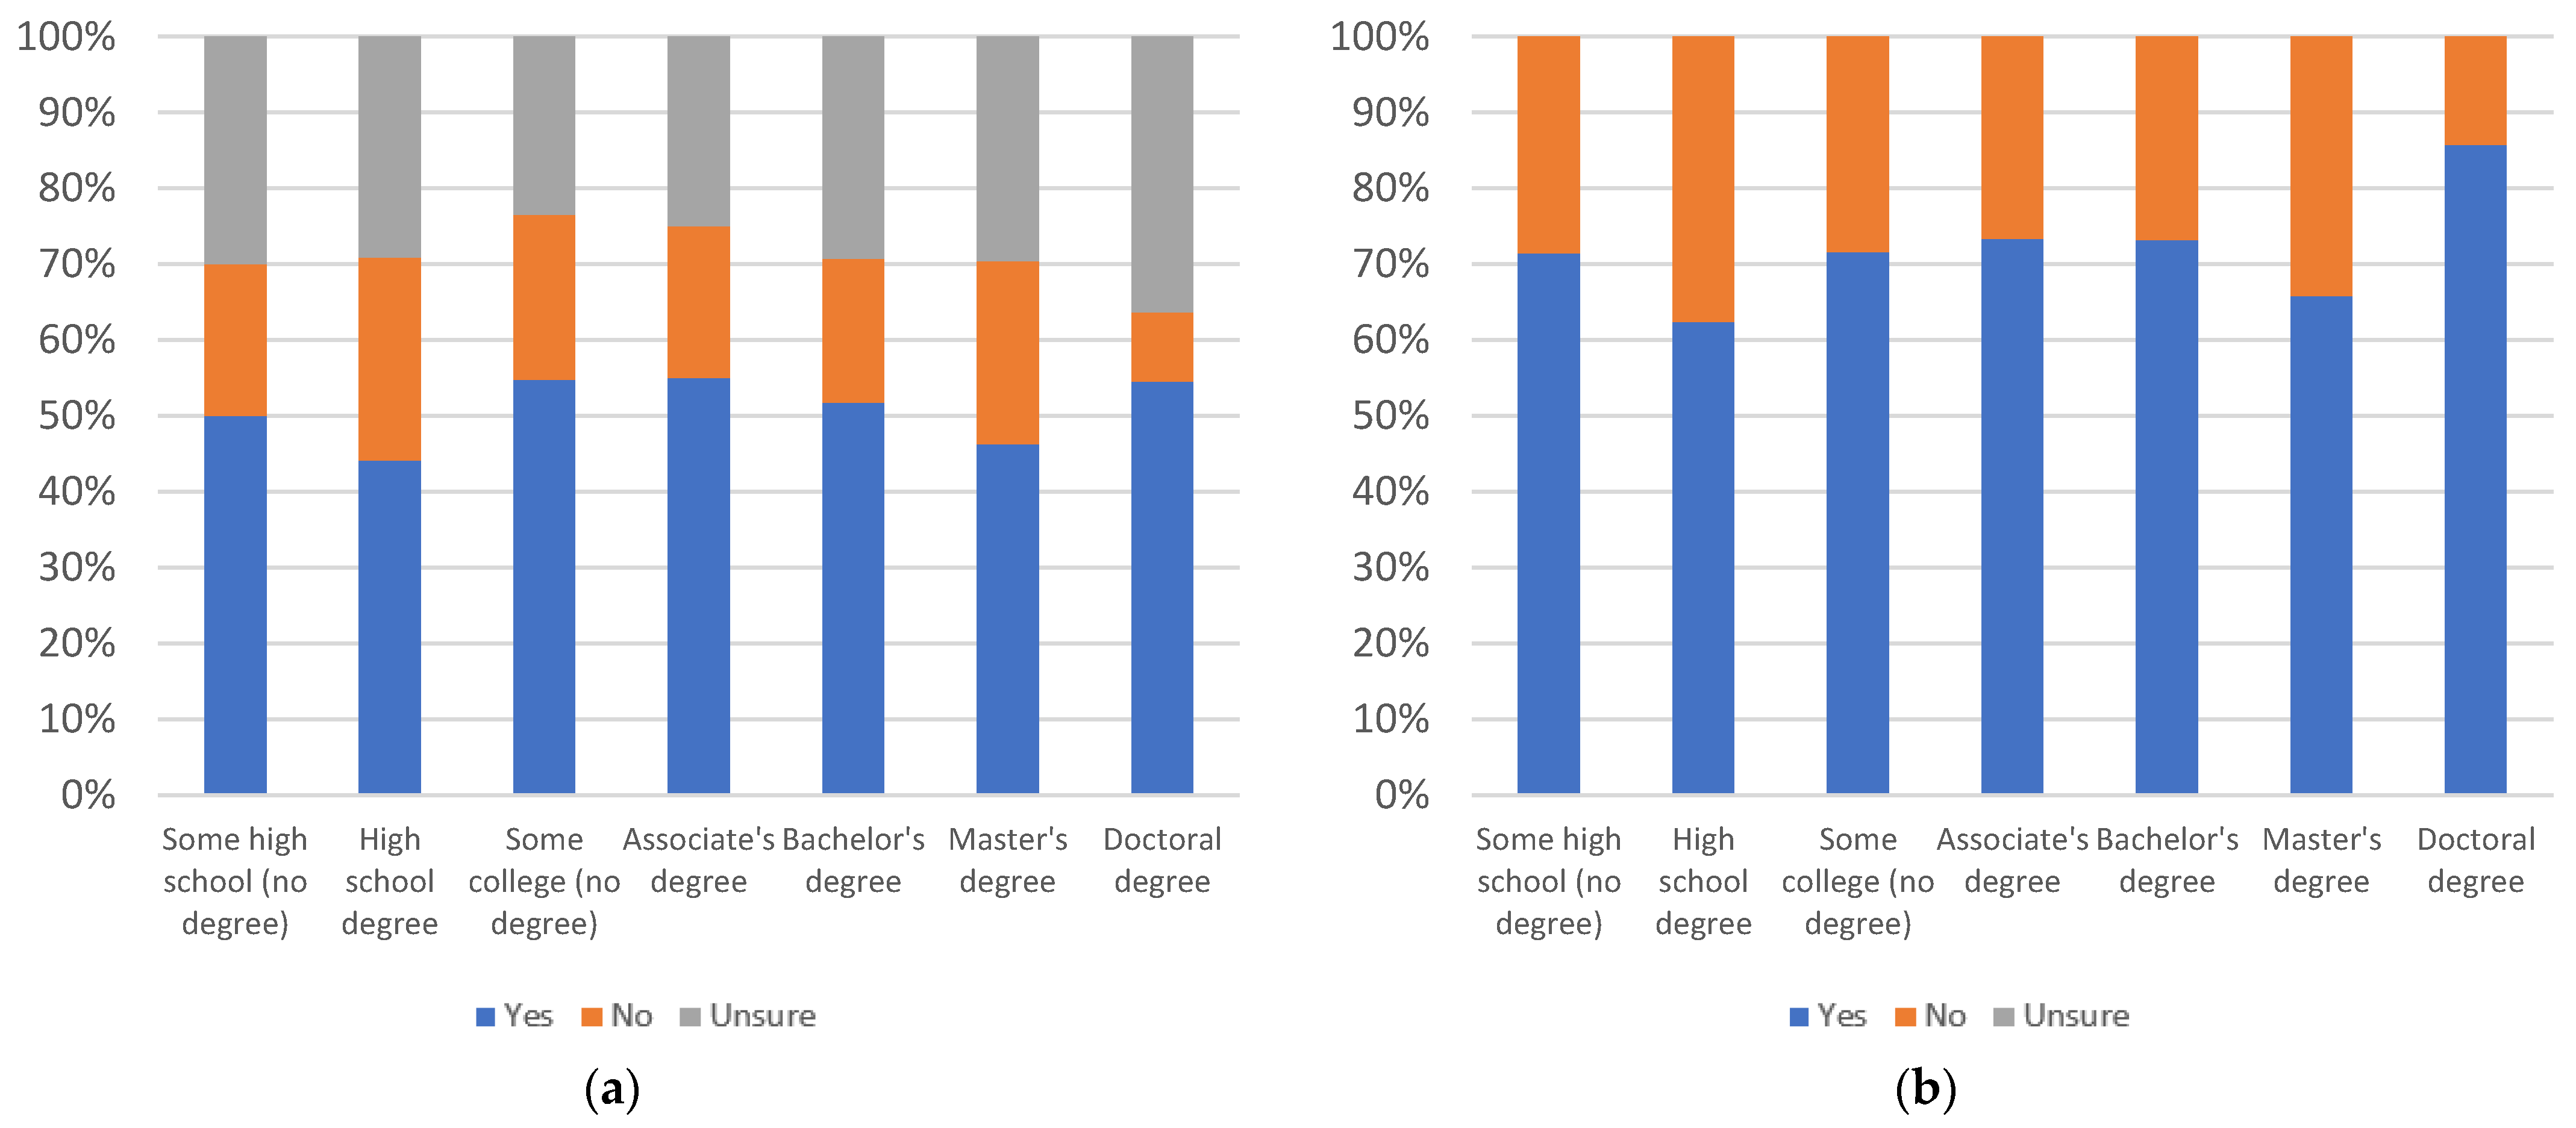
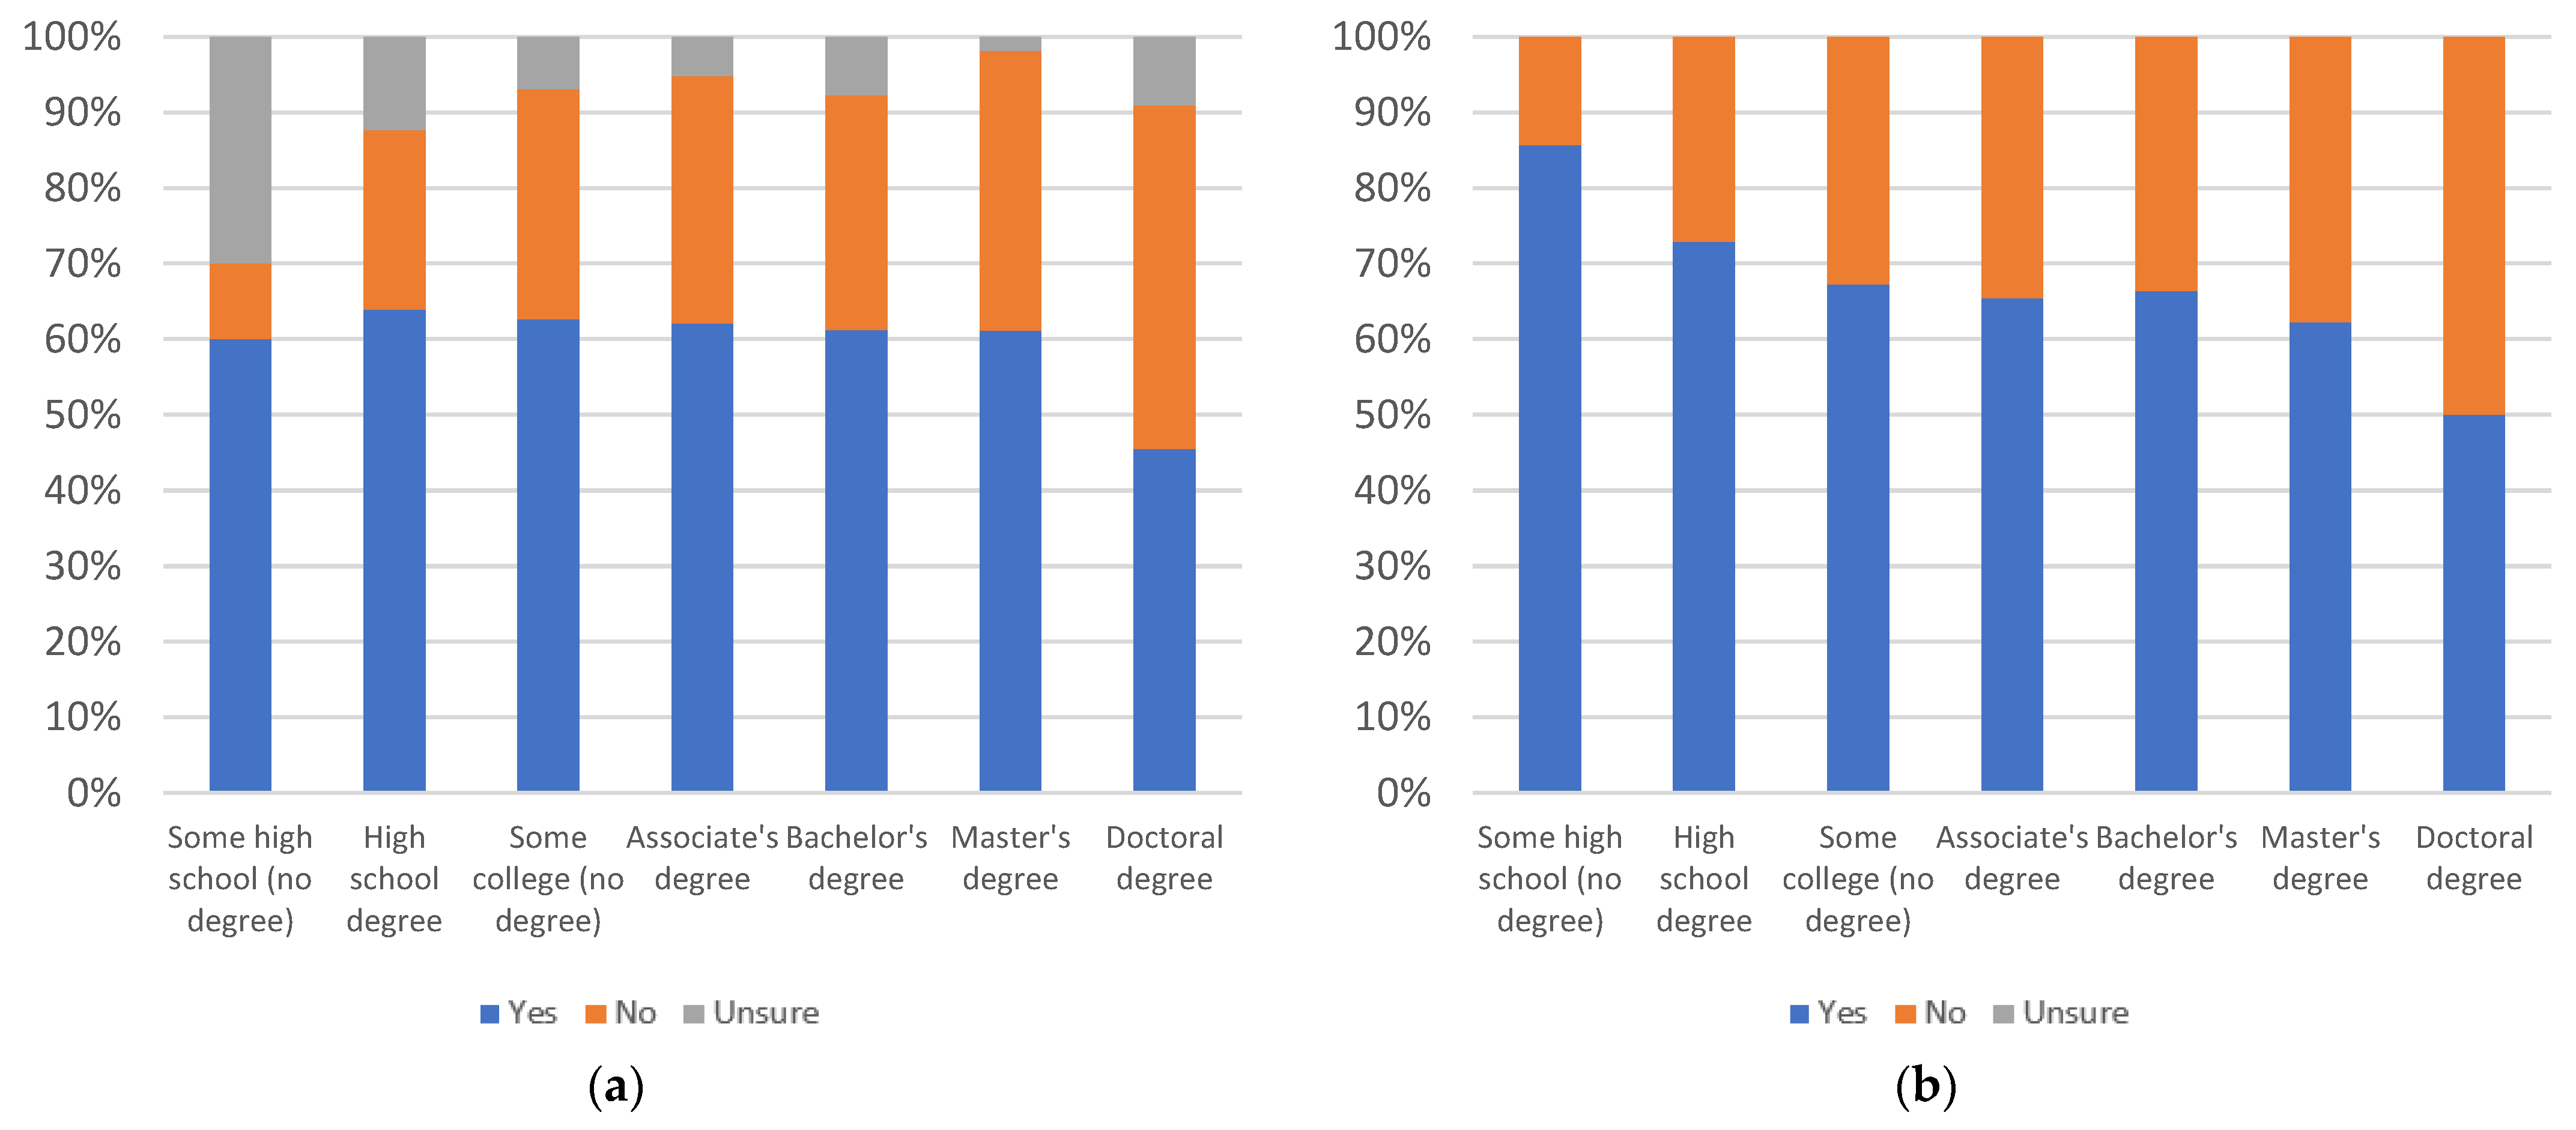
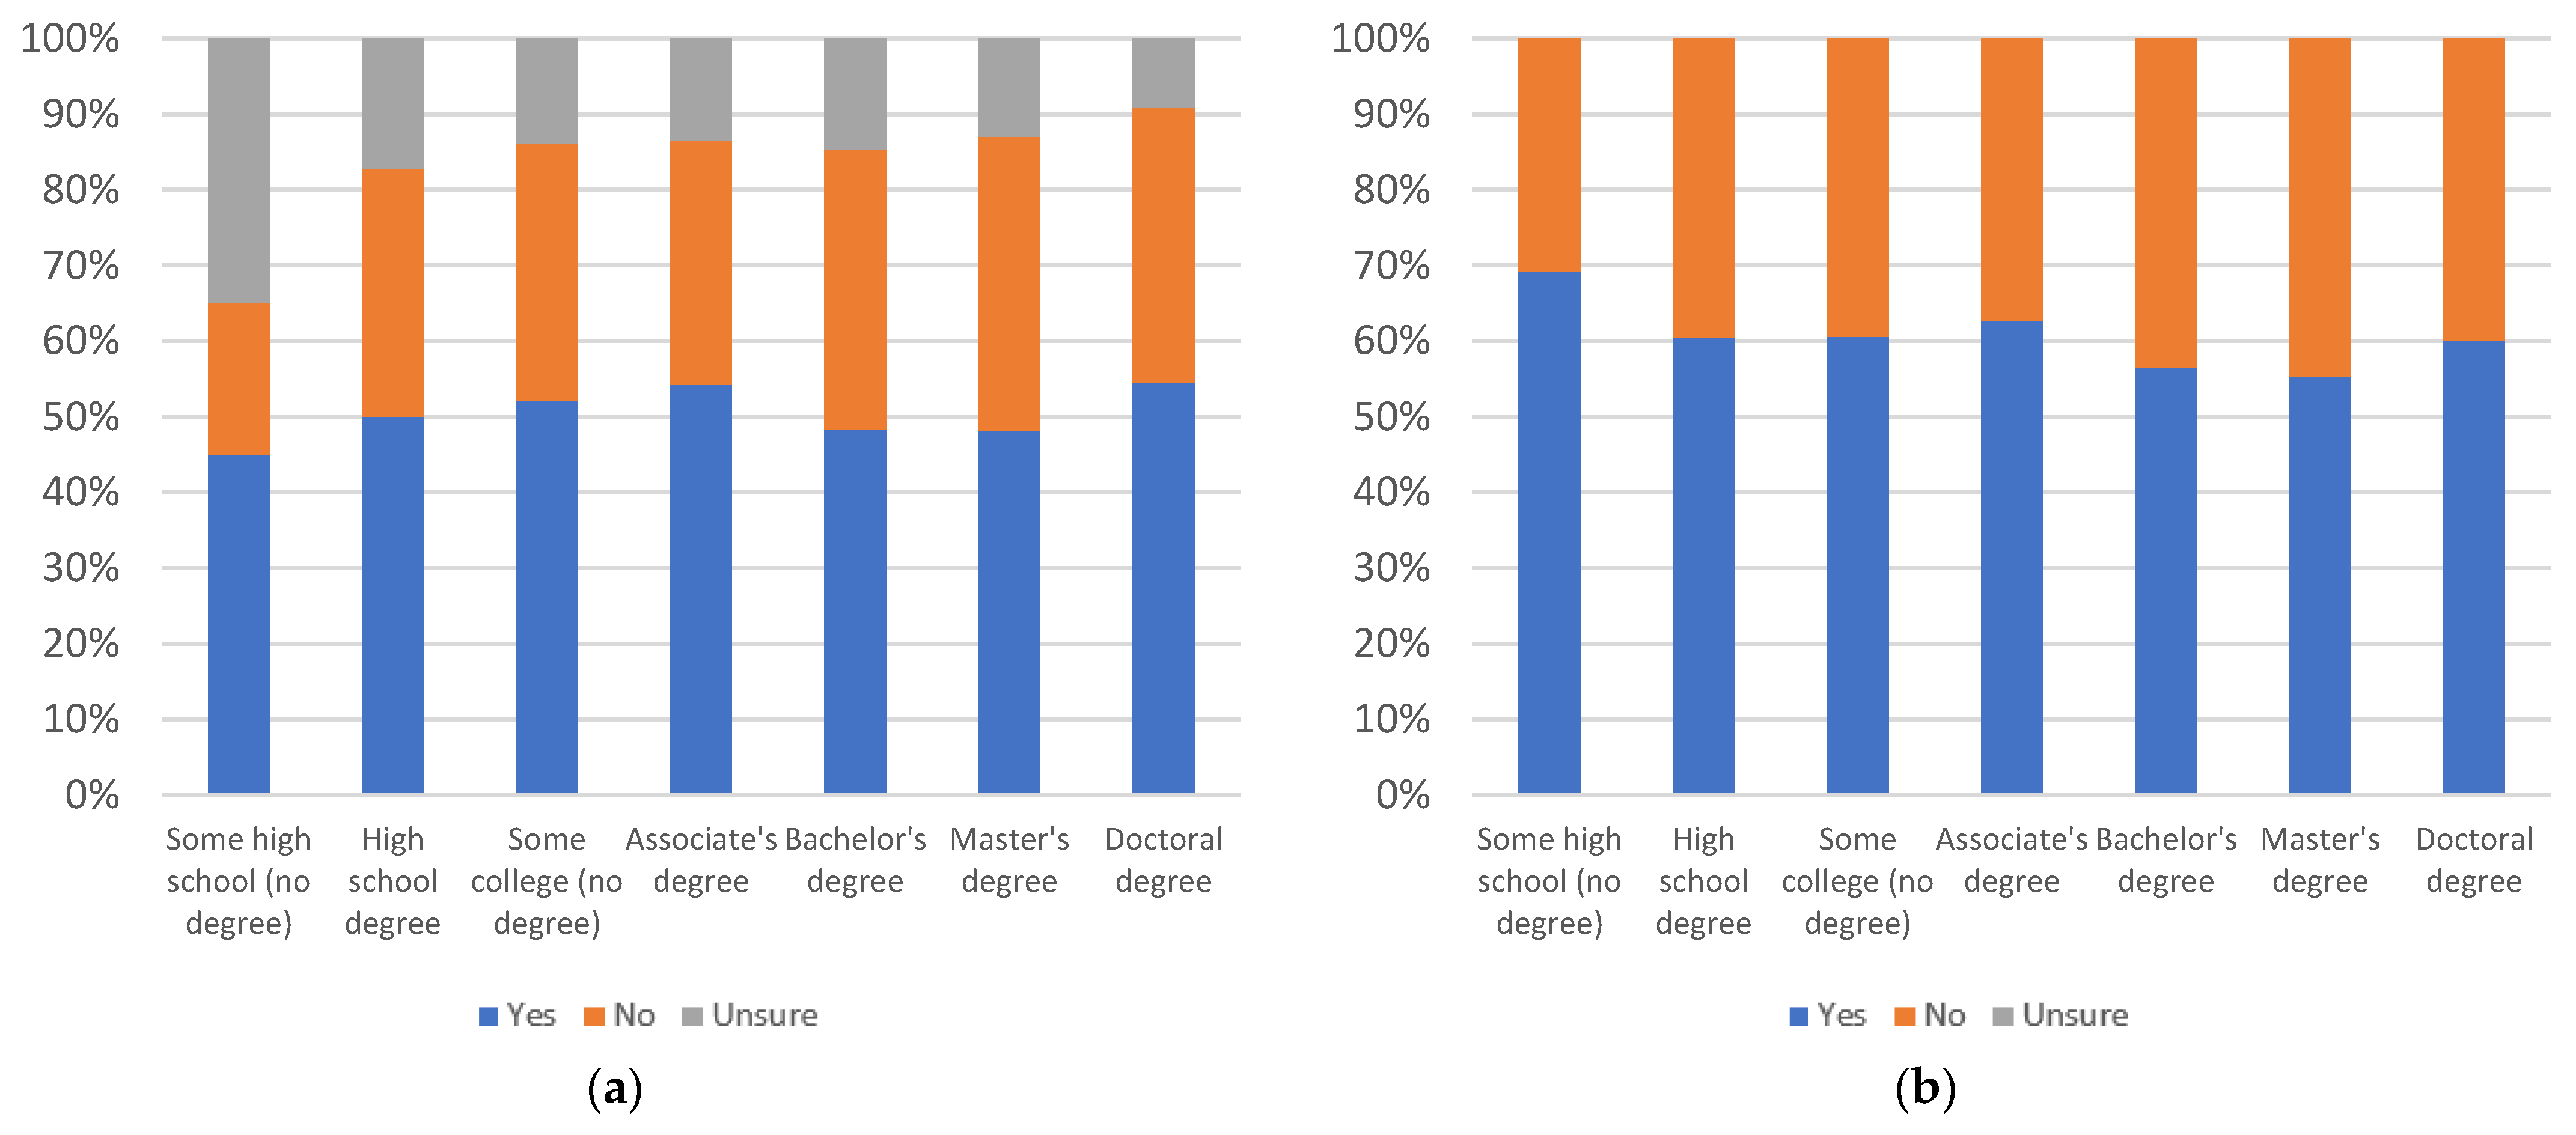
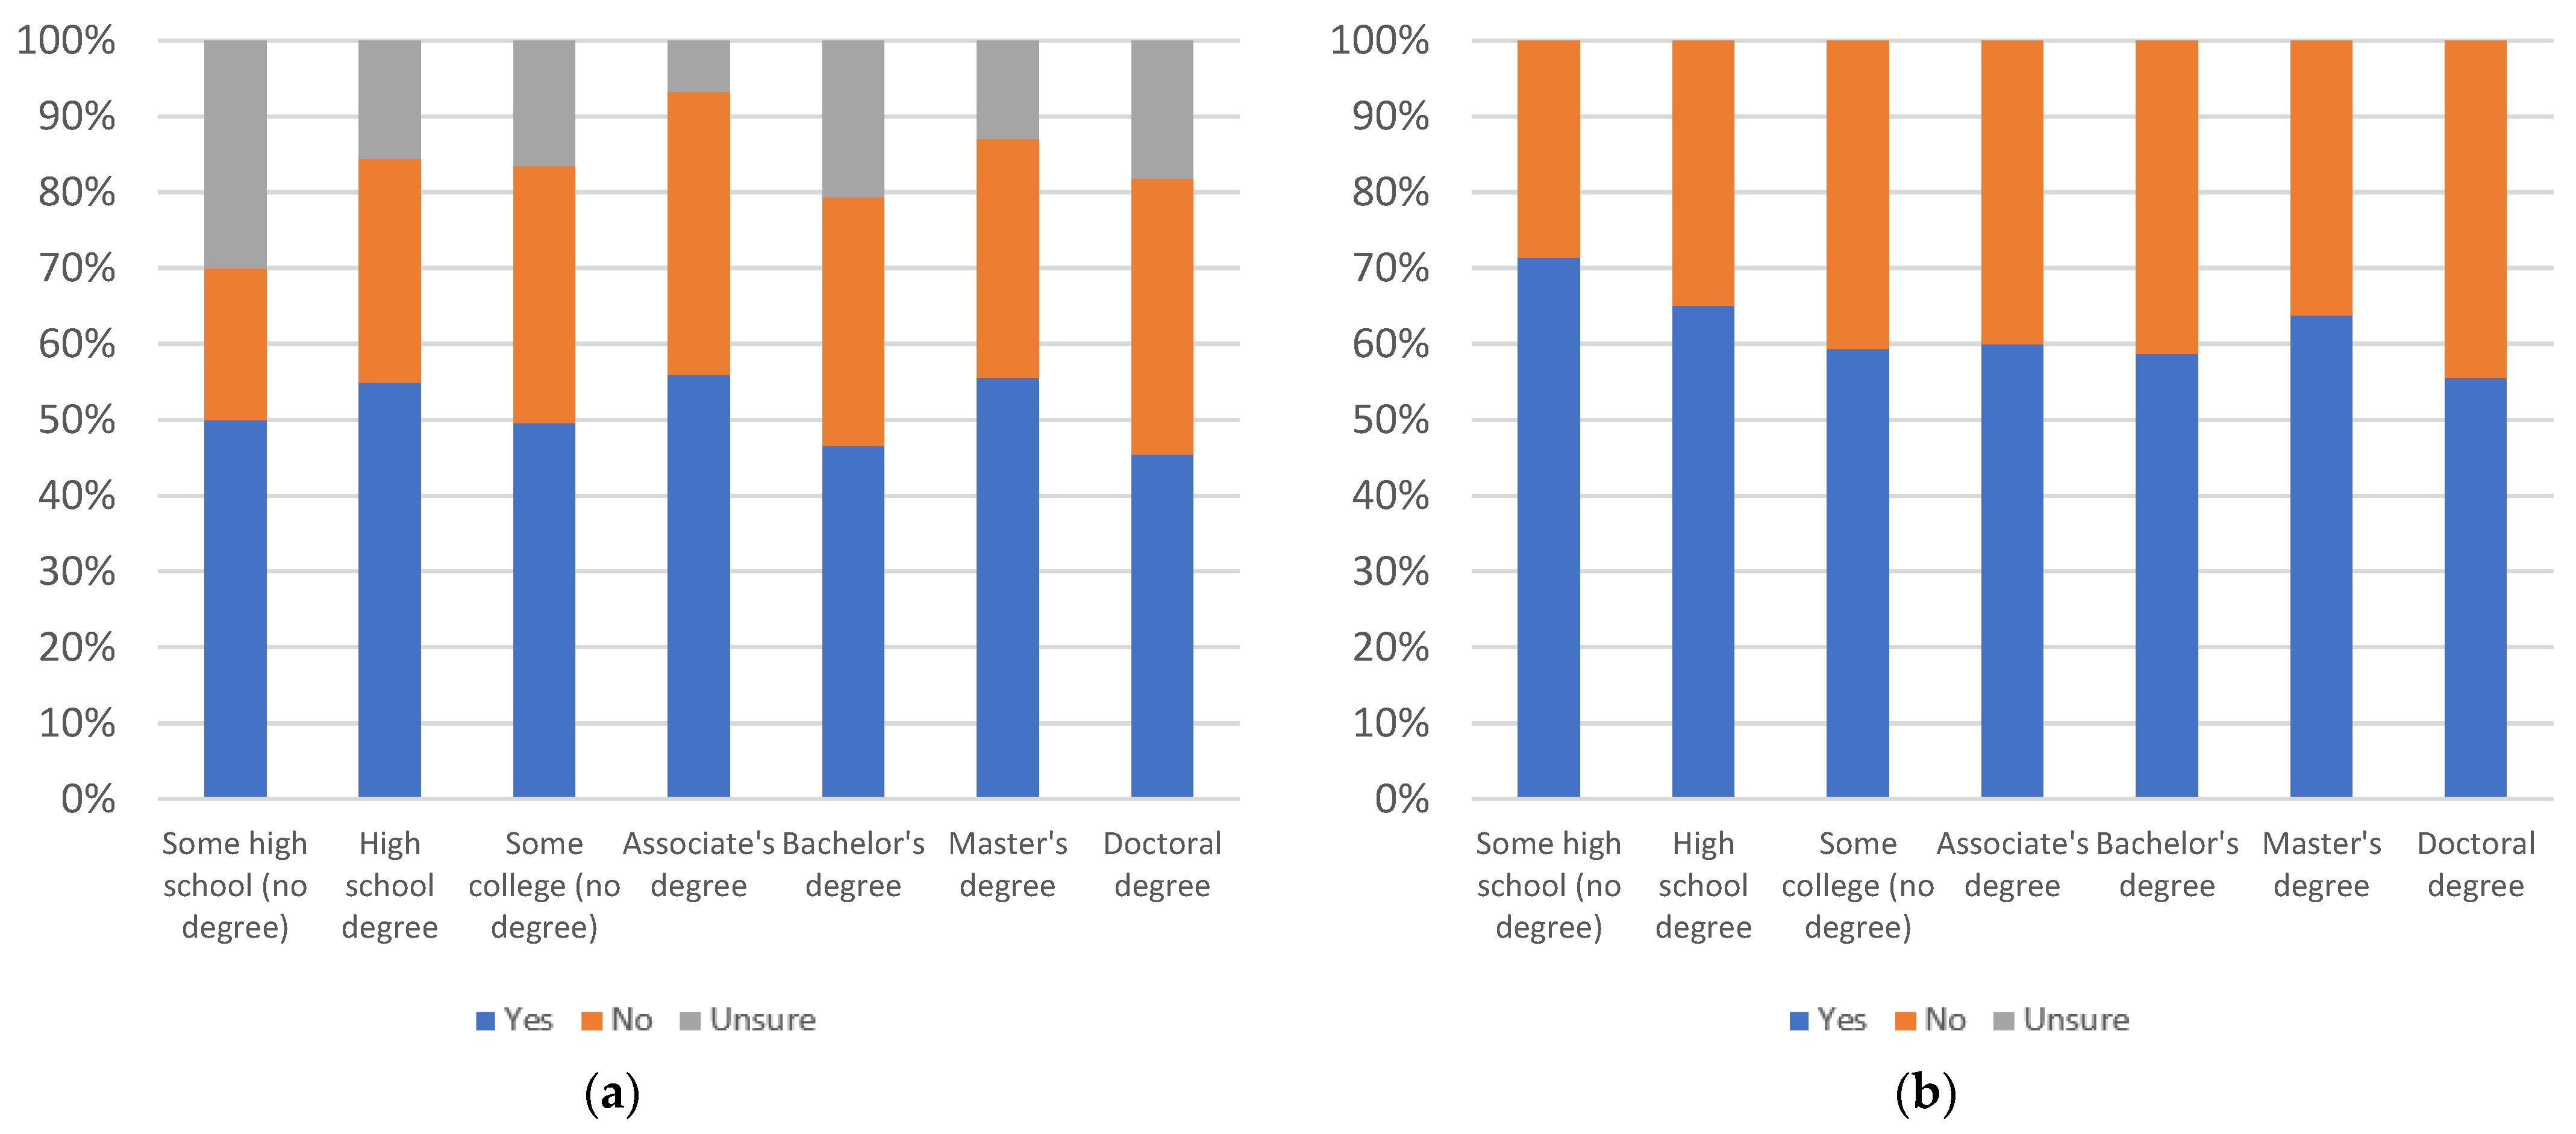
By education level, there is a larger decline as education level increases from the some high school up to the bachelor’s degree education levels. There is a spike at the master’s degree level, which is maintained at the doctoral degree level, when uncertainty is not factored in. When uncertainty is introduced, doctoral degree holders’ support is less pronounced than master’s degree holders, due to a higher level of uncertainty amongst doctoral degree holders. Education groups, other than associate’s and bachelor’s degree holders, have at least 50% answering yes, even when uncertainty is factored in. Both of these groups show at least 50% answering “yes” when uncertainty is not considered.
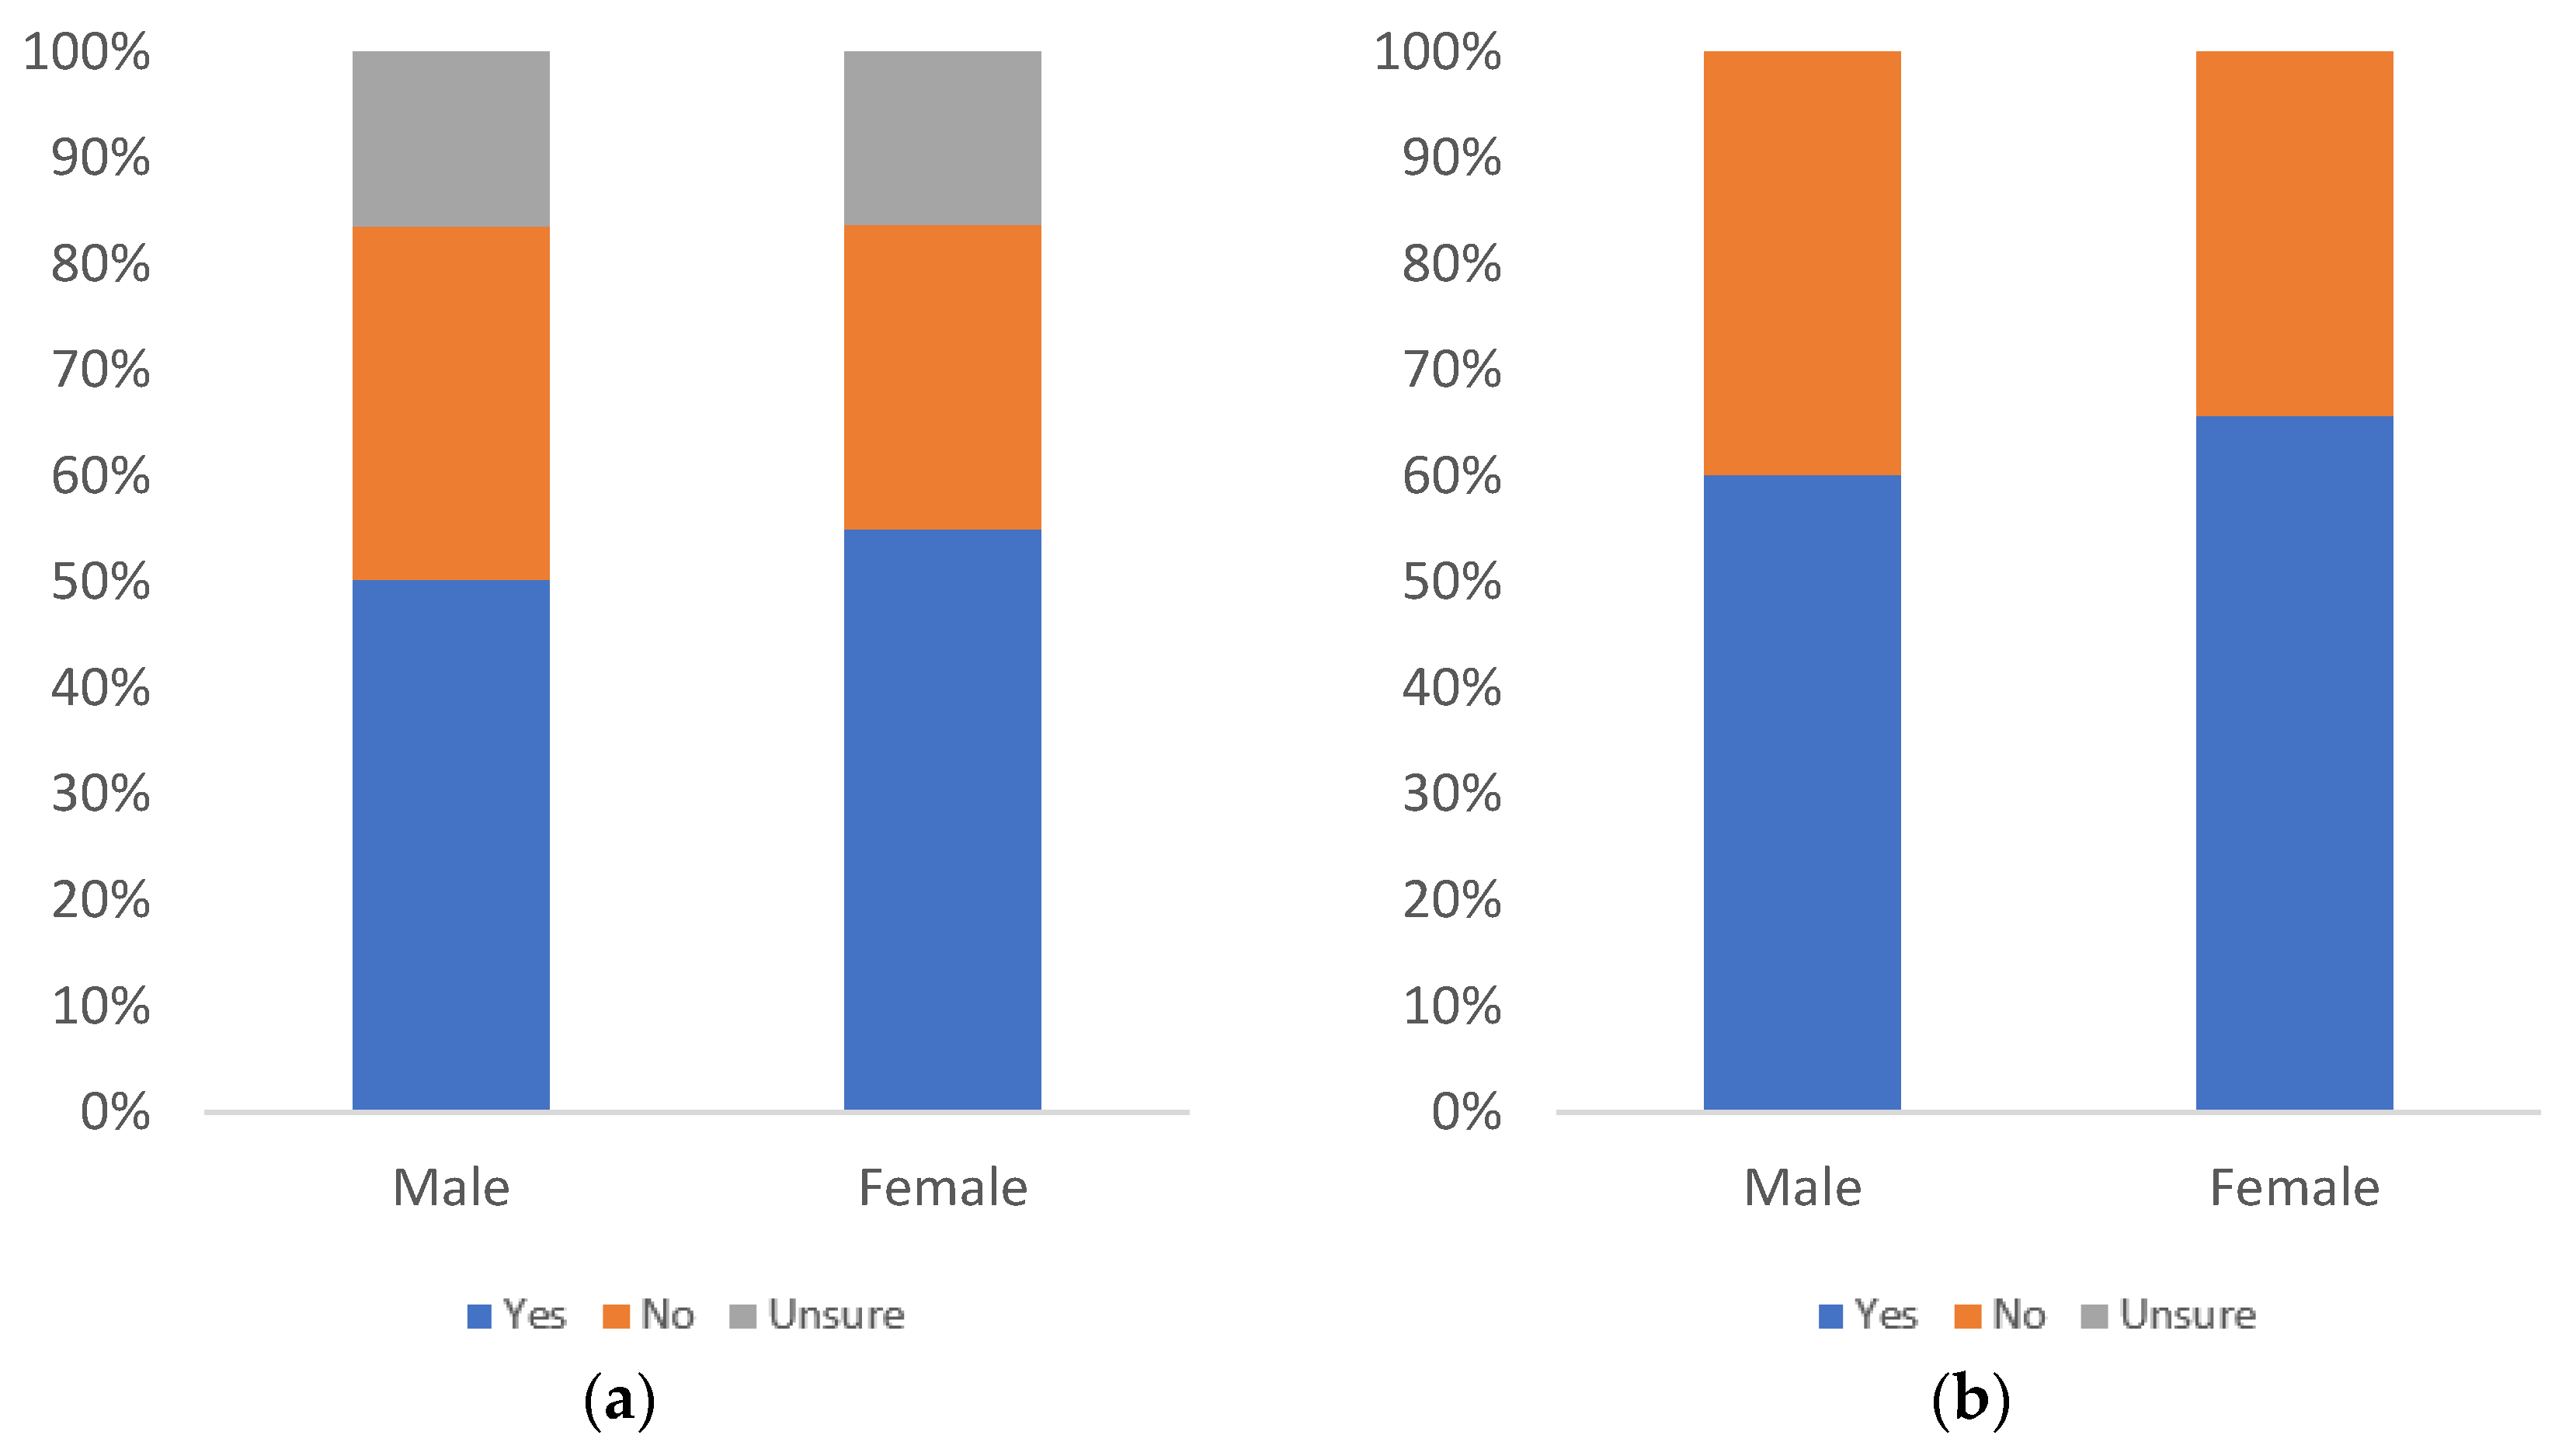
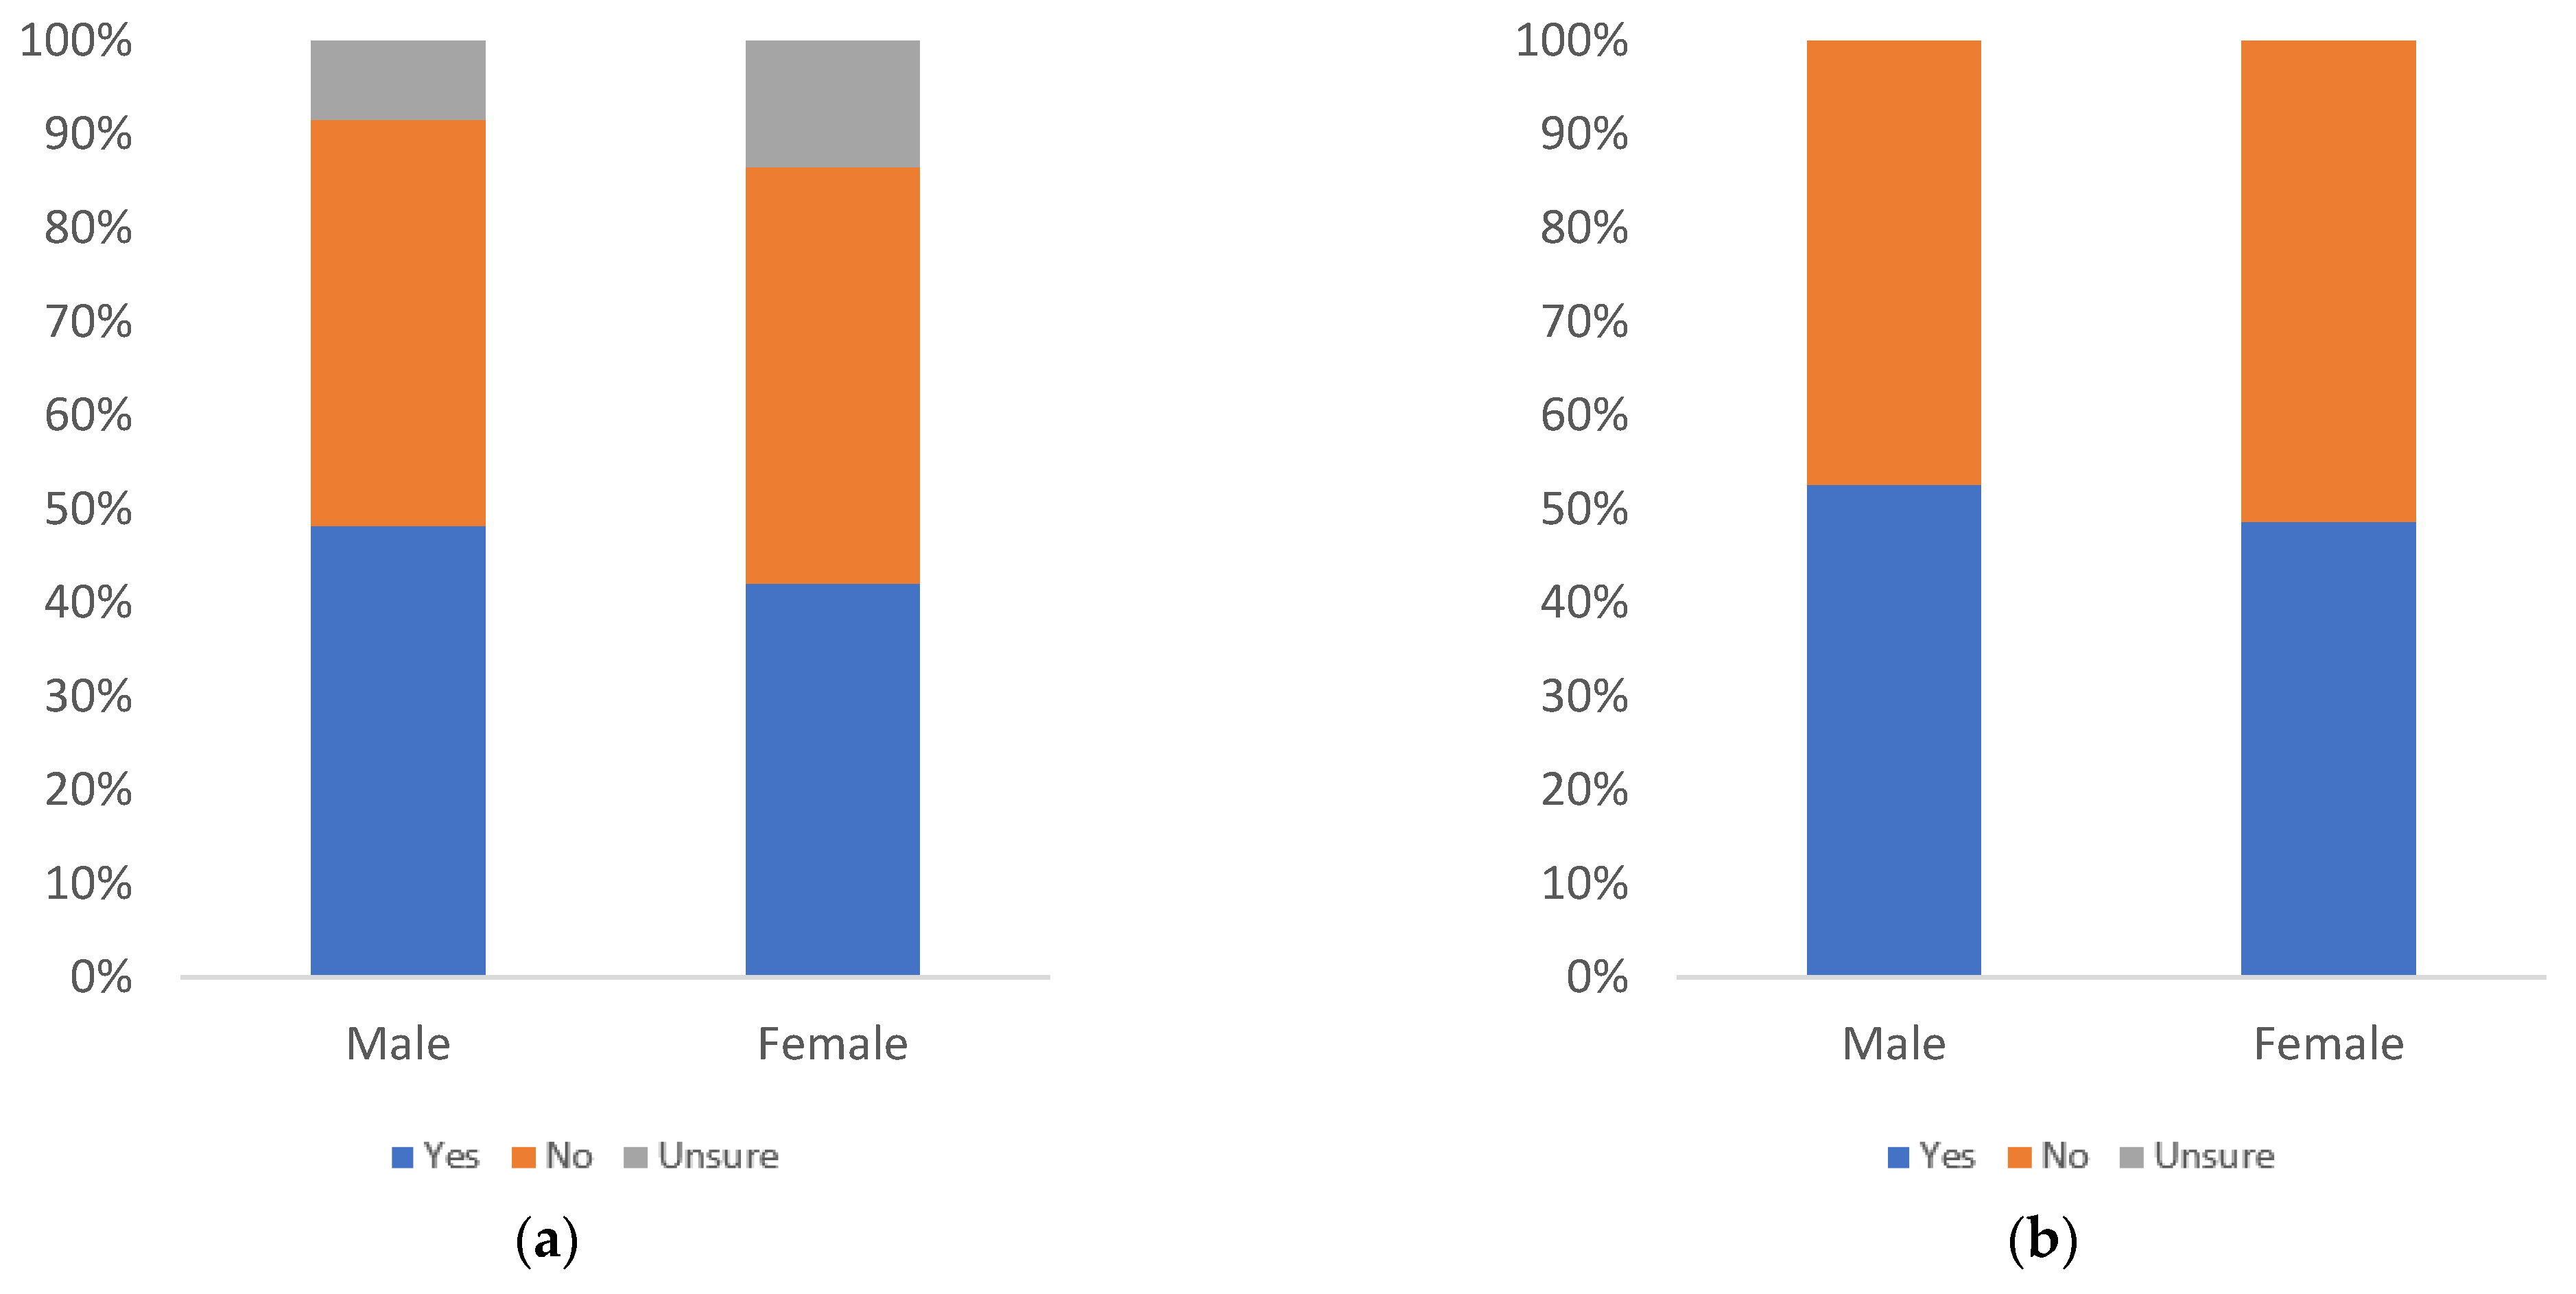
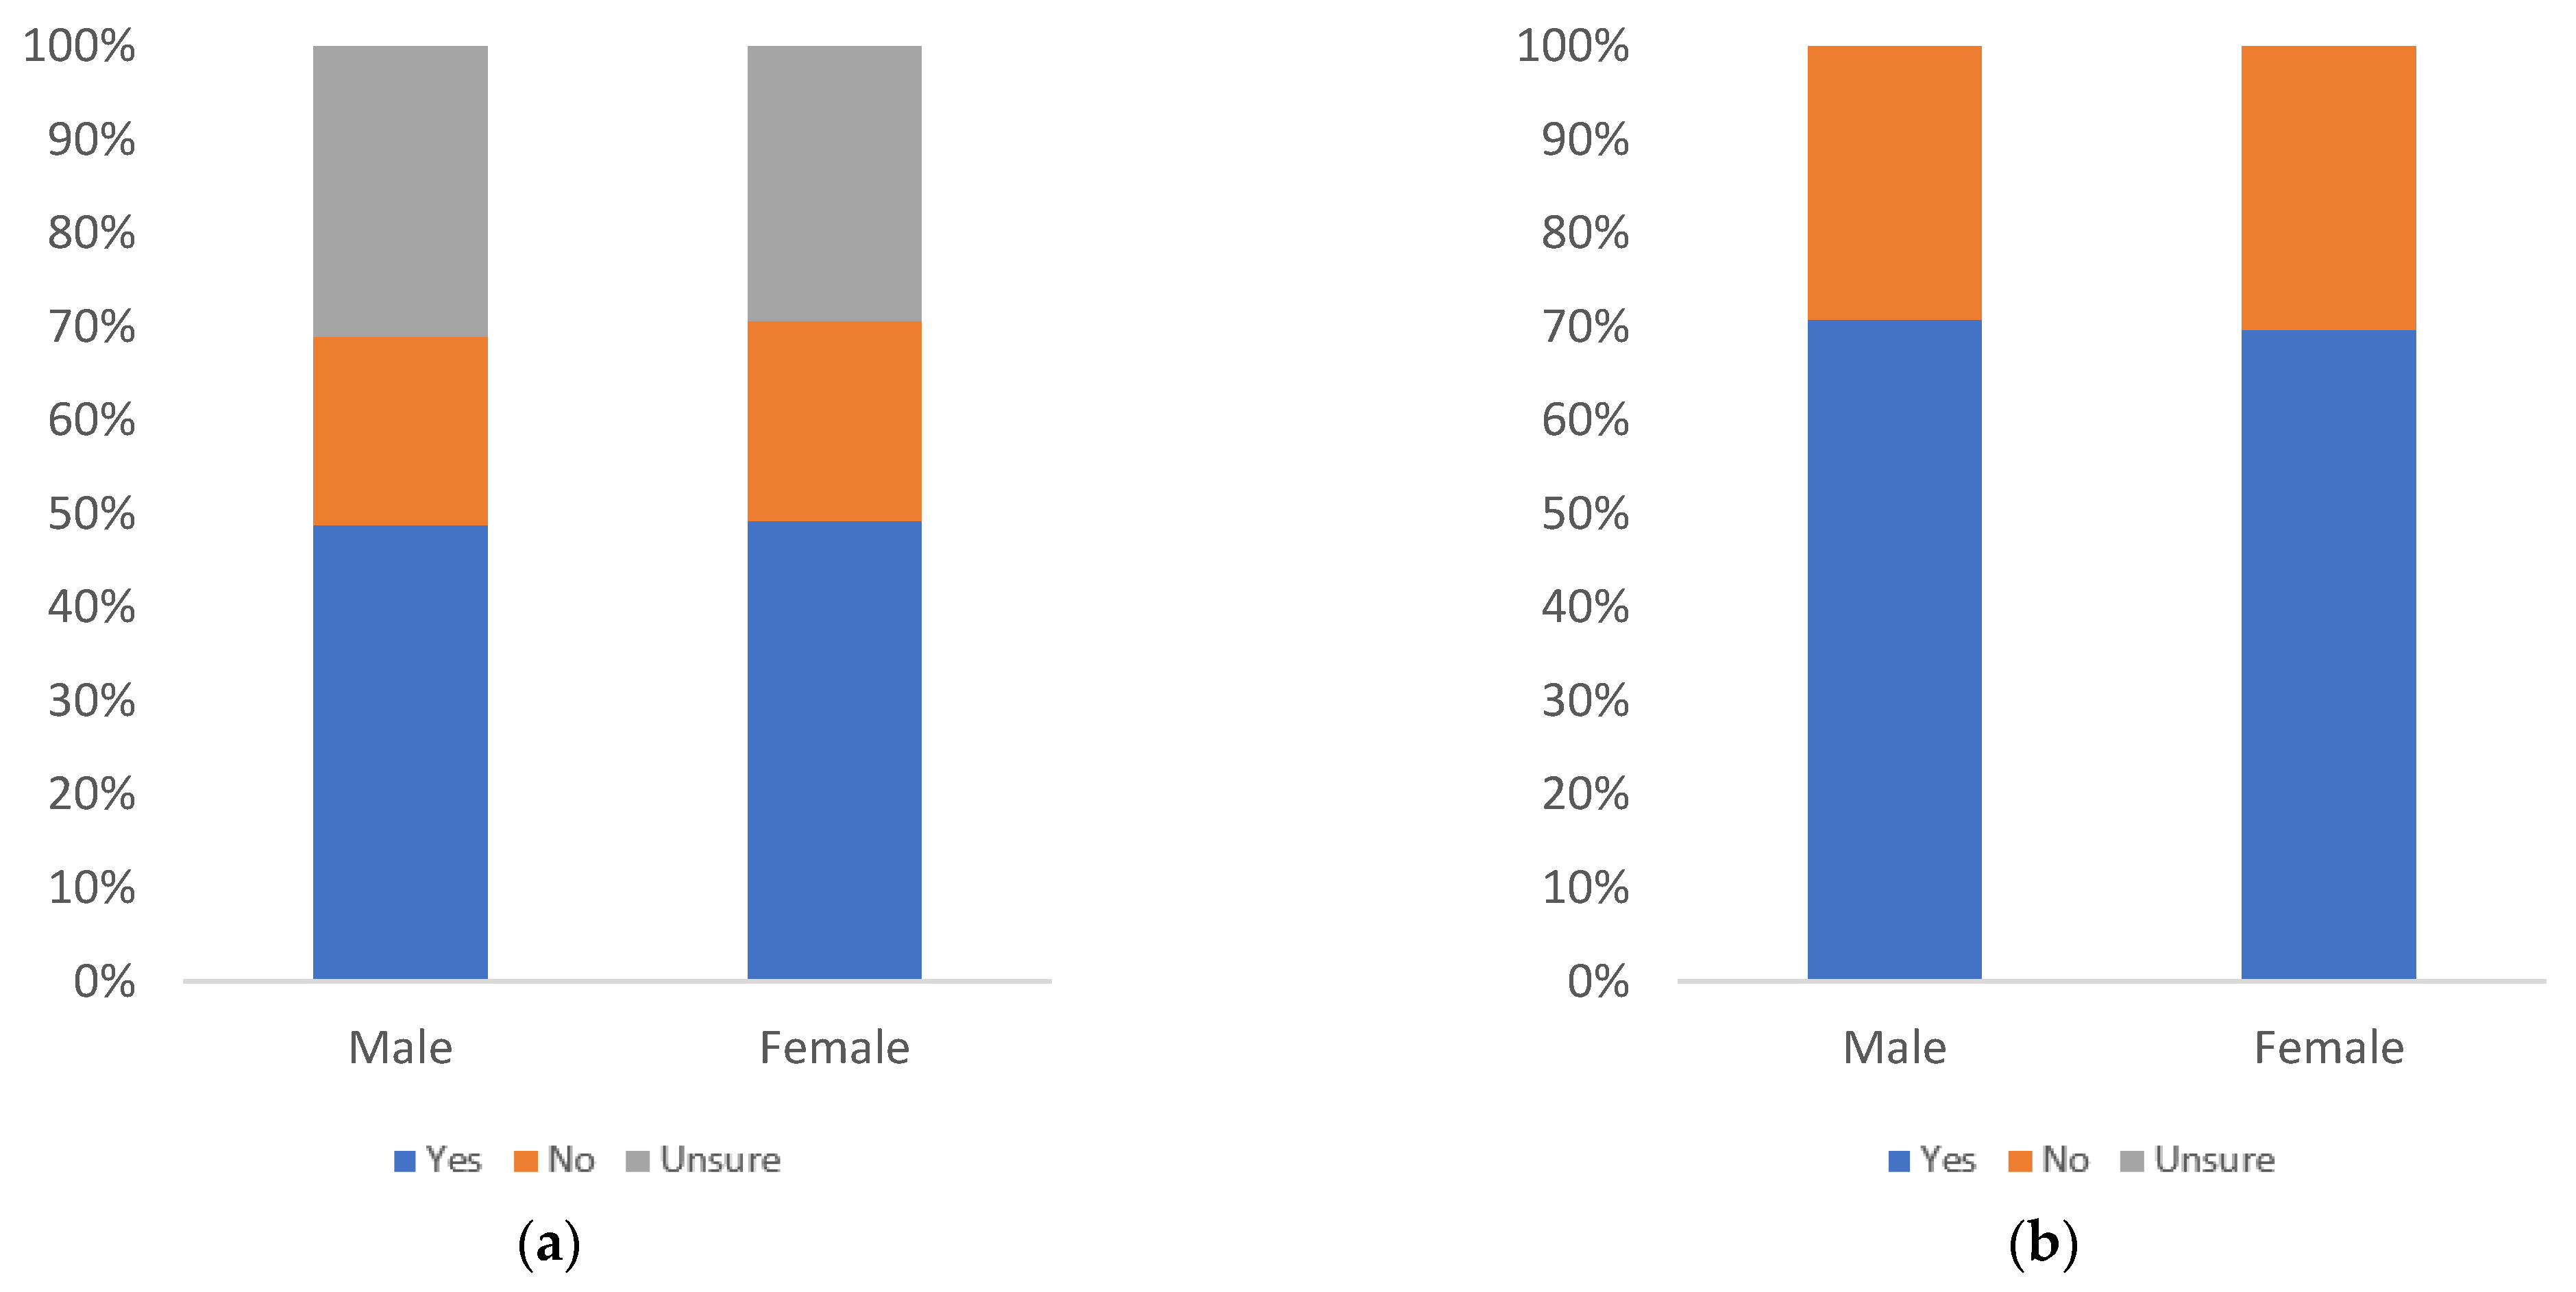
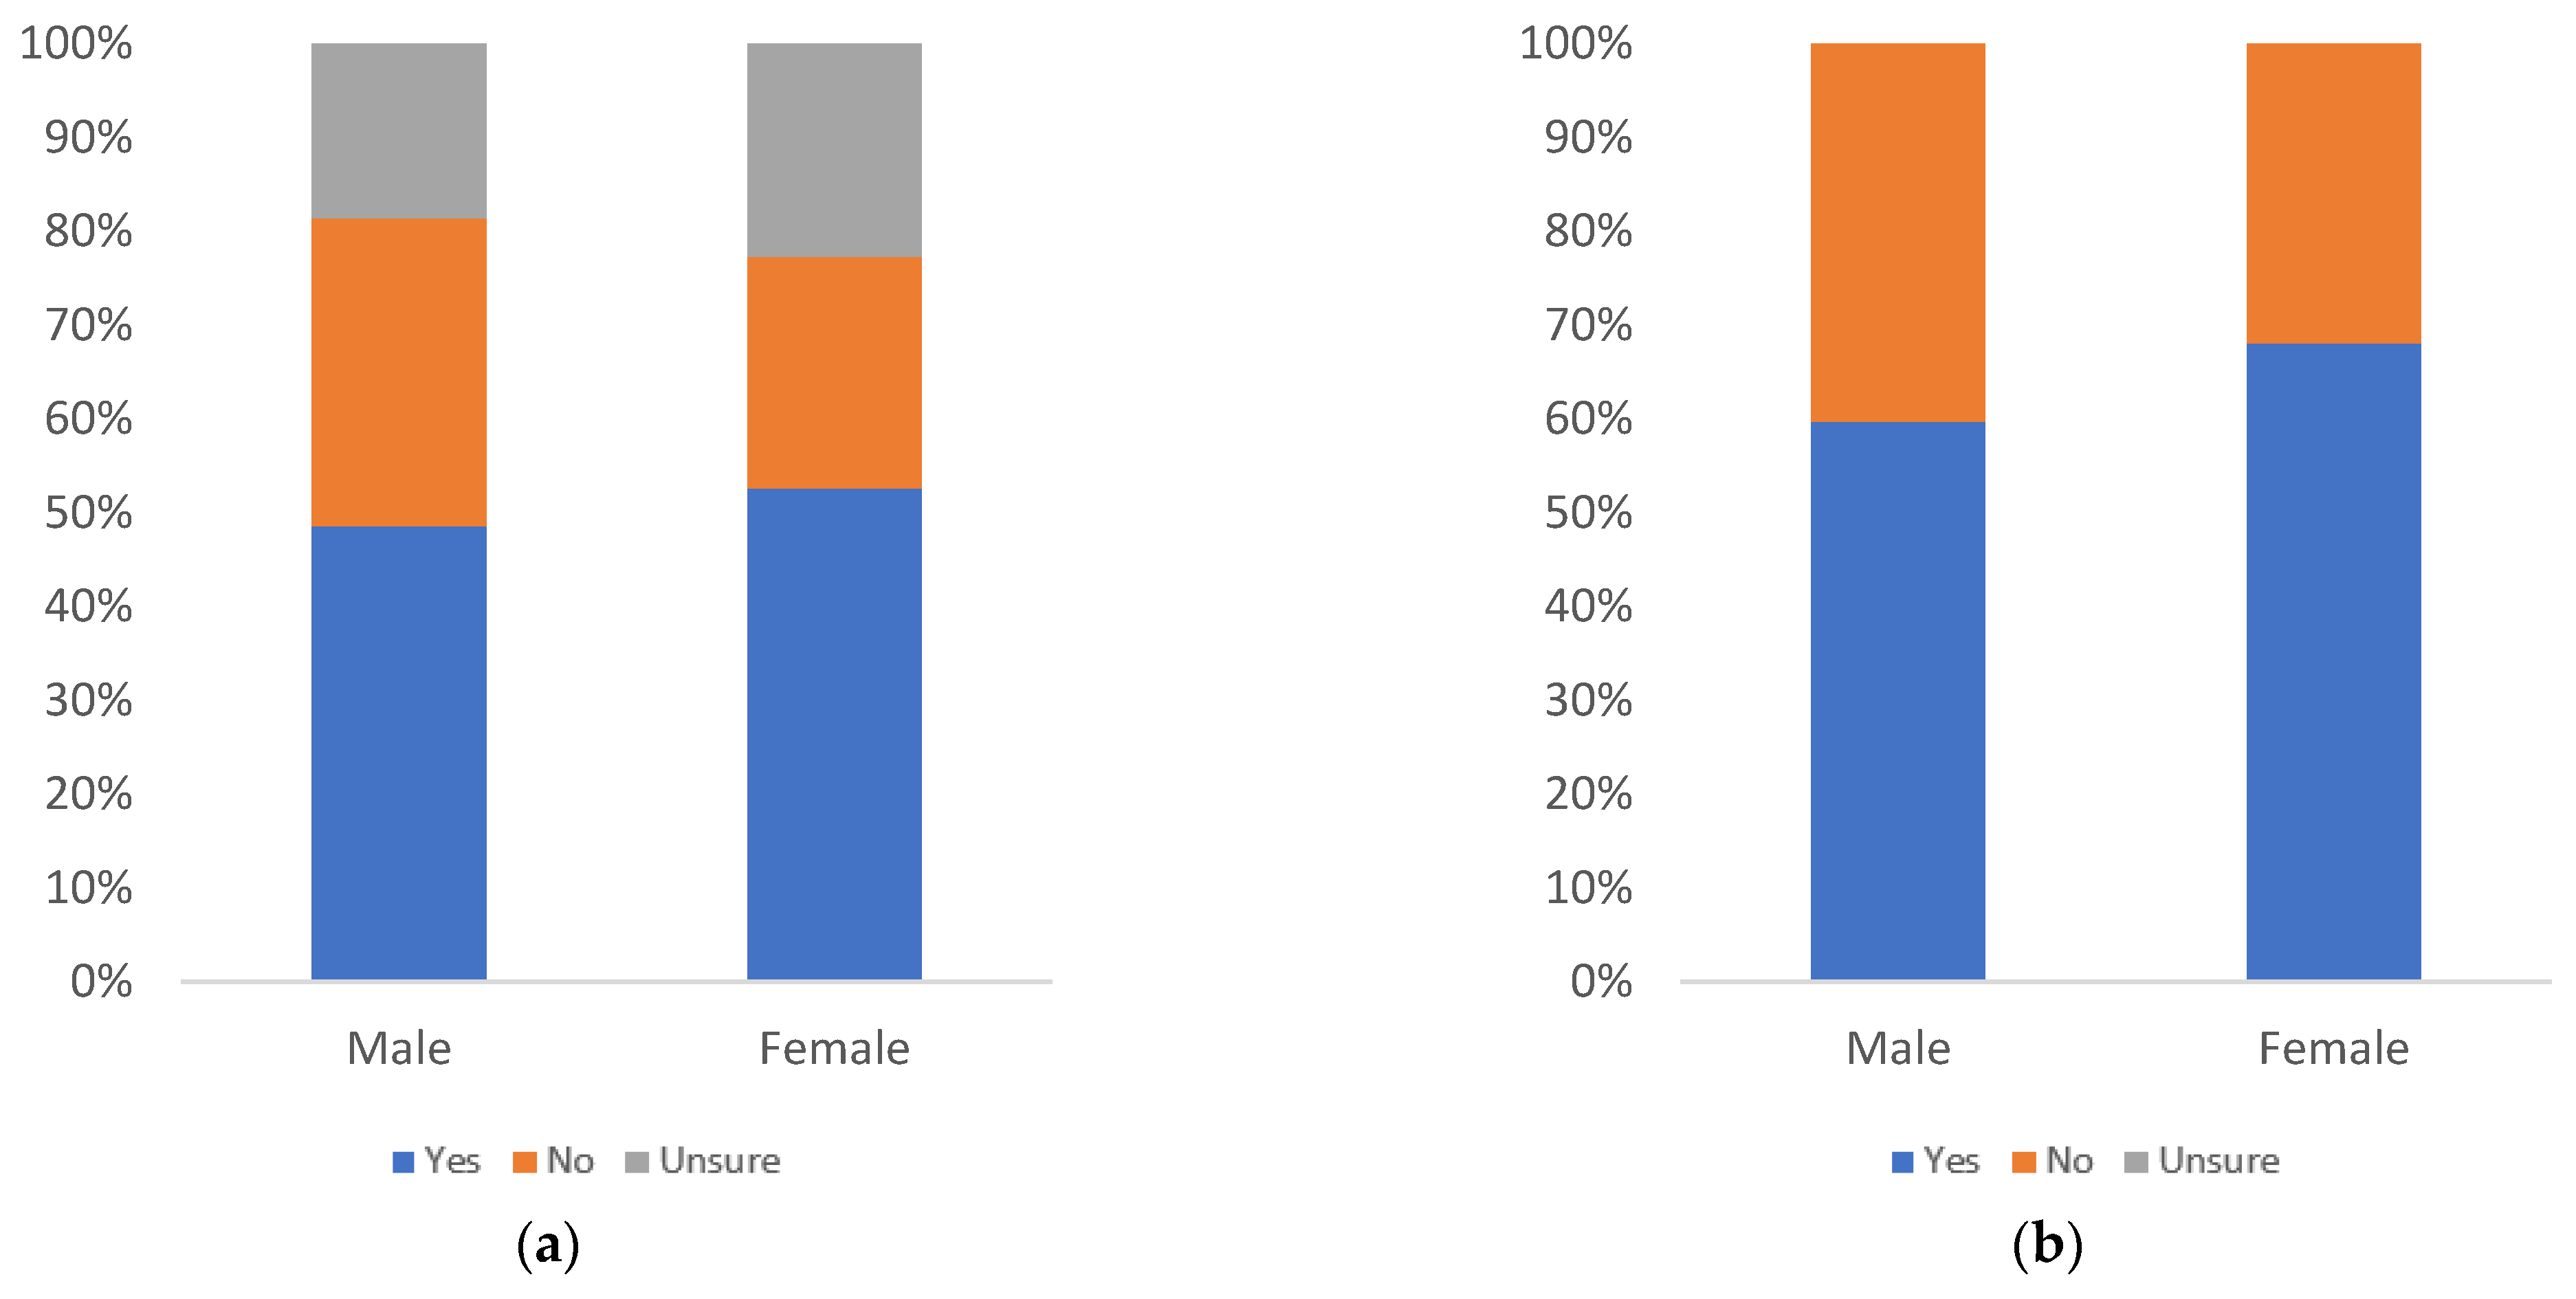
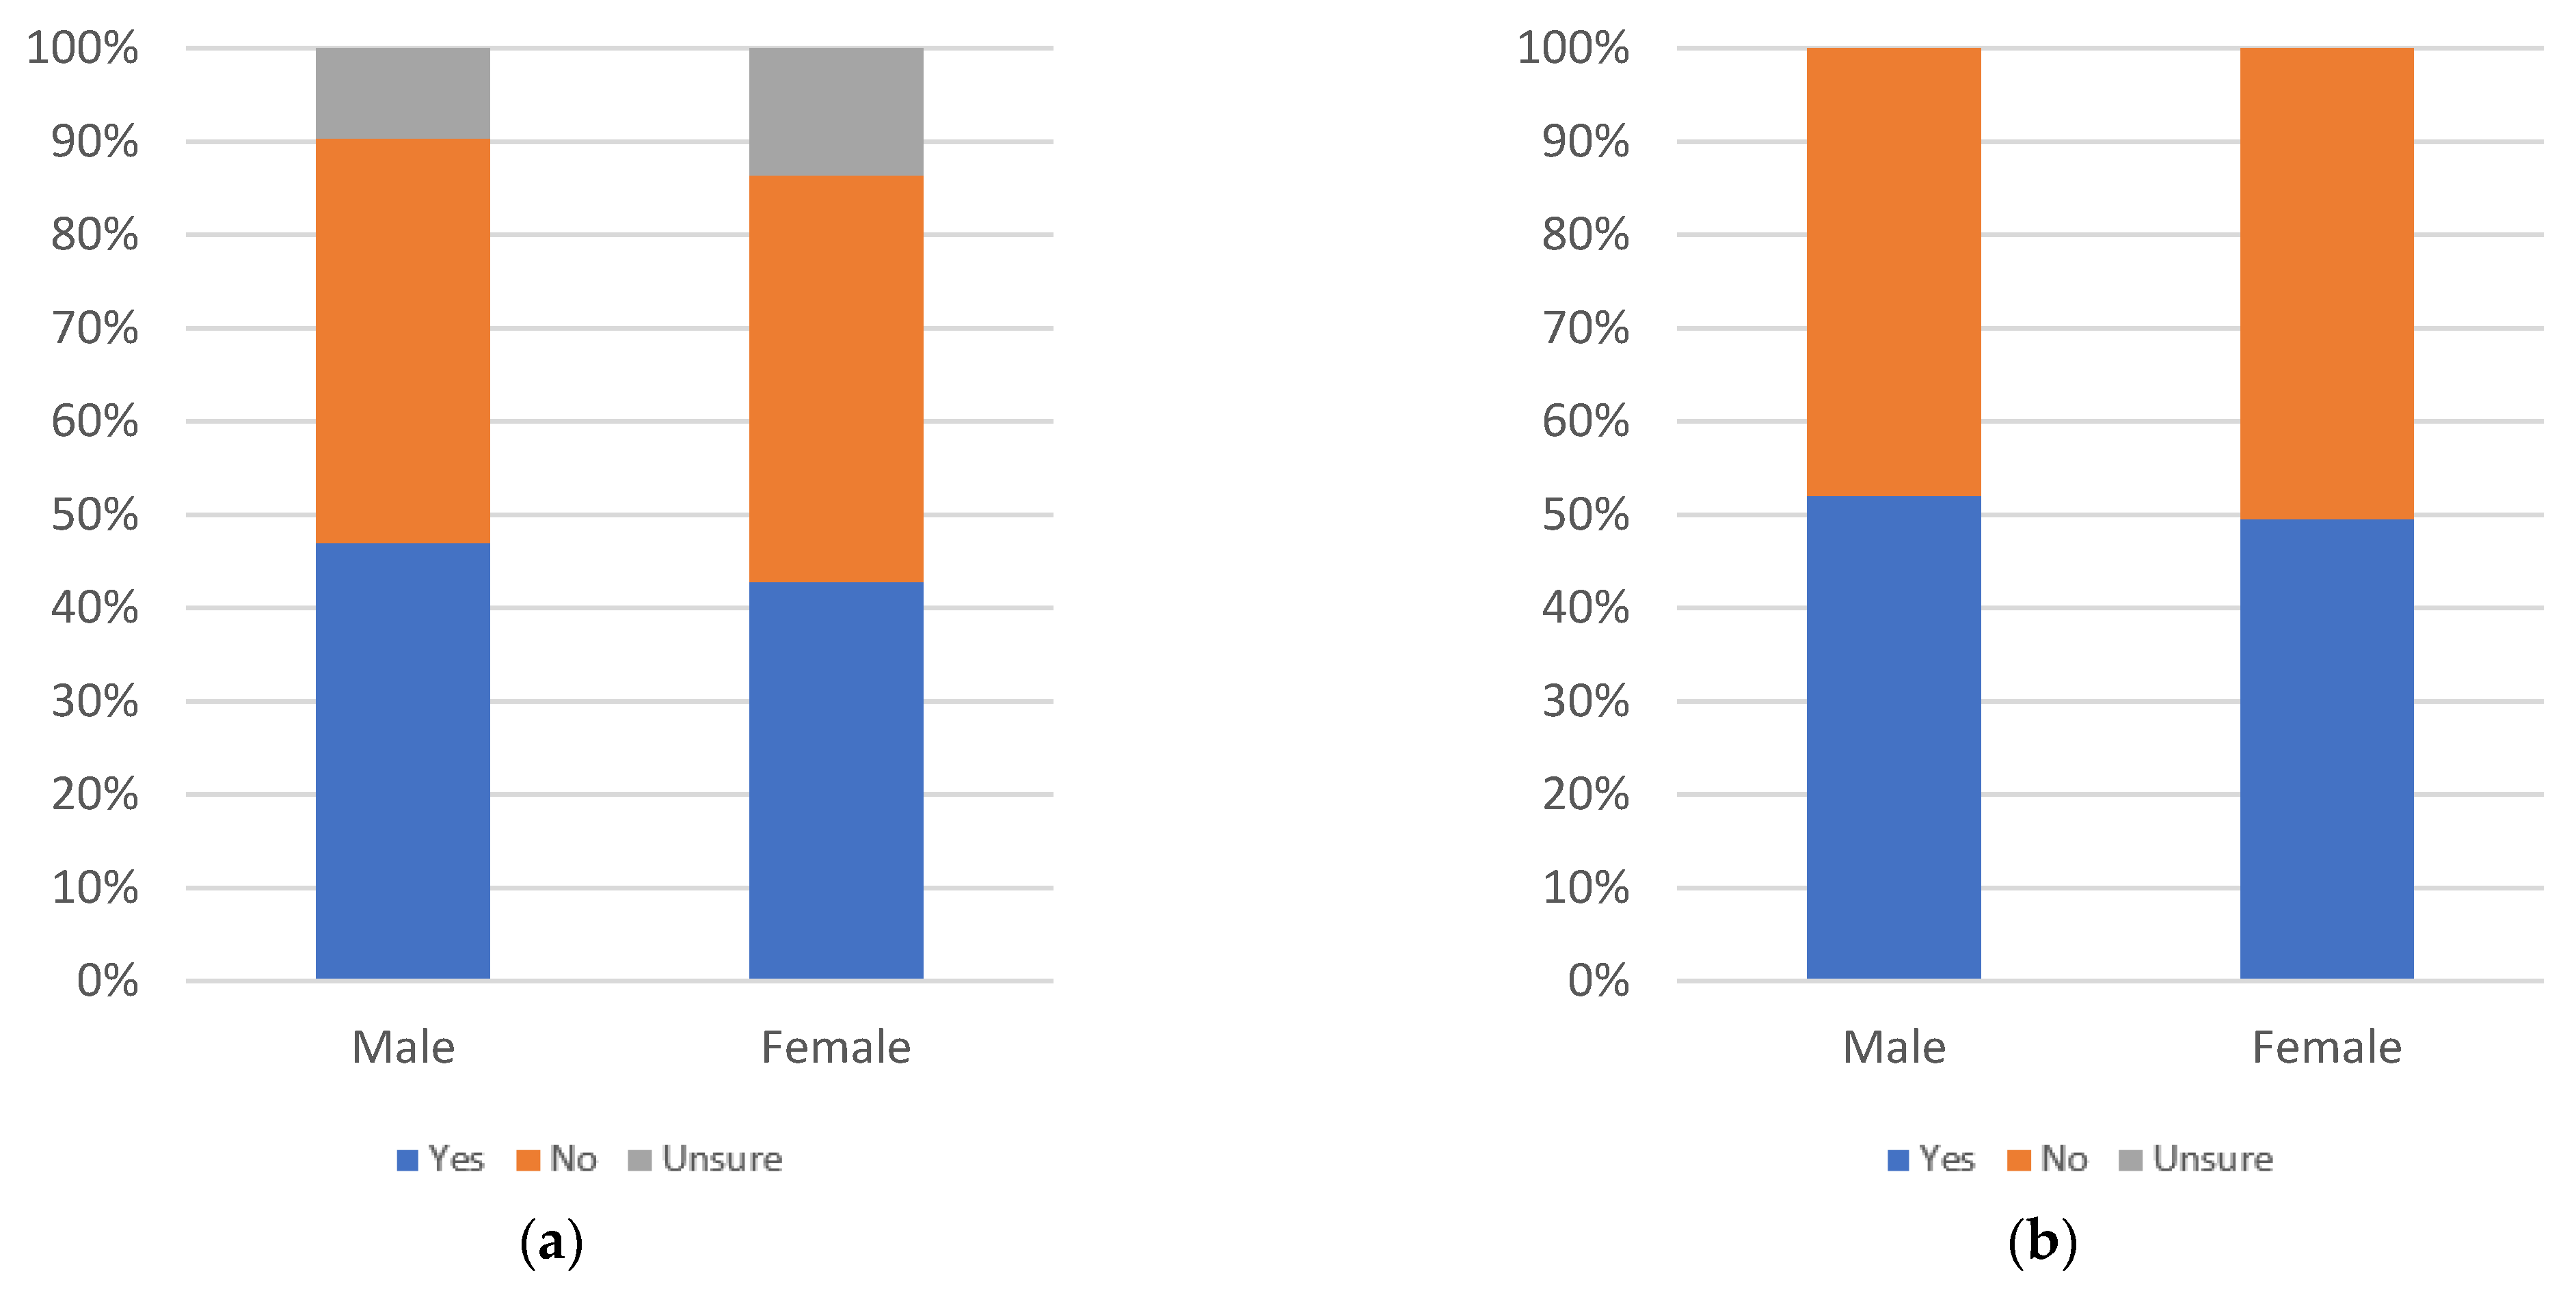
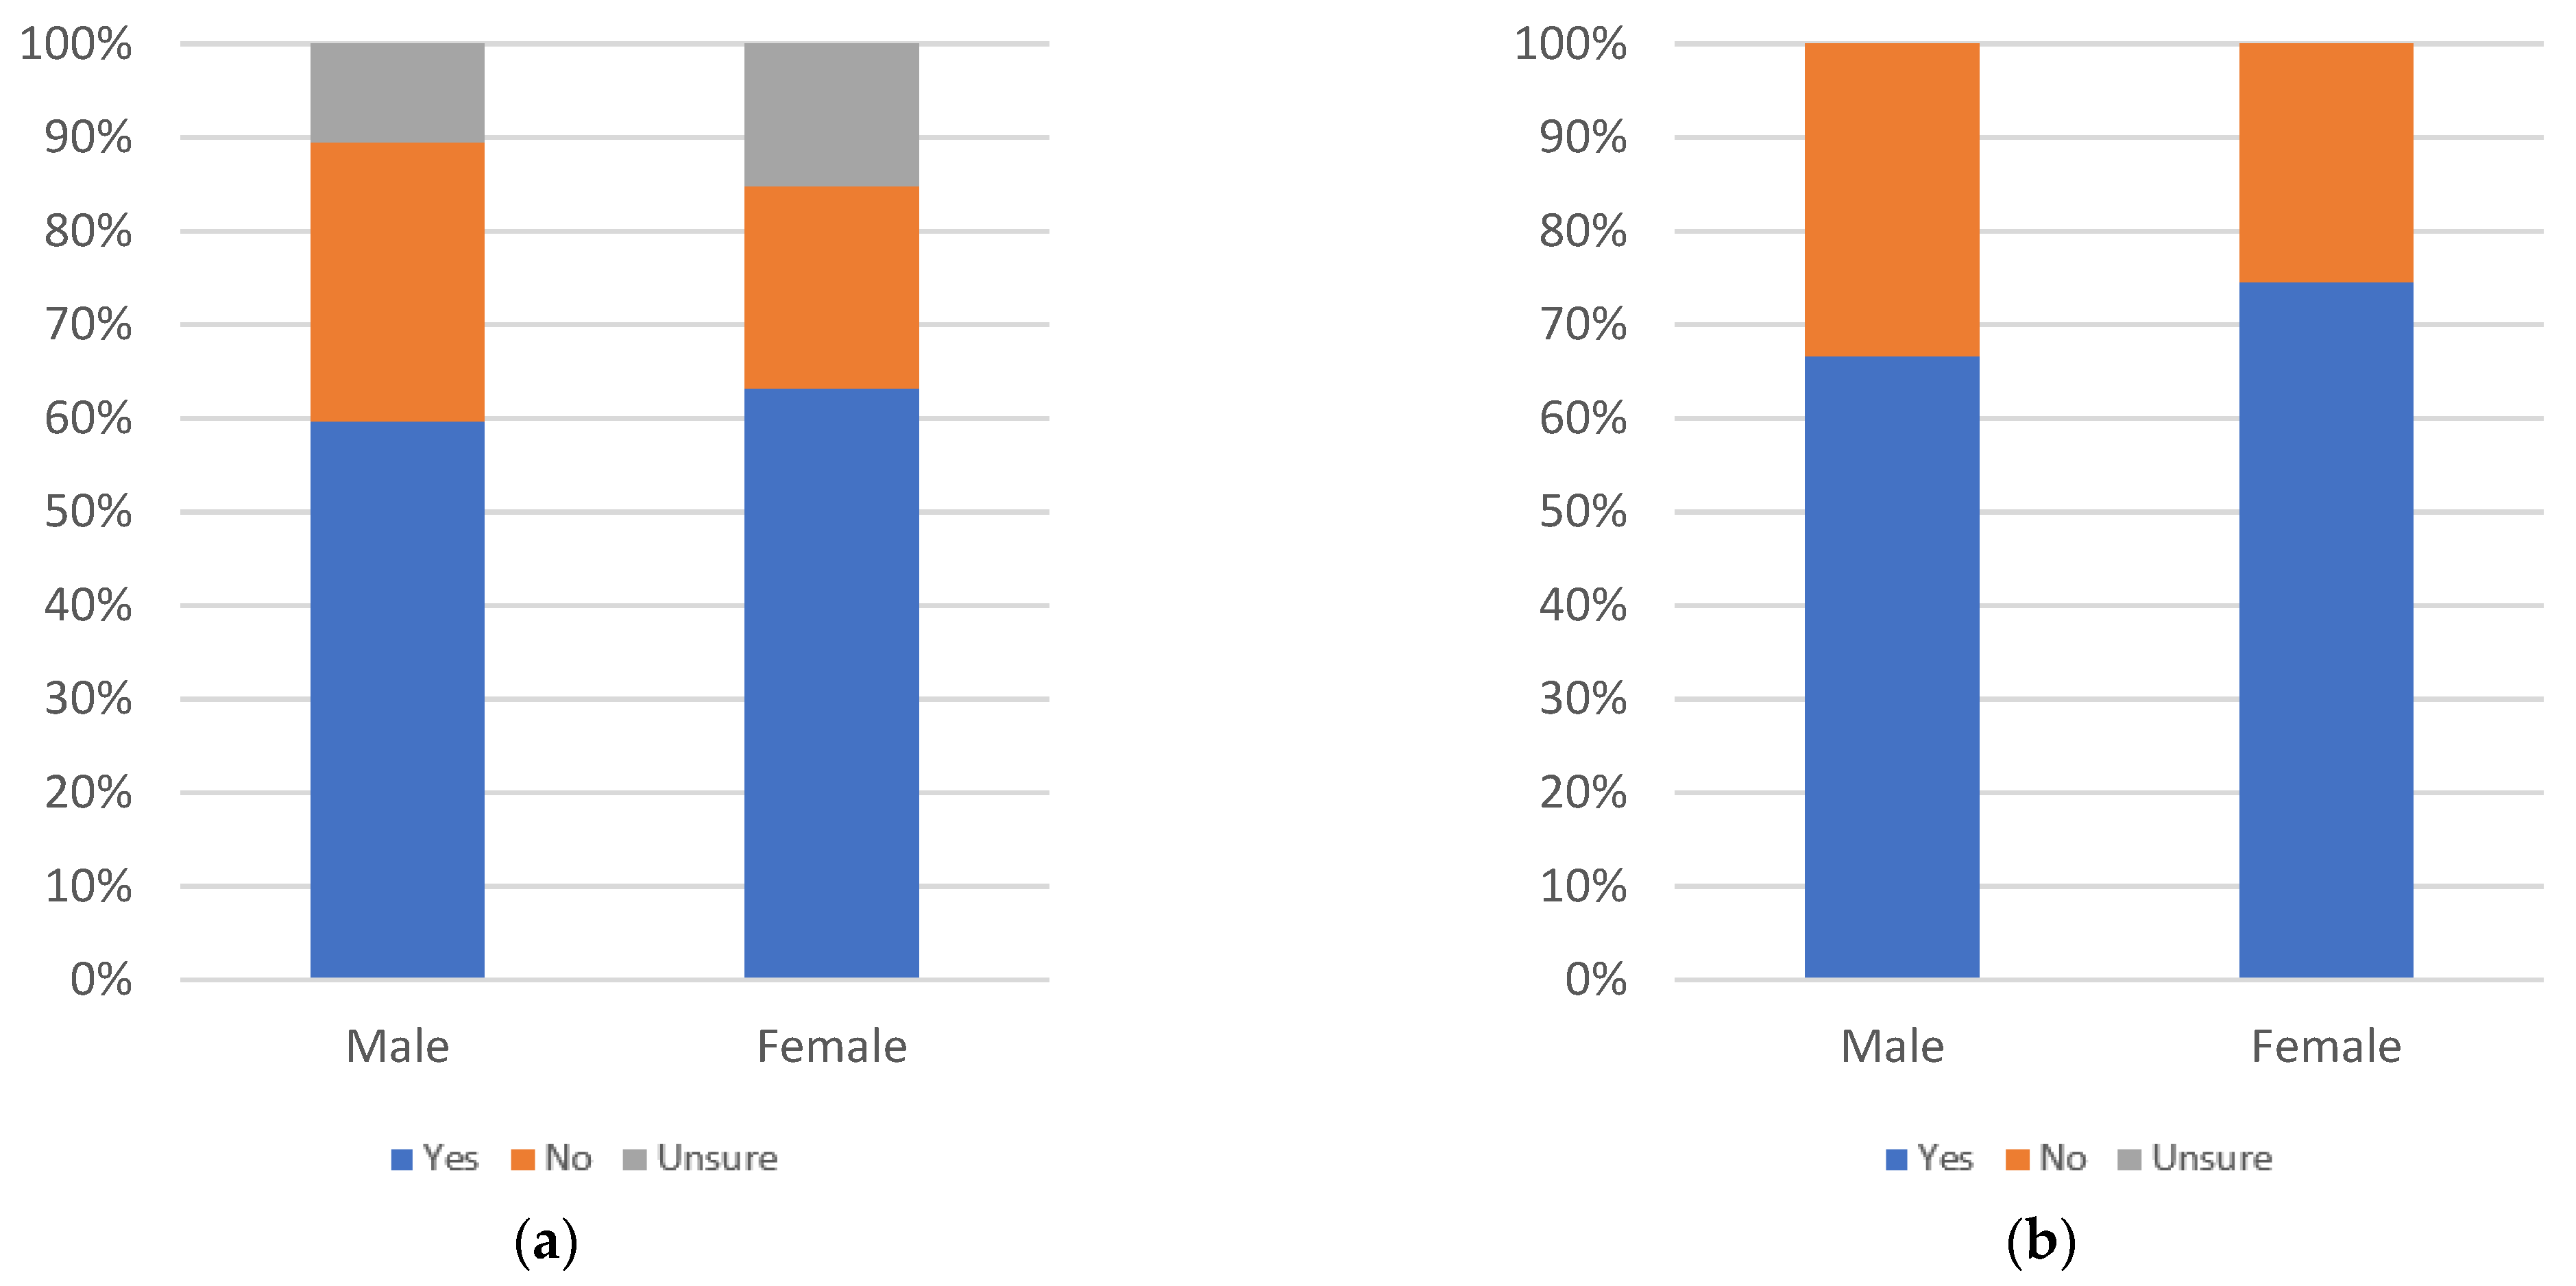
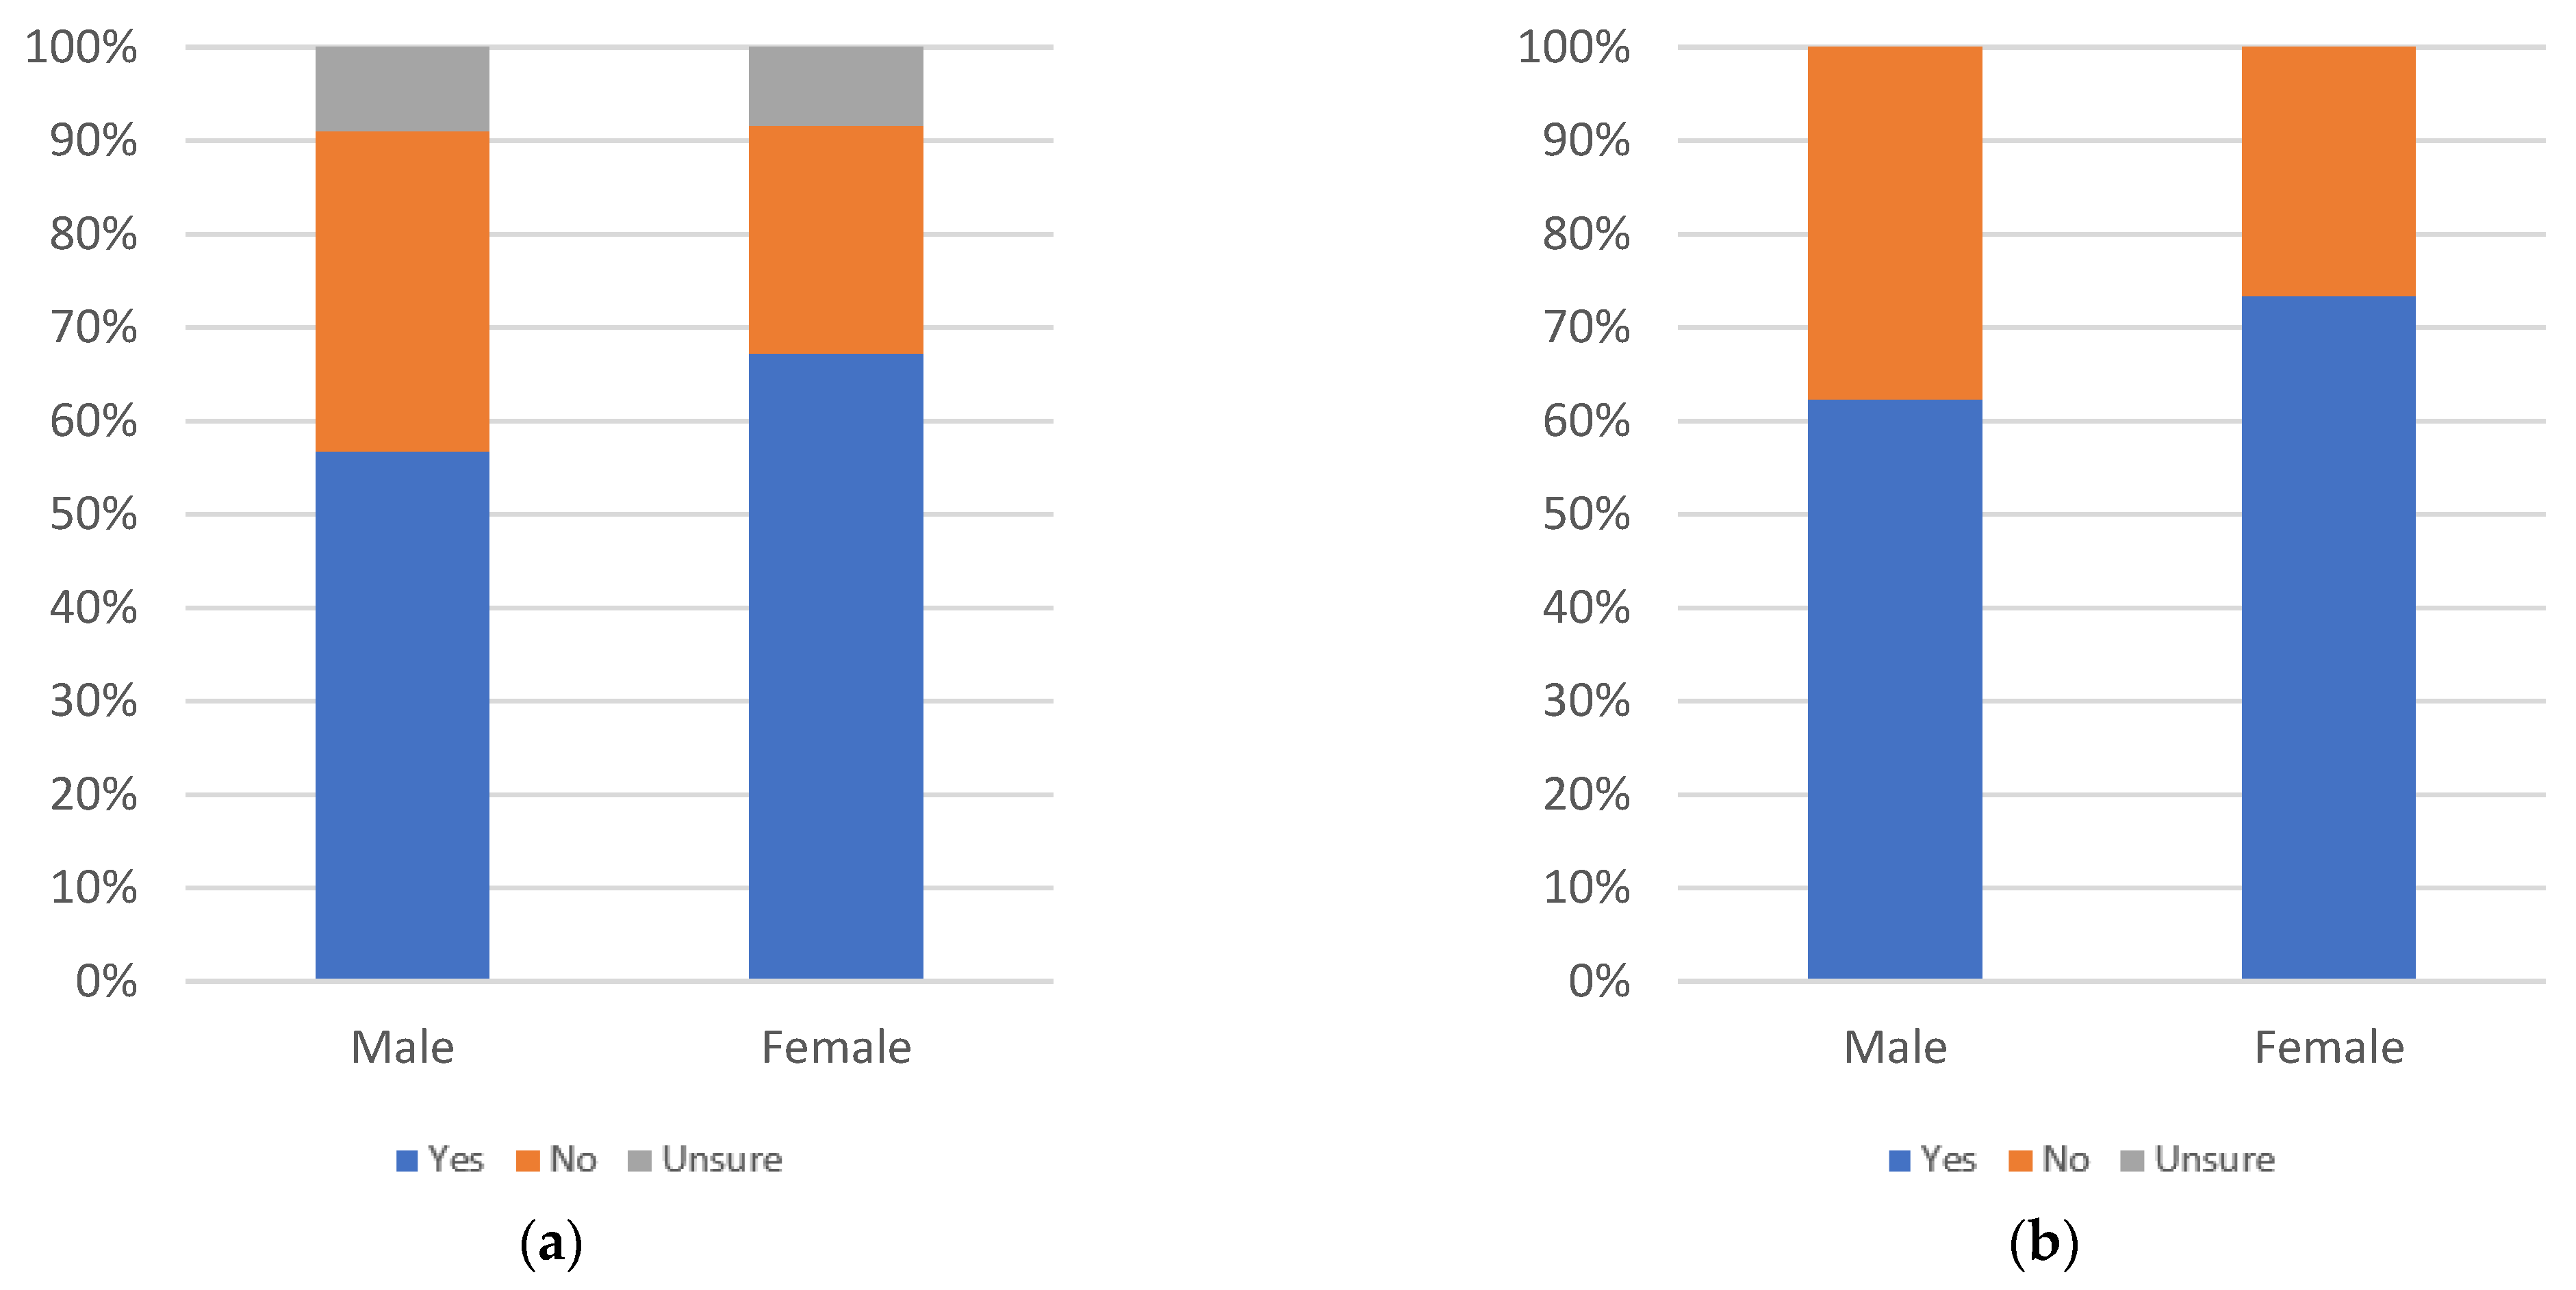
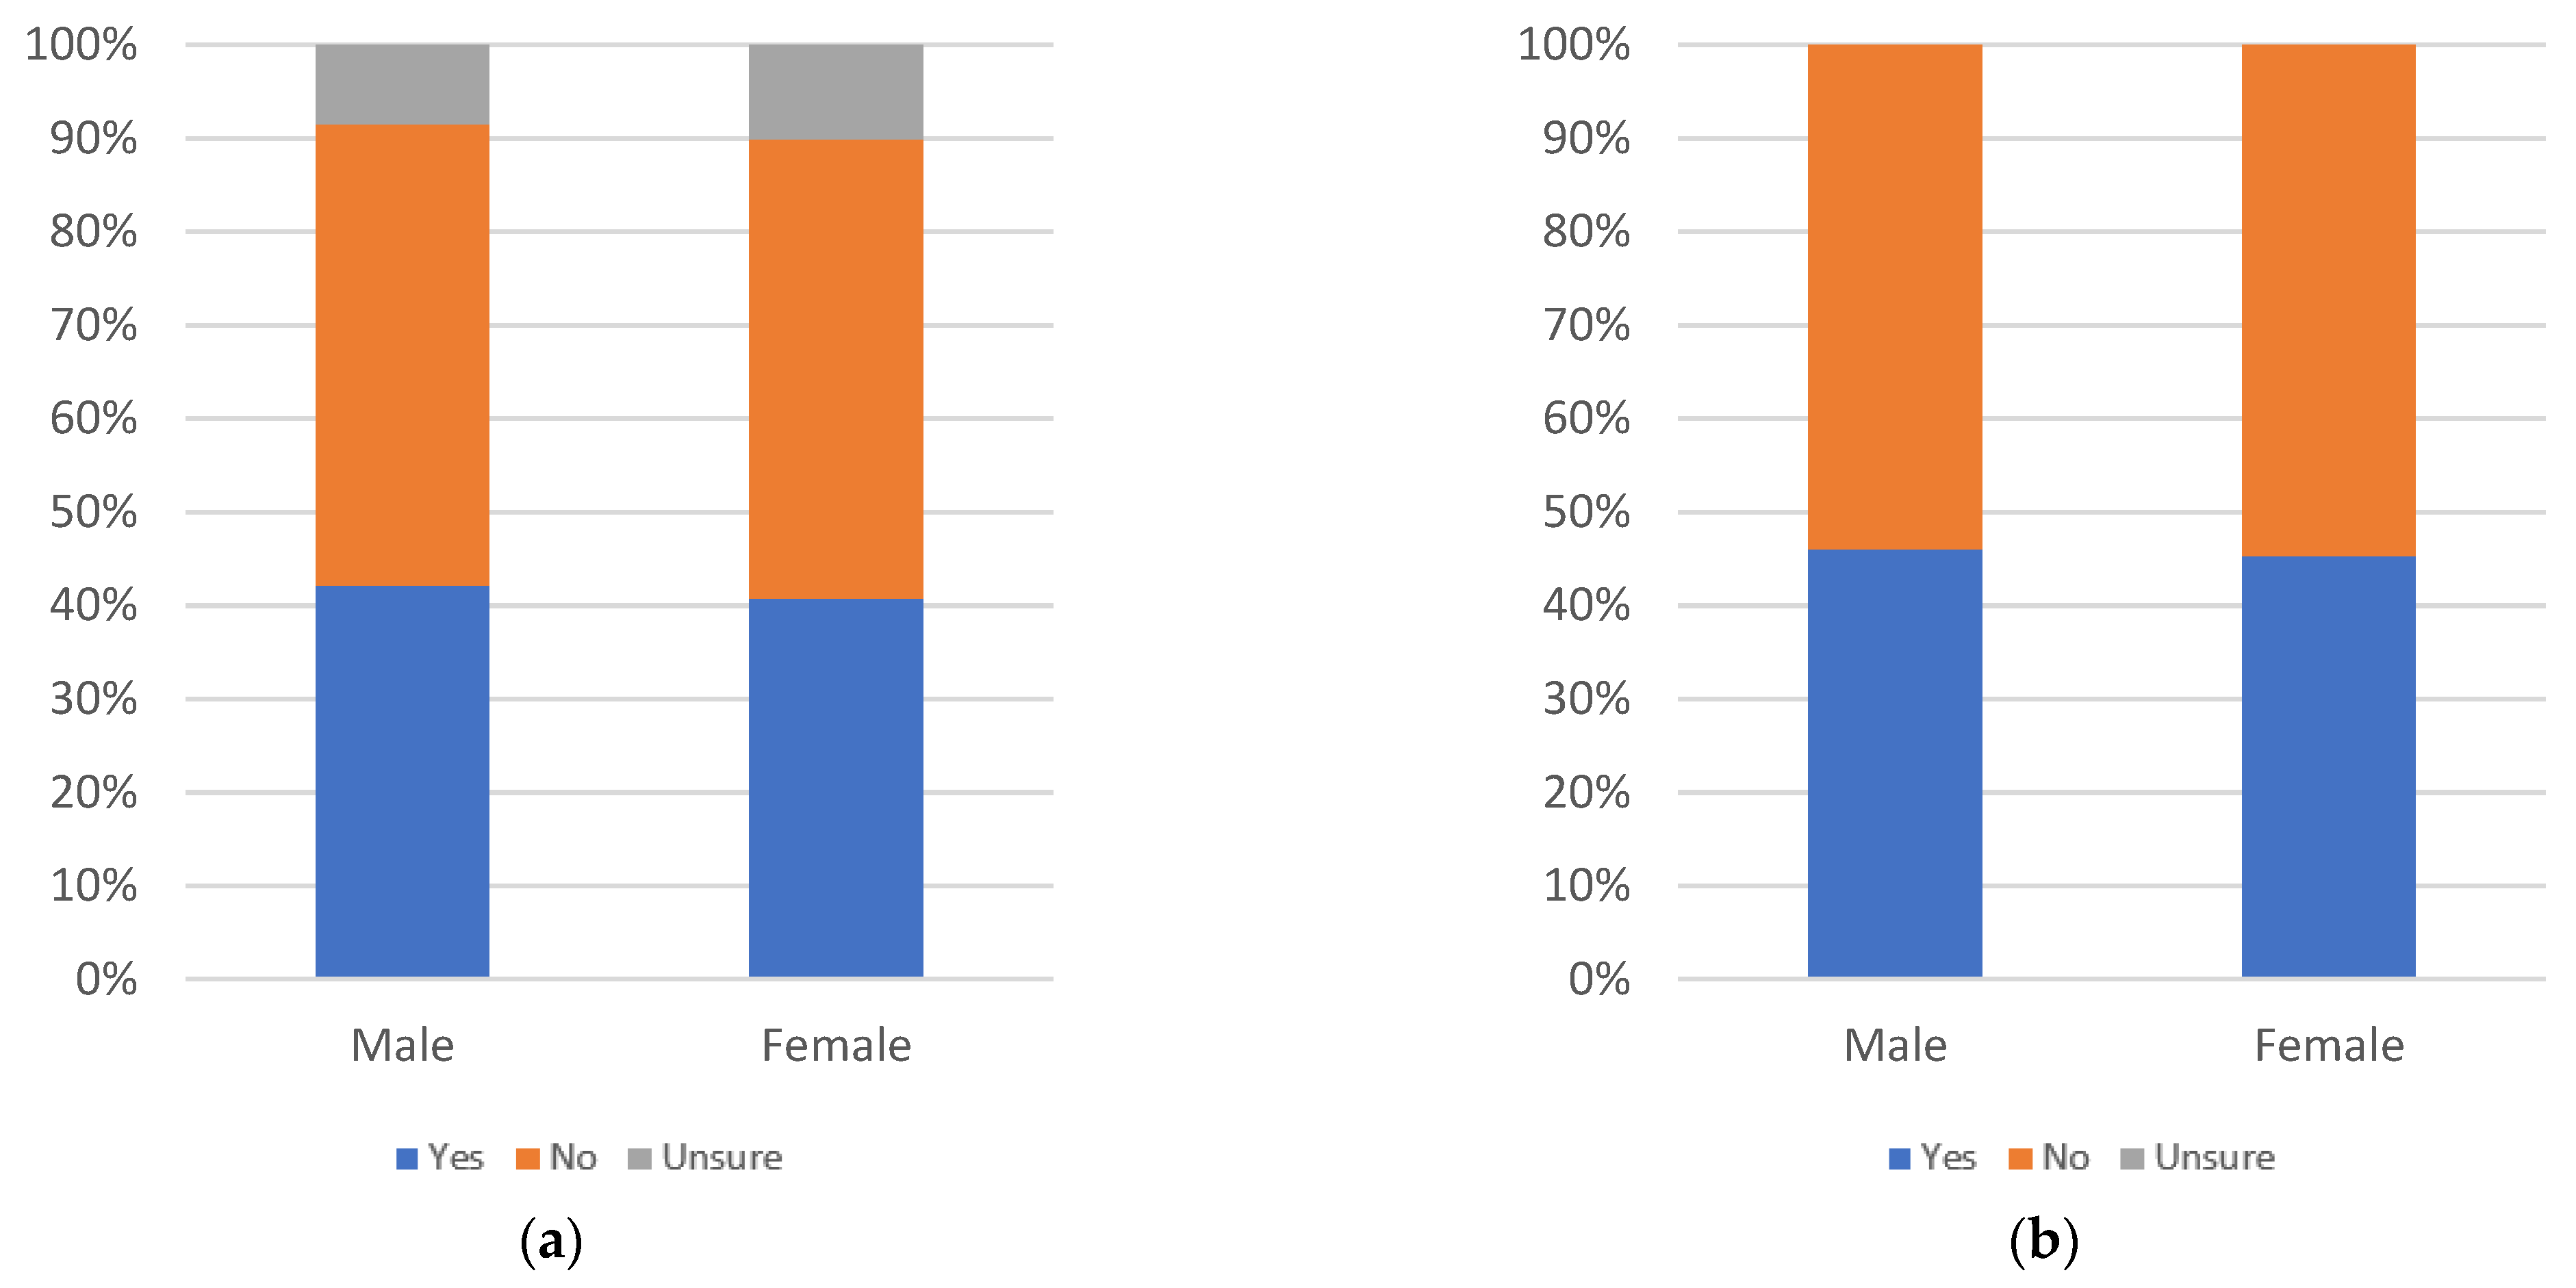
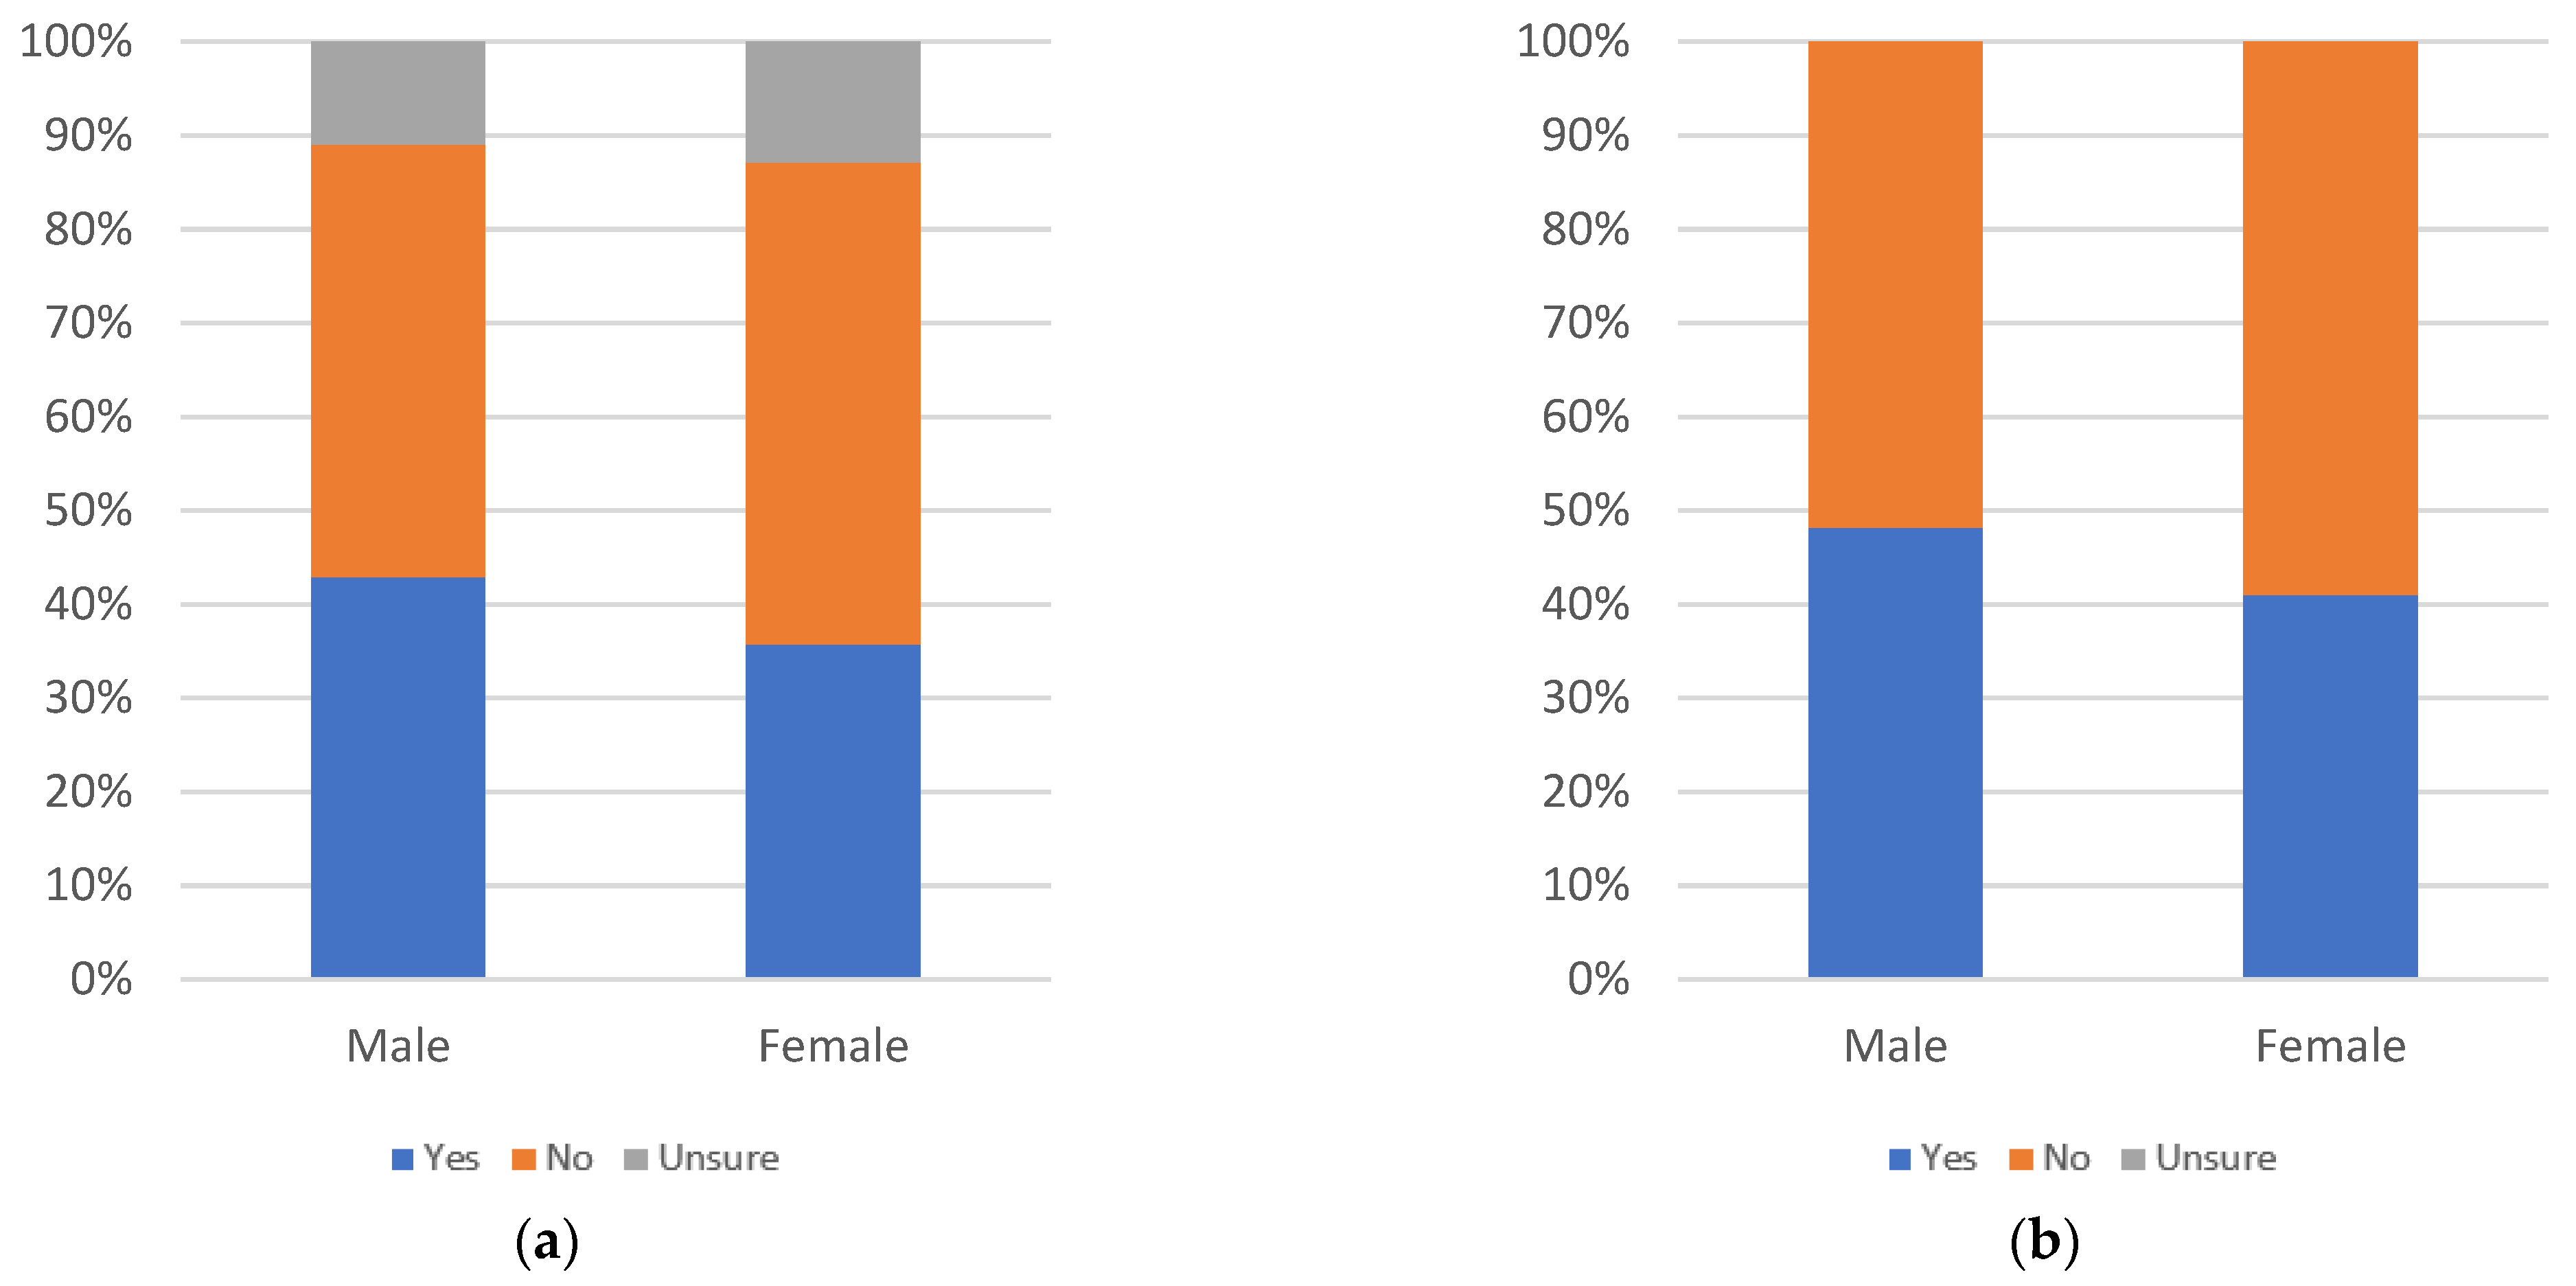
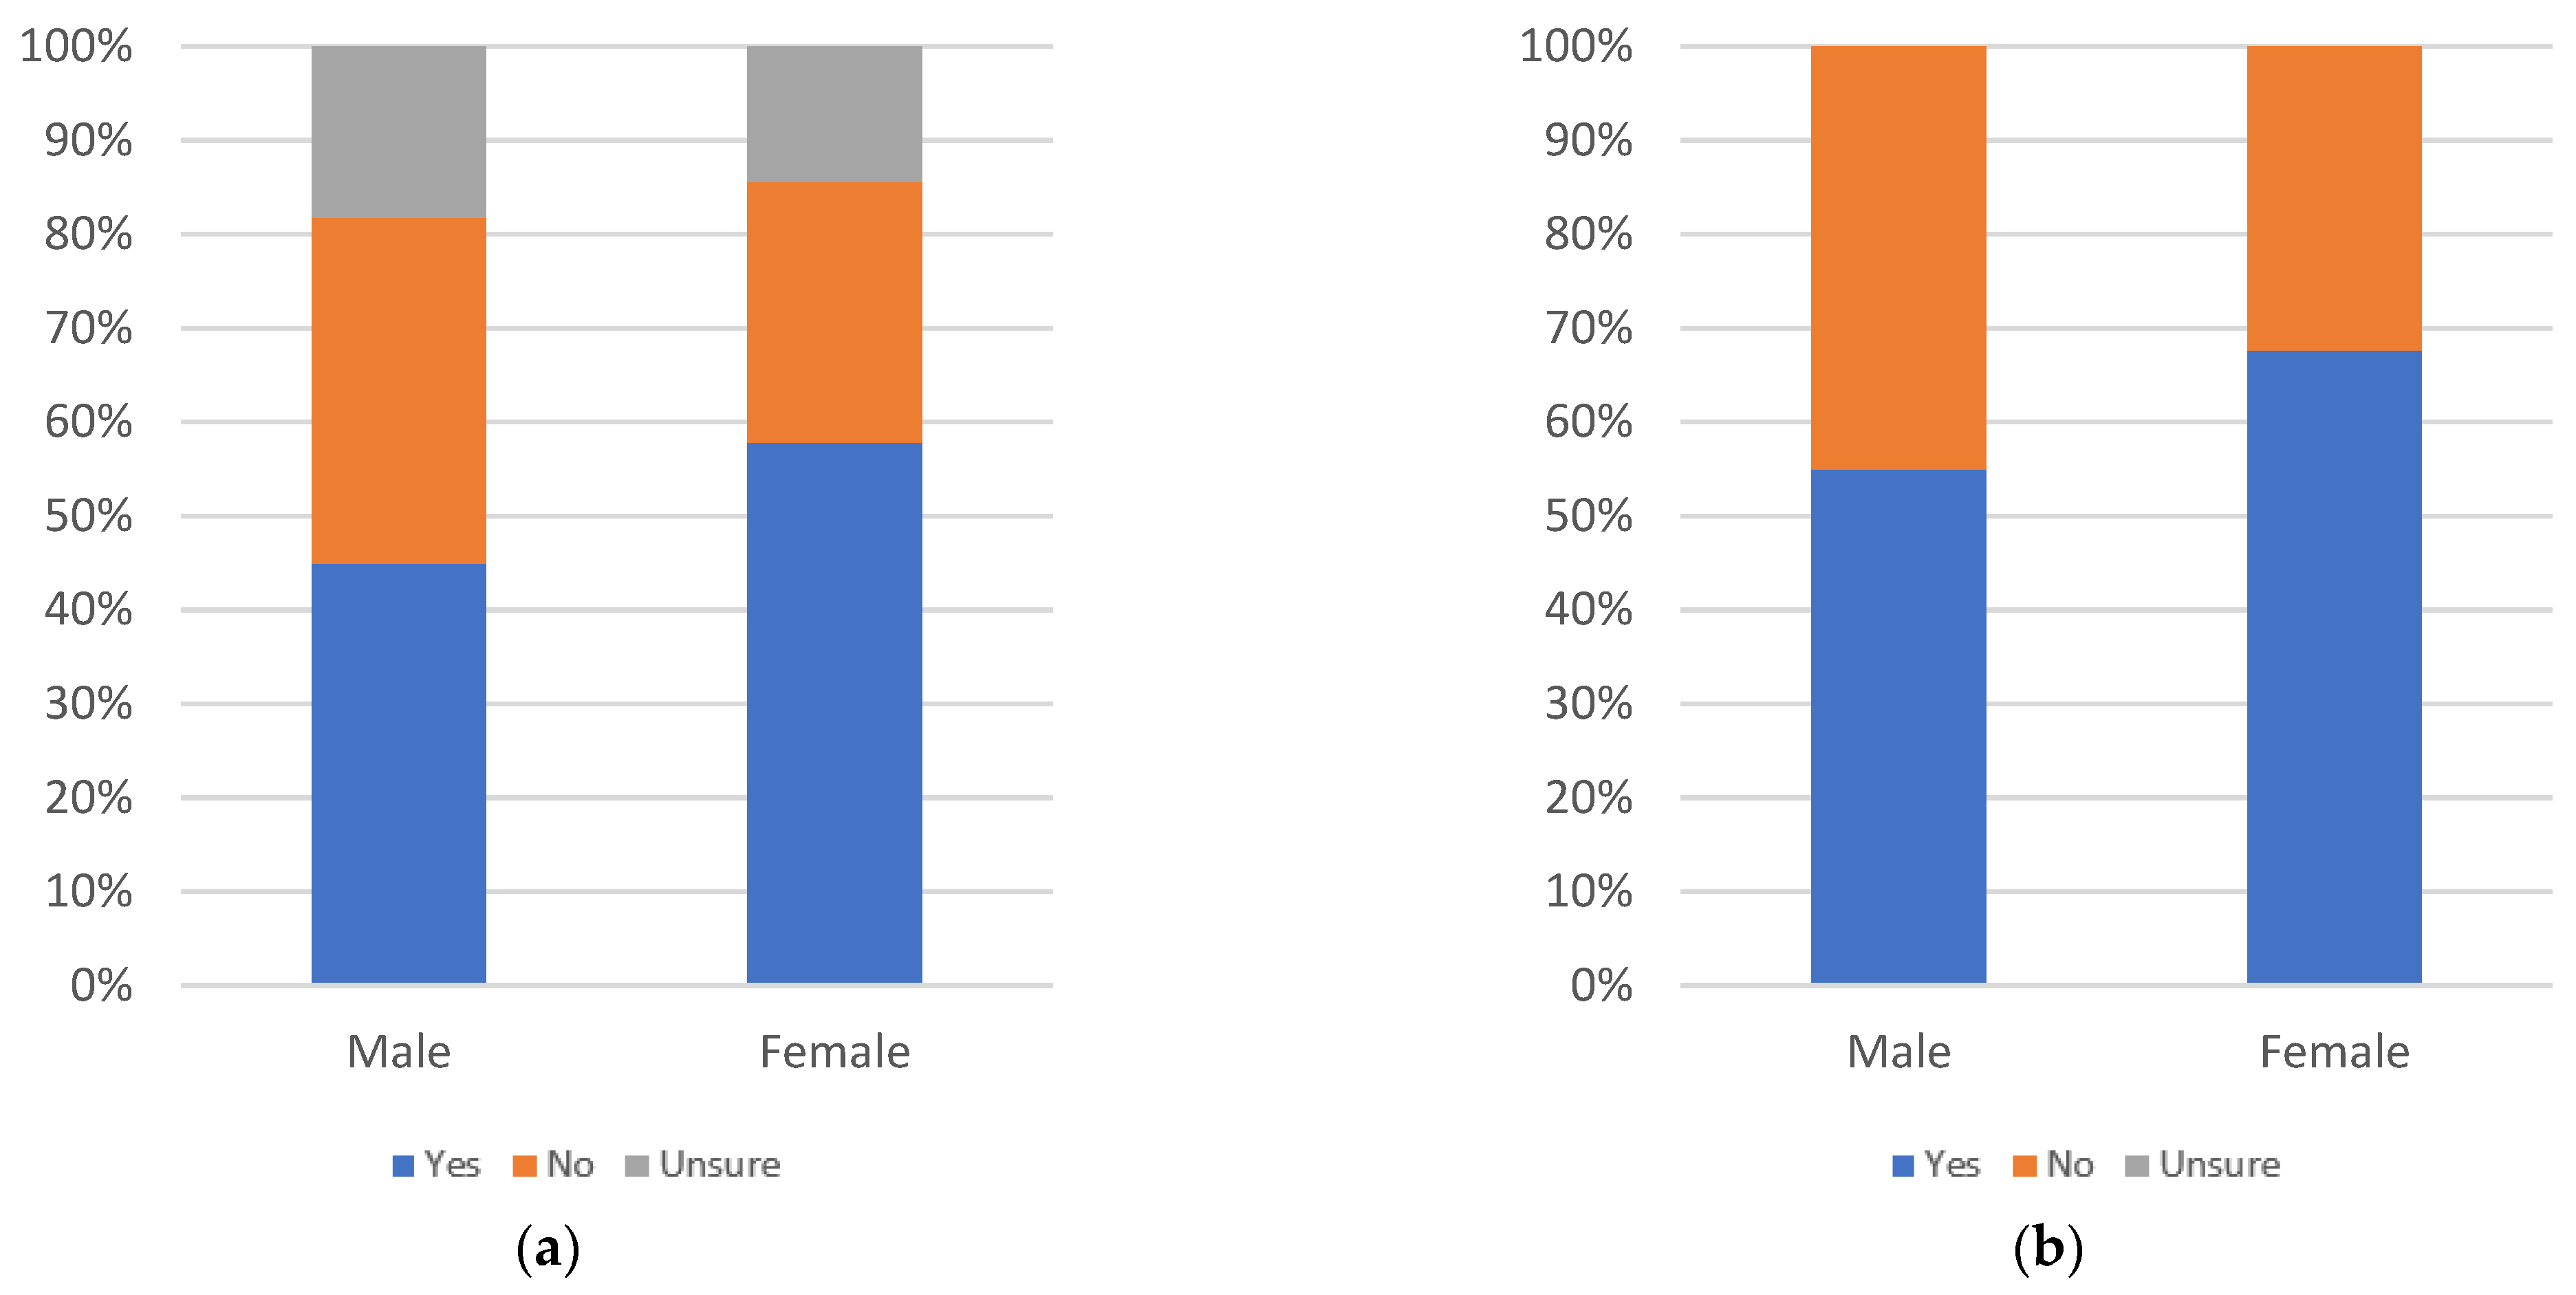
By gender, there are more yes answers among females than male respondents and nearly equal levels of uncertainty. Both groups have at least 50% of respondents answering yes, even when uncertainty is factored in.
Figure 8, Figure 9 and 
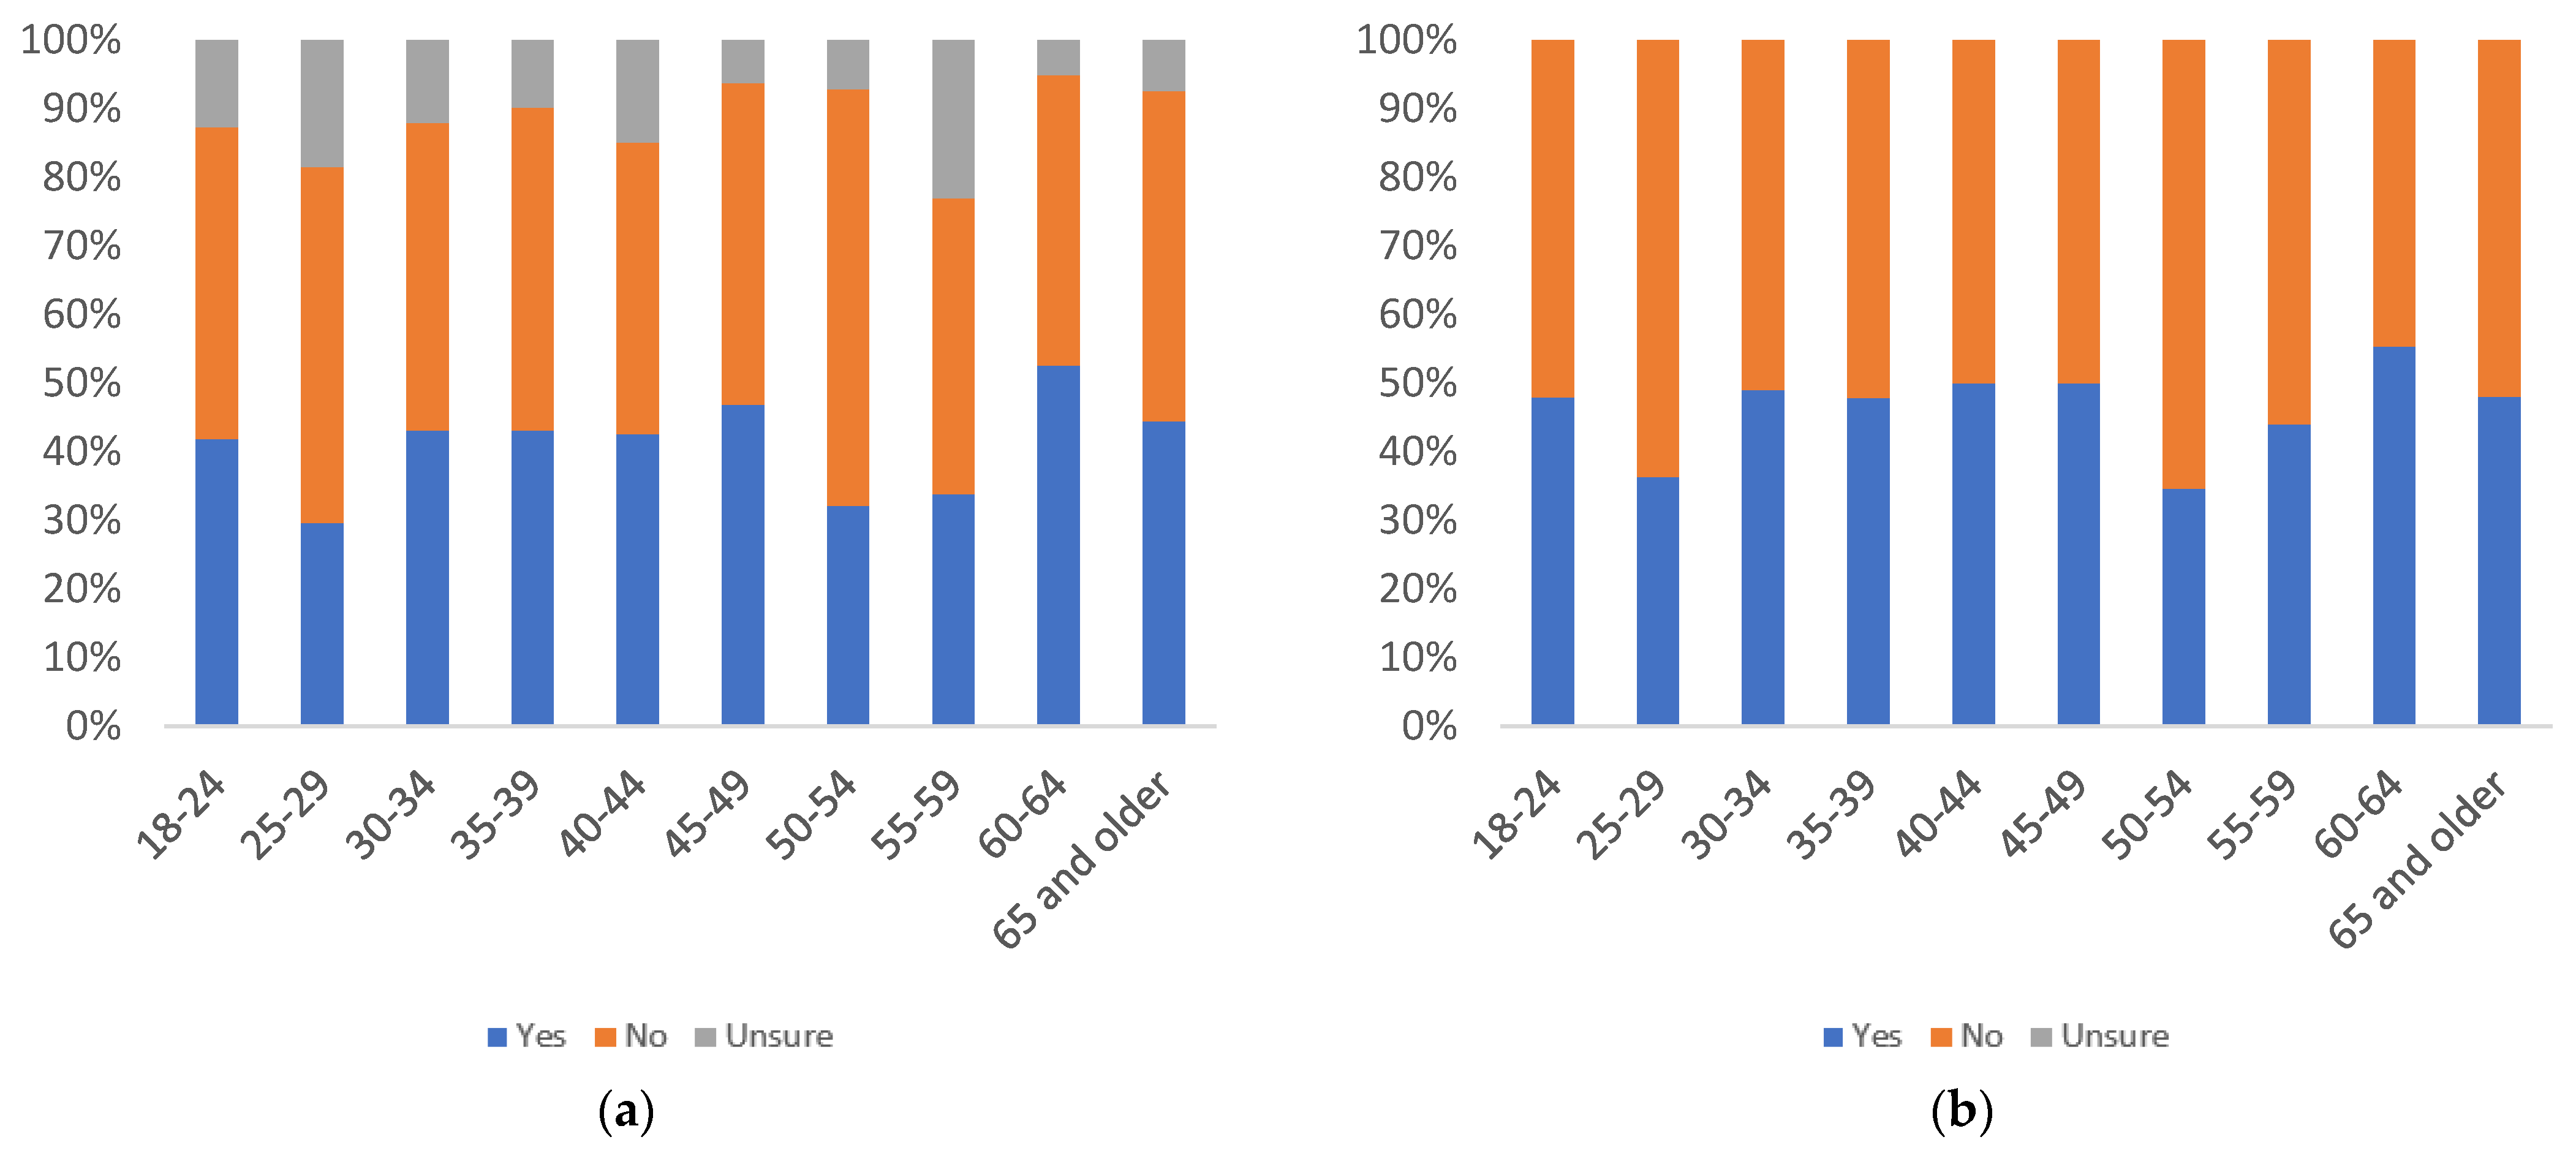
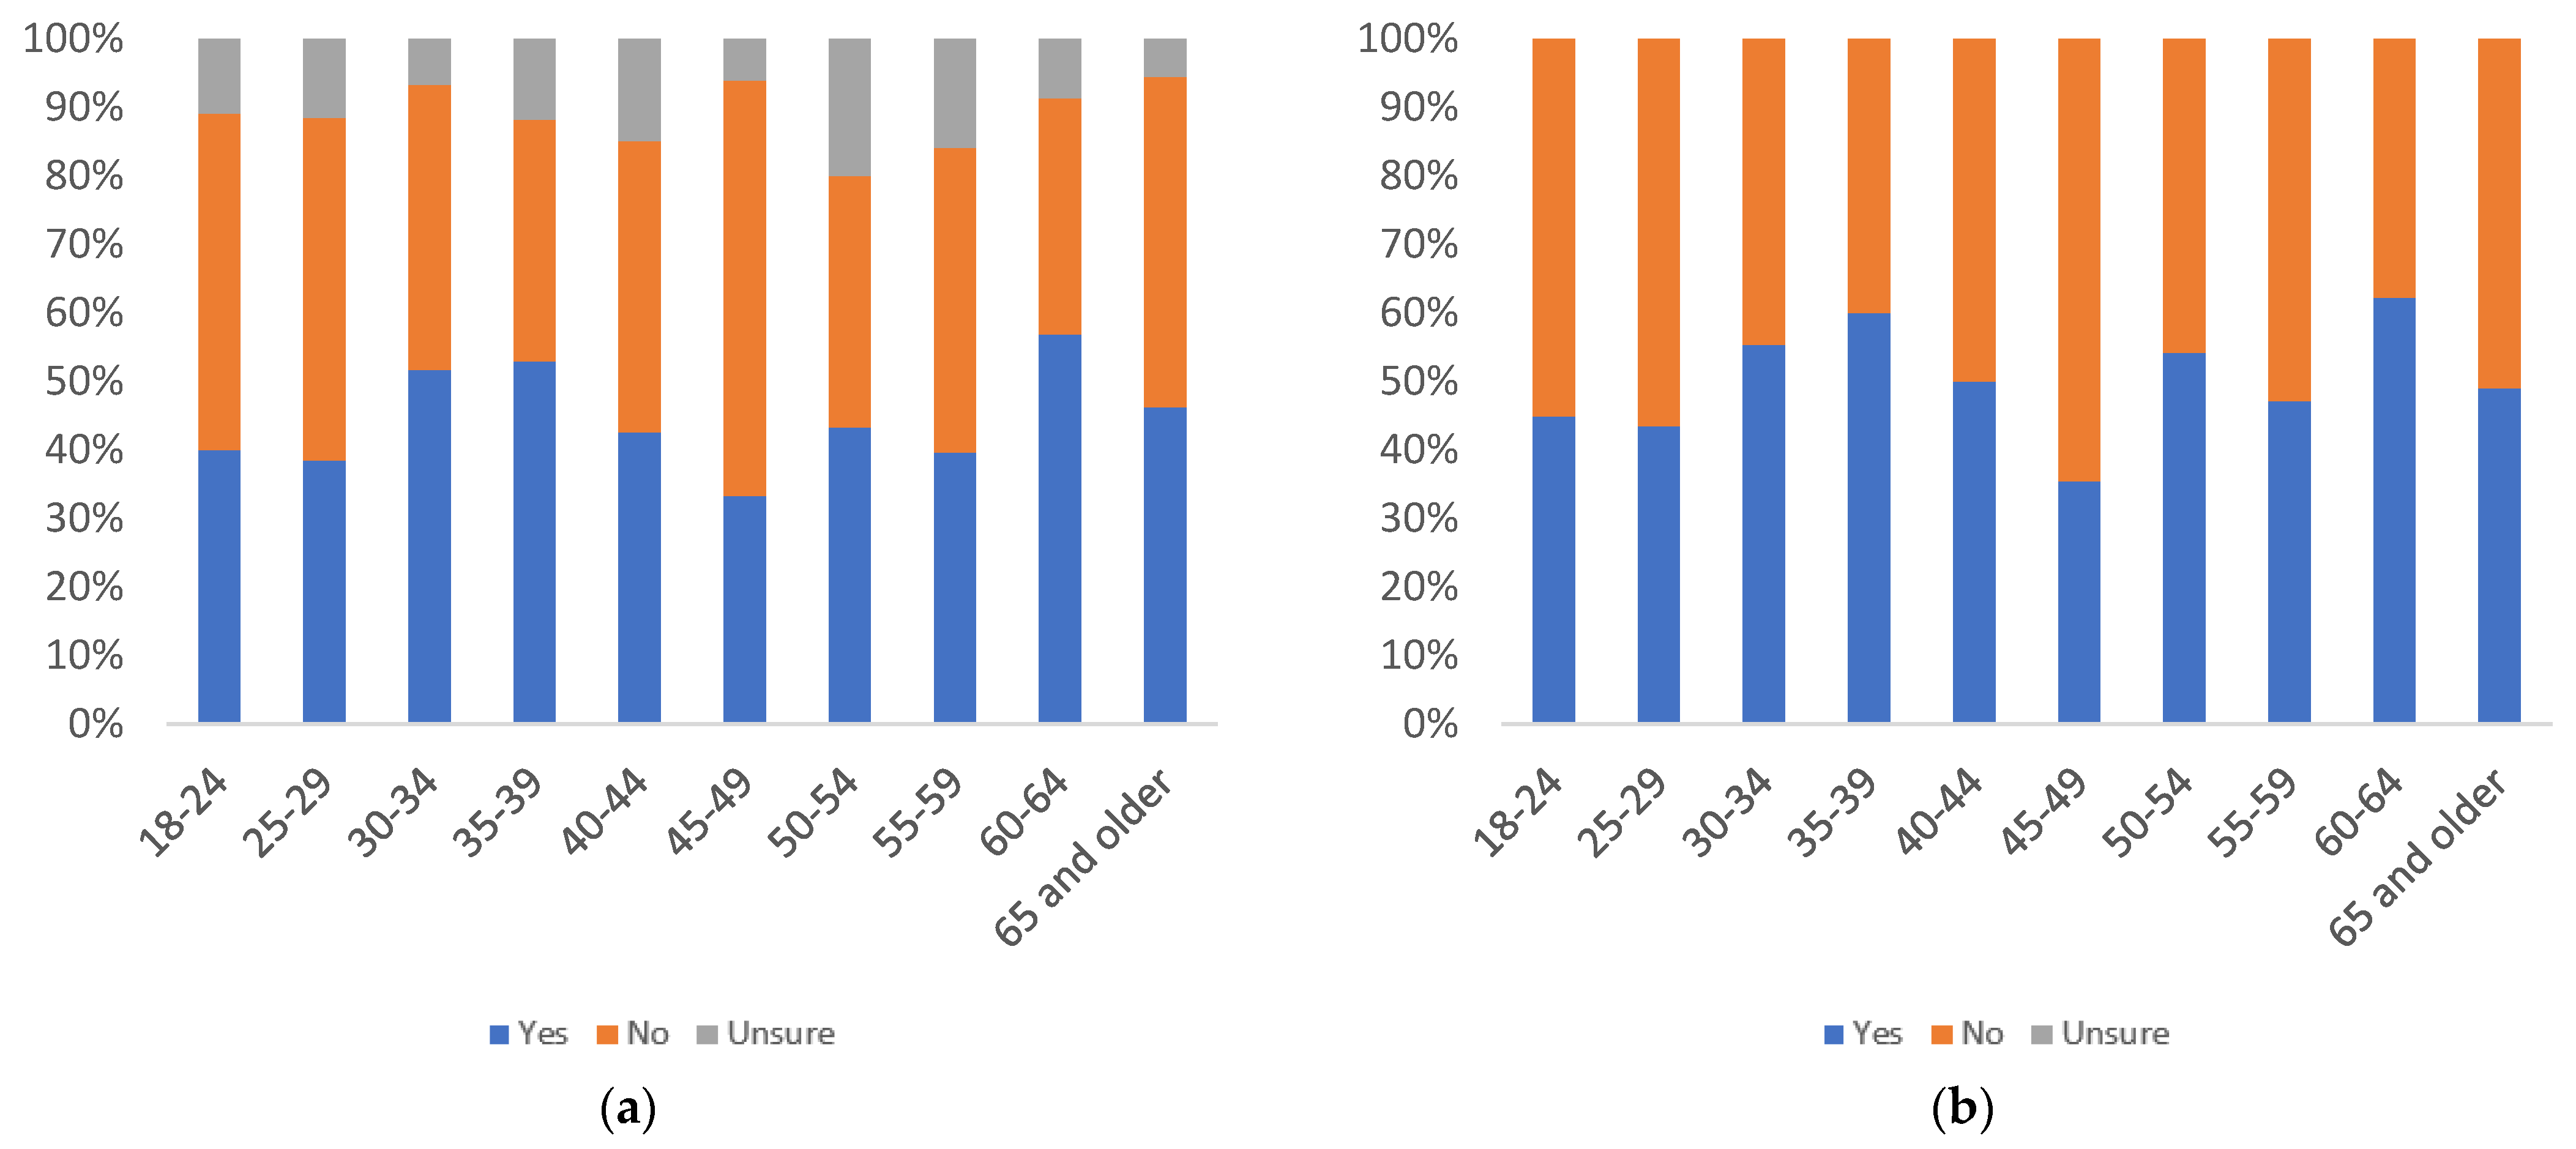
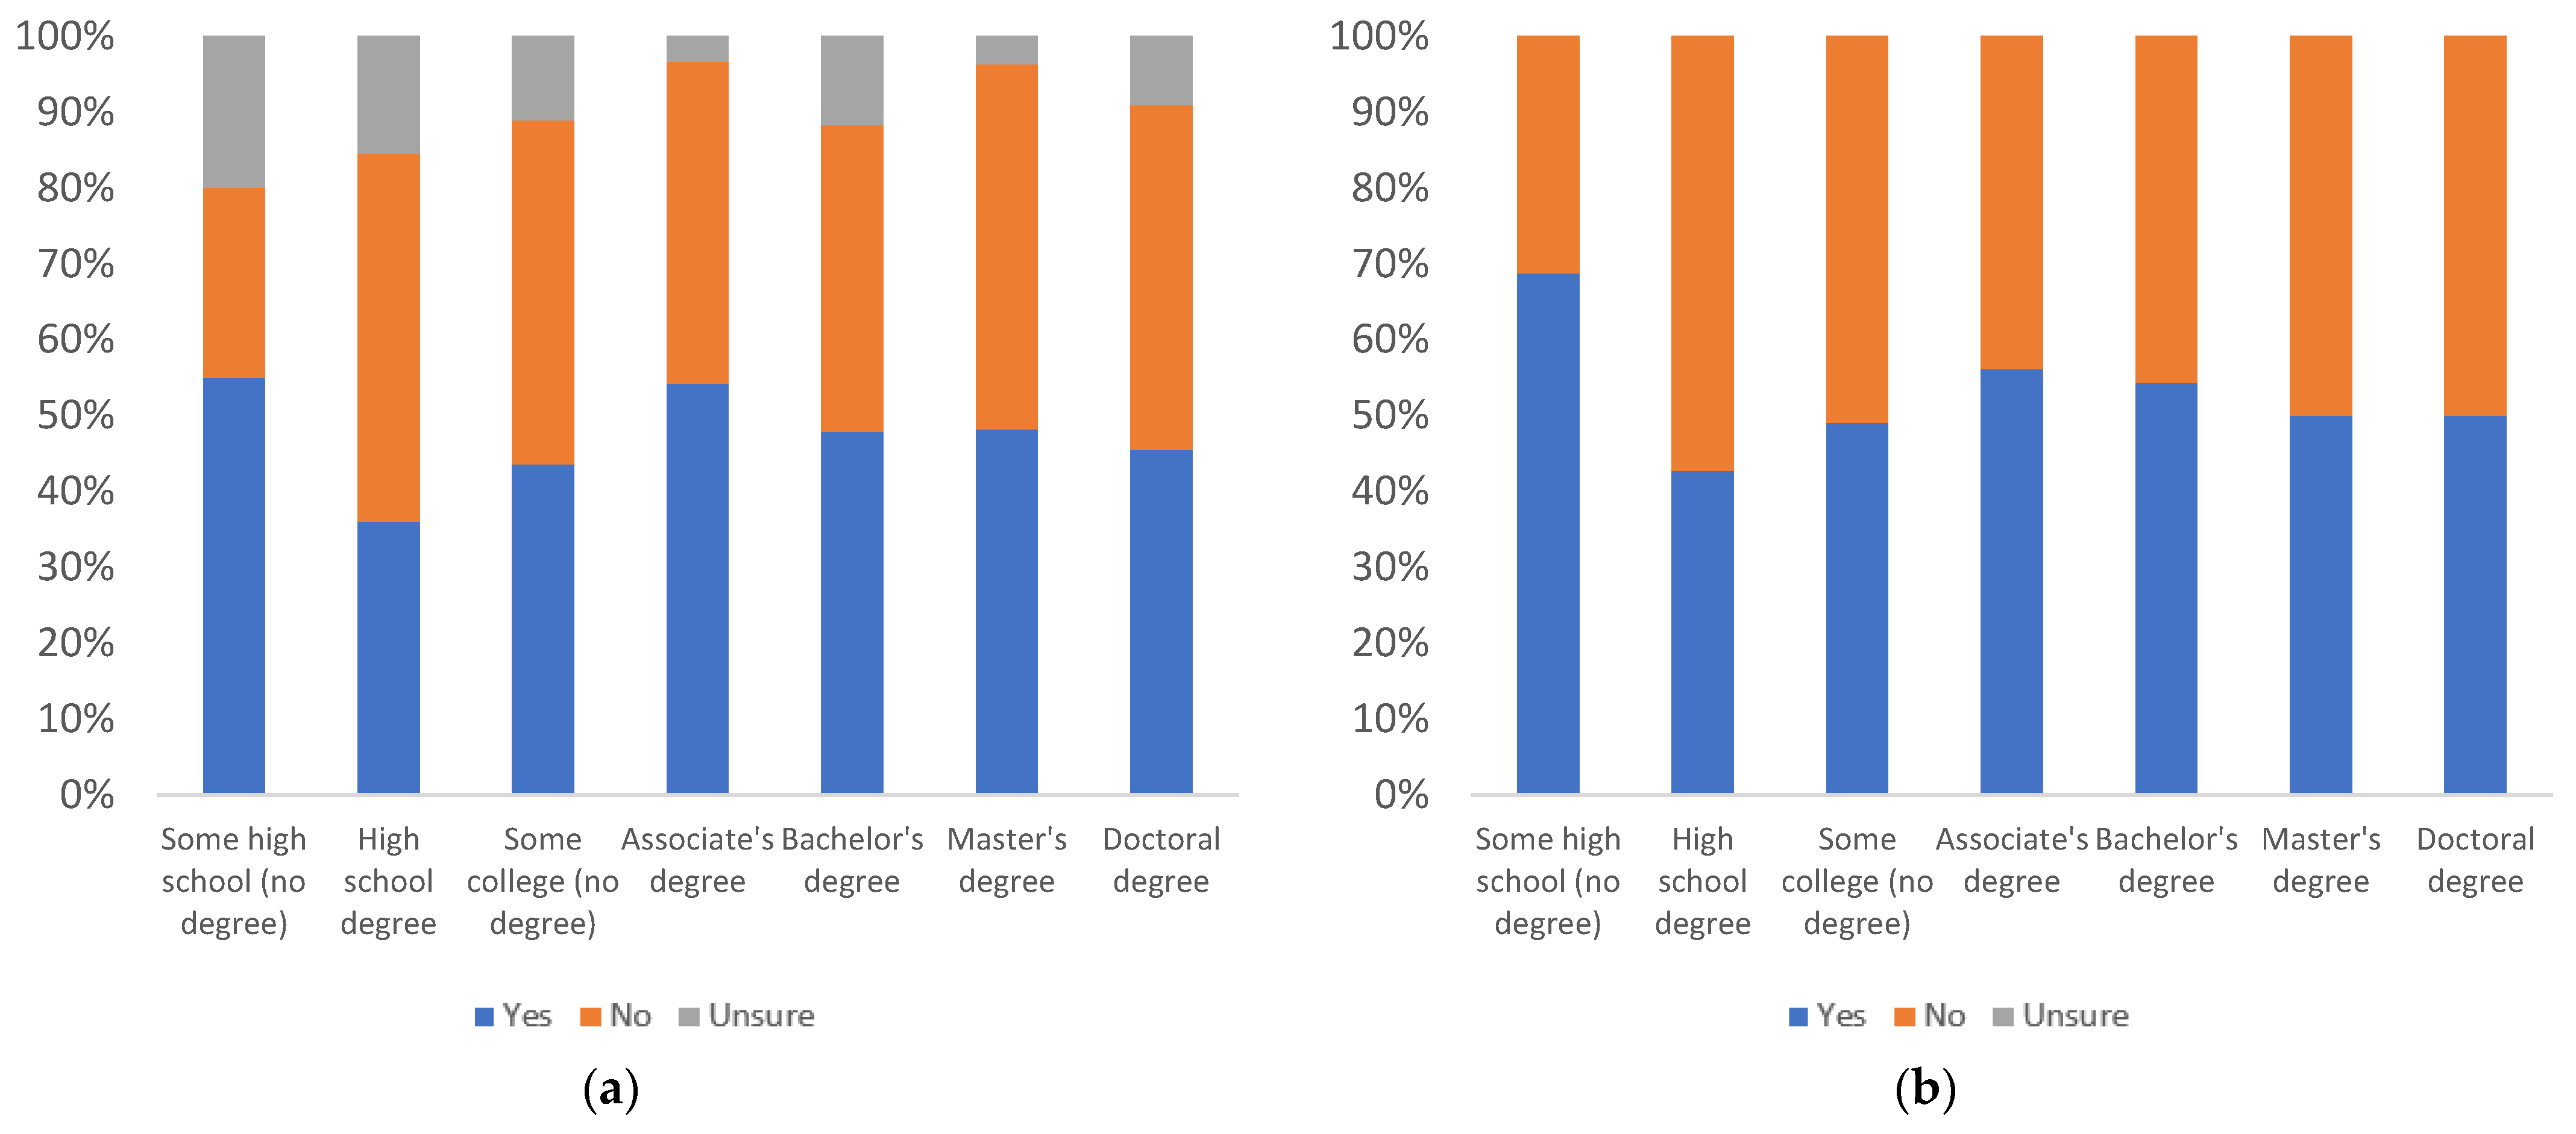
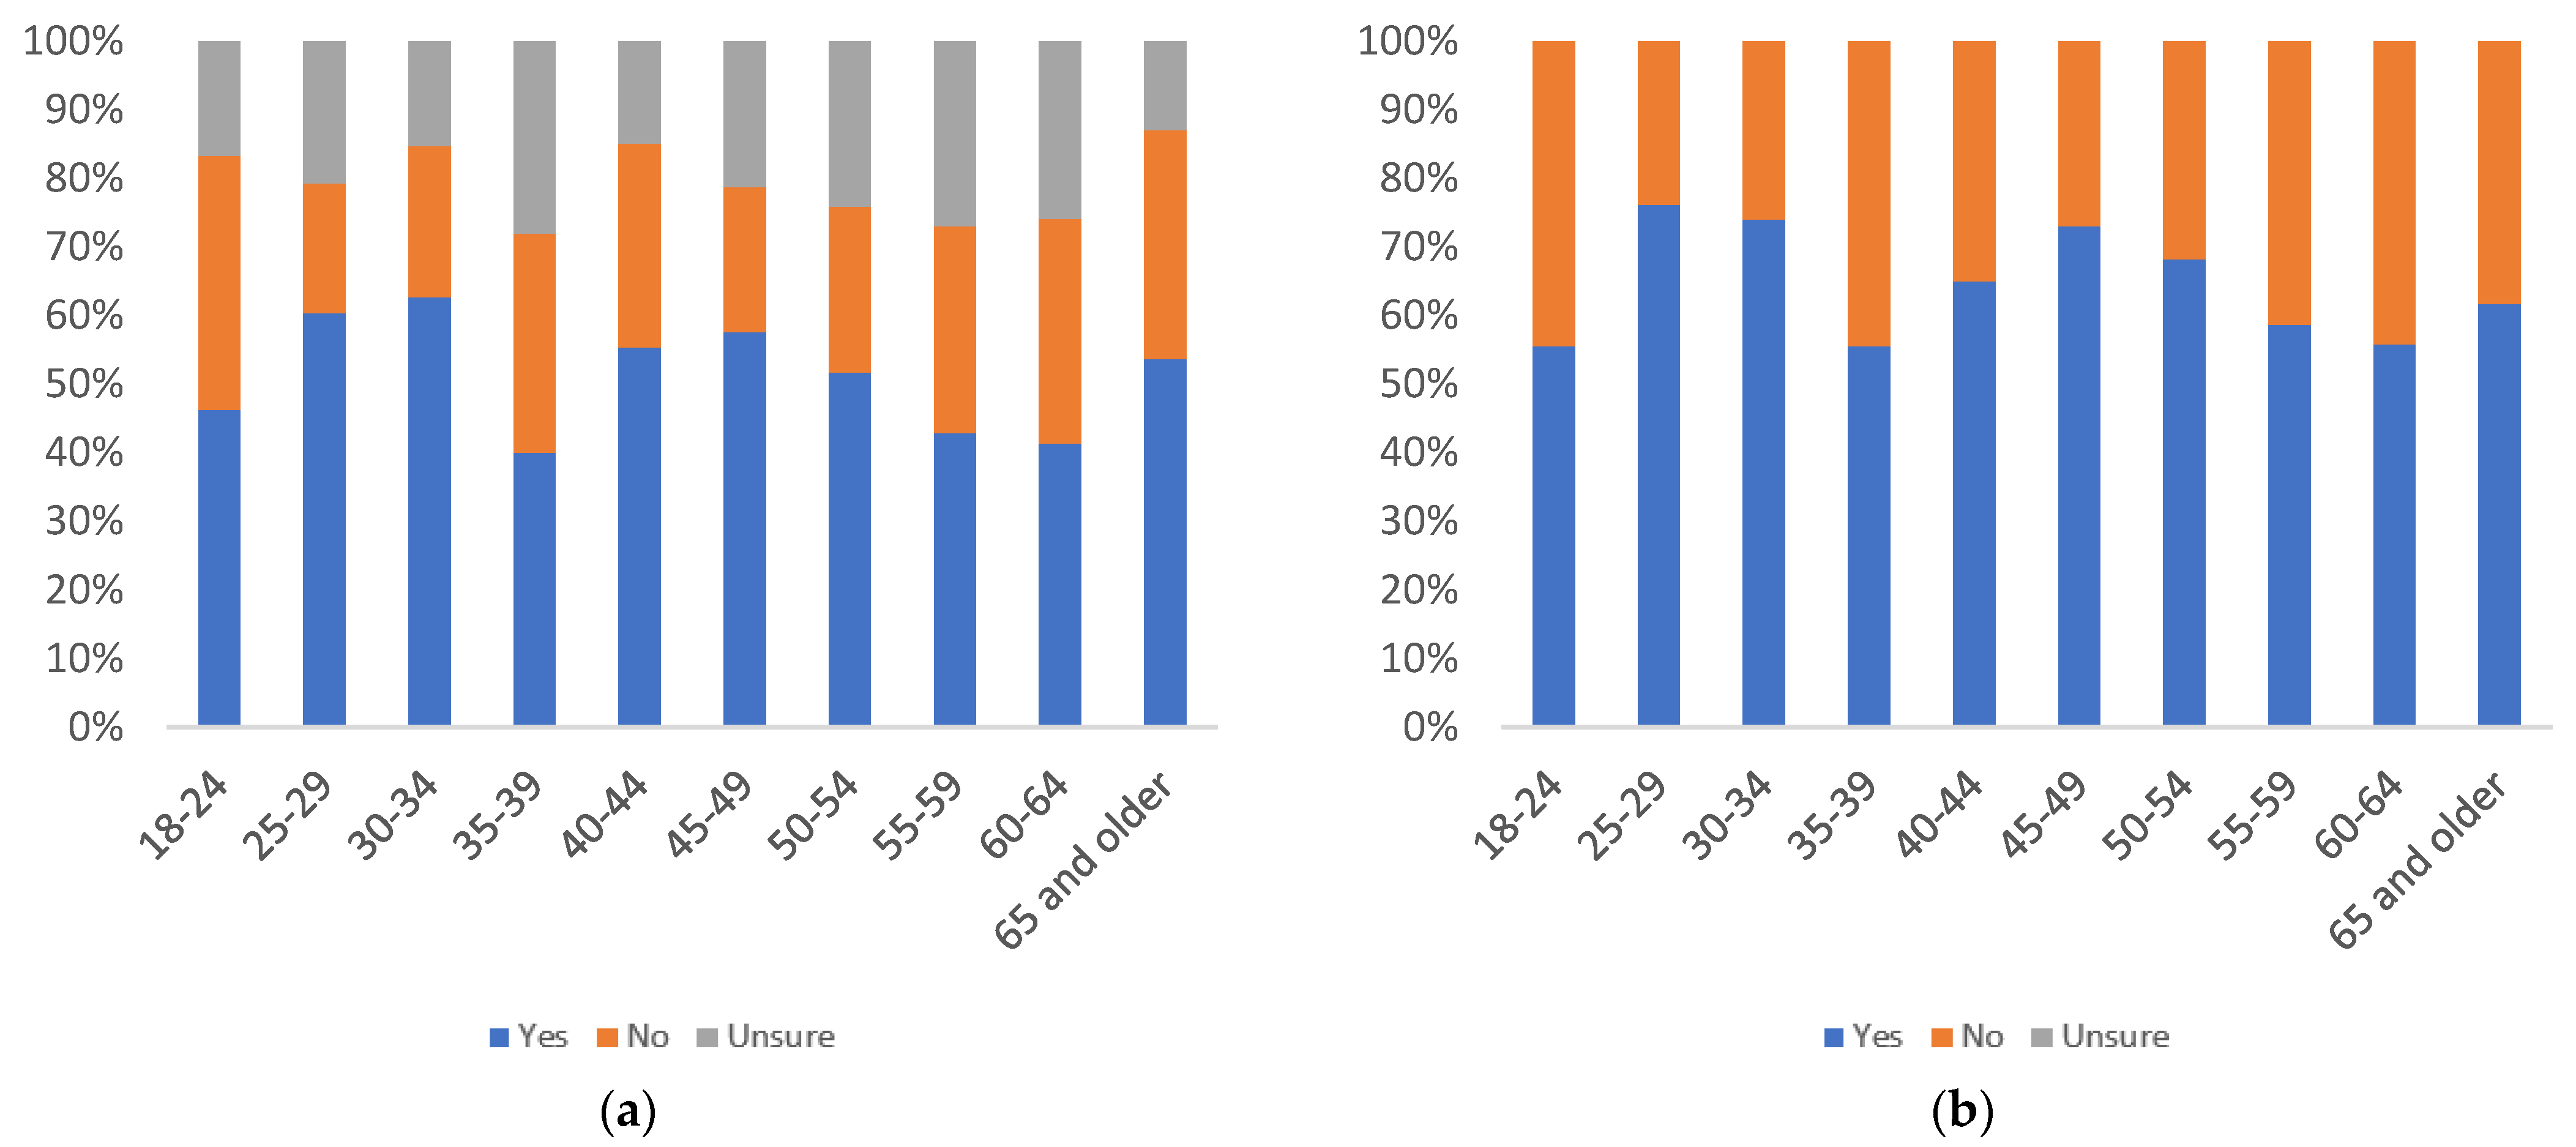
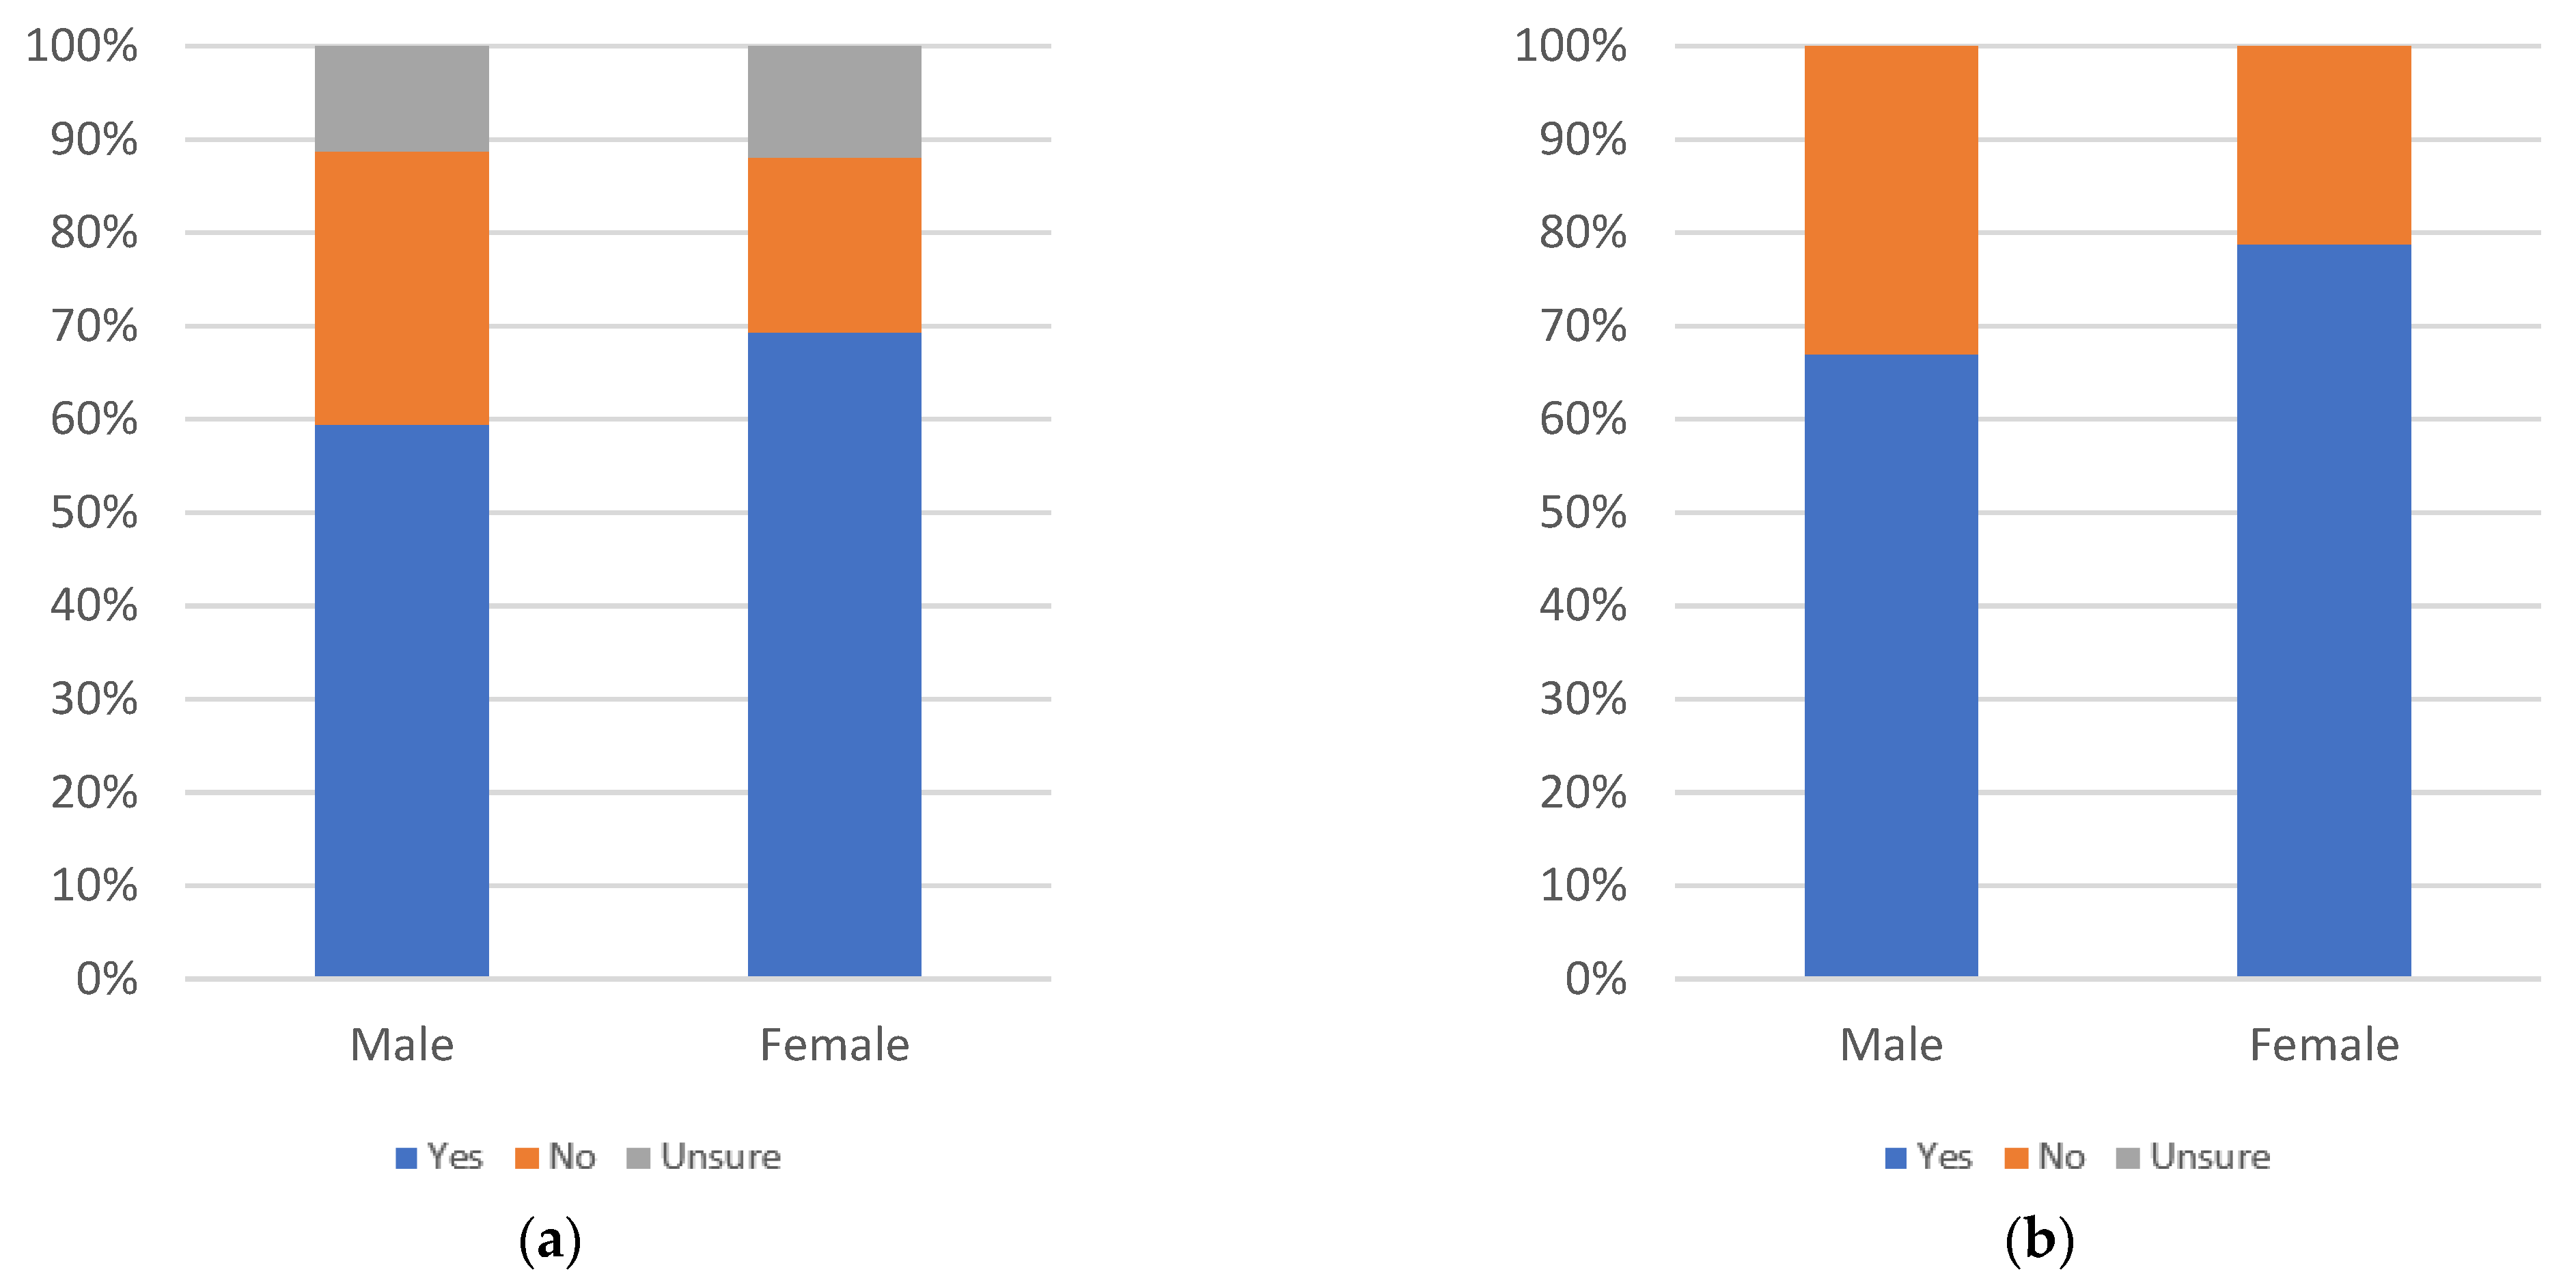
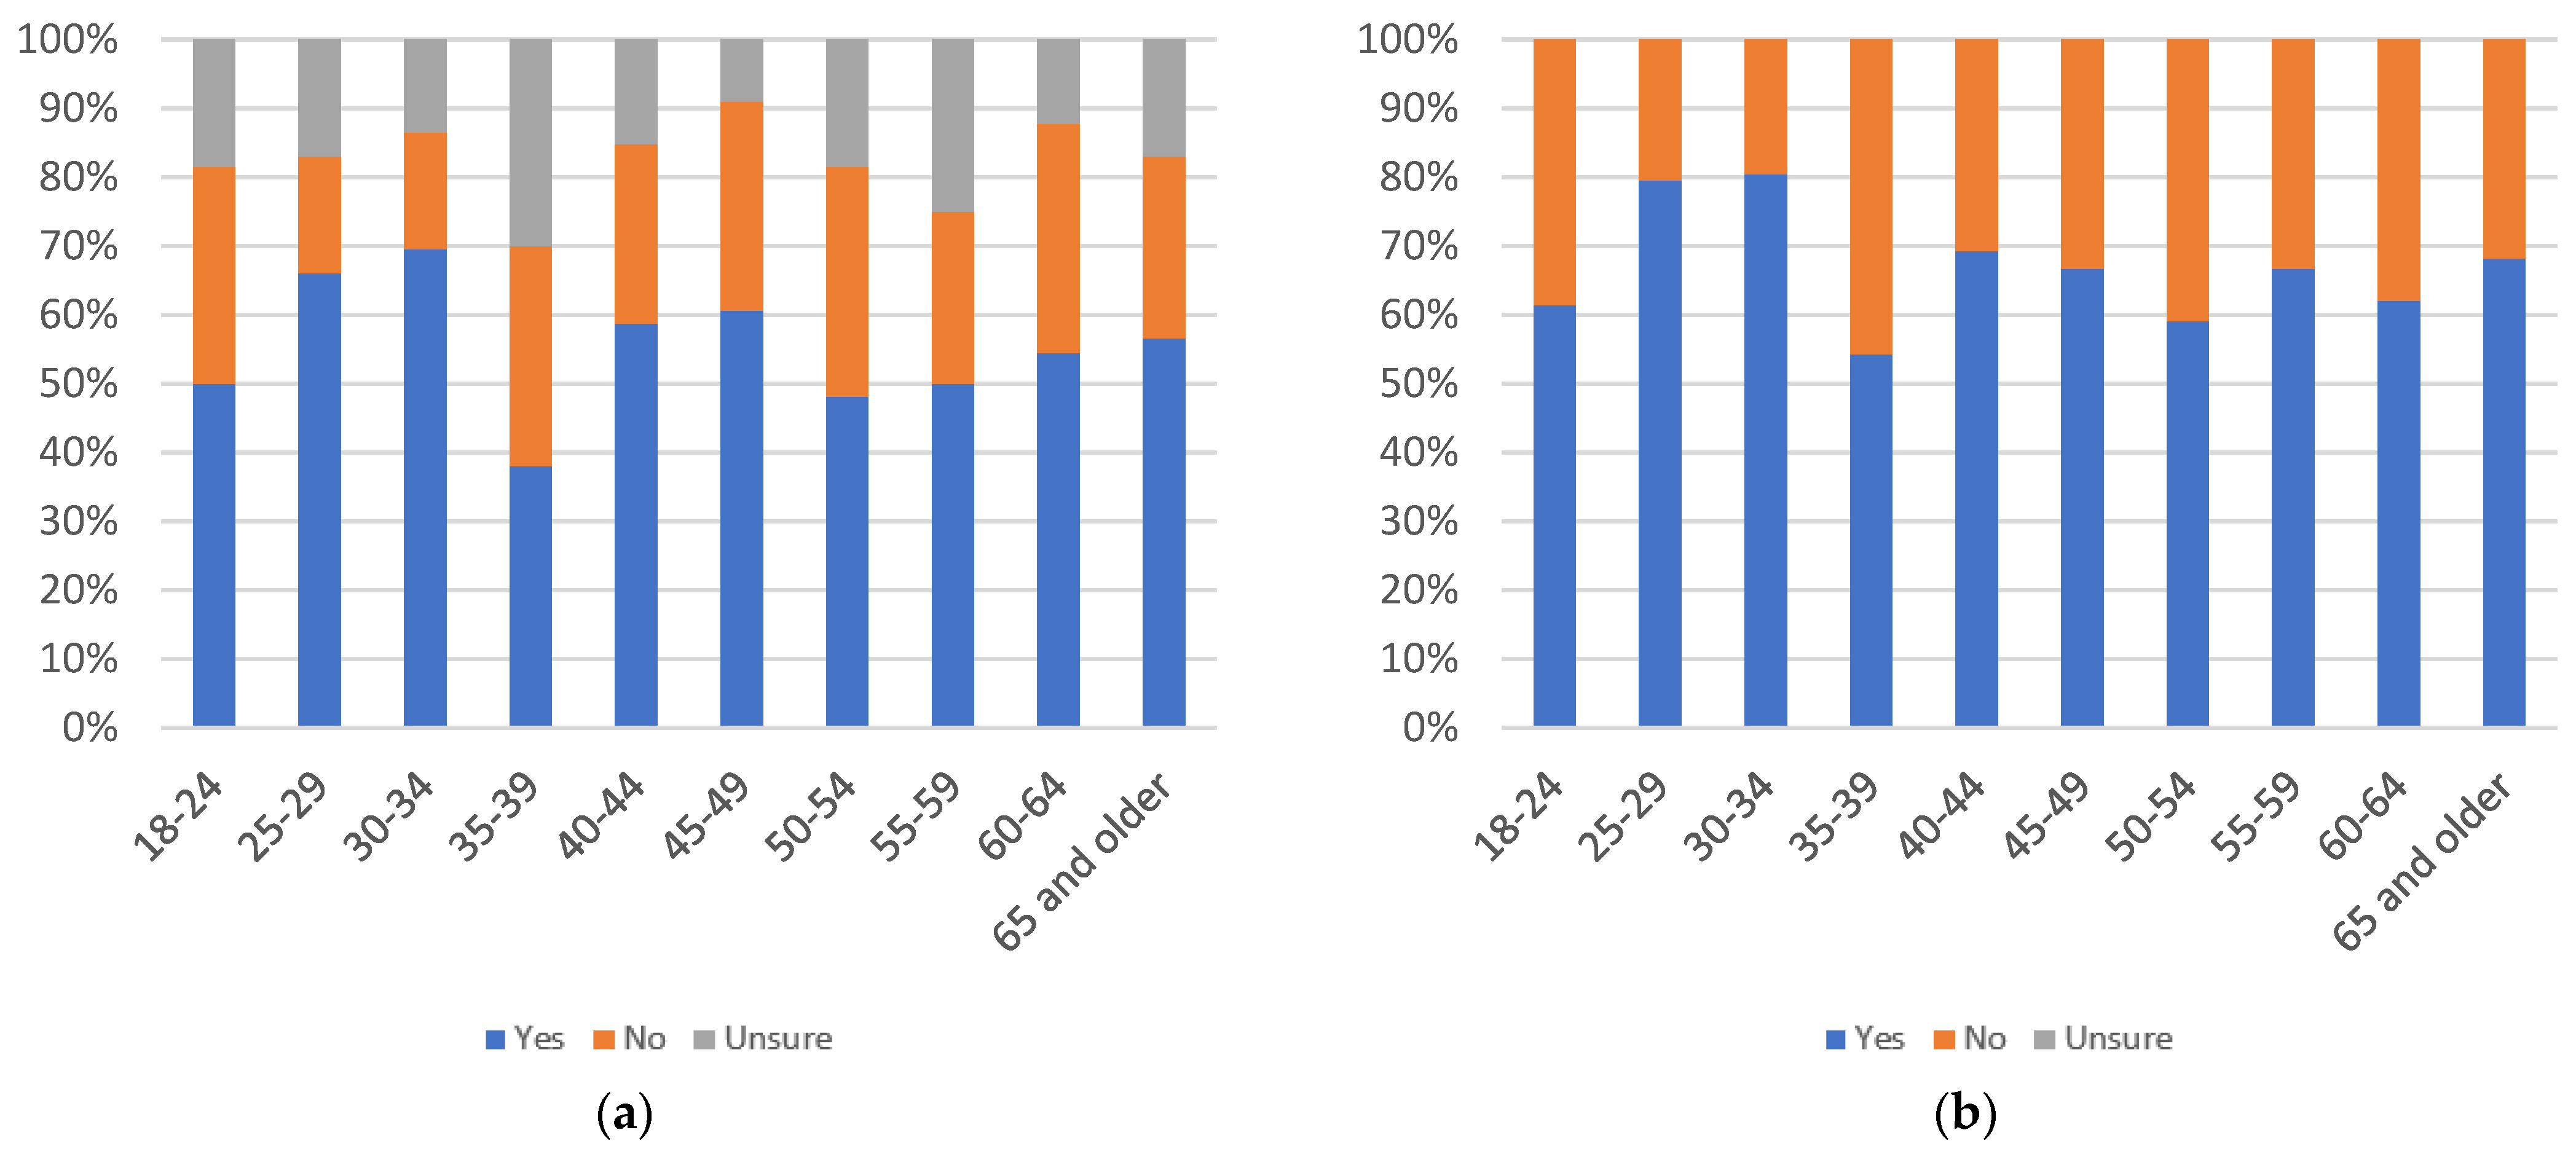
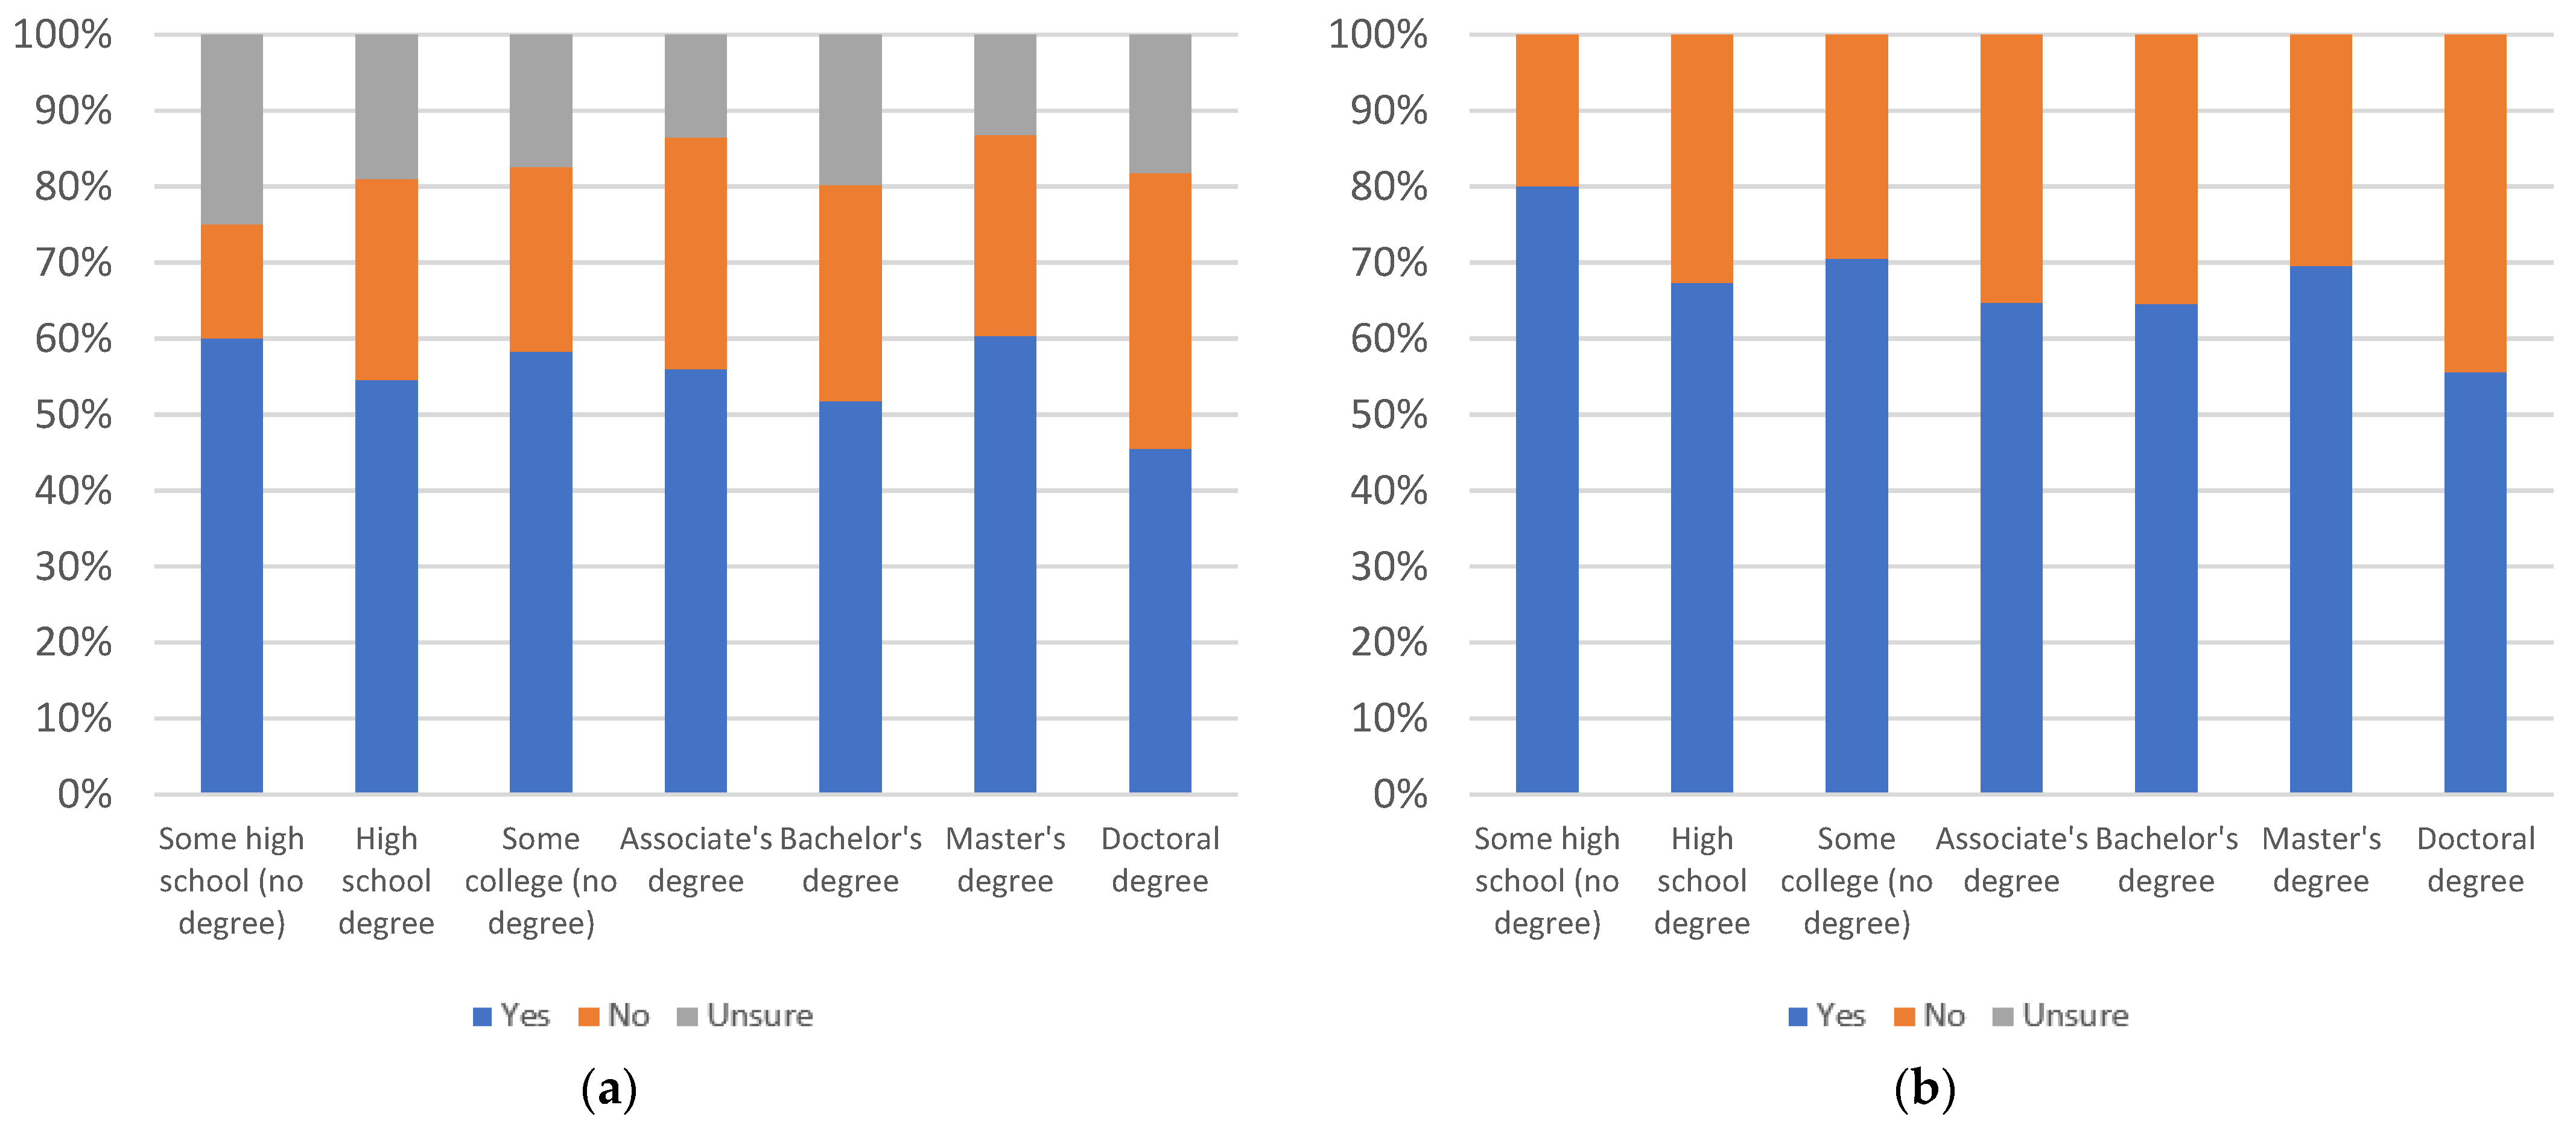
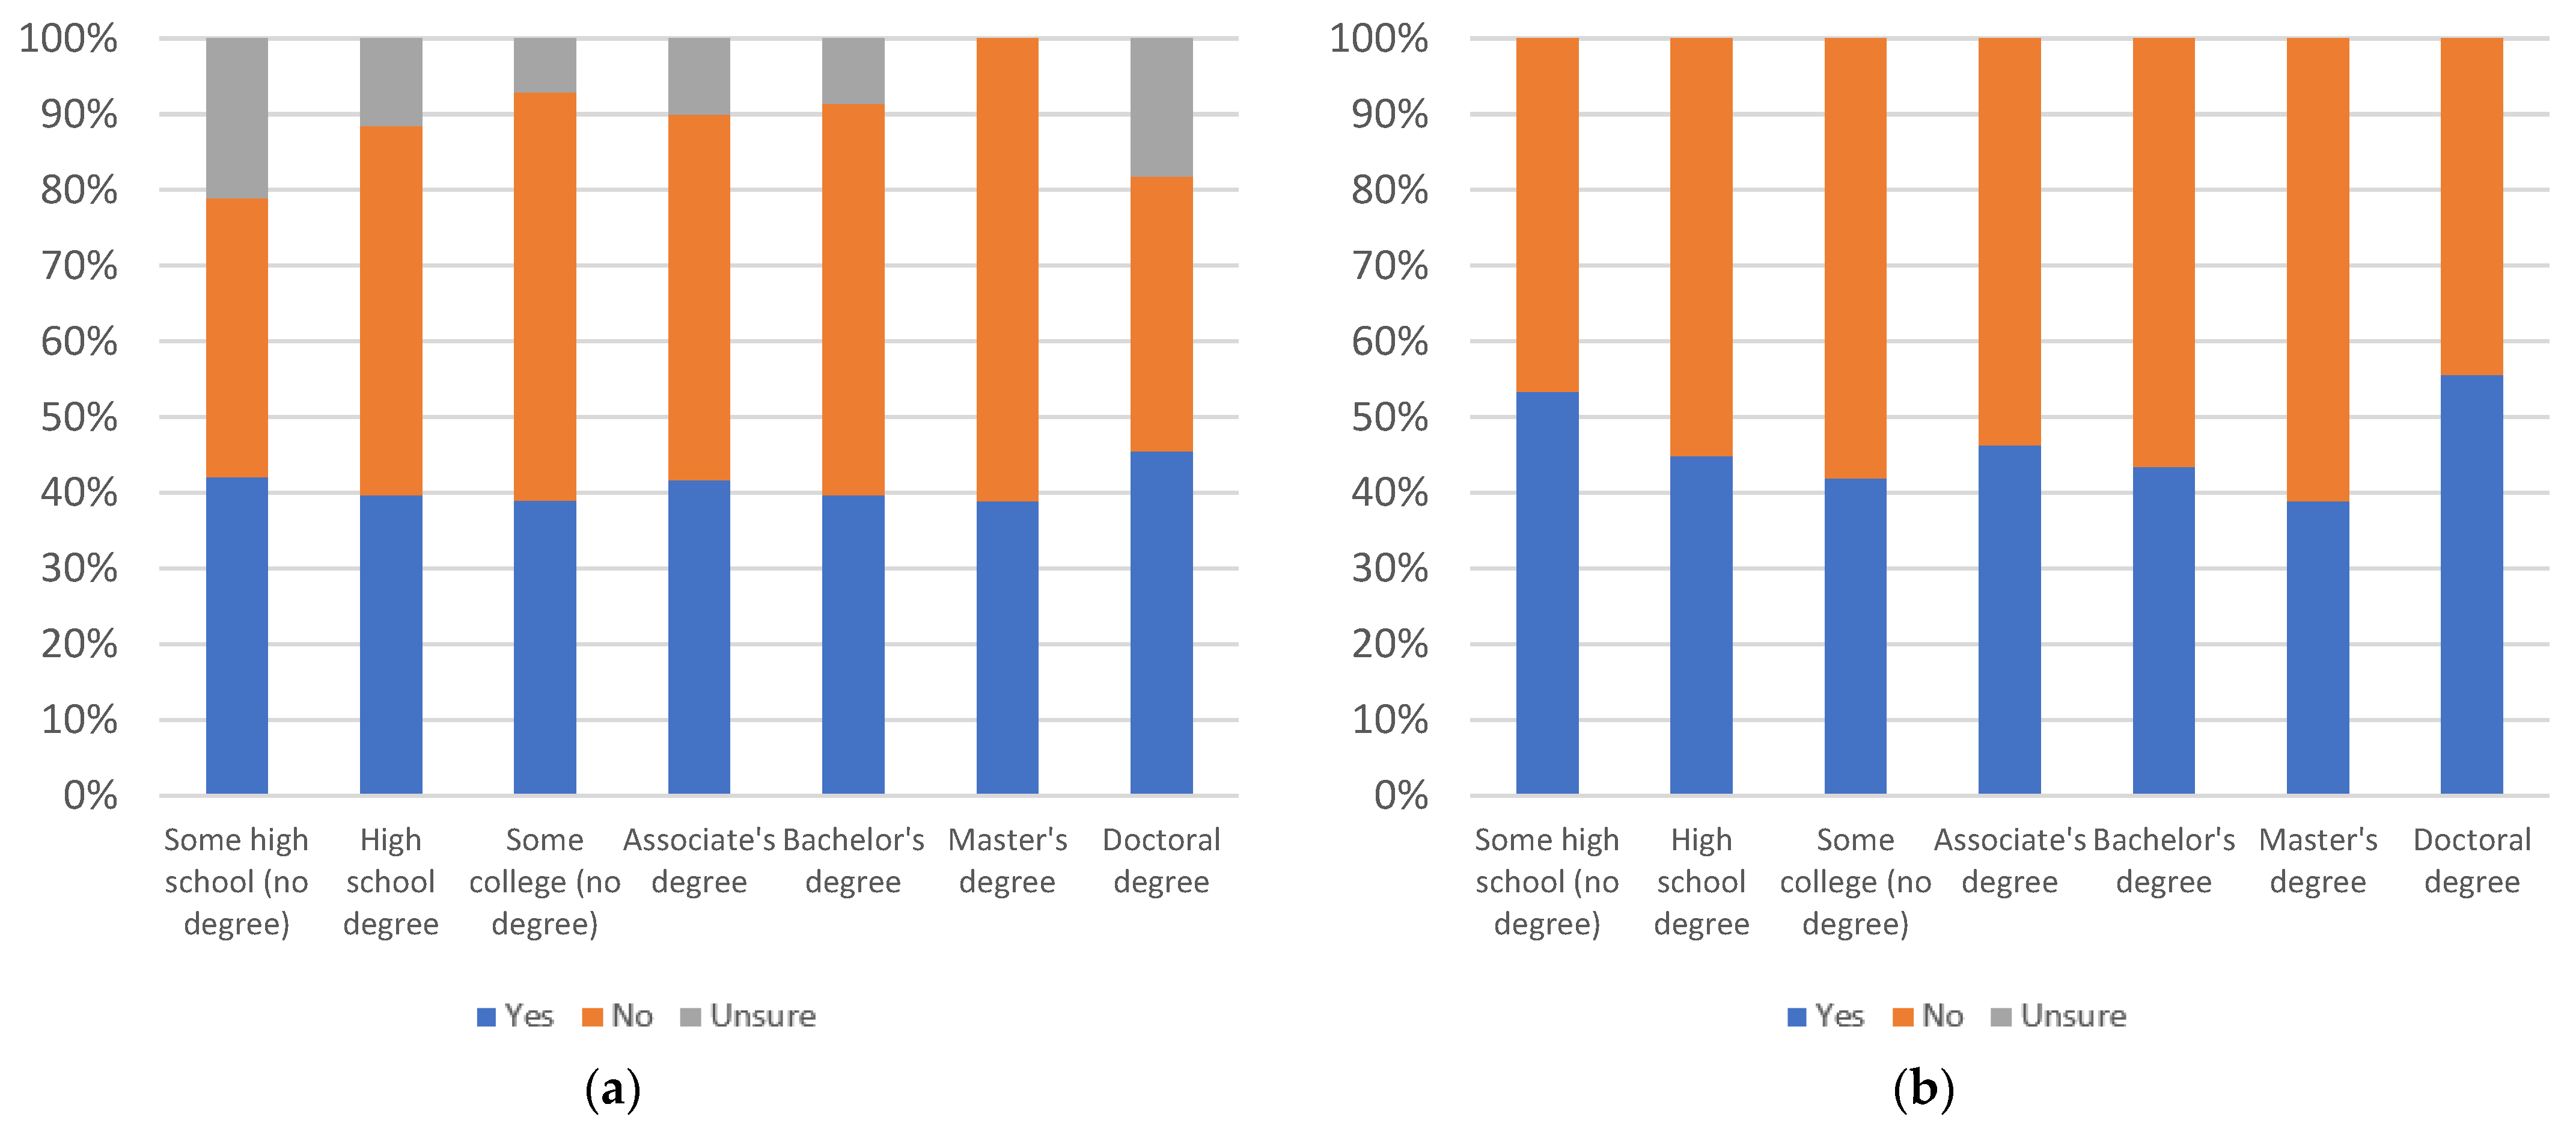
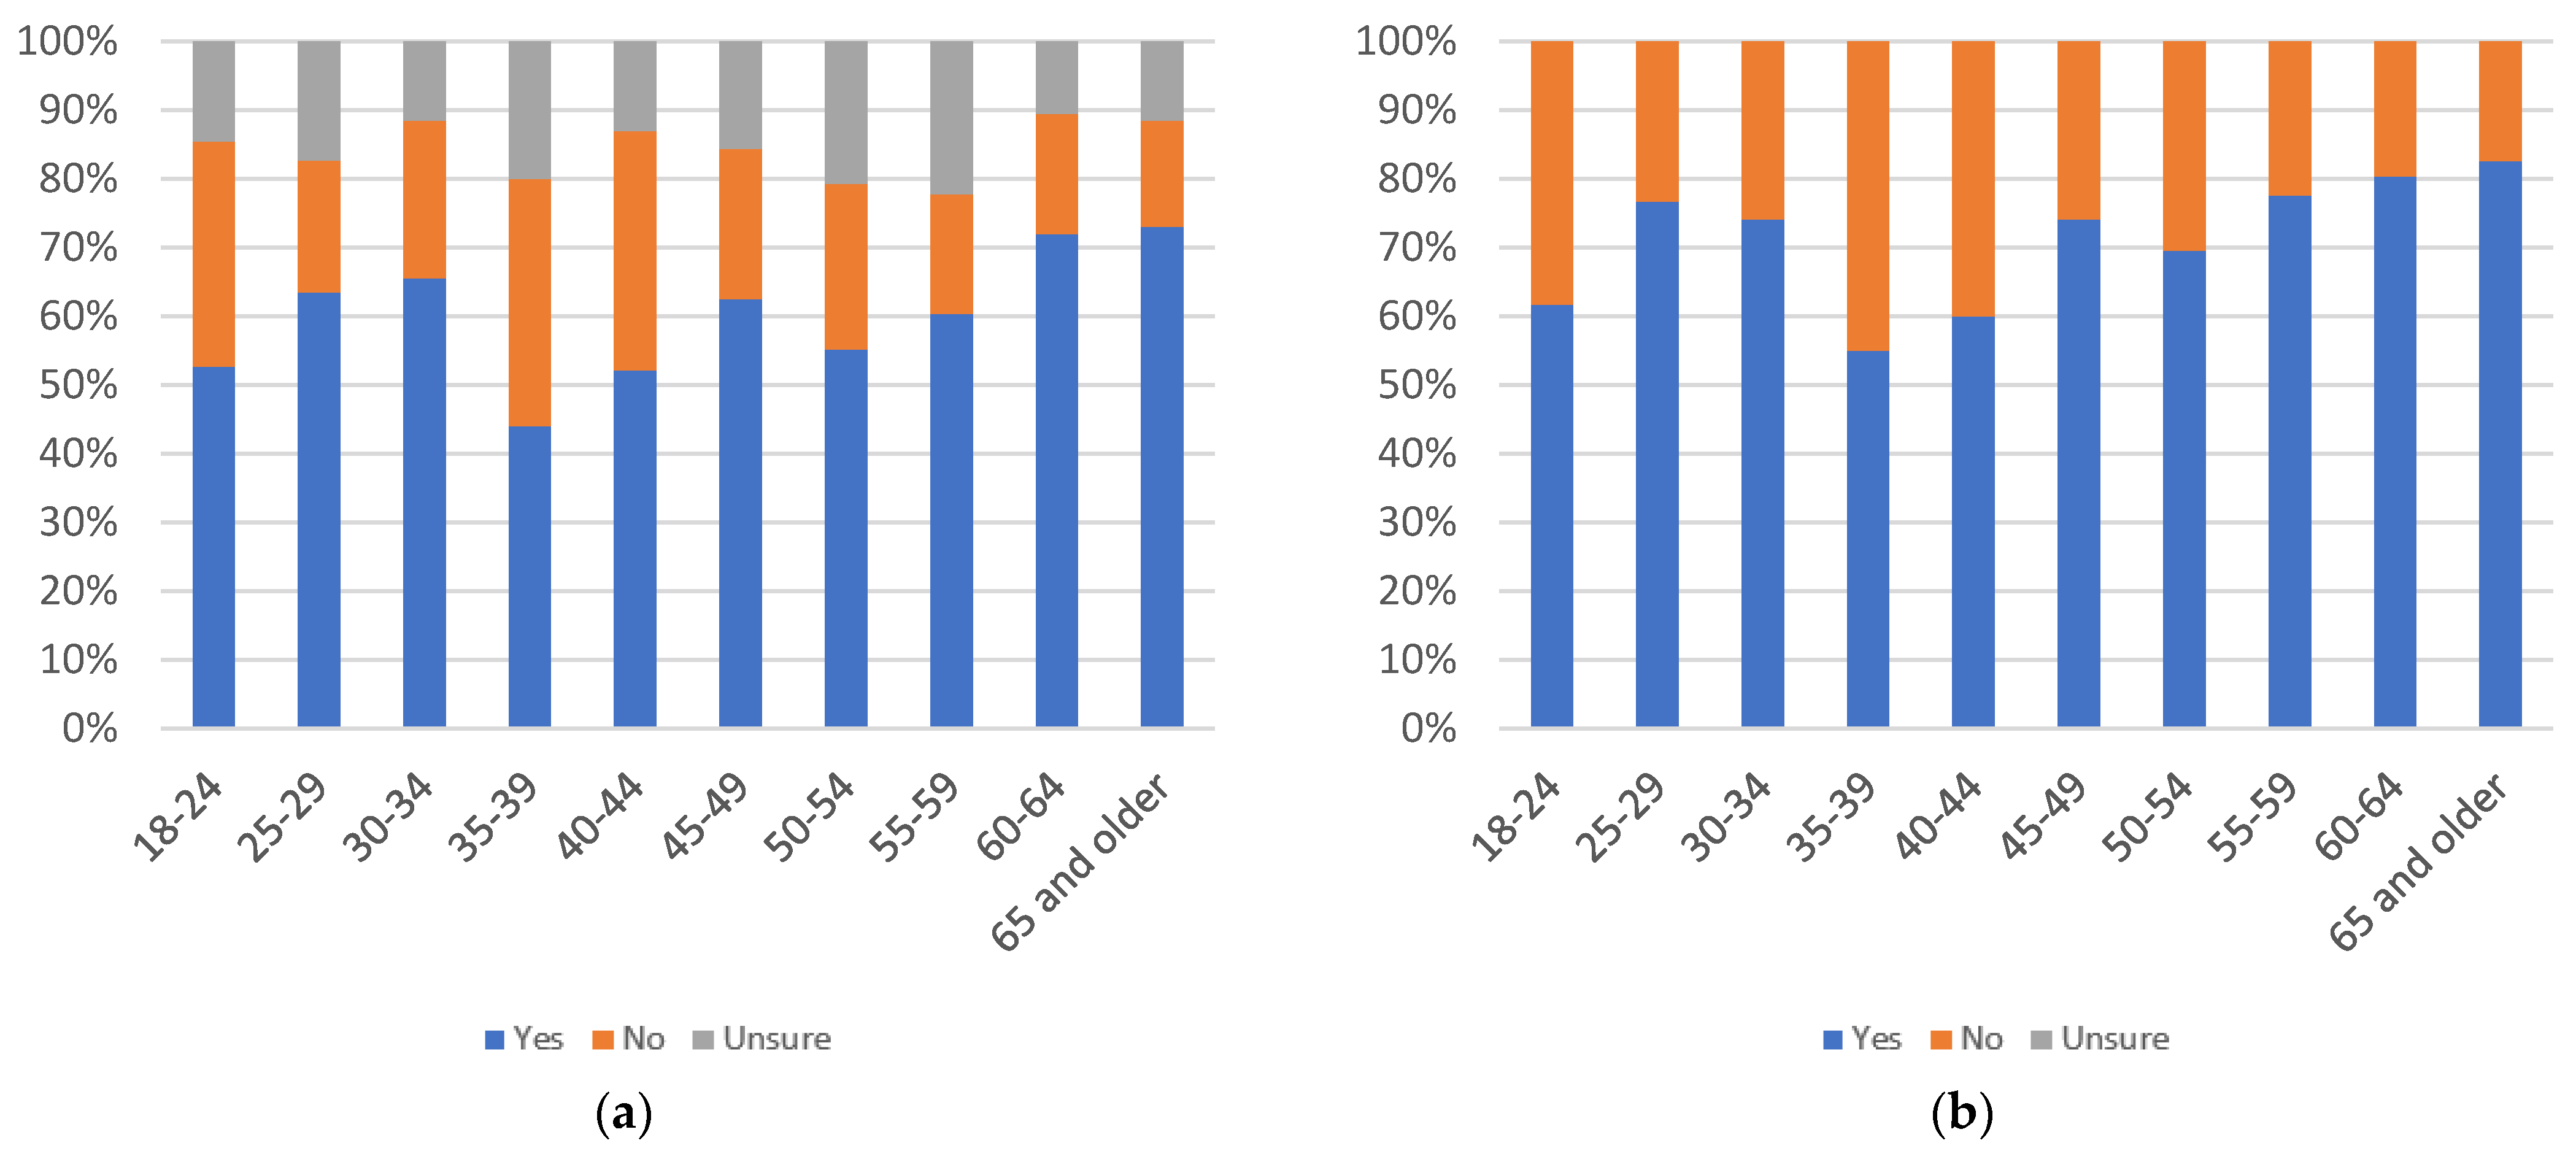
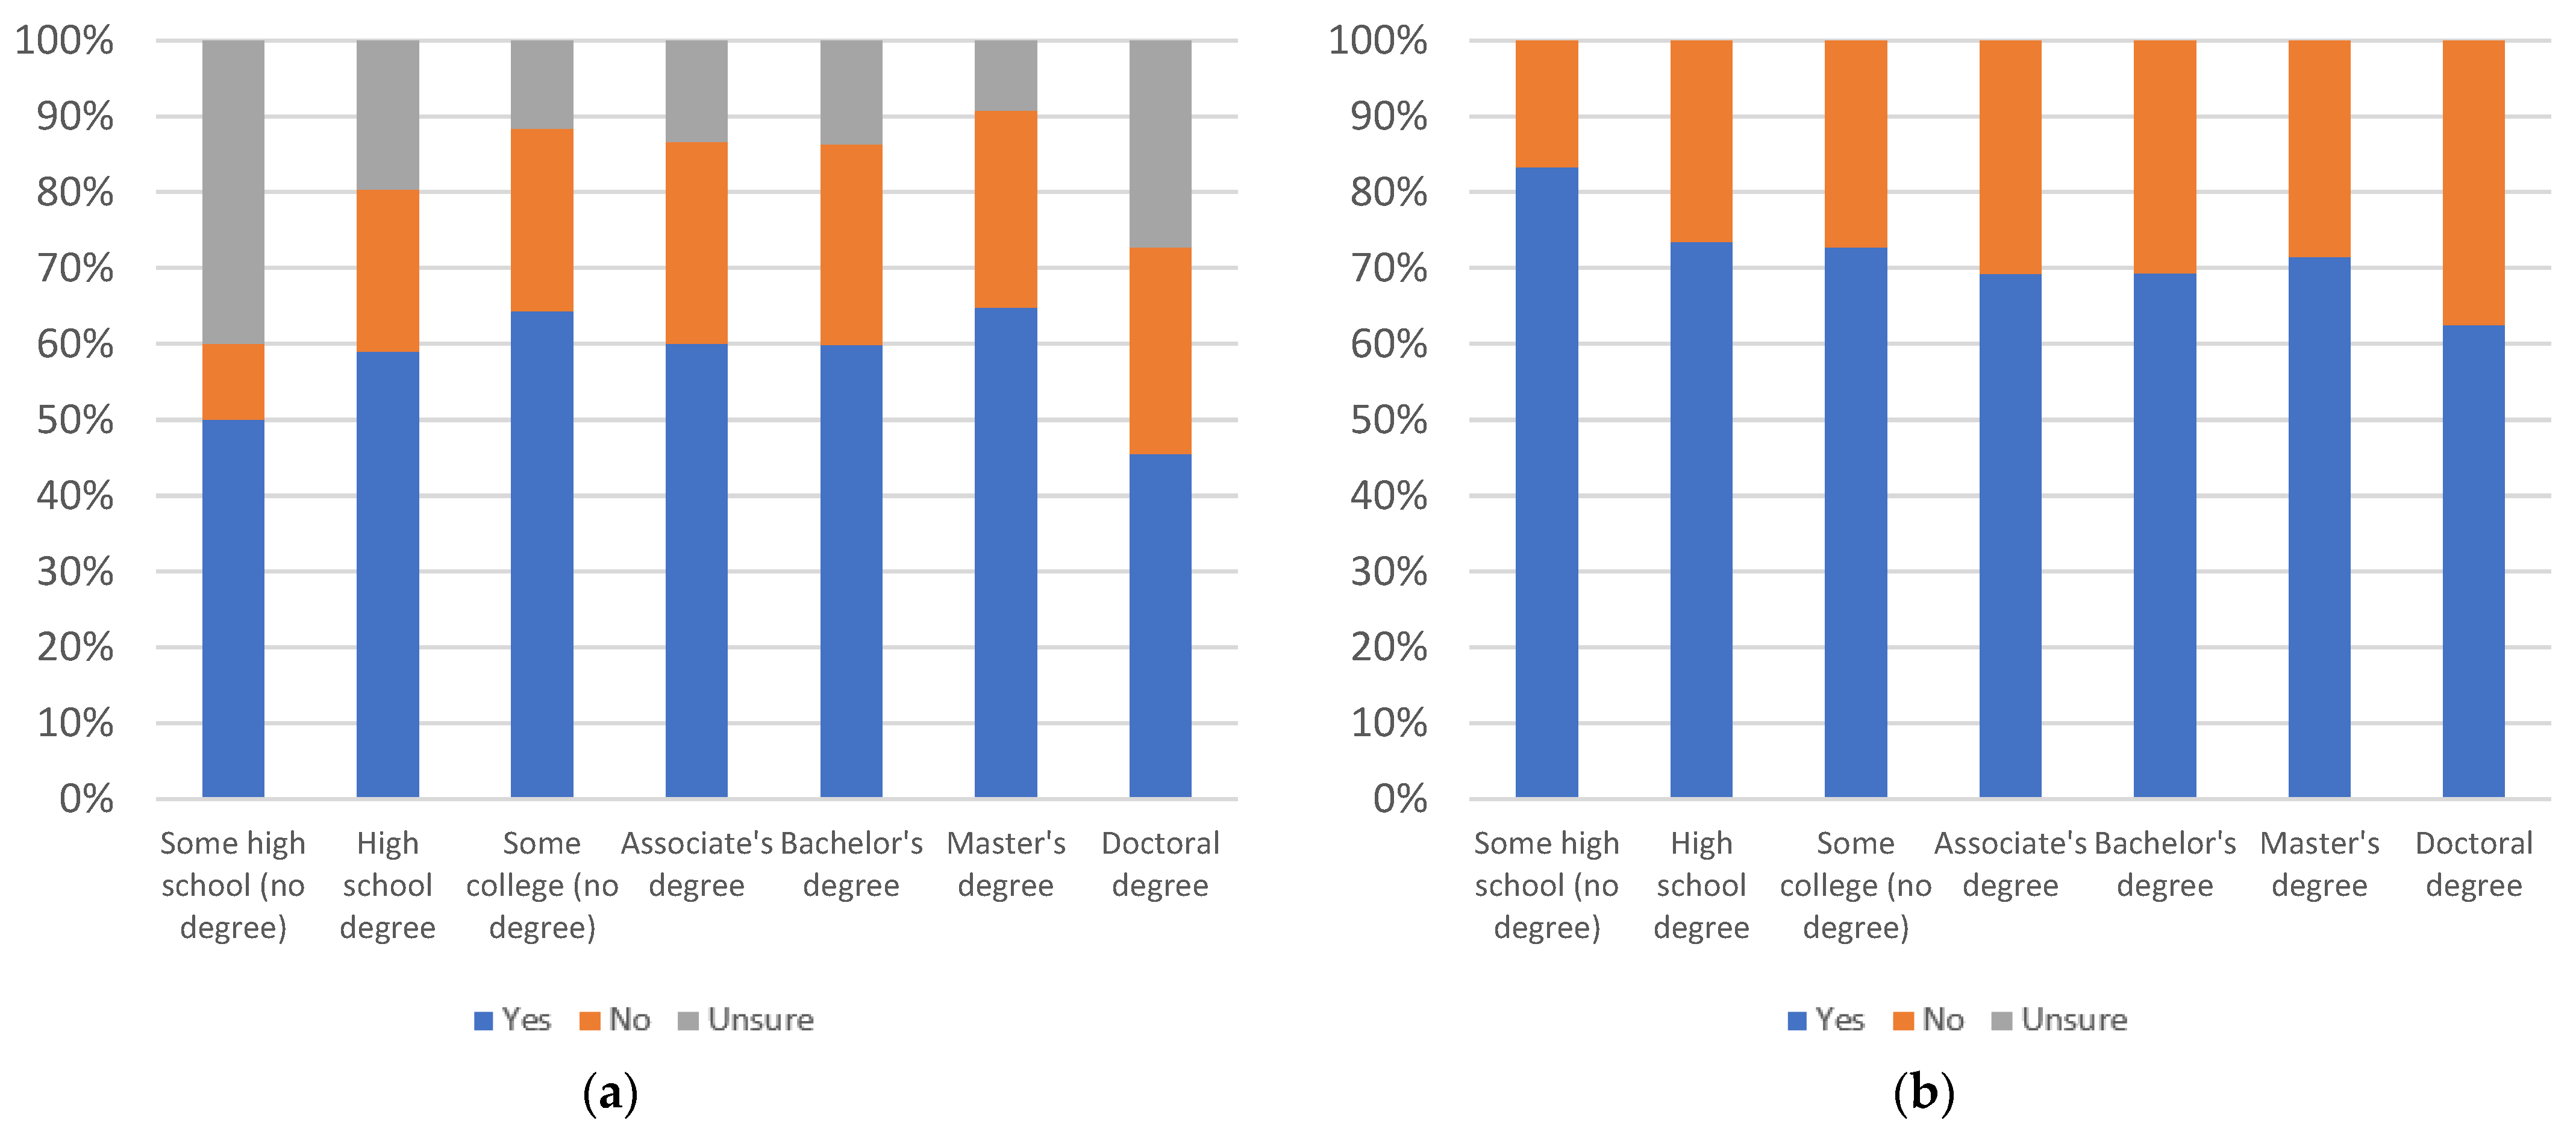
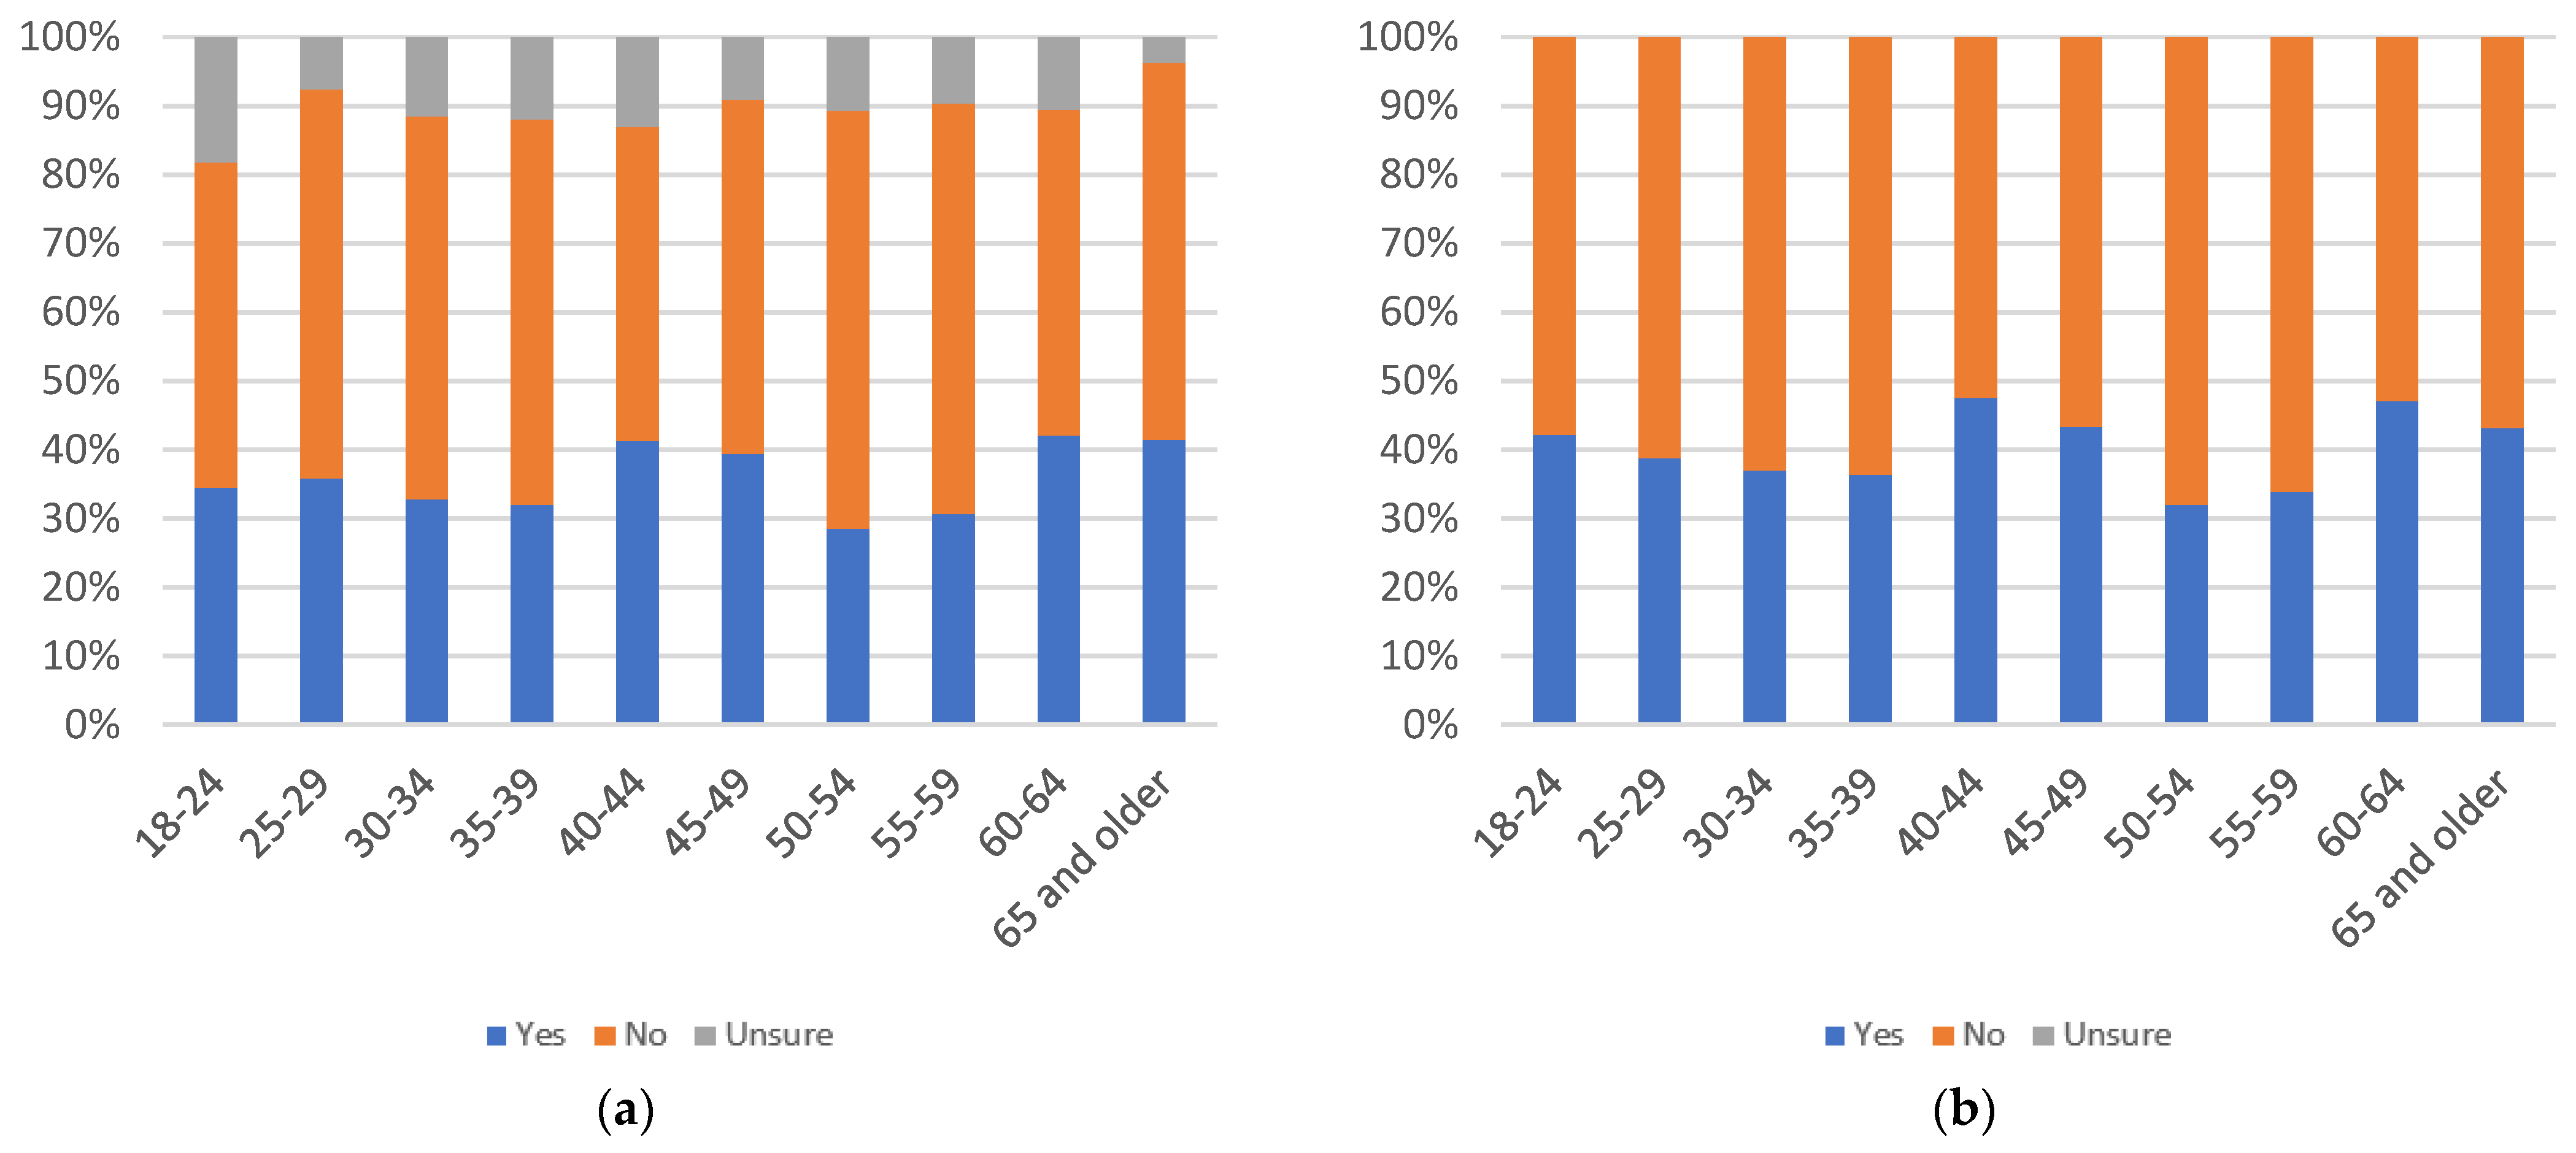
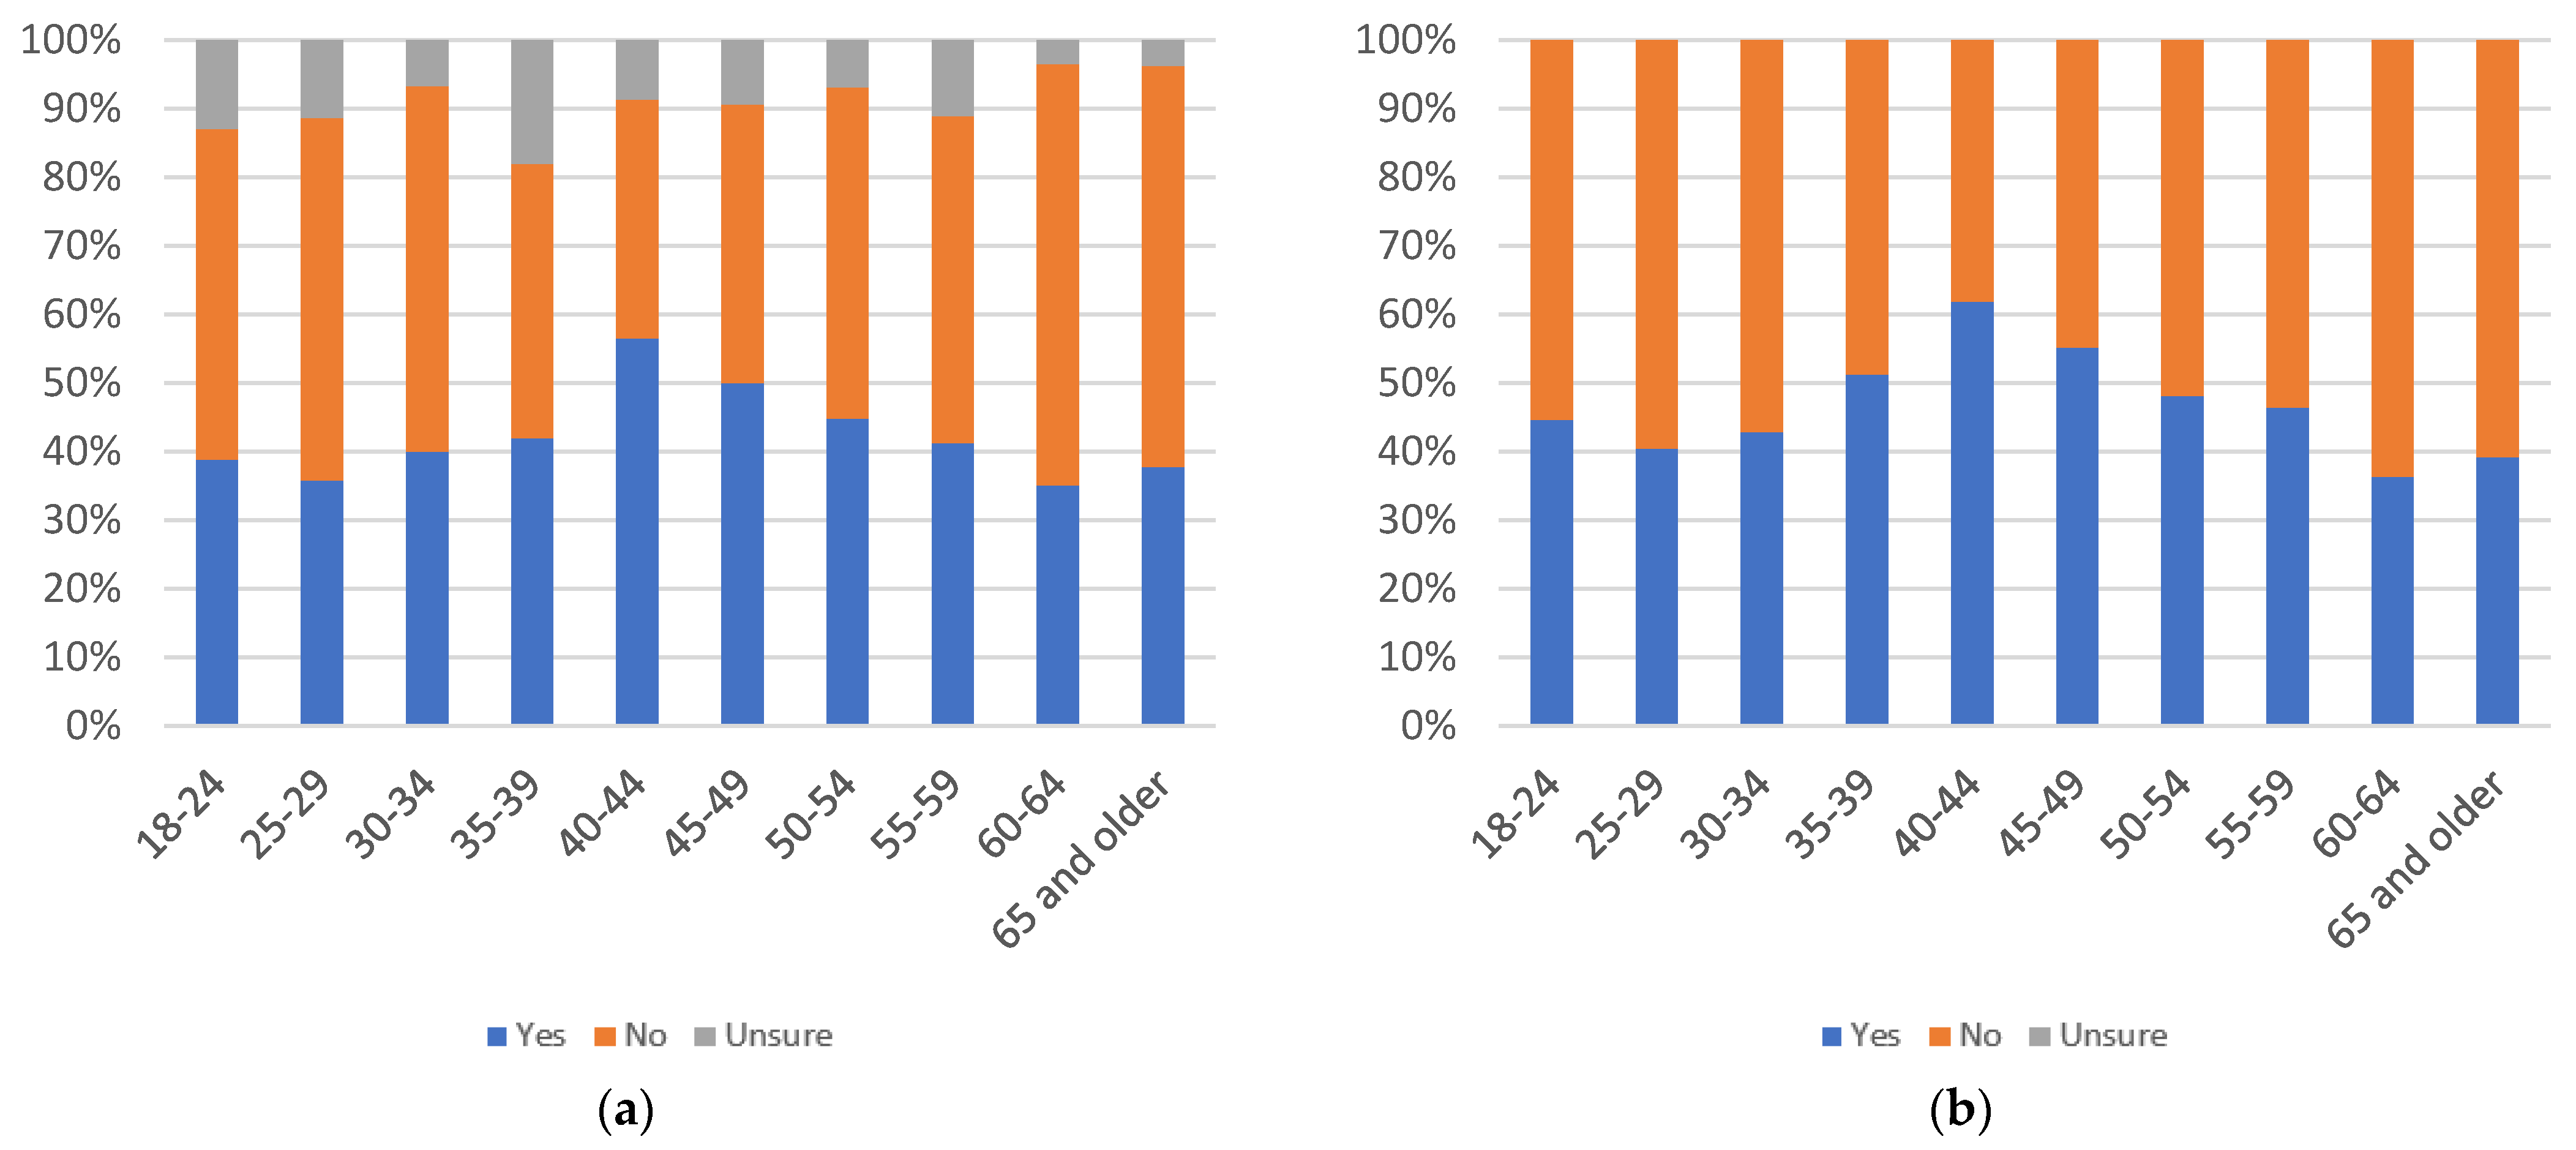
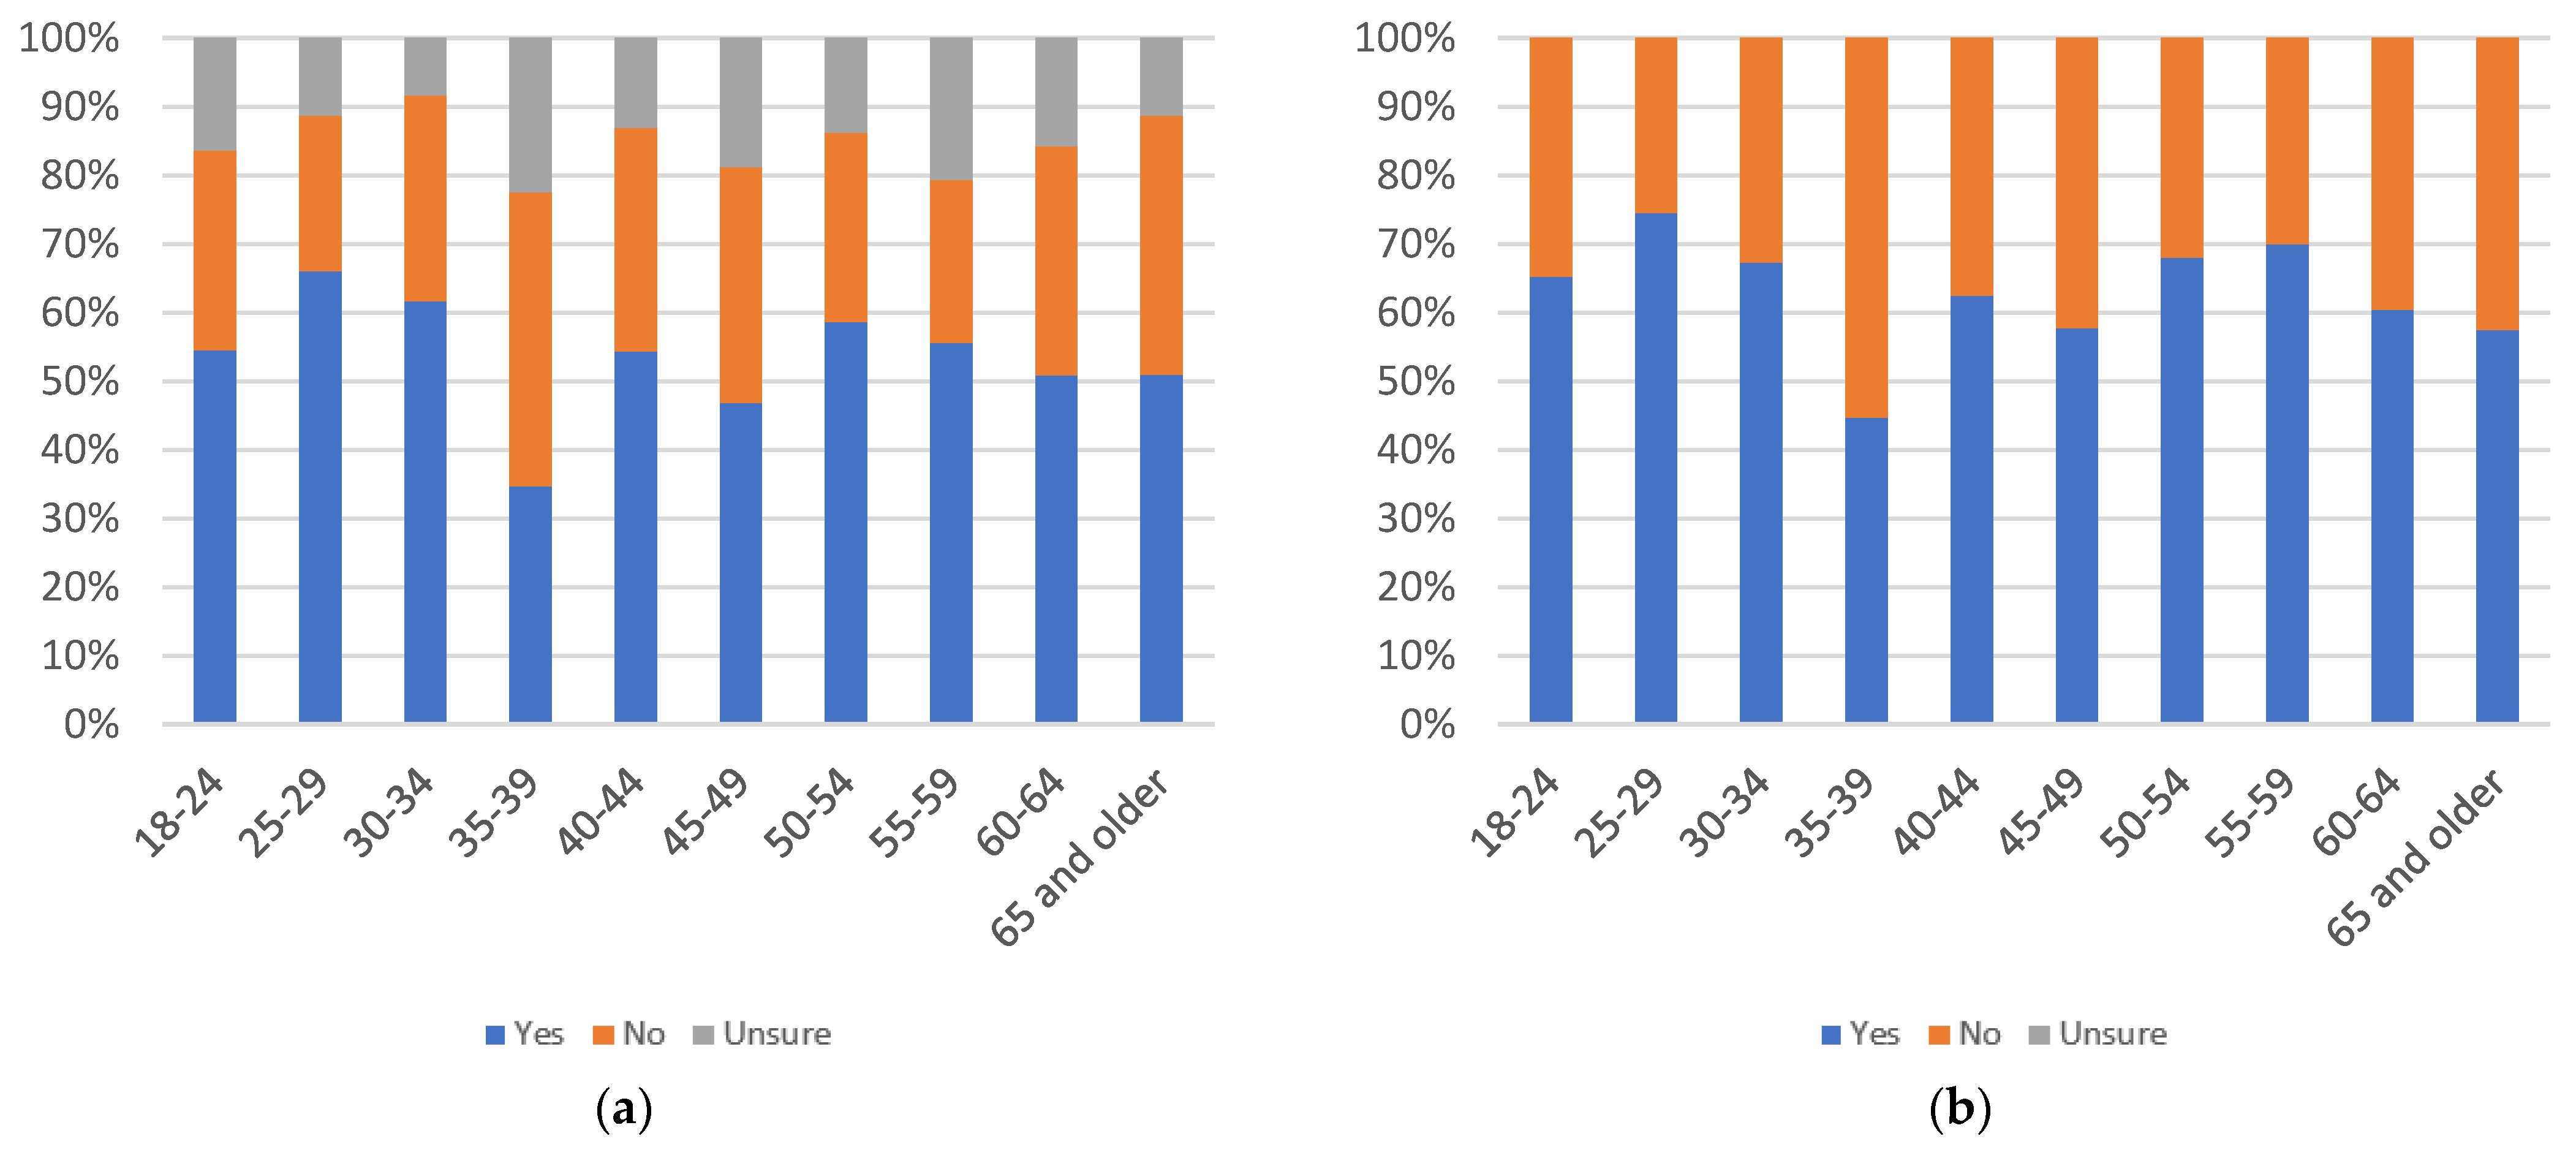
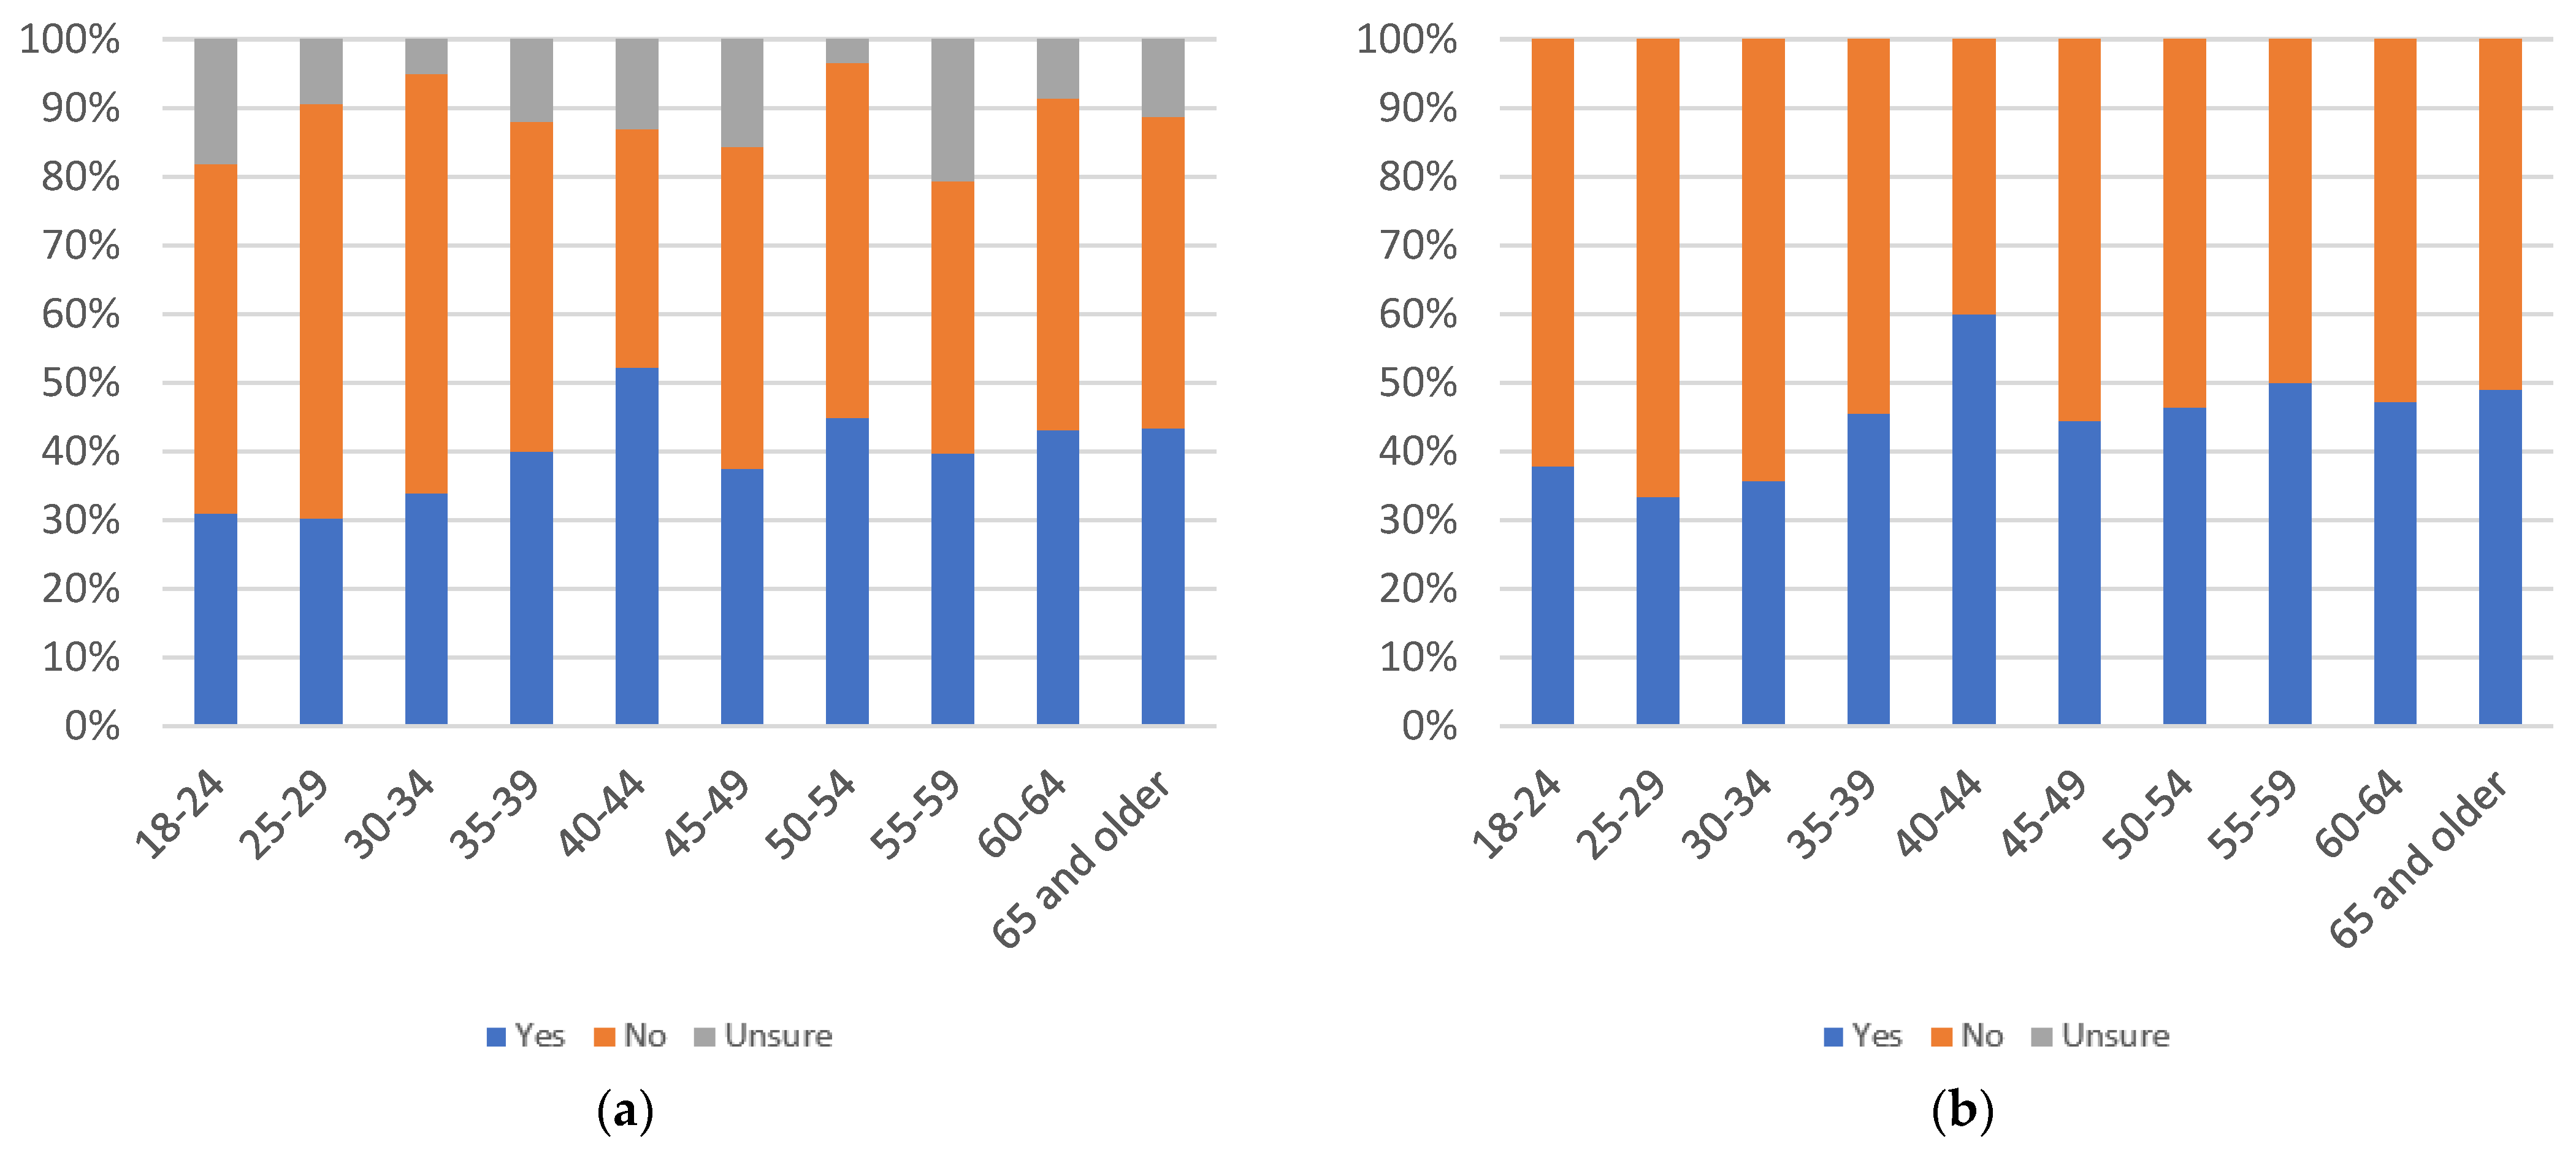
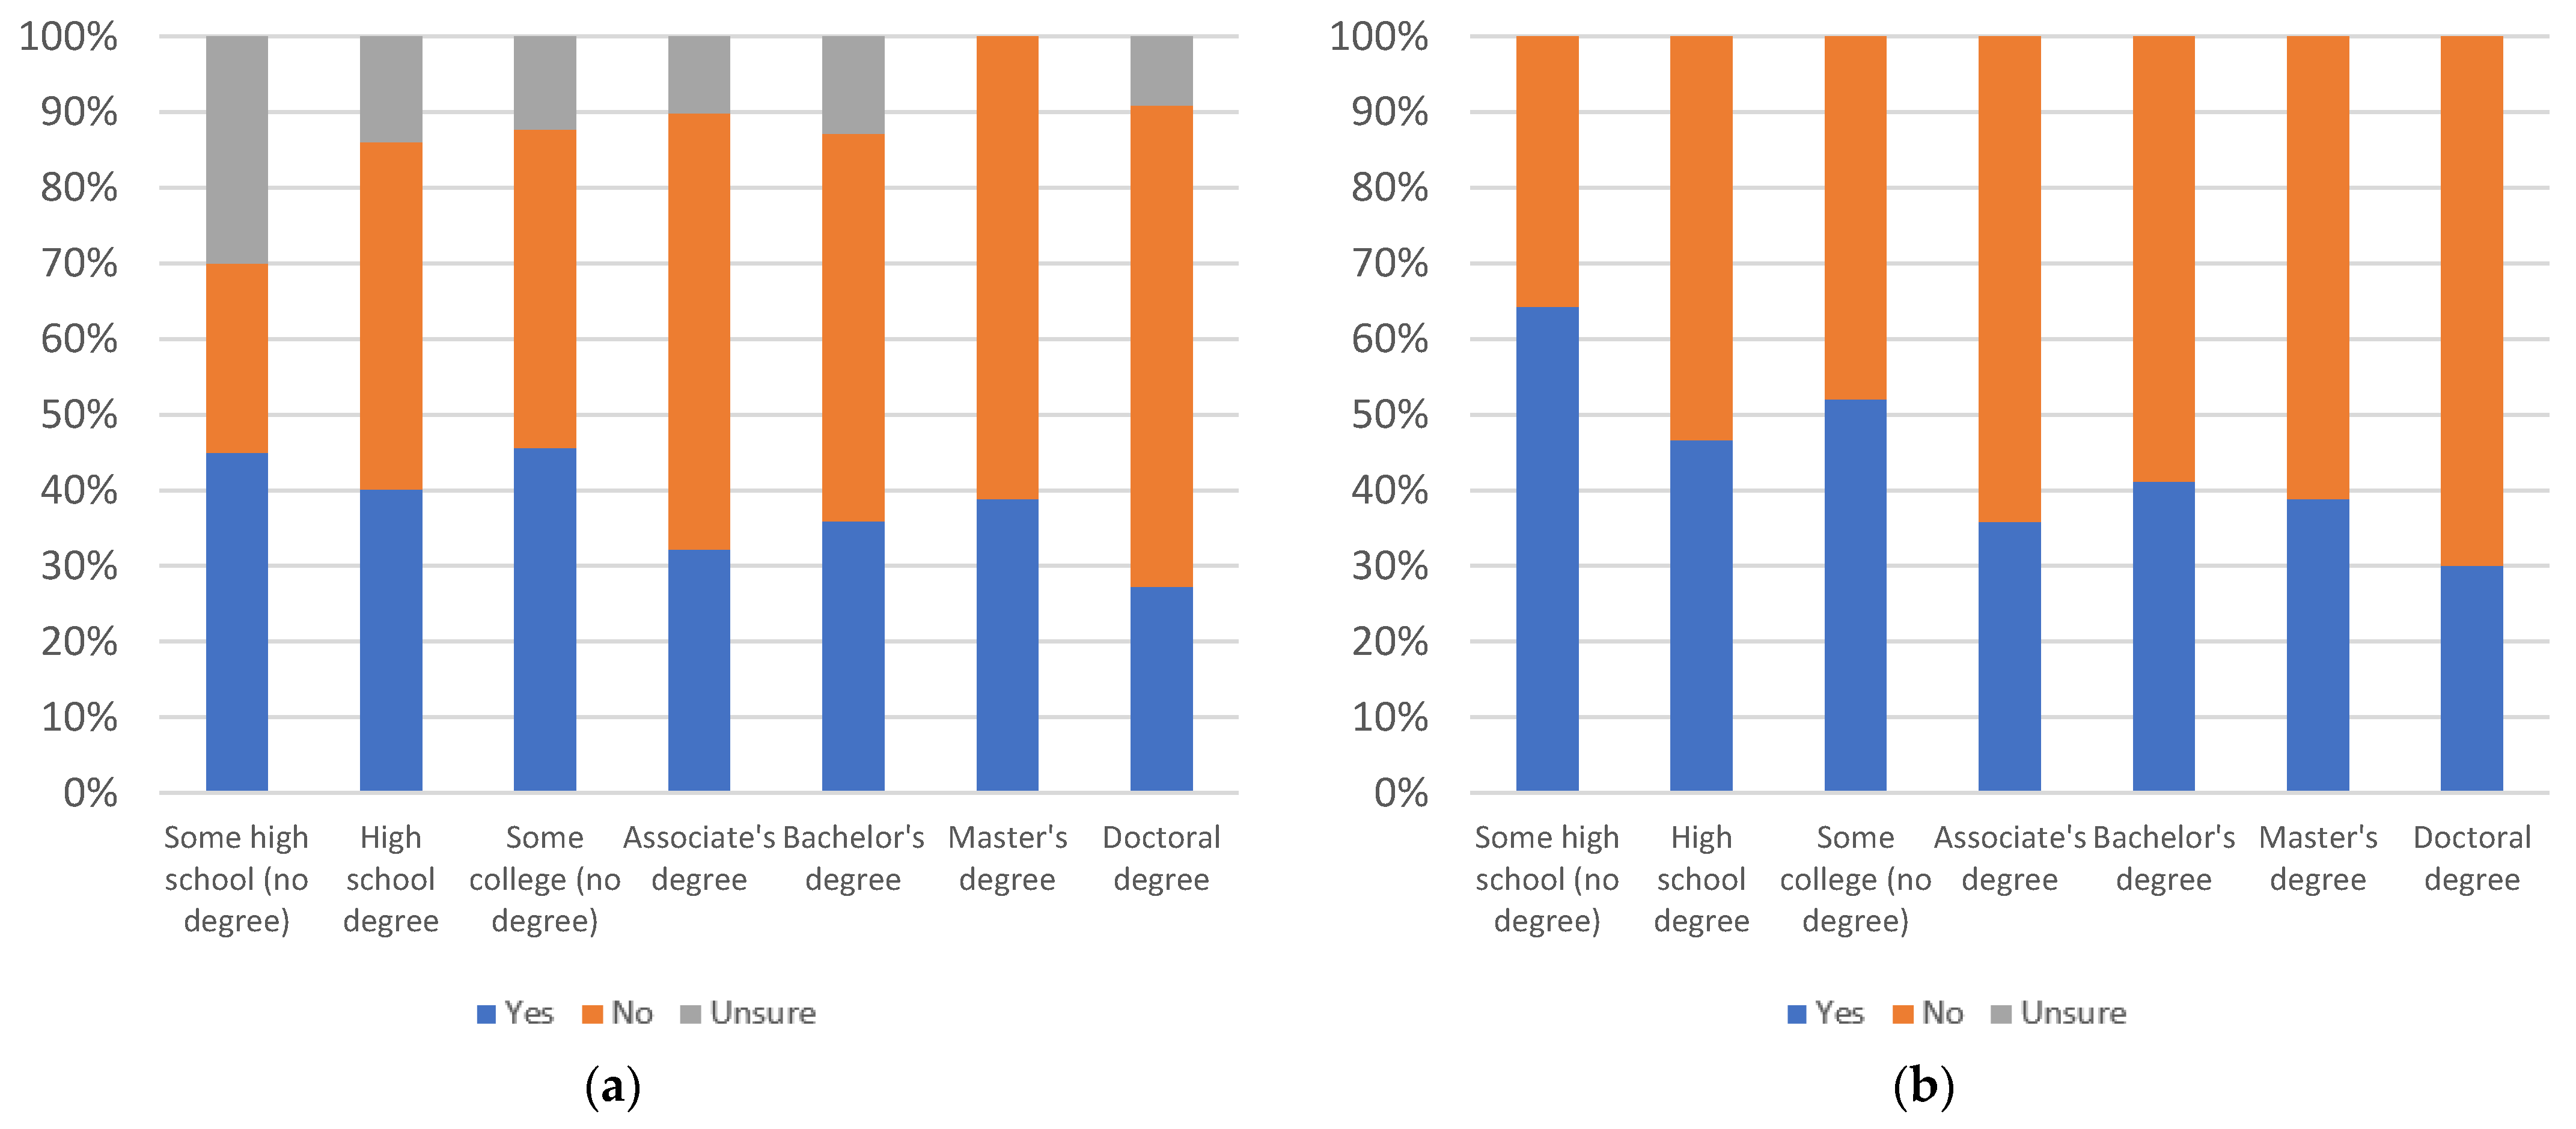
Figure 10 consider annoyingness of informational label 1, with respondents answering the question “would you find this label annoying?”.
In terms of age, there is no clear pattern of decline or increase in perceived annoyingness as age increases. There are drops in yes responses at the 25–29, 50–54, and 55–59 age groups and an increase at the 60–64 age group. The number of uncertain responses also shows no discernable pattern. All age groups have less than 50% answering yes, when uncertainty is factored in. Only the 60–64 age group has greater than 50% yes responses, when uncertainty is not considered. This indicates a low level of annoyingness overall, amongst most age groups.
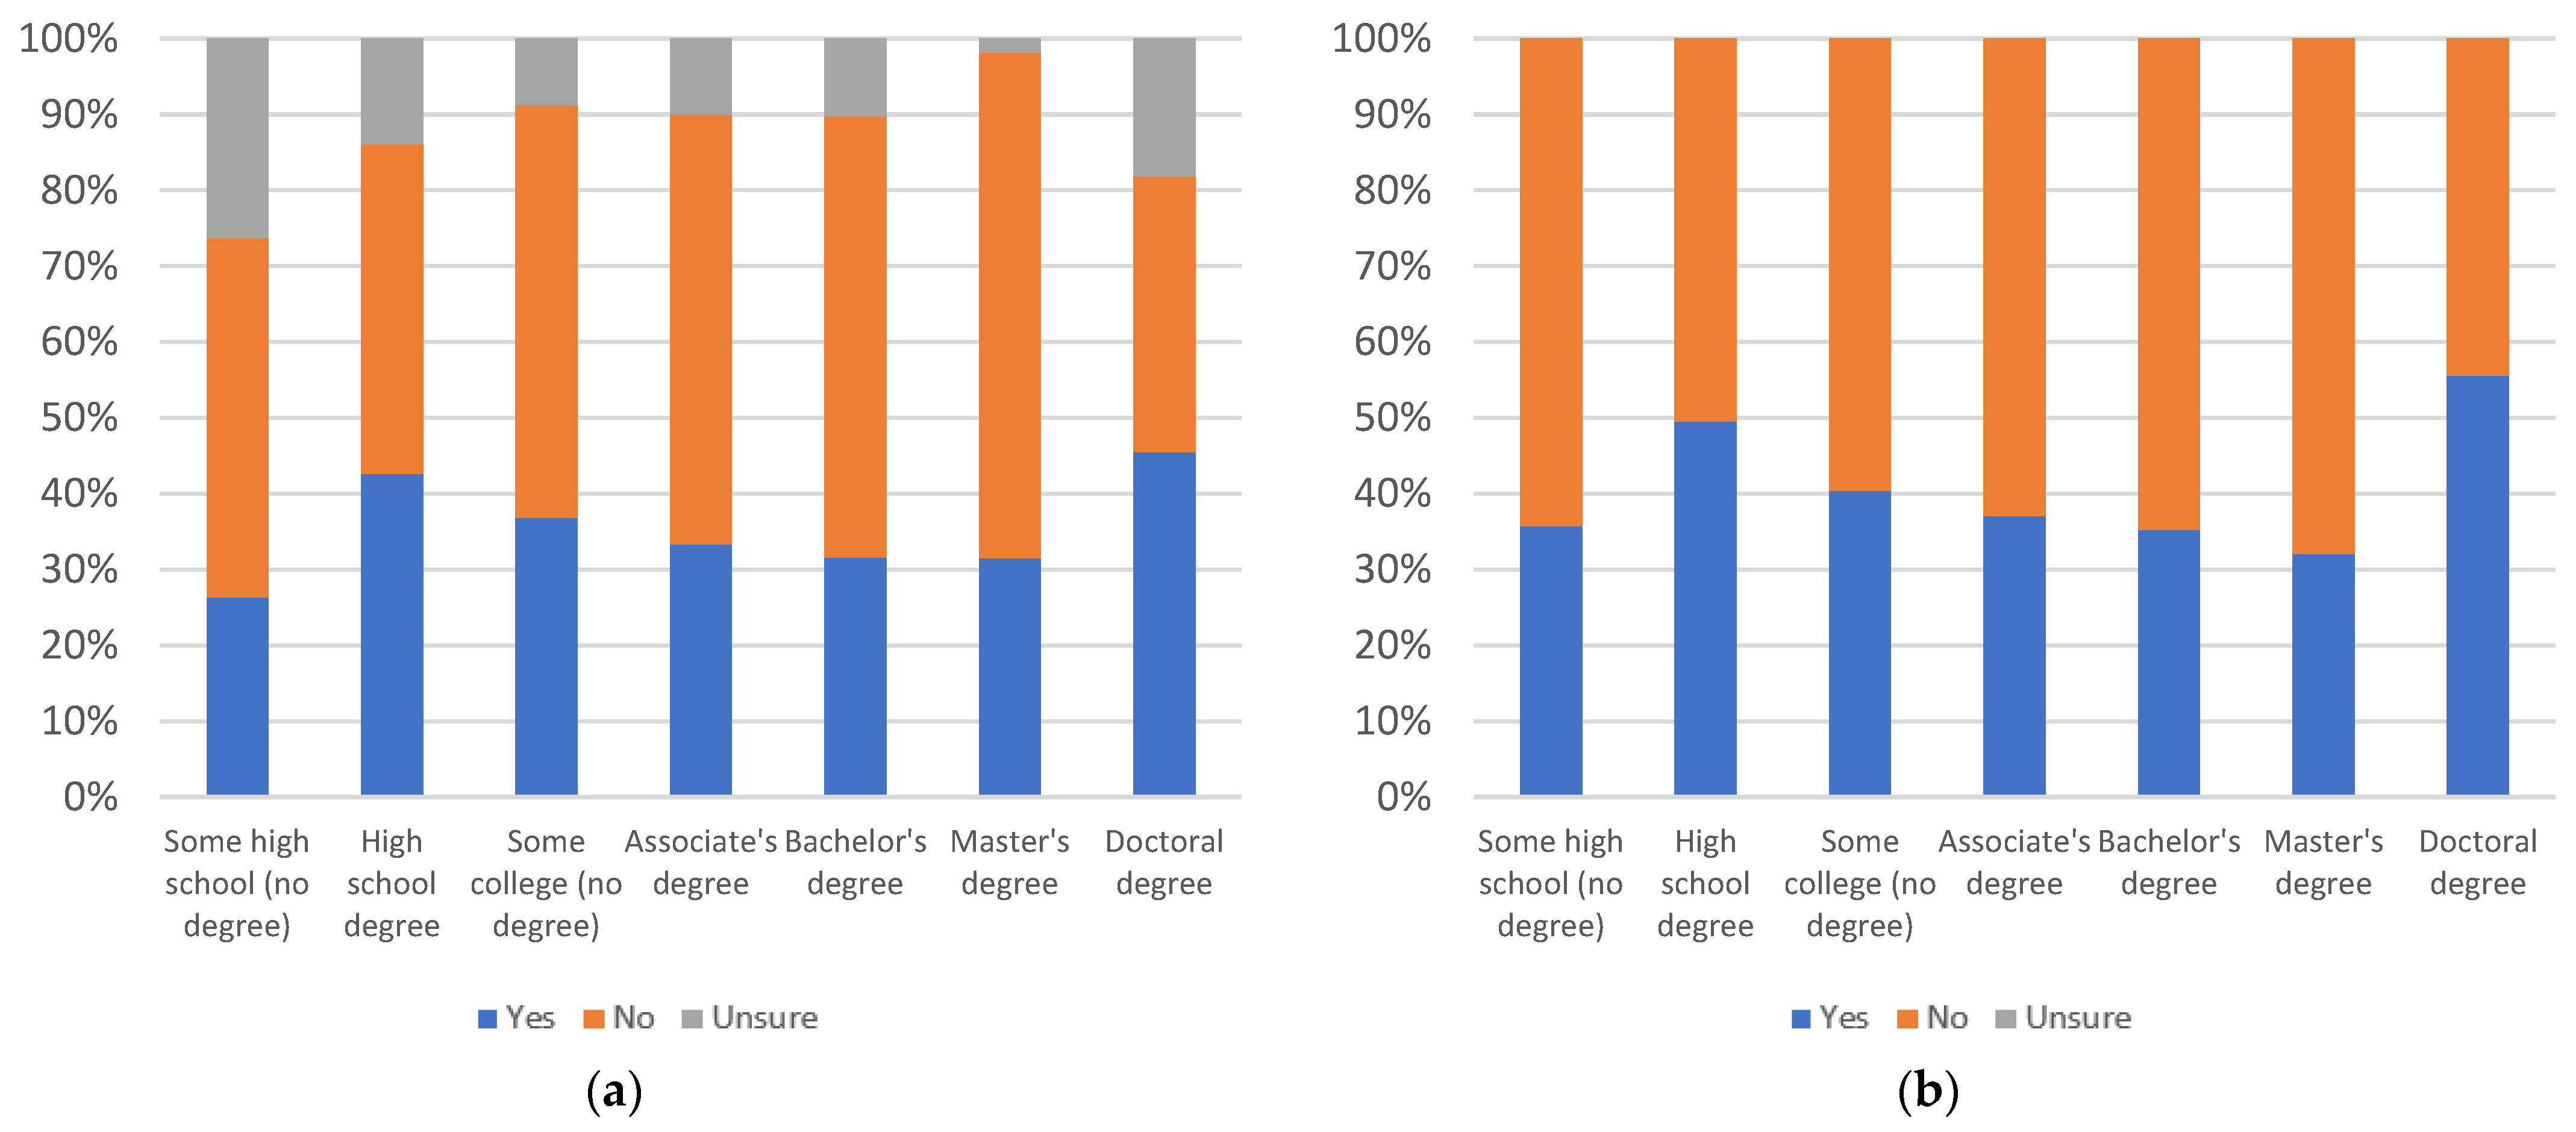
By education level, there is an increase in perceived annoyingness up to the associate’s degree level, then a decline up to the master’s degree level. Finally, there is a spike at the doctoral degree level. The spike at the doctoral degree level is less pronounced, once uncertainty is factored in, as doctoral degree holders show the largest level of uncertainty. All education groups have less than 50% of respondents answering yes, with uncertainty factored in. Only doctoral degree holders have at least 50% yes responses, when uncertainty is not considered. This indicates a low level of annoyingness overall, amongst most education groups.
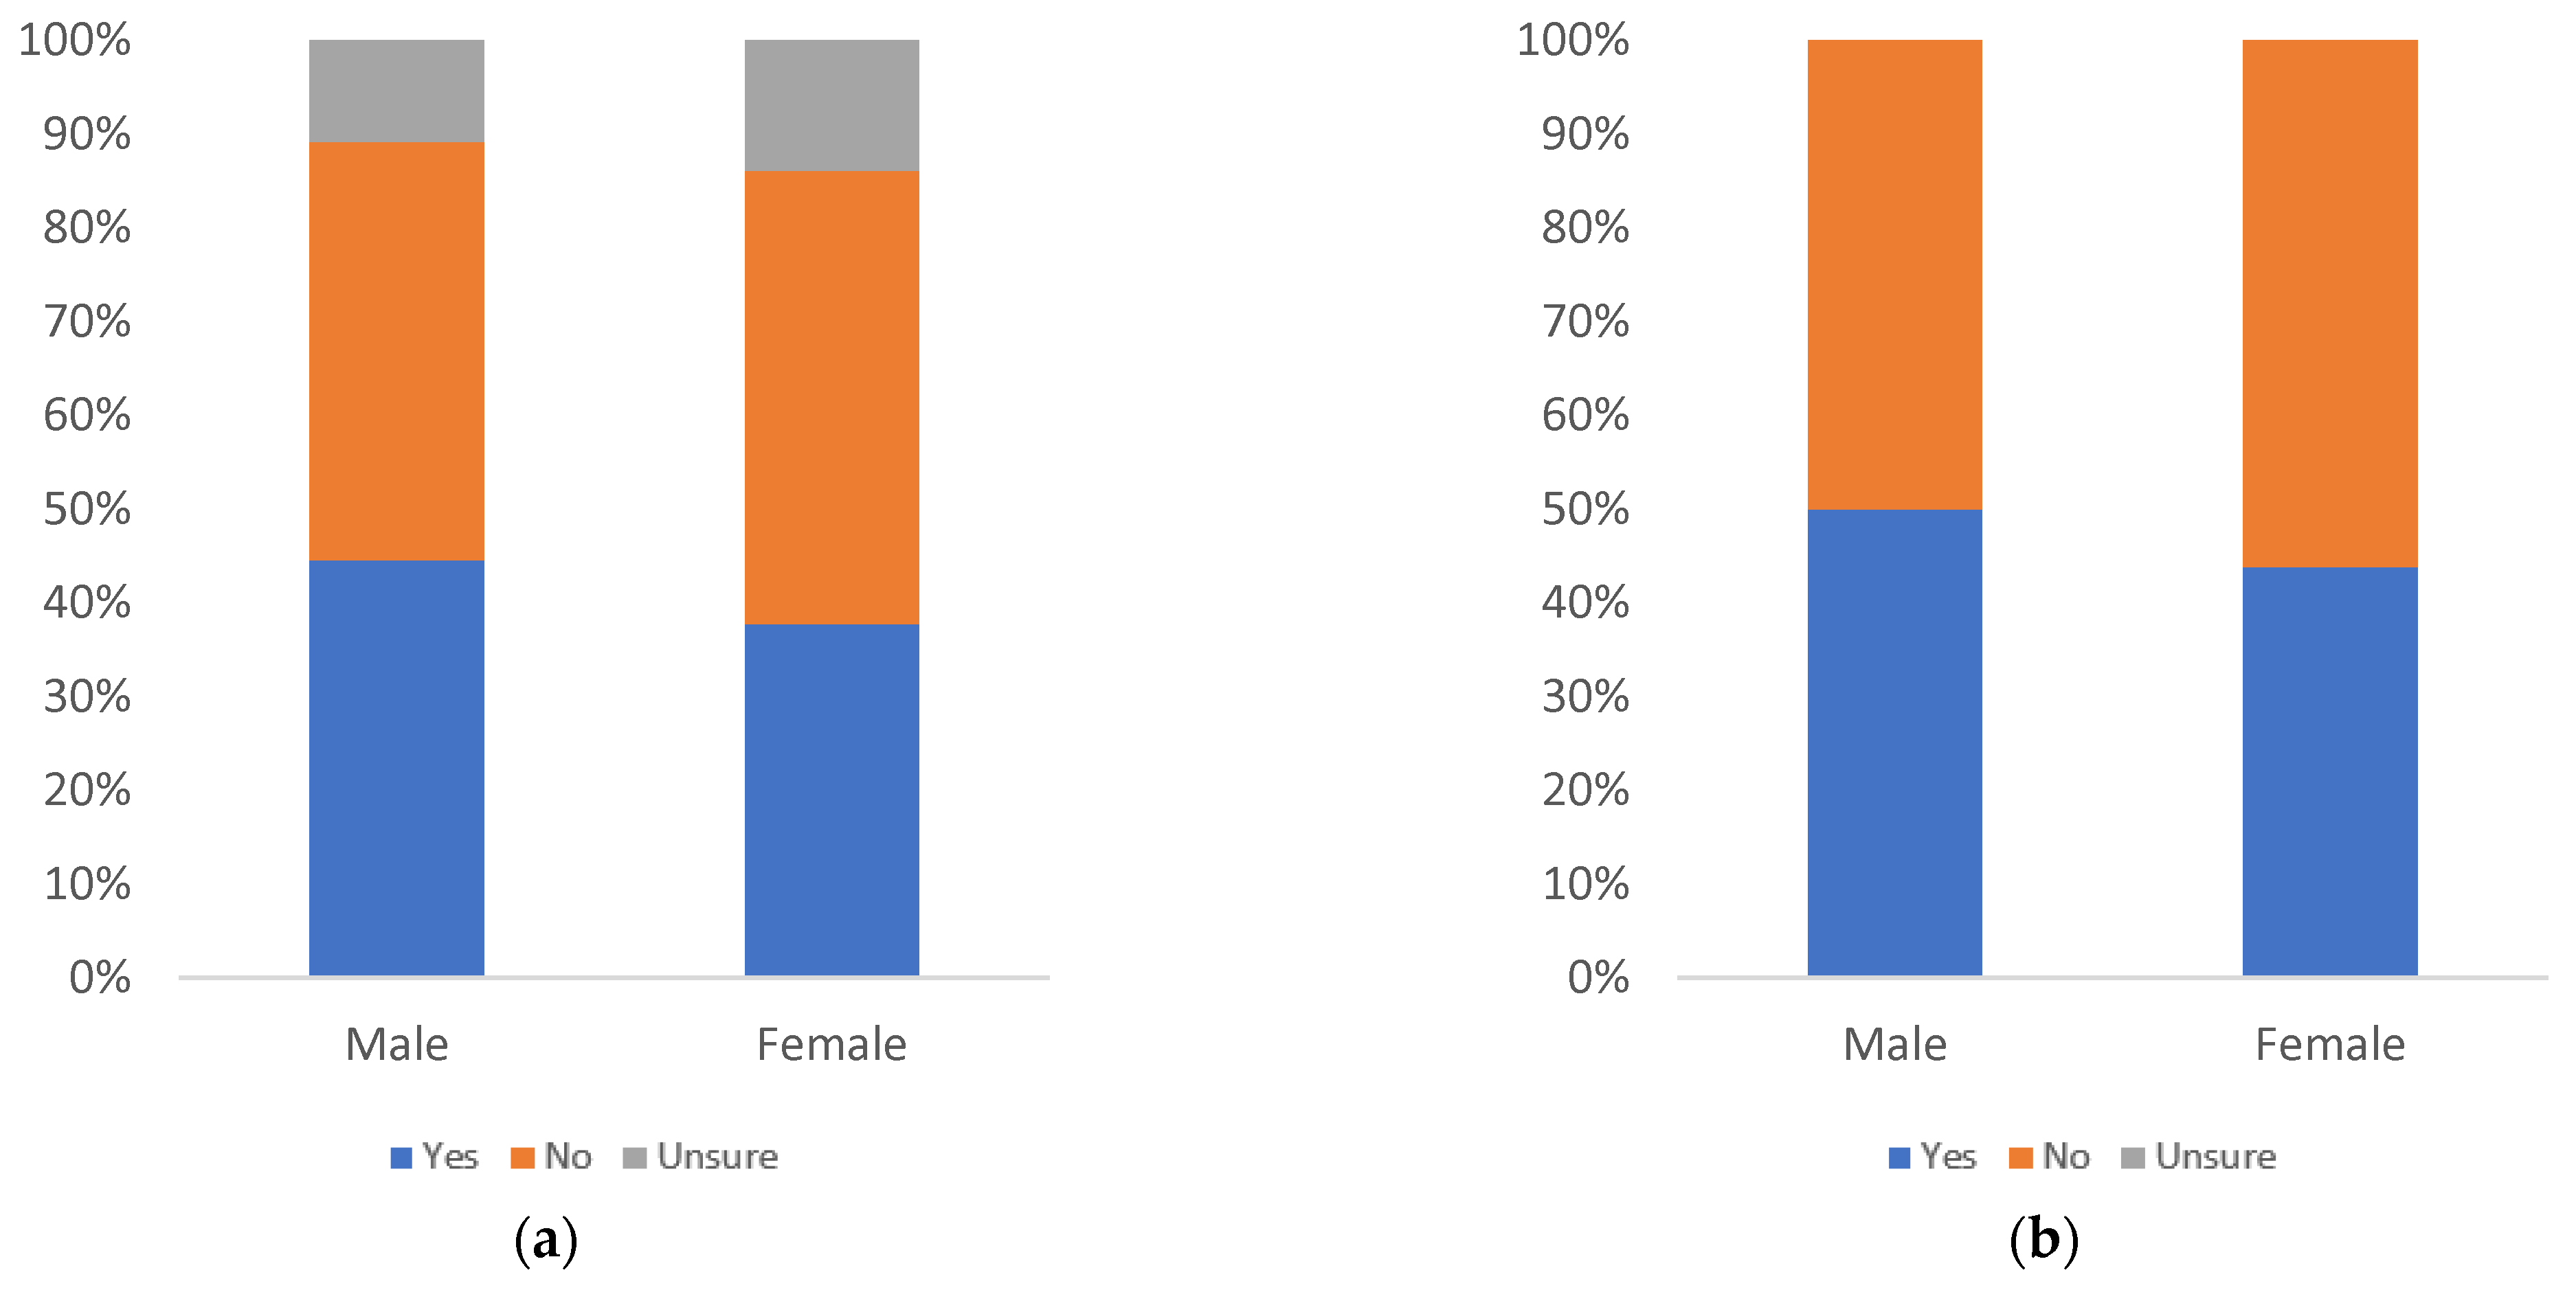
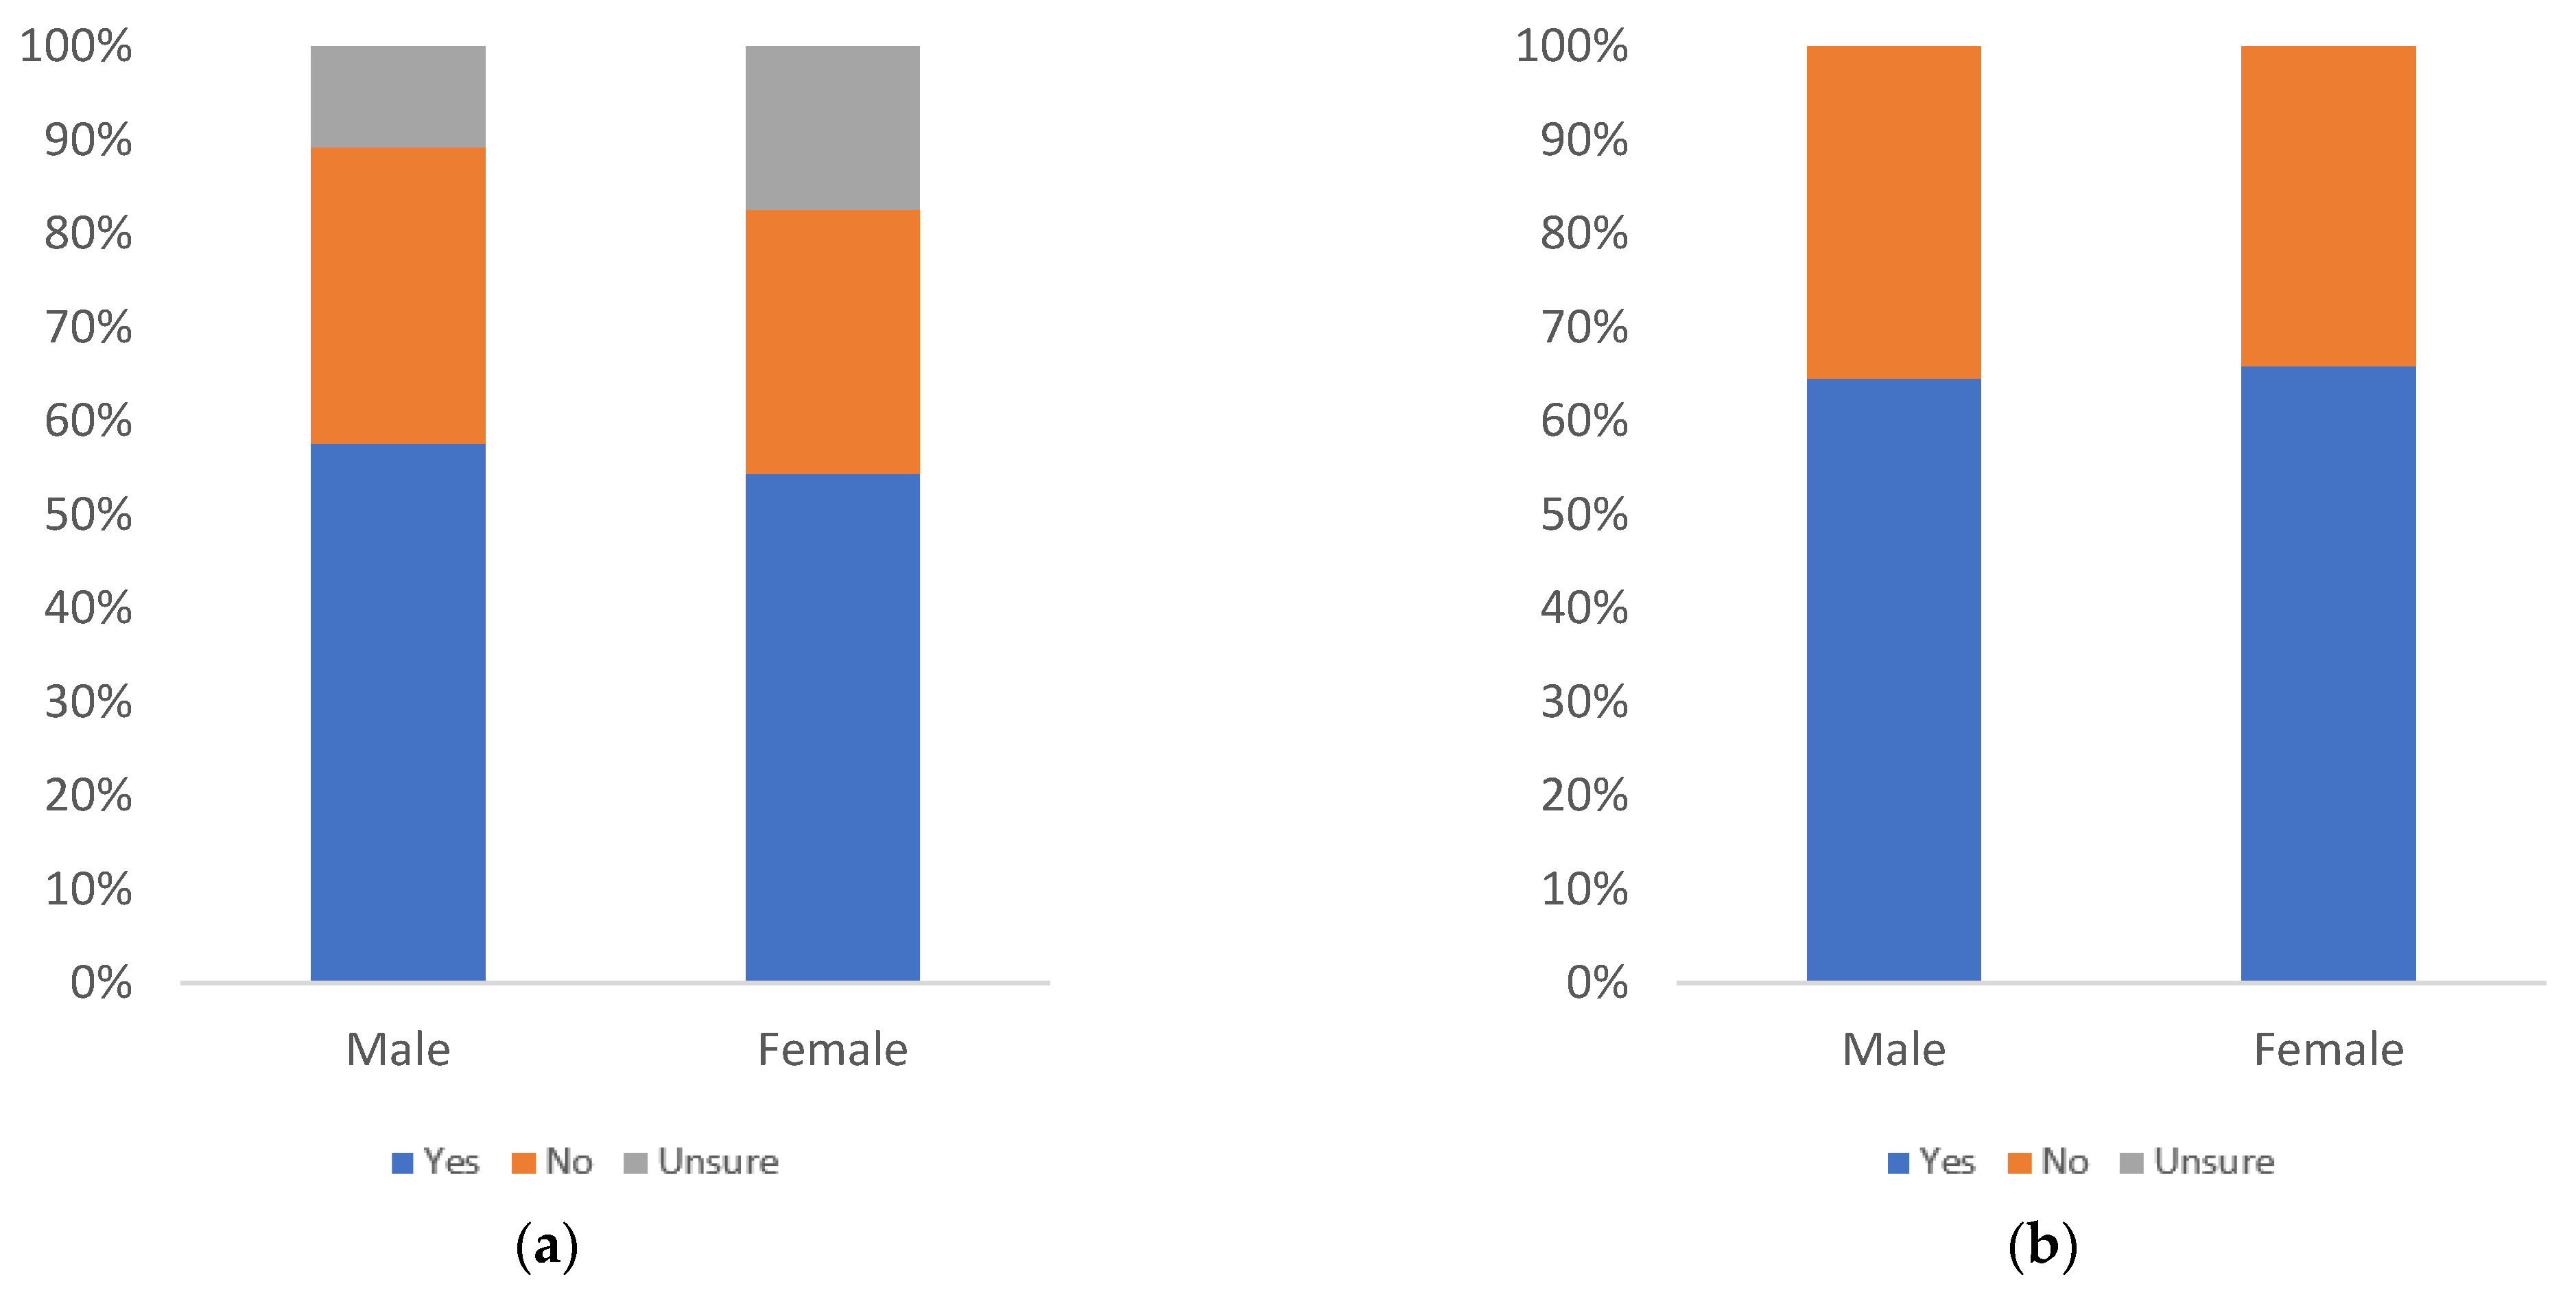
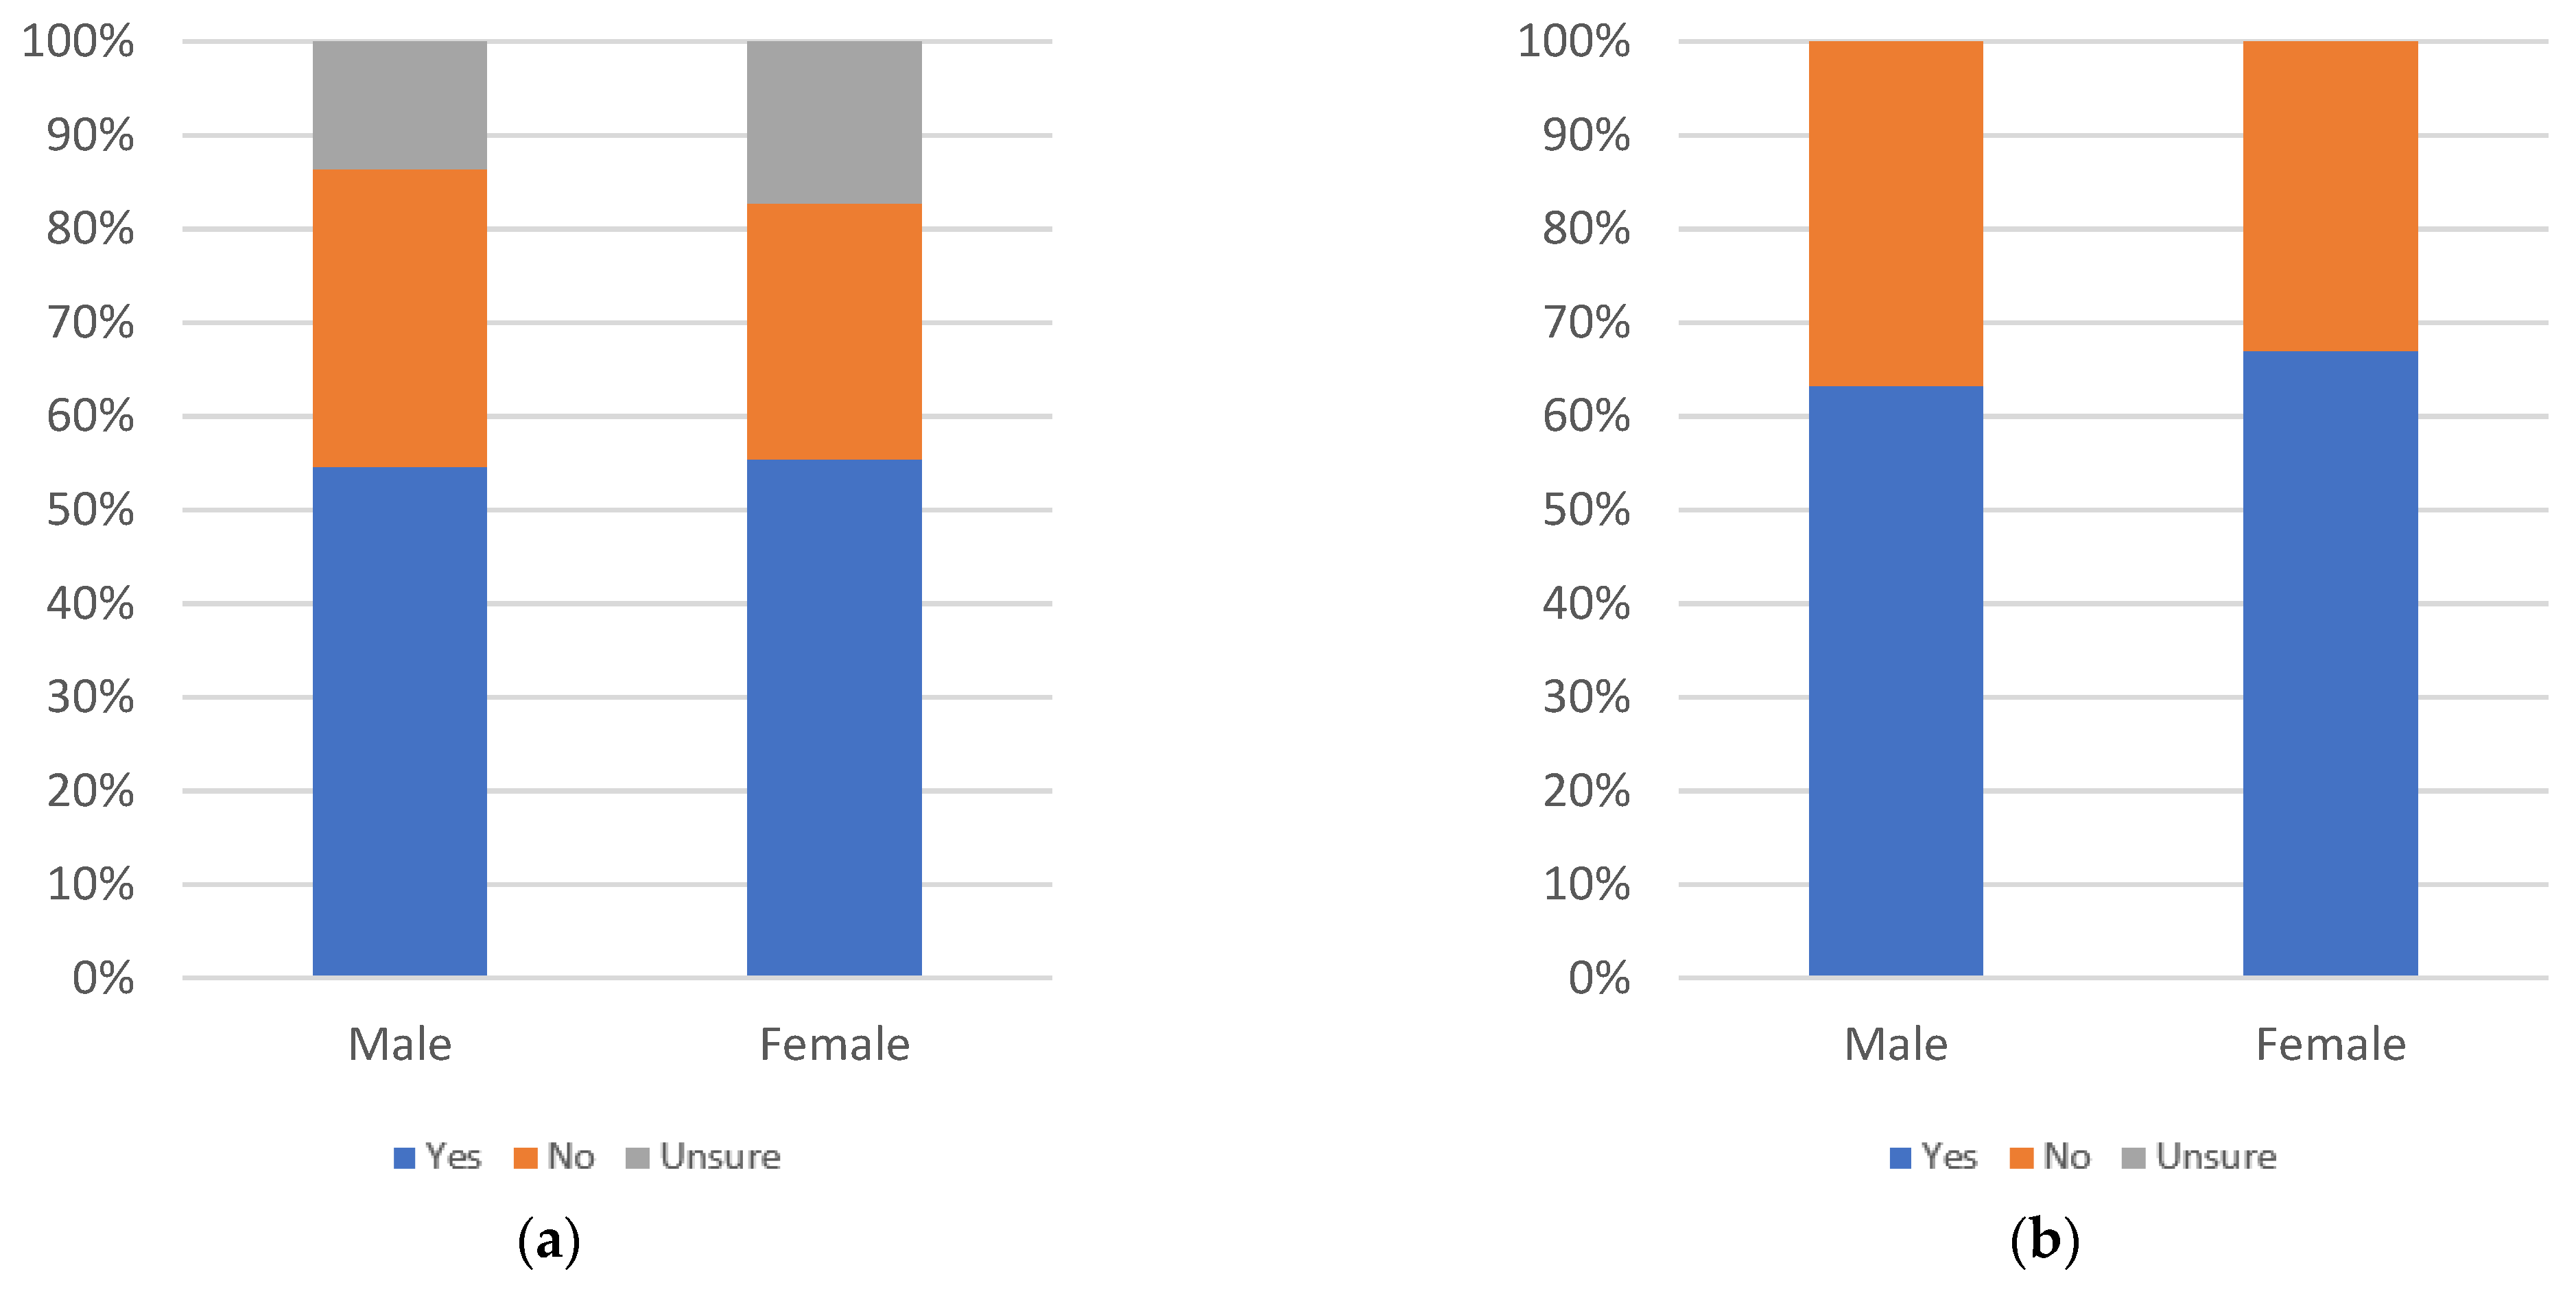
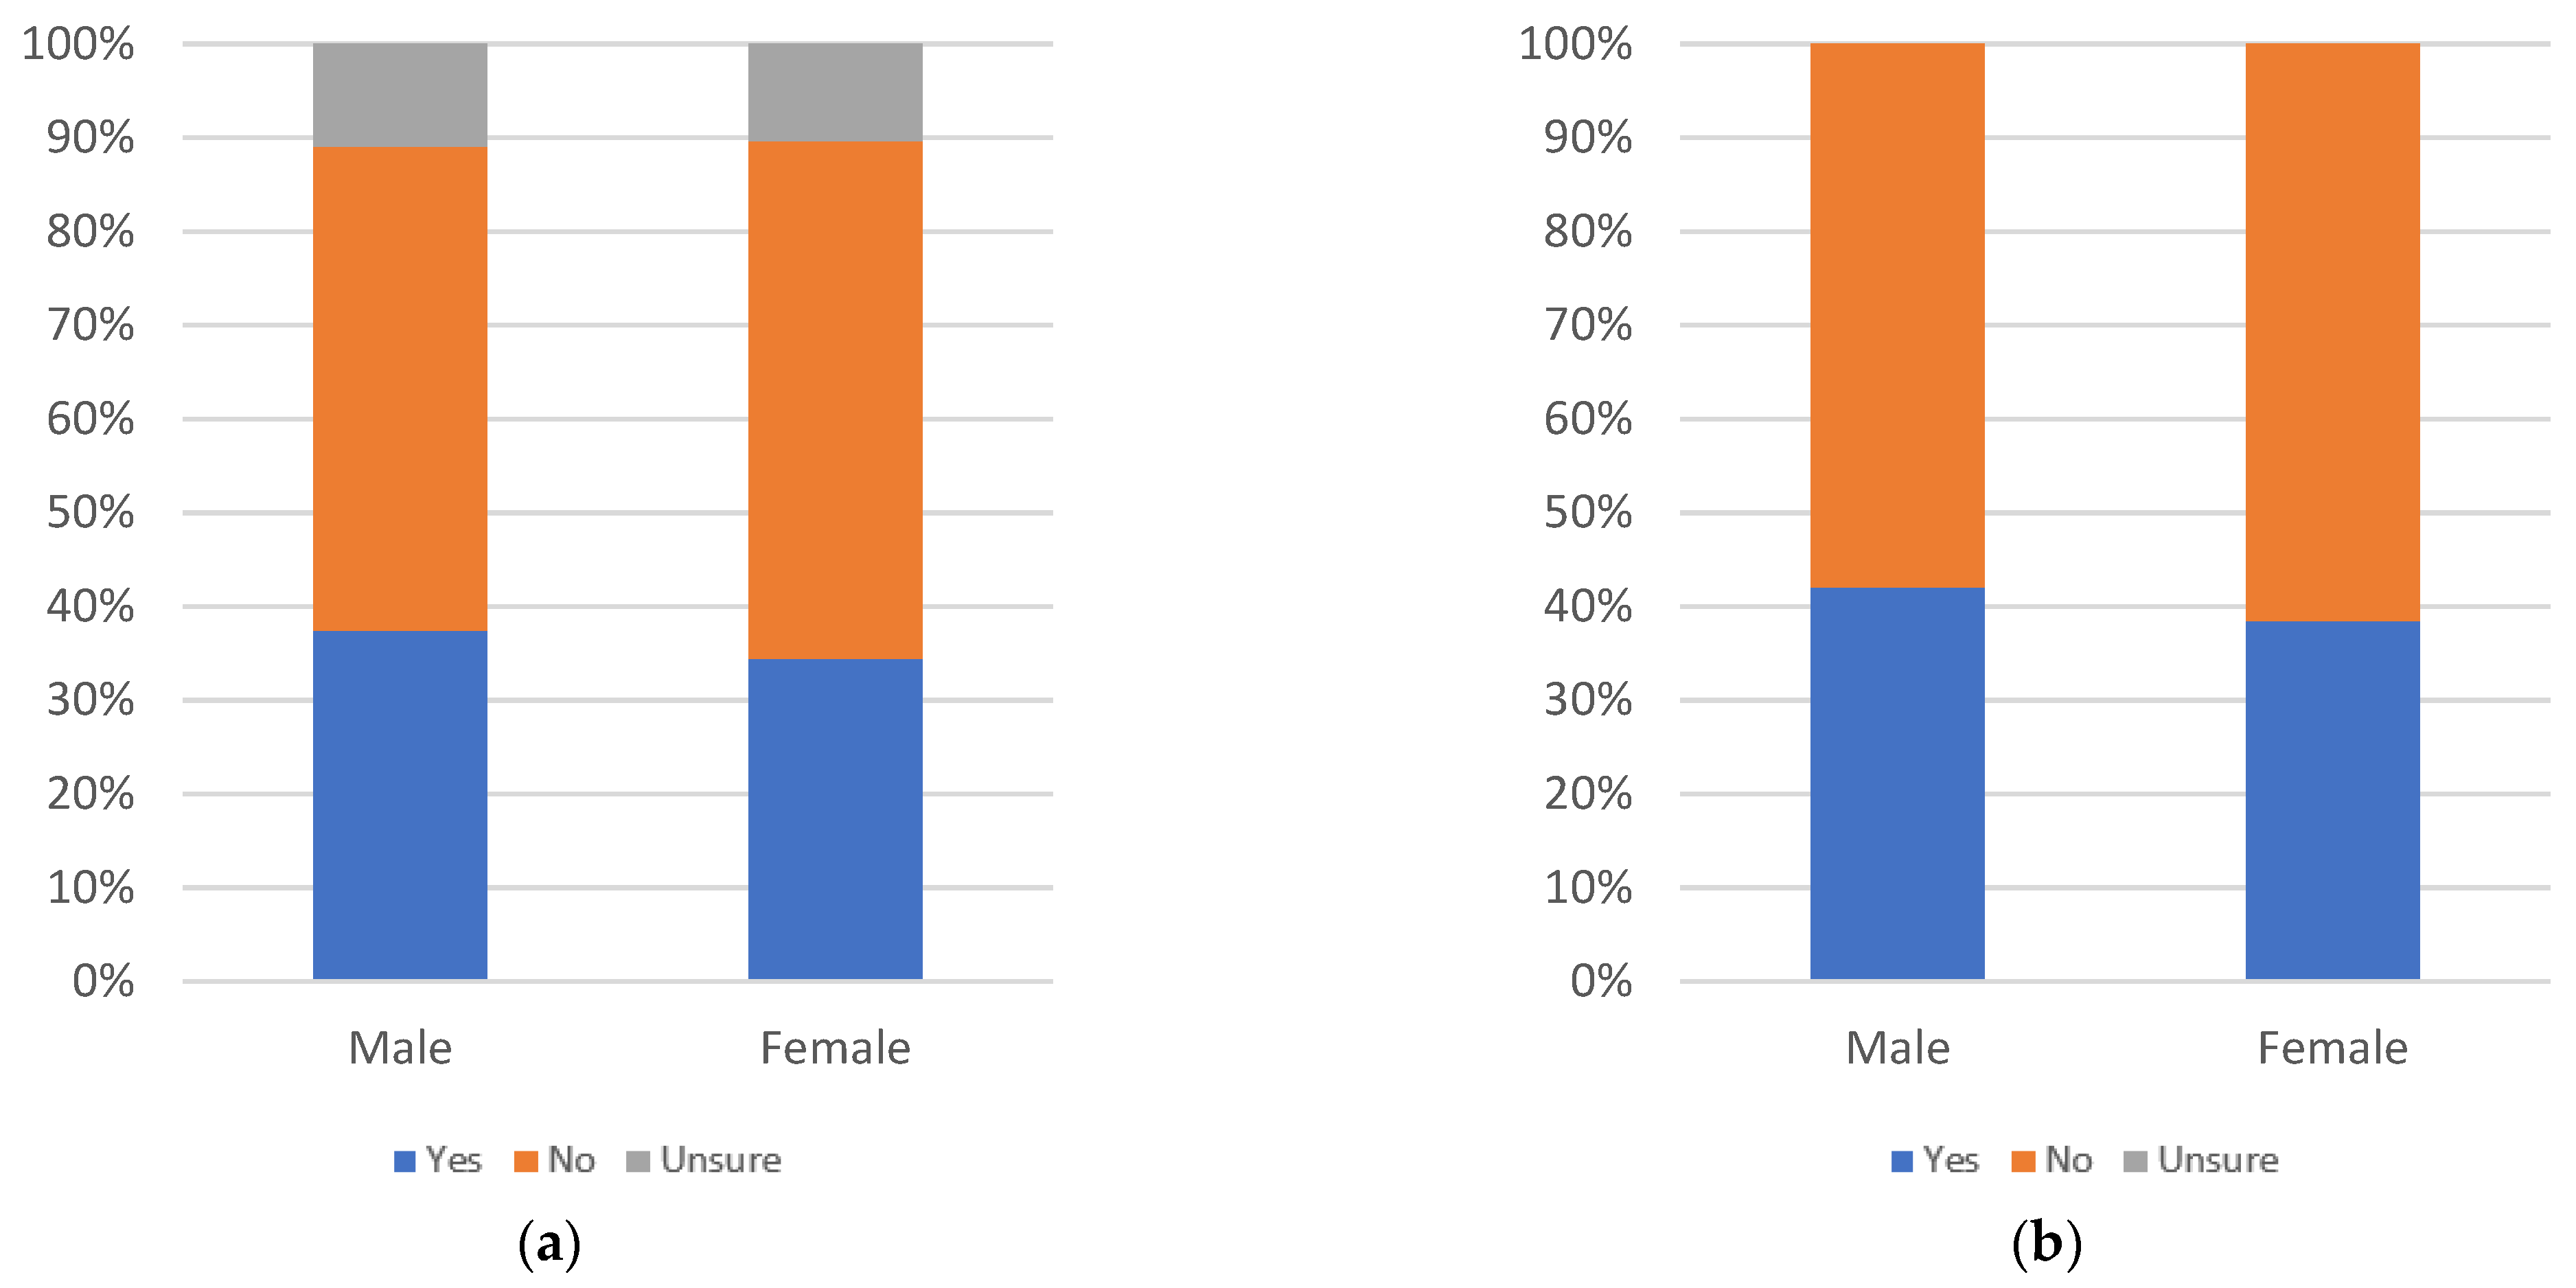
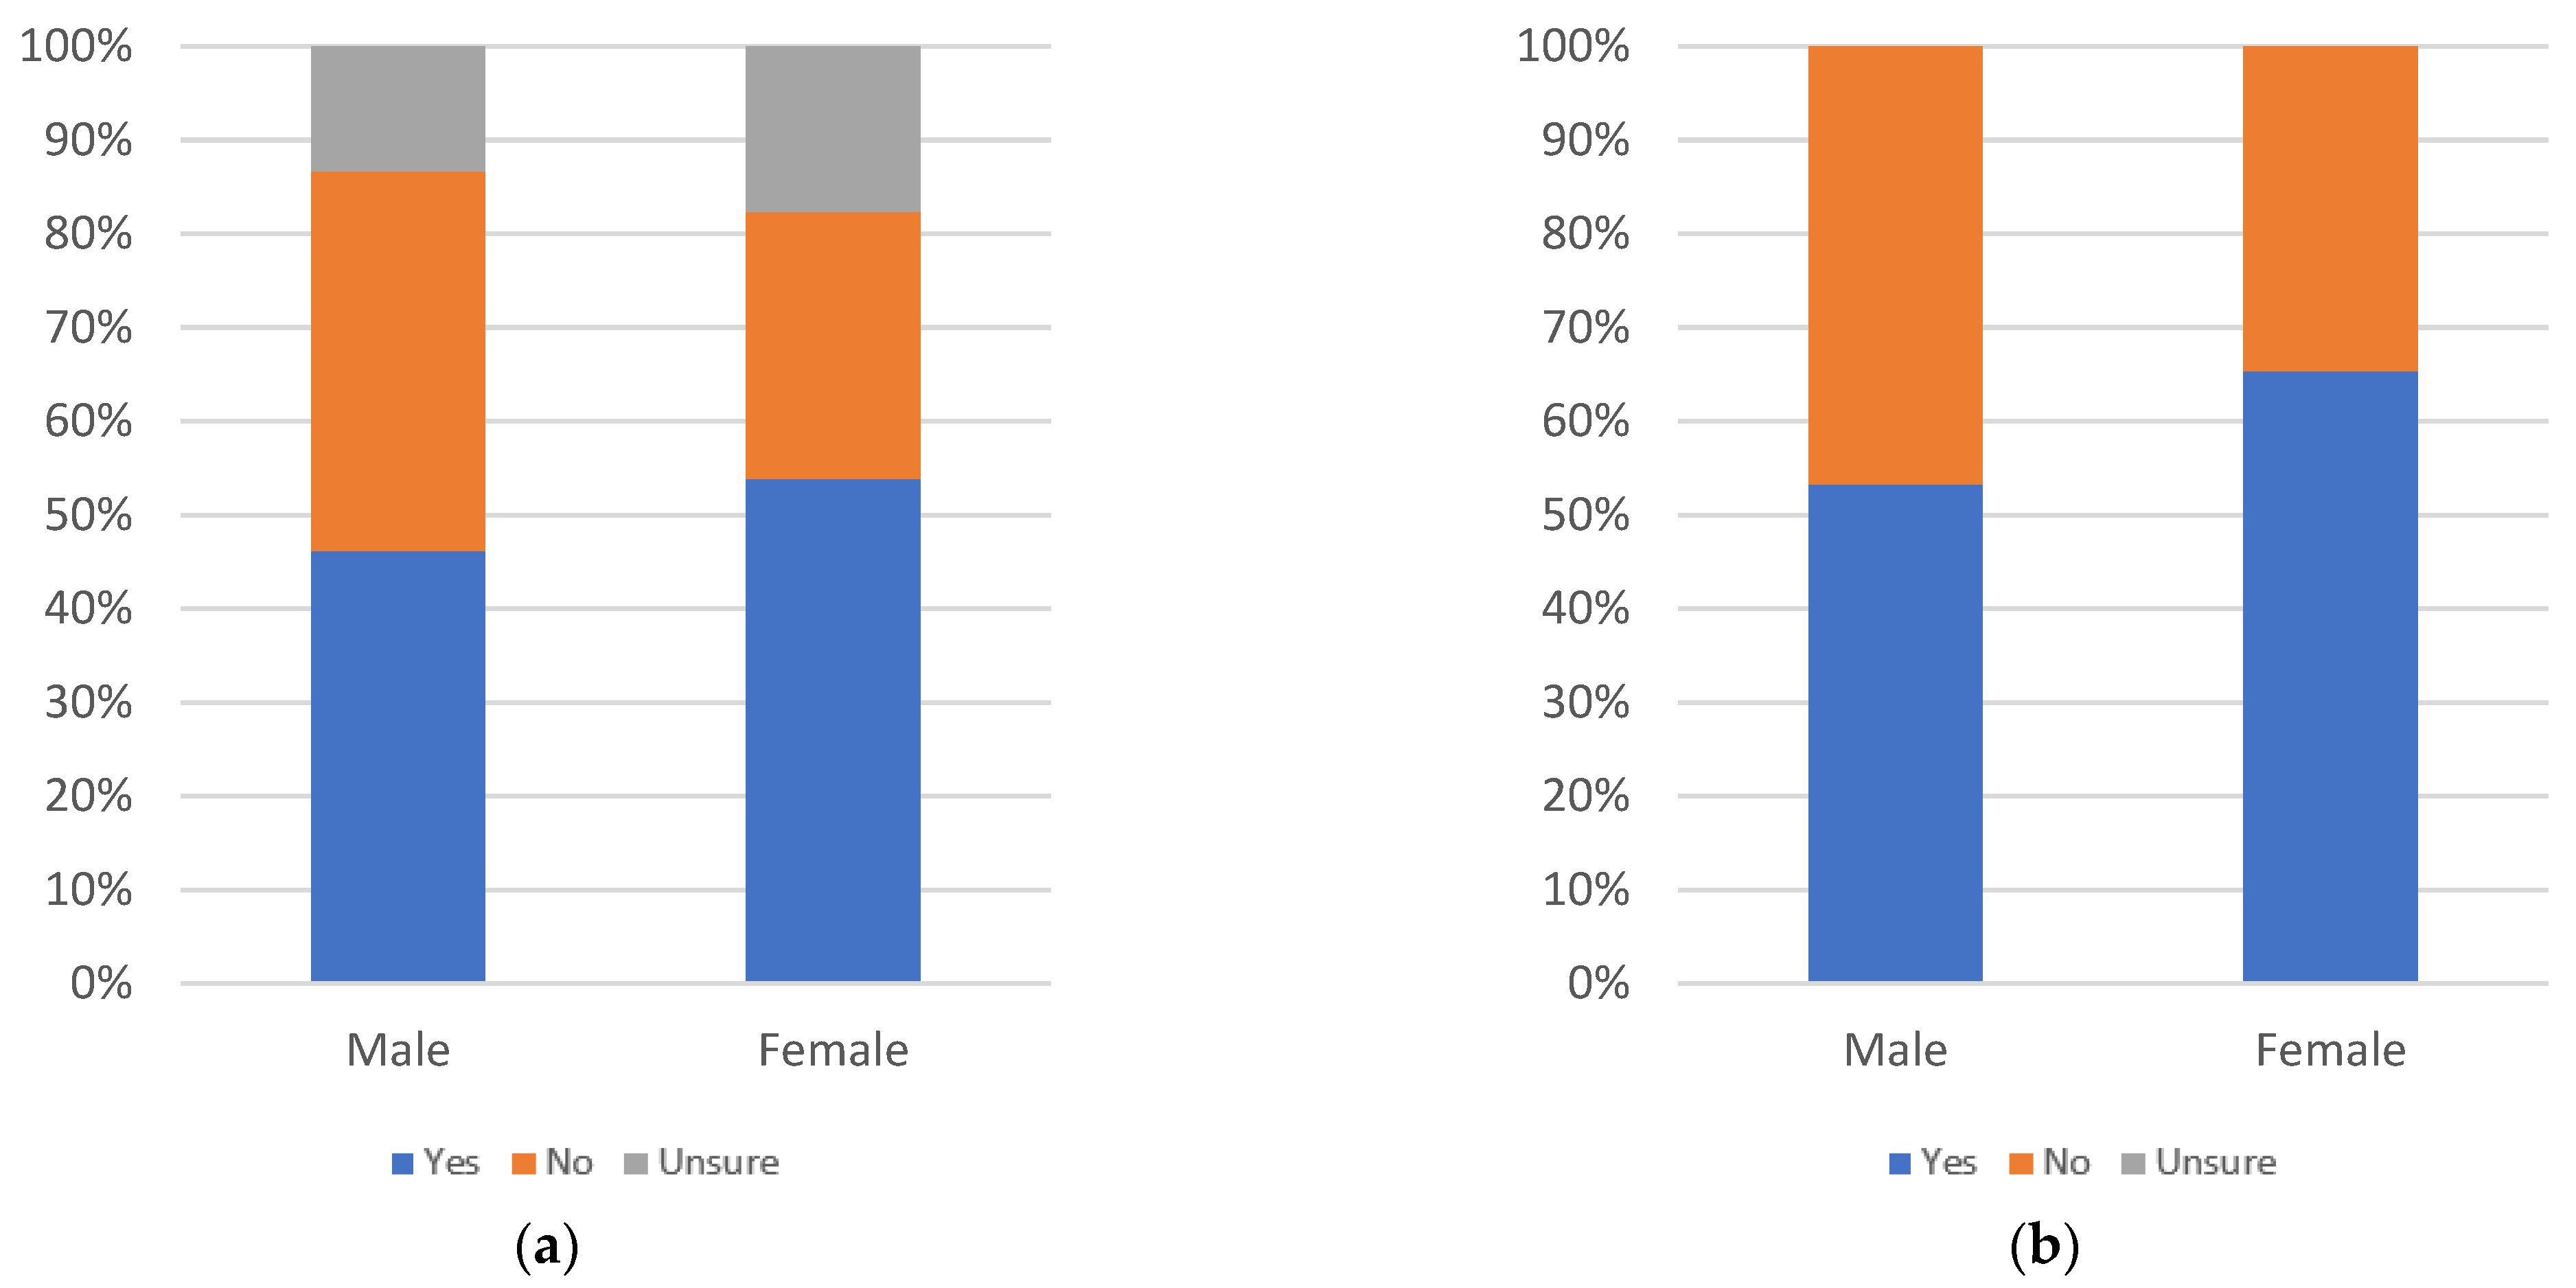
By gender, there are more yes responses among males than females and more uncertainty among female respondents. Both groups have less than 50% of respondents answering yes, even when uncertainty is not considered. This indicates a low level of annoyingness overall, amongst both gender groups.
Figure 11, Figure 12 and 
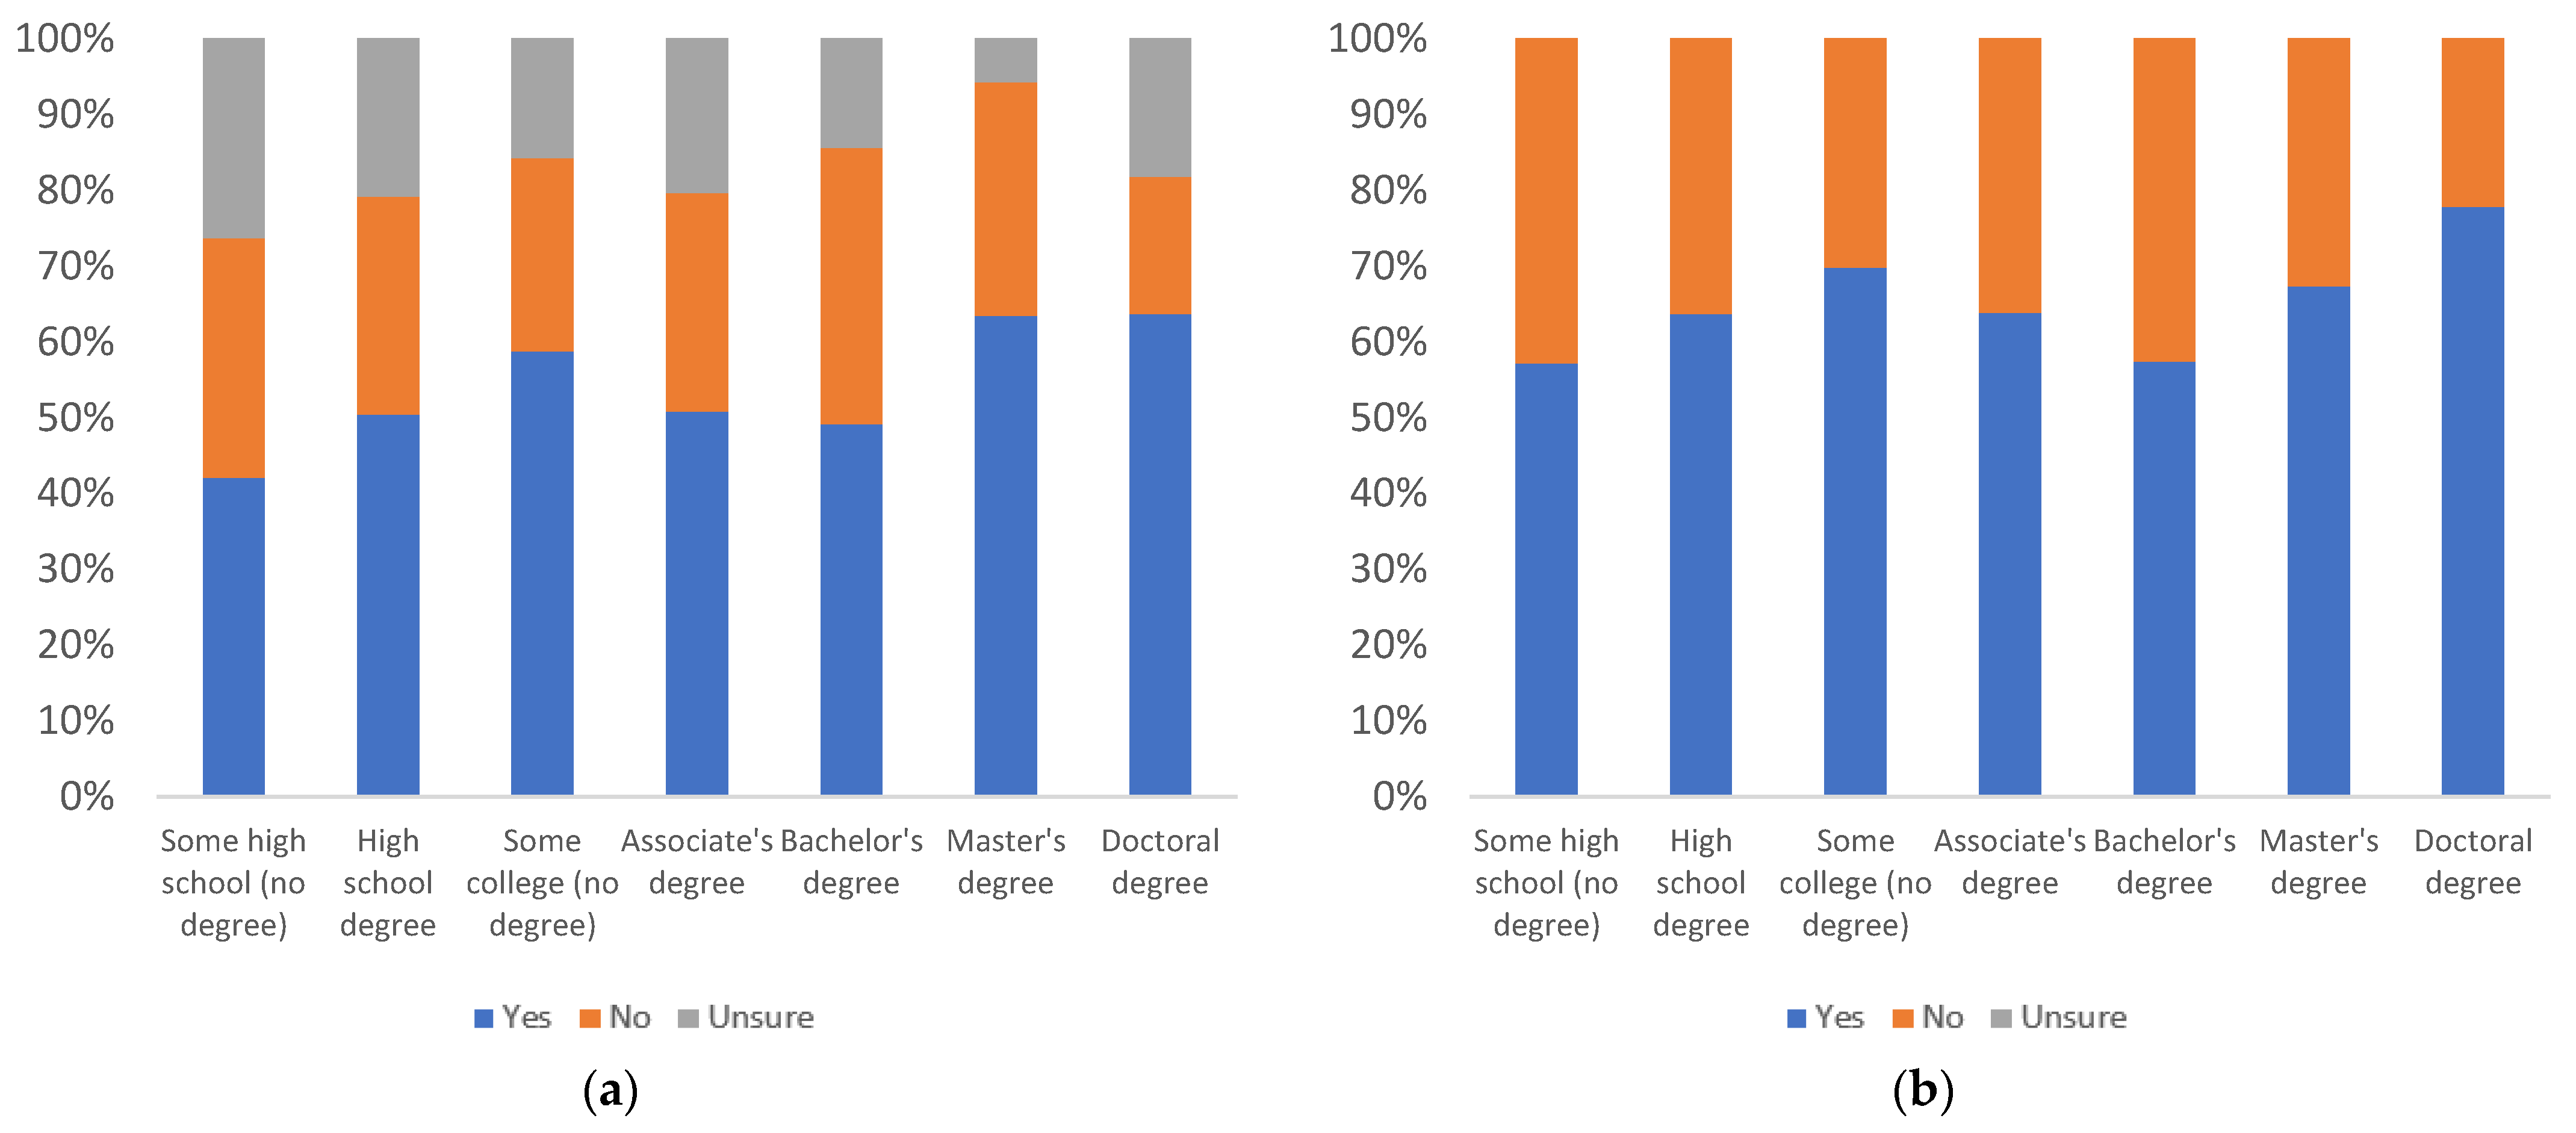
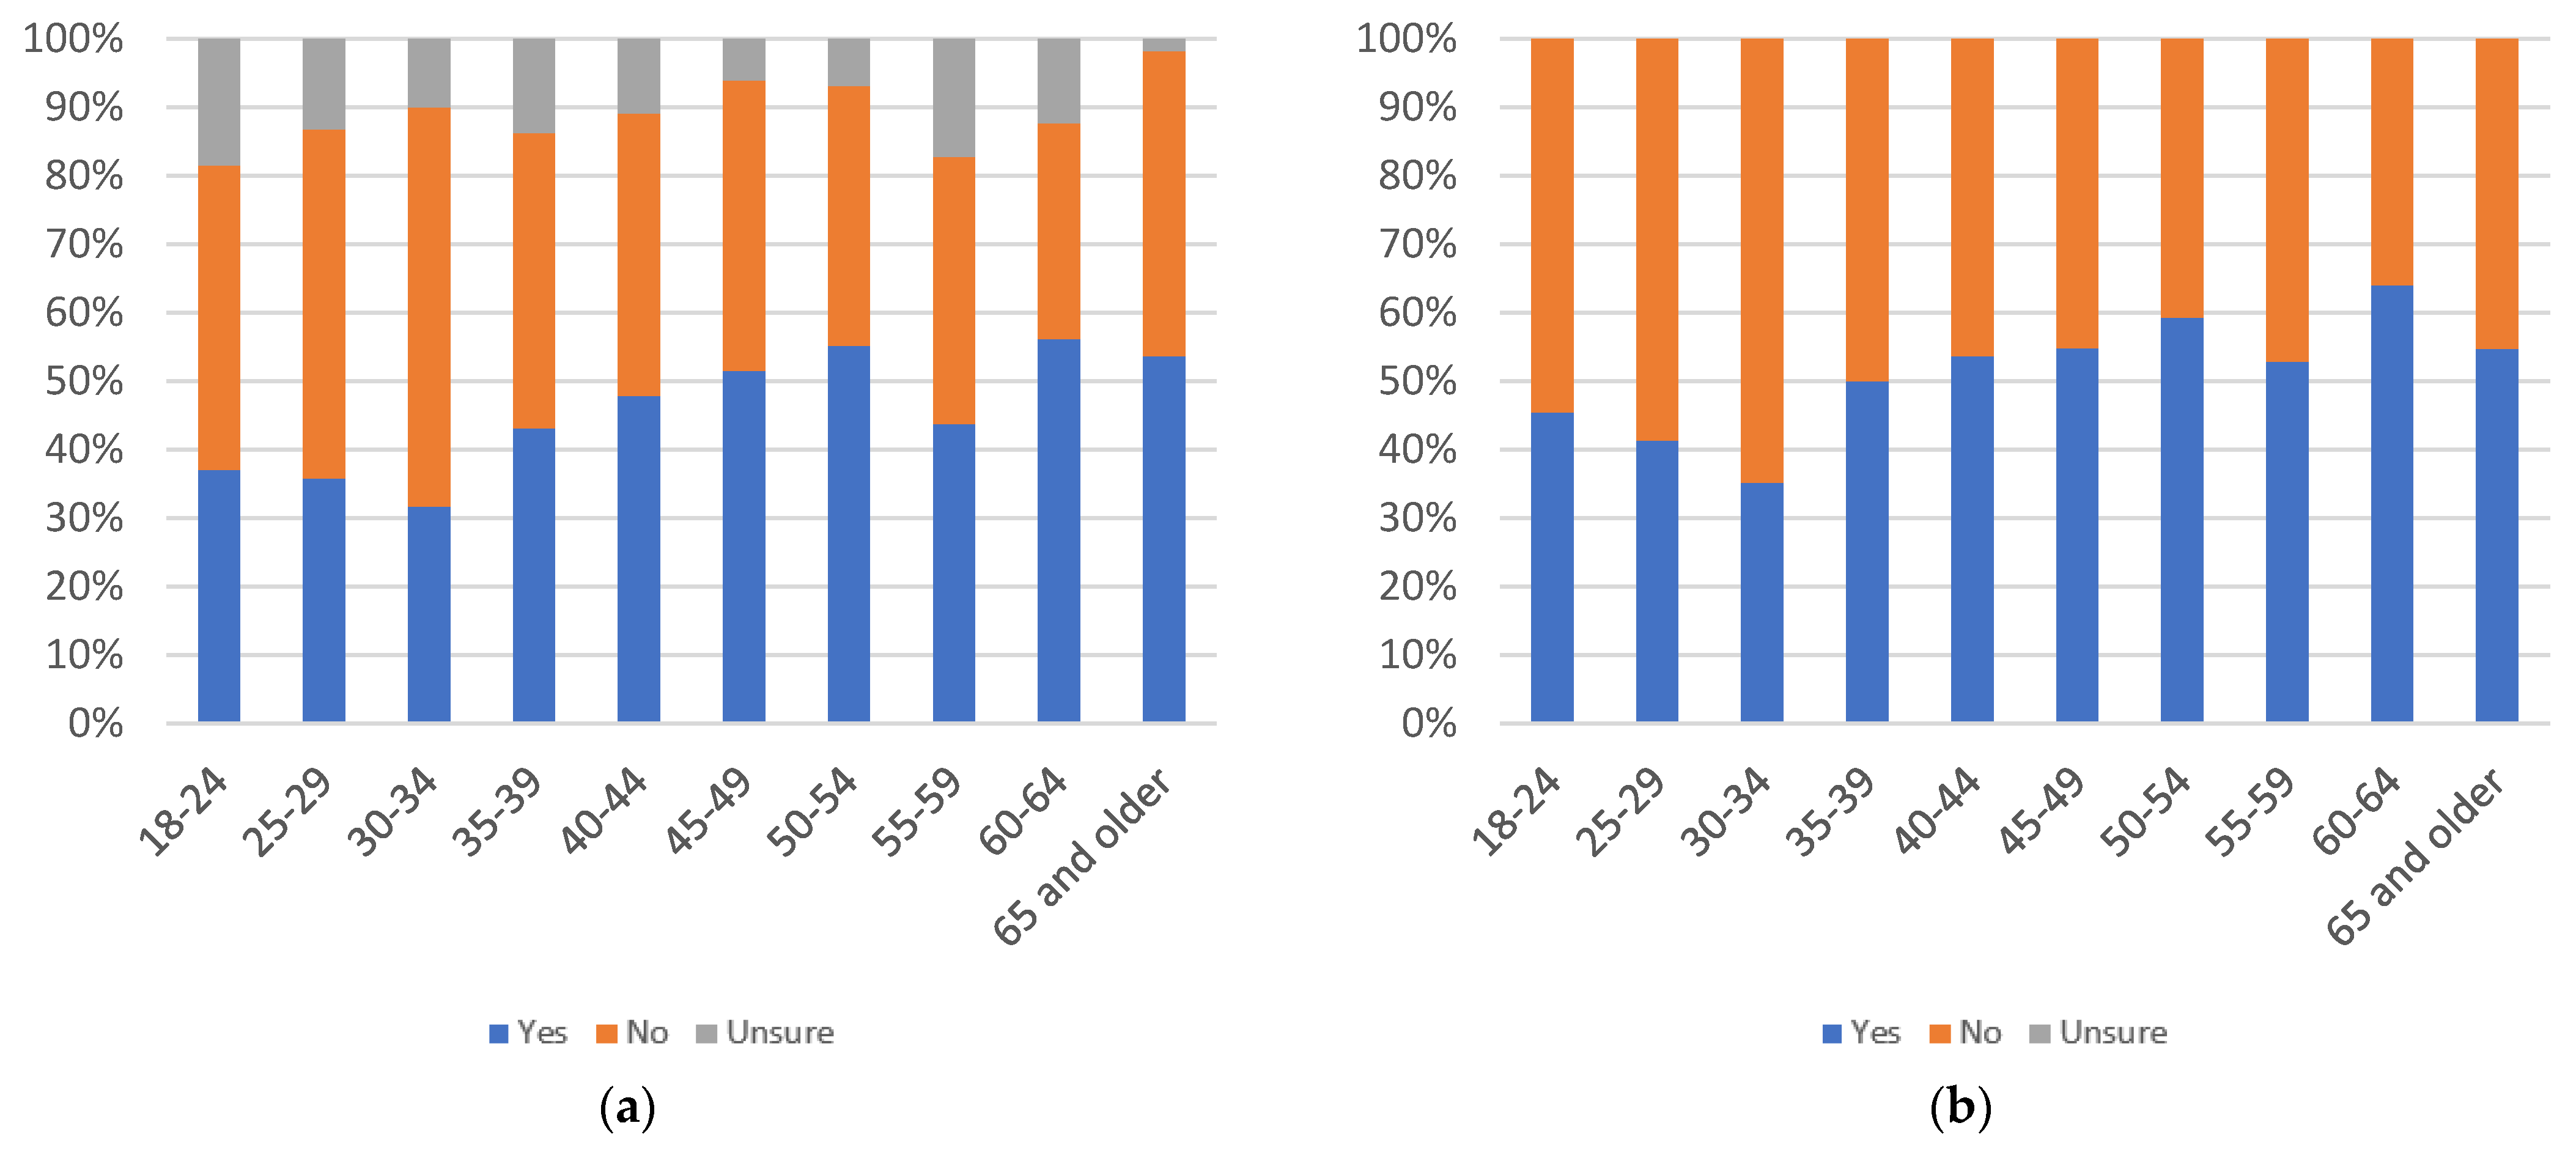
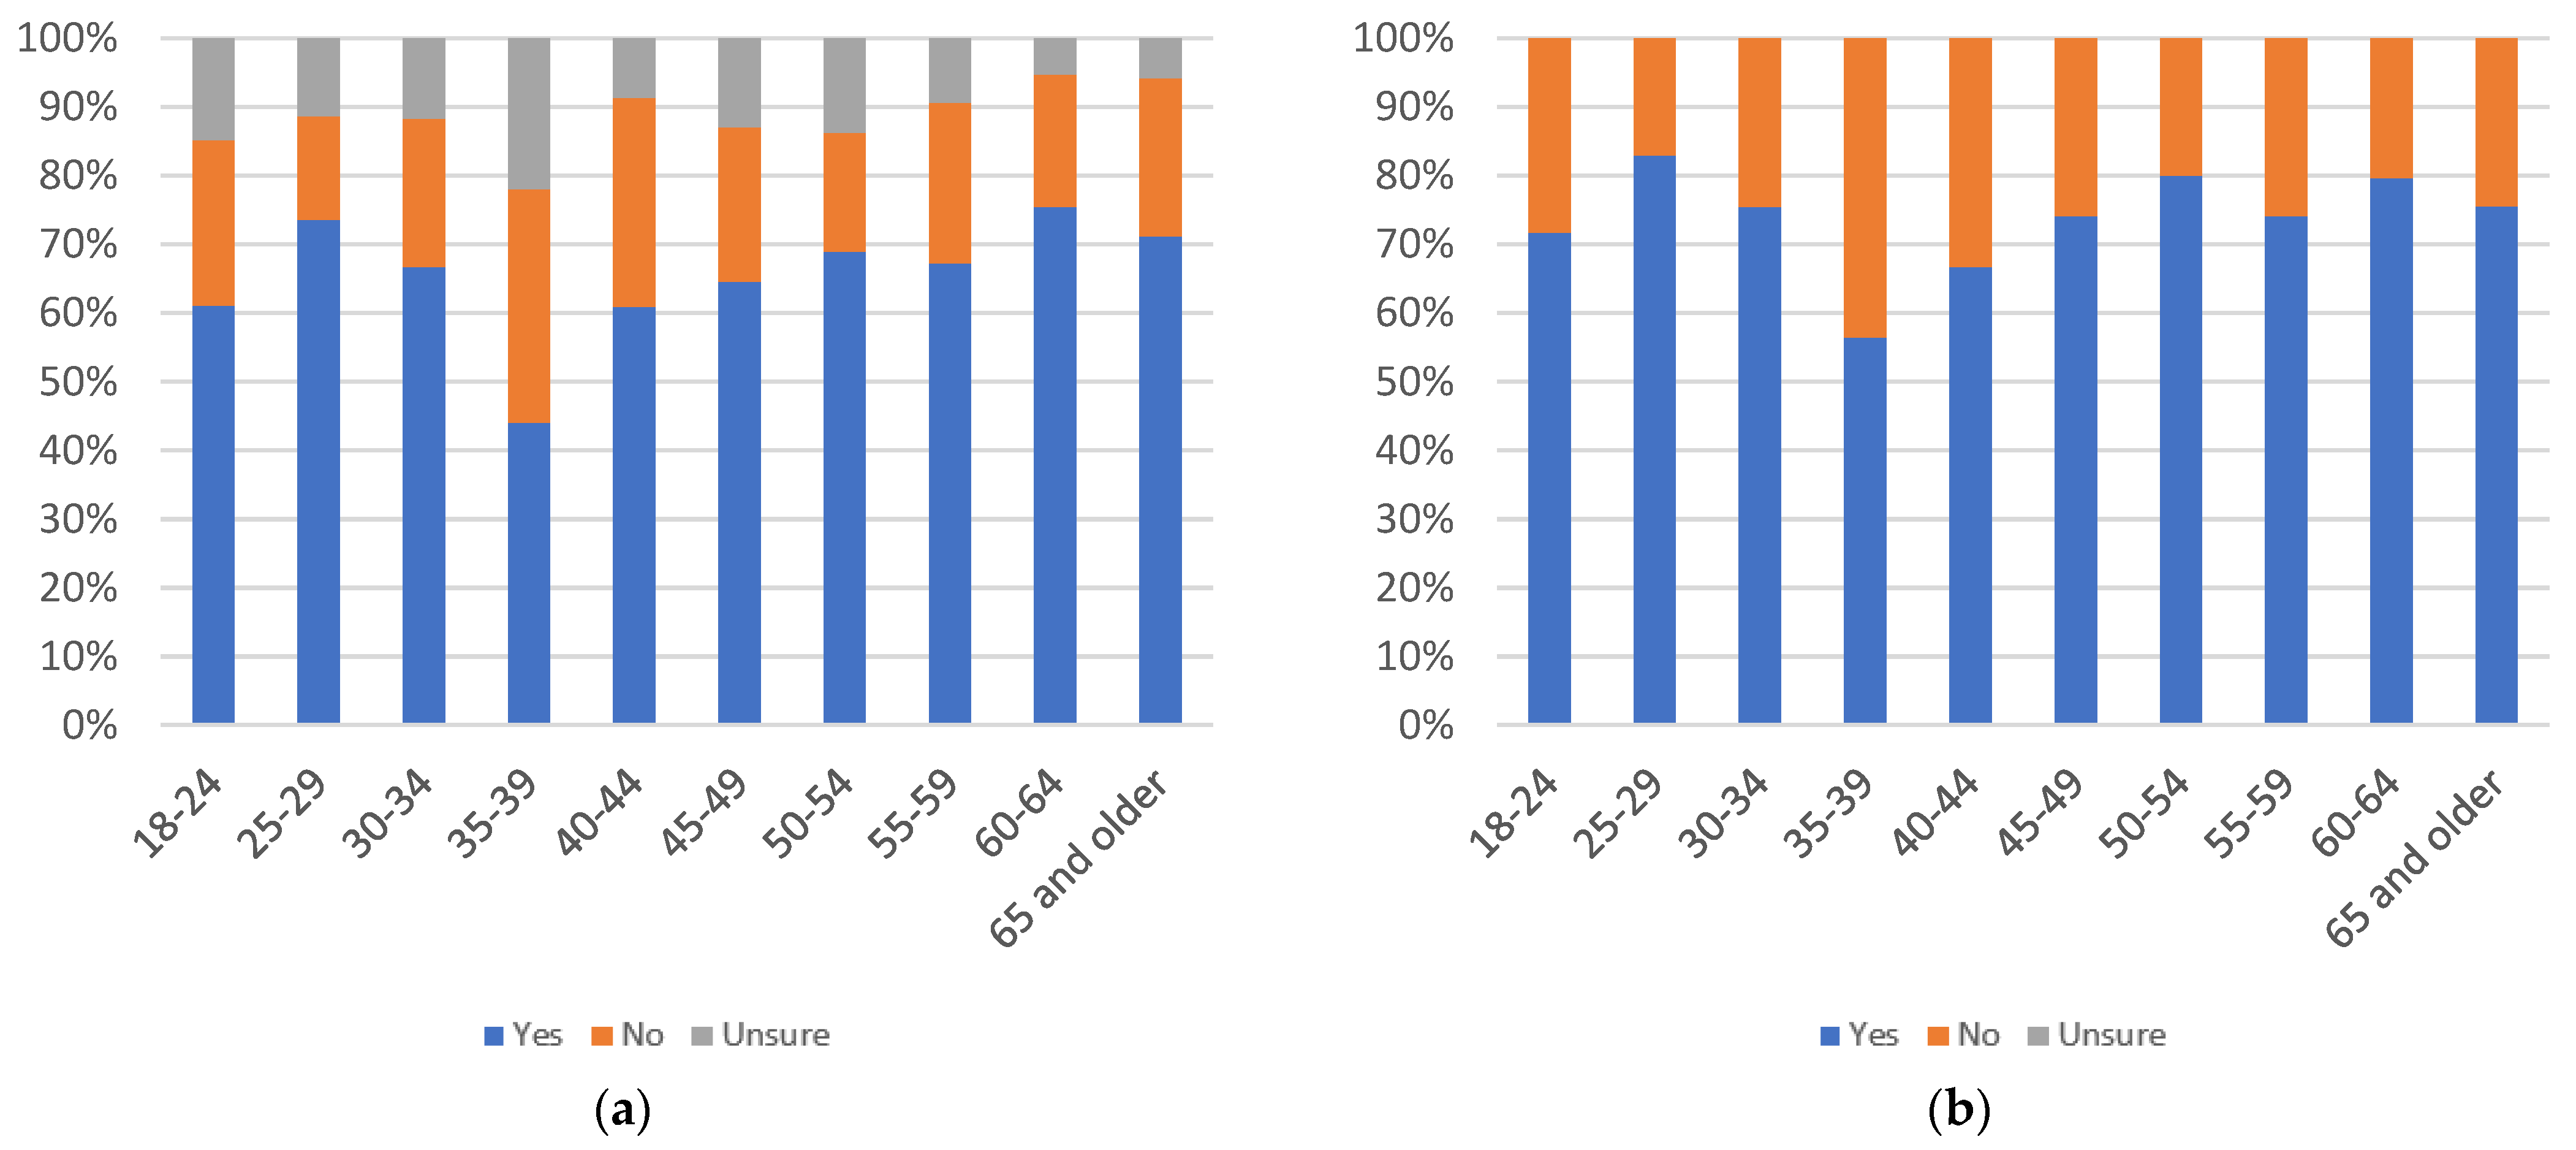
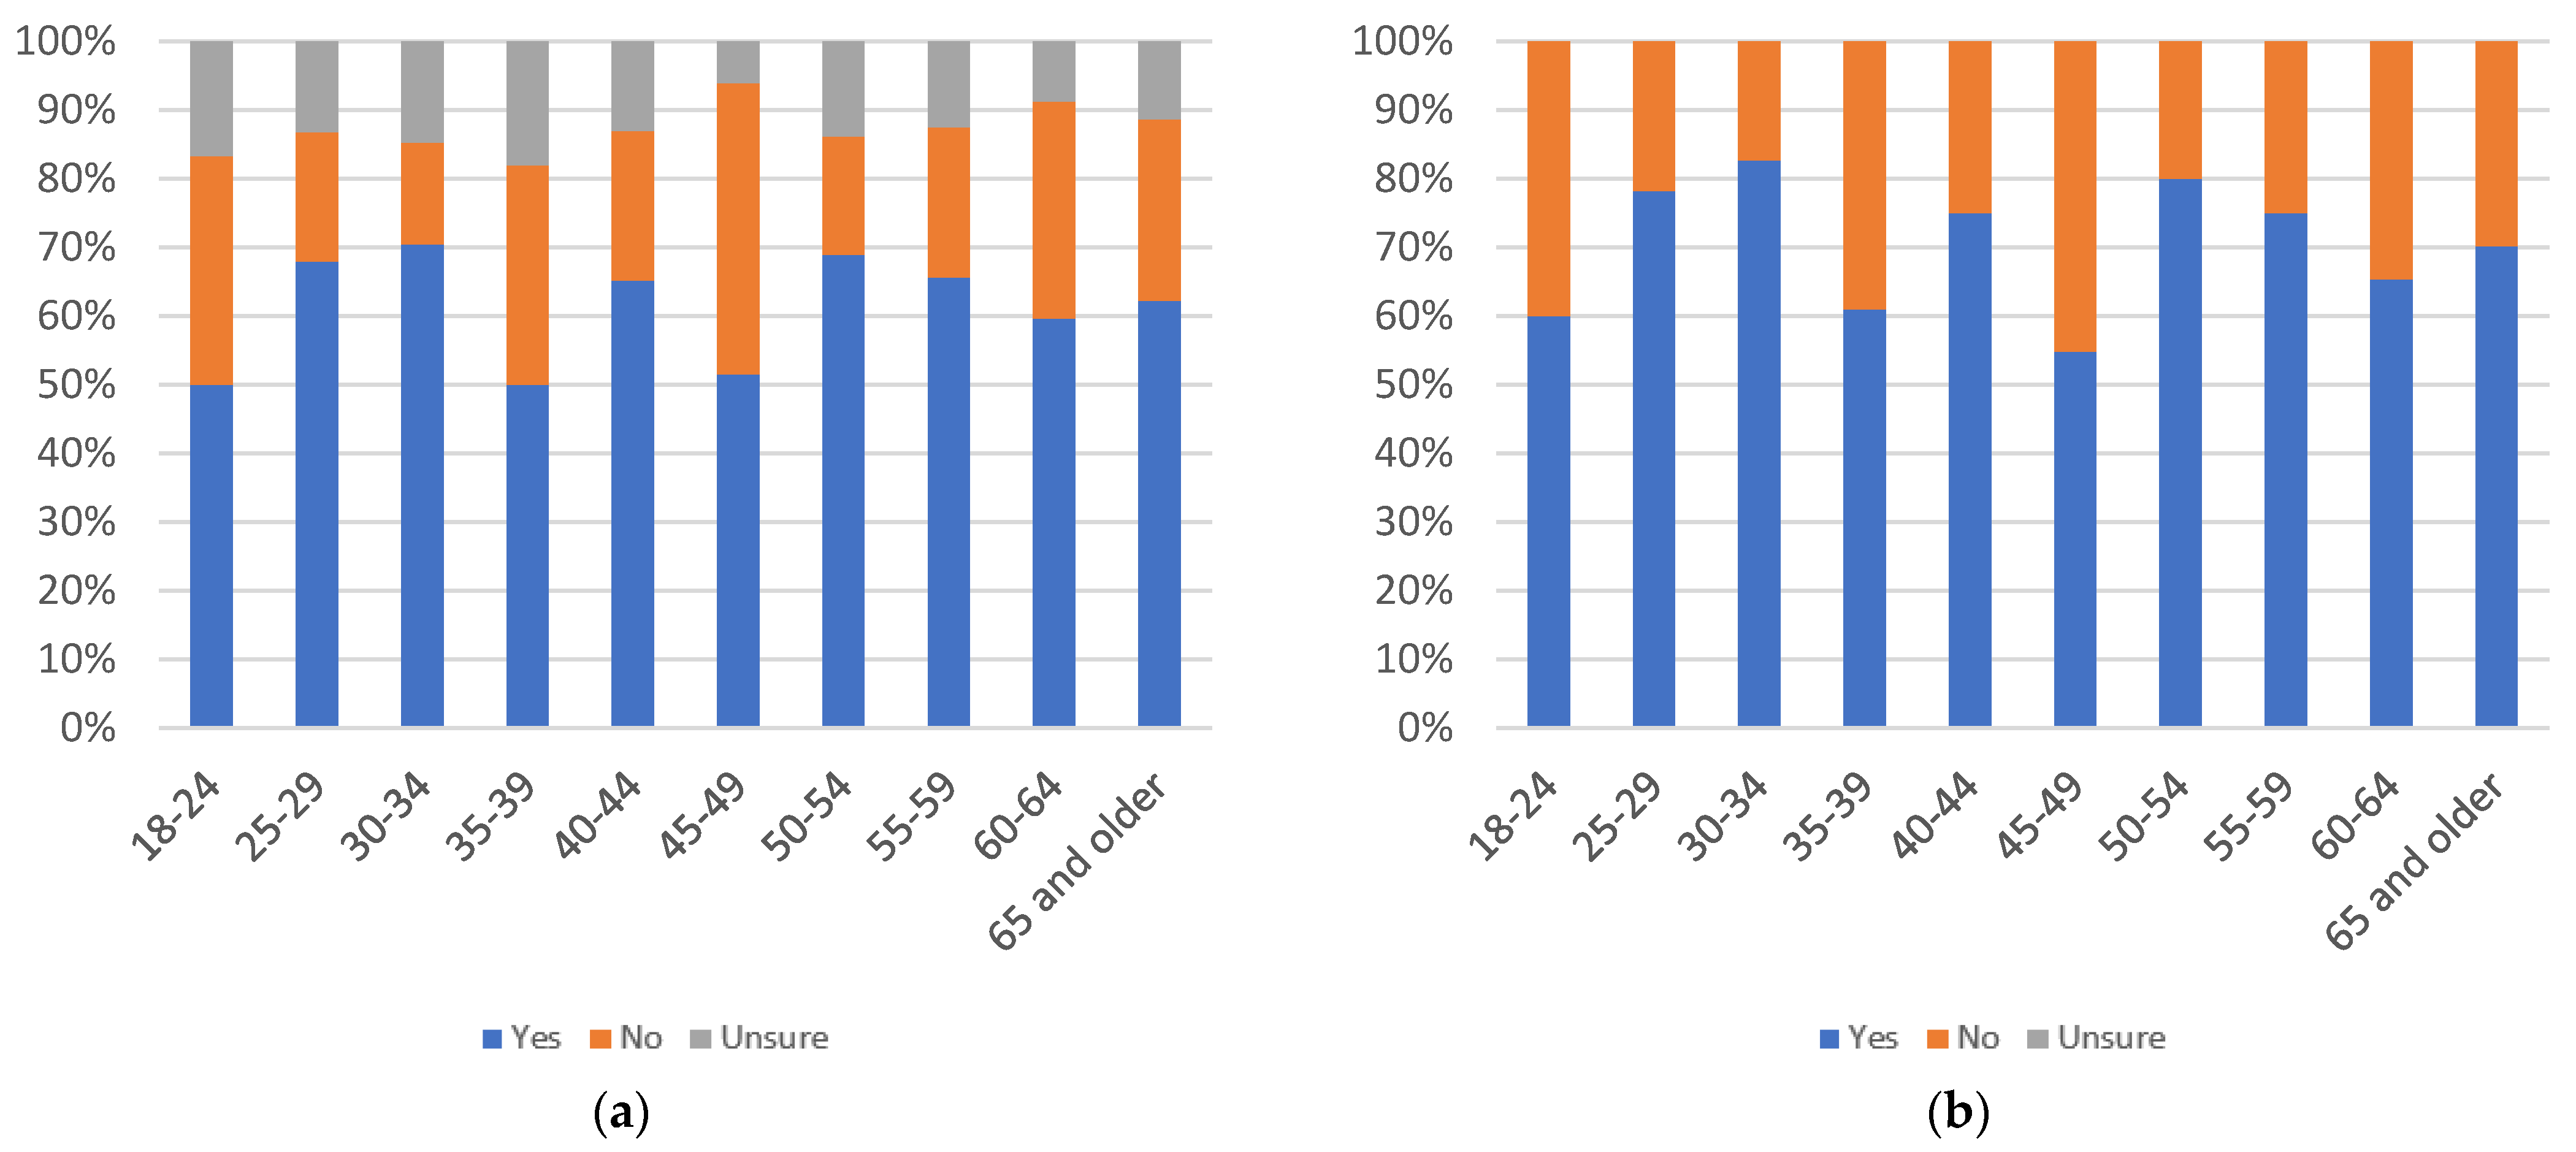
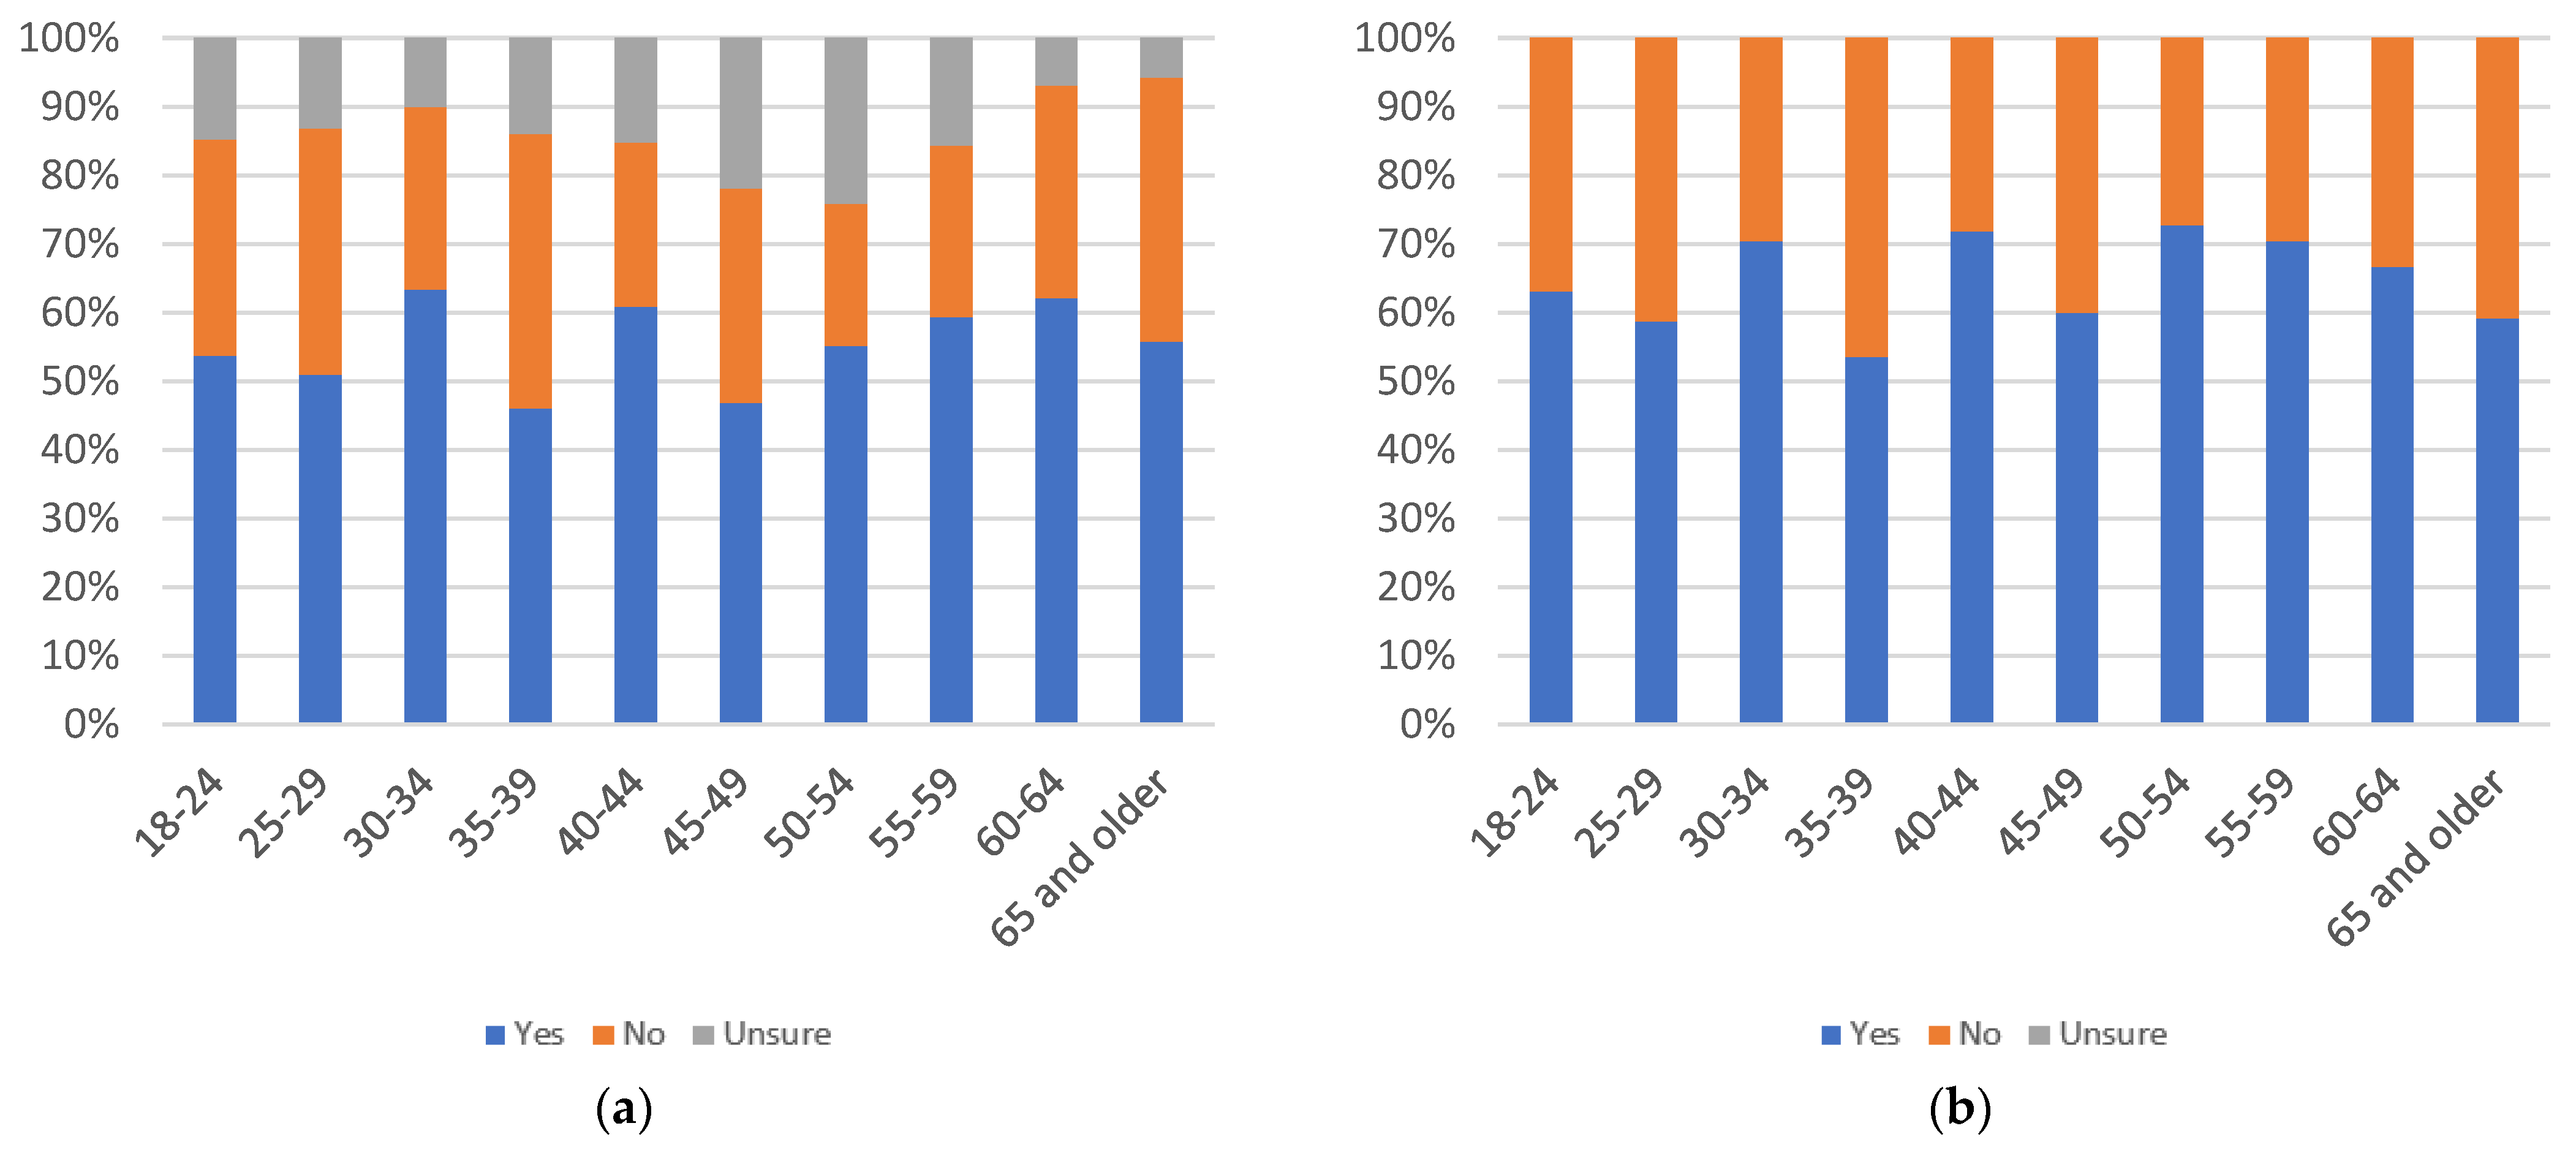
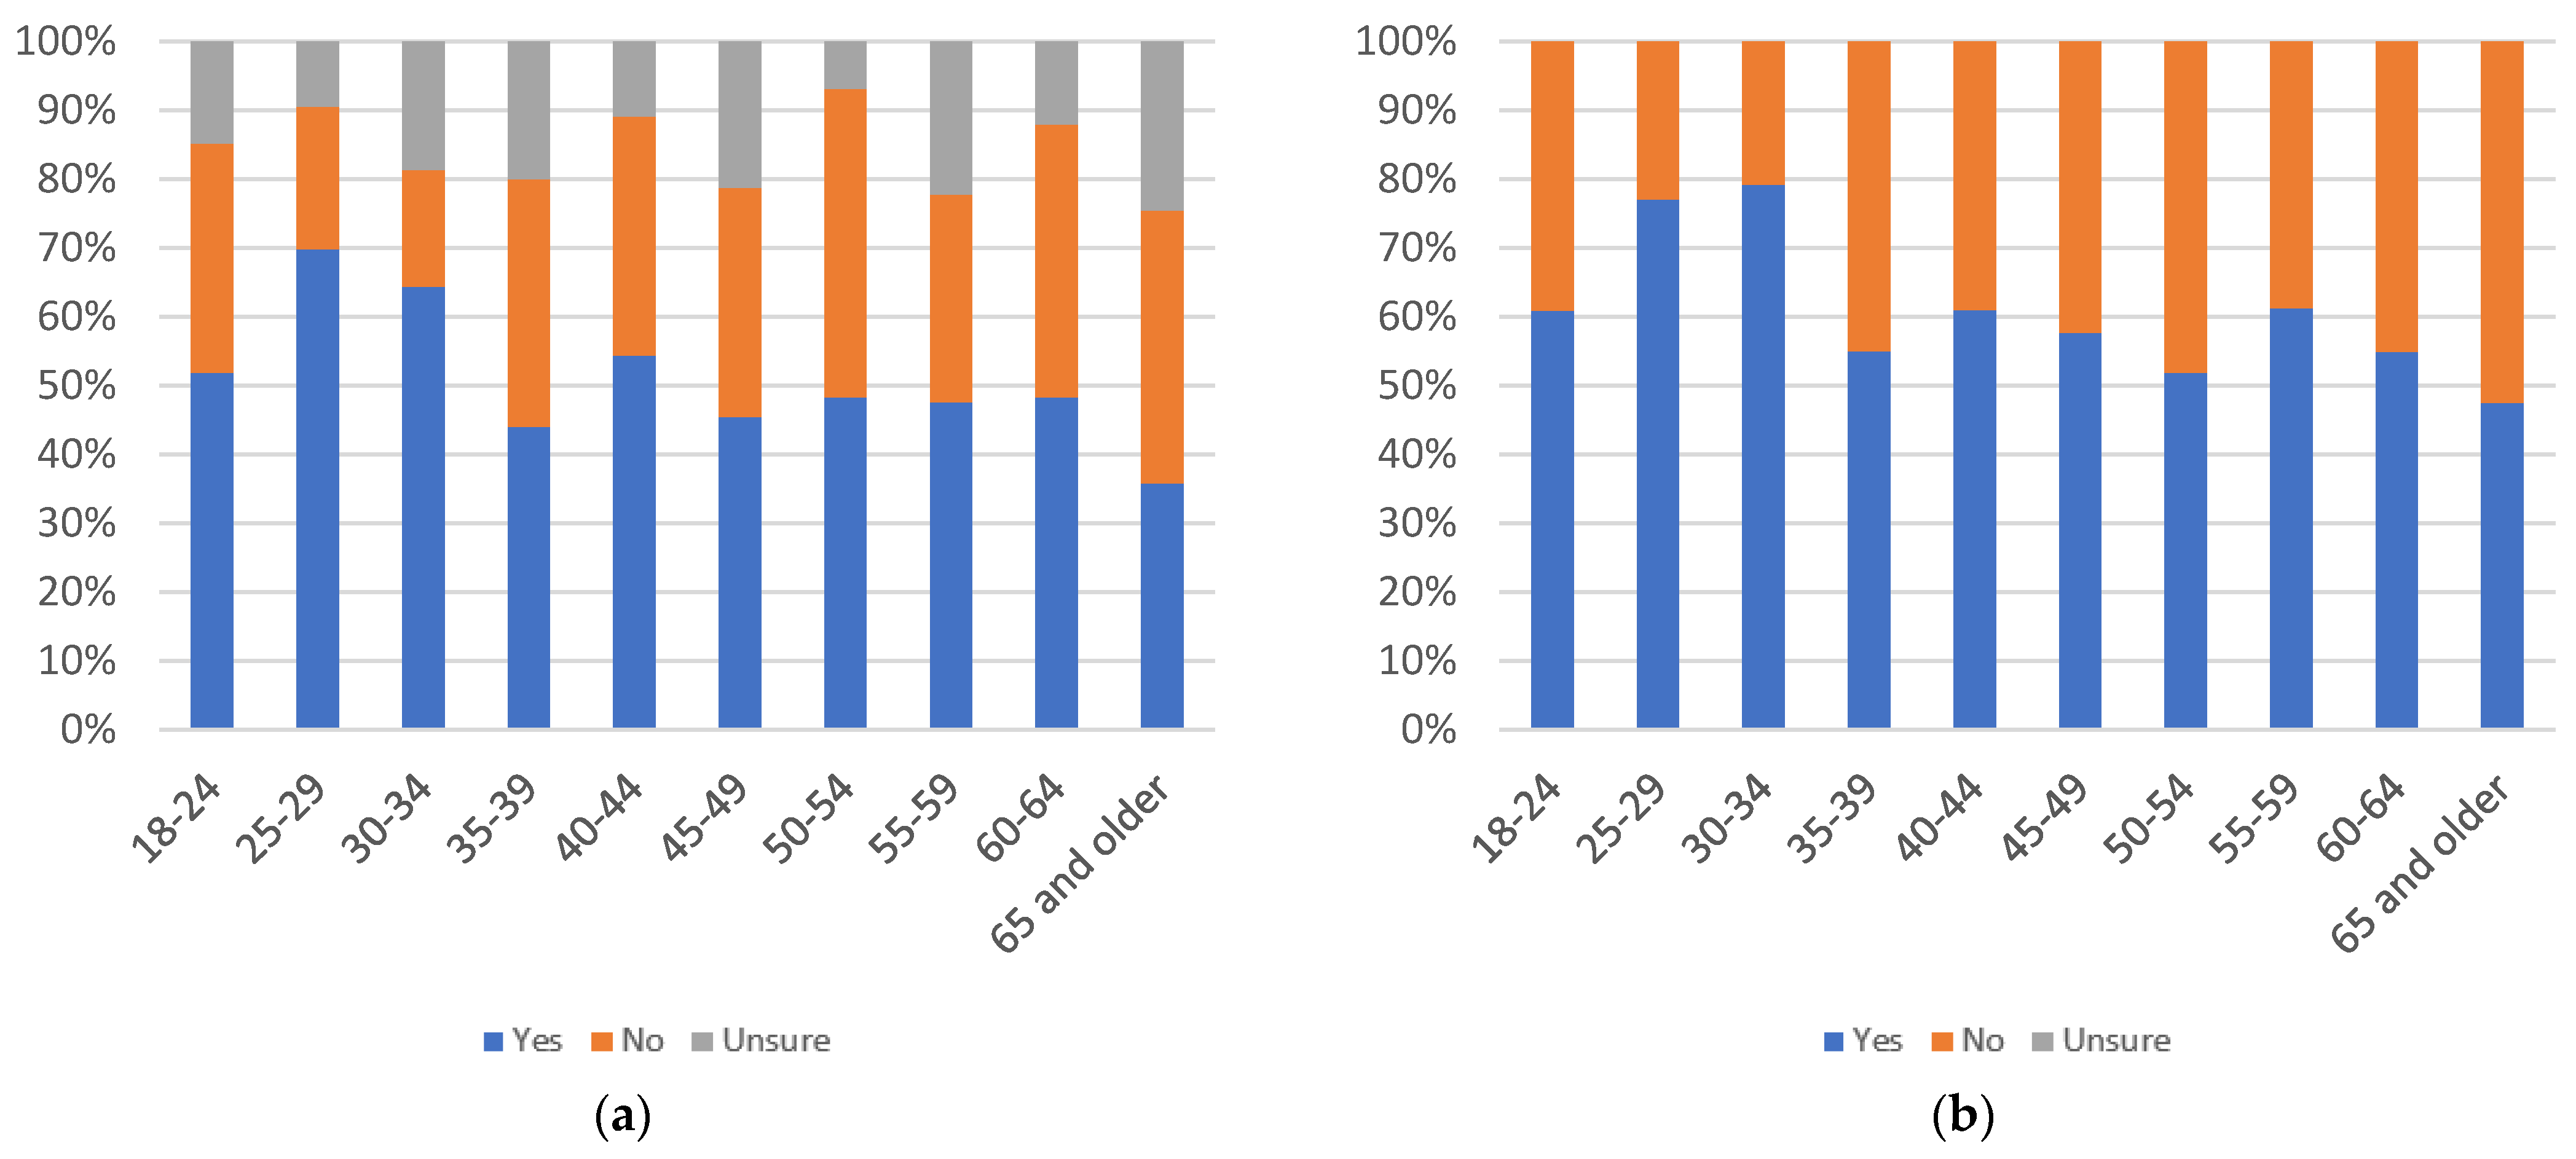
Figure 13 consider likelihood that respondents will personally use informational label 1, with respondents answering the question “would you review this label when viewing news articles on social media?”.
In terms of age, there is no clear pattern of decline or increase in perceived personal usage as age increases. There are spikes in yes responses at the 30–34, 35–39, and 50–54 age groups. The number of uncertain responses also shows no discernible pattern. All age groups, other than 40–44, 45–49 and 55–59, have at least 50% of respondents answering yes, even when uncertainty is factored in. All groups have at least 50% yes responses when uncertainty is not considered.
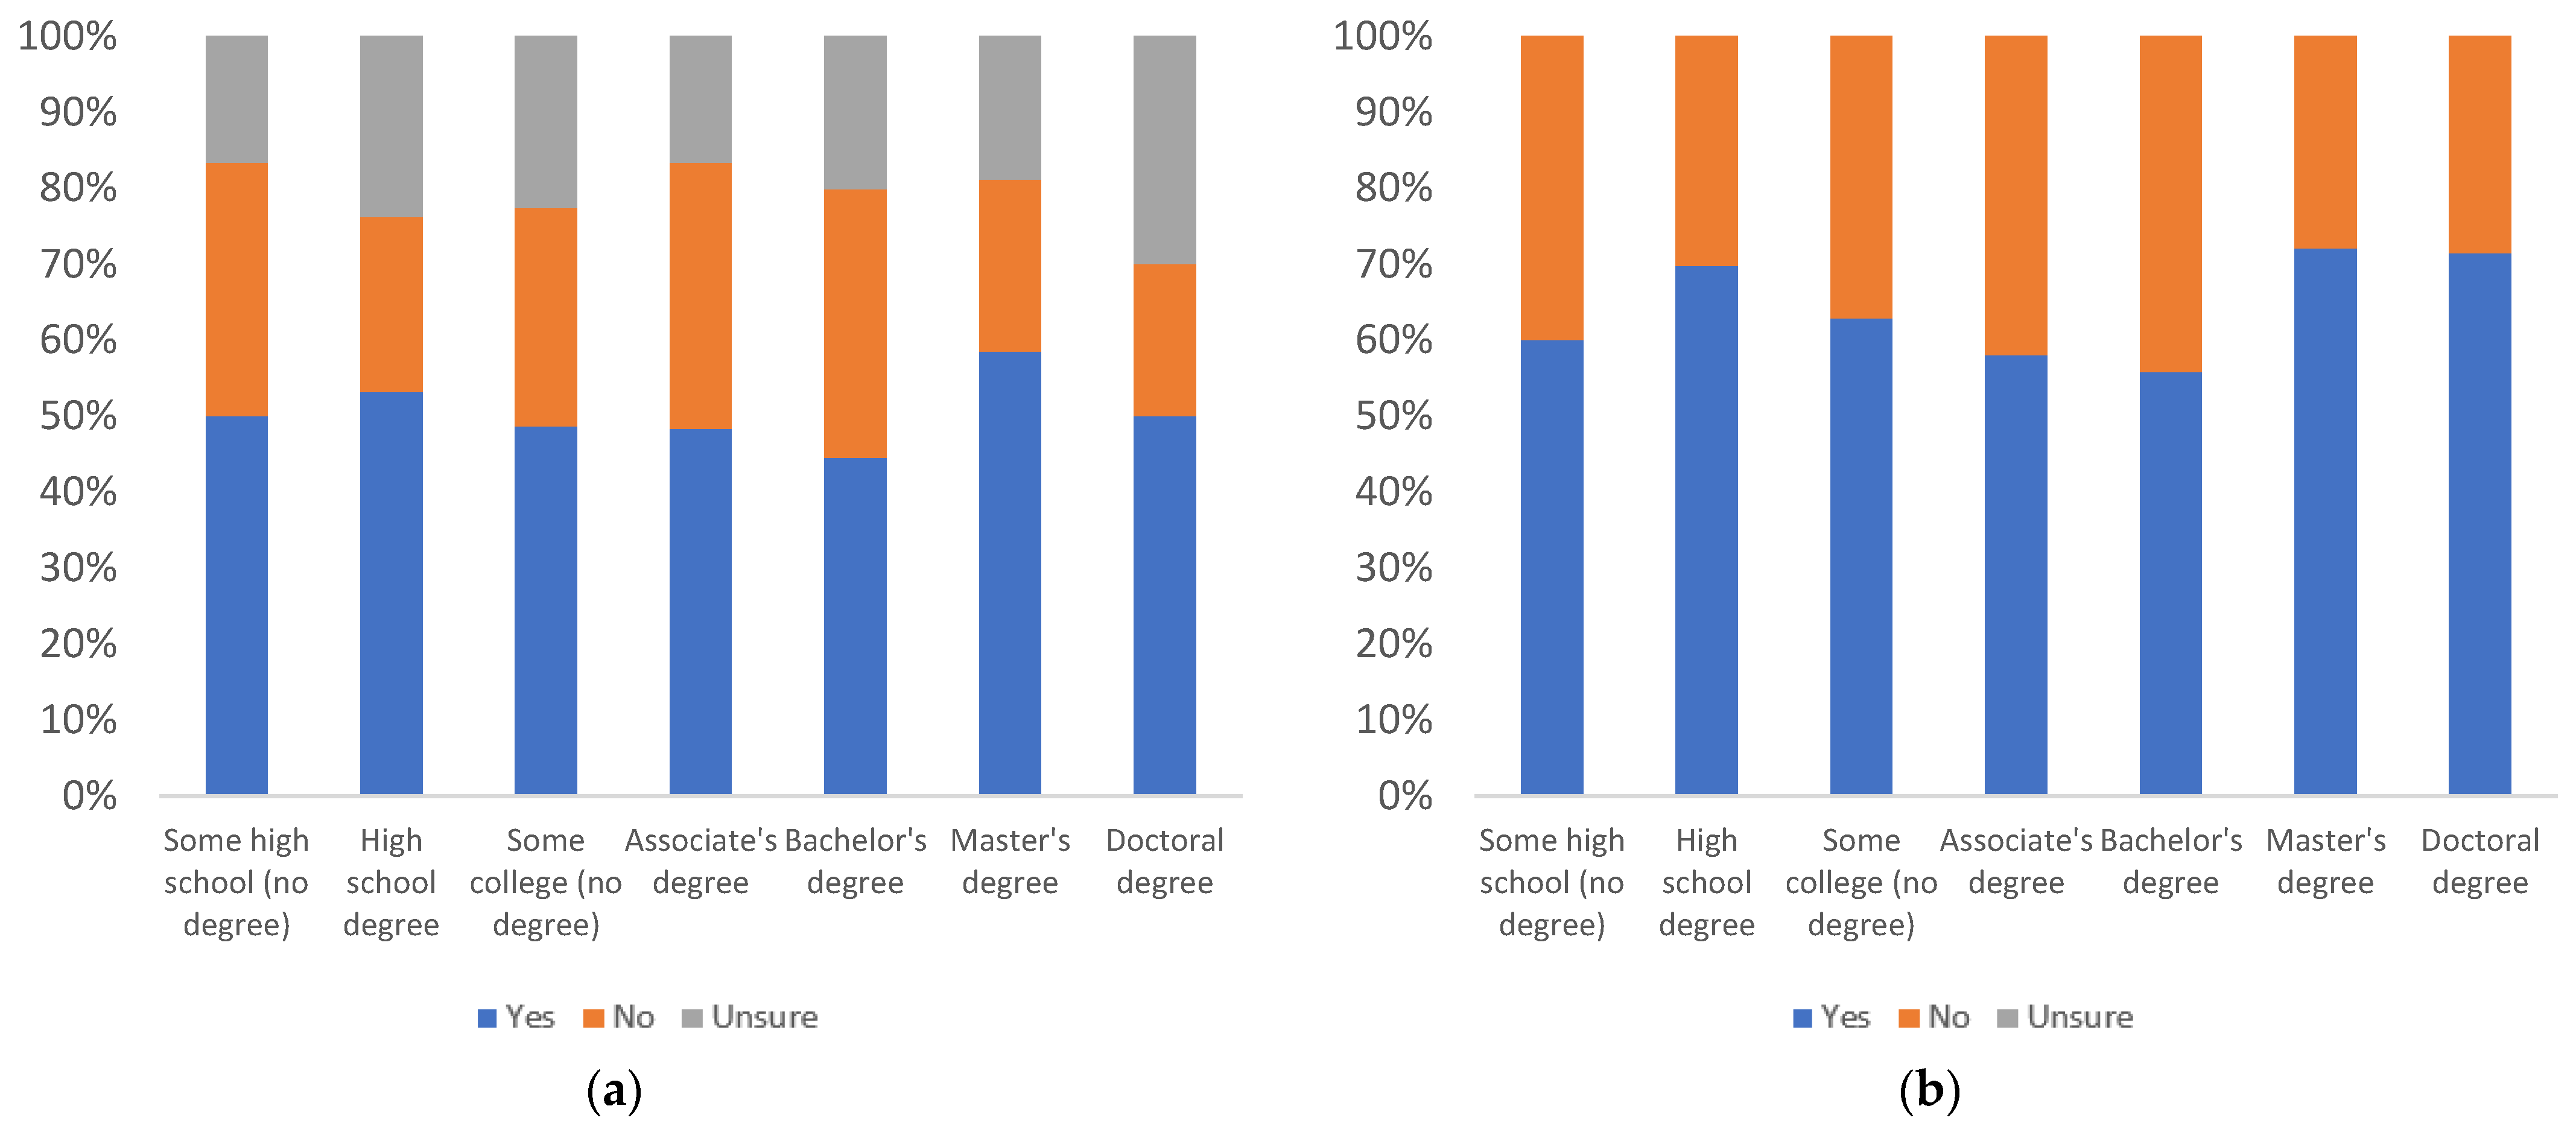
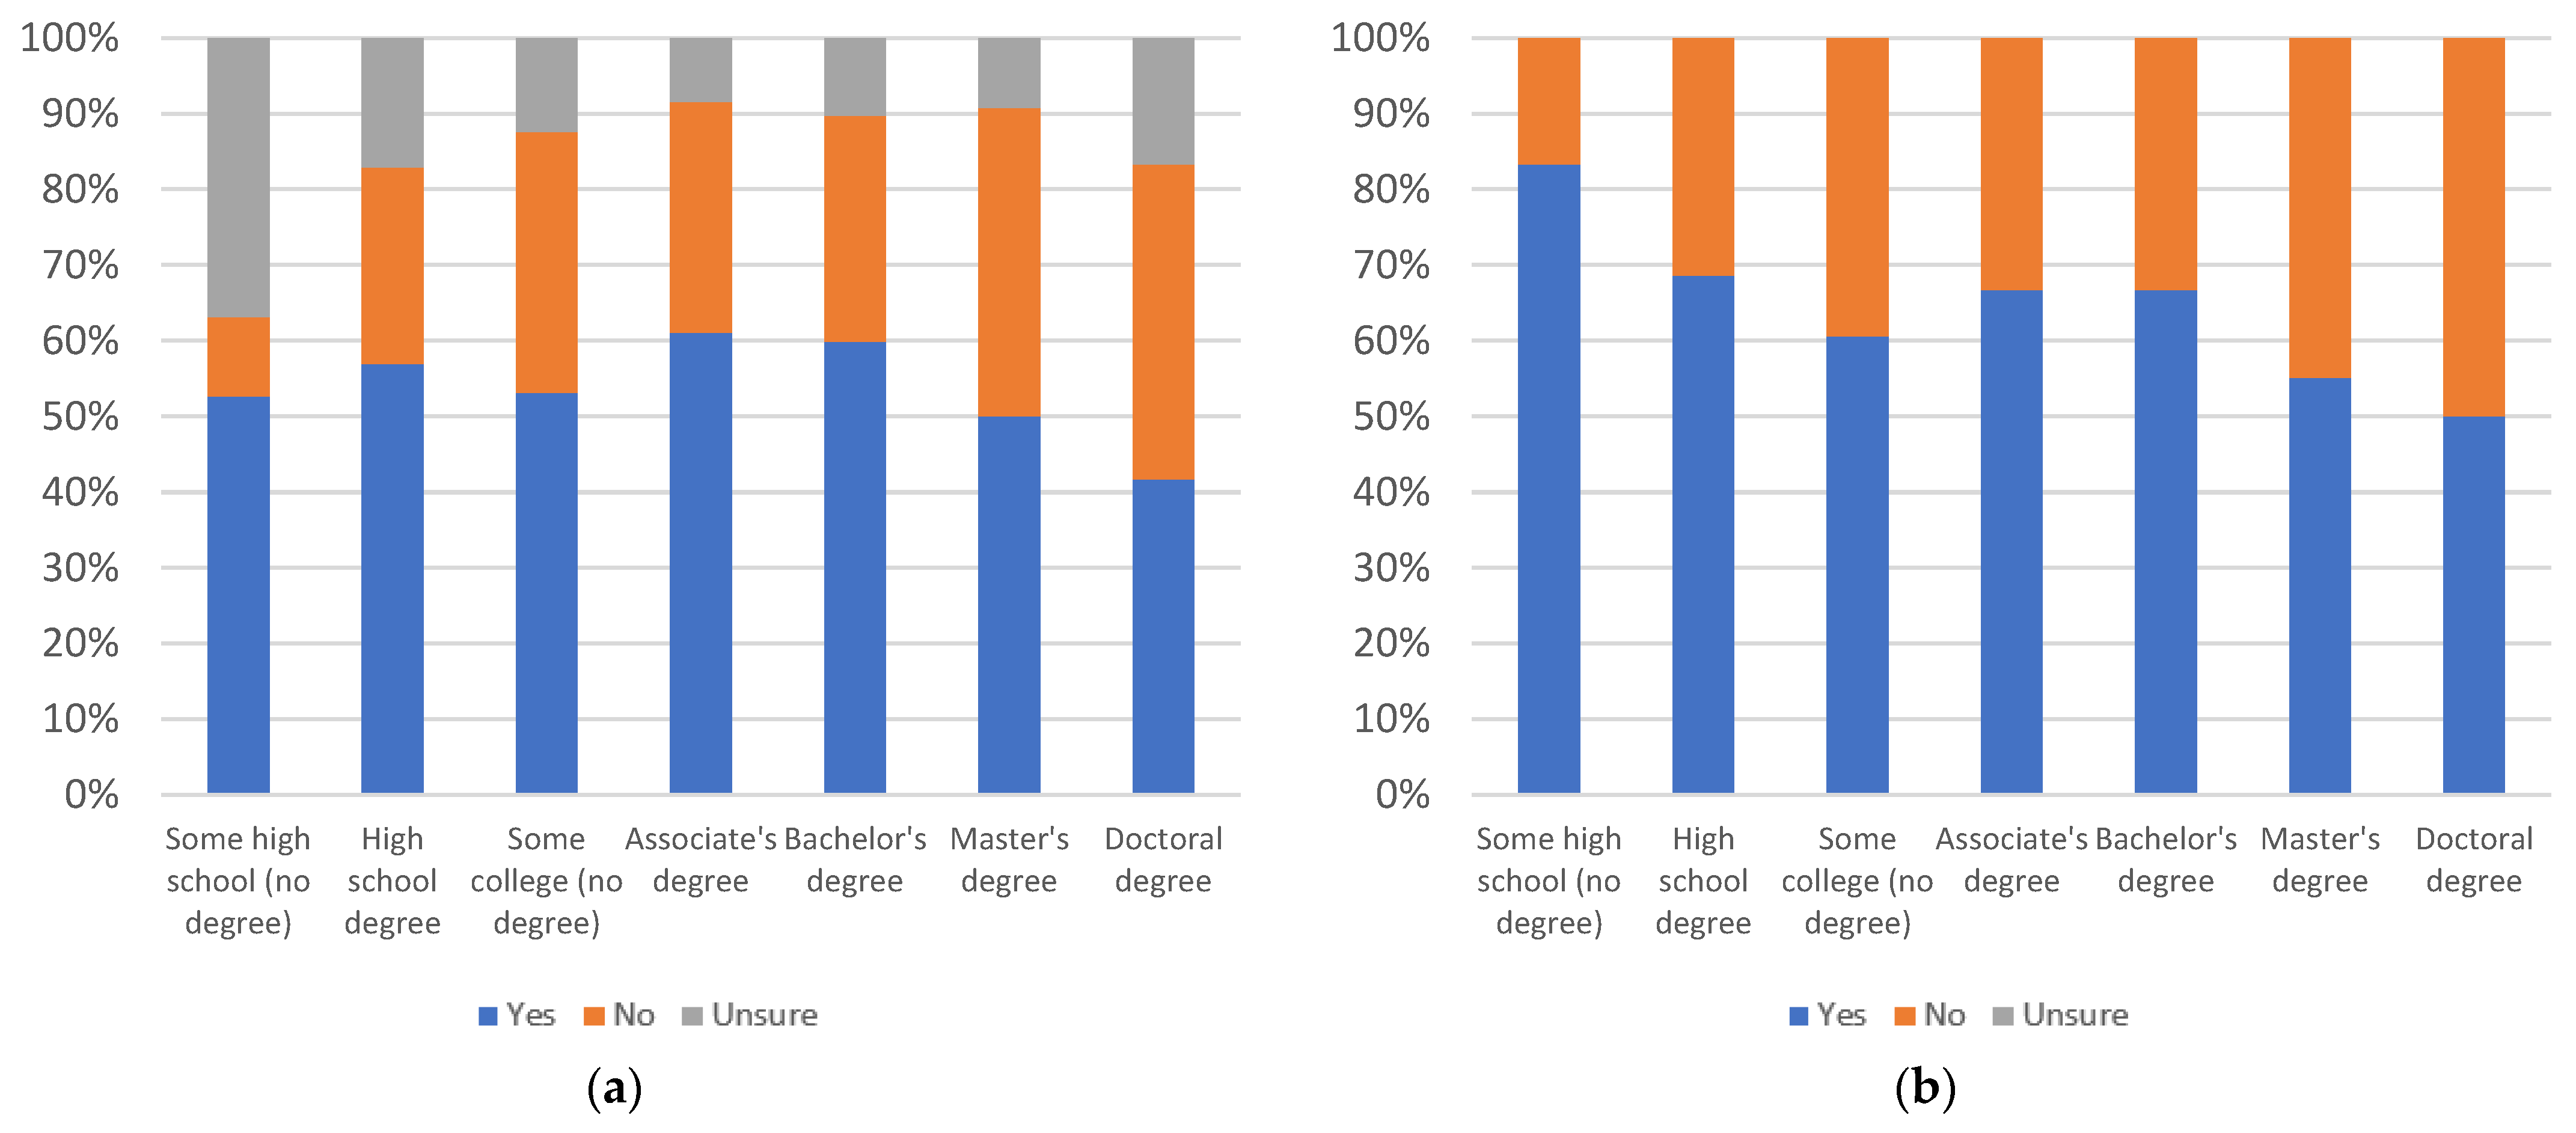
By education level, there is an overall increase in yes responses, as education level increases. The lowest percentage of yes responses is at the some high school education level, and while the percentage of yes responses declines from the some college to bachelor’s degree levels, it increases again up to its peak at the doctoral degree level. Only three of the seven education groups (some college, master’s degree, and doctoral degree) have at least 50% yes responses, when uncertainty is factored in. All groups have at least a 50% level of yes responses, when uncertainty is not considered.
By gender, there are more yes responses among females than males and slightly higher uncertainty among females. Both groups have greater than 50% answering yes, even with uncertainty.
Figure 14, Figure 15 and 
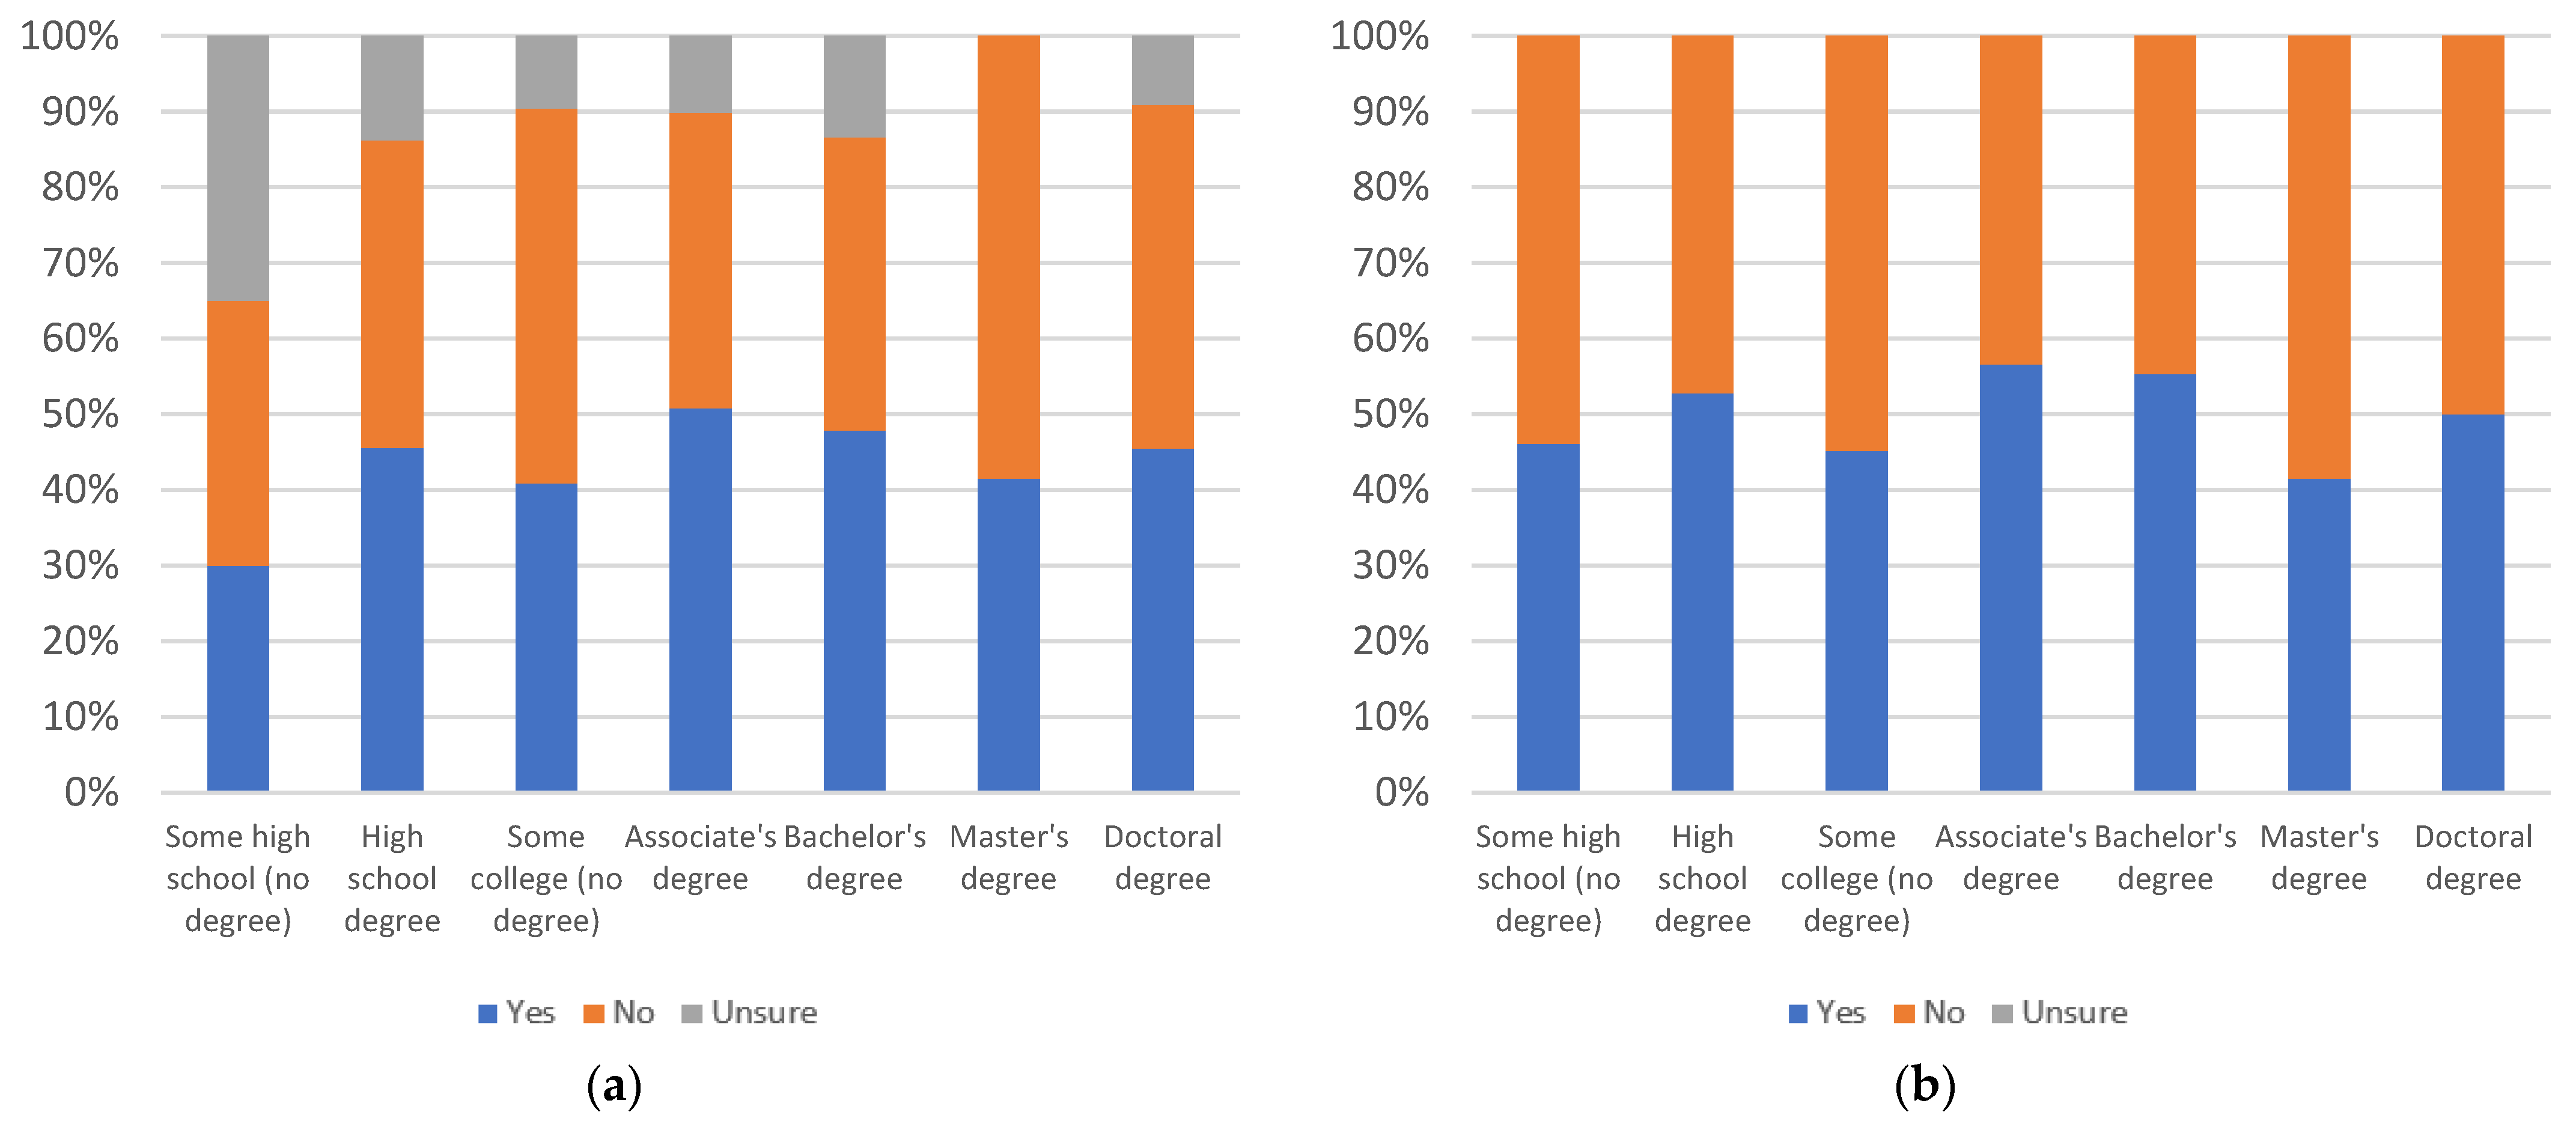
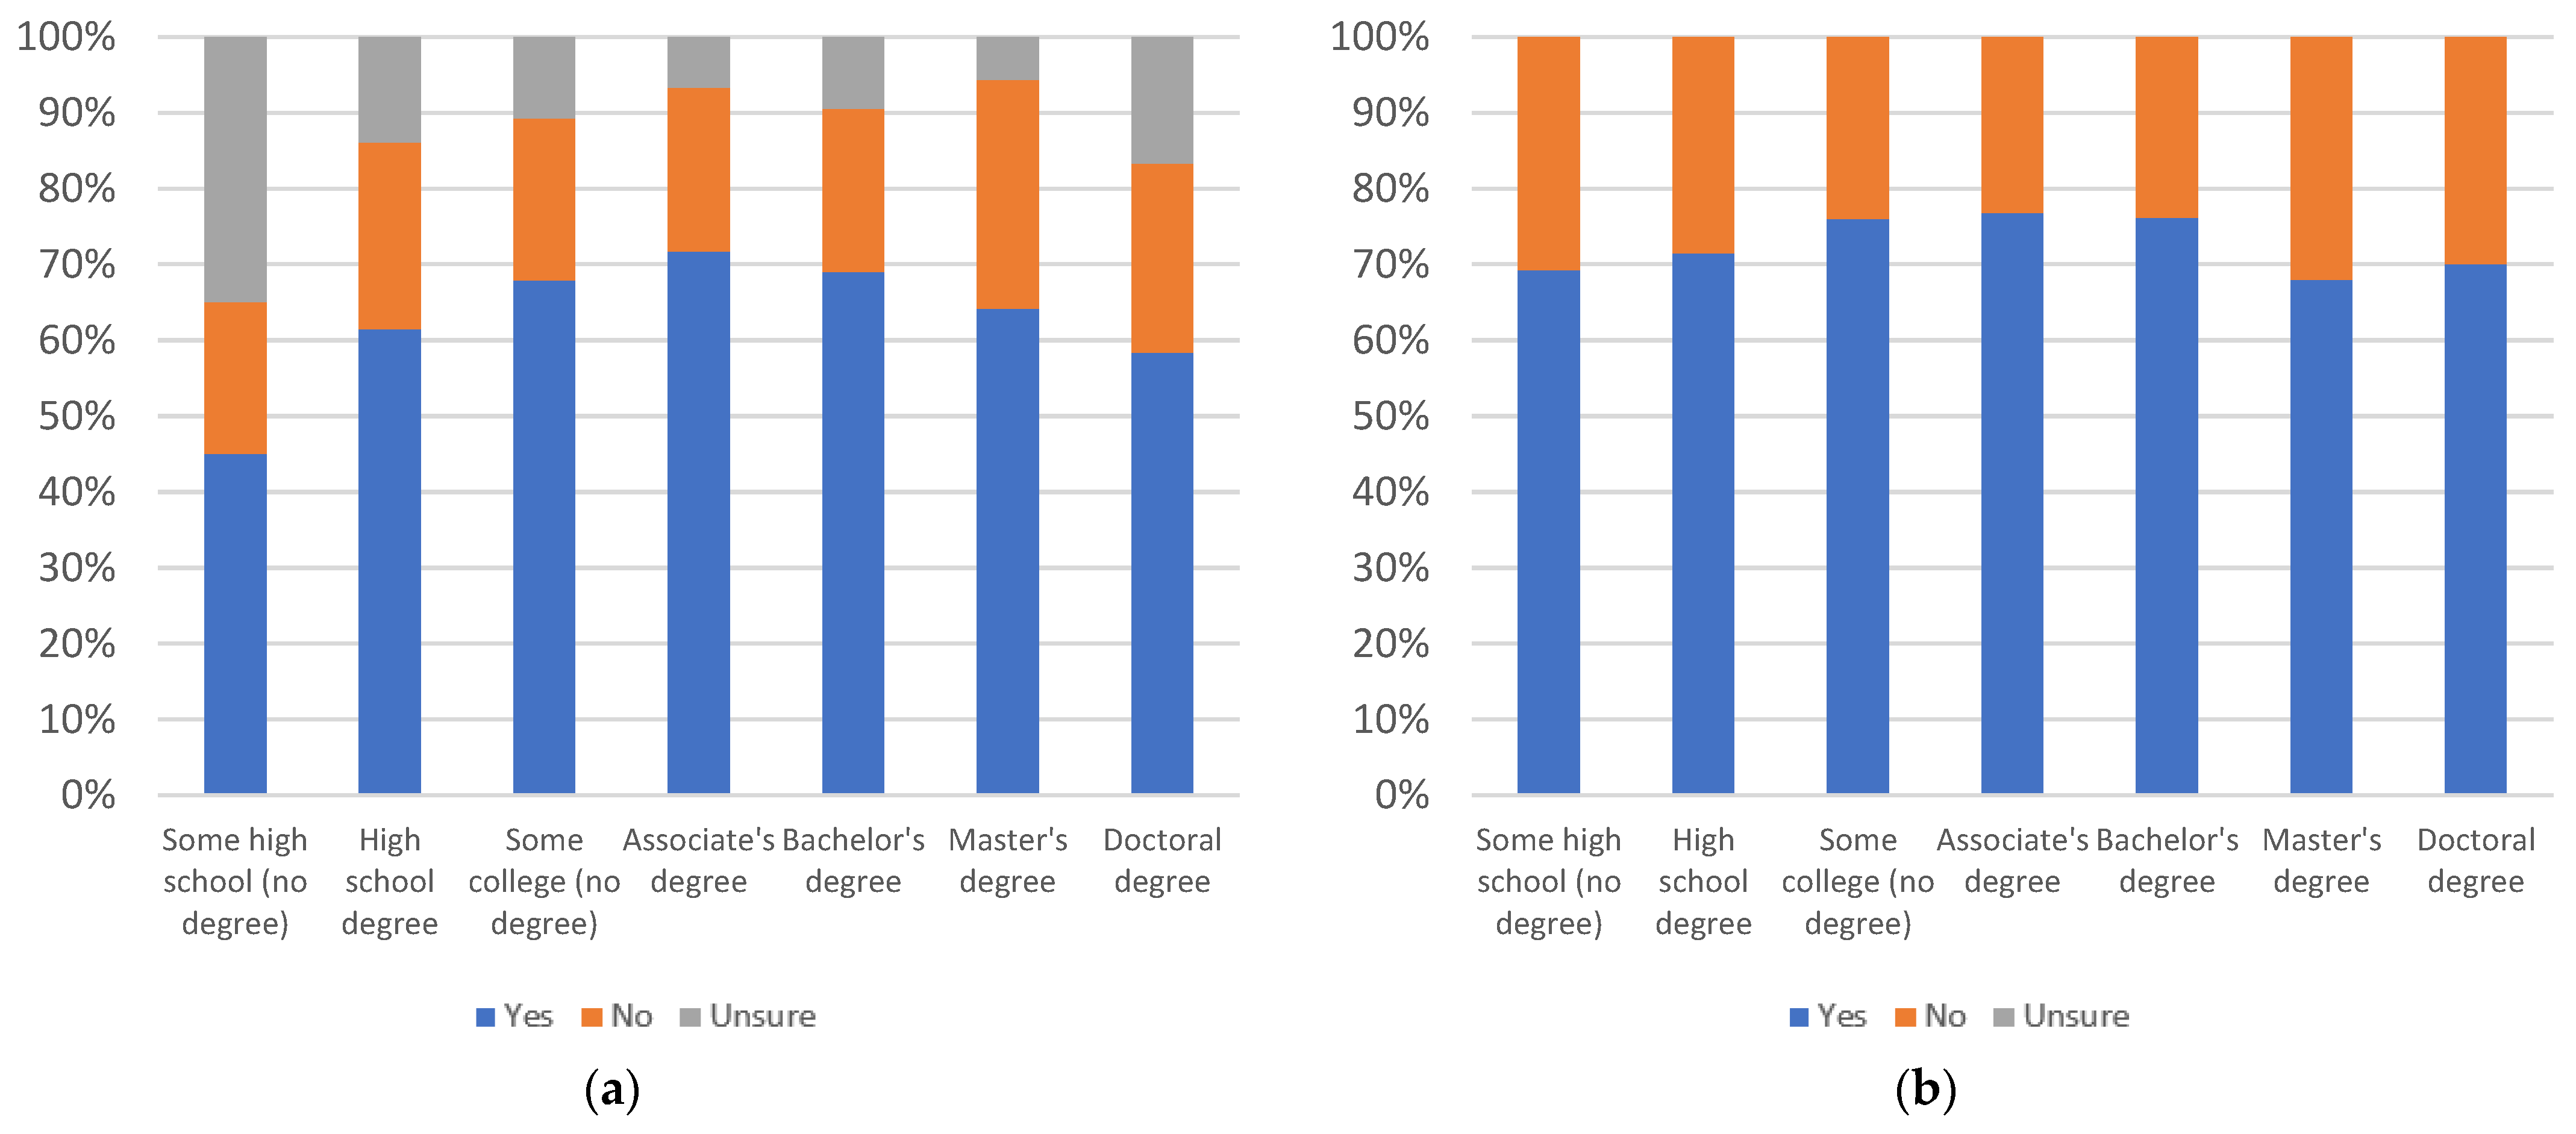
Figure 16 consider respondents’ perception of the likelihood of others to use informational label 1, with respondents answering the question “would others review this label when viewing news articles on social media?”.
In terms of age, there is no clear pattern of decline or increase in perceived use by others as age increases. There is a notable drop in yes responses for the 45–49 age group. The number of uncertain responses also shows no discernible pattern, but there is a high level of uncertainty amongst all groups. All age groups other than the 25–29 and 30–34 groups have less than 50% answering yes, when factoring in uncertainty. When uncertainty is not considered, only the 45–49 age group answers yes less than 50% of the time.
By education level, there is an increase in uncertainty level as education level increases. The number of yes responses declined from the some college to the Bachelor’s degree levels, but then it increases up to the doctoral degree level. While only two education groups, the some high school and some college groups, have at least 50% yes responses, when uncertainty is factored in, all groups show at least 50% yes responses when uncertainty is not considered.
By gender, there are slightly more yes responses among female respondents and a nearly identical level of uncertainty between males and females. Both groups have less than 50% yes responses, with uncertainty factored in and greater than 50% yes responses, when uncertainty is not considered.
Figure 17, Figure 18 and 
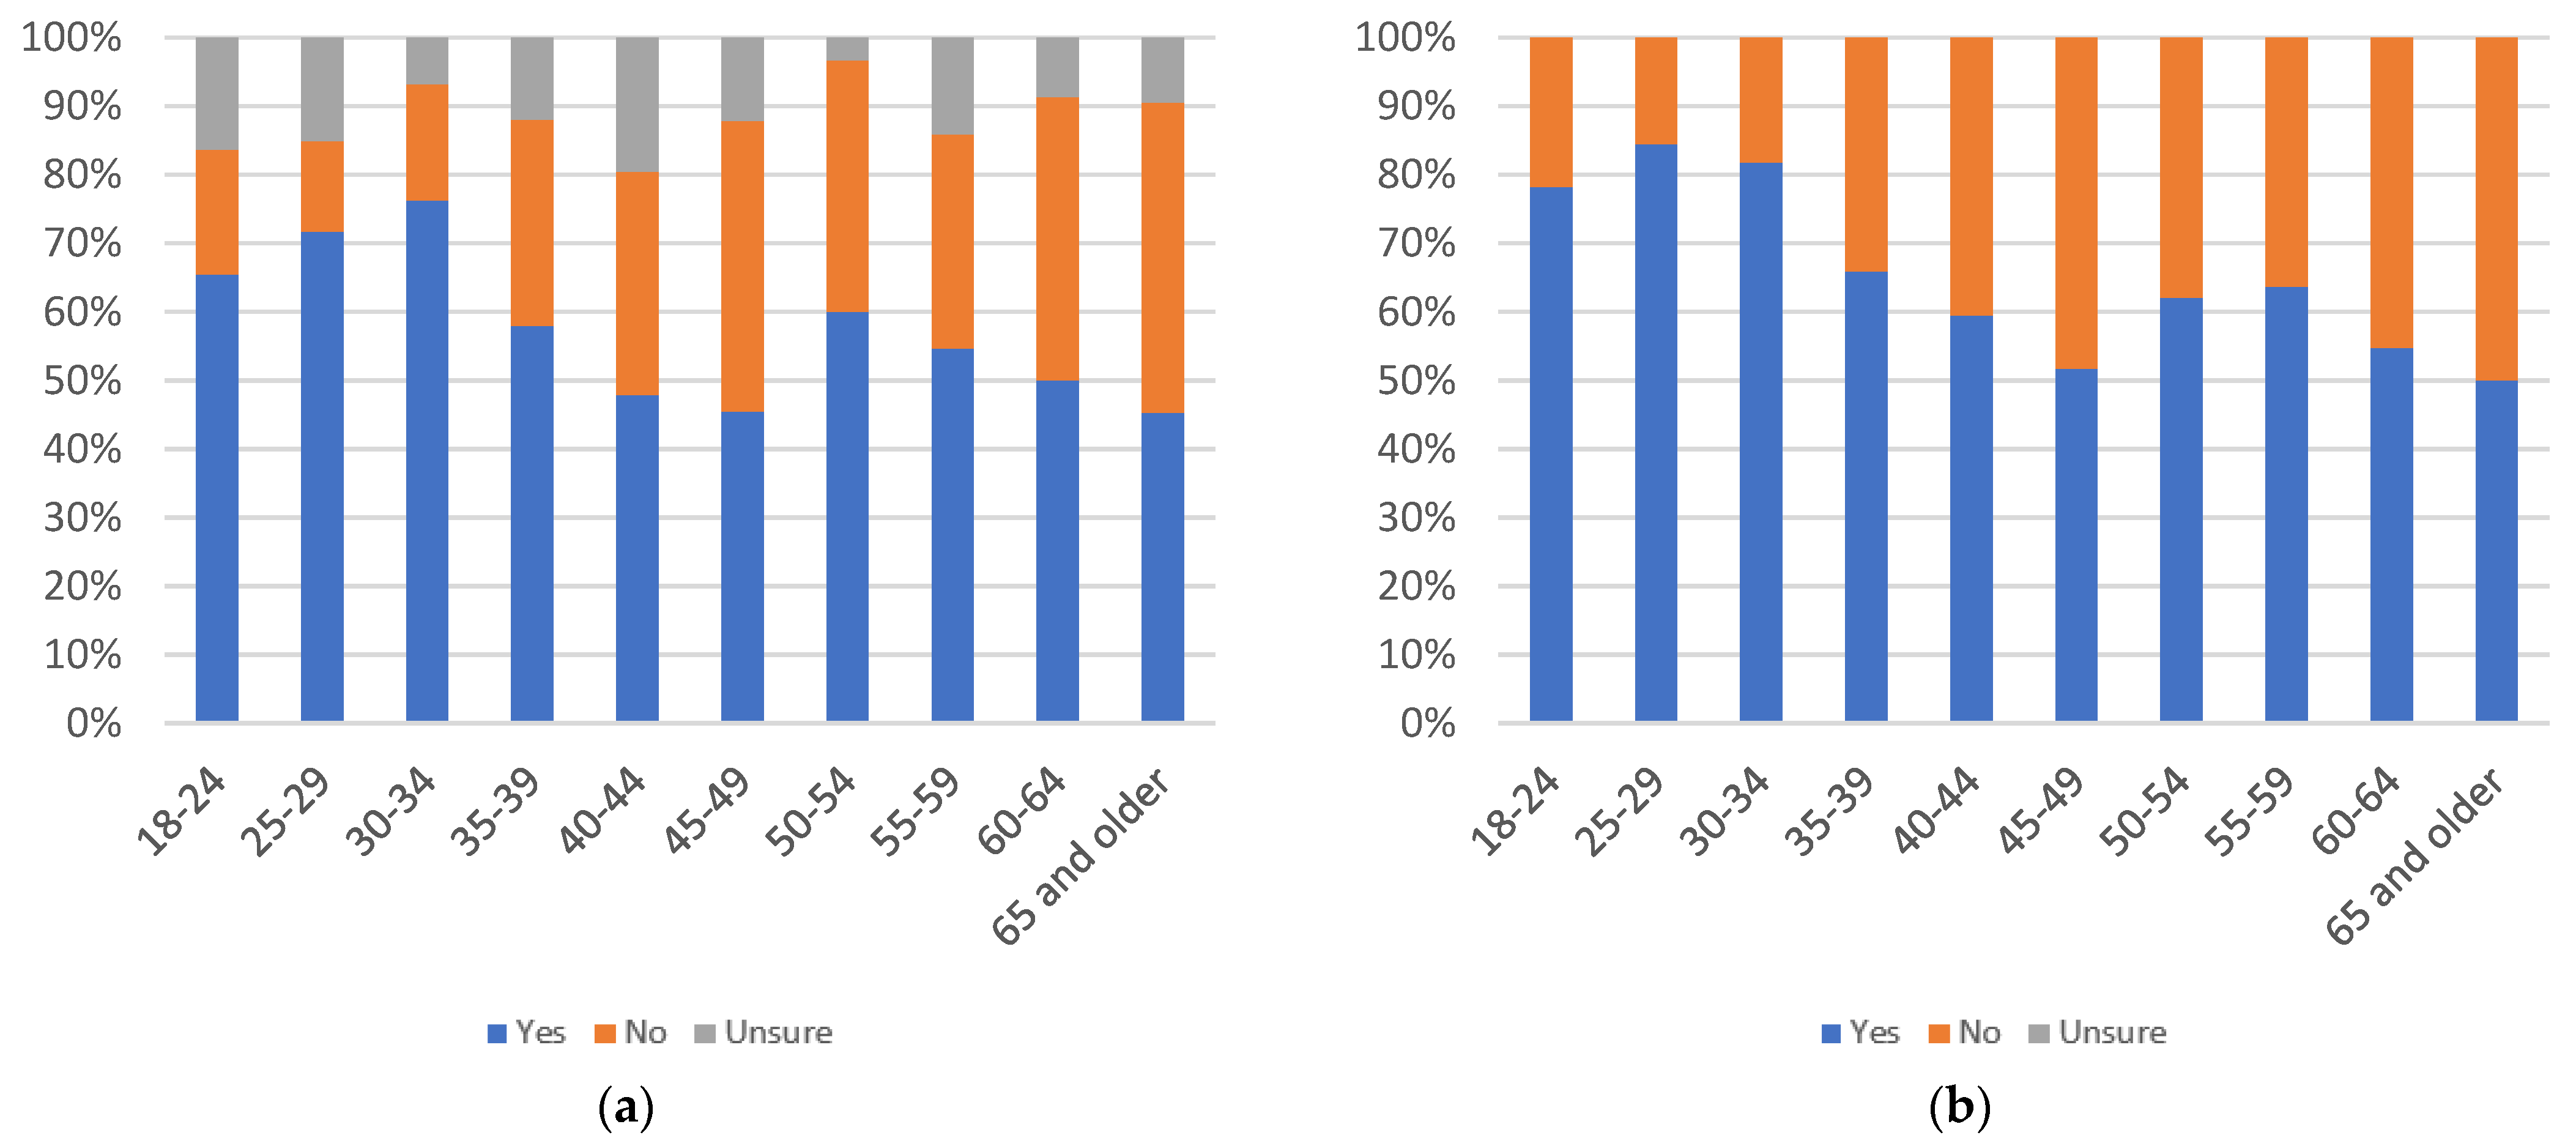
Figure 19 consider the value of informational label 1 in gauging trustworthiness, with respondents answering the question “would it be useful for judging the trustworthiness of news articles?”.
In terms of age, there is a decline in yes responses from the 25–29 age group, up to the 60–64 age group. Against this trend, there is a downward spike at the 18–24 age group and an upward spike at the 65 and older age group. The uncertainty level shows no discernible pattern. The only four age groups to have at least 50% yes responses, when uncertainty is factored in, are the 18–24, 25–29, 30–34, and 65 and older groups. All age groups have at least 50% yes responses, when uncertainty is not considered.
By education level, there is a decline in yes responses from the high school degree to the bachelor’s degree levels followed by a spike at the master’s degree and doctoral degree levels. Much of the increase in yes responses at the doctoral degree level is not present when uncertainty is factored in. While only three groups (high school, master’s degree, and doctoral degree) have at least 50% yes responses, when uncertainty is factored in, all groups have at least 50% yes responses, when uncertainty is not considered.
By gender, females have an increase in the number of yes responses and are the only group to have at least 50% yes responses, even when uncertainty is considered. Both groups have at least 50% yes responses, when uncertainty is not factored in.
The helpfulness of informational label 2 (shown in Figure 20), when it pops up in front of a news article automatically, is considered in Figure 21, Figure 22 and Figure 23. Respondents answered the question “would you find this label helpful?”.
In terms of age, there are two waves of decline in yes responses, as age decreases. The first is from the 18–24 age group to the 35–39 age group. This is followed by a spike, and then another decline from the 40–44 to 60–64 age groups, followed by another spike. These waves remain consistent, even with uncertainty considered. While the 55–59 and 60–64 age groups have less than 50% yes responses, when uncertainty is considered, even these two groups have at least 50% yes responses when uncertainty is not factored in.
By education level, there is a gradual decline in yes responses as education level increases. There is a slight increase at the master’s degree level, and a very high level of uncertainty in the some high school group. The doctoral degree holders group reports less than 50% yes responses, when uncertainty is considered. When uncertainty is removed, all groups have at least 50% yes responses.
By gender, females have more yes responses, as well as a higher uncertainty level. Both gender groups have at least 50% yes responses, even when uncertainty is factored in.
Figure 24, Figure 25 and Figure 26 consider annoyingness of informational label 2, with respondents answering the question “would you find this label annoying?”.
In terms of age, there are three peaks of yes responses. There is an increase from ages 18–24 to 35–39, followed by a decline to the 45–49 age group. Then, oscillating increases and decreases are present, up to the 65 and older age group. The uncertainty responses show no discernible pattern. Only the 30–34, 35–39 and 60–64 age groups have at least 50% yes responses, when uncertainty is considered. Without uncertainty factored in, the 50–54 age group additionally has at least 50% yes responses. This indicates a low level of annoyingness, amongst most age groups.
When considering education level, there is a spike in perceived annoyingness at the some high school education level. Amongst other education levels, the number of yes responses peaks at the associate’s degree level. Uncertainty levels, similarly, have a valley at the associate’s degree level, with fewer than 5% of associate’s degree respondents reporting uncertainty. When uncertainty is factored in, only the some high school and associate’s degree education levels have at least 50% yes responses. Bachelor’s degree holders also report 50% yes responses, when uncertainty is not considered. This indicates a low level of annoyingness amongst most education groups.
By gender, females have less yes responses, as well as a greater uncertainty level. Both gender groups report less than 50% yes responses, when uncertainty is considered, though male respondents report greater than 50% yes responses, when uncertainty is not factored in. This indicates that males find the label more annoying than females.
Figure 27, Figure 28 and Figure 29 consider respondents likelihood to personally use informational label 2, with respondents answering the question “would you review this label when viewing news articles on social media?”.
In terms of age, there are two peaks of yes responses. There is an increase from the 18–24 to 30–34 age groups, followed by a decline to the 35–39 age group. Then, there is an increase, at the 40–44 age group, followed by a general decline. The decline at higher age groups, becomes an increase, when uncertainty is factored in. The 65 and older age group’s level of uncertainty accounts for this shift. All age groups, other than 18–24, answered at least 50% yes, even when uncertainty is factored in. The 18–24 age group remains below 50%, even without uncertainty considered.
By education level, the number of yes responses remains relatively consistent, when uncertainty is not considered. Uncertainty decreases as education level increases, up to the master’s degree level, then it increases sharply at the doctoral degree level. All groups other than the some high school and doctoral degree levels have at least 50% yes responses, when uncertainty is factored in. Without uncertainty, all groups have at least 50% yes responses.
By gender, the levels of support are almost equal, except for a higher level of uncertainty being reported among female respondents. Both groups have at least a 50% level of yes responses, even with uncertainty factored in.
Figure 30, Figure 31 and Figure 32 consider respondents’ perception of likelihood of others to use informational label 2, with respondents answering the question “would others review this label when viewing news articles on social media?”.
There is no clear pattern of increasing or decreasing support as age increases. There are spikes in the number of yes responses at the 30–34, 40–44, and 50–54 age groups, which are apparent even with uncertainty factored in. Overall, the level of uncertainty is relatively high. While only three age groups (30–34, 40–44, and 50–54) have at least 50% yes responses, when uncertainty is factored in, all groups have at least 50% yes responses, when uncertainty is not considered.
By education level, responses are relatively consistent, except for a surprising level (100%) of support in the some high school group, when uncertainty is not considered. It should be noted, however, that the some high school group reports approximately 40% uncertainty, so the apparent level of enthusiasm is not as strong, given the higher level of uncertainty surrounding this question. While only the some high school group has at least 50% yes responses, with uncertainty factored in, all education level groups have at least 50% yes responses, without considering uncertainty.
By gender, the levels of support are almost equal, even with uncertainty considered. While both genders have less than 50% yes responses, when uncertainty is considered, both groups have greater than 50% yes responses, when uncertainty is removed.
Figure 33, Figure 34 and Figure 35 consider the value of informational label 2 for gauging trustworthiness, with respondents answering the question “would it be useful for judging the trustworthiness of news articles?”.
In terms of age, there are three peaks in yes responses: one is at the 25–29 and 30–34 age groups. A second is at the 45–49 age group. A final peak is at the 65 and older age group. There is a spike in uncertainty for the 35–39 age group and an increase in uncertainty from the 40–44 to 60–64 age groups. The uncertainty level for this question is relatively high. When uncertainty is factored in, only the 18–24, 35–39, 55–59 and 60–64 age groups have less than 50% yes responses. Without uncertainty, all age groups report at least 50% yes responses.
By education level, yes responses are consistent, except for a spike at the master’s degree level, followed by a drop at the doctoral degree level. Uncertainty exhibits two valleys, with one low point at the associate’s degree level and a second at the master’s degree level. Only the some college, associate’s degree, and master’s degree education levels report at least 50% yes responses, when uncertainty is considered. Without uncertainty, all but the doctoral degree group report at least 50% yes responses.
By gender, female respondents have a higher number of yes responses than makes but also a higher level of uncertainty. With uncertainty factored in, only the female respondents have at least 50% yes responses. Without uncertainty, both groups reach this threshold.
The helpfulness of informational label 3 (shown in Figure 36), when it appears underneath a news article automatically, is considered in Figure 37, Figure 38 and Figure 39. Respondents answered the question “would you find this label helpful?”.
In terms of age, there are two plateaus in yes responses, with a drop at the 35–39 age group. These plateaus remain consistent even when uncertainty is included. All age groups report at least 50% yes responses even when uncertainty is considered.
By education level, there is a spike in support by the some high school group, when uncertainty is not considered. When uncertainty is factored in, this spike is not present, due to a high level of uncertainty at the some high school education group; however, a new spike appears at the master’s degree group, due to their relatively low uncertainty. Even when uncertainty is included, all education groups report at least 50% yes responses.
By gender, female respondents report a significantly higher level of yes responses, while uncertainty is similar for both groups. Both groups have at least 50% yes responses, even when including uncertainty.
Figure 40, Figure 41 and Figure 42 consider annoyingness of informational label 3, with respondents answering the question “would you find this label annoying?”.
In terms of age, there is a decline in yes responses from the 18–24 to 30–34 age groups. This is followed by an increase from the 30–34 to 50–54 age groups. Support oscillates over the 55–59, 60–64 and 65 and older age groups. Only four age groups (45–49, 50–54, 60–64, and 65 and older) have at least 50% yes responses, when uncertainty is factored in. When uncertainty is not considered, the 35–39, 40–44, and 55–59 age groups also reach this threshold. This indicates that there is a moderate feeling of annoyance towards the label, across the 35–39 and older age groups.
By education level, there is no clear pattern of increase or decrease as education level increases. The highest level of uncertainty is seen amongst those with some high school education, while the master’s degree education level group reports no uncertainty. When uncertainty is factored in, only the associate’s degree education level group has at least 50% yes responses. Without uncertainty, the high school degree, bachelor’s degree, and doctoral degree groups also report at least 50% yes responses. This shows no clear pattern of increasing or decreasing levels of annoyance, with changing education levels.
By gender, males report a slightly higher level of annoyance, while females report a higher level of uncertainty. Neither group reports at least a 50% yes response level, when uncertainty is considered; however, male respondents meet this threshold when uncertainty is removed.
Figure 43, Figure 44 and Figure 45 consider the likelihood of respondents personally using informational label 3, with respondents answering the question “would you review this label when viewing news articles on social media?”.
In terms of age, there is no clear pattern of increase or decrease, as age increases. The most noticeable drops in yes responses occurs with the 18–24, 35–39, and 45–49 age groups. Amongst these, while the 18–24 and 35–39 groups report a high level of uncertainty, the 45–49 age group reports almost no uncertainty. All but the 18–24 and 35–39 age groups report at least 50% yes responses when uncertainty is considered. With uncertainty removed, every age group meets the 50% yes threshold.
By education level, responses are relatively consistent, when uncertainty is not considered except for another surprising 100% yes response from the some high school education level group. Again, the uncertainty level of this education group tends to place it closer to the other groups, while the master’s degree education group spikes, due to a low level of uncertainty. Recalling Figure 31, which considered the likelihood of others to use informational label 2, an almost identical dynamic of responses was found amongst age groups. However, in this case in Figure 44, the question is regarding personal use, rather than the usage of others. When uncertainty is considered, only the associate’s degree education level group has fewer than 50% yes responses. With uncertainty eliminated, even this group reaches above the 50% yes response level threshold.
By gender, females report more yes responses than males, as well as a higher level of uncertainty. Both groups report at least 50% yes responses, even when uncertainty is included.
Figure 46, Figure 47 and Figure 48 consider respondents’ perception of the likelihood of others to use informational label 3, with respondents answering the question “would others review this label when viewing news articles on social media?”.
In terms of age, when uncertainty is not factored in, there is a gradual decline in yes responses from the 25–29 to 65 and over age groups, with the exception of a spike at the 40–44 age group and a slight recovery at 50–54 age group. The lowest point for yes responses, though, is at the 18–24 age group. When uncertainty is included, the percentage of yes responses shows the same pattern of decline, but with no spike at the 40–44 age group, a steep drop at the 35–39 age group, and some recovery at the 65 and older age group. The uncertainty level for this question is relatively high. When uncertainty is considered, only four age groups (25–29, 30–34, 40–44, and 45–49) report at least a 50% level of yes responses. When uncertainty is removed, all but the 18–24 age group reach the 50% yes threshold.
By education level, there is a consistent decline in yes responses, as education level increases. As one exception, there is a sharper drop at the high school degree age group. Uncertainty levels are mostly consistent across education groups. While only the some high school and some college (no degree) groups report at least 50% “yes” responses, when uncertainty is factored in. All groups reach this threshold, when uncertainty is removed.
By gender, female respondents report yes more frequently than males, while the two groups share approximately the same level of uncertainty. Neither group exceeds 50% yes responses, when uncertainty is included; however, both groups reach this threshold when uncertainty is removed.
Figure 49, Figure 50 and Figure 51 consider the value of informational label 3 for gauging articles’ trustworthiness, with respondents answering the question “would it be useful for judging the trustworthiness of news articles?”.
In terms of age, there is no clear pattern of yes responses increasing or decreasing as age increases. There are noticeable drops in yes responses at the 18–24, 35–39 and 50–54 age groups and a spike in uncertainty for the 35–39 age group. Only the 30–34 and 50–54 age groups report fewer than 50% yes responses, when uncertainty is included. Without uncertainty factored in, all age groups report at least 50% yes responses.
By education level, there is a consistent decline in yes responses, as education level increases, except for a slight recovery at the master’s degree level. Uncertainty levels are highest for the some high school group and lowest for the associate’s degree and master’s degree groups. However, they are otherwise relatively consistent. All groups, other than the doctoral degree holders, report at least 50% yes responses, even when uncertainty is considered. With uncertainty removed, even the doctoral degree holders reach the 50% yes threshold.
By gender, there are significantly greater yes responses among female respondents, as well as slightly higher uncertainty, among females. Both groups report at least 50% yes responses, even when uncertainty is considered.

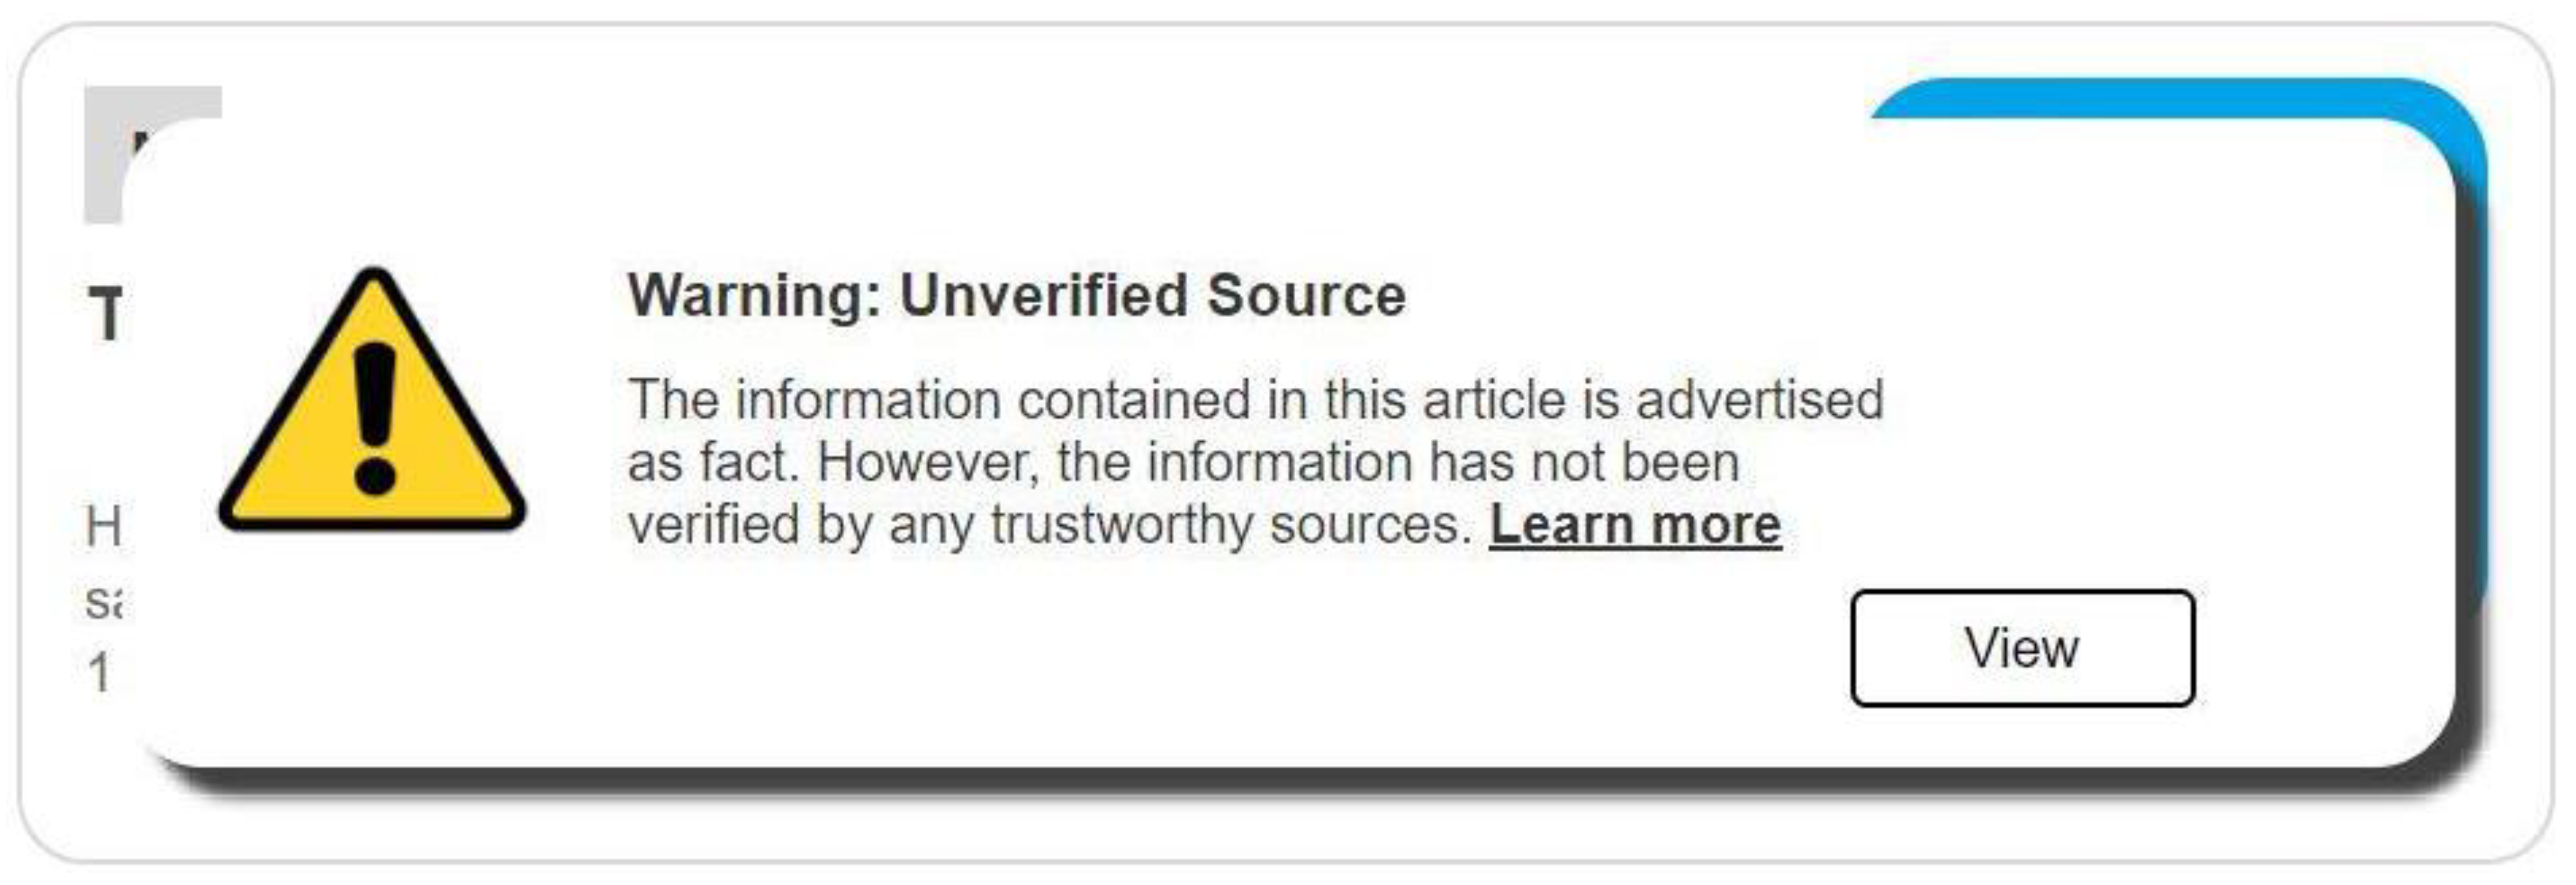
5. Warning Label Related Data and Analysis

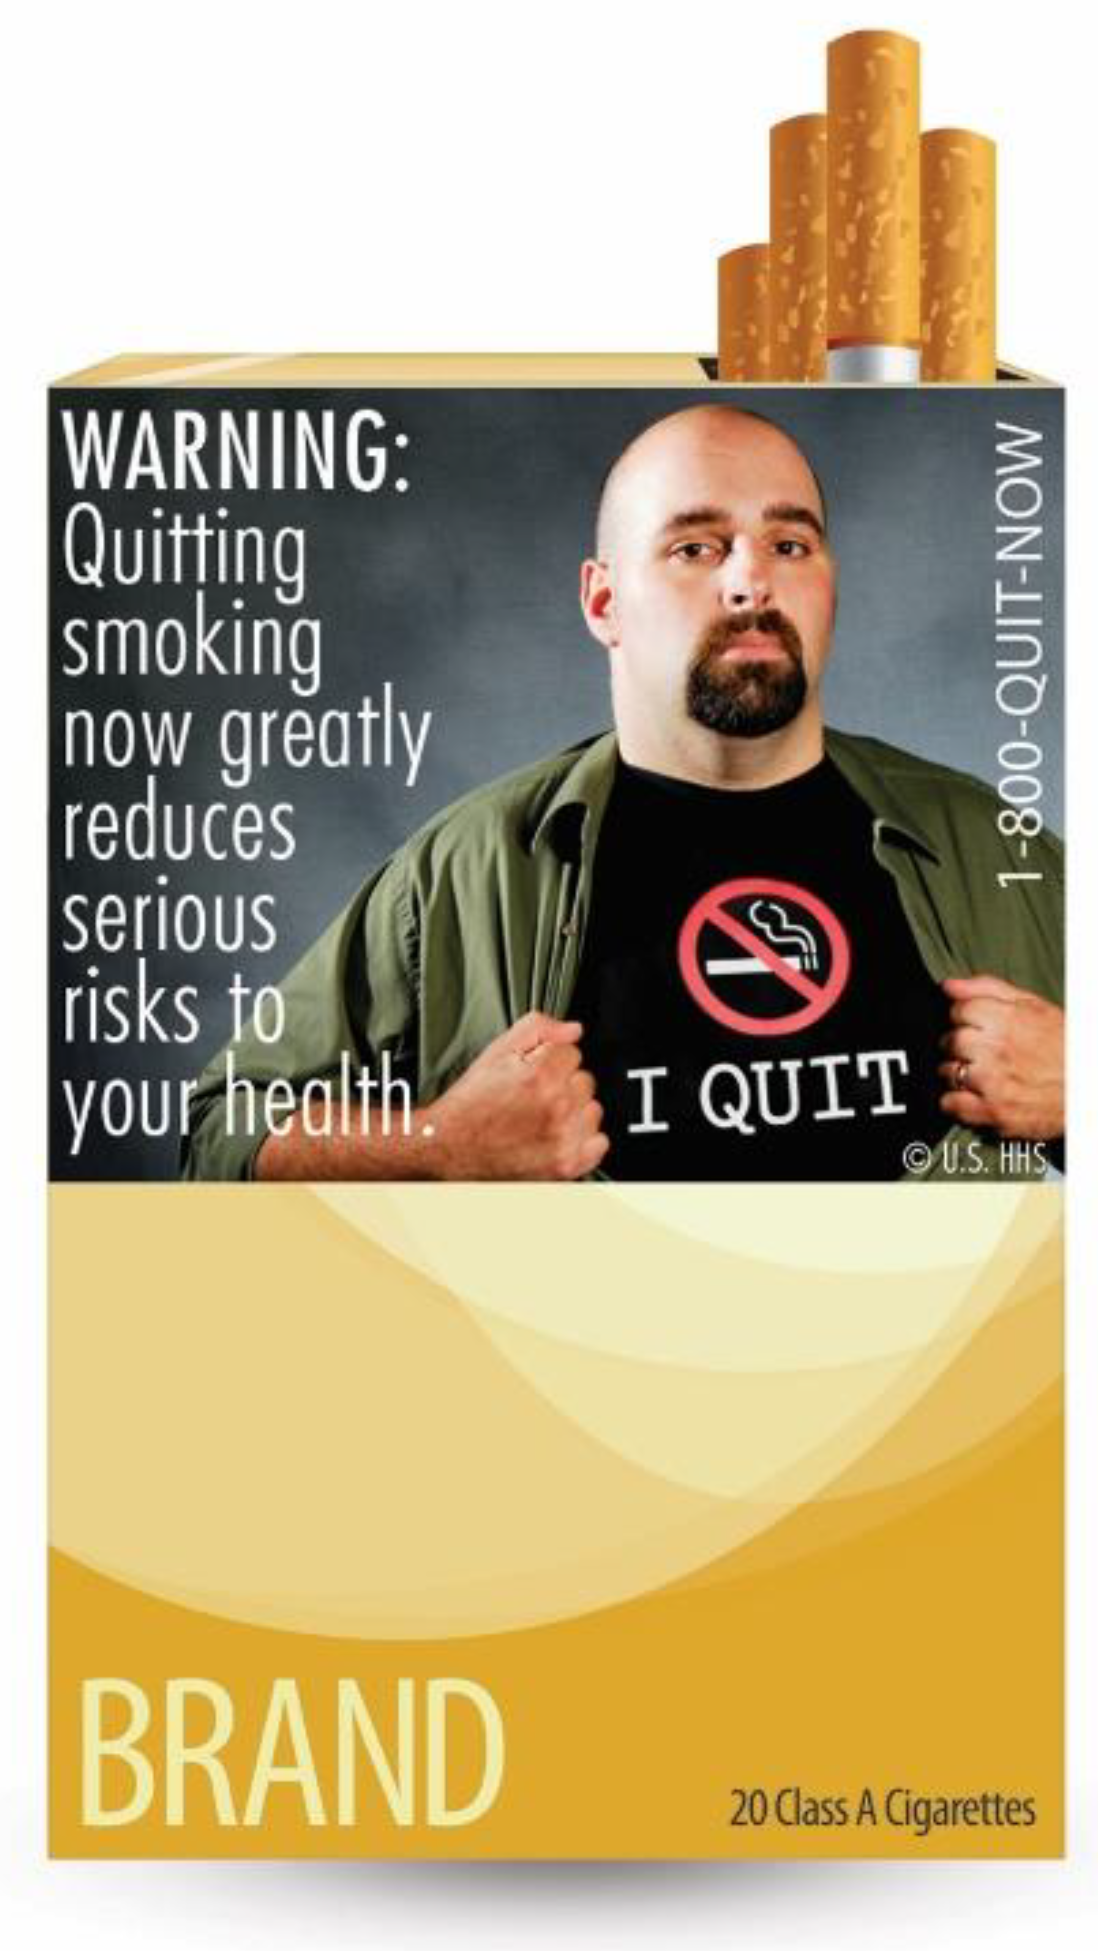
In addition to the informational labels, which present salient details in a neutral manner, labels which provide a specific caution or warning statement to viewers were also considered. Respondents’ perspectives regarding these labels are discussed in this section. Again, respondents were asked about the helpfulness, annoyingness, whether they would use the label, whether they thought others would use the label and whether they thought that the label would aid in assessing article trustworthiness. The data from these questions was analyzed in terms of respondents’ age, education level and gender.
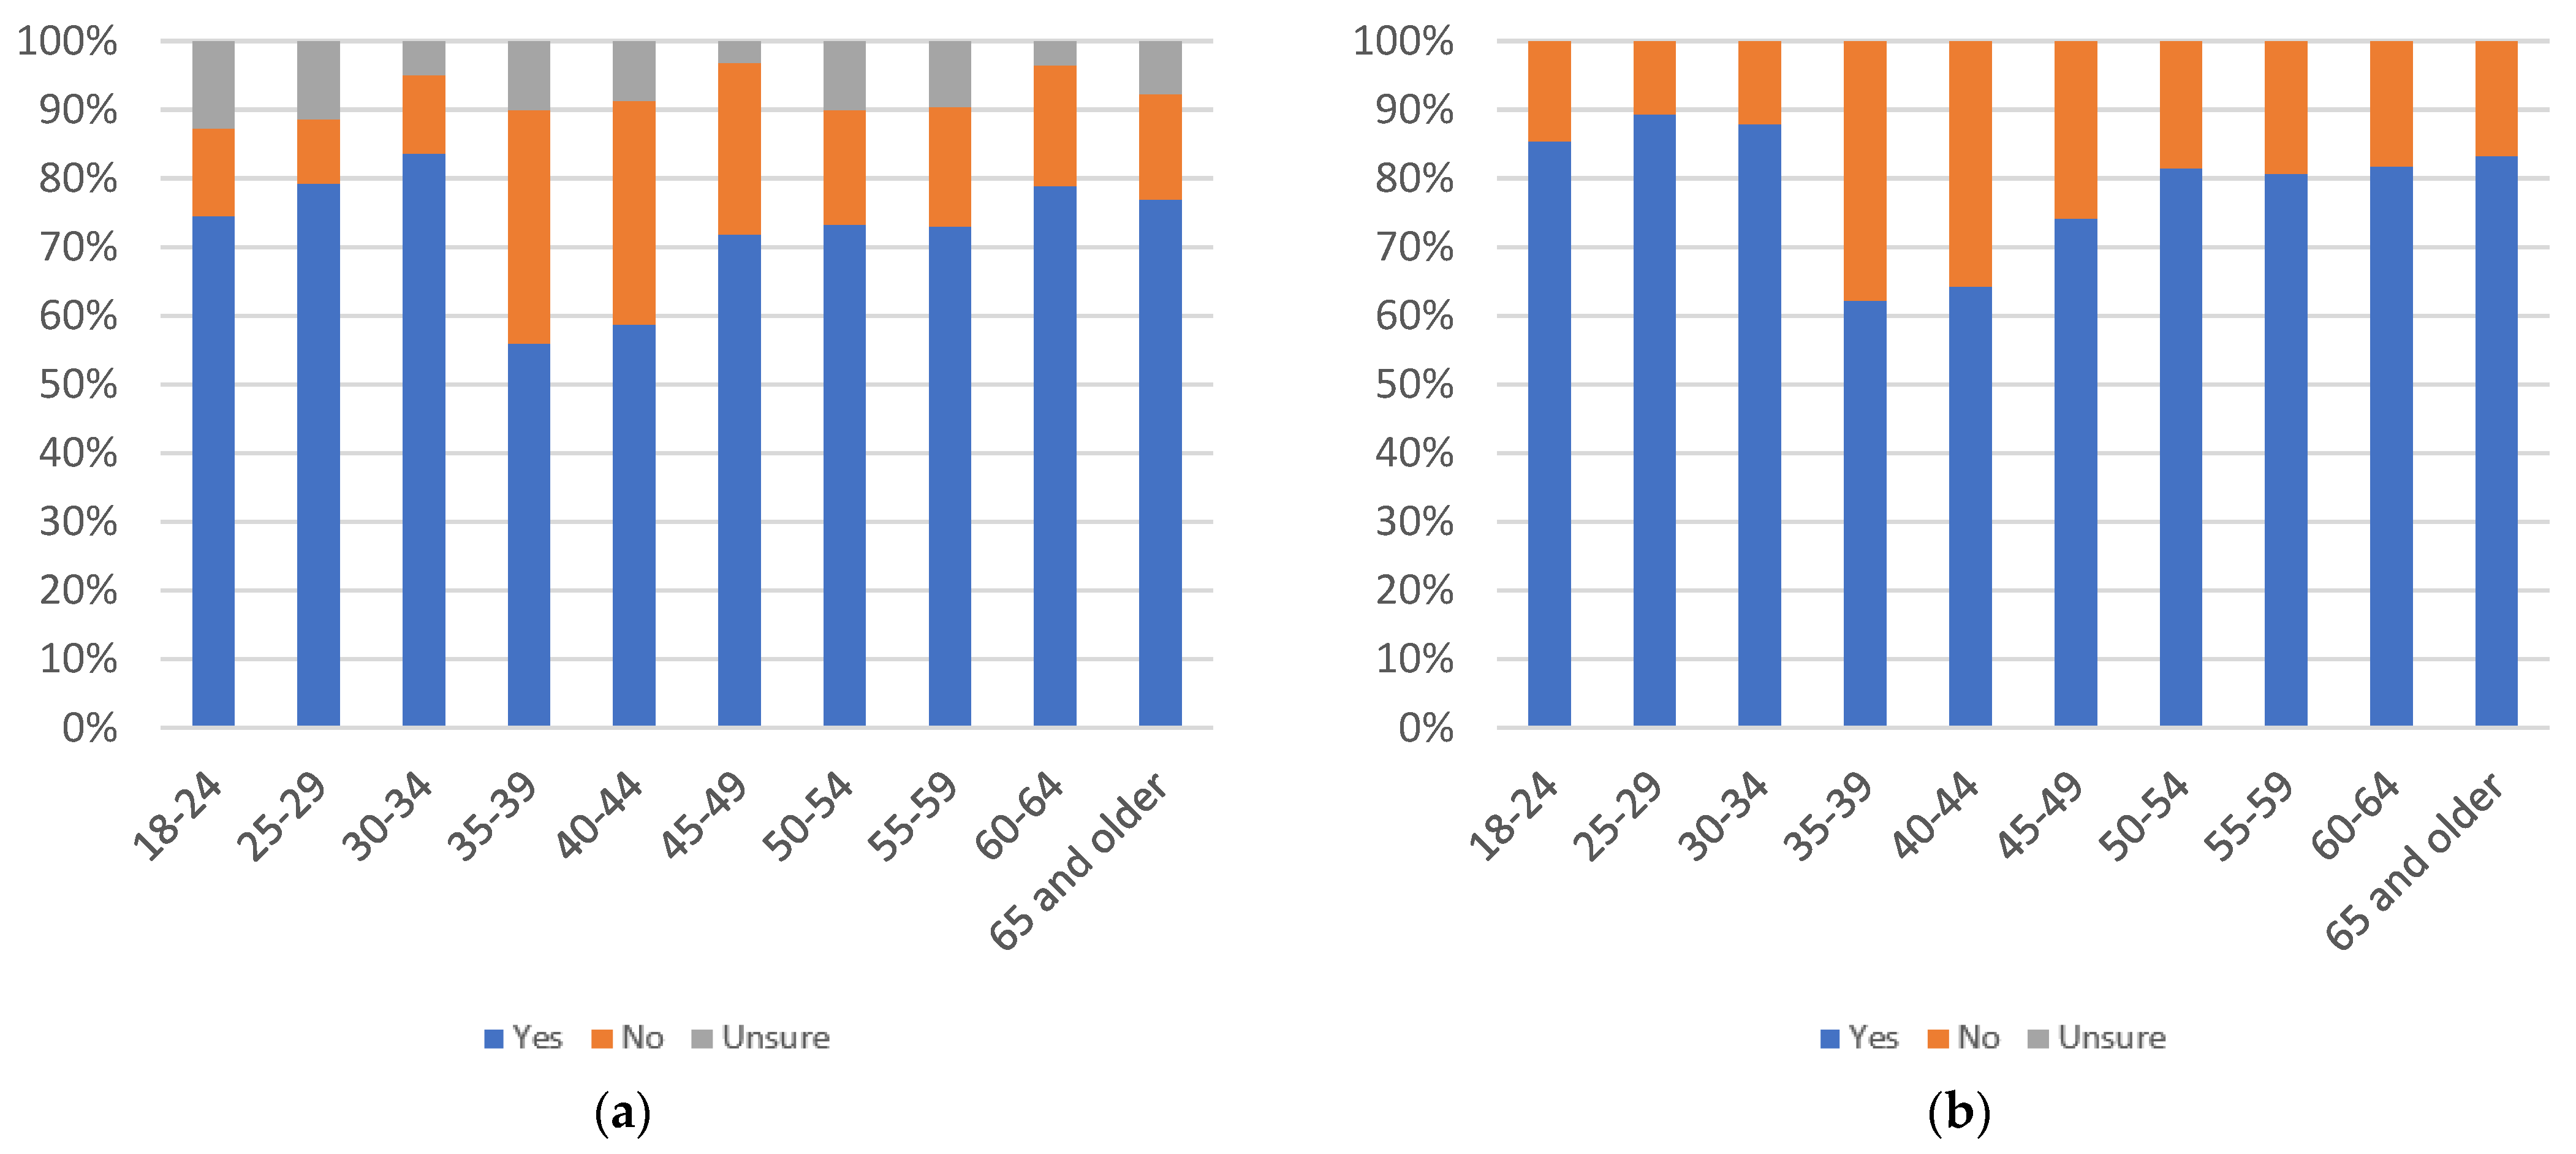
The helpfulness of warning label 1 (Figure 52), when it appears on top of an article that is deemed unsafe, is considered in Figure 53, Figure 54 and Figure 55. Respondents were asked to answer the question “would you find this label helpful?”.
In terms of age, there is a sudden drop in yes responses at the 35–39 age group, followed by a steady increase. Otherwise, responses are generally consistent when uncertainty is not considered. Even when uncertainty is not considered, all age groups report at least 50% yes responses.
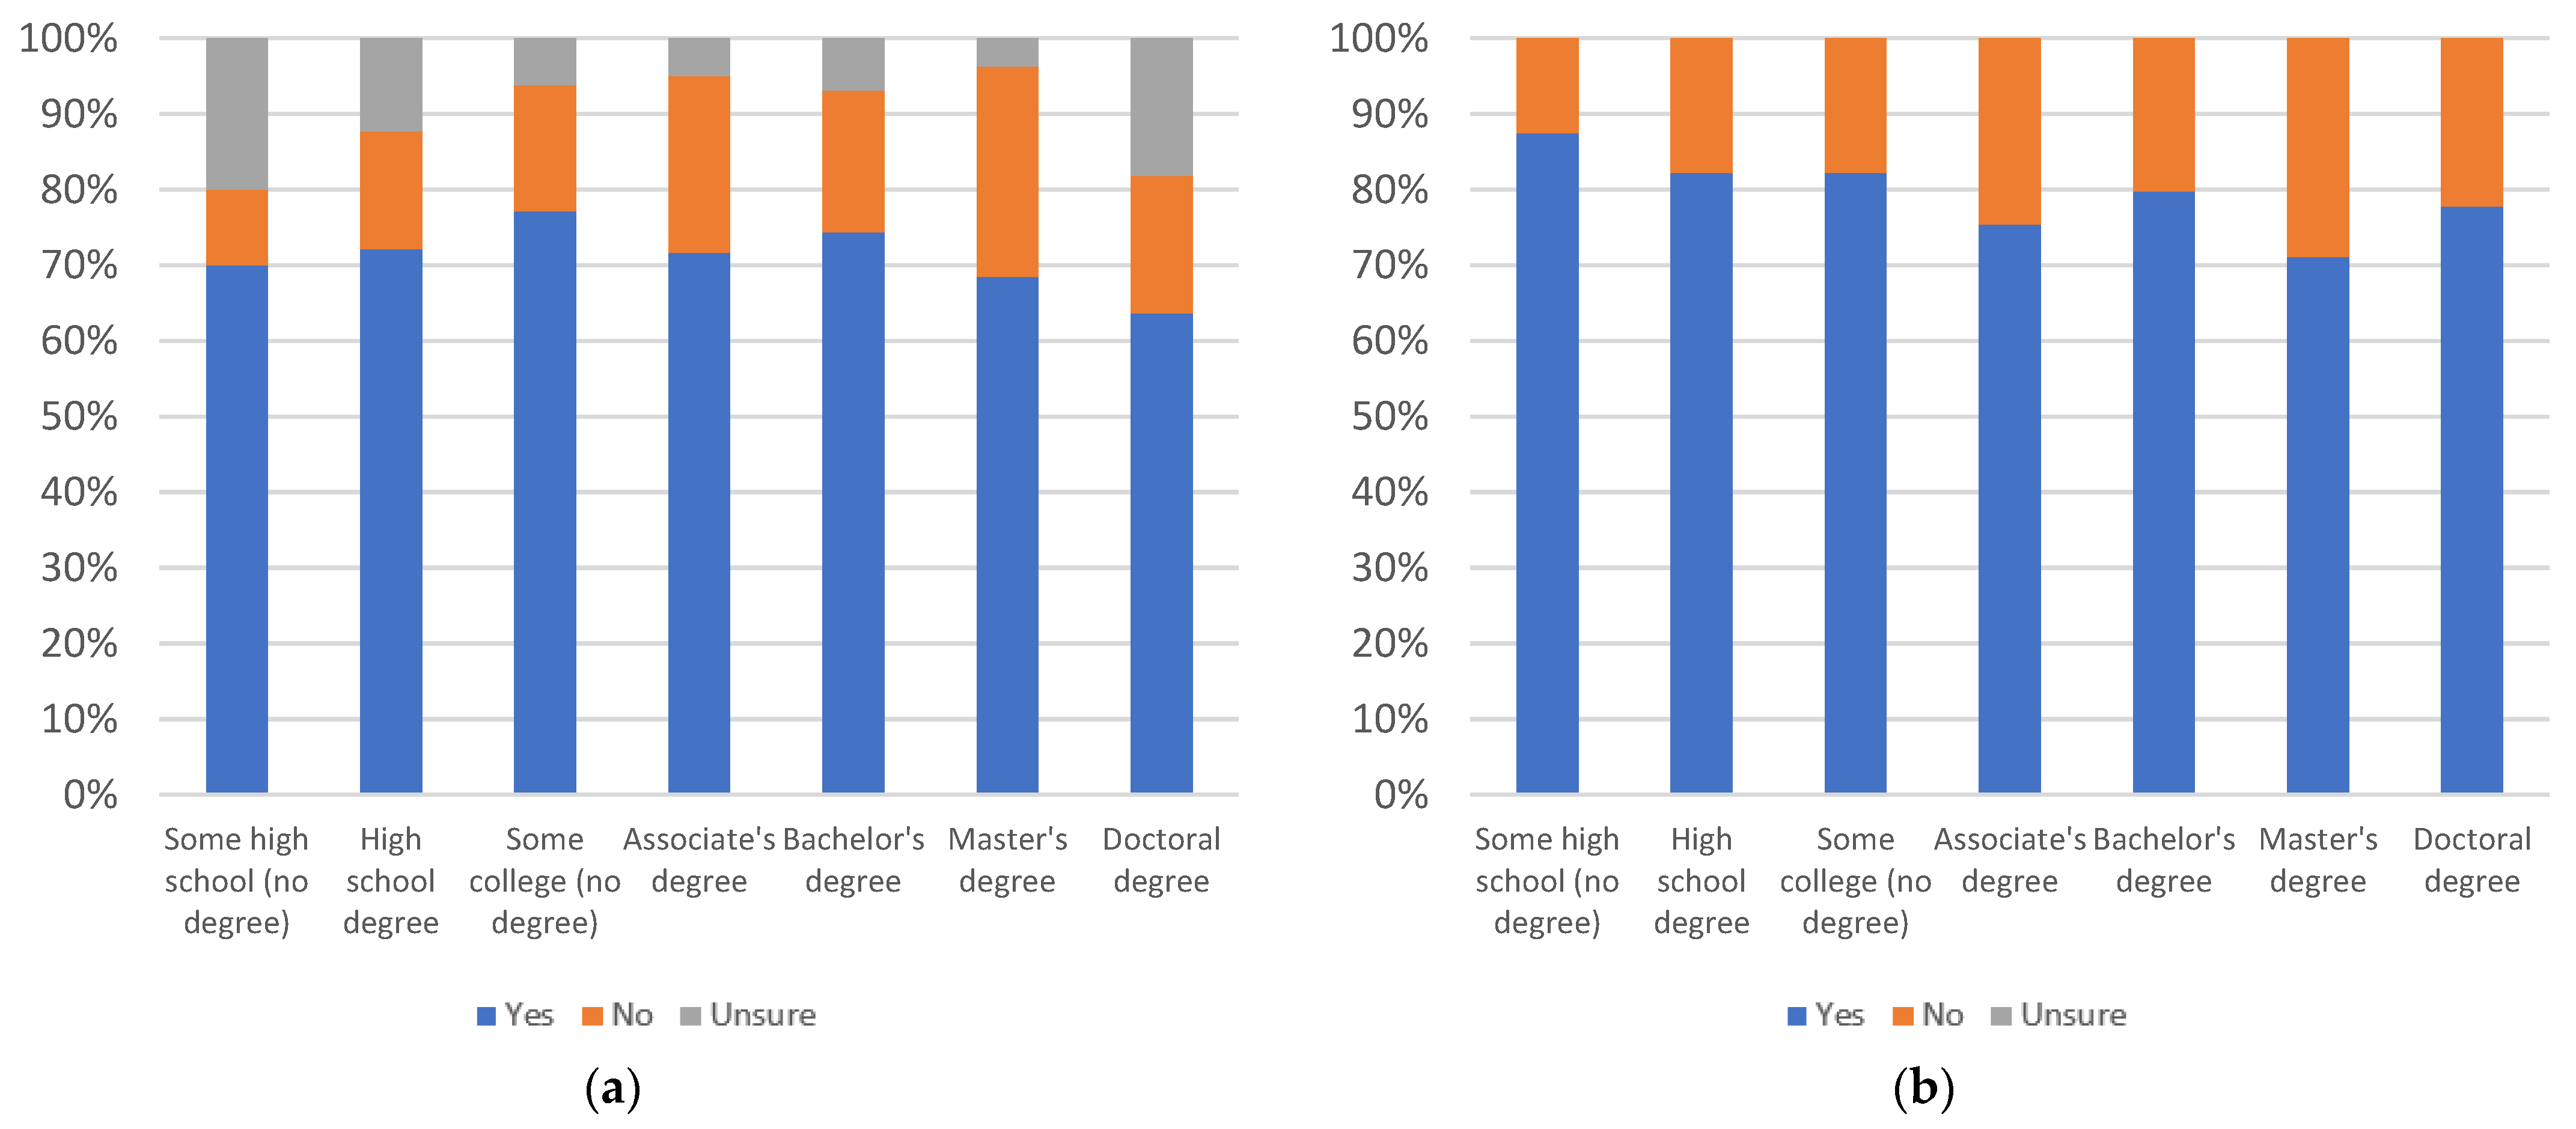
By education level, there is a slow decline in yes responses as education level increases. Uncertainty is most pronounced at the lowest and highest education levels. However, even with uncertainty factored in, all age groups report at least 50% yes responses.
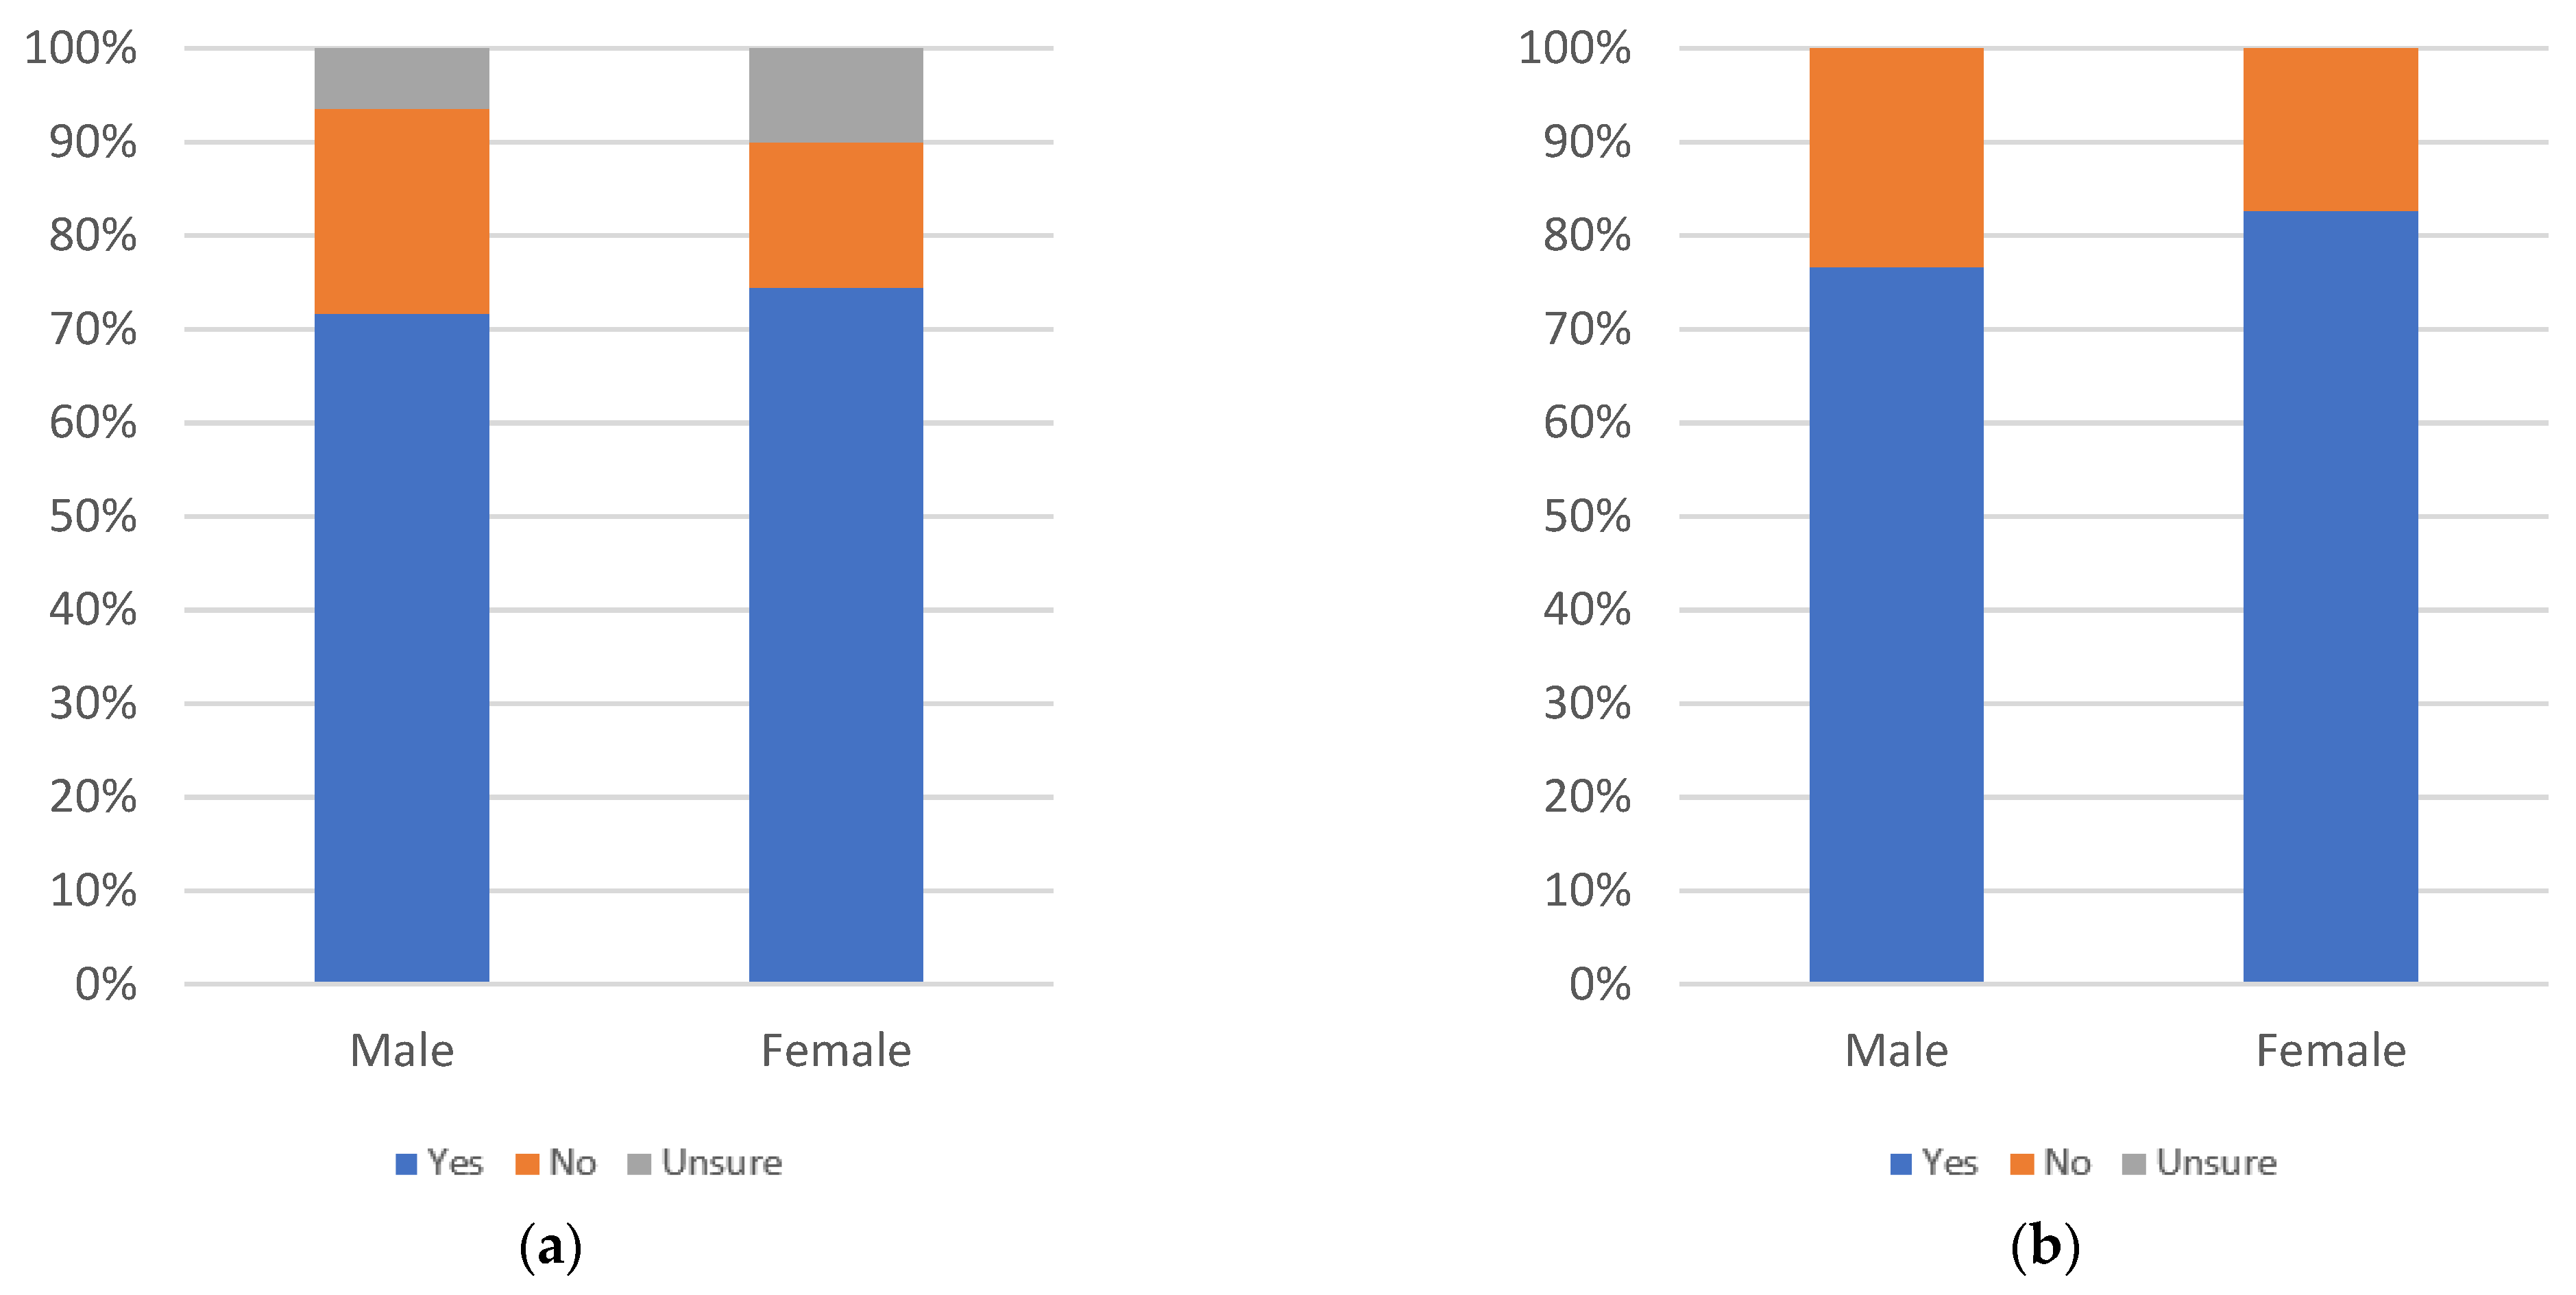
By gender, female respondents have both the highest yes response rate and the highest uncertainty level. Both gender groups have at least 50% yes responses, even when uncertainty is included.
Figure 56, Figure 57 and Figure 58 consider respondents’ perceptions of the annoyingness of warning label 1, with respondents answering the question “would you find this label annoying?”.
In terms of age, there is a peak in yes responses at the 40–44 age group, with yes responses rising steadily from the 18–24 to 40–44 age groups and then dropping again to the 55–59 age group. There is then a second, smaller peak from the 55–59 age group to the 65 and older age group. Whether uncertainty is included or not, the only age group to exceed 50% yes responses is the 40–44 age group. This indicates an overall low level of annoyance across most age groups.
By education level, yes responses spike slightly for the some high school (no degree) and doctoral degree groups, when uncertainty is not considered, and otherwise remains relatively consistent. Results are consistent, even for these groups, when uncertainty is considered, as there are spikes in uncertainty for both groups. The percentage of respondents answering yes exceeds 50% only for these two groups, and only when uncertainty is not considered.
By gender, male and female yes response levels are nearly equal, with a slightly higher yes response and uncertainty level for females. Both groups remain under 50% yes responses, even without uncertainty included.
Figure 59, Figure 60 and Figure 61 consider respondents’ likelihood of personally using warning label 1, with respondents answering the question “would you review this label when viewing news articles on social media?”.
In terms of age, there are peaks at the 25–29, 50–54, and 60–64 age groups. The steepest decline in yes responses occurs between the 30–34 and 35–39 age groups. This drop is even more pronounced, when uncertainty is also included. Only the 40–44 age group has below 50% yes responses, and then only when uncertainty is included.
By education level, there is a small peak at the associate’s degree education level. Due to a higher-than-average level of uncertainty, the some high school (no degree) group drops under 50% yes, when uncertainty is included. Without uncertainty considered, all groups report above 50% yes responses.
By gender, there is an increase in the number of yes responses among female respondents in addition to a higher level of uncertainty. Both groups report greater than 50% yes responses, even when uncertainty is included.
Figure 62, Figure 63 and Figure 64 consider respondents’ perspective as to the likelihood of others to use warning label 1, with respondents answering the question “would others review this label when viewing news articles on social media?”.
In terms of age, results appear somewhat consistent, when uncertainty is not considered. There is a plateau from the 45–49 to 65 and older age groups. There is a slow decline from the 25–29 to 40–44 age groups, and a drop at the 18–24 age group. Uncertainty levels are generally high. Once uncertainty is introduced, the results change significantly, with three waves of increase at 18–24 to 30–34, 35–39 to 45–49, and 50–54 to 65 and older. Each of these waves bottoms out either just above or just below 50% yes responses, with only two (35–39 and 50–54) dropping below 50%, with uncertainty included. Without uncertainty, all age groups exceed 50% yes responses.
By education level, there is a decline in the level of yes responses, as education level increases, when uncertainty is not considered. With the consideration of uncertainty, results are instead relatively consistent. The exceptions, in both cases, are spikes at the some college (no degree) and bachelor’s degree education level groups. All education groups meet or exceed 50% yes responses, even when uncertainty is considered.
By gender, females report a higher level of uncertainty and slightly lower level of yes responses; though female yes responses are a higher proportion when uncertainty is not considered. Both groups exceed 50% yes responses, even when uncertainty is included.
Figure 65, Figure 66 and Figure 67 consider the value of warning label 1 for gauging article trustworthiness, with respondents answering the question “would it be useful for judging the trustworthiness of news articles?”.
In terms of age, there are three waves of increasing yes responses, when uncertainty is considered, at the 18–24 to 30–34, 35–39 to 45–49, and 40–54 to 65 and older age groups. Similar waves exist, when uncertainty is removed, though there is a spike at the 25–29 age group which is due to a higher level of uncertainty for that group. Only the 35–39 age group has under 50% yes responses, and then only when uncertainty is included.
By education level, the some high school (no degree) group and doctoral degree group show higher than average uncertainty levels. As a result, while there appears to be a gradual decrease in yes responses, when uncertainty is not included, this becomes a gradual increase (not including doctoral degree holders), when uncertainty is introduced. Only doctoral degree holders have less than 50% yes responses, and then only when uncertainty is included.
By gender, females have a higher percentage of yes responses, while both groups have approximately the same level of uncertainty. Both groups report higher than 50% yes responses, even when uncertainty is included.
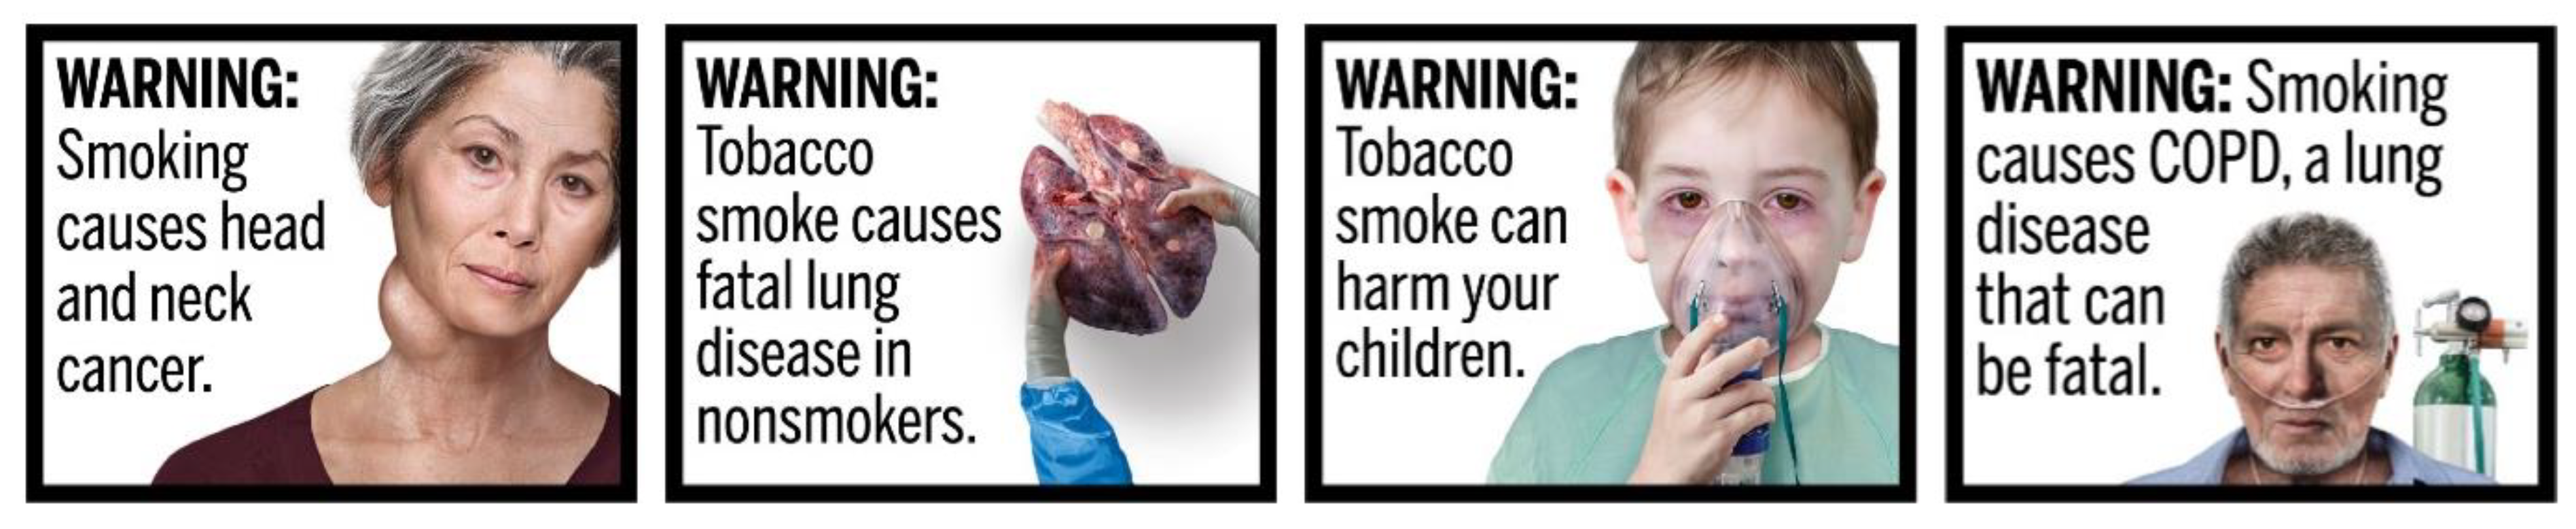
The helpfulness of warning label 2 (shown in Figure 68), when it appears underneath a news article that is deemed unsafe, is considered in Figure 69, Figure 70 and Figure 71. Respondents answer the question “would you find this label helpful?”.
In terms of age, results are relatively consistent, except for drops in yes response levels at the 35–39, 45–49, 60–64 and 65 and older age groups. These drops appear even when uncertainty is considered, though only the 45–49 age group drops below 50% yes response levels. When uncertainty is not included, all age groups exceed 50% yes responses.
By education level, there is a gradual decline in yes responses, as education level increases and a graduate decrease in uncertainty from the some high school (no degree) level up to the associate’s degree holders education level. All education levels report a greater than 50% yes response rate, even when uncertainty is included.
By gender, female respondents report higher both a higher number of yes responses and a higher level of uncertainty. Both groups have a greater than 50% yes response rate, even when uncertainty is considered.
Figure 72, Figure 73 and Figure 74 consider the annoyingness of warning label 2, with respondents answering the question “would you find this label annoying?”.
In terms of age, there is no apparent general pattern of increase or decrease as age increases. There is a decline from the 18–24 to 35–39 age groups, when uncertainty is not included; however, this decline is less notable, when uncertainty is introduced. There is a spike at the 40–44 age group, a drop at the 50–54 age group, and another spike at the 60–64 age group. All groups report less than 50% yes responses, even when uncertainty is not included, meaning that annoyance is relatively low, across all age groups.
By education level, there is a decline in yes responses from the high school degree educational level up to master’s degree holders, with a drop at the some high school (no degree) level and a spike for doctoral degree holders. Uncertainty is highest for the some high school (no degree) and doctoral degree groups as well. While yes responses remain below 50% for all education groups, when uncertainty is included, doctoral degree holders exceed 50% yes responses, when uncertainty is removed. This indicates a low level of annoyance, across most education levels.
By gender, male respondents report a higher percentage of yes responses and a higher uncertainty level than females. Neither group exceeds 50% yes responses, even when uncertainty is not included, meaning that annoyance is relatively low regardless of gender.
Figure 75, Figure 76 and Figure 77 consider likelihood of respondents’ to personally use warning label 2, with respondents answering the question “would you review this label when viewing news articles on social media?”.
In terms of age, there is no apparent general pattern of increase or decrease as age increases. There are sharp drops at the 18–24, 35–39 and 45–49 age groups, even when uncertainty is included; however, no age group drops below 50% yes responses, even considering uncertainty.
By education level, the some high school (no degree) and doctoral degree levels have the highest uncertainty. When uncertainty is not considered, there is a large spike in yes responses for the some high school (no degree) group. Otherwise, the results are relatively consistent across education levels. Yes responses remain at or above 50% for all education levels, even when uncertainty is considered.
By gender, females report a higher percentage of yes responses and a higher uncertainty level than males. Both groups have over 50% yes responses, even when uncertainty is included.
Figure 78, Figure 79 and Figure 80 consider respondents’ perception of the likelihood of others to use warning label 2, with respondents answering the question “would others review this label when viewing news articles on social media?”.
In terms of age, there are three peaks in yes responses at the 30–34, 40–44, and 55–59 age groups. These are apparent whether uncertainty is considered or not. The peaks are more gradual, though, when uncertainty is included. There are high levels of uncertainty for the 50–54 and 55–59 age groups, which smooth the curve from the 45–49 to the 65 and older age groups. Uncertainty is relatively high across all age groups. With uncertainty considered, the 35–39, 45–49, 50–54, 60–64 and 65 and older age groups all have below 50% yes responses. When uncertainty is not included, all age groups exceed 50% yes responses, indicating the magnitude of uncertainty present.
By education level, yes responses are relatively consistent, when uncertainty is considered. This is due to an exceptionally high level of uncertainty amongst doctoral degree holders. When uncertainty is omitted, yes responses for doctoral degree holders appear to spike. All education levels other than high school degree and master’s degree have at least a 50% yes response rate, even when uncertainty is included. When uncertainty is omitted, all education levels exceed 50% yes responses.
By gender, female respondents report a higher percentage of yes responses, while male respondents report a higher level of uncertainty. Consequently, male respondents fall below 50% yes responses, when uncertainty is included. Both groups exceed 50% yes responses, when uncertainty is ignored.
Figure 81, Figure 82 and Figure 83 consider the value of warning label 2 for gauging article trustworthiness, with respondents answering the question “would it be useful for judging the trustworthiness of news articles?”.
In terms of age, there is no apparent pattern of increase or decrease as age increases. The percentage of yes responses drops for the 35–39 age group, while it spikes at the 25–29, 30–34, and 55–59 age groups. Only the 35–39 age group has below 50% yes responses, and this is only when uncertainty is included. Without uncertainty’s inclusion, all age groups exceed 50% yes responses.
By education level, there is a general decline in uncertainty from the some high school (no degree) level to the master’s degree level, followed by a sharp increase at the doctoral degree level which matches the peak seen at the some high school (no degree) level. Like prior results in this study, it may be inferred that, for most label styles, doctoral degree holders reach a point in their education where they are more likely to question their own beliefs, and that otherwise certainty tends to increase as education level increases. There is a spike in yes responses for the some high school (no degree) group, when uncertainty is not included. Only doctoral degree holders have below 50% yes responses, and then only when uncertainty is included.
By gender, females report a higher percentage of yes responses, while uncertainty levels are similar for both groups. Both groups exceed 50% yes responses, even when uncertainty is included.
The helpfulness of warning label 3 (shown in Figure 84), when it appears after clicking a link to an article but before the article’s contents are displayed, is considered in Figure 85, Figure 86 and Figure 87. Respondents answer the question would you find this label helpful?
In terms of age, there are three waves of decline: from 18–24 to 25–29, from 30–34 to 45–49, and from 50–54 to 65 and older. There is a slight recovery at the 65 and older group, when uncertainty is considered, due to a very low level of uncertainty for that age group. Only the 45–49 age group has below 50% yes responses, and then only when uncertainty is included.
By education level, yes response levels are relatively consistent, when uncertainty is included, other than a drop for doctoral degree holders. Due to a very high level of uncertainty, the some high school (no degree) education level has an apparent spike in the proportion of yes responses, when uncertainty is not considered. Only doctoral degree holders drop below 50% yes responses, and then only when uncertainty is included.
By gender, female respondents are far more likely to report yes despite similar uncertainty levels for both genders. Both genders report above 50% yes responses, even with uncertainty included.
Figure 88, Figure 89 and Figure 90 consider annoyingness of warning label 3, with respondents answering the question “would you find this label annoying?”.
In terms of age, there is a clear curve peaking at the 40–44 age group, whether uncertainty is included or not. Only the 40–44 and 45–49 age groups exceed 50% yes responses, when uncertainty is included. When uncertainty is not included, only these two groups and the 35–39 age group exceed a 50% yes response level. As such, for most age groups the level of annoyance is relatively low.
By education level, there are two peaks at the some college (no degree) and master’s degree levels, whether uncertainty is included or otherwise. Uncertainty peaks at the some high school (no degree) group. All groups have below a 50% yes response level, when uncertainty is included. When uncertainty is not included, only the some college (no degree) group exceeds a 50% proportion of yes responses. This shows that the annoyance level is relatively low, across education levels.
By gender, female and male responses are nearly identical, both in terms of the proportion of yes responses and the level of uncertainty. Both have under 50% yes responses, whether uncertainty is considered or not.
Figure 91, Figure 92 and Figure 93 consider likelihood of respondents to personally use warning label 3, with respondents answering the question “would you review this label when viewing news articles on social media?”.
In terms of age, there is no clear pattern of increase or decrease in yes responses, as age increases. Uncertainty tends to increase from the 30–34 to 50–54 age groups. It then declines up to the 65 and older age group. There are spikes in yes responses for the 30–34, 40–44, and 50–54 age groups, with a gradual decline from the 50–54 to 65 and older age groups. Only the 35–39 and 45–49 age groups have below 50% yes responses, when uncertainty is included. When uncertainty is not included, the proportion of yes responses remains over 50% for all age groups.
By education level, there results are relatively consistent, when uncertainty is included except for a decline from the bachelor’s degree to doctoral degree education levels. There is a spike in the proportion of yes responses for the some high school (no degree) group, when this group’s high level of uncertainty is included. Only the doctoral degree holders have below 50% yes responses, and then only when uncertainty is included.
By gender, there are more yes responses among females, while uncertainty remains similar for both groups. Both groups have above 50% yes responses, even when uncertainty is included.
Figure 94, Figure 95 and Figure 96 consider respondents’ perception of the likelihood of others to use warning label 3, with respondents answering the question “would others review this label when viewing news articles on social media?”.
In terms of age, there is no clear pattern of consistent increase or decrease in yes responses, as age increases. Uncertainty tends to decrease as age increases, with sharp spikes in uncertainty at the 35–39 and 50–54 age groups. Despite the similarly in uncertainty levels, the 35–39 age group shows a sharp drop in the proportion of yes responses, relative to most age groups, while the 50–54 age group shows a sharp increase. Another sharp drop in yes responses is seen at the 18–24 age group. Uncertainty levels are relatively high across all age groups. When uncertainty is included, only a subset of age groups (25–29, 30–34, 40–44, 50–54, and 60–64) have at least 50% yes responses. When uncertainty is removed, only the 18–25 age group has a proportion of yes responses below 50%.
By education level, there is a slight peak in support at the bachelor’s degree level, when uncertainty is included. Uncertainty is at its highest for the some high school (no degree) and doctoral degree groups. The some high school (no degree) group has an apparent spike in the proportion of yes responses, when uncertainty is omitted. With uncertainty included, only the some college (no degree) and bachelor’s degree education groups have at least 50% yes responses. When uncertainty is removed, all groups exceed a 50% proportion of yes responses.
By gender, there are more yes responses among females and slightly greater uncertainty among males. Males report less than 50% yes responses, when uncertainty is included. Both groups exceed a 50% proportion of yes responses, when uncertainty is removed.
Figure 97, Figure 98 and Figure 99 consider the value of warning label 3 for gauging articles’ trustworthiness, with respondents answering the question “would it be useful for judging the trustworthiness of news articles?”.
In terms of age, there are three peaks in yes responses: at the 25–29, 40–44, and 50–54 age groups. The 35–39 age group has a particularly pronounced drop in yes responses, in addition to a higher-than-average level of uncertainty. Only the 35–39 and 45–49 age groups have below 50% yes responses, when uncertainty is included. Only the 35–39 age group has a proportion of yes responses below 50%, when uncertainty is not considered.
By education level, results are relatively consistent, with a drop in yes responses for doctoral degree holders. The some high school (no degree) group has a higher proportion of yes responses, when uncertainty is not considered. The some high school (no degree) and doctoral degree groups have the highest uncertainty levels. With uncertainty considered, only these two groups have below 50% yes responses. Without uncertainty, the proportion of yes responses is at or above 50% for all education levels.
By gender, females have a higher percentage of “yes” responses, while uncertainty levels are similar for both groups. Both groups have a percentage of yes responses at or above 50%, even when uncertainty is included.

6. Supplemental Information Label Related Data and Analysis

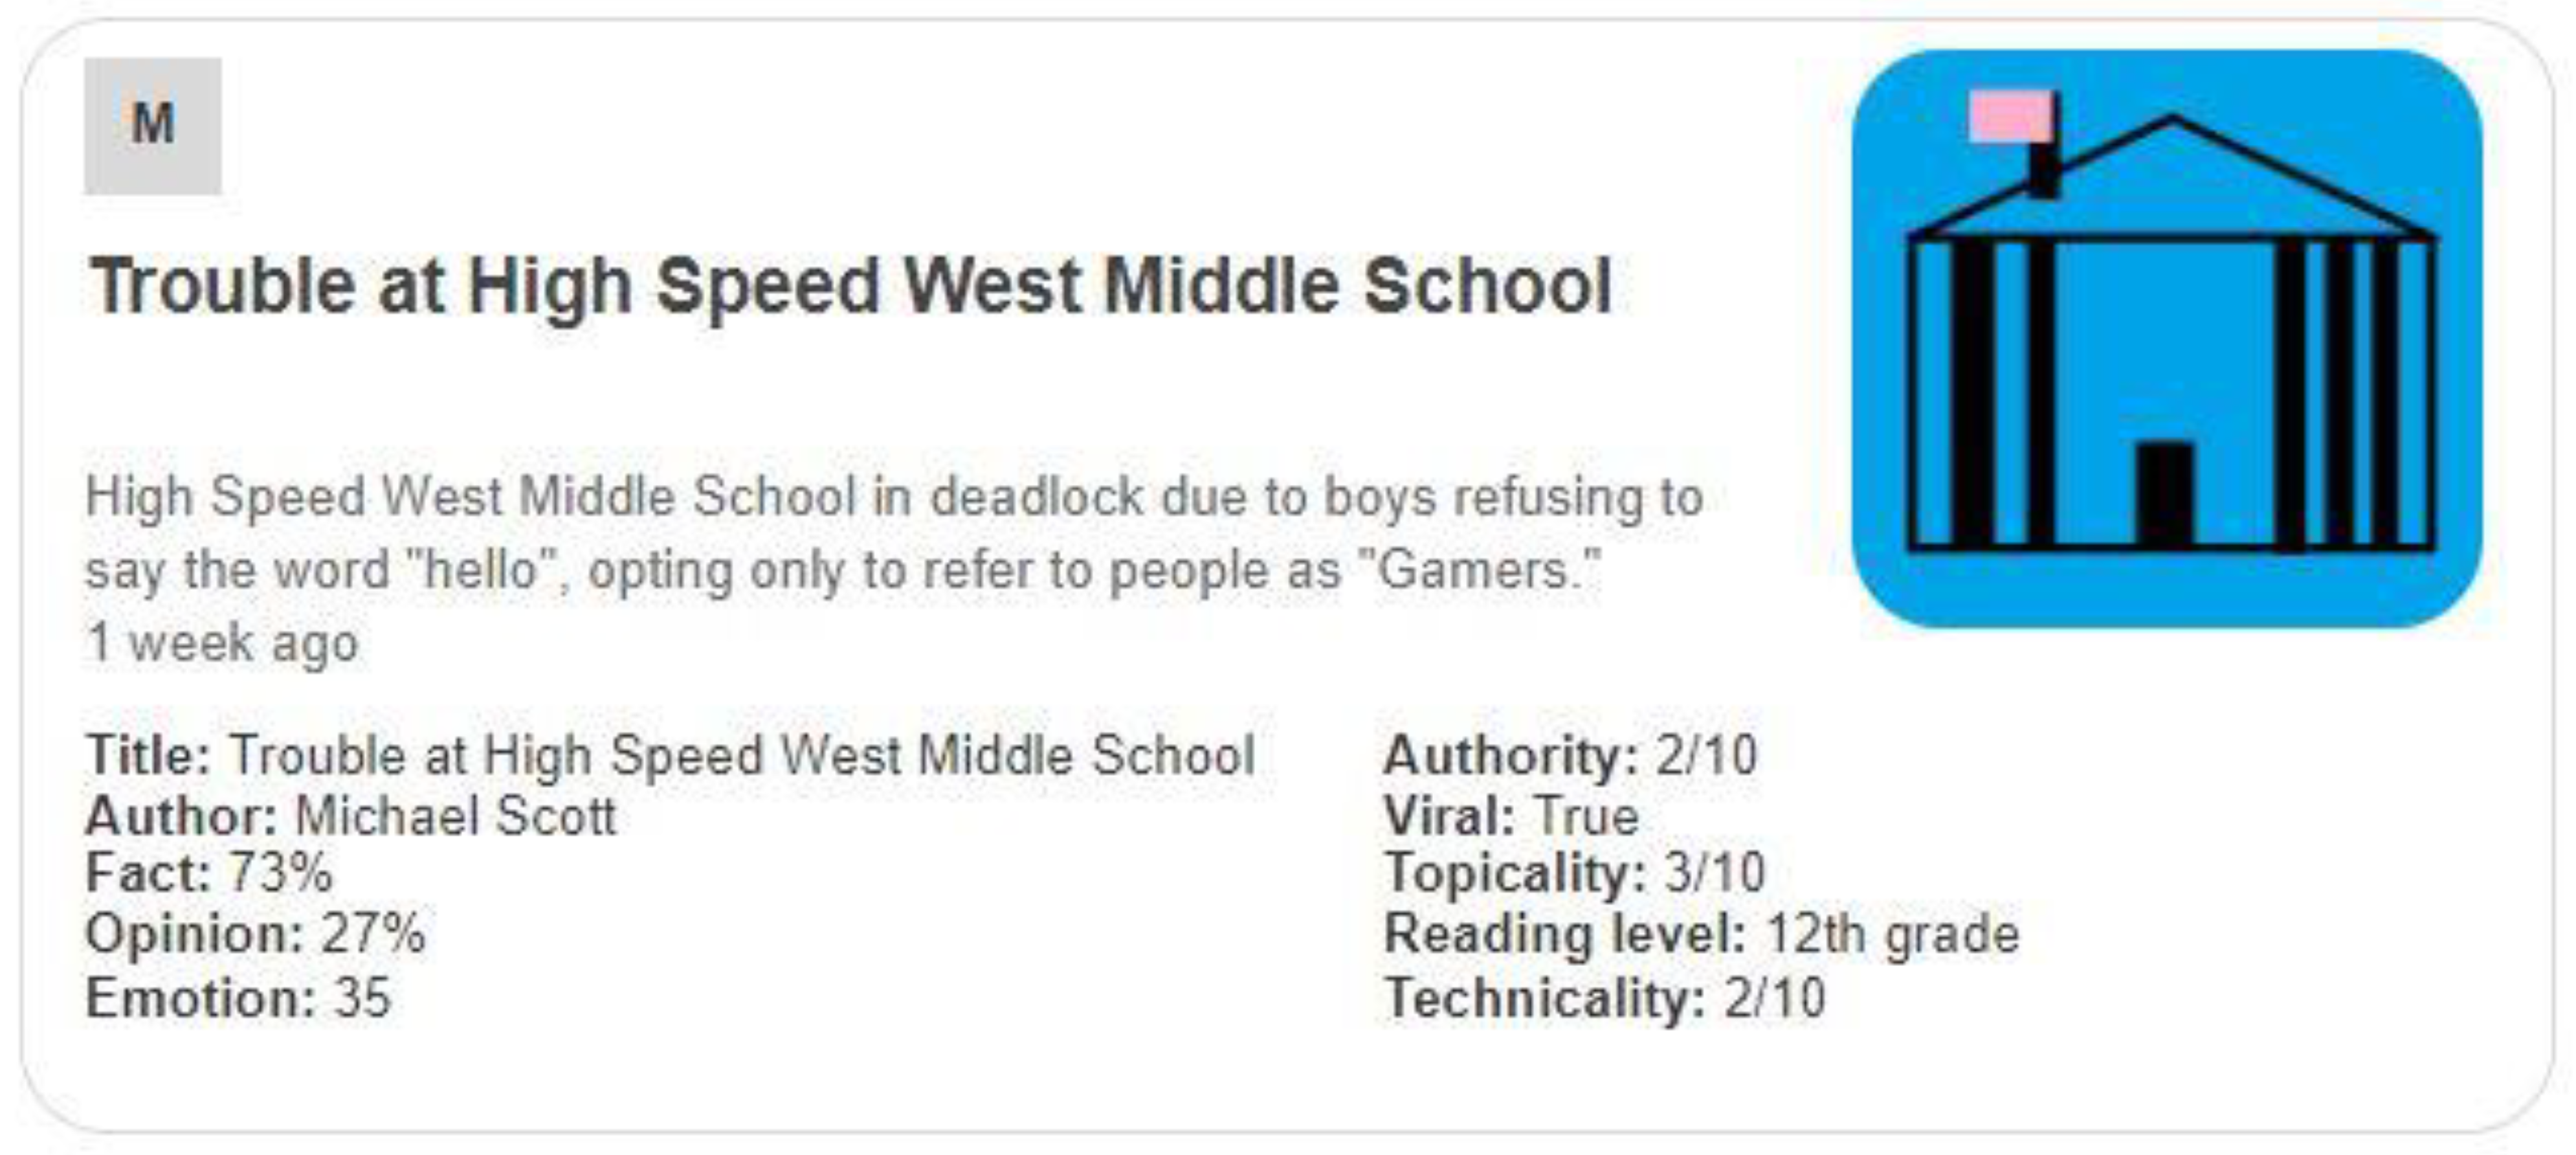
Finally, a third type of labels—supplemental information labels—are considered. These labels provide additional details about the content of a page and a link to a location where more details can be obtained from a trusted news source. Again, respondents were asked about the helpfulness, annoyingness, whether they would use the label, whether they thought others would use the label and whether they thought the label would be helpful for assessing articles’ trustworthiness. Respondents’ answers to these questions were analyzed in terms of their age, education level and gender in this section.
The helpfulness of the supplemental information label (shown in Figure 100), when it is appended to any article, regardless of its accuracy, is considered in Figure 101, Figure 102 and Figure 103. Respondents answered the question “would you find this label helpful?”.
In terms of age, there are two clear curves, with the larger curve peaking at the 30–34 age group and the smaller curve peaking at the 50–54 and 55–59 age groups. Uncertainty levels show no clear pattern, as age increases. It reaches its the highest level at the 40–44 age group and is at the 50–54 age group. The 40–44 and 45–49 age groups have under 50% yes responses, when uncertainty is included. All groups exceed a 50% proportion of yes responses, when uncertainty is not included.
By education level, yes responses remain relatively consistent with a slight spike at the associate’s degree level and a decline at the doctoral degree level. Uncertainty spikes for the some high school (no degree) education level, though all groups have at least a 50% level of yes responses, even when uncertainty is included.
By gender, there is a significantly higher level of yes responses for female responses, as well as a slightly higher level of uncertainty. Both groups have over 50% yes responses, even when considering uncertainty.
Figure 104, Figure 105 and Figure 106 consider the annoyingness of the supplemental information label, with respondents answering the question “would you find this label annoying?”.
In terms of age, there is a peak at the 40–44 age group followed by a decline and consistency, at higher age groups. Uncertainty is particularly low for the 30–34 and 50–54 age groups, while uncertainty is highest for the 18–24 and 55–59 age groups. Only the 40–44 age group exceeds 50% yes responses, with uncertainty included. The proportion of yes responses also reaches 50% for the 55–59 age group, when uncertainty is excluded. This demonstrates that the level of annoyance is low across most age groups.
By education level, there is a gradual decline in yes responses, as education level increases. There is a spike at the some college (no degree) group. As with most prior questions, the some high school (no degree) group shows the highest level of uncertainty. Interestingly, the master’s degree group reports 0% uncertainty. No group reaches the threshold of 50% yes responses, when uncertainty is considered. When uncertainty is removed, only the some high school (no degree) and some college (no degree) groups exceed a 50% proportion of yes responses. This indicates a low level of annoyance across most education levels.
By gender, males have a higher percentage of yes responses, while females have a slightly higher level of uncertainty. Neither group exceeds 50% yes responses, even when uncertainty is not included.
Figure 107, Figure 108 and Figure 109 consider respondents’ likelihood to personally use the supplemental information label, with respondents answering the question “would you review this label when viewing news articles on social media?”.
In terms of age, there is a clear curve with yes responses peaking at the 30–34 age group. This group also has the lowest level of uncertainty. When uncertainty is considered, four groups fail to reach the 50% threshold for yes responses: 18–24, 45–49, 55–59, and 65 and older. Without uncertainty, only the 65 and older age group falls below a 50% proportion of yes responses.
Responses are relatively flat across education levels, though uncertainty is again highest for the some high school (no degree) group. Three groups (some high school (no degree), bachelor’s degree, and master’s degree) have below a 50% yes response level, when uncertainty is included. When uncertainty is excluded, all educational levels exceed a 50% proportion of yes responses.
By gender, females respond yes more frequently than males, in addition to reporting a higher level of uncertainty. The male respondents have below 50% yes responses, when uncertainty is included. Both groups exceed a 50% proportion of yes responses, when uncertainty is not considered.
Figure 110, Figure 111 and Figure 112 consider respondents’ perception of the likelihood of others to use the supplemental information label, with respondents answering the question “would others review this label when viewing news articles on social media?”.
In terms of age, there are spikes at three age groups, when uncertainty is included: the 25–29 and 30–34 age groups (jointly forming one peak), the 40–44 age group, and the 50–54 age group. These same peaks exist when uncertainty is removed, though the 55–59 age group also shows a peak in this case, due to it’s higher-than-average uncertainty. In general, uncertainty across all groups is relatively high for this question. Consequently, while only two groups (25–29 and 30–34) exceed 50% yes responses when considering uncertainty, all groups—other than the 65 and older age group—exceed a 50% proportion of yes responses, when uncertainty is excluded.
Responses are relatively consistent across education levels, with the lowest point at the doctoral degree level. Unlike most other questions, where the some high school (no degree) and doctoral degree education levels are frequently the high points for uncertainty, on this question uncertainty is relatively consistent (but pronounced) across all education levels. Only the some college (no degree) group exceeds 50% yes responses, when uncertainty is included. All groups have at least a 50% proportion of yes responses, when uncertainty is removed.
By gender, females more frequently respond with yes than males, while males report a higher level of uncertainty. Males have below 50% yes responses when uncertainty is included. Both gender groups exceed a 50% proportion of yes responses, when uncertainty is eliminated.
Figure 113, Figure 114 and Figure 115 consider the value of the supplemental information label for gauging article trustworthiness, with respondents answering the question “would it be useful for judging the trustworthiness of news articles?”.
In terms of age, the level of yes responses is relatively consistent, except for a spike at the 25–29 and 30–34 age groups. Uncertainty is at its lowest level at the 50–54 age group but seems to vary unpredictably as age increases. Less than half of age groups report at least 50% yes responses, when uncertainty is included. These groups tend to be younger, including the 18–24, 25–29, 30–34 and 40–44 age groups. When uncertainty is eliminated, all age groups other than 65 and older exceed a 50% proportion of “yes” responses.
Responses are relatively consistent across education levels when uncertainty is included. The proportion of yes responses trends downward, as education level increases, when uncertainty is ignored. The highest uncertainty level is exhibited by the some high school (no degree) education level, once again, while associate’s degree holders express the lowest level of uncertainty, in this case. Only two education levels (bachelor’s degree and doctoral degree) have below 50% yes responses, when uncertainty is included. All groups exceed a 50% proportion of yes responses, when uncertainty is not considered.
By gender, females respond far more frequently with yes than do males, while males reported a higher level of uncertainty. Males have less than 50% yes responses, when uncertainty is included. Both groups exceed a 50% proportion of yes responses, when uncertainty is excluded.

7. Broader Analysis and Analysis of Implications

This section discusses trends across the different label types, demographics and questions. Notably, respondents were overall very positive about the use of labels. In most cases, the majority of respondents indicated answers supportive of the use of labels, such finding them helpful, not annoying, indicating that they and others would use them and saying that they would be useful for evaluating articles’ trustworthiness.
Of course, some labels were better received than others. In the informational labels, for example, the third informational label was the best received by the youngest age groups, with approximately 70% of those between 18 and 34 finding the first informational label helpful (not considering those indicating uncertainty), versus an average of approximately 75% for the second informational label and 85% for the third. Notably, different trends existed between these labels as well, for these groups. The first had relative similarity between the three age groups (18–24, 25–29 and 30–34), while the second exhibited a downward trend with age and the third had an increase between the first two age groups, followed by a decline between the second and third labels. Most labels exhibited a drop in support at the 35–39 demographic; however, this was notably less pronounced for warning label 3, which has only a small difference between the 30–34 and 35–39 age groups and continues falling from the 35–39 vale at the 40–49 age levels. The supplemental information label shows a drop at 35–39; however, it continues dropping at 40–44, while—in many other cases, such as warning label 2—the support rebounds in the next age level up.
Table 4 provides an overview of the trends present, by demographic, for all of the label types and questions. Notably, there is not a consistent theme of declining or increasing by age or education level. In some cases, no clear trend is present. In others, conflicting trends are seen for a given metric at different age or education levels. Differences in trend type are also present across the different labels and questions.
Overall, the age-correlated responses show the most variability between responses. The education level data (which, of course, does have an implicit but imperfect correlation with age), shows a more moderate level of fluctuations. The gender-correlated data, on the other hand, shows that there is a limited amount of difference between genders, for most questions, with several label-question combinations having results between males and females which differ between them.
Uncertainty is also measured and, in many cases, decreases—at least partially across the range—with additional age or education. Males and females exhibit different levels of uncertainty across various label and question combinations; however, there is not a consistent pattern to which gender is more or less uncertain that perfectly correlates with specific labels or question types. In general, though, females indicate greater levels of uncertainty (having greater uncertainty reported in 25 out of 35 label question combinations). Females also indicate stronger support for labeling (indicated by greater yes responses for all questions, except annoyingness, and no for annoyingness), responding with support in 28 out 35 label-question combinations.
For all labeling categories, the annoyingness level is either the same for both males and females or higher for males than females. Conversely, the reverse is observed with regard to helpfulness, across all label styles.
There are also gender differences by label style. More males than females indicated that they would use informational label 2, while females indicated this more with respect to all of the other label styles. Females also indicated being more confident than males that others would use each labeling style (including informational label 2). Finally, except for informational label 1, more females than males indicated that each label style would be useful in judging the trustworthiness of a news article.
While some gender-difference is shown in specific label preference, the trend is broader than being related to any single label. This demonstrates that the higher level of support shown by females is likely unrelated to specific elements of the design of particular labels.
The lack of a clear pattern of responses or the presence of conflicting patterns is present for many of the demographic-analyzed individual label question responses. Of the 105 demographic-question-label combinations, just under a third (33) have no clear pattern or evidence of conflicting trends. Slightly more (36) of the combinations have no clear pattern or conflicting trends related to uncertainty. In approximately two-thirds (22) of these, there is a lack of a clear pattern (or conflicting trends) in both the demographic responses and the uncertainty.
Considering the four categories that are associated with label support (all except annoyingness), 24 demographic-question-label combinations have a decreasing association of support with increased age or education level. Four of the annoyingness demographic-question-label combinations show an increase with age/education, a similar indication of support-declining with increasing age or education. Alternately, only six combinations (outside of the annoyingness question, which has three support-increasing decrease response combinations) show a trend of increasing with greater age or education. Only one demographic-question-label combination (informational label 2′s self-use) has only minimal change amongst levels.
This data suggests that the age and education demographics of an online content labeling system user are very important, when choosing the type of label to use, to maximize the efficacy of the system. However, the limited number of overarching trends, which run the entire spectrum of the age or education range, mean that system designers and administrators will need to make nuanced decisions based on specific users’ demographics. The data presented herein, when multiple label types’ absolute values are compared for particular demographic values, can inform these decisions. Of course, these initial heuristic decisions should also be refined based on the behavior of a given user, learned over time, as any given user’s behaviors may not align perfectly with others in the particular demographic group being assessed.

8. Conclusions and Future Work

This paper has analyzed data from a national study of American’s attitudes towards online content labels, in terms of age, education level and gender. It has shown that females are more supportive of labels, generally, than males; however, they also indicate greater confusion regarding their efficacy. Additionally, while females show more support, the difference in support levels between the two genders is—for many labels and considerations—relatively limited. The impact of gender on label efficacy appears to be broader than an association with specific label styles and elements, as females evidence stronger support than males across label styles and survey questions, with a very limited number of exceptions.
In terms of education level and age, it has been shown that the perceived efficacy of labels and support for them generally decreases with age; however, a majority of respondents at all ages and education levels indicated support for the labels (when excluding responses indicating uncertainty). Label annoyingness, was shown to have a positive correlation, for four labels. This perhaps indicates that some respondents found the information to be unneeded for their age and experience. A few labels were shown to have a positive correlation between age/education and support.
As youth have been identified as a key demographic that may benefit from online content labeling, it is beneficial that this study shows that the labels may be particularly useful for this demographic. Furthermore, the study has identified certain labels that may be particularly beneficial for younger users, such as informational label 3. Other age and education levels, though, may be better served with other labels.
It is clear that age and education level have a significant impact on label efficacy; however, the impact is more nuanced than an overarching trend. In some cases, conflicting trends are shown at different points along the age or education level spectrum, which may indicate gaining more (or less) benefit, up until a point, and then having that benefit decline. There may also be generational and lifestyle factors that are responsible for some of the discontinuous changes within the data. There is also a possibility of unknown confounding variables being present. In any case, the data presented and analyzed herein can inform label-selection decision making, based on the demographics of the individual being targeted to use the label.
Building upon this work, needed future work includes conducting observations of respondent’s decision making when using a simulated system to ascertain whether individuals predicted behaviors and their actual ones align, with regard to the topic of this study. A variety of activities are also needed in the broader context of online content labeling. These include the development of new and enhanced technologies to detect intentionally deceptive content, new labels designs to assess the efficacy of and policy analysis to consider how content labeling can be most effectively implemented in real-world environments.

Author Contributions

Conceptualization, J.S. and M.S.; methodology, J.S. and M.S.; resources, J.S.; writing—original draft preparation, J.S. and M.S.; writing—review and editing, J.S. and M.S.; project administration, J.S.; funding acquisition, J.S. All authors have read and agreed to the published version of the manuscript.

Funding

Partial support for this work was provided by the NDSU Challey Institute for Global Innovation and Growth. Funding for the article publication charge was provided by the Hayek Fund for Scholars at the Institute for Human Studies at George Mason University.

Institutional Review Board Statement

The study was conducted according to the guidelines of the Declaration of Helsinki, and approved by the Institutional Review Board of North Dakota State University (protocol IRB0003884, approved 23 September 2021).

Informed Consent Statement

Informed consent was obtained from all subjects involved in the study.

Data Availability Statement

A data release, via a data journal publication, is planned once initial analysis of all data is complete.

Acknowledgments

Thanks are given to Jade Kanemitsu from Qualtrics International Inc. for the management of the data collection process. Thanks are also given to Ryan Suttle, Scott Hogan and Rachel Aumaugher who developed many of the questions that were used in this study during their earlier work (which was presented in [16]). Thanks are given to Bob Fedor who generated an earlier set of figures using this data (which were not used in this paper).

Conflicts of Interest

The authors declare no conflict of interest. The funders had no role in the design of the study; in the collection, analyses, or interpretation of data; in the writing of the manuscript, or in the decision to publish the results.

References

  1. Allcott, H.; Gentzkow, M. Social Media and Fake News in the 2016 Election. J. Econ. Perspect. 2017, 31, 211–236. [Google Scholar] [CrossRef] [Green Version]
  2. Bastos, M.T.; Mercea, D. The Brexit Botnet and User-Generated Hyperpartisan News. Soc. Sci. Comput. Rev. 2017, 37, 38–54. [Google Scholar] [CrossRef] [Green Version]
  3. Cunha, E.; Magno, G.; Caetano, J.; Teixeira, D.; Almeida, V. Fake News as We Feel It: Perception and Conceptualization of the Term “Fake News” in the Media. Lect. Notes Comput. Sci. Incl. Subser. Lect. Notes Artif. Intell. Lect. Notes Bioinform. 2018, 11185, 151–166. [Google Scholar] [CrossRef] [Green Version]
  4. Aisch, G.; Huang, J.; Kang, C. Dissecting the #PizzaGate Conspiracy Theories-The New York Times. New York Times. 2016, Volume 10, p. 2. Available online: https://www.nytimes.com/interactive/2016/12/10/business/media/pizzagate.html (accessed on 1 September 2022).
  5. McGaughey, E. Could Brexit be Void? King’s Law J. 2018, 29, 331–343. [Google Scholar] [CrossRef]
  6. Keyes, R. The Post-Truth Era: Dishonesty and Deception in Contemporary Life; St. Martin’s Press: New York, NY, USA, 2004. [Google Scholar]
  7. Lee, T. The global rise of “fake news” and the threat to democratic elections in the USA. Public Adm. Policy 2019, 22, 15–24. [Google Scholar] [CrossRef] [Green Version]
  8. Tong, C.; Gill, H.; Li, J.; Valenzuela, S.; Rojas, H. “Fake News Is Anything They Say!”—Conceptualization and Weaponization of Fake News among the American Public. Mass Commun. Soc. 2020, 23, 755–778. [Google Scholar] [CrossRef]
  9. More Americans Are Getting Their News From Social Media. Available online: https://www.forbes.com/sites/petersuciu/2019/10/11/more-americans-are-getting-their-news-from-social-media/#589ec4d43e17 (accessed on 1 February 2020).
  10. Tandoc, E.C.; Lim, W.; Ling, R. Defining “Fake News” A typology of scholarly definitions. Digit. J. 2018, 6, 137–153. [Google Scholar] [CrossRef]
  11. Silverman, C.; Singer-Vine, J. Most Americans Who See Fake News Believe It, New Survey Says. BuzzFeed News. 2016. Available online: https://www.buzzfeednews.com/article/craigsilverman/fake-news-survey (accessed on 1 September 2022).
  12. Fuhr, N.; Giachanou, A.; Grefenstette, G.; Gurevych, I.; Hanselowski, A.; Jarvelin, K.; Jones, R.; Liu, Y.; Mothe, J.; Nejdl, W.; et al. An Information Nutritional Label for Online Documents. ACM SIGIR Forum 2018, 51, 46–66. [Google Scholar] [CrossRef] [Green Version]
  13. Lespagnol, C.; Mothe, J.; Ullah, M.Z. Information Nutritional Label and Word Embedding to Estimate Information Check-Worthiness. In Proceedings of the 42nd International ACM SIGIR Conference on Research and Development in Information Retrieval, ACM, Paris, France, 21–25 July 2019; pp. 941–944. [Google Scholar]
  14. Vincentius, K.; Aggarwal, P.; Sahan, A.; Högden, B.; Madan, N.; Bangaru, A.; Schwenger, C.; Muradov, F.; Aker, A. Information Nutrition Labels: A Plugin for Online News Evaluation. In First Workshop on Fact Extraction and VERification; Association for Computational Linguistics: Brussels, Belgium, 2018; pp. 28–33. [Google Scholar]
  15. Spradling, M.; Straub, J.; Strong, J. Protection from ‘Fake News’: The Need for Descriptive Factual Labeling for Online Content. Future Internet 2021, 13, 142. [Google Scholar] [CrossRef]
  16. Suttle, R.; Hogan, S.; Aumaugher, R.; Spradling, M.; Merrigan, Z.; Straub, J. University Community Members’ Perceptions of Labels for Online Media. Future Internet 2021, 13, 281. [Google Scholar] [CrossRef]
  17. Straub, J.; Spradling, M. Americans’ Perspectives on Online Media Warning Labels. Behav. Sci. 2022, 12, 59. [Google Scholar] [CrossRef] [PubMed]
  18. Straub, J.; Spradling, M.; Fedor, B. Assessment of Consumer Perception of Online Content Label Efficacy by Income Level, Party Affiliation and Online Use Levels. Information 2022, 13, 252. [Google Scholar] [CrossRef]
  19. Straub, J.; Spradling, M.; Fedor, B. Assessment of Factors Impacting the Perception of Online Content Trustworthiness by Age, Education and Gender. Societies 2022, 12, 61. [Google Scholar] [CrossRef]
  20. Ott, B. Some Good News about the News: 5 Reasons Why ‘Fake’ News is Better than Fox ‘News’-Flow. Flow A Crit. Forum Telev. Media Cult. 2005, 2, 316–317. [Google Scholar]
  21. Kim, S. All the Times People Were Fooled by the Onion. Available online: https://abcnews.go.com/International/times-people-fooled-onion/story?id=31444478 (accessed on 4 February 2022).
  22. Saez-Trumper, D. Fake Tweet Buster: A Webtool to Identify Users Promoting Fake News on Twitter. In Proceedings of the 25th ACM Conference on Hypertext and Social Media, ACM, Santiago, Chile, 1–4 September 2014. [Google Scholar]
  23. Grinberg, N.; Joseph, K.; Friedland, L.; Swire-Thompson, B.; Lazer, D. Fake news on Twitter during the 2016 U.S. presidential election. Science 2019, 363, 374–378. [Google Scholar] [CrossRef] [PubMed]
  24. Lazer, D.M.J.; Baum, M.A.; Benkler, Y.; Berinsky, A.J.; Greenhill, K.M.; Menczer, F.; Metzger, M.J.; Nyhan, B.; Pennycook, G.; Rothschild, D.; et al. The science of fake news. Science 2018, 3, 1094–1096. [Google Scholar] [CrossRef]
  25. Bovet, A.; Makse, H.A. Influence of fake news in Twitter during the 2016 US presidential election. Nat. Commun. 2019, 10, 1657. [Google Scholar] [CrossRef] [Green Version]
  26. Shearer, E.; Matsa, K.E. News Use across Social Media Platforms 2018. Available online: https://www.pewresearch.org/journalism/2018/09/10/news-use-across-social-media-platforms-2018/ (accessed on 21 September 2021).
  27. Fatilua, J. Who trusts social media? Comput. Human Behav. 2018, 81, 303–315. [Google Scholar] [CrossRef]
  28. Balmas, M. When Fake News Becomes Real: Combined Exposure to Multiple News Sources and Political Attitudes of Inefficacy, Alienation, and Cynicism. Commun. Res. 2014, 41, 430–454. [Google Scholar] [CrossRef]
  29. Kang, C.; Goldman, A. Washington Pizzeria Attack, Fake News Brought Real Guns; New York Times: New York, NY, USA, 2016. [Google Scholar]
  30. Haithcox-Dennis, M. Reject, Correct, Redirect: Using Web Annotation to Combat Fake Health Information—A Commentary. Am. J. Health Educ. 2018, 49, 206–209. [Google Scholar] [CrossRef]
  31. U.S. Food and Drug Administration Changes to the Nutrition Facts Label. Available online: https://www.fda.gov/food/food-labeling-nutrition/changes-nutrition-facts-label (accessed on 14 December 2020).
  32. U.S. Department of Energy Estimating Appliance and Home Electronic Energy Use. Available online: https://www.energy.gov/energysaver/estimating-appliance-and-home-electronic-energy-use (accessed on 10 January 2022).
  33. Hammond, D. Health warning messages on tobacco products: A review. Tob. Control. 2011, 20, 327–337. [Google Scholar] [CrossRef] [PubMed]
  34. Lomeli, N.; Funke, D. Fact Check: Cigarette Warning Labels in US Haven’t Changed Since 1984; USA Today: Tysons Corner, VA, USA, 2022. [Google Scholar]
  35. Hiilamo, H.; Crosbie, E.; Glantz, S.A. The evolution of health warning labels on cigarette packs: The role of precedents, and tobacco industry strategies to block diffusion. Tob. Control 2014, 23, e2. [Google Scholar] [CrossRef] [PubMed]
  36. Hensley, S. Be Warned: FDA Unveils Graphic Cigarette Labels. NPR Website. 2011. Available online: https://www.npr.org/sections/health-shots/2011/06/21/137316580/be-warned-fda-unveils-graphic-cigarette-labels (accessed on 1 February 2020).
  37. CBS News Judge Blocks FDA Requirement for Graphic Tobacco Warning Labels. Available online: https://www.cbsnews.com/news/judge-blocks-fda-requirement-for-graphic-tobacco-warning-labels/ (accessed on 1 March 2022).
  38. Ingram, D.; Yukhananov, A.U.S. Court Strikes down Graphic Warnings on Cigarettes. Available online: https://www.reuters.com/article/us-usa-cigarettes-labels/u-s-court-strikes-down-graphic-warnings-on-cigarettes-idUSBRE87N0NL20120824 (accessed on 1 March 2022).
  39. U.S. Food & Drug Administration FDA Proposes New Required Health Warnings with Color Images for Cigarette Packages and Advertisements to Promote Greater Public Understanding of Negative Health Consequences of Smoking. Available online: https://www.fda.gov/news-events/press-announcements/fda-proposes-new-required-health-warnings-color-images-cigarette-packages-and-advertisements-promote (accessed on 1 March 2022).
  40. FDA Label Imaegs. Available online: https://web.archive.org/web/20120302084657/http://www.fda.gov/downloads/TobaccoProducts/Labeling/CigaretteWarningLabels/UCM259974.zip (accessed on 1 March 2022).
  41. Craver, R. Tobacco Manufacturers Gain Three More Months before Graphic-Warning Labels Required on Cigarette Packs|Local|Journalnow.com. Available online: https://journalnow.com/business/local/tobacco-manufacturers-gain-three-more-months-before-graphic-warning-labels-required-on-cigarette-packs/article_fd8915b6-8f43-11ec-aad6-2f790b9bdb5a.html (accessed on 1 March 2022).
  42. Hoek, J.; Wilson, N.; Allen, M.; Edwards, R.; Thomson, G.; Li, J. Lessons from New Zealand’s introduction of pictorial health warnings on tobacco packaging. Bull. World Health Organ 2010, 88, 861–866. [Google Scholar] [CrossRef] [PubMed]
  43. U.S. Food & Drug Administration Cigarette Labeling and Health Warning Requirements|FDA. Available online: https://www.fda.gov/tobacco-products/labeling-and-warning-statements-tobacco-products/cigarette-labeling-and-health-warning-requirements (accessed on 1 March 2022).
  44. Motion Picture Association Inc.; National Association of Theatre Owners Inc. CLASSIFICATION AND RATING RULES; Sherman Oaks, California, 2020. Available online: https://www.filmratings.com/Content/Downloads/rating_rules.pdf (accessed on 27 October 2022).
  45. WELCOME TO FilmRatings.com. Available online: https://www.filmratings.com/ (accessed on 1 February 2020).
  46. The V-Chip: Options to Restrict What Your Children Watch on TV|Federal Communications Commission. Available online: https://www.fcc.gov/consumers/guides/v-chip-putting-restrictions-what-your-children-watch (accessed on 1 February 2020).
  47. Harrington, R. Record Industry Unveils Lyrics Warning Label. Available online: https://www.washingtonpost.com/archive/lifestyle/1990/05/10/record-industry-unveils-lyrics-warning-label/6fc30515-ac8a-4e5d-9abd-a06a34cb54f2/ (accessed on 28 February 2022).
  48. U.S. Federal Bureau of Investigation FBI Anti-Piracy Warning Seal. Available online: https://www.fbi.gov/investigate/white-collar-crime/piracy-ip-theft/fbi-anti-piracy-warning-seal (accessed on 1 March 2022).
  49. Baptista, J.P.; Gradim, A. Understanding Fake News Consumption: A Review. Soc. Sci. 2020, 9, 185. [Google Scholar] [CrossRef]
  50. Braun, J.A.; Eklund, J.L. Fake News, Real Money: Ad Tech Platforms, Profit-Driven Hoaxes, and the Business of Journalism. Digit. J. 2019, 7, 1–21. [Google Scholar] [CrossRef]
  51. Rostron, A. Pragmatism, Paternalism, and the Constitutional Protection of Commercial Speech. Vt. Law Rev. 2012, 37, 527–589. [Google Scholar]
  52. United States Constitution, First Amendment.
  53. U.S. Embassy Beijing New PRC Internet Regulation. Available online: https://irp.fas.org/world/china/netreg.htm (accessed on 28 February 2022).
  54. Diagne, A.; Finlay, A.; Gaye, S.; Gichunge, W.; Pretorius, C.; Schiffrin, A.; Cunliffe-Jones, P.; Onumah, C. Misinformation Policy in Sub-Saharan Africa; University of Westminster Press: London, UK, 2021; p. 224. [Google Scholar] [CrossRef]
  55. Haque, M.M.; Yousuf, M.; Alam, A.S.; Saha, P.; Ahmed, S.I.; Hassan, N. Combating Misinformation in Bangladesh. Proc. ACM Hum. Comput. Interact 2020, 4, 130. [Google Scholar] [CrossRef]
  56. Carson, A.; Fallon, L. Fighting Fake News: A Study of Online Misinformation Regulation in the Asia Pacific; La Trobe University: Melbourne, Australia, 2021. [Google Scholar] [CrossRef]
  57. Yadav, K.; Erdoğdu, U.; Siwakoti, S.; Shapiro, J.N.; Wanless, A. Countries have more than 100 laws on the books to combat misinformation. How well do they work? Bull. At. Sci. 2021, 77, 124–128. [Google Scholar] [CrossRef]
  58. Kumar, P.J.S.; Devi, P.R.; Sai, N.R.; Kumar, S.S.; Benarji, T. Battling Fake News: A Survey on Mitigation Techniques and Identification. In Proceedings of the 2021 5th International Conference on Trends in Electronics and Informatics (ICOEI), Tirunelveli, India, 3–5 June 2021; pp. 829–835. [Google Scholar] [CrossRef]
  59. Sharma, K.; Qian, F.; Jiang, H.; Ruchansky, N.; Zhang, M.; Liu, Y. Combating fake news: A survey on identification and mitigation techniques. ACM Trans. Intell. Syst. Technol. 2019, 10, 1–42. [Google Scholar] [CrossRef]
  60. Zhou, X.; Zafarani, R. A Survey of Fake News: Fundamental Theories, Detection Methods, and Opportunities. ACM Comput. Surv. 2020, 53, 1–40. [Google Scholar] [CrossRef]
  61. Wang, W.Y. “Liar, Liar Pants on Fire”: A New Benchmark Dataset for Fake News Detection. arXiv 2017, arXiv:1705.00648,. [Google Scholar]
  62. De Oliveira, N.R.; Pisa, P.S.; Lopez, M.A.; de Medeiros, D.S.V.; Mattos, D.M.F. Identifying Fake News on Social Networks Based on Natural Language Processing: Trends and Challenges. Information 2021, 12, 38. [Google Scholar] [CrossRef]
  63. Deepak, S.; Chitturi, B. Deep neural approach to Fake-News identification. Procedia Comput. Sci. 2020, 167, 2236–2243. [Google Scholar] [CrossRef]
  64. Guo, Z.; Yu, K.; Jolfaei, A.; Li, G.; Ding, F.; Beheshti, A. Mixed Graph Neural Network-Based Fake News Detection for Sustainable Vehicular Social Networks. IEEE Trans. Intell. Transp. Syst. 2022, 1–13. [Google Scholar] [CrossRef]
  65. Yuan, H.; Zheng, J.; Ye, Q.; Qian, Y.; Zhang, Y. Improving fake news detection with domain-adversarial and graph-attention neural network. Decis. Support Syst. 2021, 151, 113633. [Google Scholar] [CrossRef]
  66. Koloski, B.; Stepišnik-Perdih, T.; Pollak, S.; Škrlj, B. Identification of COVID-19 Related Fake News via Neural Stacking. Commun. Comput. Inf. Sci. 2021, 1402, 177–188. [Google Scholar] [CrossRef]
  67. Hebroune, O.; Benhiba, L. User-Enriched Embedding for Fake News Detection on Social Media; Springer: Cham, Switzerland, 2022; pp. 581–599. [Google Scholar] [CrossRef]
  68. Batailler, C.; Brannon, S.M.; Teas, P.E.; Gawronski, B. A Signal Detection Approach to Understanding the Identification of Fake News. Perspect. Psychol. Sci. 2022, 17, 78–98. [Google Scholar] [CrossRef]
  69. Anoop, K.; Deepak, P.; Lajish, L.V. Emotion cognizance improves health fake news identification. In Proceedings of the 24th International Database Engineering & Applications Symposium (IDEAS 2020), Incheon, Korea, 12–18 August 2020. [Google Scholar]
  70. Shao, Y.; Sun, J.; Zhang, T.; Jiang, Y.; Ma, J.; Li, J. Fake News Detection Based on Multi-Modal Classifier Ensemble. In Proceedings of the 1st International Workshop on Multimedia AI against Disinformation, Newark, NJ, USA, 27–30 June 2022. [Google Scholar] [CrossRef]
  71. Rapti, M.; Tsakalidis, G.; Petridou, S.; Vergidis, K. Fake News Incidents through the Lens of the DCAM Disinformation Blueprint. Information 2022, 13, 306. [Google Scholar] [CrossRef]
  72. Chen, W.; Wang, Y.; Yang, S. Efficient influence maximization in social networks. In Proceedings of the 2010 IEEE International Conference on Data Mining, Miami, FL, USA, 6–9 December 2009. [Google Scholar] [CrossRef]
  73. Chen, W.; Yuan, Y.; Zhang, L. Scalable influence maximization in social networks under the linear threshold model. In Proceedings of the 2010 IEEE International Conference on Data Mining, Sydney, Australia, 13–17 December 2010. [Google Scholar] [CrossRef]
  74. Budak, C.; Agrawal, D.; Abbadi, A. El Limiting the spread of misinformation in social networks. In Proceedings of the 20th International Conference on World Wide Web, Hyderabad, India, 28 March–1 April 2011; pp. 665–674. [Google Scholar] [CrossRef]
  75. Jain, S.; Sharma, V.; Kaushal, R. Towards automated real-time detection of misinformation on Twitter. In Proceedings of the 2016 International Conference on Advances in Computing, Communications and Informatics (ICACCI), Jaipur, India, 21–24 September 2016; pp. 2015–2020. [Google Scholar] [CrossRef]
  76. Fairbanks, J.; Fitch, N.; Knauf, N.; Briscoe, E. Credibility Assessment in the News: Do we need to read? In Proceedings of the MIS2 Workshop held in conjuction with 11th Int’l Conference on Web Search and Data Mining, ACM, Del Ray, CA, USA, 5–9 February 2018. [Google Scholar]
  77. Bakir, V.; McStay, A. Fake News and The Economy of Emotions. Digit. J. 2018, 6, 154–175. [Google Scholar] [CrossRef]
  78. Pröllochs, N. Community-Based Fact-Checking on Twitter’s Birdwatch Platform. arXiv 2021, arXiv:2104.07175. [Google Scholar]
Figure 1. (a) Nutrition Facts label format (modified from [31]), left, and (b) energy guide label format [32], right.
Information 13 00516 g001
Figure 2. Example of the FDA’s proposed cigarette labels in 2011 [40].
Information 13 00516 g002
Figure 3. Examples of the cigarette labels proposed in 2019 [43].
Information 13 00516 g003
Figure 4. Informational Label 1 [16].
Information 13 00516 g004
Figure 5. Label helpfulness, by age group: (a) with uncertain respondents (left) and (b) without uncertain respondents (right).
Information 13 00516 g005
Figure 6. Label helpfulness, by education level: (a) with uncertain respondents (left) and (b) without uncertain respondents (right).
Information 13 00516 g006
Figure 7. Label helpfulness, by gender: (a) with uncertain respondents (left) and (b) without uncertain respondents (right).
Information 13 00516 g007
Figure 8. Label annoyingness, by age group: (a) with uncertain respondents (left) and (b) without uncertain respondents (right).
Information 13 00516 g008
Figure 9. Label annoyingness, by education level: (a) with uncertain respondents (left) and (b) without uncertain respondents (right).
Information 13 00516 g009
Figure 10. Label annoyingness, by gender: (a) with uncertain respondents (left) and (b) without uncertain respondents (right).
Information 13 00516 g010
Figure 11. Label use, by age group: (a) with uncertain respondents (left) and (b) without uncertain respondents (right).
Information 13 00516 g011
Figure 12. Label use, by education level: (a) with uncertain respondents (left) and (b) without uncertain respondents (right).
Information 13 00516 g012
Figure 13. Label use, by gender: (a) with uncertain respondents (left) and (b) without uncertain respondents (right).
Information 13 00516 g013
Figure 14. Label others’ use, by age group: (a) with uncertain respondents (left) and (b) without uncertain respondents (right).
Information 13 00516 g014
Figure 15. Label others’ use, by education level: (a) with uncertain respondents (left) and (b) without uncertain respondents (right).
Information 13 00516 g015
Figure 16. Label others’ use, by gender: (a) with uncertain respondents (left) and (b) without uncertain respondents (right).
Information 13 00516 g016
Figure 17. Label trustworthiness judging use, by age group: (a) with uncertain respondents (left) and (b) without uncertain respondents (right).
Information 13 00516 g017
Figure 18. Label trustworthiness judging use, by education level: (a) with uncertain respondents (left) and (b) without uncertain respondents (right).
Information 13 00516 g018
Figure 19. Label trustworthiness judging use, by gender: (a) with uncertain respondents (left) and (b) without uncertain respondents (right).
Information 13 00516 g019
Figure 20. Informational label 2 [16].
Information 13 00516 g020
Figure 21. Label helpfulness, by age group: (a) with uncertain respondents (left) and (b) without uncertain respondents (right).
Information 13 00516 g021
Figure 22. Label helpfulness, by education level: (a) with uncertain respondents (left) and (b) without uncertain respondents (right).
Information 13 00516 g022
Figure 23. Label helpfulness, by gender: (a) with uncertain respondents (left) and (b) without uncertain respondents (right).
Information 13 00516 g023
Figure 24. Label annoyingness, by age group: (a) with uncertain respondents (left) and (b) without uncertain respondents (right).
Information 13 00516 g024
Figure 25. Label annoyingness, by education level: (a) with uncertain respondents (left) and (b) without uncertain respondents (right).
Information 13 00516 g025
Figure 26. Label annoyingness, by gender: (a) with uncertain respondents (left) and (b) without uncertain respondents (right).
Information 13 00516 g026
Figure 27. Label use, by age group: (a) with uncertain respondents (left) and (b) without uncertain respondents (right).
Information 13 00516 g027
Figure 28. Label use, by education level: (a) with uncertain respondents (left) and (b) without uncertain respondents (right).
Information 13 00516 g028
Figure 29. Label use, by gender: (a) with uncertain respondents (left) and (b) without uncertain respondents (right).
Information 13 00516 g029
Figure 30. Label others’ use, by age group: (a) with uncertain respondents (left) and (b) without uncertain respondents (right).
Information 13 00516 g030
Figure 31. Label others’ use, by education level: (a) with uncertain respondents (left) and (b) without uncertain respondents (right).
Information 13 00516 g031
Figure 32. Label others’ use, by gender: (a) with uncertain respondents (left) and (b) without uncertain respondents (right).
Information 13 00516 g032
Figure 33. Label trustworthiness judging use, by age group: (a) with uncertain respondents (left) and (b) without uncertain respondents (right).
Information 13 00516 g033
Figure 34. Label trustworthiness judging use, by education level: (a) with uncertain respondents (left) and (b) without uncertain respondents (right).
Information 13 00516 g034
Figure 35. Label trustworthiness judging use, by gender: (a) with uncertain respondents (left) and (b) without uncertain respondents (right).
Information 13 00516 g035
Figure 36. Informational label 3 [16].
Information 13 00516 g036
Figure 37. Label helpfulness, by age group: (a) with uncertain respondents (left) and (b) without uncertain respondents (right).
Information 13 00516 g037
Figure 38. Label helpfulness, by education level: (a) with uncertain respondents (left) and (b) without uncertain respondents (right).
Information 13 00516 g038
Figure 39. Label helpfulness, by gender: (a) with uncertain respondents (left) and (b) without uncertain respondents (right).
Information 13 00516 g039
Figure 40. Label annoyingness, by age group: (a) with uncertain respondents (left) and (b) without uncertain respondents (right).
Information 13 00516 g040
Figure 41. Label annoyingness, by education level: (a) with uncertain respondents (left) and (b) without uncertain respondents (right).
Information 13 00516 g041
Figure 42. Label annoyingness, by gender: (a) with uncertain respondents (left) and (b) without uncertain respondents (right).
Information 13 00516 g042
Figure 43. Label use, by age group: (a) with uncertain respondents (left) and (b) without uncertain respondents (right).
Information 13 00516 g043
Figure 44. Label use, by education level: (a) with uncertain respondents (left) and (b) without uncertain respondents (right).
Information 13 00516 g044
Figure 45. Label use, by gender: (a) with uncertain respondents (left) and (b) without uncertain respondents (right).
Information 13 00516 g045
Figure 46. Label others’ use, by age group: (a) with uncertain respondents (left) and (b) without uncertain respondents (right).
Information 13 00516 g046
Figure 47. Label others’ use, by education level: (a) with uncertain respondents (left) and (b) without uncertain respondents (right).
Information 13 00516 g047
Figure 48. Label others’ use, by gender: (a) with uncertain respondents (left) and (b) without uncertain respondents (right).
Information 13 00516 g048
Figure 49. Label trustworthiness judging use, by age group: (a) with uncertain respondents (left) and (b) without uncertain respondents (right).
Information 13 00516 g049
Figure 50. Label trustworthiness judging use, by education level: (a) with uncertain respondents (left) and (b) without uncertain respondents (right).
Information 13 00516 g050
Figure 51. Label trustworthiness judging use, by gender: (a) with uncertain respondents (left) and (b) without uncertain respondents (right).
Information 13 00516 g051
Figure 52. Warning label 1 [16].
Information 13 00516 g052
Figure 53. Label helpfulness, by age group: (a) with uncertain respondents (left) and (b) without uncertain respondents (right).
Information 13 00516 g053
Figure 54. Label helpfulness, by education level: (a) with uncertain respondents (left) and (b) without uncertain respondents (right).
Information 13 00516 g054
Figure 55. Label helpfulness, by gender: (a) with uncertain respondents (left) and (b) without uncertain respondents (right).
Information 13 00516 g055
Figure 56. Label annoyingness, by age group: (a) with uncertain respondents (left) and (b) without uncertain respondents (right).
Information 13 00516 g056
Figure 57. Label annoyingness, by education level: (a) with uncertain respondents (left) and (b) without uncertain respondents (right).
Information 13 00516 g057
Figure 58. Label annoyingness, by gender: (a) with uncertain respondents (left) and (b) without uncertain respondents (right).
Information 13 00516 g058
Figure 59. Label use, by age group: (a) with uncertain respondents (left) and (b) without uncertain respondents (right).
Information 13 00516 g059
Figure 60. Label use, by education level: (a) with uncertain respondents (left) and (b) without uncertain respondents (right).
Information 13 00516 g060
Figure 61. Label use, by gender: (a) with uncertain respondents (left) and (b) without uncertain respondents (right).
Information 13 00516 g061
Figure 62. Label others’ use, by age group: (a) with uncertain respondents (left) and (b) without uncertain respondents (right).
Information 13 00516 g062
Figure 63. Label others’ use, by education level: (a) with uncertain respondents (left) and (b) without uncertain respondents (right).
Information 13 00516 g063
Figure 64. Label others’ use, by gender: (a) with uncertain respondents (left) and (b) without uncertain respondents (right).
Information 13 00516 g064
Figure 65. Label trustworthiness judging use, by age group: (a) with uncertain respondents (left) and (b) without uncertain respondents (right).
Information 13 00516 g065
Figure 66. Label trustworthiness judging use, by education level: (a) with uncertain respondents (left) and (b) without uncertain respondents (right).
Information 13 00516 g066
Figure 67. Label trustworthiness judging use, by gender: (a) with uncertain respondents (left) and (b) without uncertain respondents (right).
Information 13 00516 g067
Figure 68. Warning label 2 [16].
Information 13 00516 g068
Figure 69. Label helpfulness, by age group: (a) with uncertain respondents (left) and (b) without uncertain respondents (right).
Information 13 00516 g069
Figure 70. Label helpfulness, by education level: (a) with uncertain respondents (left) and (b) without uncertain respondents (right).
Information 13 00516 g070
Figure 71. Label helpfulness, by gender: (a) with uncertain respondents (left) and (b) without uncertain respondents (right).
Information 13 00516 g071
Figure 72. Label annoyingness, by age group: (a) with uncertain respondents (left) and (b) without uncertain respondents (right).
Information 13 00516 g072
Figure 73. Label annoyingness, by education level: (a) with uncertain respondents (left) and (b) without uncertain respondents (right).
Information 13 00516 g073
Figure 74. Label annoyingness, by gender: (a) with uncertain respondents (left) and (b) without uncertain respondents (right).
Information 13 00516 g074
Figure 75. Label use, by age group: (a) with uncertain respondents (left) and (b) without uncertain respondents (right).
Information 13 00516 g075
Figure 76. Label use, by education level: (a) with uncertain respondents (left) and (b) without uncertain respondents (right).
Information 13 00516 g076
Figure 77. Label use, by gender: (a) with uncertain respondents (left) and (b) without uncertain respondents (right).
Information 13 00516 g077
Figure 78. Label others’ use, by age group: (a) with uncertain respondents (left) and (b) without uncertain respondents (right).
Information 13 00516 g078
Figure 79. Label others’ use, by education level: (a) with uncertain respondents (left) and (b) without uncertain respondents (right).
Information 13 00516 g079
Figure 80. Label others’ use, by gender: (a) with uncertain respondents (left) and (b) without uncertain respondents (right).
Information 13 00516 g080
Figure 81. Label trustworthiness judging use, by age group: (a) with uncertain respondents (left) and (b) without uncertain respondents (right).
Information 13 00516 g081
Figure 82. Label trustworthiness judging use, by education level: (a) with uncertain respondents (left) and (b) without uncertain respondents (right).
Information 13 00516 g082
Figure 83. Label trustworthiness judging use, by gender: (a) with uncertain respondents (left) and (b) without uncertain respondents (right).
Information 13 00516 g083
Figure 84. Warning label 3 [16].
Information 13 00516 g084
Figure 85. Label helpfulness, by age group: (a) with uncertain respondents (left) and (b) without uncertain respondents (right).
Information 13 00516 g085
Figure 86. Label helpfulness, by education level: (a) with uncertain respondents (left) and (b) without uncertain respondents (right).
Information 13 00516 g086
Figure 87. Label helpfulness, by gender: (a) with uncertain respondents (left) and (b) without uncertain respondents (right).
Information 13 00516 g087
Figure 88. Label annoyingness, by age group: (a) with uncertain respondents (left) and (b) without uncertain respondents (right).
Information 13 00516 g088
Figure 89. Label annoyingness, by education level: (a) with uncertain respondents (left) and (b) without uncertain respondents (right).
Information 13 00516 g089
Figure 90. Label annoyingness, by gender: (a) with uncertain respondents (left) and (b) without uncertain respondents (right).
Information 13 00516 g090
Figure 91. Label use, by age group: (a) with uncertain respondents (left) and (b) without uncertain respondents (right).
Information 13 00516 g091
Figure 92. Label use, by education level: (a) with uncertain respondents (left) and (b) without uncertain respondents (right).
Information 13 00516 g092
Figure 93. Label use, by gender: (a) with uncertain respondents (left) and (b) without uncertain respondents (right).
Information 13 00516 g093
Figure 94. Label others’ use, by age group: (a) with uncertain respondents (left) and (b) without uncertain respondents (right).
Information 13 00516 g094
Figure 95. Label others’ use, by education level: (a) with uncertain respondents (left) and (b) without uncertain respondents (right).
Information 13 00516 g095
Figure 96. Label others’ use, by gender: (a) with uncertain respondents (left) and (b) without uncertain respondents (right).
Information 13 00516 g096
Figure 97. Label trustworthiness judging use, by age group: (a) with uncertain respondents (left) and (b) without uncertain respondents (right).
Information 13 00516 g097
Figure 98. Label trustworthiness judging use, by education level: (a) with uncertain respondents (left) and (b) without uncertain respondents (right).
Information 13 00516 g098
Figure 99. Label trustworthiness judging use, by gender: (a) with uncertain respondents (left) and (b) without uncertain respondents (right).
Information 13 00516 g099
Figure 100. Supplemental information label [16].
Information 13 00516 g100
Figure 101. Label helpfulness, by age group: (a) with uncertain respondents (left) and (b) without uncertain respondents (right).
Information 13 00516 g101
Figure 102. Label helpfulness, by education level: (a) with uncertain respondents (left) and (b) without uncertain respondents (right).
Information 13 00516 g102
Figure 103. Label helpfulness, by gender: (a) with uncertain respondents (left) and (b) without uncertain respondents (right).
Information 13 00516 g103
Figure 104. Label annoyingness, by age group: (a) with uncertain respondents (left) and (b) without uncertain respondents (right).
Information 13 00516 g104
Figure 105. Label annoyingness, by education level: (a) with uncertain respondents (left) and (b) without uncertain respondents (right).
Information 13 00516 g105
Figure 106. Label annoyingness, by gender: (a) with uncertain respondents (left) and (b) without uncertain respondents (right).
Information 13 00516 g106
Figure 107. Label use, by age group: (a) with uncertain respondents (left) and (b) without uncertain respondents (right).
Information 13 00516 g107
Figure 108. Label use, by education level: (a) with uncertain respondents (left) and (b) without uncertain respondents (right).
Information 13 00516 g108
Figure 109. Label use, by gender: (a) with uncertain respondents (left) and (b) without uncertain respondents (right).
Information 13 00516 g109
Figure 110. Label others’ use, by age group: (a) with uncertain respondents (left) and (b) without uncertain respondents (right).
Information 13 00516 g110
Figure 111. Label others’ use, by education level: (a) with uncertain respondents (left) and (b) without uncertain respondents (right).
Information 13 00516 g111
Figure 112. Label others’ use, by gender: (a) with uncertain respondents (left) and (b) without uncertain respondents (right).
Information 13 00516 g112
Figure 113. Label trustworthiness judging use, by age group: (a) with uncertain respondents (left) and (b) without uncertain respondents (right).
Information 13 00516 g113
Figure 114. Label trustworthiness judging use, by education level: (a) with uncertain respondents (left) and (b) without uncertain respondents (right).
Information 13 00516 g114
Figure 115. Label trustworthiness judging use, by gender: (a) with uncertain respondents (left) and (b) without uncertain respondents (right).
Information 13 00516 g115
Table 1. Survey instrument questions for each label instrument. Respondents were presented with each proposed label instrument and were asked the following questions.
Question CategoryText from Survey Instrument
HelpfulnessWould you find this label helpful?
AnnoyingnessWould you find this label annoying?
UsefulnessWould you review this label when viewing news articles on social media?
Others’ usefulnessWould others review this label when viewing news articles on social media?
Trustworthiness judgingWould it be useful for judging the trustworthiness of news articles?
Table 2. Respondents’ age distribution [17].
18–2425–2930–3435–3940–4445–4950–5455–5960–6465 and Older
10.57%10.93%11.29%10.04%8.96%6.63%6.09%12.54%12.19%10.75%
59616356503734706860
Table 3. Respondents’ education distribution [17].
Some High School (No Degree)High School DegreeSome College (No Degree)Associate’s DegreeBachelor’s DegreeMaster’s DegreeDoctoral Degree
4.68%25.72%23.20%11.51%22.12%10.25%2.52%
26143129641235714
Table 4. Overview of trends in responses and respondents’ demographics.
HelpfulnessAnnoyingnessUseOthers’ UseTrustworthiness
Informational 1AgeDecreasesNo clear
pattern
No clear
pattern
No clear patternPartial decrease
(UNCT)No clear patternNo clear
pattern
No clear
pattern
No clear patternNo clear pattern
EducationPartial
decrease
No clear
pattern
Two partial
increases
No clear patternPartial decrease
(UNCT)No clear
pattern
Partial slight decreasePartial
decrease
DecreaseNo clear pattern
GenderFemale slightly higherMale slightly higherFemale slightly higherSameMale slightly higher
(UNCT)SameFemale slightly higherFemale slightly higherSameFemale slightly higher
Informational 2AgeTwo partial decreasesNo clear
pattern
Partial
increase
No clear patternNo clear pattern
(UNCT)Partial
increase
No clear
pattern
No clear
pattern
No clear patternNo clear pattern
EducationDecreasesPartial
increase
Minimal changeNo clear patternNo clear pattern
(UNCT)No clear
pattern
Partial
decrease
Partial
decrease
No clear patternPartial decrease
GenderFemale higherMale higherMale slightly higherSameFemale slightly higher
(UNCT)Female higherMale higherFemale higherMale slightly higherFemale higher
Informational 3AgeNo clear
pattern
Partial
increase
Two partial increasesNo clear patternNo clear pattern
(UNCT)No clear
pattern
Partial
decrease
No clear
pattern
Two partial
decreases
No clear pattern
EducationPartial
decrease
Partial
increase
No clear
pattern
Partial decreaseDecrease
(UNCT)Partial
decrease
Partial
decrease
No clear
pattern
Partial decreasePartial decrease
GenderFemale higherMale higherFemale slightly higherFemale higherFemale higher
(UNCT)Female slightly higherFemale higherFemale slightly higherSameFemale higher
Warning 1AgePartial
increase
Conflicting trendsConflicting trendsNo clear patternPartial increase
(UNCT)No clear
pattern
No clear patternNo clear
pattern
Two partial
decreases
Conflicting Trends
EducationDecreasesTwo partial decreasesPartial slight increaseDecreaseDecrease
(UNCT)Partial
decrease
No clear
pattern
Partial
decrease
Partial decreasePartial decrease
GenderFemale higherSameFemale higherFemale slightly higherFemale higher
(UNCT)Female higherFemale slightly higherFemale higherFemale higherFemale higher
Warning 2AgeNo clear
pattern
No clear
pattern
No clear
pattern
No clear patternNo clear pattern
(UNCT)No clear
pattern
No clear
pattern
Conflicting trendsNo clear patternConflicting Trends
EducationDecreasesPartial
decrease
No clear
pattern
No clear patternConflicting Trends
(UNCT)Partial
decrease
Partial
decrease
Partial
decrease
No clear patternPartial decrease
GenderFemale higherMale higherFemale higherFemale higherFemale higher
(UNCT)Female higherMale higherFemale higherFemale slightly higherFemale slightly higher
Warning 3AgeTwo partial decreasesConflicting trendsPartial
decrease
Partial decreaseNo clear pattern
(UNCT)No clear
pattern
No clear
pattern
Conflicting trendsNo clear patternNo clear pattern
EducationDecreasesConflicting trendsPartial
decrease
No clear patternTwo partial
decreases
(UNCT)Partial
decrease
Partial
decrease
Two partial decreasesPartial decreasePartial decrease
GenderFemale higherSameFemale higherFemale higherFemale higher
(UNCT)Male slightly higherFemale slightly higherFemale slightly higherMale higherFemale slightly higher
Supplemental InformationAgeTwo partial decreasesTwo partial increasesConflicting trendsNo clear patternConflicting Trends
(UNCT)Conflicting trendsConflicting trendsNo clear
pattern
Two partial
decreases
No clear pattern
EducationPartial
decrease
DecreaseNo clear
pattern
Partial decreasePartial decrease
(UNCT)Partial
decrease
Partial
decrease
Partial
decrease
No clear patternPartial decrease
GenderFemale higherMale higherFemale higherFemale higherFemale higher
(UNCT)Female slightly higherFemale slightly higherFemale higherMale higherMale higher
Publisher’s Note: MDPI stays neutral with regard to jurisdictional claims in published maps and institutional affiliations.

