

Predictive Modeling for the Diagnosis of Gestational Diabetes Mellitus Using Epidemiological Data in the United Arab Emirates
 , , and
Abstract
:1. Introduction
2. Materials and Methods
| Algorithm 1 GDM diagnosis using ML model. |
| Input: is the total dataset of Patients P. |
| Output: diagnosis of GDM for a Patient such that is normal and is a GDM. |
|
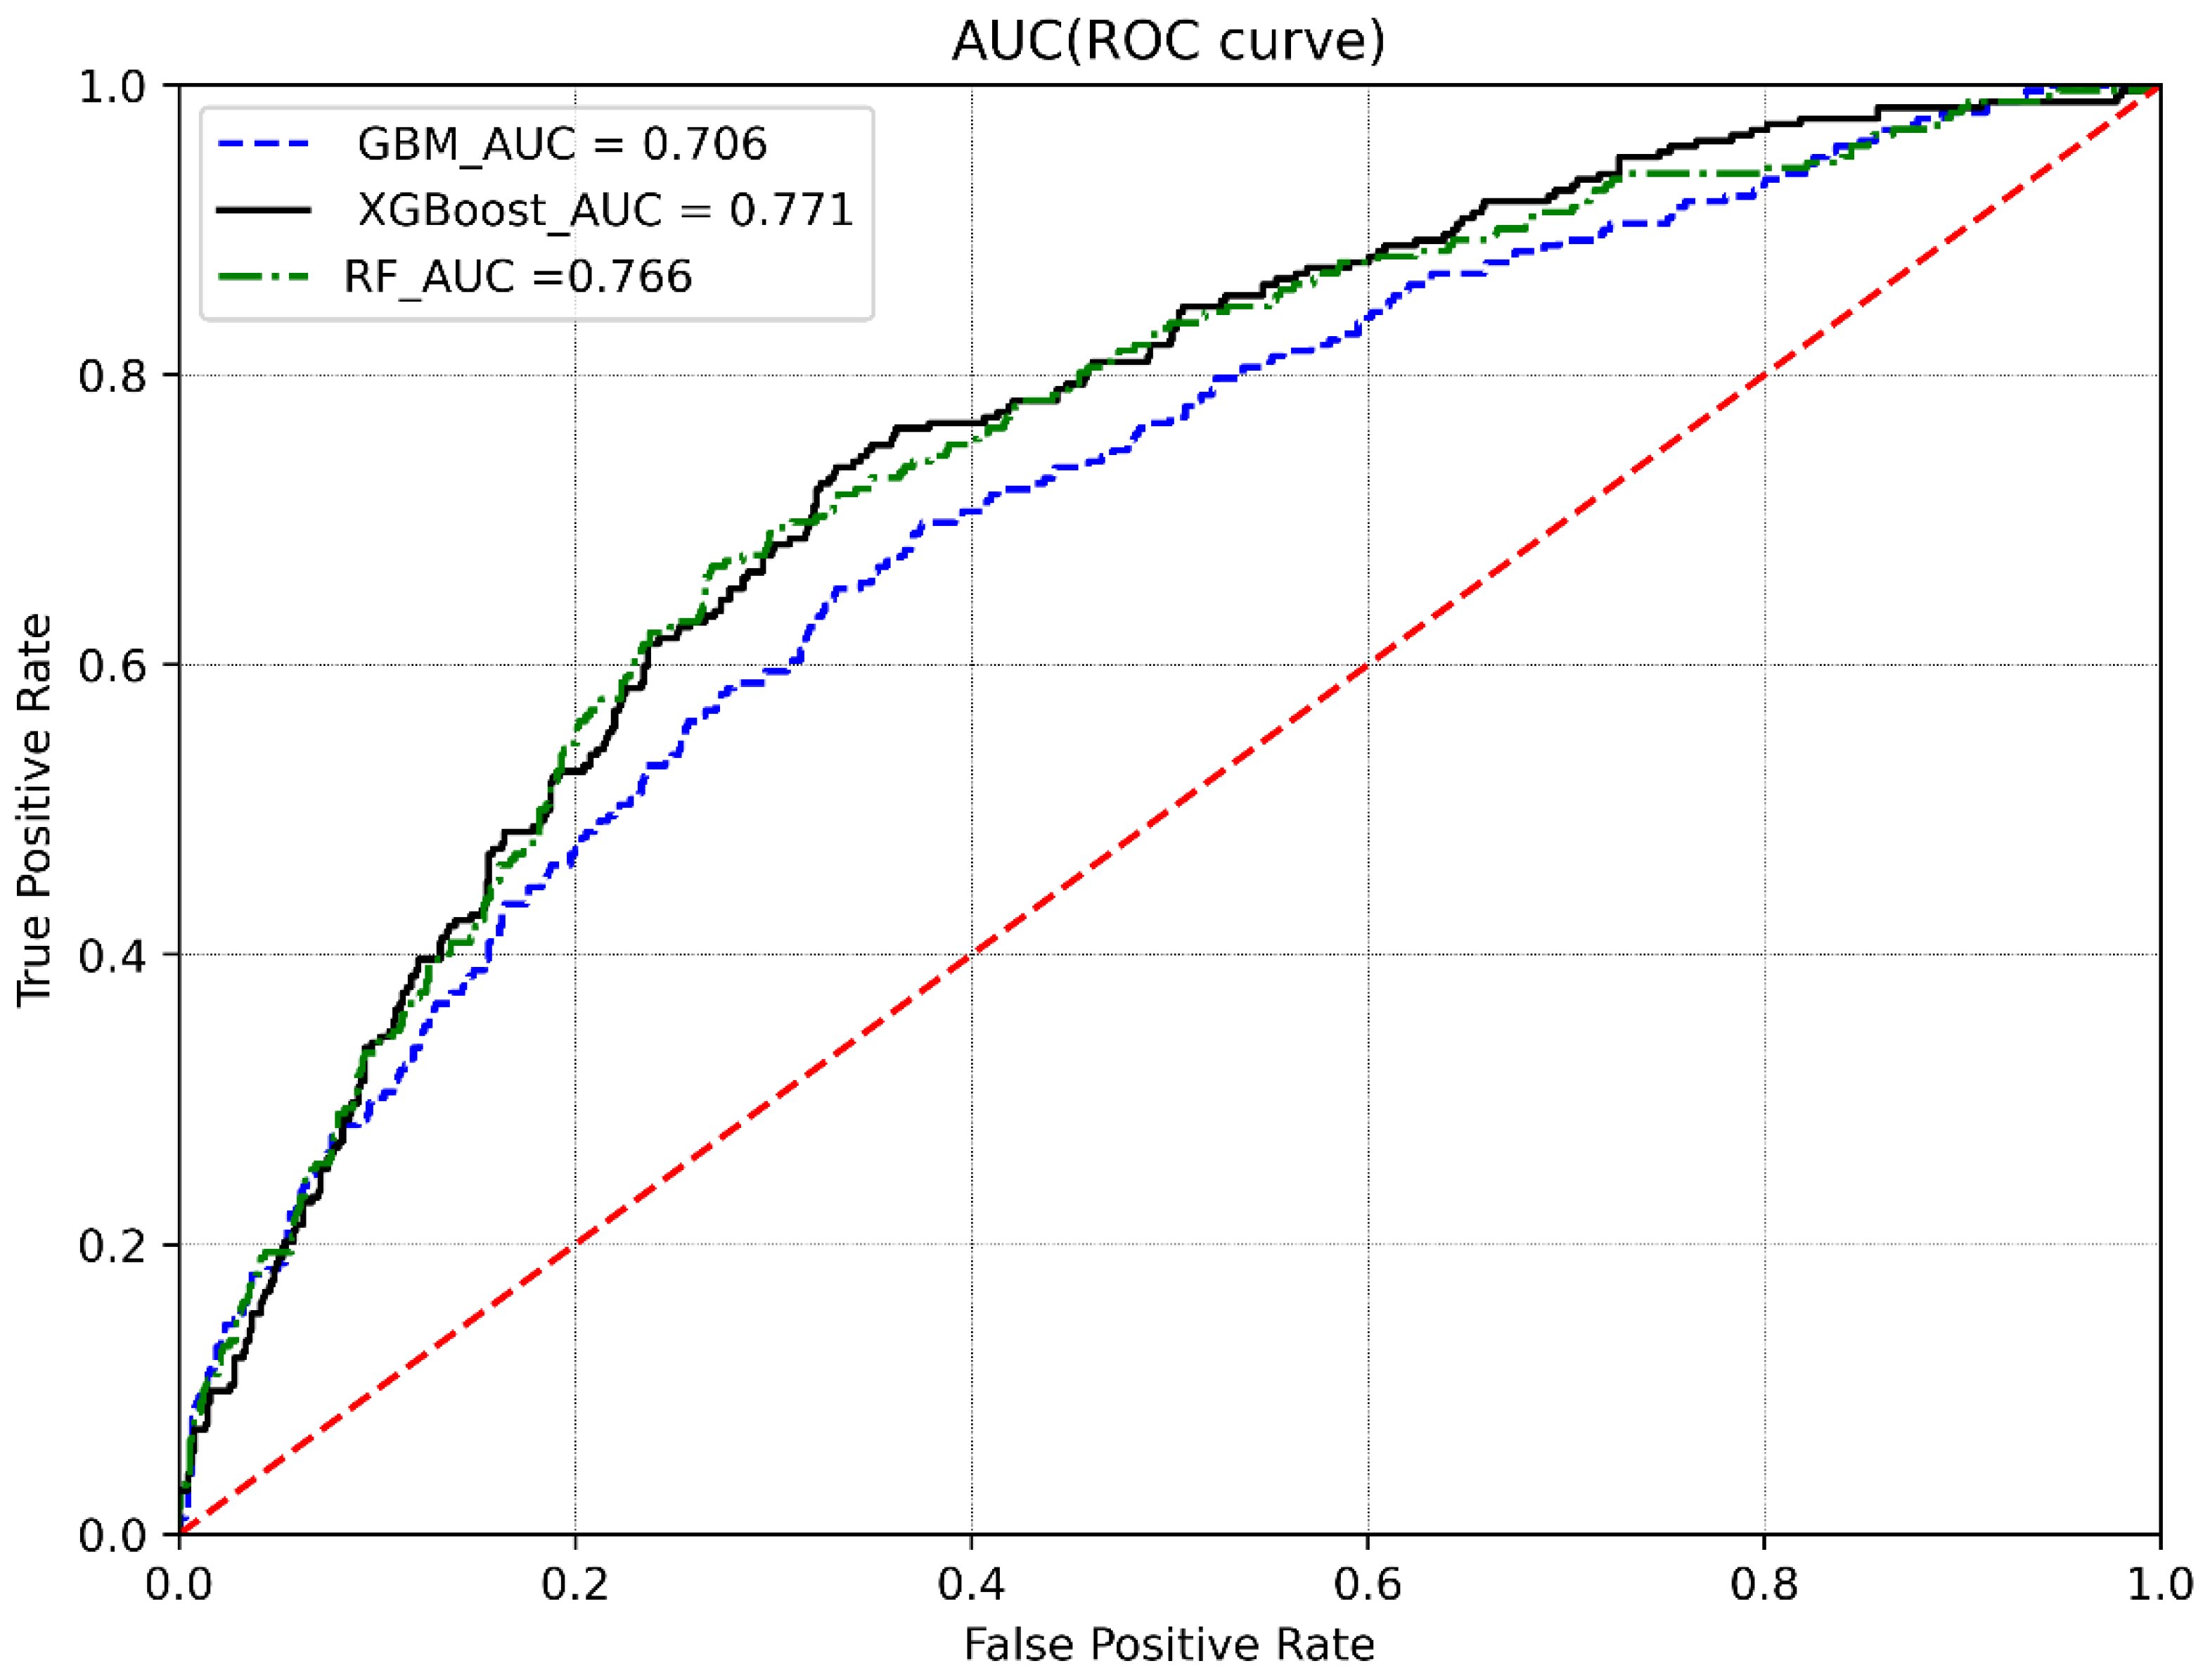
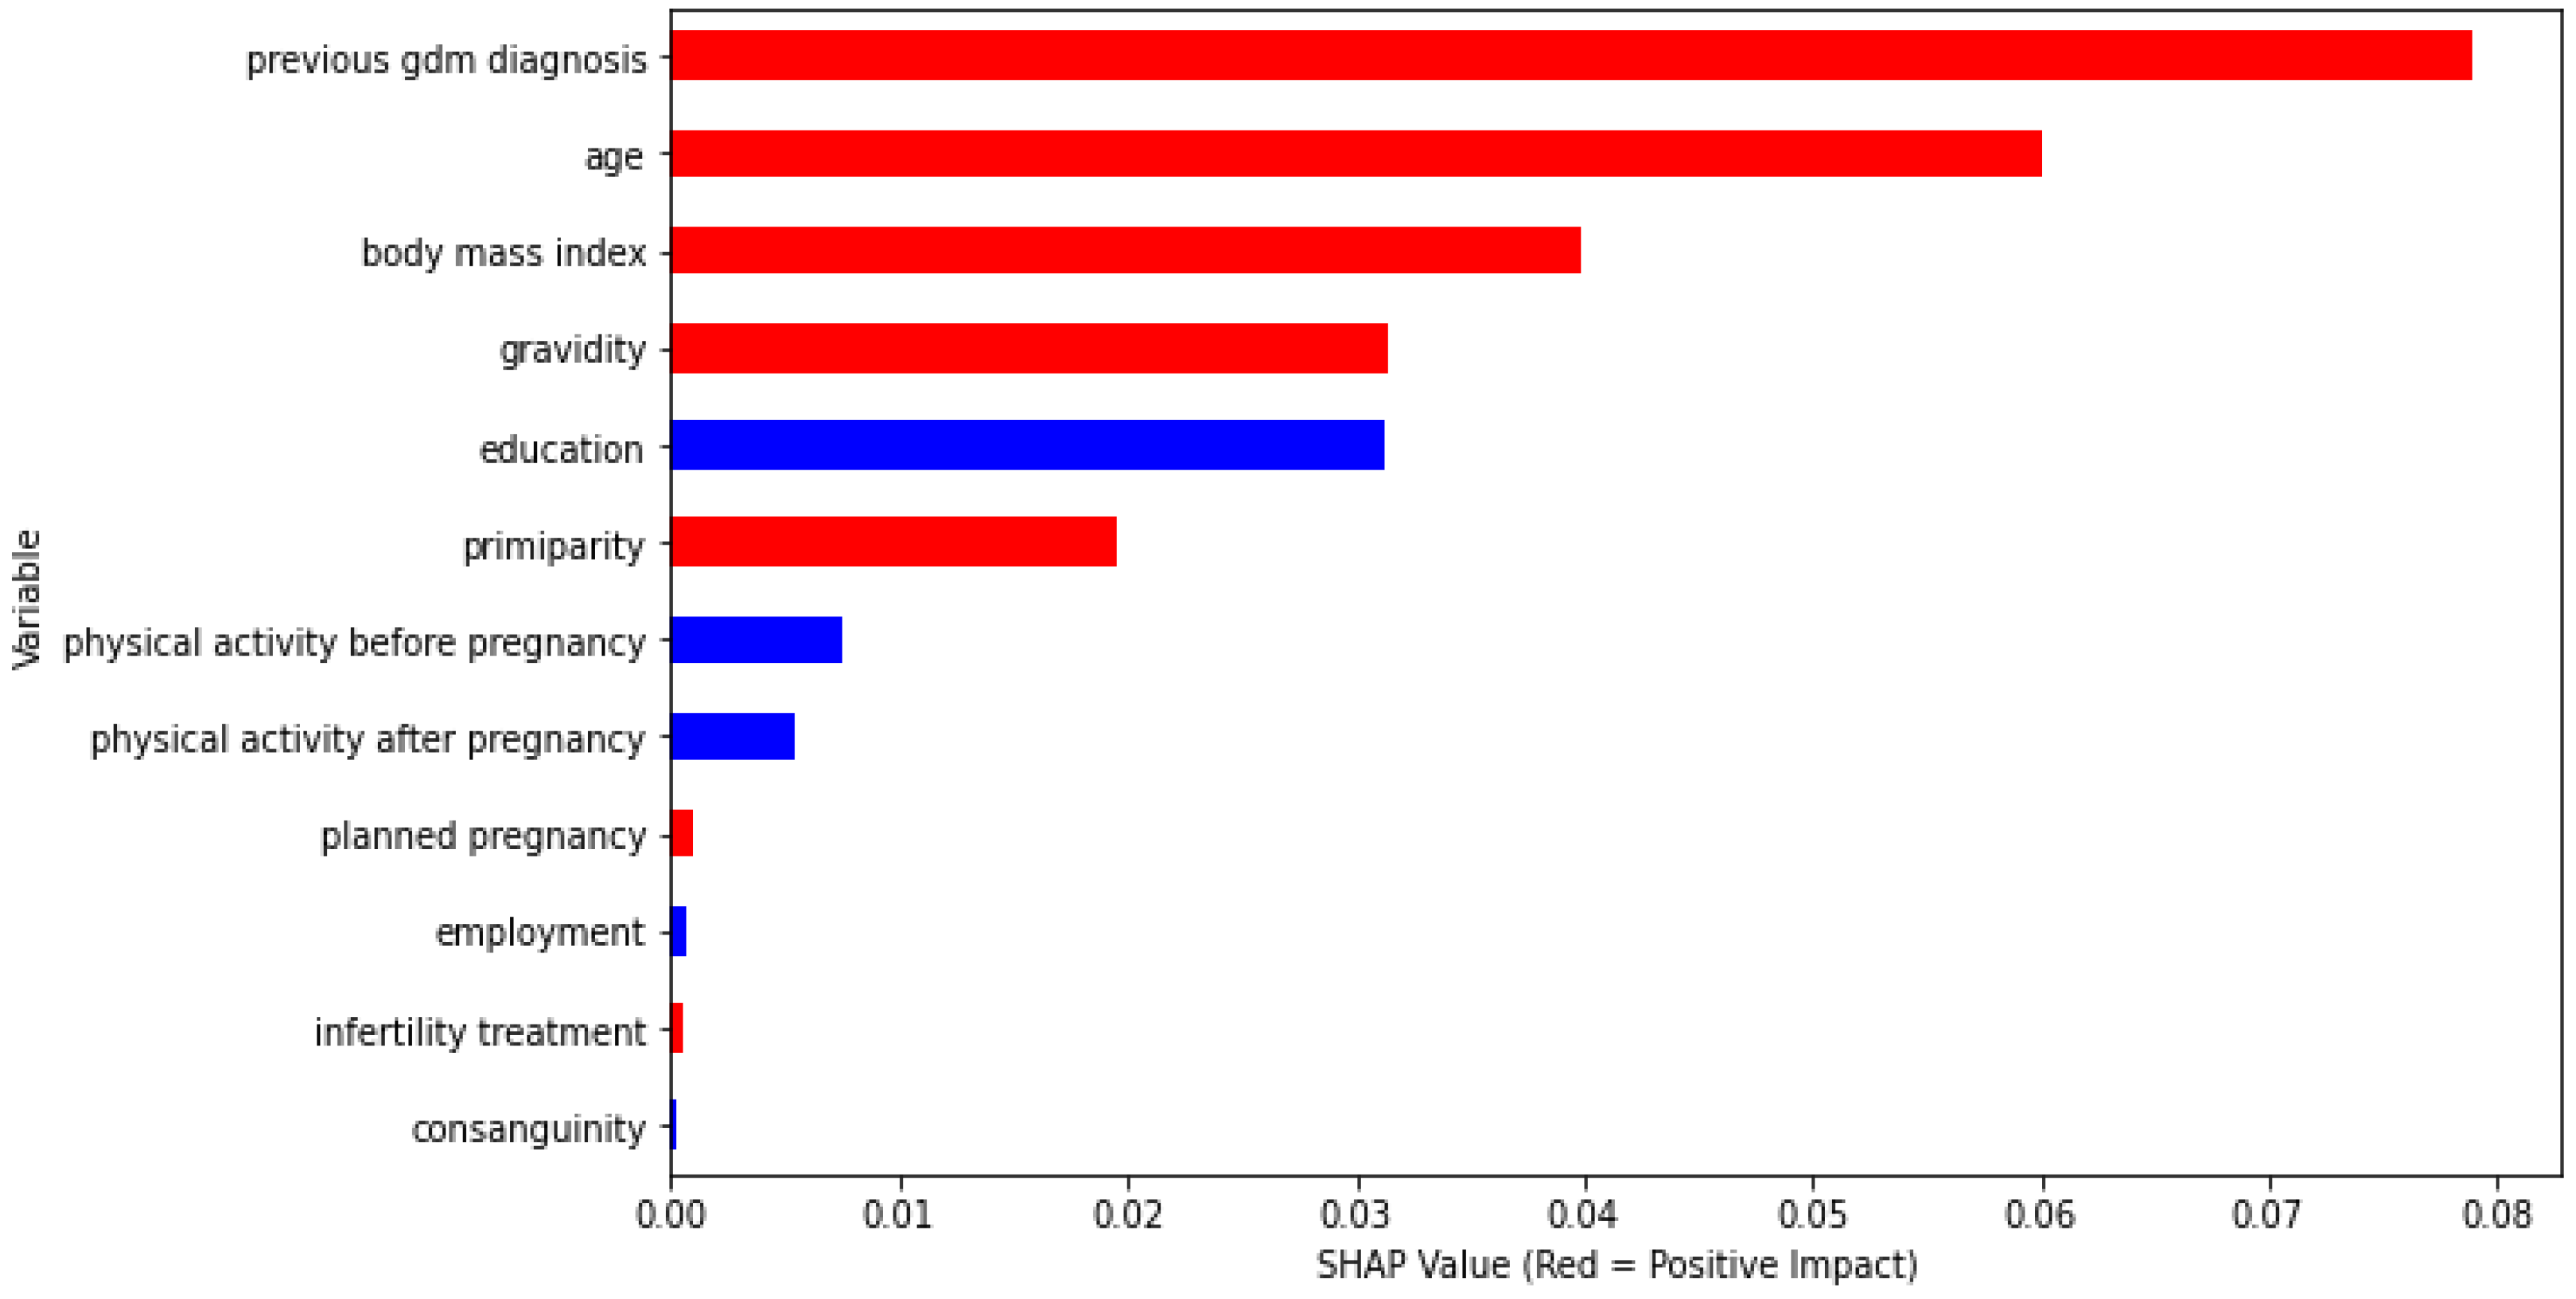
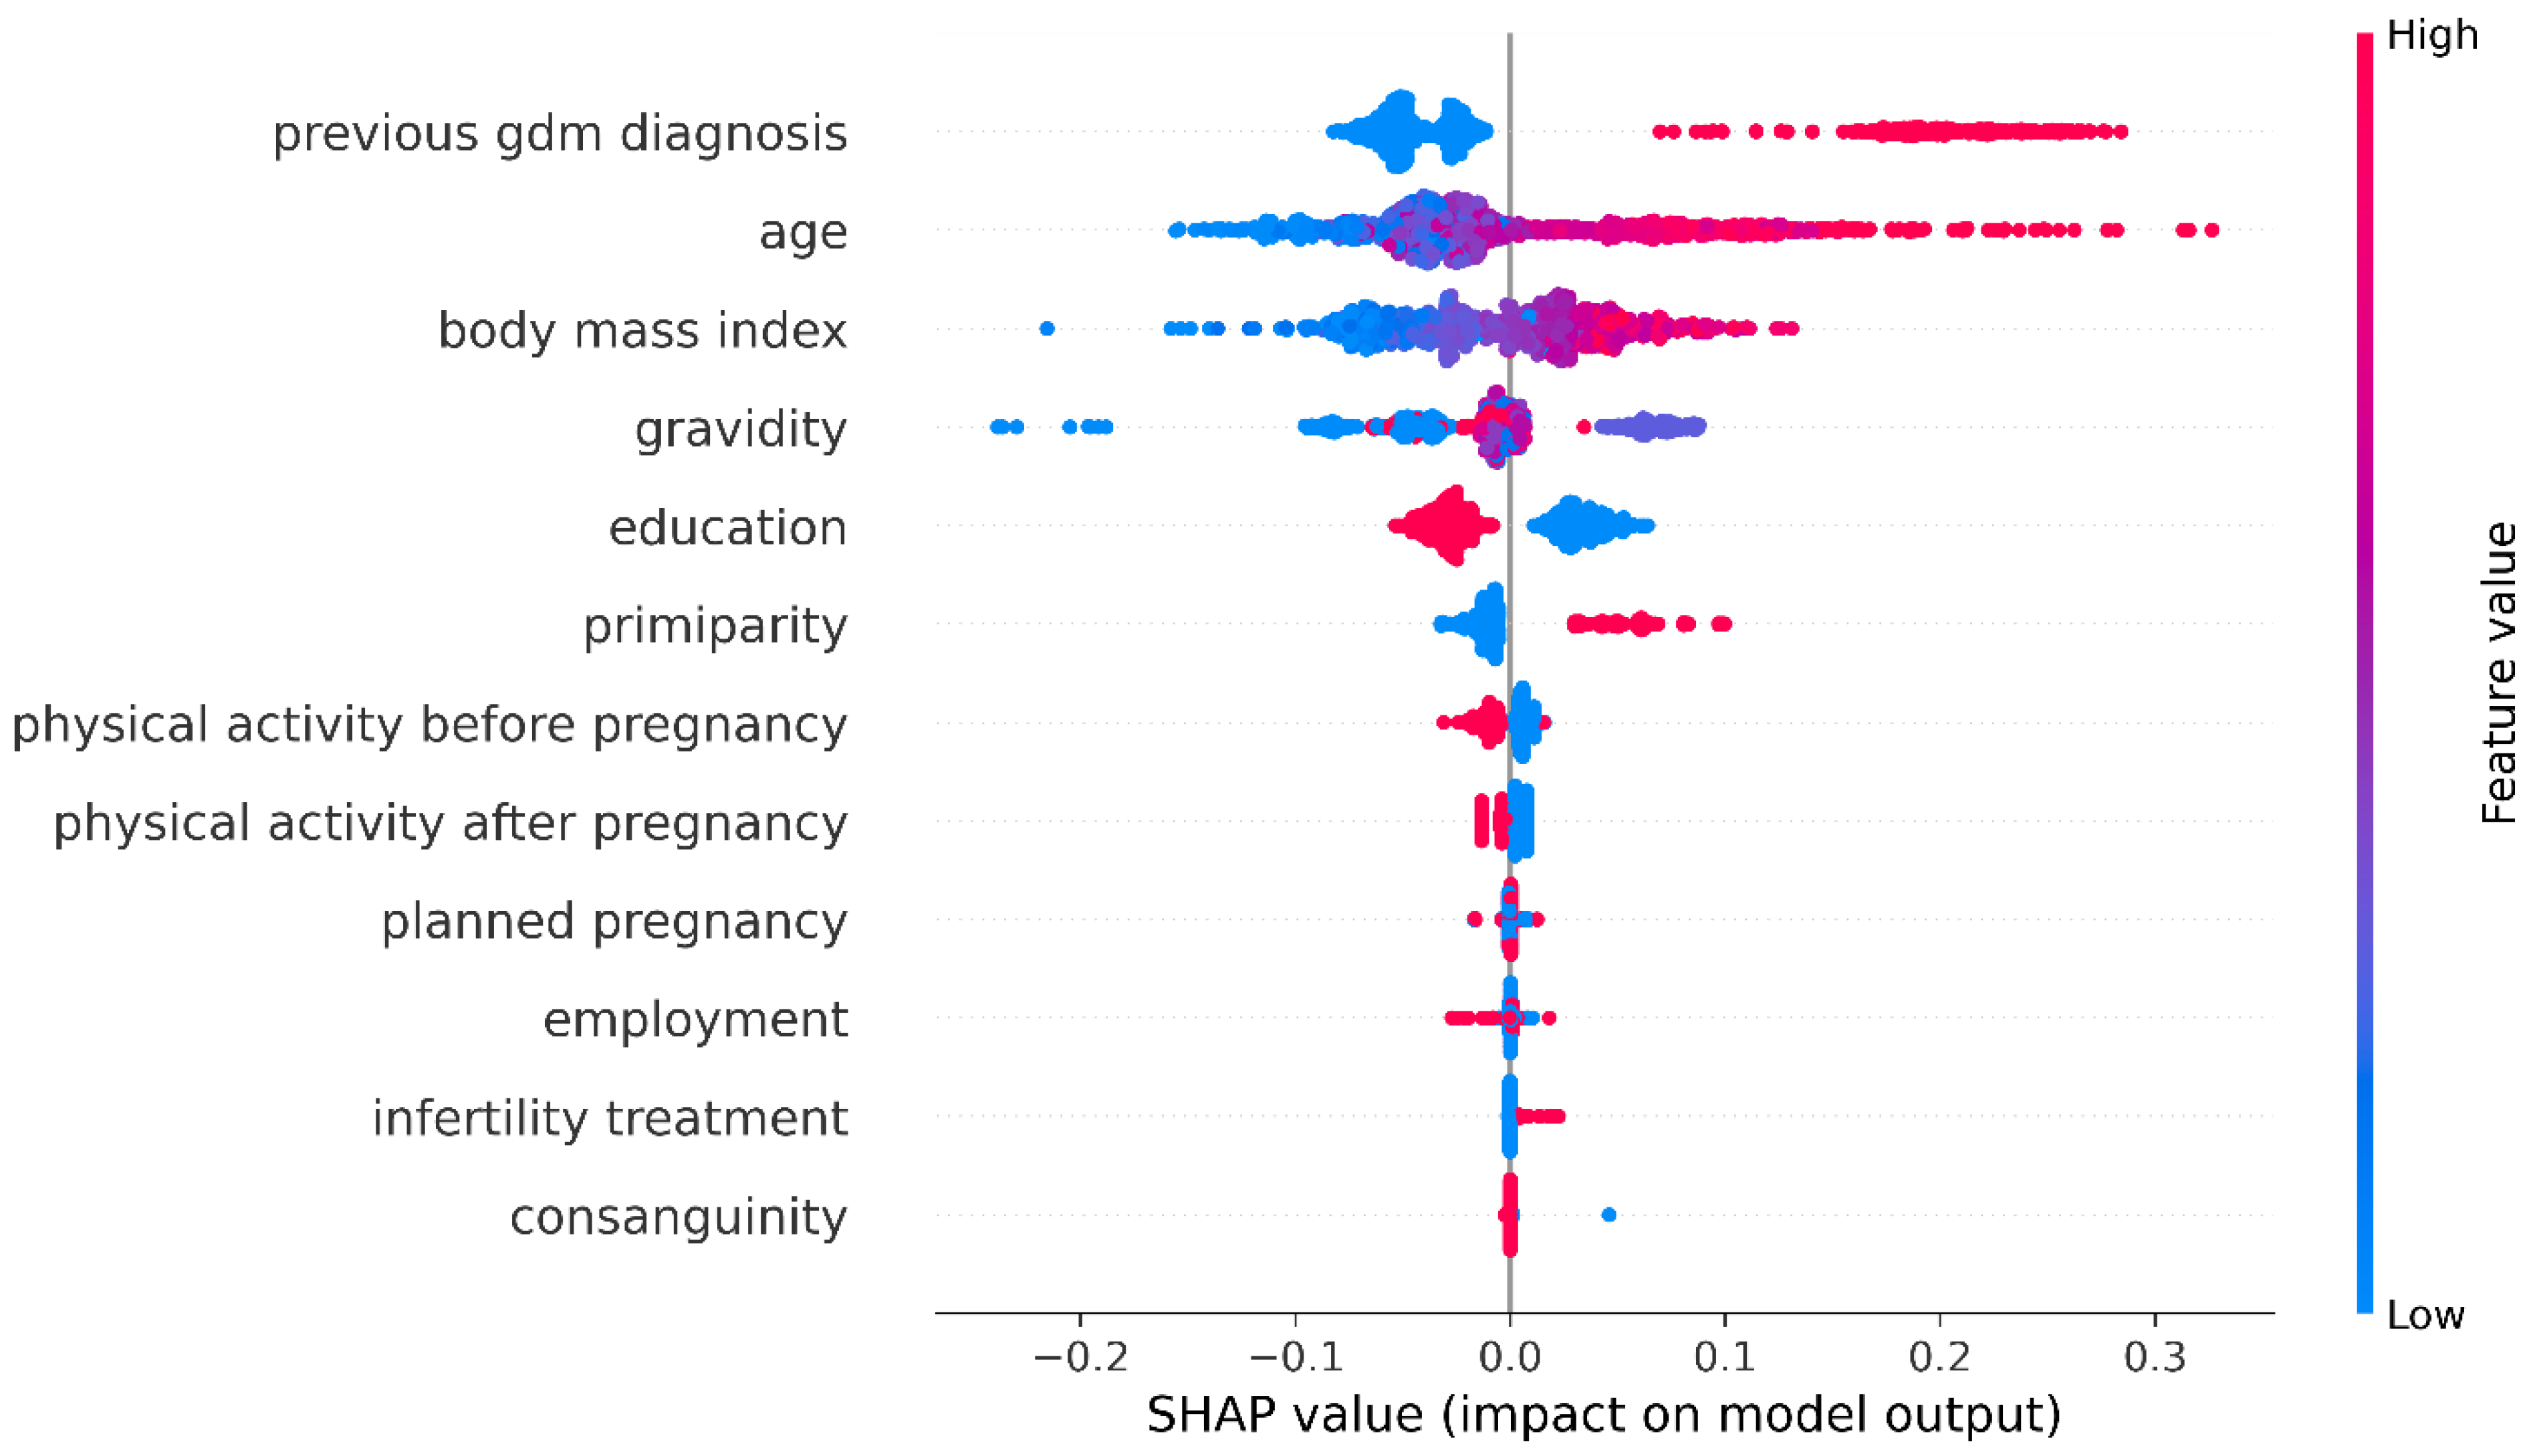
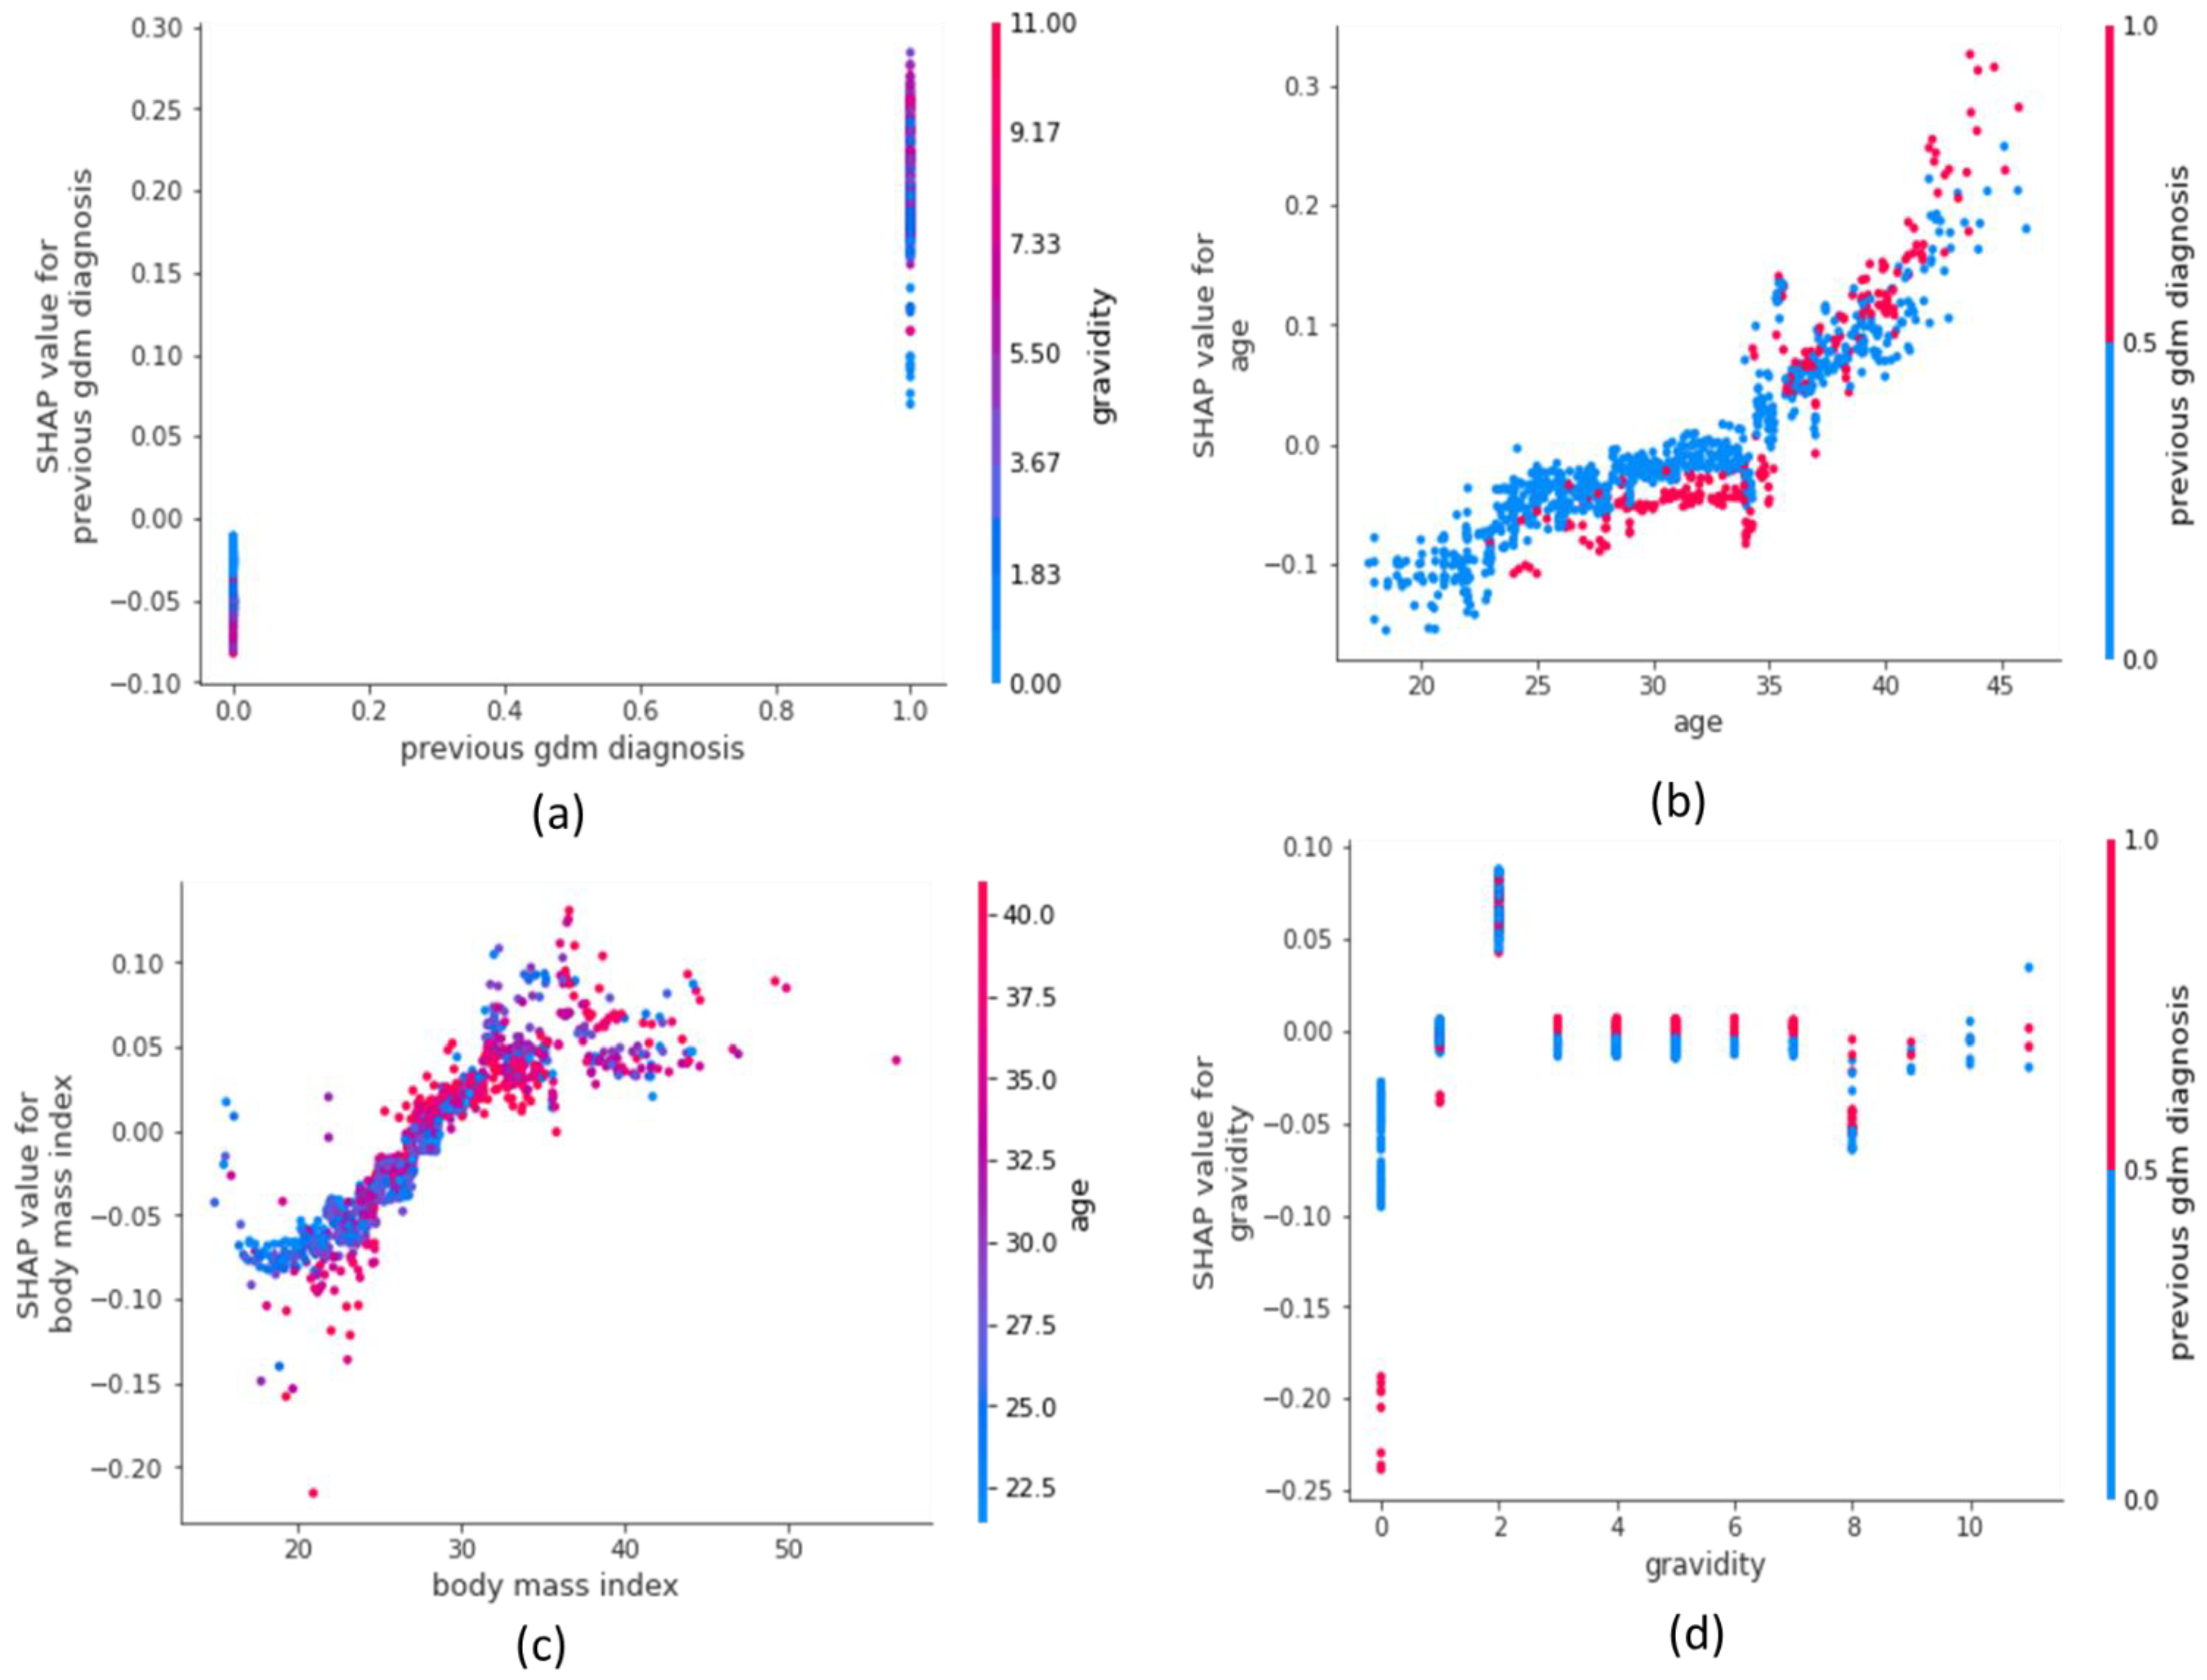
3. Results
4. Discussion
5. Conclusions
Author Contributions
Funding
Informed Consent Statement
Data Availability Statement
Acknowledgments
Conflicts of Interest
References
- Buchanan, T.A.; Xiang, A.; Kjos, S.L.; Watanabe, R. What is gestational diabetes? Diabetes Care 2007, 30 (Suppl. S2), S105–S111. [Google Scholar] [CrossRef] [PubMed] [Green Version]
- McIntyre, H.D.; Colagiuri, S.; Roglic, G.; Hod, M. Diagnosis of GDM: A suggested consensus. Best Pract. Res. Clin. Obstet. Gynaecol. 2015, 29, 194–205. [Google Scholar] [CrossRef] [PubMed] [Green Version]
- Keller, J.D.; Lopez-Zeno, J.A.; Dooley, S.L.; Socol, M.L. Shoulder dystocia and birth trauma in gestational diabetes: A five-year experience. Am. J. Obstet. Gynecol. 1991, 165, 928–930. [Google Scholar] [CrossRef]
- Catalano, P.M.; McIntyre, H.D.; Cruickshank, J.K.; McCance, D.R.; Dyer, A.R.; Metzger, B.E.; Lowe, L.P.; Trimble, E.R.; Coustan, D.R.; Hadden, D.R.; et al. The hyperglycemia and adverse pregnancy outcome study: Associations of GDM and obesity with pregnancy outcomes. Diabetes Care 2012, 35, 780–786. [Google Scholar] [CrossRef] [Green Version]
- Lao, T.; Ho, L. Does maternal glucose intolerance affect the length of gestation in singleton pregnancies? J. Soc. Gynecol. Investig. 2003, 10, 366–371. [Google Scholar] [CrossRef]
- He, X.-J.; Qin, F.-Y.; Hu, C.-L.; Zhu, M.; Tian, C.-Q.; Li, L. Is gestational diabetes mellitus an independent risk factor for macrosomia: A meta-analysis? Arch. Gynecol. Obstet. 2015, 291, 729–735. [Google Scholar] [CrossRef]
- Gasim, T. Gestational diabetes mellitus: Maternal and perinatal outcomes in 220 Saudi women. Oman Med. J. 2012, 27, 140. [Google Scholar] [CrossRef]
- Billionnet, C.; Mitanchez, D.; Weill, A.; Nizard, J.; Alla, F.; Hartemann, A.; Jacqueminet, S. Gestational diabetes and adverse perinatal outcomes from 716,152 births in France in 2012. Diabetologia 2017, 60, 636–644. [Google Scholar] [CrossRef] [Green Version]
- Bellamy, L.; Casas, J.-P.; Hingorani, A.D.; Williams, D. Type 2 diabetes mellitus after gestational diabetes: A systematic review and meta-analysis. Lancet 2009, 373, 1773–1779. [Google Scholar] [CrossRef]
- Kessous, R.; Shoham-Vardi, I.; Pariente, G.; Sherf, M.; Sheiner, E. An association between gestational diabetes mellitus and long-term maternal cardiovascular morbidity. Heart 2013, 99, 1118–1121. [Google Scholar] [CrossRef]
- Kim, S.Y.; England, J.L.; Sharma, J.A.; Njoroge, T. Gestational diabetes mellitus and risk of childhood overweight and obesity in offspring: A systematic review. Exp. Diabetes Res. 2011, 2011, 541308. [Google Scholar] [CrossRef] [PubMed] [Green Version]
- Vohr, B.R.; Boney, C.M. Gestational diabetes: The forerunner for the development of maternal and childhood obesity and metabolic syndrome? J. Matern.-Fetal Neonatal Med. 2008, 21, 149–157. [Google Scholar] [CrossRef] [PubMed]
- Lee, H.; Jang, H.C.; Park, H.K.; Cho, N.H. Early manifestation of cardiovascular disease risk factors in offspring of mothers with previous history of gestational diabetes mellitus. Diabetes Res. Clin. Pract. 2007, 78, 238–245. [Google Scholar] [CrossRef] [PubMed]
- Buckley, B.S.; Harreiter, J.; Damm, P.; Corcoy, R.; Chico, A.; Simmons, D.; Vellinga, A.; Dunne, F. Gestational diabetes mellitus in Europe: Prevalence, current screening practice and barriers to screening. A review. Diabet. Med. 2012, 29, 844–854. [Google Scholar] [CrossRef]
- Smirnakis, K.V.; Plati, A.; Wolf, M.; Thadhani, R.; Ecker, J.L. Predicting gestational diabetes: Choosing the optimal early serum marker. Am. J. Obstet. Gynecol. 2007, 196, 410.e1–410.e7. [Google Scholar] [CrossRef]
- Qiu, H.; Yu, H.Y.; Wang, L.Y.; Yao, Q.; Wu, S.N.; Yin, C.; Fu, B.; Zhu, X.J.; Zhang, Y.L.; Xing, Y.; et al. Electronic health record driven prediction for gestational diabetes mellitus in early pregnancy. Sci. Rep. 2017, 7, 16417. [Google Scholar] [CrossRef] [Green Version]
- Al Haddad, A.; Ali, N.; Elbarazi, I.; Elabadlah, H.; Al-Maskari, F.; Narchi, H.; Brabon, C.; Ghazal-Aswad, S.; AlShalabi, F.M.; Zampelas, A.; et al. Mutaba’ah—Mother and Child Health Study: Protocol for a prospective cohort study investigating the maternal and early life determinants of infant, child, adolescent and maternal health in the United Arab Emirates. BMJ Open 2019, 9, e030937. [Google Scholar] [CrossRef] [Green Version]
- Department of Health. HAAD Standard for Routine Antenatal Screening and Care; HAAD/ANSC/SD; Department of Health: Abu Dhabi, United Arab Emirates, 2011; pp. 1–8.
- Chen, T.; Carlos, G. Xgboost: A scalable tree boosting system. In Proceedings of the 22nd ACM SIGKDD International Conference on Knowledge Discovery and Data Mining, San Francisco, CA, USA, 13–17 August 2016; pp. 785–794. [Google Scholar]
- Bentéjac, C.; Csörgő, A.; Martínez-Muñoz, G. A comparative analysis of gradient boosting algorithms. Artif. Intell. Rev. 2021, 54, 1937–1967. [Google Scholar] [CrossRef]
- Wang, F.; Ross, C.L. Machine learning travel mode choices: Comparing the performance of an extreme gradient boosting model with a multinomial logit model. Transp. Res. Rec. 2018, 2672, 35–45. [Google Scholar] [CrossRef] [Green Version]
- Zhang, D.; Qian, L.; Mao, B.; Huang, C.; Huang, B.; Si, Y. A data-driven design for fault detection of wind turbines using random forests and XGboost. Ieee Access. 2018, 6, 21020–21031. [Google Scholar] [CrossRef]
- Lundberg, S.M.; Erion, G.; Chen, H.; DeGrave, A.; Prutkin, J.M.; Nair, B.; Katz, R.; Himmelfarb, J.; Bansal, N.; Lee, S.I. From local explanations to global understanding with explainable AI for trees. Nat. Mach. Intell. 2020, 2, 56–67. [Google Scholar] [CrossRef] [PubMed]
- Lundberg, S.M.; Lee, S.I. A unified approach to interpreting model predictions. Adv. Neural Inf. Process. Syst. 2017, 30, 4768–4777. [Google Scholar]
- Sundararajan, M.; Najmi, A. The many Shapley values for model explanation. In Proceedings of the International Conference on Machine Learning, Virtual Event, 13–18 July 2020; pp. 9269–9278. [Google Scholar]
- Stekhoven, D.J.; Bühlmann, B. MissForest—Non-parametric missing value imputation for mixed-type data. Bioinformatics 2012, 28, 112–118. [Google Scholar] [CrossRef] [PubMed] [Green Version]
- Sun, J.; Hong, M.; Xie, S.; Wu, L.; Wang, Y.; Mei, W.; Zhang, J. The interactive effect of pre-pregnancy overweight and obesity and hypertensive disorders of pregnancy on the weight status in infancy. Sci. Rep. 2019, 9, 15960. [Google Scholar] [CrossRef] [PubMed] [Green Version]
- Liu, J.; Wu, J.; Liu, S.; Li, M.; Hu, K.; Li, K. Predicting mortality of patients with acute kidney injury in the ICU using XGBoost model. PLoS ONE 2021, 16, e0246306. [Google Scholar] [CrossRef]
- Shi, X.; Wong, Y.D.; Li, M.Z.F.; Palanisamy, C.; Chai, C. A feature learning approach based on XGBoost for driving assessment and risk prediction. Accid. Anal. Prev. 2019, 129, 170–179. [Google Scholar] [CrossRef]
- Sahin, E.K. Assessing the predictive capability of ensemble tree methods for landslide susceptibility mapping using XGBoost, gradient boosting machine, and random forest. SN Appl. Sci. 2020, 2, 1–17. [Google Scholar] [CrossRef]
- Shrikumar, A.; Greenside, P.; Shcherbina, A.; Kundaje, A. Not just a black box: Learning important features through propagating activation differences. arXiv 2016. Available online: https://arxiv.org/abs/1605.01713 (accessed on 5 September 2022).
- Qiu, J.; Liu, Y.; Zhu, W.; Zhang, C. Comparison of effectiveness of routine antenatal care with a midwife-managed clinic service in prevention of gestational diabetes mellitus in early pregnancy at a hospital in China. Med. Sci. Monit. Int. Med. J. Exp. Clin. Res. 2020, 26, e925991-1–e925991-8. [Google Scholar] [CrossRef]
- Lamminpää, R.; Vehviläinen-Julkunen, K.; Schwab, U. A systematic review of dietary interventions for gestational weight gain and gestational diabetes in overweight and obese pregnant women. Eur. J. Nutr. 2018, 57, 1721–1736. [Google Scholar] [CrossRef] [Green Version]
- Popova, P.; Kravchuk, E.; Gerasimov, A.; Shelepova, E.; Tsoi, U.; Grineva, E. The new combination of risk factors determining a high risk of gestational diabetes mellitus. In Proceedings of the 15th International & 14th European Congress of Endocrinology, Florence, Italy, 5–9 May 2012. [Google Scholar]
- Liu, R.; Zhan, Y.; Liu, X.; Zhang, Y.; Gui, L.; Qu, Y.; Nan, H.; Jiang, Y. Stacking Ensemble Method for Gestational Diabetes Mellitus Prediction in Chinese Pregnant Women: A Prospective Cohort Study. J. Healthc. Eng. 2022, 1, 1–14. [Google Scholar] [CrossRef] [Green Version]
- Marozio, L.; Picardo, E.; Filippini, C.; Mainolfi, E.; Berchialla, P.; Cavallo, F.; Tancredi, A.; Benedetto, C. Maternal age over 40 years and pregnancy outcome: A hospital-based survey. J. Matern.-Fetal Neonatal Med. 2019, 32, 1602–1608. [Google Scholar] [CrossRef] [PubMed]
- Sweeting, A.N.; Wong, J.; Appelblom, H.; Ross, G.P.; Kouru, H.; Williams, P.F.; Sairanen, M.; Hyett, J.A. A novel early pregnancy risk prediction model for gestational diabetes mellitus. Fetal Diagn. Ther. 2019, 45, 76–84. [Google Scholar] [CrossRef] [PubMed]
- Artzi, N.S.; Shilo, S.; Hadar, E.; Rossman, H.; Barbash-Hazan, S.; Ben-Haroush, A.; Balicer, R.D.; Feldman, B.; Wiznitzer, A.; Segal, E. Prediction of gestational diabetes based on nationwide electronic health records. Nat. Med. 2020, 26, 71–76. [Google Scholar] [CrossRef] [PubMed]
- Wu, Y.; Ma, S.; Wang, Y.; Chen, F.; Zhu, F.; Sun, W.; Shen, W.; Zhang, J.; Chen, H. A risk prediction model of gestational diabetes mellitus before 16 gestational weeks in Chinese pregnant women. Diabetes Res. Clin. Pract. 2021, 179, 109001. [Google Scholar] [CrossRef]


| Characteristic | All (n = 3858) | No GDM (n = 2977) | GDM (n = 881) | p-Value |
|---|---|---|---|---|
| Age a* | 31.1 ± 6.08 | 30.2 ± 5.90 | 33.8 ± 5.84 | <0.001 |
| BMI at pregnancy a* | 28.6 ± 5.82 | 28.0 ± 5.68 | 30.7 ± 5.79 | <0.001 |
| Number of pregnancies a* | 2.91 ± 2.42 | 2.71 ± 2.34 | 3.61 ± 2.58 | <0.001 |
| Primiparity ** | <0.001 | |||
| Yes | 718 (19.8%) | 609 (21.7%) | 109 (13.4) | |
| No | 2911 (80.2%) | 2200 (78.3%) | 711 (86.2) | |
| Previous GDM diagnosis ** | <0.001 | |||
| Yes | 875 (24.8%) | 452 (16.6%) | 423 (52.6%) | |
| No | 2657 (75.2%) | 2276 (83.4%) | 381 (47.4%) | |
| Planned pregnancy ** | 0.684 | |||
| Yes | 1894 (53.1%) | 1467 (53.3%) | 427 (52.5%) | |
| No | 1674 (46.9%) | 1287 (46.7%) | 387 (47.5%) | |
| Infertility treatment ** | <0.001 | |||
| Yes | 320 (9.1%) | 219 (8.0%) | 101 (12.6%) | |
| No | 3212 (90.9%) | 2509 (92.0%) | 703 (87.4%) | |
| Consanguinity ** | 0.727 | |||
| Yes | 1001 (84.2%) | 794 (84.4%) | 207 (83.5) | |
| No | 188 (15.8%) | 147 (15.6%) | 41 (16.5) | |
| Education ** | ||||
| High school and below | 1798 (50.8%) | 1420 (52.0%) | 378 (46.8%) | 0.011 |
| Above High school | 1742 (49.2%) | 1313 (48.0%) | 429 (53.2%) | |
| Employed ** | 0.004 | |||
| Not employed | 2426 (68.4%) | 1906 (69.7%) | 520 (64.3%) | |
| Employed | 119 (31.6%) | 830 (30.3%) | 289 (35.7%) | |
| Physical activity prior to current pregnancy ** | 0.582 | |||
| Yes | 1437 (44.3%) | 1098 (44.1%) | 339 (45.2) | |
| No | 1805 (55.7%) | 1394 (55.9%) | 411 (54.8) | |
| Physical activity during current pregnancy ** | 0.026 | |||
| Yes | 1548 (46.8%) | 1335 (52.2%) | 323 (43.2) | |
| No | 1759 (53.2%) | 1225 (47.8%) | 424 (56.8) |
Publisher’s Note: MDPI stays neutral with regard to jurisdictional claims in published maps and institutional affiliations. |
© 2022 by the authors. Licensee MDPI, Basel, Switzerland. This article is an open access article distributed under the terms and conditions of the Creative Commons Attribution (CC BY) license (https://creativecommons.org/licenses/by/4.0/).
Share and Cite
Ali, N.; Khan, W.; Ahmad, A.; Masud, M.M.; Adam, H.; Ahmed, L.A. Predictive Modeling for the Diagnosis of Gestational Diabetes Mellitus Using Epidemiological Data in the United Arab Emirates. Information 2022, 13, 485. https://doi.org/10.3390/info13100485
Ali N, Khan W, Ahmad A, Masud MM, Adam H, Ahmed LA. Predictive Modeling for the Diagnosis of Gestational Diabetes Mellitus Using Epidemiological Data in the United Arab Emirates. Information. 2022; 13(10):485. https://doi.org/10.3390/info13100485
Chicago/Turabian StyleAli, Nasloon, Wasif Khan, Amir Ahmad, Mohammad Mehedy Masud, Hiba Adam, and Luai A. Ahmed. 2022. "Predictive Modeling for the Diagnosis of Gestational Diabetes Mellitus Using Epidemiological Data in the United Arab Emirates" Information 13, no. 10: 485. https://doi.org/10.3390/info13100485