Article

Technology-Induced Stress, Sociodemographic Factors, and Association with Academic Achievement and Productivity in Ghanaian Higher Education during the COVID-19 Pandemic

by
Harry Barton Essel
1,
Dimitrios Vlachopoulos
2,*,
Akosua Tachie-Menson
1,
Esi Eduafua Johnson
1 and
Alice Korkor Ebeheakey
1
1
Department of Educational Innovations in Science and Technology, Kwame Nkrumah University of Science and Technology, Kumasi AK-315-7530, Ghana
2
Faculty of Digital Media & Creative Industries, Amsterdam University of Applied Sciences, 1091 GM Amsterdam, The Netherlands
*
Author to whom correspondence should be addressed.
Information 2021, 12(12), 497; https://doi.org/10.3390/info12120497
Submission received: 24 October 2021 / Revised: 22 November 2021 / Accepted: 25 November 2021 / Published: 30 November 2021
(This article belongs to the Special Issue Information Technologies in Education, Research and Innovation)

Abstract

:
The COVID-19 pandemic affected many nations around the globe, including Ghana, in the first quarter of 2020. To avoid the spread of the virus, the Ghanaian government ordered universities to close, although most of them had only just begun the academic year. The adoption of Emergency Remote Teaching (ERT) had adverse effects, such as technostress, notwithstanding its advantages for both students and academic faculty. This study examined two significant antecedents: digital literacy and technology dependence. In addition, the study scrutinized the effects of technostress on two relevant student qualities: academic achievement and academic productivity. A descriptive correlational study method was used to discern the prevalence of technology-induced stress among university students in Ghana. The technostress scale was used with a sample of 525 students selected based on defined eligibility criteria. A confirmatory factor analysis (CFA) was employed to calculate the measurement models and structural models. The divergent validity and convergent validity were estimated with the average variance extracted (AVE) and coefficients of correlation between the constructs. The online survey of 525 university students inferred that technology dependence and digital literacy contributes significantly to technostress. Additionally, technostress has adverse effects on academic achievement and academic productivity. Practical implications, limitations, and future directions for the study were also discussed.

1. Introduction

The world has been dealing with the effects of the COVID-19 pandemic since early 2020. Ghana has been one of Africa’s affected countries and imposed lockdown stratagems on the major cities to prevent the Coronavirus from spreading. The government established many emergency measures in a climate of a radical paradigm shift, including simplifying processes [1] for universities to access remote teaching. Additionally, these measures have left instructors improvising alternative modes of instruction described as emergency remote teaching [2,3] rather than quality online instruction [4]. Emergency remote teaching (ERT) is a temporary phase in instructions during crises; it requires the use of utterly remote teaching methods that may typically be given as in-person or blended courses [3]. ERT differs from online education as defined by Sangrà, Vlachopoulos, and Cabrera [5] in that it represents a rapid and unplanned transition of brick-and-mortar courses to a distance education model [6]. ERT has been a critical and common alternative, even though it was not commonly used in Ghanaian universities before the COVID-19 lockdown [7].
ERT adoption has significantly increased information and communication technologies (ICTs) usage in contemporary education [8,9] in Ghana during the pandemic. While ICTs’ use has become the norm, there is a hybrid approach in Ghanaian universities. Notwithstanding, many universities do not have specific online instruction implementation and management policies [7]. Throughout the lockdown restrictions, universities had to decide on ways to continue teaching and learning as well as maintain their staff (teaching and non-teaching) and students protected from a rapidly evolving and sparsely distributed public health emergency [3].
The transition from in-person instruction to ERT flooded the learning space with digital technologies (DTs) or ICTs relatively new to most students. These technologies include blended learning and mobile learning facilitated by emerging technologies such as intelligent tutoring systems, learning analytics, and diverse learning applications [10,11,12]. Notwithstanding, ICTs come with benefits for students demonstrated via performance improvements, saving institutional resources and time, high student satisfaction [13,14], convenience, flexibility, and extended access to quality learning support [15]. ICT allows universities to streamline institutional management, increase openness, and accelerate students’ academic data processing [16,17]. These benefits are said to advance the learning and teaching process [18]. Besides, students tend to have positive attitudes toward including ICT in the learning environment [19].
While the critical success factors are undeniable, there is a growing concern in determining the negative effect of technology on students. There is a general perception that university students are tech-savvy and are not affected by technology-induced stress; thus, their psychological or cognitive responses and adaptation [20] to new applications, functionalities, and workflows [21] are neglected. Students may actually encounter adverse effects or may have expected interactions with ICTs [22] due to altered conditions and expectations, requests of more time and effort, and time management inclinations and extended request for more self-regulated learning [20,23]. However, it is often required to investigate the negative aspects of technology, such as technology-induced stress, which can reduce students’ academic achievements and productivity [24]. ICTs have given rise to a distinct description of stress known as ‘technostress.’
Technostress is an inverse psychological condition kindred to the use or potential threat of ICT usage influenced by the sense of an imbalance between resources and demands linked to the use of ICTs, which results in a higher degree of uncomfortable psychophysiological activation and the development of inverse attitudes to ICTs [25]. It is also described as an adaptive condition effectuated by the inability to cope with emerging digital technology healthily [26], or a maladaptation issue caused by students’ inability to subsist with technology and changing technological [21,27]. Accordingly, technostress emerges when ICT core competencies transcend students’ threshold of expertise within an institution or when technological expectations surpass its capabilities or ability to fulfil them [26,28,29,30]. Decreased learning commitment, burnout, negative performances, and intentions to discontinue technology-enhanced learning can result from technostress among university students enrolled in learning environments integrated with ICTs [20,27].
Although an increasing amount of research is currently focused on the educational context [16,21,23,25,27,31], the bulk of research on the effects of technostress has been done in a business or industrial work environment [26,32]. These studies disregarded the accelerated technological advancements that have been consolidated in the field of education. Pallavi Upadhyaya [16] observed that technostress negatively affected student academic productivity. A study also discovered that first-year undergraduate psychology students faced computer anxiety, technostress, and test anxiety during their first Online Assessment [33]. In comparison, Qi’s [20] findings support the notion that students’ academic usage of mobile or smart devices for academic purposes has a more negligible effect on technostress; rather, it facilitates academic performance enhancement.
In this context, it is also essential to examine this phenomenon during its summit adoption to determine practical solutions and future spread changes. Besides, there should be an understanding of how students experience their academic engagements and remote learning in such a particular situation, acknowledging that learning remotely, supported by ICTs, has been almost ubiquitously employed [1] during the ERT period. To our knowledge, a dearth of study has been conducted in Ghana to observe the prevalence and the negative effect of technostress on students’ cognitive response within a university context, especially, during the COVID-19 pandemic. In modern society, it is critical to have information image for university, students, and staff, and today’s university students have a unique set of traits and behaviours, making them an intriguing subject to study [16,34].
Grounded on the literature mentioned earlier, we had double purposes to examine the types and prevalence of technostress reported by students at a Ghanaian university during the population exclusion and confinement rules implemented, and to examine the effects of technostress on students’ academic achievement and academic productivity during the COVID-19 pandemic. Throughout this interval, all university teaching responsibilities had to be undertaken online.
The research questions of the study are the following:
  • What is the prevalence of technology-induced stress among the university student population?
  • How different is technology-induced stress in students, based on sociodemographic differences that exist in the university student population?
  • How do technology dependence and digital literacy impact technology-induced stress?
  • To what magnitude does technostress affect students’ academic achievement and productivity?
Technology dependence is considered as an additionally significant concept that describes users’ technology utilisation instead of technology acceptance and persistent use. Besides, technology dependence is regarded as the intensity of ICT usage, including the reliance on various digital devices, software applications, and methods that help explain problems or achieve distinct functions or accomplish complex tasks [35]. Throughout the COVID-19 pandemic, several universities have adopted various technologies to enhance learning and teaching. It is highly likely that students would spend more time dealing with technology and such engagement can be associated with technology-induced stress. Shu et al. [36] explored the association between technology dependence, as an academic construct, and technostress, and found that persons with high technology dependence illustrate a high level of technostress. This finding shows that there is a connection between technology dependence and technology-induced stress.
Higher technology dependence indicates the closer personal significance of ICTs in regular engagement. The proportion of times a student decides to employ the ICTs, illustrating a subjective psychological condition, indicates the significance and personal connection to technologies and positively influences their behavioural intention to utilise them [35,36]. As a result, a reliant user on technology is more likely to experience ICT challenges such as technology uncertainty, complexity, insecurity, overload, and invasion [36]. As the technologies for emergency remote teaching were unfamiliar and rapidly changing, the students had to undergo training on using the technologies to effectively academic activities. Therefore, this current study infers that high technology dependence has a significant positive repercussion on technostress.
Hypothesis 1 (H1).
Technology dependence contributes positively to technostress.
Digital literacy (DL) encompasses a wide range of literacies related to digital technology [37]. It also associates with a person’s self-efficacy or expertise to utilise ICT and Internet resources to accomplish results [38]. Martin and Grudziecki [39] describe DL as the awareness, behaviour, and ability of students to utilise digital technologies to enable constructive social action appropriately. Digital technologies include hardware and software used by people in schools and at home for instructional, social, or entertainment purposes [37]. As technology is pervasive in everyday lives and transcends all social spheres, DL has become a pivotal skill for mastering daily activities and routines in the 21st century [40,41,42]. Thus, digital literacy refers to knowing one’s inclination to use a digital device to solve complex problems.
The emergency remote teaching embedded the use of email or instant messaging, internet searches, databases, and library websites to interact with the course facilitator and peers [38,43,44]. It also included various learning, presentation, assessment, and collaborative media into the students’ learning. Typically, student groups afford a combination of students with diverse digital literacy levels [43]. With the growing diversity of emerging technologies, these distinctions are becoming more complex [38]. Ng [37] stated that recurrent exposure to ICT also presents additional challenges, leading to technology-induced stress such as technology uncertainty, complexity, insecurity, overload, and invasion. Researchers have found that high digital literacy extends technology use and reduces a student’s technology stress. Students with higher digital literacy will respond to changes and innovations in ICTs more swiftly than those with lower digital literacy. This is attributed to students’ ability to self-regulate and empower themselves to participate in the learning process because they have high self-efficacy [38].
With these factors in mind, high digital literacy is likely to promote new experiences and reduce technology-induced stress, while low digital literacy can decline operational skills and increase technology-induced stress. As a result, the following hypothesis emerged:
Hypothesis 2 (H2).
Digital literacy contributes negatively to technostress.
There is a dearth of literature on technostress and academic achievement (performance). However, the not-so-many studies address the negative effect of technostress on the academic achievements of individuals. Tarafdar et al. [45] discovered an inverse relationship between performance and technostress. Suharti and Susanto [46] demonstrate that work overload induces technostress, which has a direct and inverse effect on performance. Technology facilitates multitasking and drives students to their limits, resulting in fatigue, burnout, and lower performance [45].
Wang et al. [15] reported that three dimensions of technostress were correlated with student burnout, which negatively impacted their perceived performance in Technology-Enhanced Learning. Students confronted with massive amounts of information are pushed to work harder to meet accelerated and simultaneous processing demands from teachers and group members, which impair their performance due to techno-overload [20]. Besides, students feel exhausted, drained, and burned in such conditions [47], resulting in subpar quality academic performance. Another finding from Qi [20] suggests that students will perceive a loss of privacy due to the technological invasion because ICTs blur the boundary between home and academics, leading to an unwillingness to utilise online services to complete academic activities. Moreover, the lower levels of performance of students is based on the fact that students often easily access the types of information exposed to them when working from home; this inefficient application of technology disregards the deep thinking needed for creativity and innovative decision-making [48]. Based on these arguments, technostress may restrain students from successfully performing academic tasks required for success, resulting in low overall academic performance. Hence, we Hypothesised H3.
Hypothesis 3 (H3).
Technostress contributes negatively to student academic achievement.
According to stress studies, technology may lead to stress [49,50], and experts have termed the stress-creating influences of technologies as technostress [45,47]. Technostress is an adjustment problem that occurs when a person cannot cope with or become accustomed to technologies [45].
Studies demonstrate that technostress occurs in various consequences, such as frustration, exhaustion, anxiety, and stress, leading to an adverse impact on student productivity [45,51]. Productivity is often referred to as “job productivity” in information systems, and it is described as the degree to which an application improves the user’s performance through a unit of time [52]. Among the various significant technostress outcomes, recent studies found reduced worker productivity [15,45,51]. Tarafdar et al. [45] discovered that five technostress creators had an adverse effect on organisational productivity. A study also found a converse relationship between technostress from mobile interaction on employee productivity and quality of life [24]. Alam [53] studied three causes of technostress and discovered that their negative association with crew productivity grew stronger as the crew became more role-overloaded and equity-sensitive. Based on the previous discussions, it is likely to hypothesise an inverse association between technostress and productivity. Hence, we, therefore, framed H4.
Hypothesis 4 (H4).
Technostress contributes negatively to academic productivity.
The examination of the above-mentioned hypotheses will bridge the gap in the literature on possible associations between technostress and technology dependence, technology characteristics and digital literacy, as well as its impact on student achievement and productivity.

2. Materials and Methods

In this section, we describe the methodology followed in the study, including the type of design, the sampling method, the measurement tools, as well as the process of the data management and analysis.
The present study followed a correlational, non-experimental design, employing a survey to explain the prevalence of technostress with students in the Kwame Nkrumah University of Science and Technology (KNUST) and its association with academic achievement and productivity using their sociodemographic profiles. The present study is carried out as a multidisciplinary study; consequently, students were selected from the six colleges in KNUST, and they are (1) Art and Built Environment; (2) Health Science; (3) Sciences; (4) Engineering; (5) Agriculture and Natural Resources; and (6) Humanities and Social Sciences. The population consisted of undergraduates. The students were eligible for inclusion, given they were above 18 years old, of any gender, who wanted to willingly participate in the study [54]. It is worth noting that KNUST is an English-medium, science, technology, and liberal art university; thus, the study instruments used in the present study were in the English language.

2.1. Sample Size and Sample Method

A total sample of n = 525 undergraduate students from all the six colleges participated in the study. The researchers selected the sample for the present study (n = 525) bearing in mind a 3% error margin, 50% estimated percentage of sample, and a 95% confidence interval. The researchers applied a non-probability convenience sampling method to recruit the participants for the study. Though this method of sampling does not produce randomisation, it fits the overall characterisation of students in the university. After the data wrangling process, we maintained the final sample for the present study as n = 525 students since there were no questionnaires with missing or extreme responses. The process for data collection lasted for a duration of a month.
We garnered data crosswise in all the six colleges in KNUST, with 20.6% (n = 108) of the students in Science, 18.1% (n = 95) in Art and Built Environment, 17.2% (91) in Humanities and Social Science, 17.0% (n = 89) in Health Sciences, 17.0% (n = 89) in Engineering, and 10.1% (n = 53) in Agriculture and Natural Resources.

2.2. Measurement Tools

The technostress creator questionnaire (TSC-Q) is a 23-item instrument that defines an ideal condition that develops technology-induced stress [36,45]. The scale is made up of five computer-related factors derived from the perspectives of sources of stress [21,36,45]. The five factors are as follows (see Table 1): factor (1) techno-overload, caused by overload of information (5 items); factor (2) techno-invasion, caused by technology invasion of personal life (4 items); factor (3) techno-complexity, caused by the inability to deal with the complexity associated with technology (5 items); factor (4) techno-insecurity, caused by technology-induced work insecurity (5 items); factor (5) techno-uncertainty, caused by the uncertainty associated with technology (4 items). For adaption, the researchers made minor amendments to the original technostress creator scale. We transformed three of the factors, techno-insecurity, techno-uncertainty, and techno-complexity, to adhere to the academic setting [16].
The respondents answered each item on a Likert-type scale with points varying between 1 coded as “strongly disagree” to 7 coded as “strongly agree”. The researchers adapted a 5-grade average score scale designed by Ahmad [55] to interpret the prevalence of technostress (see Table 2). The original scale generated a Cronbach’s alpha coefficient above α = 0.70, indicating acceptable internal consistency reliability [45]. The reliability coefficients of the subfactors were reported as factor 1 (α = 0.89), factor 2 (α = 0.81), factor 3 (α = 0.84), factor 5 (α = 0.84), and factor 5 (α = 0.84). In the present study, we found a reliability value of α = 0.85 for the TSC-Q, representing an excellent internal consistency. Each of the subfactors in the TSC-Q demonstrated good internal consistency in the present study ((factor 1: α = 0.89), (factor 2: α = 0.81; ωt = 0.83), (factor 3: α = 0.84, ωt = 0.81), (factor 4: α = 0.84; ωt = 0.79), and (factor 5: α = 0.84; ωt = 0.82)). Thus, it is concluded that the technostress creator scale is valid and reliable.
The academic achievement of students was measured using the current Weighted Average (WA) of the academic year (2019/2020). The WA is taken as a quantitative variable. We adopted the KNUST standard class division system to represent the achievements (WA) of the students. The WA division system is as follows: First class division (100.0–70.0), Second Upper class division (69.9–60.0), Second Lower division (59.9–50.0), and Pass division (49.9–40.0). Some studies have used a single test result or a subject’s examination results to determine a students’ academic achievement [56,57]. Another study used both cumulative Grade Point Averages (GPAs) and examination results of a course to measure students’ academic achievement [20]. In the present study, WA for the second semester of the 2019/2020 academic year was used as most academic activities were executed online due to the COVID-19 pandemic.
The researchers measured academic productivity with an instrument developed by Upadhyaya [16] from the previous work of Tarafdar et al. [45]. The scale consists of four indicators, and each indicator is estimated on a 5-point Likert-type scale varying between 1 coded as “Strongly Disagree” to 5 coded as “Strongly Agree”. To maintain uniformity across the scales, we assessed the indicators on a 7-point Likert scale with “Strongly Disagree” coded as 1 and the scale had a good Cronbach’s coefficient alpha α = 0.877 [16]. In the present study, the internal consistency reliability of the academic productivity scale was α = 0.89.
The researchers adopted Ng’s [37] nine-item scale to assess digital literacy. Digital literacy, in this case, is a three-factor solution that includes technological, cognitive, and social-emotional components. Each item is measured on a 7-point Likert-type scale varying between “strongly disagree” coded as 1 and “Strongly agree” coded as 7. In the present study, we reported a Cronbach’s α = 0.91 and McDonald’s omega wt= 0.92.
The technology dependency is a one-factor scale developed by Shu et al. [36] based on studies by Hoffman et al. [58] and McCune [59]. Each item is rated on a 7-point Likert-type scale varying between “Strongly agree” coded as 1 and “Strongly disagree” coded as 7. The original scale had good internal consistency reliability of α = 0.80. Base on the data garnered, the present study reported a Cronbach’s α = 0.91 and McDonald’s wt = 0.93.
In the present study, data were obtained from students in KNUST during the first month of the second semester of the 2019/2020 academic year. The principal researcher administered an e-questionnaire, designed with Google Forms application [60] to the students. Before issuing the e-questionnaire, all of the students were notified of the purpose of the present study and inquired (website notification) if they desired to cooperate willingly. A short uniform resource locator (URL), or a link was generated and sent to the participating students via their institutional electronic mail (email) and Short Message Service (SMS). None of the items of the e-questionnaire included personal identifiers. The URL was distributed to n = 525 students, and they were asked to complete the e-questionnaire as precisely as practicable. About 10 to 15 min were required to complete the e-questionnaire. The data were transferred from the Google Forms to Google spreadsheet, saved as a comma-separated value (.csv) file and uploaded to Jamovi 1.6.6 for statistical computation and analysis. One of the researchers coded the items in the e-questionnaire while the others controlled the accuracy of the data.

2.3. Data Management and Analysis

Descriptive and Inferential statistics were used in examining the data obtained for this study. The researchers used Jamovi open-source statistical package version 1.6.6 and R with Lavaan package for data computations and analyses. All statistical significance for the present study was calculated while the estimated probability (p) was equal to or less than 5% (p ≤ 0 05; 2-tailed) with a 95% confidence interval. The distribution of the sociodemographic factors (gender, age, marital status, academic grade, residential status, college/academic discipline, and ICT usage experience) was described with means (m), standard deviations (SD), frequencies (f), and percentages. Continuous variables such as age and ICT usage experience were transformed into categorical variables using the median split method. One-way analysis of variance (ANOVA) and independent samples T-test was employed to calculate the differences in statistical significance of technostress scores and sociodemographic factors. A confirmatory factor analysis (CFA) was estimated using R with the Lavaan software package to calculate the measurement models and structural model. The divergent validity and convergent validity were estimated by measuring the correlation coefficient between the constructs and average variance extracted (AVE).

3. Results and Findings

The presentation of the findings starts with the sociodemographic profiles of the participants and the technologies they use (type, frequency, and scope). Then, we present the prevalence of technostress among participants, as well as the associations between technostress and sociodemographic factors. The section ends with a reference on the relation between variables of interest and sociodemographic factors and the results of the measurement model applied.
The sociodemographic profiles of the students were presented as technological and non-technological associated factors. The non-technological-related factors (see Table 3) include gender, age, subjective economic status, residential status, sleep hours, and having work beside studies.
The technological factors consist of active internet service, devices owned, and data package ownership. The span of technology usage, recurrent use of technology, and the aim and daily recurrent of technology are also factors considered in the present study (see Table 4, Table 5 and Table 6).
Overall, the study counted with the participation of 525 university students, with the majority (56.2%, n = 295) as females. The mean age of the students was 21.2 (SD = 2.5) years old. In terms of residential status, the majority (n = 310) of the students lived off campus with the others residing on campus. Concerning marital status, the majority were single (70.2%, n = 369), with the outstanding having married (15.1%, n = 79), in a relationship (13.4%, n = 70), or divorced (1.3%, n = 7). The majority had no work beside their studies (56.8%, n = 298), with the remaining engaging in irregular (26.0%, n = 137) or regular work (17.2%, n = 90). Regarding the subjective economic status, most of the students were managing (39.5%, n = 207), followed by those with good (26.4%, n = 139) and poor (34.1%, n = 179).

3.1. The Prevalence of Technostress among Participants

To measure technostress prevalence among the students, the researchers employed the 23-item technostress scale designed by Tarafdar et al. [45]. We garnered data from a sample of n = 525 students using the scale. Table 7 presents the representational statistics of the technostress scores of the students understudied. While 4.3% (n = 23) of the respondents showed very low-level technostress, 7.8% (n = 41) demonstrated low level technostress, 33.0% (n = 173) exhibited moderate level technostress, 36.9% (n = 208) demonstrated high level technostress, and 15.2% (n = 80) were very high-level technostress. A mean score of m = 3.85 (SD = 0.68, range: 3.14–4.68), presenting clear evidence of a moderate prevalence of technostress among the students.

3.2. Relationship between Technology-Induced Stress and Selected Sociodemographic Factors among University Students

Independent samples t-test technique was employed to establish the variation between technostress and selected sociodemographic parameters (age, gender, academic level, experience with ICT, and the number of devices owned) of the sampled students (see Table 8).
Concerning gender, technostress was statistically significant among males (m = 3.8; SD = 0.59) and females (m = 4.1; SD = 0.57), with males experiencing less technostress than females (p  <  0.001). Females recorded higher technology-induced stress in the techno-uncertainty (t: 3.471, p  <  0.001) and techno-complexity (t:5.421, p  <  0.001) out of the five technostress factors. The median-split method was used to categorise students’ ages (continuous variable) into two age categories (0–20 and above 20 years). The results illustrated a significant difference between students in the 0–20-year category (m = 3.1; SD = 0.55) and above 20 years category (m = 3.5; SD = 0.55). The student in the above 20 years category endured significantly higher technology-induced stress than students in the 0–20 years category (p <  0.001). Additionally, the above 20 years category experienced a higher level of techno-overload (t: 2.143, p <  0.001) and techno-invasion (t: 3.051, p < 0.01) factors.
Comparatively, technology-induced stress among undergraduates and postgraduate students illustrated that postgraduates experienced higher technostress than undergraduates (p < 0.0). Additionally, postgraduates endured higher technostress in techno-overload (t: 5.191, p < 0.001), and techno-complexity (t: 3.413, p < 0.001). The results showed a significant difference between students with 0–10 years’ experience and students with above 10 years of experience regarding the experience with ICT (p < 0.05). Students with low ICT experience endured more significant technology-induced stress concerning techno-insecurity (t: 3.291, p < 0.001) and techno-complexity (t: 2.948, p < 0.001). There is a statistically significant difference between technostress and the number of devices a student owned. Moreover, out of the five technostress factors, students who owned more than one device experienced higher technology-induced stress in techno-overload (t: 3.719, p < 0.001) and techno-invasion (t: 5.241, p < 0.001).

3.3. Relationship between Variables of Interest and Sociodemographic Variables

Bivariate correlations between the constructs and the sociodemographic variables are presented in Table 9. The technostress score was significantly related to technology dependence (r = 0.35, p < 0.001), and to computer self-efficacy (r = 0.17, p < 0.001). As illustrated in Table 10, significant positive correlations existed between technostress and the student’s academic productivity (r = −0.29, p < 0.001), and the student’s academic achievement (r = −0.43, p < 0.001). A significant positive correlation existed between age and technostress (r = 0.231, p < 0.001), while no significant effect existed on academic levels and gender.

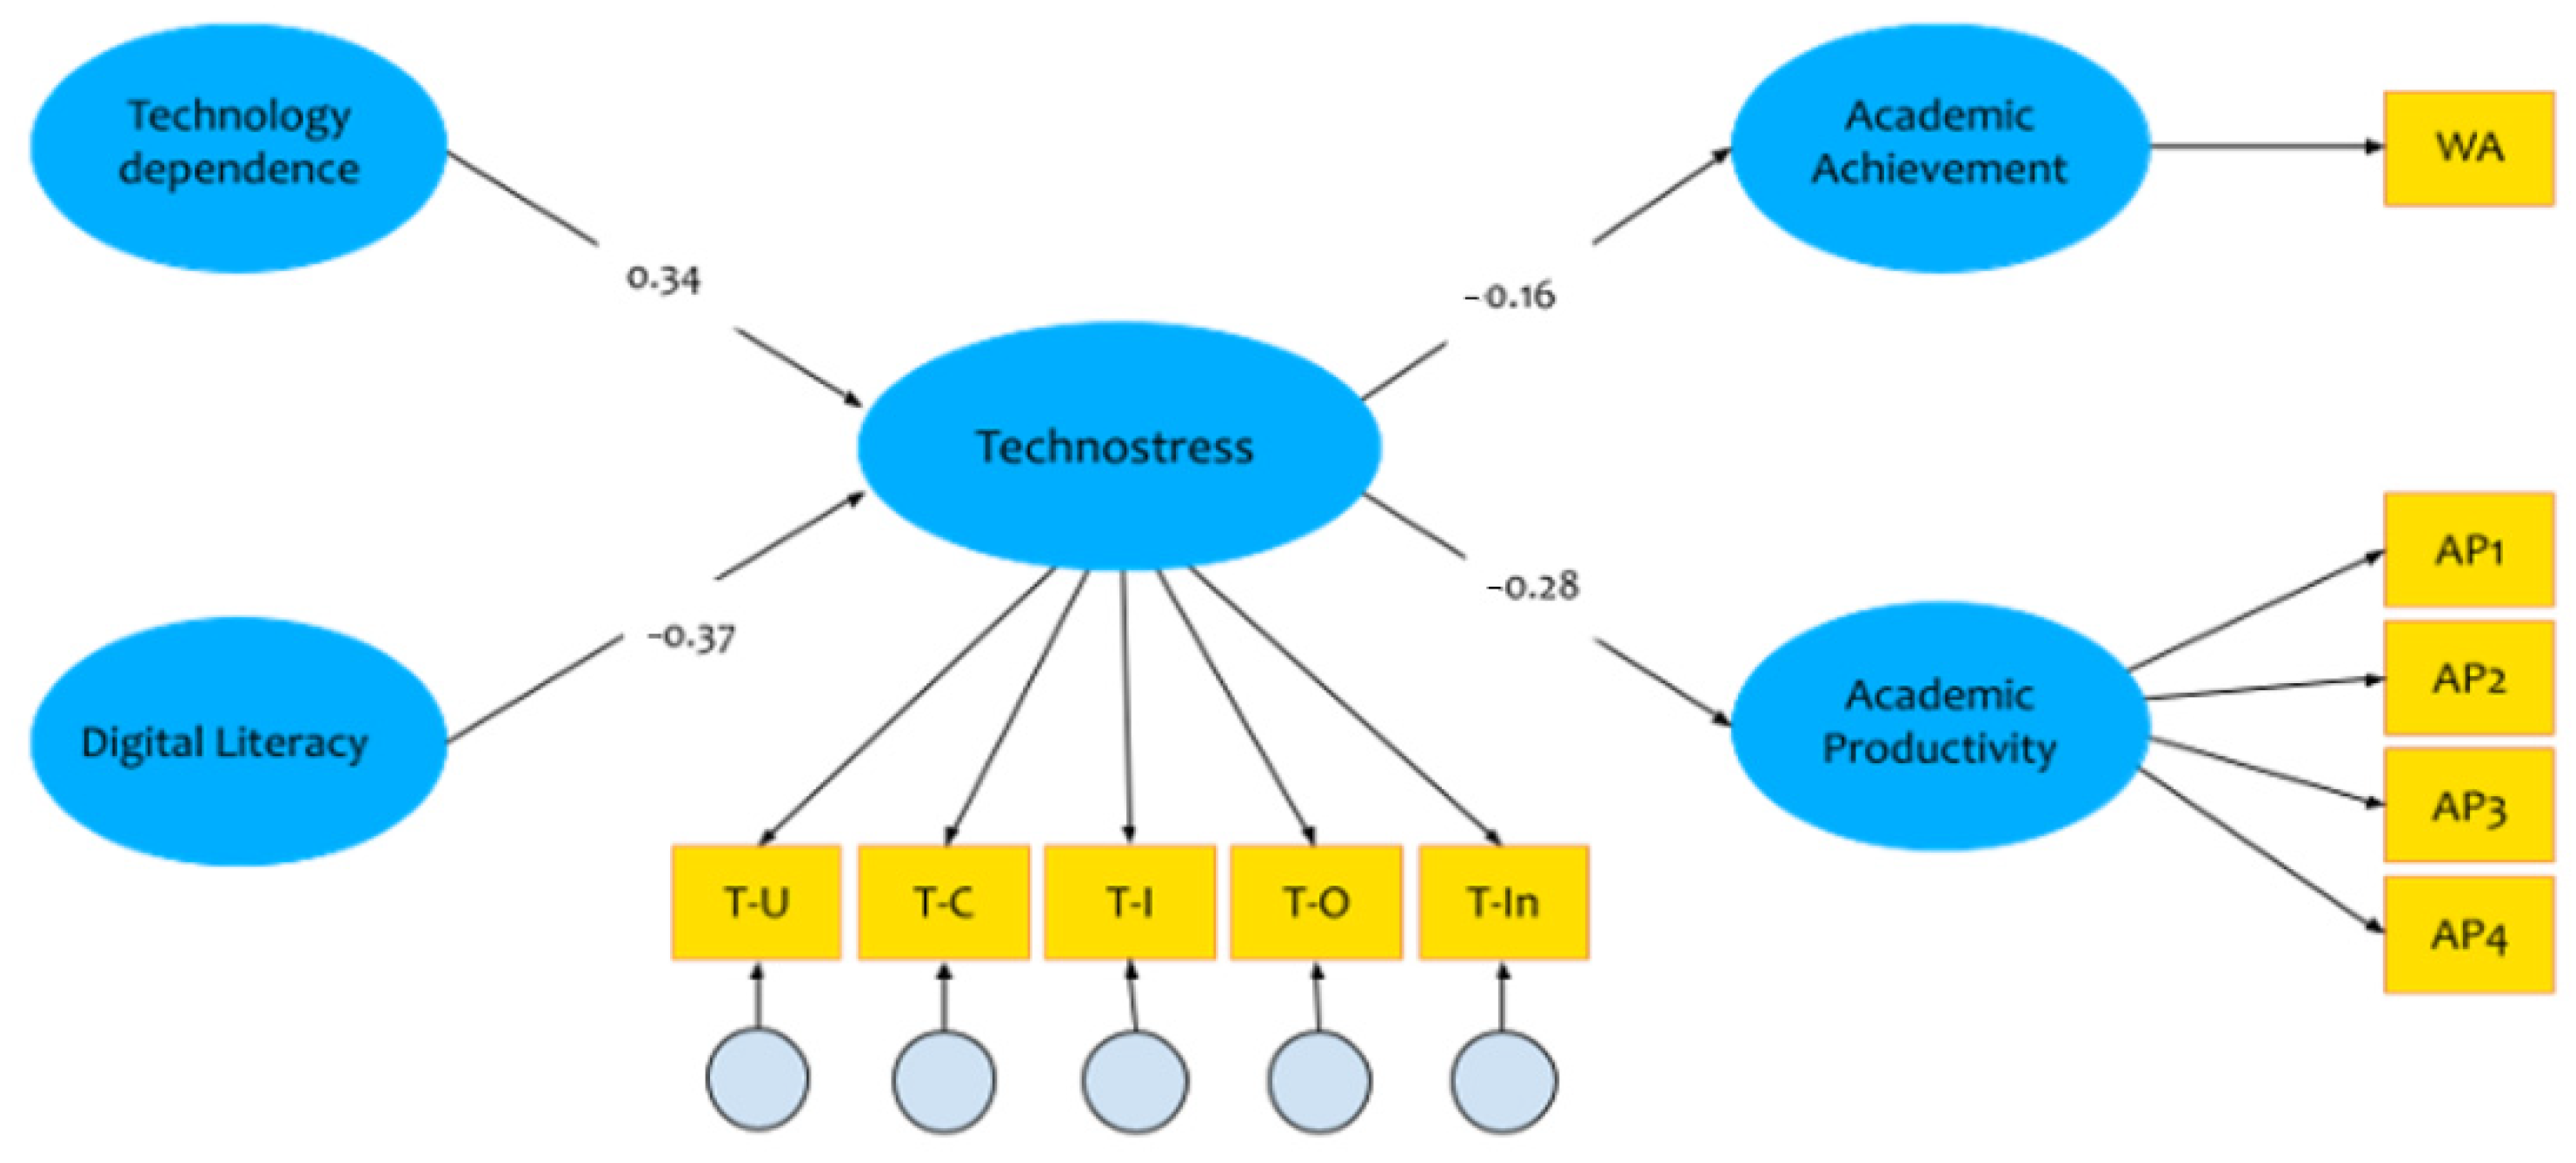
3.4. Measurement and Structural Models

The study involved CFA using Jamovi version 1.6.15 (Solid) and R with the Lavaan package to analyze the measurement model’s reliability and validity [61,62,63,64]. We found that discriminant validity, which the inter-construct correlations indicate, is often present as most measures do not transcend the limit of 0.8 [65]. All the average variance extracted (AVE) scores transcend the minimum threshold coefficient of 0.5, indicating that each construct is unique or meets the suggested convergent validity criteria [66,67,68]. The square roots of the AVE coefficients were also larger than the inter construct correlations, indicating satisfactory divergent validity [69].
The hypotheses are estimated with structural equation modelling in Jamovi and the R lavaan package. The hypotheses converge on the direct associations among variables in the structural model (see Figure 1).
The researchers also focus on three other models to make sure that this approach was a good fit. Firstly, direct paths from technology dependence to academic achievement and academic productivity included in model 1. Model 2 involved direct paths from digital literacy to academic achievement and academic productivity. The third model consisted of all the paths from the two initial conceptual models. Notwithstanding, the last model, which does not involve direct paths from technology dependence or digital literacy to academic achievement and academic productivity, compared with the other three models, offered a better model fit index (see Table 11).
The measurement model demonstrates that all items loaded significantly on each latent construct and that each internal consistency score (Cronbach’s alpha) passes the minimum limit of α = 0.7, illustrating high reliability [65,70,71]. The model fit statistics for the final measurement model are the chi-square ratio to degrees of freedom (1.23), adjusted goodness of fit index (0.89), the goodness of fit index (0.91), the comparative fit index (0.96), Tucker Lewis index (0.95), and root mean square error of approximation (0.04). These estimates demonstrate a good model fit, and the indices were observed to be within adequate cutoff criteria. Additionally, there is statistical significance among all the path coefficients. The results infer that technology dependence has a significant positive effect on technostress (β = 0.34, ρ < 0.01). Inversely, digital literacy seems to have a statistically significant negative effect on technostress (β = −0.37, ρ < 0.05). However, technostress seems to support the two endogenous variables. The results revealed an inverse effect of technostress on student academic achievement (β = −0.16; p < 0.01). Technostress has a statistically significant inverse influence on academic productivity (β = −0.28; p < 0.01). Hence, H3 and H4 are supported.

4. Discussion

The COVID-19 pandemic halted in-person classroom didactics and coerced educational institutions to adopt a comprehensive continuum of technology-enhanced learning strategies as an alternative approach to reduce the spread of the infection, which is not well explained [3]. Most universities adopted emergency remote teaching, which exposed students to using ICTs to complete educational activities. With the propensity of ICTs to increase the stress levels of students’ technology-enhanced learning, this study, therefore, aimed: to demonstrate the prevalence of technostress among student in the light of selected sociodemographic predictors and to explore the influence of technology dependence and digital literacy on technostress, and to estimate the impacts of technostress on academic achievement and academic productivity. A structural equation modelling was utilised to contextualise the association between these latent constructs.
The results in Table 6 explain further aspects of technostress in the present study. We compared the five levels of technostress against sociodemographic parameters (gender, age, academic levels, and experience with ICT use). Concerning gender, females experience more technostress than males. Our finding concurs with prior studies [16,20], although it contradicts other studies [21]. Regarding age groups, the finding demonstrates that older students (above 20 years) experienced higher levels of technostress than younger students (20 years and less). This finding is consistent with prior studies [16], which discovered similar results. The present study showed that postgraduate students experienced higher technology-induced stress than undergraduate students. This finding is consonant with prior research and theory [16], which attribute this finding to the academic workload experienced by postgraduates. Upadhyaya [16] also argues that techno-overload is one dimension of technostress mainly experienced by older and postgraduate students. We also anticipate there may be diverse bases for this result. The finding also demonstrates that students with many years of ICT experience show higher technology-induced stress than those with fewer years of ICT experience. This finding is consonant with prior investigations conducted by Upadhyaya [16] and Ragu-Nathan et al. [21]. Students who have many years of experience with ICT depend mainly on technologies that enhance their learning [60].
We observed several implications in the present study. First, the study backs up the idea that technology dependence contributes to technology-induced stress. The findings illustrate that dependence on ICTs, introduced as a result of the emergency remote teaching, may increase technostress. This finding is consonant with prior studies [36]. Technology dependence refers to how users rely on technology to perform specific functions or solve a problem [35]. However, Shu et al. [36] inferred that the high technology dependence level fosters introducing innovative digital technologies (hardware and software applications). Engagement with digital technologies leads to technology dependence, which is explained as psychological dependence on working with technology. Notwithstanding, such engagement requires students to acquire new experiences required for academic activities. As students get engaged with technology, they rely on that technology’s immersed status [35]. As a result, students may experience more technology uncertainty and complexity. Additionally, students battling with techno-uncertainty and techno-complexity during routine academic activity may also experience techno-overload. The obtained results confirmed the first hypothesis of the study.
Second, digital literacy also contributes negatively to technostress (considering the five factors of technostress). The structural model results indicate that when students’ digital literacy is high, they experience reduced technology-induced stress. We can, therefore, infer that advancing digital literacy can lessen technostress caused by technology’s complexity and insecurity significantly. Though there are no quantitative studies correlating technostress with students’ digital literacy, the deduction for lessening technostress when digital literacy is high may be due to student’s familiarity with ubiquitous ICTs, they use to enhance their learning. Students with higher digital literacy have substantial confidence to use ICTs to complete a specific academic task. This kind of reliance drives students to surmount the complexities of ICTs and a sense of academic insecurity [36]. Digital literacy requires understanding the utilisation of information technology to discover information and experience it productively; however, a positive strategy for universities will be to give adequate opportunities to advance digital literacy capability [38]. The frequently asked questions, well-defined instructions and user guides are effective channels that universities can adopt to advance digital literacy capability [37,38]. In this context, the second hypothesis of the study is also confirmed.
As expected, technostress had a significant negative relationship with academic achievement. This finding implies that technostress impairs the students’ academic achievement. Our finding is in line with studies [47], which concentrated on the inverse effect or outgrowth of technostress on individuals, in our case, students’ academic performance and productivity. Concerning technostress’s distinct dimensions, techno-complexity and techno-invasion are the two dimensions of technostress accounting for poor academic achievement (WA). The finding also implies that students’ poor academic achievement, as a result of technostress, stems from circumstances in which the ICTs used to enhance learning are too complicated to grasp. The presence of technostress can impair students’ academic achievement. Universities should collaborate to develop moderately manageable functions in learning applications, avoid presenting too many activities, and compelling students to utilise applications to achieve optimal technology-enhanced learning and have a balanced lifestyle [16,20]. The above-mentioned results confirm the third hypothesis of the study.
Lastly, our study also found an inverse effect of technostress on students’ academic productivity. This study is consistent with earlier studies’ conclusions [16,24,45,47], confirming the fourth hypothesis of the study. Similar to academic achievement, two dimensions of technostress that had impact on productivity include techno-complexity and techno-invasion. The study also found that techno-uncertainty had an inverse effect on productivity. One of the most shared goals for using ICTs in students’ technology-enhanced learning is to increase academic productivity. According to this study results, lower technostress leads to increased productivity [45]. The implication is that inability to control the effects of technology-induced stress will mitigate gains in academic productivity.

5. Conclusions, Limitations and Further Study

In conclusion, the present study adds to the existing knowledge of technostress by expanding study on this subject to the undergraduate students’ technology-enhanced learning in higher education during the COVID-19 pandemic in Ghana. The study found that the technostress prevalence among university students was moderate, particularly with female students. It also found that both technology dependence and technology characteristics had a positive impact on technostress. The study also discovered that technostress has an inverse effect on academic achievement and academic productivity. The findings show that students’ failure to reduce technology-induced stress can counteract predicted academic achievement gains and academic productivity. Altogether, these findings are essential in understanding the different ‘levers’ for sustaining successful technology-enhanced learning.
Our results are not without limitations, as found in other theoretical, empirical, and academic studies:
  • This study was a cross-sectional survey; in the future, longitudinal studies are required to validate causal relationships among these factors across time.
  • The sample comprised students in a public university selected using a convenience sample process and was not significantly representative of the Ghanaian general university population. Prospective studies that employ nationwide representative samples of students from public and private universities are needed to confirm the results detailed here.
  • Further studies adopting methods such as diary studies and in-depth qualitative interviews on students’ technostress experiences are recommended, as self-reported data used may be influenced by memory recall, social desirability, and other general bias practices.
Notwithstanding these limitations, this study adds to the technostress research by authenticating its associations with technology dependence, technology characteristics, and digital literacy. Further studies correlating with university students’ technostress in the brick-and-mortar classroom, especially during traditional times, and emergency remote teaching will be an innovative study area. Finally, in future studies, online facilitators’ roles and leadership styles and students’ learning style and self-efficacy should be considered by researchers.

Author Contributions

Conceptualization, H.B.E. and A.T.-M.; methodology, H.B.E., D.V. and A.T.-M.; formal analysis, H.B.E., E.E.J. and D.V.; resources, A.T.-M., H.B.E. and D.V.; data curation, H.B.E., A.T.-M., E.E.J. and A.K.E.; writing—original draft preparation, H.B.E. and A.T.-M.; writing—review and editing, D.V.; supervision, D.V.; project administration, H.B.E., A.T.-M., E.E.J. and A.K.E. All authors have read and agreed to the published version of the manuscript.

Funding

This research received no external funding.

Institutional Review Board Statement

The study was conducted according to the guidelines of the Declaration of Helsinki, and approved by the Humanities and Social Sciences Ethics Committee (HuSSRECC) of Kwame Nkrumah University of Science and Technology. Approval No. 233/11-9/2020 (10 September 2020).

Informed Consent Statement

Informed consent was obtained from all subjects involved in the study.

Data Availability Statement

The data presented in this study are available on request from the corresponding author. The data are not publicly available due to identity protection/confidentiality reasons.

Conflicts of Interest

The authors declare no conflict of interest.

References

  1. Molino, M.; Ingusci, E.; Signore, F.; Manuti, A.; Giancaspro, M.L.; Russo, V.; Zito, M.; Cortese, C.G. Wellbeing Costs of Technology Use during Covid-19 Remote Working: An Investigation Using the Italian Translation of the Technostress Creators Scale. Sustainability 2020, 12, 5911. [Google Scholar] [CrossRef]
  2. Mohmmed, A.O.; Khidhir, B.A.; Nazeer, A.; Vijayan, V.J. Emergency remote teaching during Coronavirus pandemic: The current trend and future directive at Middle East College Oman. Innov. Infrastruct. Solut. 2020, 5, 1–11. [Google Scholar] [CrossRef]
  3. Hodges, C.; Moore, S.; Lockee, B.; Trust, T.; Bond, A. The Difference between Emergency Remote Teaching and Online Learning. EDUCAUSE Review. 2020. Available online: https://er.educause.edu/articles/2020/3/the-difference-between-emergency-remote-teaching-andonline-learning (accessed on 17 October 2021).
  4. Abilleira, M.P.; Rodicio-García, M.-L.; Deus, M.P.R.-D.; Mosquera-González, M.J. Technostress in Spanish University Teachers during the COVID-19 Pandemic. Front. Psychol. 2021, 12, 496. [Google Scholar] [CrossRef]
  5. Vlachopoulos, D.; Sangrà, A.; Cabrera, N. The Conceptual Framework of e-Learning: A View from Inside. Int. J. Learn. Annu. Rev. 2012, 18, 93–104. [Google Scholar] [CrossRef]
  6. Aguliera, E.; Nightengale-Lee, B. Emergency remote teaching across urban and rural contexts: Perspectives on educational equity. Inf. Learn. Sci. 2020, 121, 471–478. [Google Scholar] [CrossRef]
  7. Essel, H.B.; Vlachopoulos, D.; Adom, D.; Tachie-Menson, A. Transforming higher education in Ghana in times of disruption: Flexible learning in rural communities with high latency internet connectivity. J. Enterprising Communities 2021, 15, 296–312. [Google Scholar] [CrossRef]
  8. Henderson, M.; Selwyn, N.; Aston, R. What works and why? Student perceptions of ‘useful’ digital technology in university teaching and learning. Stud. High. Educ. 2017, 42, 1567–1579. [Google Scholar] [CrossRef]
  9. Higgins, S.; Xiao, Z.; Katsipataki, M. The Impact of Digital Technology on Learning: A Summary for the Education Endowment Foundation; Education Endowment Foundation and Durham University: Durham, UK, 2012. [Google Scholar]
  10. Nistor, N.; Hernández-García, Á. What types of data are used in learning analytics? An overview of six cases. Comput. Hum. Behav. 2018, 89, 335–338. [Google Scholar] [CrossRef]
  11. Cho, M.-H.; Byun, M.-K. Nonnative English-Speaking Students’ Lived Learning Experiences with MOOCs in a Regular College Classroom. Int. Rev. Res. Open Distrib. Learn. 2017, 18, 173–190. [Google Scholar] [CrossRef] [Green Version]
  12. McGuinness, N.; Vlachopoulos, D. Student Experiences of Using Online Material to Support Success in A-Level Economics. Int. J. Emerg. Technol. Learn. 2019, 14, 80–109. [Google Scholar] [CrossRef]
  13. Barbuto, A.; Gilliland, A.; Peebles, R.; Rossi, N.; Shrout, T. Telecommuting: Smarter Workplaces. 2020. Available online: http://hdl.handle.net/1811/91648 (accessed on 20 October 2021).
  14. Thulin, E.; Vilhelmson, B.; Johansson, M. New Telework, Time Pressure, and Time Use Control in Everyday Life. Sustainability 2019, 11, 3067. [Google Scholar] [CrossRef] [Green Version]
  15. Wang, X.; Tan, S.C.; Li, L. Measuring university students’ technostress in technology-enhanced learning: Scale development and validation. Australas. J. Educ. Technol. 2020, 36, 96–112. [Google Scholar] [CrossRef]
  16. Pallavi Upadhyaya, V. Impact of technostress on academic productivity of university students. Educ. Inf. Technol. 2021, 26, 1647–1664. [Google Scholar] [CrossRef]
  17. Vlachopoulos, D.; Makri, A. Quality Teaching in Online Higher Education: The Perspectives of 250 Online Tutors on Technology and Pedagogy. Int. J. Emerg. Technol. Learn. 2021, 16, 40–56. [Google Scholar] [CrossRef]
  18. Mirzajani, H.; Mahmud, R.; Ayub, A.F.M.; Wong, S.L. Teachers’ acceptance of ICT and its integration in the classroom. Qual. Assur. Educ. 2016, 24, 26–40. [Google Scholar] [CrossRef]
  19. Vahedi, Z.; Zannella, L.; Want, S.C. Students’ use of information and communication technologies in the classroom: Uses, restriction, and integration. Act. Learn. High. Educ. 2019, 22, 215–228. [Google Scholar] [CrossRef]
  20. Qi, C. A double-edged sword? Exploring the impact of students’ academic usage of mobile devices on technostress and academic performance. Behav. Inf. Technol. 2019, 38, 1337–1354. [Google Scholar] [CrossRef]
  21. Ragu-Nathan, T.S.; Tarafdar, M.; Ragu-Nathan, B.S.; Tu, Q. The Consequences of Technostress for End Users in Organizations: Conceptual Development and Empirical Validation. Inf. Syst. Res. 2008, 19, 417–433. [Google Scholar] [CrossRef] [Green Version]
  22. Korunka, C.; Zauchner, S.; Weiss, A. New Information Technologies, Job Profiles, and External Workload as Predictors of Subjectively Experienced Stress and Dissatisfaction at Work. Int. J. Hum. Comput. Interact. 1997, 9, 407–424. [Google Scholar] [CrossRef]
  23. Jung, I. Improving Online Collaborative Learning: Strategies to Mitigate Stress. Procedia Soc. Behav. Sci. 2013, 93, 322–325. [Google Scholar] [CrossRef] [Green Version]
  24. Lee, S.B.; Lee, S.C.; Suh, Y.H. Technostress from mobile communication and its impact on quality of life and productivity. Total Qual. Manag. Bus. Excell. 2016, 27, 775–790. [Google Scholar] [CrossRef]
  25. Salanova, M. Trabajando con tecnologías y afrontando el tecnoestrés: El rol de las creencias de eficacia. Rev. Psicol. Trab. Organ. 2003, 19, 225–246. [Google Scholar]
  26. Abilleira, M.P.; Rodicio-García, M.L.; Ríos-De-Deus, M.P.; Mosquera-González, M.J. Technostress in Spanish University Students: Validation of a Measurement Scale. Front. Psychol. 2020, 11, 582317. [Google Scholar] [CrossRef]
  27. Jena, R.K. Technostress in ICT enabled collaborative learning environment: An empirical study among Indian academician. Comput. Hum. Behav. 2015, 51, 1116–1123. [Google Scholar] [CrossRef]
  28. Fischer, T.; Riedl, R. Technostress research: A nurturing ground for measurement pluralism? Commun. Assoc. Inf. Syst. 2017, 40, 375–401. [Google Scholar] [CrossRef]
  29. Srivastava, S.C.; Chandra, S.; Shirish, A. Technostress creators and job outcomes: Theorising the moderating influence of personality traits. Inf. Syst. J. 2015, 25, 355–401. [Google Scholar] [CrossRef]
  30. Galluch, P.; Grover, V.; Thatcher, J. Interrupting the workplace: Examining stressors in an information technology context. J. Assoc. Inf. Syst. 2015, 16, 1–47. [Google Scholar] [CrossRef]
  31. Marchiori, D.M.; Mainardes, E.W.; Gouveia Rodrigues, R. Do individual characteristics influence they types of technostress reported by workers? Int. J. Hum. Comput. Interact. 2019, 35, 218–230. [Google Scholar] [CrossRef]
  32. Özgür, H. Relationships between teachers’ technostress, technological pedagogical content knowledge (TPACK), school support and demographic variables: A structural equation modeling. Comput. Hum. Behav. 2020, 112, 106468. [Google Scholar] [CrossRef]
  33. Davies, G. Online MCQ Assessment Anxiety Amongst First Year Undergraduate Psychology Students: A Case Study. J. Perspect. Appl. Acad. Pract. 2015, 3, 84–89. [Google Scholar]
  34. Korzh, R.; Peleshchyshyn, A.; Syerov, Y.; Fedushko, S. Principles of University’s Information Image Protection from Aggression. In Proceedings of the 2016 XIth International Scientific and Technical Conference Computer Sciences and Information Technologies (CSIT), Lviv, Ukrain, 6–10 September 2016; pp. 77–79. [Google Scholar] [CrossRef]
  35. Fan, L.; Liu, X.; Wang, B.; Wang, L. Interactivity, engagement, and technology dependence: Understanding users’ technology utilisation behaviour. Behav. Inf. Technol. 2016, 36, 113–124. [Google Scholar] [CrossRef]
  36. Shu, Q.; Tu, Q.; Wang, K. The Impact of Computer Self-Efficacy and Technology Dependence on Computer-Related Technostress: A Social Cognitive Theory Perspective. Int. J. Hum. Comput. Interact. 2011, 27, 923–939. [Google Scholar] [CrossRef]
  37. Ng, W. Can we teach digital natives digital literacy? Comput. Educ. 2012, 59, 1065–1078. [Google Scholar] [CrossRef]
  38. Prior, D.D.; Mazanov, J.; Meacheam, D.; Heaslip, G.; Hanson, J. Attitude, digital literacy and self efficacy: Flow-on effects for online learning behavior. Internet High. Educ. 2016, 29, 91–97. [Google Scholar] [CrossRef]
  39. Martin, A.; Grudziecki, J. DigEuLit: Concepts and Tools for Digital Literacy Development. Innov. Teach. Learn. Inf. Comput. Sci. 2006, 5, 249–267. [Google Scholar] [CrossRef]
  40. Van Laar, E.; Van Deursen, A.J.A.M.; Van Dijk, J.A.G.M.; De Haan, J. The relation between 21st-century skills and digital skills: A systematic literature review. Comput. Hum. Behav. 2017, 72, 577–588. [Google Scholar] [CrossRef]
  41. Castellví, J.; Díez-Bedmar, M.-C.; Santisteban, A. Pre-Service Teachers’ Critical Digital Literacy Skills and Attitudes to Address Social Problems. Soc. Sci. 2020, 9, 134. [Google Scholar] [CrossRef]
  42. Voogt, J.; Roblin, N.P. A comparative analysis of international frameworks for 21st century competences: Implications for national curriculum policies. J. Curric. Stud. 2012, 44, 299–321. [Google Scholar] [CrossRef] [Green Version]
  43. Knutsson, O.; Blåsjö, M.; Hållsten, S.; Karlström, P. Identifying different registers of digital literacy in virtual learning environments. Internet High. Educ. 2012, 15, 237–246. [Google Scholar] [CrossRef]
  44. DiMaria-Ghalili, R.A.; Ostrow, L.; Rodney, K. Webcasting: A new instructional technology in distance graduate nursing education. J. Nurs. Educ. 2005, 44, 11–18. [Google Scholar] [CrossRef]
  45. Tarafdar, M.; Tu, Q.; Ragu-Nathan, B.S.; Ragu-Nathan, T.S. The Impact of Technostress on Role Stress and Productivity. J. Manag. Inf. Syst. 2007, 24, 301–328. [Google Scholar] [CrossRef]
  46. Suharti, L.; Susanto, A. The impact of workload and technology competence on technostress and performance of employees. Indian J. Commer. Manag. Stud. 2014, 5, 1. [Google Scholar]
  47. Ayyagari, R.; Grover, V.; Purvis, R. Technostress: Technological Antecedents and Implications. MIS Q. 2011, 35, 831–858. [Google Scholar] [CrossRef] [Green Version]
  48. Tarafdar, M.; Pullins, E.B.; Ragu-Nathan, T.S. Technostress: Negative effect on performance and possible mitigations. Inf. Syst. J. 2015, 25, 103–132. [Google Scholar] [CrossRef] [Green Version]
  49. Anderson, N.; Ones, D.S.; Sinangil, H.K. Handbook of Industrial, Work & Organizational Psychology: Volume 1: Personnel Psychology; Viswesvaran, C., Ed.; Sage: London, UK, 2001. [Google Scholar]
  50. Cooper, C.L.; Cooper, C.P.; Dewe, P.J.; Dewe, P.J.; O’Driscoll, M.P.; O’Driscoll, M.P. Organizational Stress: A Review and Critique of Theory, Research, and Applications; Sage: London, UK, 2001. [Google Scholar]
  51. Joo, Y.J.; Lim, K.Y.; Kim, N.H. The effects of secondary teachers’ technostress on the intention to use technology in South Korea. Comput. Educ. 2016, 95, 114–122. [Google Scholar] [CrossRef]
  52. Torkzadeh, G.; Doll, W. The development of a tool for measuring the perceived impact of information technology on work. Omega 1999, 27, 327–339. [Google Scholar] [CrossRef]
  53. Alam, M. Techno-stress and productivity: Survey evidence from the aviation industry. J. Air Transp. Manag. 2016, 50, 62–70. [Google Scholar] [CrossRef]
  54. Mohammed, S.; Essel, H.B. Motivational factors for blood donation, potential barriers, and knowledge about blood donation in first-time and repeat blood donors. BMC Hematol. 2018, 20, 18–36. [Google Scholar] [CrossRef] [Green Version]
  55. Ahmad, U.N.U. Technostress and Organisational Commitment among Librarians in the Malaysian Public Higher Learning Institutions; Universiti Teknologi Malaysia: Johor Bahru, Malaysia, 2011. [Google Scholar]
  56. Rabiu, H.; Muhammed, A.I.; Umaru, Y.; Ahmed, H.T. Impact of Mobile Phone Usage on Academic Performance among Secondary School Students in Taraba State, Nigeria. Eur. Sci. J. 2016, 12, 1857–1881. [Google Scholar] [CrossRef]
  57. Morris, N.P. Podcasts and Mobile Assessment Enhance Student Learning Experience and Academic Performance. Biosci. Educ. 2010, 16, 1–7. [Google Scholar] [CrossRef]
  58. Hoffman, D.L.; Novak, T.P.; Venkatesh, A. Has the Internet become indispensable? Commun. ACM 2004, 47, 37–42. [Google Scholar] [CrossRef]
  59. McCune, J.C. Technology dependence. Manag. Rev. 1999, 88, 10. [Google Scholar]
  60. Essel, H.B.; Nunoo, F.K.N.; Tachie-Menson, A.; Amankwa, J.O. Higher Education Students’ Ownership and Usage of Smart Phones and Tablets: The Case of Kwame Nkrumah University of Science and Technology (KNUST). Int. J. Educ. Technol. 2018, 5, 20–28. [Google Scholar]
  61. The Jamovi Project. Available online: https://www.jamovi.org (accessed on 20 October 2021).
  62. Rosseel, Y.; Oberski, D.L.; Byrnes, J.; Vanbrabant, L.; Savalei, V.; Merkle, E.; Barendse, M. Lavaan: Latent Variable Analysis. [R Package]. Available online: https://cran.r-project.org/package=lavaan (accessed on 20 October 2021).
  63. Kline, R.B. Principles and Practice of Structural Equation Modeling; Guilford Press: New York, NY, USA, 2011. [Google Scholar]
  64. Byrne, B.M. Structural Equation Modeling with Amos: Basic Concepts, Applications, and Programming, 2nd ed.; Taylor and Francis Group: New York, NY, USA, 2010. [Google Scholar]
  65. Fornell, C.; Larcker, D.F. Evaluating structural equation models with unobservable variables and measurement error. J. Mark. Res. 1981, 18, 39–50. [Google Scholar] [CrossRef]
  66. Denis, D.J. Univariate, Bivariate, and Multivariate Statistics Using R: Quantitative Tools for Data Analysis and Data Science; John Wiley & Sons: New York, NY, USA, 2020. [Google Scholar]
  67. Murtagh, F.; Heck, A. Multivariate Data Analysis; Springer Science & Business Media: Berlin, Germany, 2012. [Google Scholar]
  68. Hair, J.F.; Black, W.C.; Babin, B.J.; Anderson, R.E.; Tatham, R. Multivariate Data Analysis; Pearson Prentice Hall: Uppersaddle River, NJ, USA, 2006. [Google Scholar]
  69. Sánchez-Franco, M.J.; Roldán, J.L. Web acceptance and usage model: A comparison between goal-directed and experiential Web users. Internet Res. 2005, 15, 21–48. [Google Scholar] [CrossRef]
  70. Raykov, T.; Marcoulides, G.A. Introduction to Psychometric Theory; Routledge: London, UK, 2011. [Google Scholar]
  71. Van der Maas, H.L.J.; Molenaar, D.; Maris, G.; Kievit, R.A.; Borsboom, D. Cognitive psychology meets psychometric theory: On the relation between process models for decision making and latent variable models for individual differences. Psychol. Rev. 2011, 118, 339–356. [Google Scholar] [CrossRef] [Green Version]
Figure 1. Structural model.
Information 12 00497 g001
Table 1. The subfactors of the TSC-Q scale, and corresponding number of items.
NumberFactor CodeNumber of Indicators
1Techno-overloadTSCQ_OV15
2Techno-invasionTSCQ_IV24
3Techno-complexityTSCQ_CM35
4Techno-insecurityTSCQ_IN45
5Techno-uncertaintyTSCQ_UN54
Total 22
TSC-Q = Technostress Creator Questionnaire.
Table 2. The 5-grade average score scale.
NumberAverage (Mean)Technostress Prevalence (Level)
11.0–2.19Very Low
22.20–3.39Low
33.40–4.59Moderate
44.60–5.79High
55.80–7.0Very High
Table 3. Sociodemographic profiles of the participants (n = 525).
Variables MSDf (%)
GenderMale 230 (43.8)
Female 295 (56.2)
Age 21.22.5
Residential statusOff-Campus 310 (59.1)
On-Campus 215 (40.9)
Academic levelUndergraduate 335 (63.8)
Postgraduate 190 (36.2)
Marital statusMarried 79 (15.1)
Single 369 (70.2)
Divorced 7 (1.3)
In a relationship 70 (13.4)
Experience with ICT0–10 years 348 (66.3)
Above 10 years 177 (33.7)
Number of devices owned1 248 (47.3)
>2 277 (52.7)
Active internet serviceYes 501 (95.4)
No 24 (5.6)
Does sleep/rest hours affect you?Yes 323 (61.5)
No 202 (38.5)
Ownership of data package Yes 342 (65.1)
No 183 (34.9)
Having work beside their studiesNo 298 (56.8)
Regular 90 (17.2)
Irregular 137 (26.0)
Subjective economic statusGood 139 (26.4)
Managing 207 (39.5)
Poor 179 (34.1)
M = mean; SD = Standard Deviation; f = Frequencys.
Table 4. The span of technology usage (Years) (n = 525).
0–1 Year,
n (%)
2–3 Years,
n (%)
4–5 Years,
n (%)
6 and More Years, n (%)
Devices
Desktops28 (5.3)123 (23.5)219 (41.7)155 (29.5)
Laptops37 (7.1)101 (19.2)274 (52.1)113 (21.6)
Tablets54 (10.3)135 (25.7)209 (39.9)127 (24.1)
Mobile phones6 (1.2)63 (11.9)387 (73.8)69 (13.1)
n = sample.
Table 5. Recurrent use of technology (Hours) (n = 525).
0–1 h,
n (%)
2–3 h,
n (%)
4–5 h,
n (%)
6 and More Hours, n (%)
Technologies
Internet18 (3.4)53 (10.0)280 (53.3)174 (33.3)
Games21 (4.0)77 (14.7)317 (60.4)110 (20.9)
Social media2 (0.3)64 (12.2)356 (67.9)103 (19.6)
Computers14 (2.6)74 (14.1)395 (75.3)42 (8.0)
h = hour (s); n = sample.
Table 6. Aim and daily recurrent of technology use (Hours) (n = 525).
0–1 h, n (%)2–3 h, n (%)4–5 h, n (%)h ≥ 6, n (%)
Activities
Web surfing106 (20.2) 317 (60.3) 92 (17.6) 10 (1.9)
Online shopping190 (36.2)289 (55.1) 37 (7.0)9 (1.7)
Internet banking264 (50.3) 236 (44.9) 21 (4.1) 4 (0.7)
Selfies and sharing photos160 (30.4) 285 (54.2) 62 (11.9)18 (3.5)
Watching videos21 (4.0) 203 (38.6)213 (40.7) 88 (16.7)
Education23 (4.3) 274 (52.2) 158 (30.1) 70 (13.4)
Gaming19 (3.6) 254 (48.3) 201 (38.3) 51 (9.8)
Video calling46 (8.7) 413 (78.7) 48 (9.2) 18 (3.4)
Messaging (SMS/online)100 (19.1)321 (61.1)95 (18.1) 9 (1.7)
Social media44 (8.3) 213 (40.5) 203 (38.8) 65 (12.4)
E-mail166 (31.7)298 (56.7) 54 (10.2) 7 (1.4)
h = hour (s); n = sample.
Table 7. Descriptive statistics of technostress levels with factors.
Levels of Technostress
FactorVery Low
m (SD)
Low
m (SD)
Moderate
m (SD)
High
m (SD)
Very High
m (SD)
Techno-overload 3.91 (0.71)
Techno-invasion 4.68 (0.55)
Techno-uncertainty 3.88 (0.78)
Techno-complexity 3.27 (0.59)
Techno-insecurity 4.26 (0.75)
m = mean; SD = Standard deviation.
Table 8. Technostress levels and selected sociodemographic parameters.
VariablesCategoriesScore m (SD)t-Test/f Testp-Value
GenderMale3.8 (0.59)3.4370.004 **
Female4.1 (0.57)
Age
Below 20 years old3.1 (0.55)2.1430.001 ***
Above 20 years old3.5 (0.55)
Academic levelUndergraduate3.1 (0.54)2.1600.001 ***
Postgraduate3.12 (0.55)
Experience with ICT (in years)0–10 years3.21 (0.53)3.8720.041 *
Above 10 years3.10 (0.53)
Number of devices owned13.23 (0.54)
>23.08 (0.53)3.4270.031 *
m = mean; SD = Standard Deviation; f = Frequency. * p < 0.05 ** p < 0.01 *** p < 0.001.
Table 9. Bivariate Correlations matrix.
Variable12345678
1. Technostress
2. Academic achievement−0.43 **
3. Academic productivity−0.29 **0.34
4. Digital literacy0.17 *0.040.14
5. Technology dependence0.35 **0.070.480.24 **
6. Gender0.0350.170.12−0.190.04
7. Age0.232 **0.050.020.220.25 *0.01
8. Academic level−0.0590.03−0.090.190.15−0.04−0.06
NB. * p < 0.05, ** p < 0.01.
Table 10. Analysis of structural equation modelling results.
Estimates
Standardised Estimate (β) and Significance
Technostress← Technology dependence0.34 ***
Technostress← Digital literacy−0.37 ***
Academic achievement← Technostress−0.16 ***
Academic productivity← Technostress−0.28 ***
Techno-overload← Technostress0.76 ***
Techno-invasion← Technostress0.68 ***
Techno-complexity← Technostress0.69 ***
Techno-insecurity← Technostress0.42 ***
Techno-uncertainty← Technostress0.66 ***
WA← Academic achievement0.74 ***
AP1← Academic productivity0.84 ***
AP2← Academic productivity0.93 ***
AP3← Academic productivity0.80 ***
AP4← Academic productivity0.87 ***
*** p < 0.001.
Table 11. Model Fit.
Model Fit
χ2dfΧ2/dfAGFIGFICFITFINFIIFIRMSEA
Model425.623471.230.890.910.960.950.900.960.04
NB: AGFI = adjusted goodness of fit; GFI = goodness of fit; CFI = comparative fit index; TFI: technology fit index; NFI = normed fit index; IFI = incremental fit index; RMSEA = root mean square error of approximation.
Publisher’s Note: MDPI stays neutral with regard to jurisdictional claims in published maps and institutional affiliations.

