Article

P2P Botnet Detection Based on Nodes Correlation by the Mahalanobis Distance

Institute of Information and Navigation, Air Force Engineering University, Xi’an 710077, China
*
Author to whom correspondence should be addressed.
Information 2019, 10(5), 160; https://doi.org/10.3390/info10050160
Submission received: 7 February 2019 / Revised: 7 April 2019 / Accepted: 9 April 2019 / Published: 1 May 2019
(This article belongs to the Section Information and Communications Technology)

Abstract

:
Botnets are a common and serious threat to the Internet. The search for the infected nodes of a P2P botnet is affected by the number of commonly connected nodes, with a lower detection accuracy rate for cases with fewer commonly connected nodes. However, this paper calculates the Mahalanobis distance—which can express correlations between data—between indirectly connected nodes through traffic with commonly connected nodes, and establishes a relationship evaluation model among nodes. An iterative algorithm is used to obtain the correlation coefficient between the nodes, and the threshold is set to detect P2P botnets. The experimental results show that this method can effectively detect P2P botnets with an accuracy of >85% when the correlation coefficient is high, even in cases with fewer commonly connected nodes.

1. Introduction

1.1. Background and Motivation

The Internet has developed into a technology that is present in people’s daily lives, and consequently, the safety of the Internet is an important issue. Distributed denial of service (DDoS) [1] attacks can seriously damage large-scale network hubs and pose great threats to the operation of networks and the privacy of users’ information. A botnet can be thought of as the army that launches the DDoS attacks and is a necessary condition for them to occur. Therefore, botnet detection has become a key part of the defense against such attacks. However, the distributed and decentralized characteristics of peer-to-peer (P2P) botnets make their detection very difficult, and although many researchers have achieved good results in this field, botnet developers update their networks to evade detection. Therefore, botnet detection is still an important research field [2].
At present, researchers are carrying out relevant research into the detection of novel P2P botnets. In the early stages of research, researchers used signature mechanisms to detect P2P botnets [3]. However, this could not accurately detect cases with random or encrypted ports, or the signature mechanisms of the zombie host. Later, many researchers turned to P2P botnet behavior detection. However, because botnets have been evolving, behavior detection cannot be always effective. To achieve more in-depth analysis of botnet data, researchers began to detect P2P botnets through machine learning methods [4], mainly via intrusion detection or anomaly detection, Lin et al. [5] proposed a novel data-mining method to overcome the various difficulties in detecting P2P botnets, but infected nodes may not be detected using such methods. Kalaivani and Suguna [6] designed a system to identify botnets in a P2P network using a security principle called data provenance integrity. The main technological contributions that are proposed in this project are the, model and operations of cryptographic provenance verification in a host-based security setting. Host-based principle can ensure host security.
It is difficult to detect a complete P2P botnet, because this topology is harder to be disrupted because each infected host behaves at the same time as server and client, meaning that the loss of one host in the topology does not affect the entire botnet. Thus, the detection of other botnet nodes in the botnet with the nose as the center is a problem to be solved.
Based on the distributed characteristics of P2P botnets, infected nodes need to share information. The authors in [7] found other infected nodes through their connections with other nodes. However, when a P2P botnet takes the initiative to reduce the number of commonly connected nodes, the method in [7] is not capable of detection. This paper attempts to replace the number of commonly connected nodes with the Mahalanobis distance. In contrast to the commonly connected nodes method, the Mahalanobis distance can calculate the correlation between two points and improve the model to detect infected nodes, even when the number of commonly connected nodes is reduced.

1.2. Contributions

The major contributions of this work can be classified into three categories:
1. This paper proposes the Mahalanobis distance model to express correlations between data, which is a first of its kind study of detecting the P2P botnet, solves the problem of nodes relation expression while the P2P botnet deliberately reduces the commonly connected nodes. The model uses the first packet sizes of the traffic with commonly connected nodes to calculate the Mahalanobis distance. The Mahalanobis distance not affected by dimension, which can express correlations between data more effectively, not related to the measurement unit of the original data.
2. We establish a relationship evaluation model among nodes, unlike [5], we simplify the calculation of the correlation coefficient, use the nodes distance instead of the number of nodes, give play to the characteristics of Mahalanobis distance advantage. Using the iterative algorithm to obtain the correlation coefficient between the nodes.
3. Through ROC curve analysis, the influence of various model methods on the detection performance is discussed. The experimental results show that this method can effectively detect P2P botnets with an accuracy of >85% when the correlation coefficient is high, even in cases with fewer commonly connected nodes.

2. Related Work

The most critical component of a botnet is the so-called command-and-control infrastructure (C&C), consisting of the bots and a control entity that can be either centralized or decentralized. The C&C infrastructure typically serves as the only way to control bots within the botnet and is necessary for maintaining a stable connection within this infrastructure to operate efficiently. In general, botnets may be classified as centralized or decentralized [8,9,10,11].
The centralized command was employed by early botnets while control (C&C) has been applied for the distribution of commands and has been updated to individual bots, generally by HTTP or IRC protocols [12]. Even though it is easy and simple to manage a centralized structure, it suffers from a single failure point and shoulders the susceptibility to the conventional defenses, for example blacklisting, DNS redirection, domain revocation, etc. Thus, P2P architecture has been started to be used by the botmasters for the C&C channels. For the P2P botnets, every bot is applied as both a client and a server, permitting botmasters for the publishing of the commands and the updating of the botnet’s any point [13,14].
Beigi et al. [15] conducted a selection of the characteristics for the detection of the botnets through C4.5 machine learning algorithm and a greedy algorithm, which is called a stepwise algorithm. The datasets being applied actually have been collected from three various agencies: the Malware Capture Facility Project, ISCX, and ISOT. Various experiments have been performed by them, where the characteristics have been divided into 4 categories, based on their behavior, time, package, and bytes. The outcomes of the final set of characteristics demonstrated the detection rate larger 90% in a dataset with a limited number of botnets. According to another experiment containing some botnets for the phase training a greater diversity of the botnets’ test, there was 75% detection rate. According to the study of Huseynov et al. [16], a comparison is made between the ant colony system algorithm K-means algorithm for detection decentralized botnets.
All the schemes above have been designed for the detection of either the particular botnet, which they have been trained for the centralized botnets.
Generally, the network’s P2P bots’ detection is difficult. There are some methods for the detection of botnets and bots, though there are some traditional techniques being comparatively effective botnets, even though many conventional skills have been comparatively less effective being botnets with centralized C&C mechanism is replaced by peer-to-peer (P2P) botnets, which pose difficulty for detection.
Su el al. [17] offered a comprehensively great survey of DDoS and SDNA attacks being included SDN technology for management of network, even though the mechanism of P2P botnet identification was not applied as the concentration of the study. According to [18], Gu et al. figured out the BotSniffer for the detection of the bots based on the spatio-temporal relationships between commands’ bot responses. Meanwhile, according to [19], Narang et al. established PeerShark, through which the hosts were clustered via the network by protocol-oblivious and port-oblivious characteristics. To conclude, the disadvantage of the approach is that members of various botnets generally fall into the same cluster.
A lot of work has been conducted via machine learning for the identification of P2P botnets by researchers. According to paper [20], a novel hybrid mechanism for the identification of P2P botnets has been implemented and proposed by the authors through the integration of the Bayesian Regularization and Bayesian. By Bayesian Regulation, it is helpful for the network traffic through the integration of Bayesian Regularization and Neural Networks. A better generalization of the dataset has been achieved with the assistance of Bayesian Regularization and thus empowering the botnet activity detection even of those bots, which have been never used for the Neural Network training. Therefore, a framework such as this is deemed suitable for the identification of the unseen and newer botnets in the network’s live traffic.
According to paper [21], a two-tier detection scheme has been presented for the identification of the P2P botnets. The botnets have been detected through our method during the waiting phase. The search requests have been sent out to those neighboring peers very often in the network. The fact that the nodes have been connected indirectly has not been considered. According to research [22], the effectiveness of the algorithms of community detection for the detection of P2P botnets have been analyzed, particularly through partial information. They demonstrate that only around half of the nodes can use this approach, with only a slight increase of the detection errors. According to the research [23], various clustering algorithms have been experimented and tested while their accuracy has been recorded through the prepared datasets. Experiments have been implemented over multiple unsupervised machine learning approaches and it has been noticed that it has not proposed the best detection effect yet.
The Mahalanobis distance method mentioned in literature [24] is a direct application of features between points and is only used as an introduction for anomaly detection. References [24,25] all use Mahalanobis distance to measure the correlation between features and filter the data, but there is no specific application analysis on the characteristics of P2P botnet, which has reference significance for the detection of botnet. In reference [26], Mahalanobis distance is used for anomaly detection, which uses the distance from the point to the center to estimate whether the point belongs to the center cluster. This method can be used in the detection of botnet anomalies, but they are different from the detection background in this paper and the problems solved are different.
Few techniques have been proposed that are able to detect local P2P bots, assuming that P2P bots exhibit similar malicious activities and similar connection patterns, and there is no application of Mahalanobis distance to detect P2P botnet using the P2P botnet communication characteristics. Returning to our problem, assuming that botnet reduces direct contact, how to use the bot node finding other nodes with the same attribute, our work is innovative and necessary.

3. Theoretical Analysis

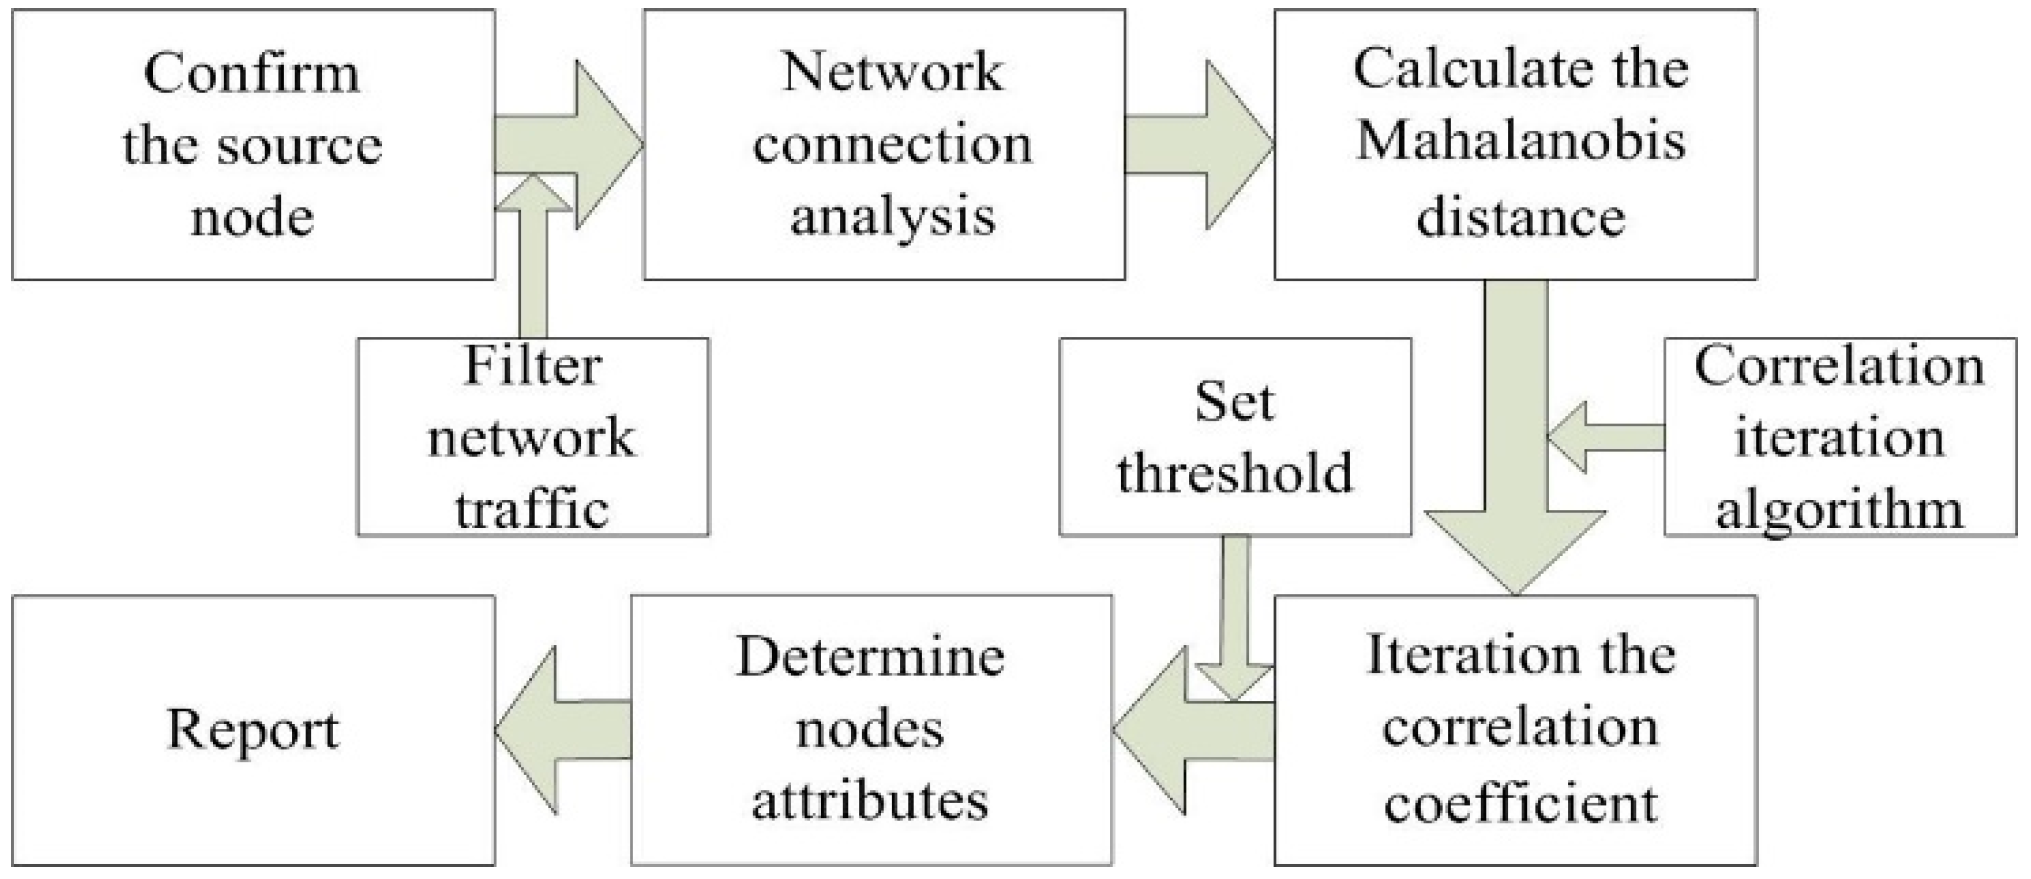
In this paper, aiming at the characteristics of P2P botnet connection, Mahalanobis distance is used to distance the connection between nodes, and an iterative algorithm is introduced to analyze the dynamic propagation of infected nodes, to expand the range of indirect connection between nodes. By determining the attributes of one node, the attributes of other nodes can be determined.
Paper [
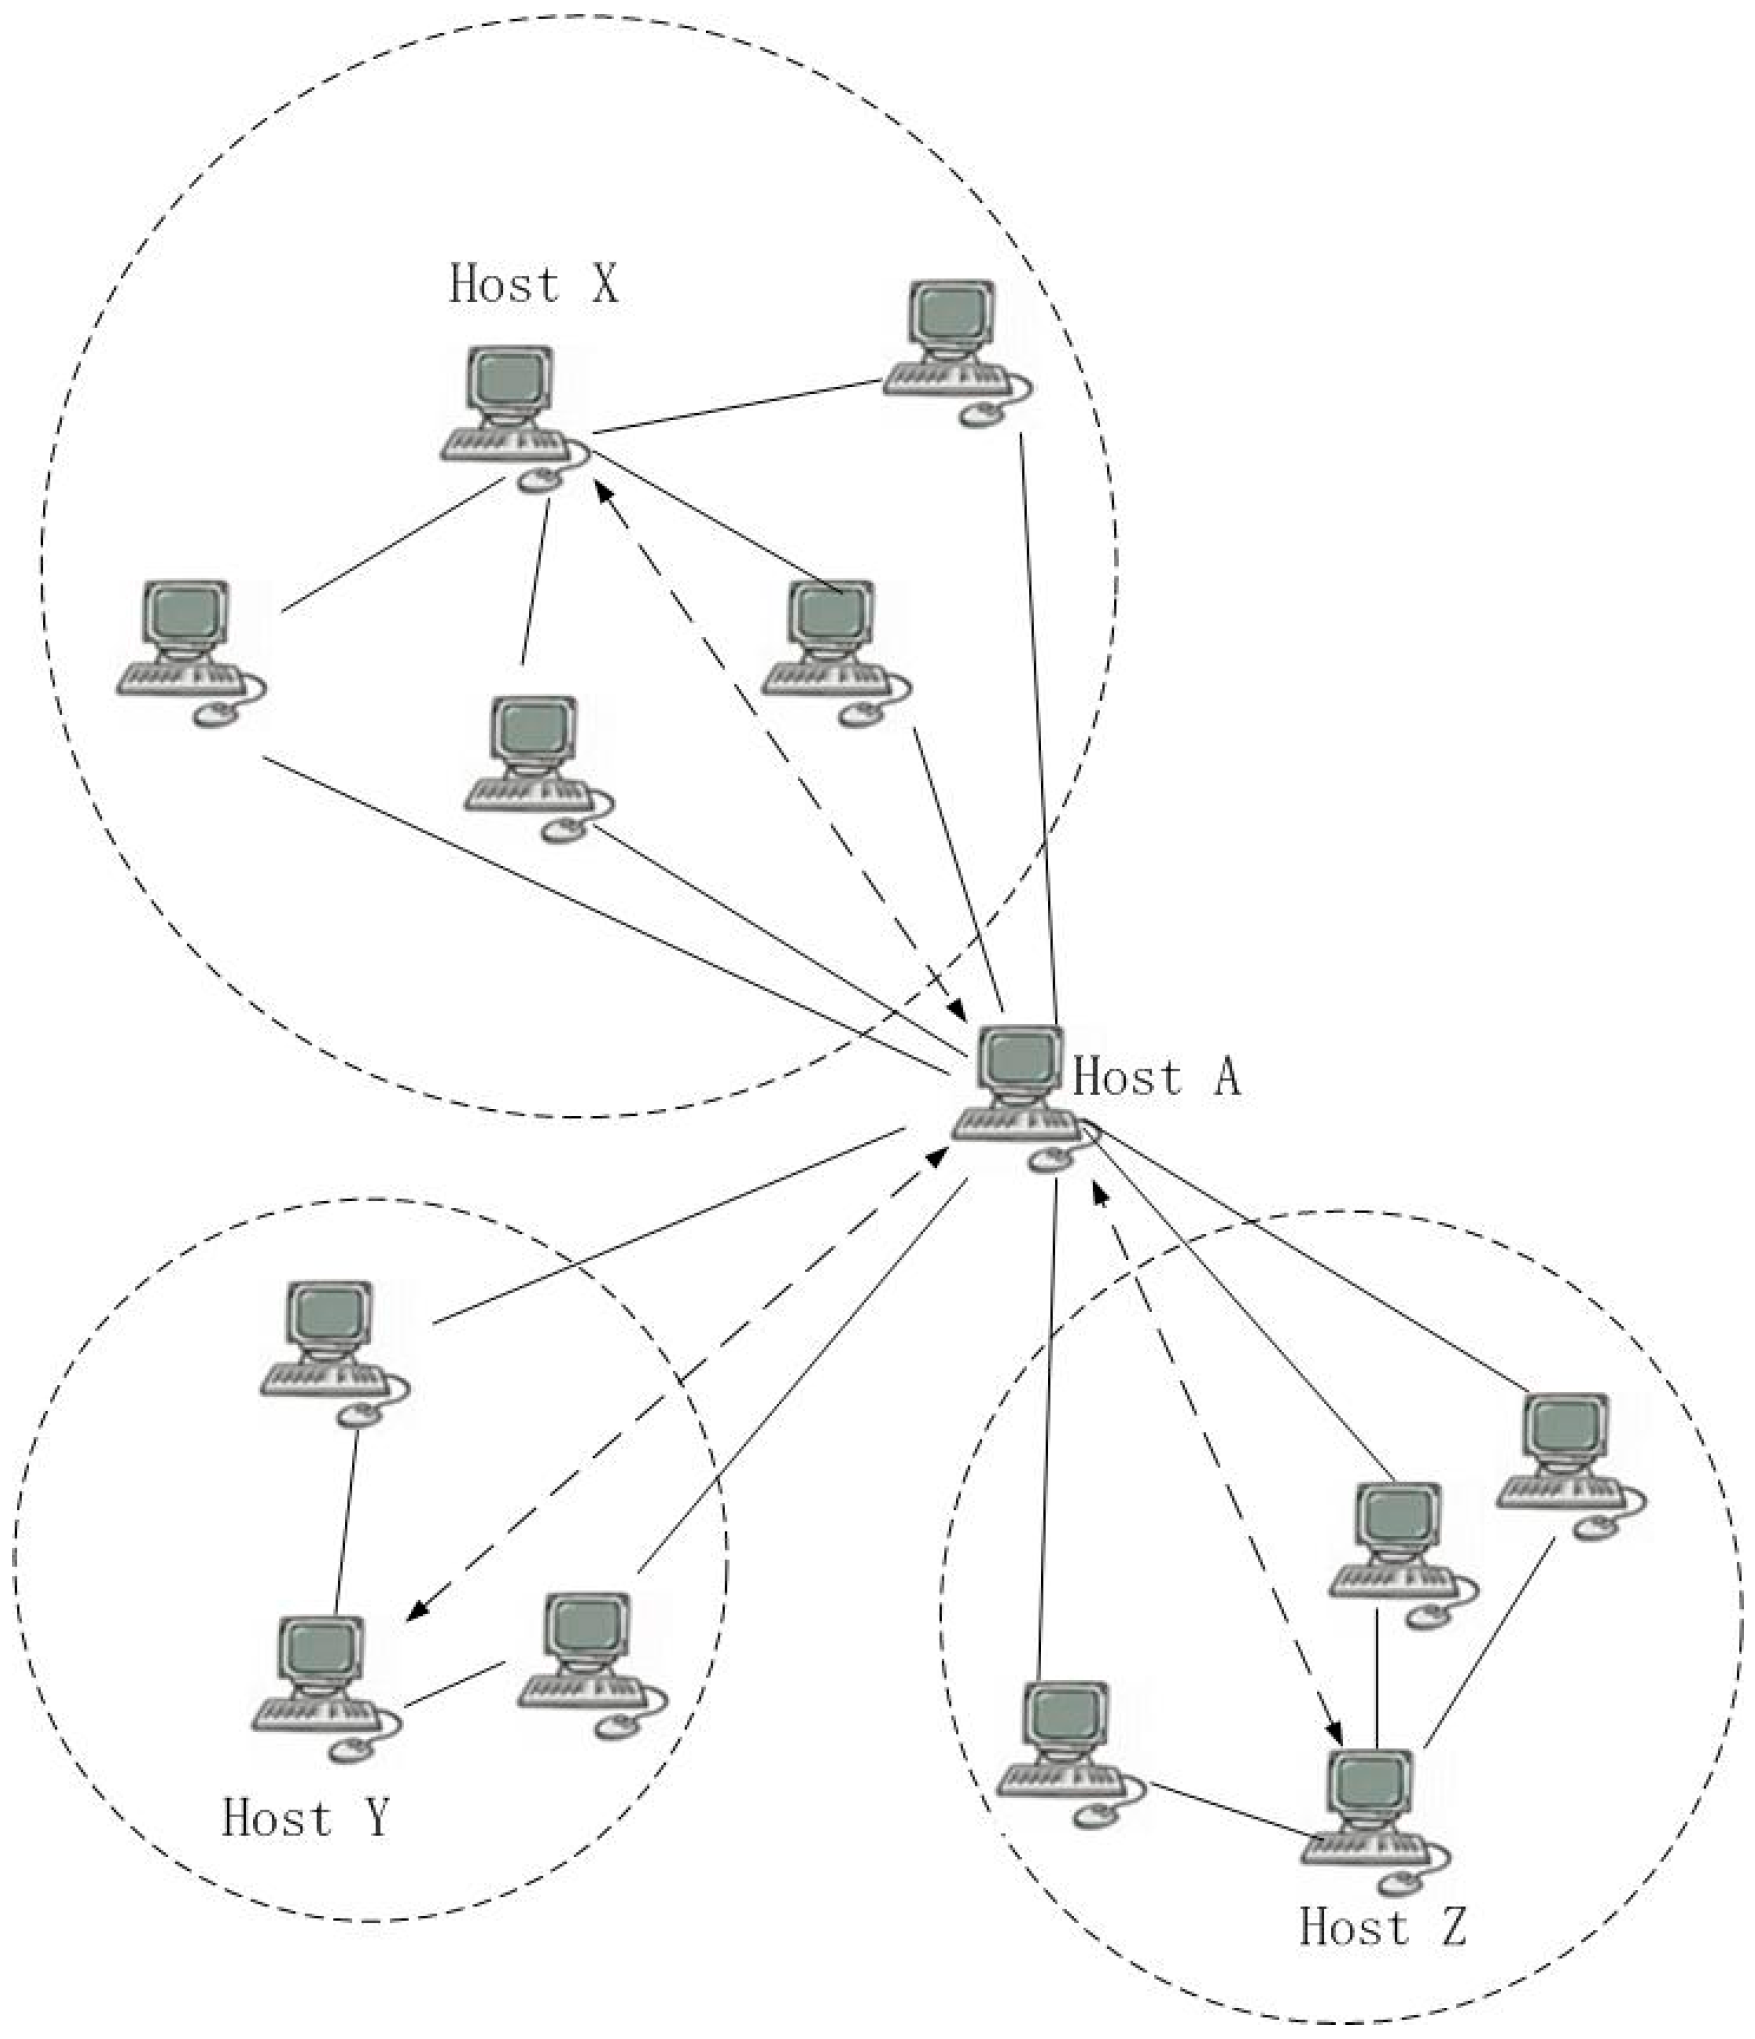
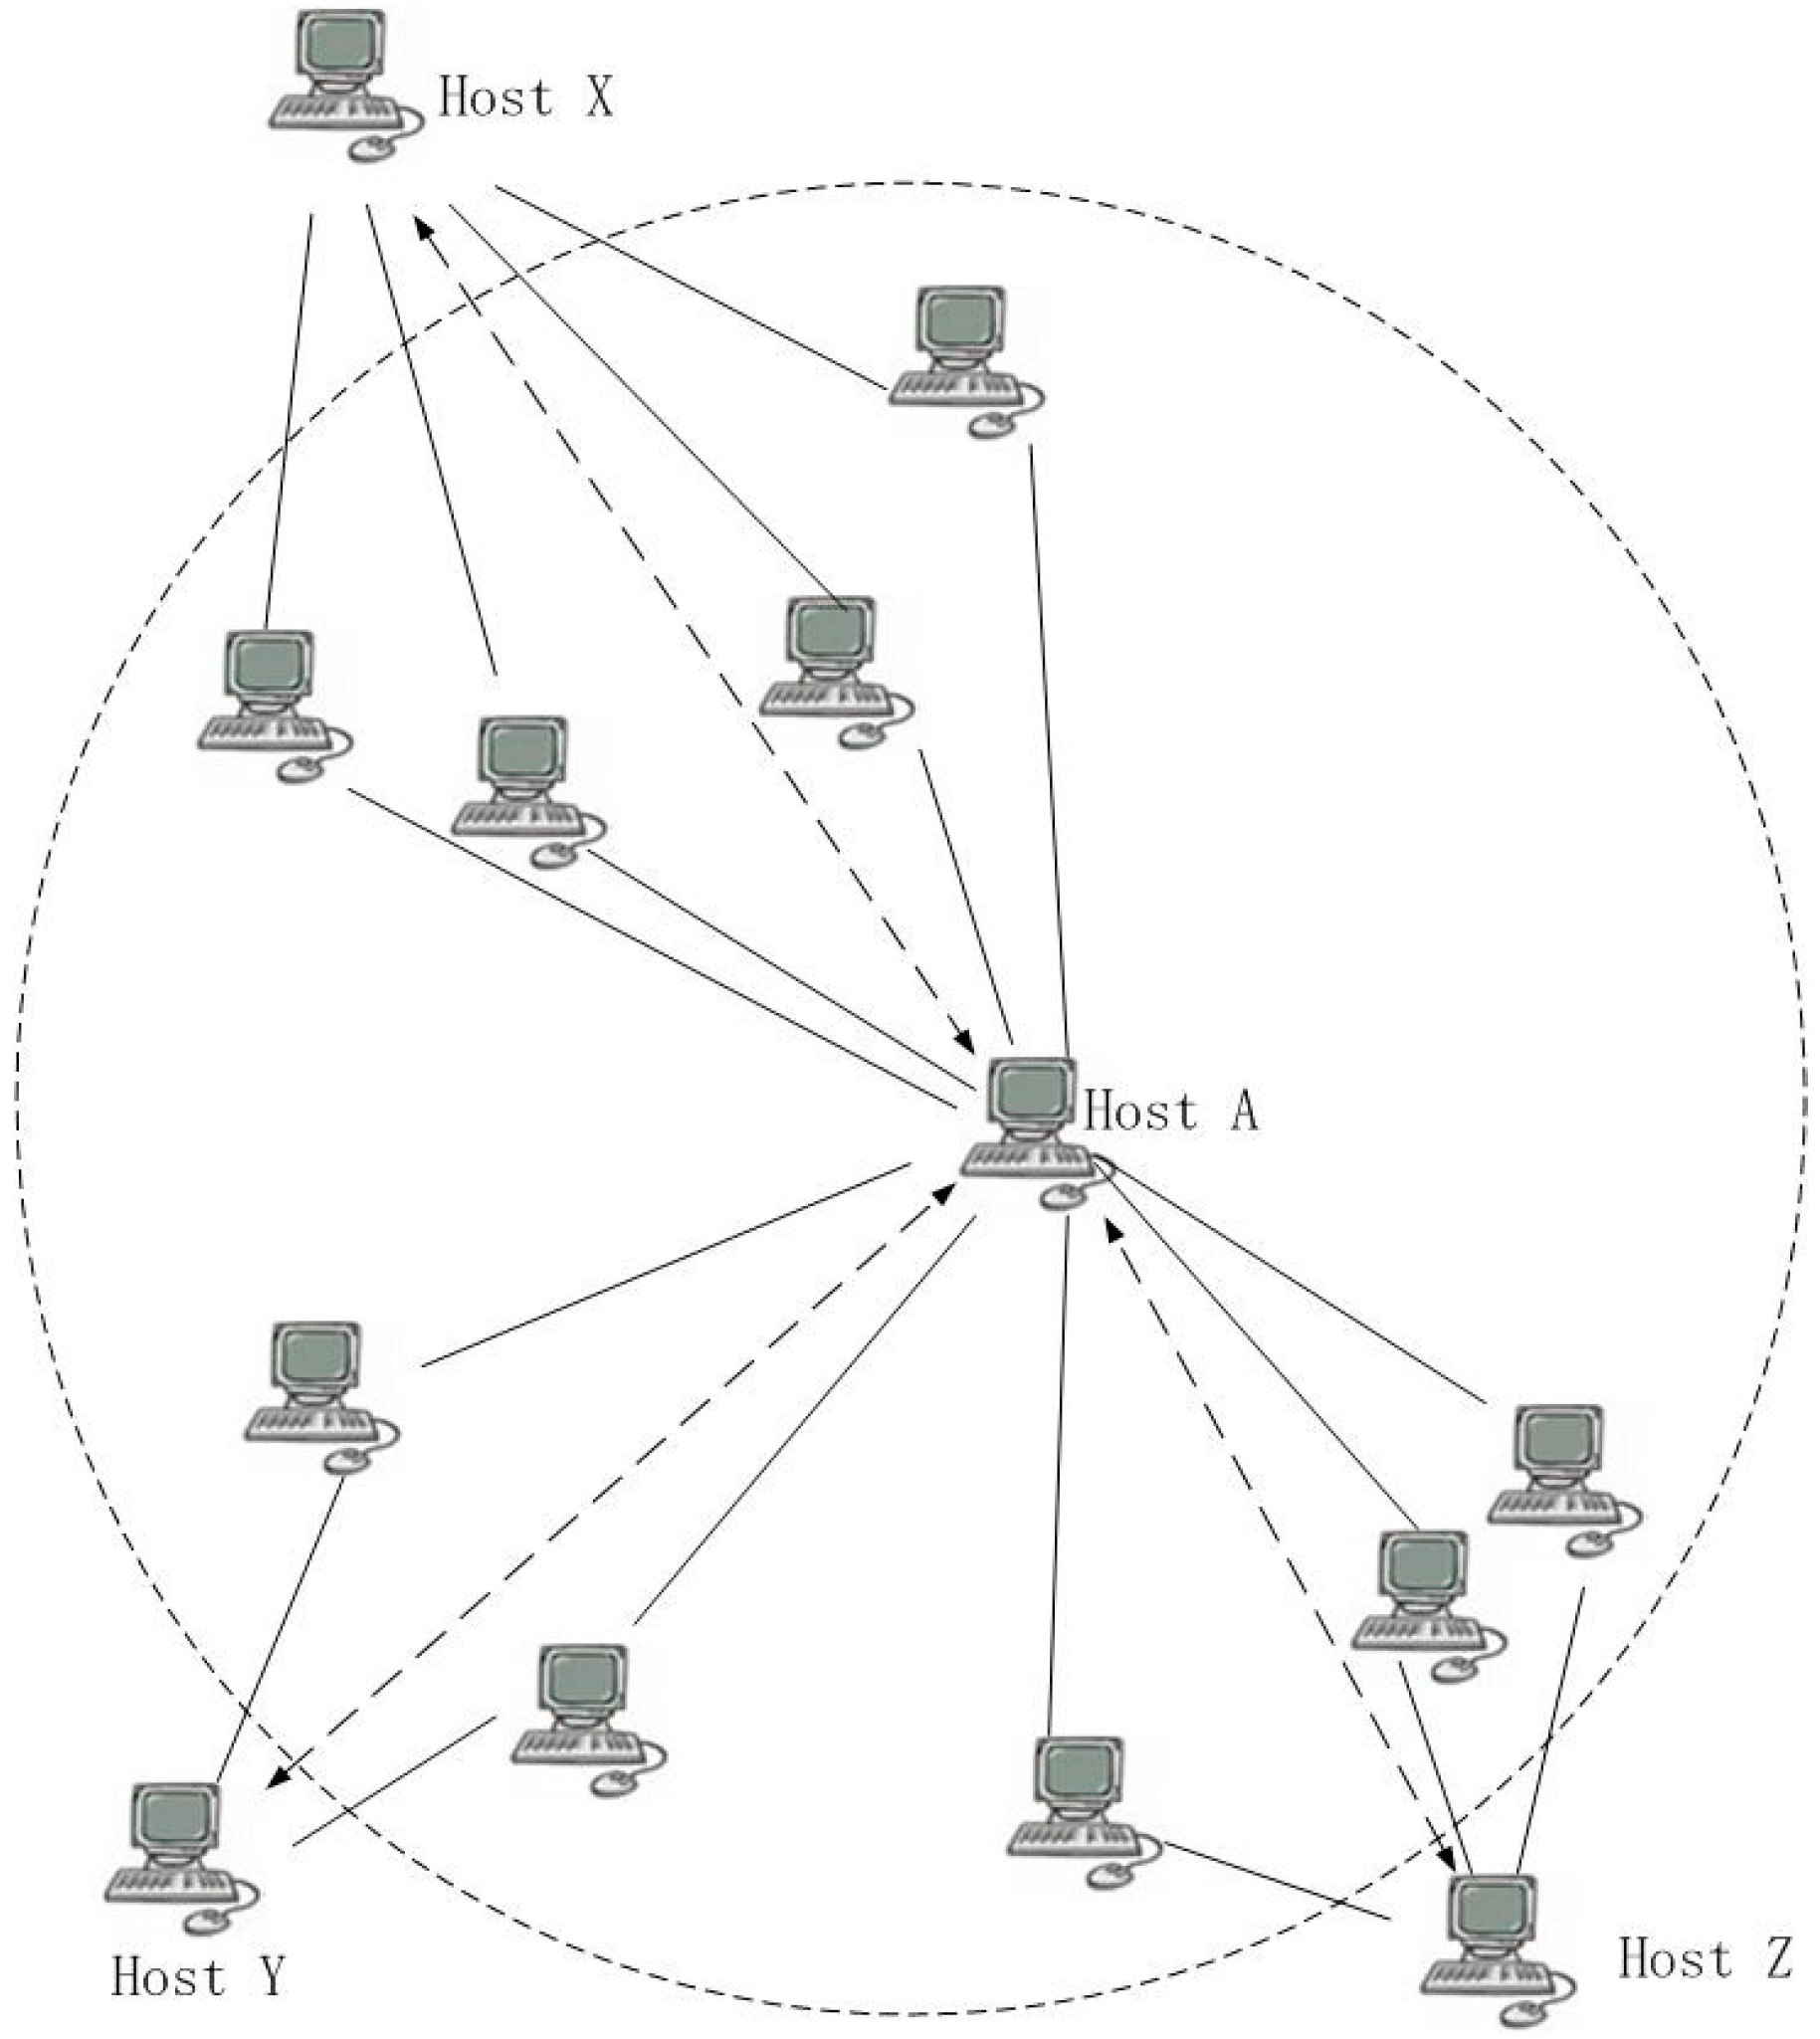
7] determined the correlation coefficient between nodes through the connected number to find the infected nodes (we called that ‘connected nodes method’)—the greater the number of commonly connected nodes, the more similar two nodes are. As shown in Figure 1, when Host A and Host B are not directly connected, but are indirectly connected through the commonly connected Host X, Host A is assumed to be a bot, and Host B may also be a bot. Other hosts are connected to Host X might also be bots. Therefore, the connection model can be assumed using the commonly connected nodes between hosts. When a host is bot, the possibility that the other host is also a bot is greater.
The most obvious feature of P2P botnets is that each node in the network is a peer and can receive the same instructions and information. When a node receives instructions, this information is connected to other nodes and cannot easily be perceived. Therefore, there are commonly connected nodes which can convey information between nodes.
The number of commonly connected nodes excludes the non-structural connection nodes of nodes and the public connected nodes related to the software. If a source node is infected, the commonly connected nodes are used to determine the correlation to find other inflected nodes. The correlations between the nodes in a bot are complex. If we analyze the connections of all the related nodes, there are many errors between nodes of the same type. The correlation coefficient can be used to identify the correlation that is most relevant to the commonly connected nodes based on the object being detecting to find the next node by connection iteration after the model is realized and to determine whether the connected nodes are infected.
When a P2P botnet deliberately reduces the commonly connected nodes in a botnet, the correlation between the hosts can be used to indicate whether the hosts have the same attributes. Thus, we needed to identify a value to express the correlations between indirectly connected nodes.
The Mahalanobis distance calculates the distance between the two variables by obtaining their degree of correlation. The data object considers the measurement by calculating the dependence on scale [27]. It is not affected by dimension, and the Mahalanobis distance between two nodes is not related to the measurement unit of the original data. The Mahalanobis distance between two nodes calculated using standardized and centralized data (i.e., the difference between the original data and the mean value) is the same.
To compute the Mahalanobis distance (MD), the variance–covariance matrix Cx is first constructed:
C x = 1 n 1 ( X c ) T ( X c )
where X is the data matrix containing n objects in the rows measured for p variables; and Xc is the column-centered data matrix ( X X ¯ ) . In the case of two variables, x1 and x2, the variance–covariance matrix is
C x = [ σ 1 2 ρ 12 σ 1 σ 2 ρ 12 σ 1 σ 2 σ 2 2 ]
where σ 1 2 and σ 2 2 are the variances of the values of, respectively, the first and second variables, and ρ 12 σ 1 σ 2 is the covariance between the two variables.
The MD for each object xi is then
M D i = ( x i x ¯ ) C x 1 ( x i x ¯ ) T
with
C x 1 = [ σ 2 2 / det ( C x ) ρ 12 σ 1 σ 2 / det ( C x ) ρ 12 σ 1 σ 2 / det ( C x ) σ 1 2 / det ( C x ) ]
where det ( C x ) = σ 1 2 σ 2 2 ( 1 ρ 12 2 ) is the determinant of the variance–covariance matrix.
For an object xi measured in two variables, x1 and x2, M D i can be rewritten, since
[ ( x 1 x ¯ ) ( x 2 x ¯ ) ] C x 1 = [ σ 2 2 ( x 1 x ¯ ) ( x 2 x ¯ ) ρ 12 σ 1 σ 2 det ( C x ) σ 1 2 ( x 2 x ¯ ) ( x 1 x ¯ ) ρ 12 σ 1 σ 2 det ( C x ) ]
and
[ ( x 1 x ¯ ) ( x 2 x ¯ ) ] C x 1 [ ( x 1 x ¯ ) ( x 2 x ¯ ) ] = [ σ 2 2 ( x 1 x ¯ ) ( x 2 x ¯ ) ρ 12 σ 1 σ 2 det ( C x ) σ 1 2 ( x 2 x ¯ ) ( x 1 x ¯ ) ρ 12 σ 1 σ 2 det ( C x ) ] [ ( x 1 x ¯ ) ( x 2 x ¯ ) ] = σ 2 2 ( x 1 x ¯ ) 2 ( x 1 x ¯ ) ( x 2 x ¯ ) ρ 12 σ 1 σ 2 det ( C x ) + σ 1 2 ( x 2 x ¯ ) 2 ( x 1 x ¯ ) ( x 2 x ¯ ) ρ 12 σ 1 σ 2 det ( C x ) = σ 2 2 ( x 1 x ¯ ) 2 ( 1 ρ 12 2 ) + σ 1 2 ( x 2 x ¯ ) 2 2 ( x 1 x ¯ ) ( x 2 x ¯ ) ρ 12 σ 1 σ 2 + σ 2 2 ( x 1 x ¯ ) ρ 12 2 σ 1 2 σ 2 2 ( 1 ρ 12 2 ) = ( x 1 x ¯ ) 2 σ 1 2 + ( x 2 x ¯ ) 2 σ 2 2 ( 1 ρ 12 2 ) 2 ( x 1 x ¯ ) ( x 2 x ¯ ) ρ 12 σ 1 2 σ 2 2 ( 1 ρ 12 2 ) + ρ 12 2 ( x 1 x ¯ ) 2 σ 1 2 ( 1 ρ 12 2 ) = ( x 1 x ¯ ) 2 σ 1 2 + ( x 2 x ¯ σ 2 1 ρ 12 2 ρ 12 ( x 1 x ¯ ) σ 1 1 ρ 12 2 ) 2
so that
M D i = ( x i 1 x ¯ 1 σ 1 ) 2 + { ( x i 2 x ¯ 2 σ 2 ) ρ 12 ( x i 1 x ¯ 1 σ 1 ) } 1 1 ρ 12 2 2 .
Through this experiment, second variable’s section has already been demonstrated through the first subtracted variable. That is to say the MD corrects for the correlations within the data.
Each cluster in the MD is a multi-dimensional Gaussian distribution with a central position and a covariance matrix describing the local data distribution. It can present the distance between the data in the following form:
mahalanobis ( x , y ) = ( x y ) 1 ( x y ) T .
This paper attempts to represent the correlation between hosts using the MD. When Host A is a bot, and the distance to Host B is used to calculate the correlation coefficient, Host B is considered to be an infected host if the correlation coefficient after the iteration is greater than the set threshold. Based on the advantages of the MD for classification, P2P botnet detection can be achieved when there are fewer commonly connected nodes.

4. The Proposed Approach

Figure 2 shows the architecture of our proposed P2P botnet detection system, which consists of 3 main components: network connection analysis, calculate the MD and iteration the correlation coefficient. Network connection analysis is responsible for filtering the network traffic related to the source node, and sorting the obtained network traffic to obtain the characteristic form of calculating the MD. Calculate the MD is responsible for calculating the MD between nodes using the connection framework in the previous part. Iteration the correlation coefficient is responsible for using the MD to calculate the correlation between the nodes through an iterative algorithm. In this paper, the data set filter is used to analyze and filter the network traffic related to the source node. In the actual network deployment, the traffic is generally monitored in the network server.

4.1. Network Connection Analysis

As shown in Figure 3, the MD can use the commonly connected node Host X as the center to determine multiple populations, calculate and compare the MD to obtain the nearest connection node, and then find the suspicious node. However, multiple botnet nodes are rarely seen on the same connection node; thus, the calculation will lead to an overall sampling imbalance. Therefore, the distance between the botnet nodes and all indirectly connected nodes should be taken as a whole, as shown in Figure 4, where the commonly connected node is used as a bridge to represent the mutual relationship between nodes i and j, and the MD is calculated by using all the traffic features with the indirect connected nodes. In this way, the nodes can be closer to each other and the threshold (THR) can be used for judgment.

4.2. Calculate the MD

For many protocols, when a node joins the network, the first packet usually follows the protocol definition, and the protocol is also followed in the following session. In reference [4], unique characteristics were detected in bot traffic based on the packet exchange behavior, especially the variations of the flow behavior in comparison with the standard network traffic. Meanwhile, any new flow generated through such malicious traffic is exchanged by the first packet. The first packet transferred in the flow can reveal some characteristics of the underlying protocol and, as such, can be useful for detecting P2P botnets. The model uses the first packet sizes of the traffic with commonly connected nodes to calculate the MD as the sample set, and the previous connected nodes method is used as the contrast group.
The MD D M ( i , j ) n between nodes is calculated. The number of the commonly connected nodes is represented by M. n represents the number of connections. The closest connection between two nodes and the commonly connected node is taken as one connection. When calculating the distance between node i and j, X( x 1 , x 2 , x n ) and Y( y 1 , y 2 , y n ) represent the set of the first packet size of the source node connection and the suspected node connection.
The mean μ is
μ = [ μ x , μ y ] = [ i = 1 n x i , i = 1 n y i ] / M
and the covariance matrix is
= [ i = 1 n [ x i μ x y i μ x ] [ x i μ x , y i μ x ] ] / M .
Covariance is used to express the correlations between indirect connected nodes. The MD better explains the relationship between nodes:
D M ( i , j ) n = ( i j ) 1 ( i j ) T .

4.3. Iteration the Correlation Coefficient

The correlation coefficient is represented by the reciprocal of the MD of m nodes, and it signifies the trusting relationship between node j and node i, namely, γ j i . When the correlation coefficient of two nodes exceeds the threshold, and node j is the infected node, node i is also the infected node:
γ j i = 1 / D M ( i , j ) n .
The correlation iteration algorithm is as follows:
T ( i , j ) = γ j i .
T ¯ ( j , i ) represents the normalization of the correlation coefficient. When the numbers of i and j are the same, the transition matrix is a square matrix. The normalized transition matrix is T ¯ :
T ¯ ( j , i ) = n = 1 m 1 / D M ( i , j ) n i = 1 v 1 / D M ( i , j ) .
The column vector L is the correlation grade vector. After the first iteration, the source node s will be correlated, and the next generation L ( i ) can be expressed as
L ( i ) = { 1 , i f   s = i   0 , e l s e w h e r e .
L ( i ) represents the accumulative correlation grade vector of node i. After iteration, the value of L ( i ) is
L ( i ) = j = 1 v T ¯ ( j , i ) L ( j ) .
The value of the source node has increased by one, representing one iteration process having taken place. The correlation model represents the correlations between nodes. According to the network status, P2P botnets are detected through the relationships between the source node and other nodes.
The algorithm flow is as follows:
Algorithm 1Correlation iteration algorithm (D, s, maxIter)
1: T ← Mahalanobis distance matrix (D)
2: T ¯ ← Normalization processing ( T )
3: L [ 0 , 0 , , 0 ] t r (initialize L as 0 vector)
4: for iter = 1 to maxIter do (maxIter is the maximum iteration)
5: L ( s ) L ( s ) + 1 (Inject the associated value at the source node)
6: L D M ( i , j ) i = 1 v D M ( i , j ) (Normalize the correlation coefficient of nodes)
7: L T L ¯ (Assign the correlation value of the iteration)
8: end for
9: output L
It is noted that the algorithm contains a constant matrix multiplication. However, the vector (L) and the transition matrix (T) are sparse. Therefore, the model can implement the algorithm through fast sparse matrix multiplication.
Set the iteration number, and get L, when the L output of the algorithm exceeds the threshold, the node is regarded as an infected node. The specific setting of the threshold value is described in the experimental part.

4.4. Threshold Setting

For botnet detection in data set, we can set a threshold, if used for real-time monitoring, we can use dynamic threshold. As a virus, botnet spreads in the network, and the network traffic data is a small amount of traffic. When the set threshold is analyzed and many botnet nodes are obtained in a certain time window, we believe that the threshold set at the current time is not suitable for botnet detection.
The sequential analysis is applied to check the data statistical characteristics for the specific time cycle. Assuming temporal analysis function is f e , statistical function is ( x ) , the temporal correlation is defined as:
e ( x , t ) = f e ( φ ( c ( x , t ) ) , φ ( π ( x , t ) ) )
The adaptive threshold module is applied to use threshold to detect botnet nodes to generate decisions. Meanwhile, the threshold is updated with attack data percentages to mitigate the false alarm ratio. Assuming the threshold for detection is ϑ t on time t, the threshold control function is f ϑ , the fluctuation of threshold is related with threshold on time t − 1 and statistical values on botnet detection, we model the potential principle as:
ϑ t = f ϑ ( ϑ t 1 , 1 t t h ( x , t ) )
where the statistical value for detection is binary function h(x,t), when the analysis result δ constructed by e(x,t) is beyond ϑ t , h(x,t) is set as 1, otherwise is 0.
h ( x , t ) = { 1   δ   ϑ t 0   δ   < ϑ t

5. Experiment and Analysis of the Results

Unstructured botnet is more suitable for this detection structure, because unstructured botnet needs botmaster to convey information and is easier to detect. A structured P2P topology can be used by botmaster for the decrease of the chance of the possible mutual contacts through peer-connection with the same network for the communication with various sets of peers. To realize this, it requires the peers in the same mechanism to coordinate with each other and hence they will not have communication with the peer list of each other. From a specific perspective, peers with the same network are required to have their own tiny botnet and they show up as a single node for the rest of the P2P botnet. Even though a mutual-contact-fee P2P is deployed by botmaster, at least two networks have the choices of sharing the flow records and hence to get the mutual contacts among the P2P bots exploited in various networks, which cannot be avoided given that it would be impossible for the botmaster to acknowledge which network has the collaboration at the beginning. In this paper, structured botnet is used to evaluate the reliability of detection because there are few common connection nodes of P2P botnet.

5.1. Background Traffic

The model was established based on obtaining the network traffic, determining the time window, and screening the host relationship required by the experiment within a time window. To evaluate the performance of the botnet detection through the model, the experimental traffic was obtained from the ISOT data set issued by the international network security conference [28]. The data set integrates the representative P2P botnet storm [14], Waledac [29], and the normal network traffic through LAN communication. A total of 78,000 conversations of ‘clean’ data were sampled from the entire clean dataset. 10,000 conversations each of Storm and Waledac were sampled from their respective datasets. To capture the data for the experiment, first, the network connection nodes of the source node, excluding the public connected nodes related to the software, were sorted, and then the network connections of the connection node were sorted. After obtaining two lists of sessions, we filtered the size of the first packet of sessions.
Conversation creation module
This module is fed with the output of packet filter module for the creation of conversations, which are realized through the packet-level data aggregation. Every conversation has been identified via a FLOWGAP parameter and <IP1, IP2>. FLOWGAP has been assumed to be the maximum permissible inter-arrival time between 2 packets in a conversation. When the packet arrives, which is supposed to belong to the timestamp of the FLOWGAP time throughout the talk and conversation’s IP pair, the conversation will add the packet. Then that IP pair will be created with a new conversation.
Packet filter module
The network log files (.pcap) has been taken into the module serving as a kind of input. Only those packets with valid UDP/TCP header has been kept. It discarded the corrupted packets with the missing of the necessary header information. For every packet, the Payload Length, Destination IP and Source IP (TCP or UDP, as applicable) are used, which are applied for the development of an elaborate feature set and the generation of conversations.
Data related to a storm spanning a period of 24 h were extracted as the analysis object for the experiment. The network traffic recurred through Wireshark. The session was segmented with a time interval of 300 s in the corresponding correlation to obtain the traffic flow of the network traffic.
To capture the data for the experiment, first, the network connection nodes of the source node, excluding the public connected nodes related to the software, were sorted, and then the network connections of the connection node were sorted. After obtaining two lists of sessions, we filtered the size of the first packet of sessions.

5.2. Model Parameter Setting

Common connection nodes are few, and the number of infected nodes in a network range is also small. When the number of infected nodes obtained by threshold judgment is large, the threshold value needs to be adjusted.
The iteration number setting
The correlation coefficient γ j i between the corresponding nodes was calculated using the size of the first packet of the commonly connected nodes as a characteristic sample of different correlations.
However, according to the actual data, most hosts do not share, or rarely share, connected nodes with other nodes. To reduce the computation time, it is not necessary to calculate the MD of all hosts with the indirect connected nodes. Therefore, the number of iterations associated with iterative algorithm should not be greater than five. According to the Erdös–Renyi model [30], a P2P botnet can never find infected nodes beyond three hops, so the iteration number was set as five.
The commonly connected nodes number setting
Considering that the botnet will deliberately reduce the number of commonly connected nodes, the smallest number of commonly connected nodes was set to k = 2 in the experiment.
The threshold setting
After obtaining the result of sequential analysis, reasonable threshold is in demand to distinguish botnet nodes. Assuming initial threshold is ϑ 0 , its value is set as:
ϑ 0 = σ δ 0 ,   σ [ 1 , 1.5 ]
δ t = e ( x , t ) e ¯ ( x , t )
where δ t is the normalization based on e(x,t).
Assuming the time cycle is Tth, the detailed coordinated strategy is:
ϑ t = ϑ t 1 [ ( max ( g ( x , t ) , 0 ) min ( g ( x , t ) , 0 ) ) 1 ]
g ( x , t ) = l n ( h ( x ,   t ) N T t h ) 1 ε
where N T t h is the amount of sample data within T t h , ε is the factor to control the percentage of attack behaviors.
The THR represents the threshold of the correlation coefficient. To do a comparative experiment, according to the calculation results of the coefficient, the numerical magnitude was 10 4 , and the correlation coefficient results are normalized, the order of magnitude of different methods remains unchanged. So, we set the three specified thresholds were 1 × 10 4 , 5 × 10 4 , and 10 × 10 4 for the comparative experiment.
After the correlation coefficient threshold of node data had been obtained, a known bot was selected to be the source node, and the iteration number was set as five. Moreover, new infected nodes in the data set were detected through the correlation iteration algorithm.

5.3. Comparison of the Results

The average accuracy rate and recall ratio were calculated to measure the performance of the proposed algorithm. After model detection, the accuracy rate was defined as the ratio of the number of the actually detected storm-detected nodes to the number of storm-detected nodes in the data set. The recall ratio was defined as the ratio of the number of detected storm-detected nodes to the number of the detected nodes in the data set list.
In accordance with the numerical interval of the correlation coefficient threshold, to compare the results, we set the experimental threshold to be the same as the previous method, which were set as 1 × 10 4 , 5 × 10 4 , and 10 × 10 4 . The numbers of commonly connected hosts were 2, 4, and 6. The detection results are shown in Table 1.
The accuracy rates and recall ratios of the test data were compared under different settings, and the results are shown below.
As shown in Figure 5 and Figure 6, as the threshold increased, the detection accuracy rate increased, while as the threshold decreased, the recall ratio decreased. It was demonstrated that the presence of a k value caused the recall ratio to decrease with an increasing number of commonly connected nodes, while the accuracy rate was less affected by the k value. Moreover, in cases with only two commonly connected nodes, the accuracy rate and the recall ratio were maintained at 89.3% and 85.4%, respectively, when the threshold was 10 × 10 4 .
We write in the Related Work section that many methods work in the P2P botnet detection. However, the articles use different data sets, and the premise of our method is that an infected node is known, which is different from the detection environment of other articles, so the results of this paper are compared with paper [7] under the same detection background. When the THR was the same, the detection results of the previously connected nodes method in paper [7] were as shown in Table 2, and we made the accuracy comparison with the MD detection method.
As shown in Figure 7, when k = 4, the accuracy rate of the MD detection method was shown to be higher than that of the connected nodes method. According to the comparison results with different k values, when k = 2, the detection accuracy rate decreased obviously as the THR value reduced.
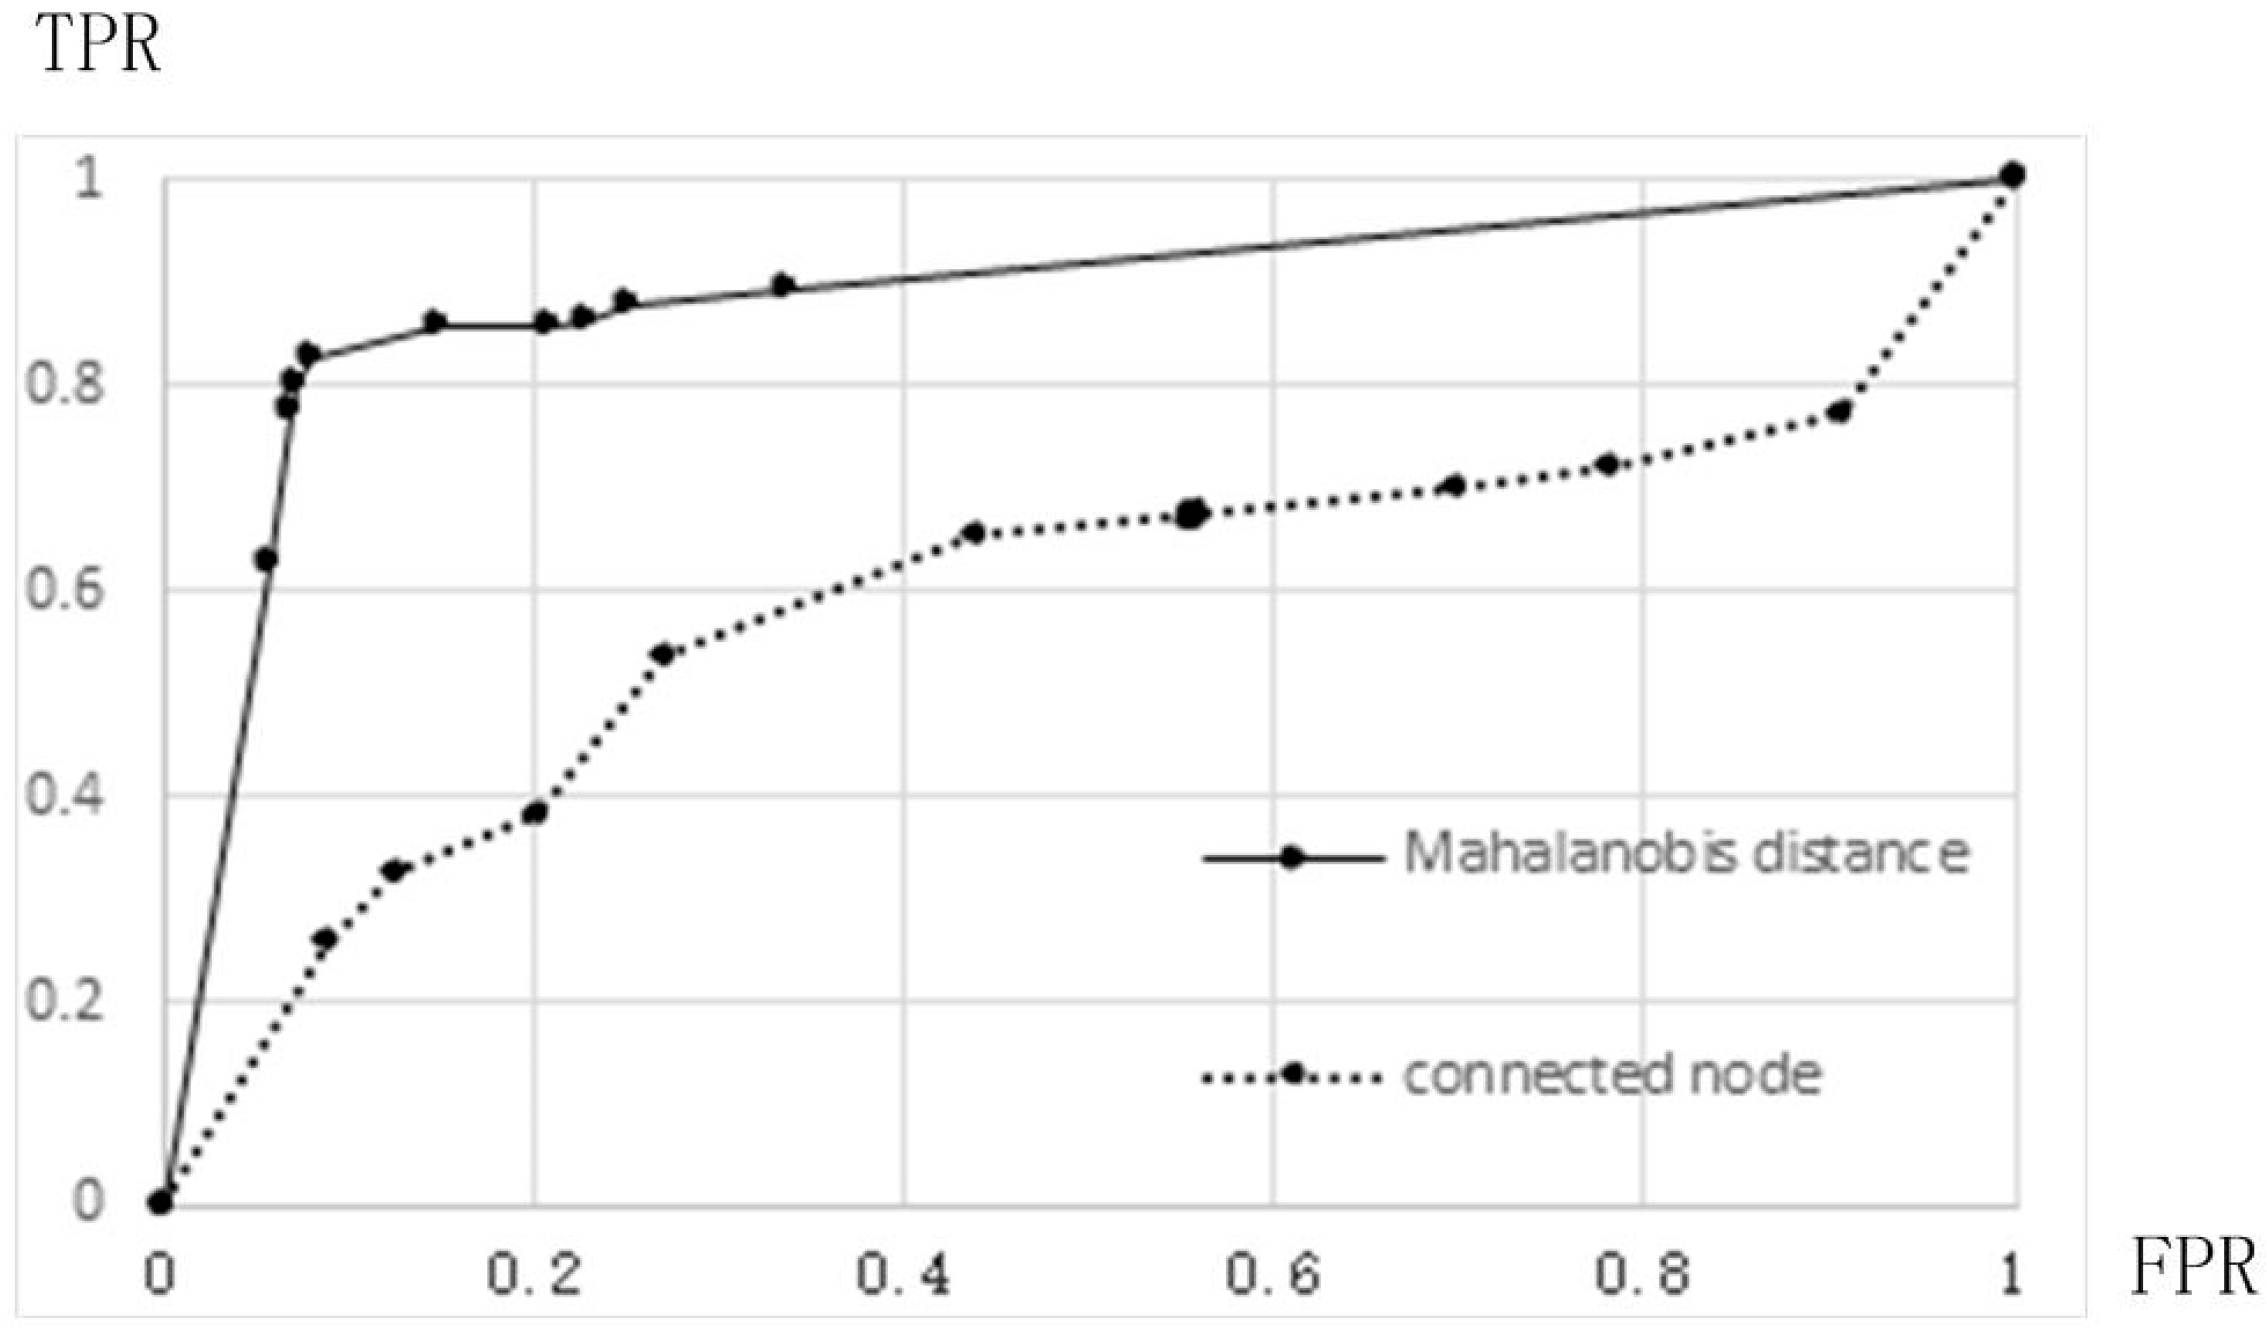
Each point on the ROC curve corresponds to a threshold, and for different threshold settings there will be a true positive rate (TPR) and false positive rate (FPR). For example, when the threshold value of the classifier is at its maximum, TP = FP = 0, corresponding to the origin. The minimum threshold value, TN = FN = 0, corresponds to point (1,1) in the upper right corner. As the threshold value of classifier increased, the TP and FP decreased, the TPR and FPR decreased, and the ROC point moved down to the left.
To determine the accuracy of the ROC curve, the selected threshold increased in the experiment, and the TPR and FPR were plotted (Figure 8). The area under the curve (AUC) was determined using the coordinates. In general, the AUC was greater than 0.5, and the closer the AUC was to 1, the better the detection effect was. It can be seen from the figure that the MD detection method had higher accuracy than the previous method. In the figure, under the setting k = 2, when the FPR was 5%, the TPR was higher than 75%, and after that, it was close to the final accuracy level of the method. As can be seen from Figure 9, when the connected number method was used, a TPR of 75% was associated with an FPR as high as 65%. In addition, as the threshold changed throughout the test, the TPR gradually increased, indicating that the method was unstable. The stable performance of the MD method under multiple detection settings created a larger AUC area and a better detection effect.
The experimental results showed that the application of the MD detection method can improve the accuracy rate and recall ratio of the detection. Moreover, when there are fewer commonly connected nodes, both the accuracy rate and the recall ratio will be greater than 85%, which addresses the limitations of the connected nodes method. Above all, we can conclude that the expression of correlations between the data by the MD is useful for the description of P2P botnet node relationships. Different correlation coefficient thresholds and k values have their advantages in terms of the accuracy rate and recall ratio. In practical applications, their values should be determined according to the specific arrangement demands of a network.

6. Conclusions

By studying the characteristics of P2P botnet propagation modes, botnet-infected nodes were identified based on the change in the MD between the nodes. This method used MD to reduce the dependence on the number of commonly used connection nodes in P2P botnet detection, and used the iterative algorithm to expand the connection of nodes in the network. The proposed method was verified through experimental evaluation. The method was able to detect P2P botnets in cases with few commonly connected points. This method is more suitable for real-time detection, hence we propose the concept of dynamic threshold. Future research will focus on the above two aspects to enhance the integrity and real-time detection performance.

Author Contributions

Z.Y. and B.W. designed the study, performed the research, analyzed data, and wrote the paper.

Acknowledgments

We would like to acknowledge Xidian University for supporting experimental platform.

Conflicts of Interest

The authors declare that they have no competing interests.

References

  1. Mirkovic, J.; Reiher, P. A taxonomy of DDoS attack and DDoS defense mechanisms. ACM SIGCOMM Comput. Commun. 2004, 34, 39–53. [Google Scholar] [CrossRef]
  2. Gelenbe, E.; Gellman, M.; Loukas, G. Defending Networks against Denial of Service Attacks. Proc. SPIE 2004, 5611, 233–243. [Google Scholar]
  3. Wurzinger, P.; Bilge, L.; Holz, T.; Göbel, J.; Krügel, C.; Kirda, E. Automatically Generating Models for Botnet Detection. In Proceedings of the 14th European Symposium on Research in Computer Security, Saint-Malo, France, 21–23 September 2009; pp. 232–249. [Google Scholar]
  4. Saad, S.; Traore, I.; Ghorbani, A.; Sayed, B.; Zhao, D.; Lu, W.; Felix, J.; Hakimian, P. Detecting p2p botnets through network behavior analysis and machine learning. In Proceedings of the 2011 Ninth Annual International Conference on Privacy, Security and Trust (PST), Montreal, QC, Canada, 19–21 July 2011; pp. 174–180. [Google Scholar]
  5. Lin, S.-C.; Chen, P.S.; Chang, C.-C. A novel method of mining network flow to detect P2P botnets. Peer-to-Peer Netw. Appl. 2014, 7, 645–654. [Google Scholar] [CrossRef]
  6. Kalaivani, K.; Suguna, C. Efficient botnet detection based on reputation model and content auditing in P2P networks. In Proceedings of the 2015 IEEE 9th International Conference on Intelligent Systems and Control (ISCO), Coimbatore, India, 9–10 January 2015; pp. 1–4. [Google Scholar]
  7. Coskun, B.; Dietrich, S.; Memon, N. Friends of an Enemy: Identifying Local Members of Peer-to-Peer Botnets Using Mutual Contacts. In Proceedings of the 26th Annual Computer Security Applications Conference, Austin, TX, USA, 6–10 December 2010; pp. 131–140. [Google Scholar]
  8. Silva, S.S.C.; Silva, R.M.P.; Pinto, R.C.G.; Salles, R.M. Botnets: A survey. Comput. Netw. 2013, 57, 378–403. [Google Scholar] [CrossRef]
  9. Anagnostopoulos, M.; Kambourakis, G.; Gritzalis, S. New facets of mobile botnet: Architecture and evaluation. Int. J. Inf. Secur. 2016, 15, 455–473. [Google Scholar] [CrossRef]
  10. Bailey, M.; Cooke, E.; Jahanian, F.; Xu, Y.; Karir, M. A survey of botnet technology and defenses. In Proceedings of the Cybersecurity Applications & Technology Conference for Homeland Security, Washington, DC, USA, 3–4 March 2009; pp. 300–304. [Google Scholar]
  11. García, S.; Zunino, A.; Campo, M. Survey on network-based botnet detection methods. Secur. Commun. Netw. 2014, 7, 878–903. [Google Scholar] [CrossRef]
  12. Dittrich, D.; Dietrich, S. New directions in peer-to-peer malware. In Proceedings of the 2008 IEEE Sarnoff Symposium, Princeton, NJ, USA, 28–30 April 2008. [Google Scholar]
  13. Grizzard, J.B.; Sharma, V.; Nunnery, C.; Kang, B.B.; Dagon, D. Peer-to-peer botnets: Overview and case study. In Proceedings of the HotBots’07: First Conference on First Workshop on Hot Topics in Understanding Botnets, Cambridge, MA, USA, 4 April 2007. [Google Scholar]
  14. Holz, T.; Steiner, M.; Dahl, F.; Biersack, E.; Freiling, F. Measurements and mitigation of peer-to-peer-based botnets: A case study on Storm Worm. In Proceedings of the 1st Usenix Workshop on Large-Scale Exploits and Emergent Threats, San Francisco, CA, USA, 15 April 2008. Article No. 9. [Google Scholar]
  15. Beigi, E.; Jazi, H.; Stakhanova, N.; Ghorbani, A. Towards Effective Feature Selection in Machine Learning-Based Botnet Detection Approaches. In Proceedings of the IEEE Conference on Communications and Network Security (CNS), San Francisco, CA, USA, 29–31 October 2014. [Google Scholar]
  16. Huseynov, K.; Kim, K.; Yoo, P. Semi-supervised Botnet Detection Using Ant Colony System. In Proceedings of the 31th Symposium on Cryptography and Information Security, Kagoshima, Japan, 21–24 January 2014. [Google Scholar]
  17. Su, S.-C.; Chen, Y.-R.; Tsai, S.-C.; Lin, Y.-B. Detecting P2P Botnet in Software Defined Networks. Secur. Commun. Netw. 2018, 2018, 4723862. [Google Scholar] [CrossRef]
  18. Gu, G.; Zhang, J.; Lee, W. BotSniffer: Detecting botnet command and control channels in network traffic. In Proceedings of the 15th Annual Network and Distributed System Security Symposium (NDSS’08), San Diego, CA, USA, 8–11 February 2008. [Google Scholar]
  19. Narang, P.; Ray, S.; Hota, C.; Venkatakrishnan, V. Peer- Shark: Detecting Peer-to-Peer Botnets by Tracking Conversations. In Proceedings of the 2014 IEEE Security and Privacy Workshops, San Jose, CA, USA, 17–18 May 2014. [Google Scholar]
  20. Guntuku, S.C.; Narang, P.; Hota, C. Real-time Peer-to-Peer Botnet Detection Framework based on Bayesian Regularized Neural Network. arXiv 2013, arXiv:1307.7464. [Google Scholar]
  21. Priyanka; Dave, M. PeerFox: Detecting parasite P2P botnets in their waiting stage. In Proceedings of the 2015 International Conference on Signal Processing Computing and Control (ISPCC), Waknaghat, India, 24–26 September 2015; pp. 350–355. [Google Scholar]
  22. Joshi, H.P.; Bennison, M.; Dutta, R. Collaborative botnet detection with partial communication graph information. In Proceedings of the 2017 IEEE 38th Sarnoff Symposium, Newark, NJ, USA, 18–20 September 2017. [Google Scholar]
  23. Wu, W.; Alvarez, J.; Liu, C.; Sun, H.-M. Bot detection using unsupervised machine learning. Microsyst. Technol. 2018, 24, 209–217. [Google Scholar] [CrossRef]
  24. Villamarín-Salomón, R.; Brustoloni, J.C. Identifying botnets using anomaly detection techniques applied to DNS traffic. In Proceedings of the 2008 5th IEEE Consumer Communications and Networking Conference, Las Vegas, NV, USA, 10–12 January 2008. [Google Scholar]
  25. Schiavoni, S.; Maggi, F.; Cavallaro, L.; Zanero, S. Phoenix: DGA-based botnet tracking and intelligence. In International Conference on Detection of Intrusions and Malware, and Vulnerability Assessment; Springer: Cham, Switzerland, 2014. [Google Scholar]
  26. Pascoal, C.; de Oliveira, M.R.; Valadas, R.; Filzmoser, P.; Salvador, P.; Pacheco, A. Robust feature selection and robust PCA for Internet traffic anomaly detection. In Proceedings of the 2012 Proceedings IEEE INFOCOM, Orlando, FL, USA, 25–30 March 2012. [Google Scholar]
  27. De Maesschalck, R.D.; Jouan-Rimbaud, D.L.M. The Mahalanobis distance. Proc. Chemom. Intell. Lab. Syst. 2000, 50, 1. [Google Scholar] [CrossRef]
  28. The Honeynet Project. French Chapter. Available online: http://www.Honeynet.org/chapters/france (accessed on 19 September 2008).
  29. Sinclair, G.; Nunnery, C.; ByungHoon Kang, B. The waledac protocol: The how and why. In Proceedings of the 2009 4th International Conference on Malicious and Unwanted Software (MALWARE), Montreal, QC, Canada, 13–14 October 2009. [Google Scholar]
  30. Erdos, P.; Renyi, A. The evolution of random graphs. Publ. Math. Inst. Hung. Acad. Sci. 1960, 5, 17–61. [Google Scholar]
Figure 1. Network connection analytical model 1.
Information 10 00160 g001
Figure 2. P2P botnet detection architecture.
Information 10 00160 g002
Figure 3. Network connection analytical model 2.
Information 10 00160 g003
Figure 4. Network connection analytical model 3.
Information 10 00160 g004
Figure 5. Accuracy rates of the Mahalanobis distance detection under different settings.
Information 10 00160 g005
Figure 6. Recall ratios of the Mahalanobis distance detection under different settings.
Information 10 00160 g006
Figure 7. Comparison of accuracy rates when k = 4.
Information 10 00160 g007
Figure 8. ROC curve of the Mahalanobis distance method with different k values.
Information 10 00160 g008
Figure 9. Comparison of the ROC curve when k = 4.
Information 10 00160 g009
Table 1. The detection results of the Mahalanobis distance under different settings.
THR = 1 × 10 4 THR = 5 × 10 4 THR = 10 × 10 4
kAccuracy RateRecall RatioAccuracy RateRecall RatioAccuracy RateRecall Ratio
20.5030.9260.7170.8910.8930.854
40.5240.8950.7310.8590.8790.781
60.5170.8430.6980.8020.8650.732
Table 2. Detection results based on connected nodes method under different settings.
THR = 1 × 10 4 THR = 5 × 10 4 THR = 10 × 10 4
kAccuracy RateRecall RatioAccuracy RateRecall RatioAccuracy RateRecall Ratio
20.1340.7950.3930.6890.4880.429
40.2780.7710.4650.6540.5890.382
60.2150.6650.4270.5920.5240.321

