Article

Analysis of Composite Scrubber with Built-In Silencer for Marine Engines

Division of Mechanical Engineering, Korea Maritime and Ocean University, Busan 49112, Korea
*
Author to whom correspondence should be addressed.
J. Mar. Sci. Eng. 2021, 9(9), 962; https://doi.org/10.3390/jmse9090962
Submission received: 17 August 2021 / Revised: 27 August 2021 / Accepted: 28 August 2021 / Published: 3 September 2021
(This article belongs to the Special Issue Marine Engines Performance and Emissions II)

Abstract

:
The International Maritime Organization (IMO) is strengthening regulations on reducing sulfur oxide emissions, and the demand for reducing exhaust noise affecting the environment of ships is also increasing. Various technologies have been developed to satisfy these needs. In this paper, a composite scrubber for ships that can simultaneously reduce sulfur oxide and noise was proposed, and the flow characteristics and noise characteristics were analyzed. For the silencer, vane type and resonate type were applied. In the case of the vane type, the effects of the direction, size, and location of the vane were analyzed, and in the case of the resonate type, the effects of the hole location and the number of holes were analyzed. The result shows that the length increase of the vane increased the average transmission loss and had a great effect, especially in the low frequency region. The transmission loss increased when the vane was installed outside, and the noise reduction effect was excellent when the vane was in the reverse direction. In the resonate type, increasing the number of holes is advantageous for noise reduction. The condition for maximally reducing noise in the range not exceeding 840 Pa, which is 70% of the allowable back pressure, is a vane length of 225 mm in the outer vane reverse type. The pressure drop under this condition was 777 Pa, and the average transmission losses in the low frequency region and the entire frequency region were 43.5 and 54.5 dB, respectively.

1. Introduction

The International Maritime Organization (IMO), a specialized agency of the United Nations (UN), proposed a 0.1% sulfur content limit in fuels in the emission control areas (ECAs) from 2015, and a 0.5% sulfur content limit in areas other than ECAs from 2020 [1]. It is mandatory to use emission post-processing devices that have equal or greater effect than using low sulfur fuel [2]. Many studies have been conducted on the removal of sulfur oxides contained in exhaust gases.
Research is being conducted on wet scrubbers (applicable to existing ships). A wet scrubber, used on a ship, is a device that removes particulate matter and sulfur oxides contained in exhaust gas. It causes contact with exhaust gas through the spraying of water, removes particulate matter (capturing them in liquid droplets), and removes sulfur oxides through a chemical reaction. The effect of the shape and internal elements of the scrubber, on back pressure, particulate matter removal in exhaust gas, and chemical reaction, was studied [3,4,5,6,7,8]. Han et al. [3] compared the pressure loss and the removal efficiency of ammonia, hydrochloric acid, and hydrofluoric acid gas, according to the type of filler of the wet scrubber, and analyzed the gas removal performance by flow rate, liquid-to-liquid ratio, and pH concentration. Byeon at al. [4] designed a modified turbulent wet scrubber (MTWS) and analyzed the efficiency and pressure drop of ammonia gas and particulate removal through experiments. Lee et al. [5] analyzed the particle removal efficiency of the turbulent scrubber through experiments and studied the pressure drop to estimate the energy consumed by the scrubber. Son et al. [6] measured the smoke reduction rate before and after the scrubber by applying a wet scrubber system to a 3298cc commercial diesel engine and varying the scrubber aspect ratio, internal filling rate, washing water spray flow rate, and engine load conditions. Using this, the optimal shape and filling rates were studied. Lee et al. [7] analyzed the inlet and outlet pressure difference, internal pressure distribution, and exhaust gas streamline of the scrubber through numerical analyses to identify the problems of the existing scrubber; they designed and analyzed a new type of vortex scrubber. Hu et al. [8] studied the optimal number of blades when the dust concentration, air volume, and number of blades were different under various water intake conditions of a wet scrubber with rotating blades.
To improve the performance of the scrubber and to reduce various gases (SO2, NO, HG0, CO2), various methods, such as washing water, additives, static electricity, and dust collectors were applied [9,10,11,12,13,14,15,16,17,18]. Fang et al. [9] performed basic research on the theory and technology of simultaneous SO2 and NO treatments by spraying urea water. Fang et al. [10] conducted a study on the simultaneous treatment of SO2, NO, and HG0 by spraying urea water and KMnO4. Raghunath and Mondal [11] conducted a study on the simultaneous reduction of SO2 and NO by mixing and spraying NH3/NaClO with water. Yang et al. [12] studied the effect of electrolyzed seawater injection on NOx and SO2 reduction. Meikpa et al. [13] studied the SO2 removal efficiency of a multi-stage bubble column scrubber using water. D’Addio et al. [14] conducted a study on the removal of submicron particles using wet electrostatic scrubbing. Park et al. [15] studied the simultaneous reduction of NO and SO2 using a wet scrubber combined with a plasma electrostatic precipitator. Lim et al. [16] investigated the contamination characteristics of the washing water at the scrubber and studied the removal characteristics of sulfur compounds when microbubbles were supplied to the washing water. Sun et al. [17] conducted a study to simultaneously reduce CO2 and PM in industrial flue gas by connecting an ammonia scrubber (AS) and a granular bed filter (GBF) in series. Xie et al. [18] conducted a study on VOCs (Volatile Organic Compounds) removal of a wet scrubber combined with UV/PMS (peroxymonosulfate).
There are no regulations on the exhaust noise from ships, but noise regulation is being considered, regarding the impact on the health of the crew and the surrounding residential areas when anchored at the port. Diesel engines are the main sources of vibration noise for ships because they generate vibration noise through combustion, piston up-and-down motions, and a crankshaft rotational motion in the process of producing mechanical energy [19]. Since the engine is inside the ship, the engine noise spreading to the inside of the ship is greatly reduced by the partition walls and structures. However, since engine noise transmitted through the exhaust gas is hardly reduced, the noise of the ship can be greatly reduced by installing a silencer at the exhaust gas outlet.
Noise reduction is caused by the synthesis, dissipation, and conversion of sound waves into thermal energy. The silencer is divided into a resonance type that focuses on sound wave synthesis, a vane type that induces dissipation and synthesis at the same time, and an expansion type that focuses on dissipation. Various studies are being conducted on the flow characteristics and acoustic characteristics according to the shape of the silencer for noise reduction [20,21,22,23,24,25,26,27]. Hwang et al. [20] investigated the internal structure of the silencer, classified its components, and studied the noise and back pressure characteristics of the silencer. Kwon et al. [21] assumed that the fluid flow in the simple expansion chamber was divided into potential flow and turbulent flow, and then studied the acoustic transmission loss of the muffler according to the flow velocity of the fluid through computational analysis. Kim and Jeong [22] modeled a circular simple expansion pipe divided by a bulkhead with holes, and studied acoustic and flow characteristics through computational analysis. Yi et al. [23] studied the pressure loss through the internal flow analysis of a silencer for an 8 kW diesel generator. Secgin et al. [24] studied the acoustic characteristics through computational analysis by changing the baffle position, number, and extension shape of the baffle in the expansion tube. Nursal et al. [25] studied the flow characteristics according to the pipe shape and the position of the silencer of a 4-stroke marine diesel generator through computational analysis. Kakade and Sayyad [26] studied the transmission loss and back pressure according to the shape of the silencer for automobiles through computational analysis. Kim [27] studied the structure of an effective silencer for high-frequency attenuation while maintaining the performance of the existing silencer for medium and low frequency attenuation in exhaust noise generated from medium-sized diesel engines.
In this paper, a composite scrubber that can simultaneously reduce exhaust gas and engine noise was proposed, and the factors affecting noise reduction and the effect on engine performance were analyzed. Among the types of silencers currently used in various fields, vane-type and resonance-type silencers are combined with the scrubber. The effect of the length change, the installation position and the inclined direction of the vane on the flow characteristics and acoustic characteristics was studied in the vane type silencer, and the effect of the number and installation position of the holes was analyzed in the resonator type silencer. Through this analysis, a design method for maximally reducing noise in the range of 840 Pa or less, which is 70% of the allowable back pressure of the target engine, is suggested.

2. Mathematical Model and Calculation Conditions

2.1. Mathematical Model

2.1.1. CFD Mathematical Models

The computational analysis program used to analyze the flow characteristics is ANSYS CFX V14.0 (Ansys Inc.: Canonsburg, PA, USA) and the formulas refer to the ANSYS CFX-Theory Guide [28].
The continuity equation is given in Equation (1).
ρ t + ( ρ U ) = 0
The momentum is given in Equation (2).
( ρ U ) t + ( ρ U U ) = ρ + τ + S M
where, stress tensor τ is associated with strain rate, as shown in Equation (3).
τ = μ [ U + ( U ) T 2 3 δ U ]
The total Energy Equations is given in Equation (4).
( ρ h t o t ) t ρ t + ( ρ U h t o t ) = ( λ T ) + ( U τ ) + U S M + S E
where total enthalpy htot is associated with static enthalpy h(T, P) as shown in Equation (5).
h t o t = h + 1 2 U 2
( U τ ) is the term for work by viscous stress and indicates internal heating by viscosity of fluid.

2.1.2. Acoustic Mathematical Model

The computational analysis program used to analyze the acoustic characteristics is ANSYS Acoustics ACT (Application Customization ToolKit) Extension (Ansys Inc.: Canonsburg, PA, USA), and it was installed and used in the Harmonic response program of ANSYS Workbench V17.0 (Ansys Inc.: Canonsburg, PA, USA). For the formula, refer to Lectures of the Acoustics ACT Extension [29].
In acoustic fluid-structural interaction problems, the structural dynamics equation must be considered along with the Navier-Stokes equations of fluid momentum and the flow continuity equation. The fluid momentum equation and continuity equation are simplified to obtain the acoustic wave equation using the assumption that the fluid is compressible and has no mean flow. That equation is given in Equation (6).
( 1 ρ 0 p ) 1 ρ 0 c 2 2 p t 2 + · [ 4 μ 3 ρ 0 ( 1 ρ 0 c 2 p t ) ] = t ( Q ρ 0 ) + · [ 4 μ 3 ρ 0 ( Q ρ 0 )
where, c is speed of sound ( K ρ 0 ) in fluid medium, ρ0 is mean fluid density, μ is dynamic viscosity, K is bulk modulus of fluid, p is acoustic pressure, Q is mass source in the continuity equation and t is time.
The acoustic pressure exerted on the structure at the FSI (Fluid Structure Interaction) interface will be considered in the Derivation of Acoustics matrices to form the coupling stiffness matrix. Harmonically varying pressure is given in Equation (7)
p ( r , t ) = R e [ p ( r ) e j w t ]
where, p is amplitude of the pressure, j is 1 , w is 2nf and f is frequency of oscillations of the pressure.
The transmission losses is given in Equation (8).
T L = 10 log ( W i n W t r a n s m i t t e d ) ( dB )
where, Win represents the radiated sound pressure, Wtransmitted represents the transmitted sound pressure.
The acoustic sound pressure level is calculated as Equation (9).
L S P L = 10 log ( P s 2 P r e f 2 ) ( dB )
Ps is the root mean square of sound pressure, and Pref is the reference sound pressure that is 2 × 10⁵(Pa).

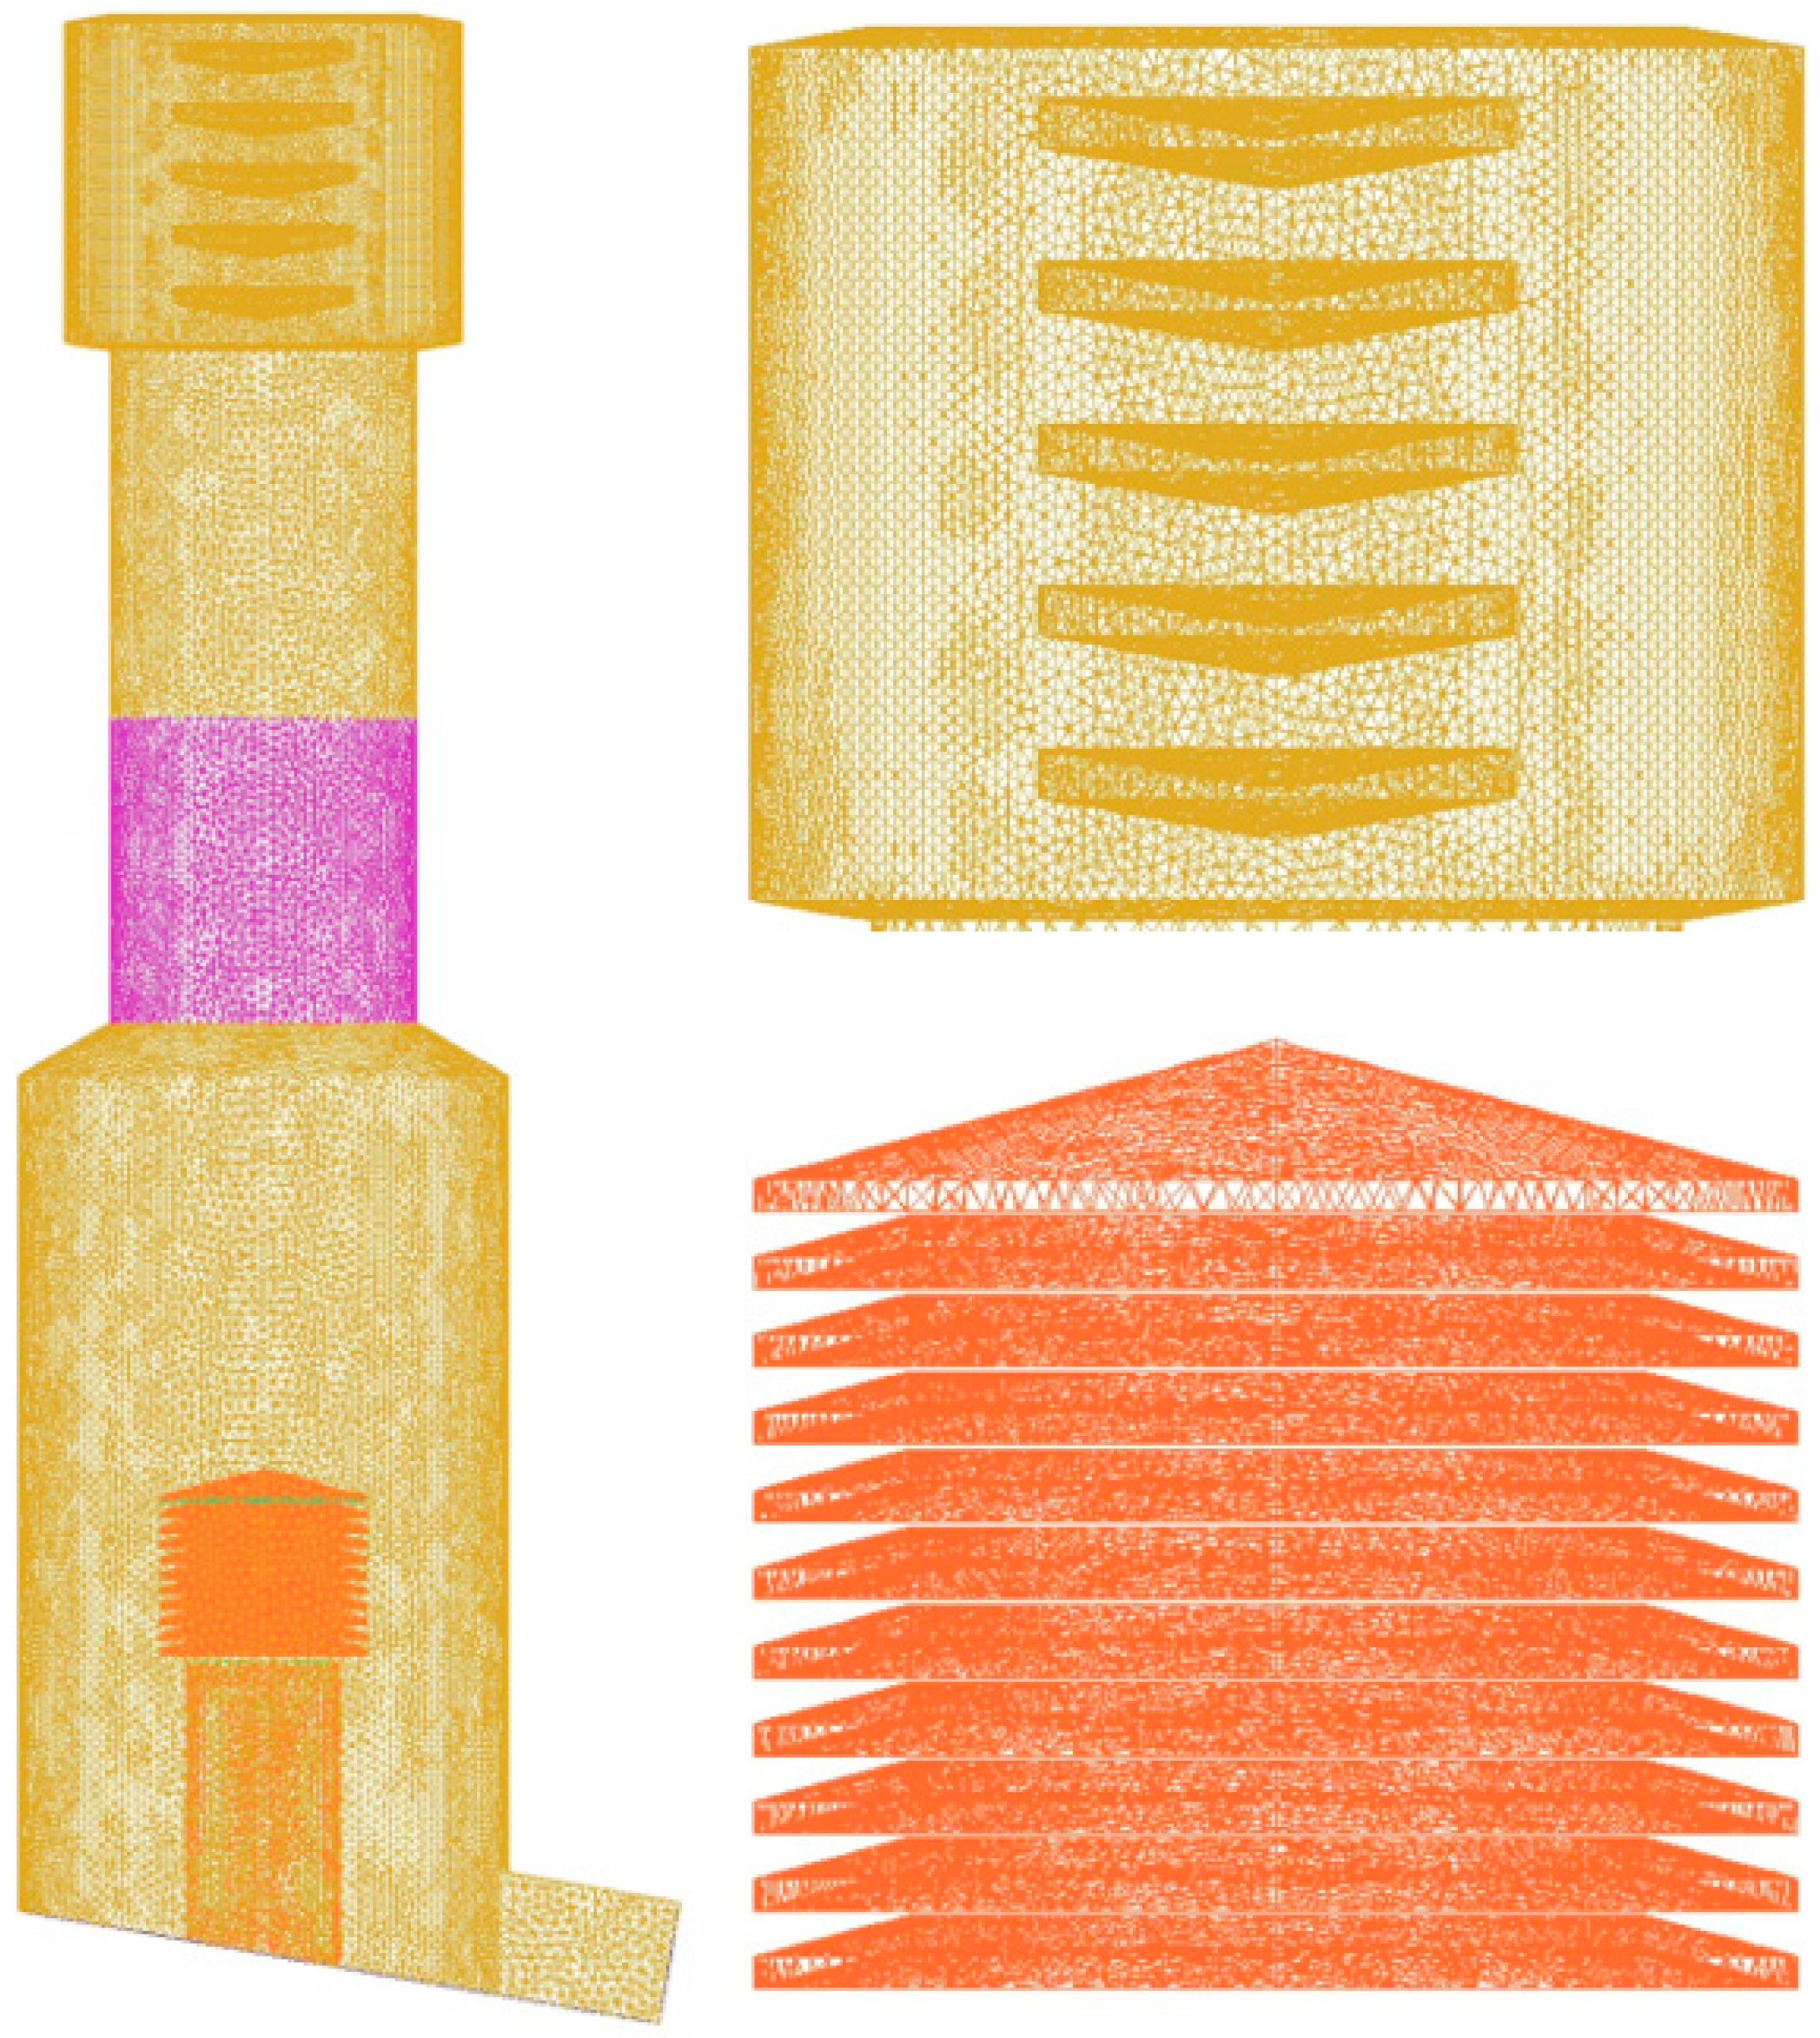
2.2. Calculation Grids

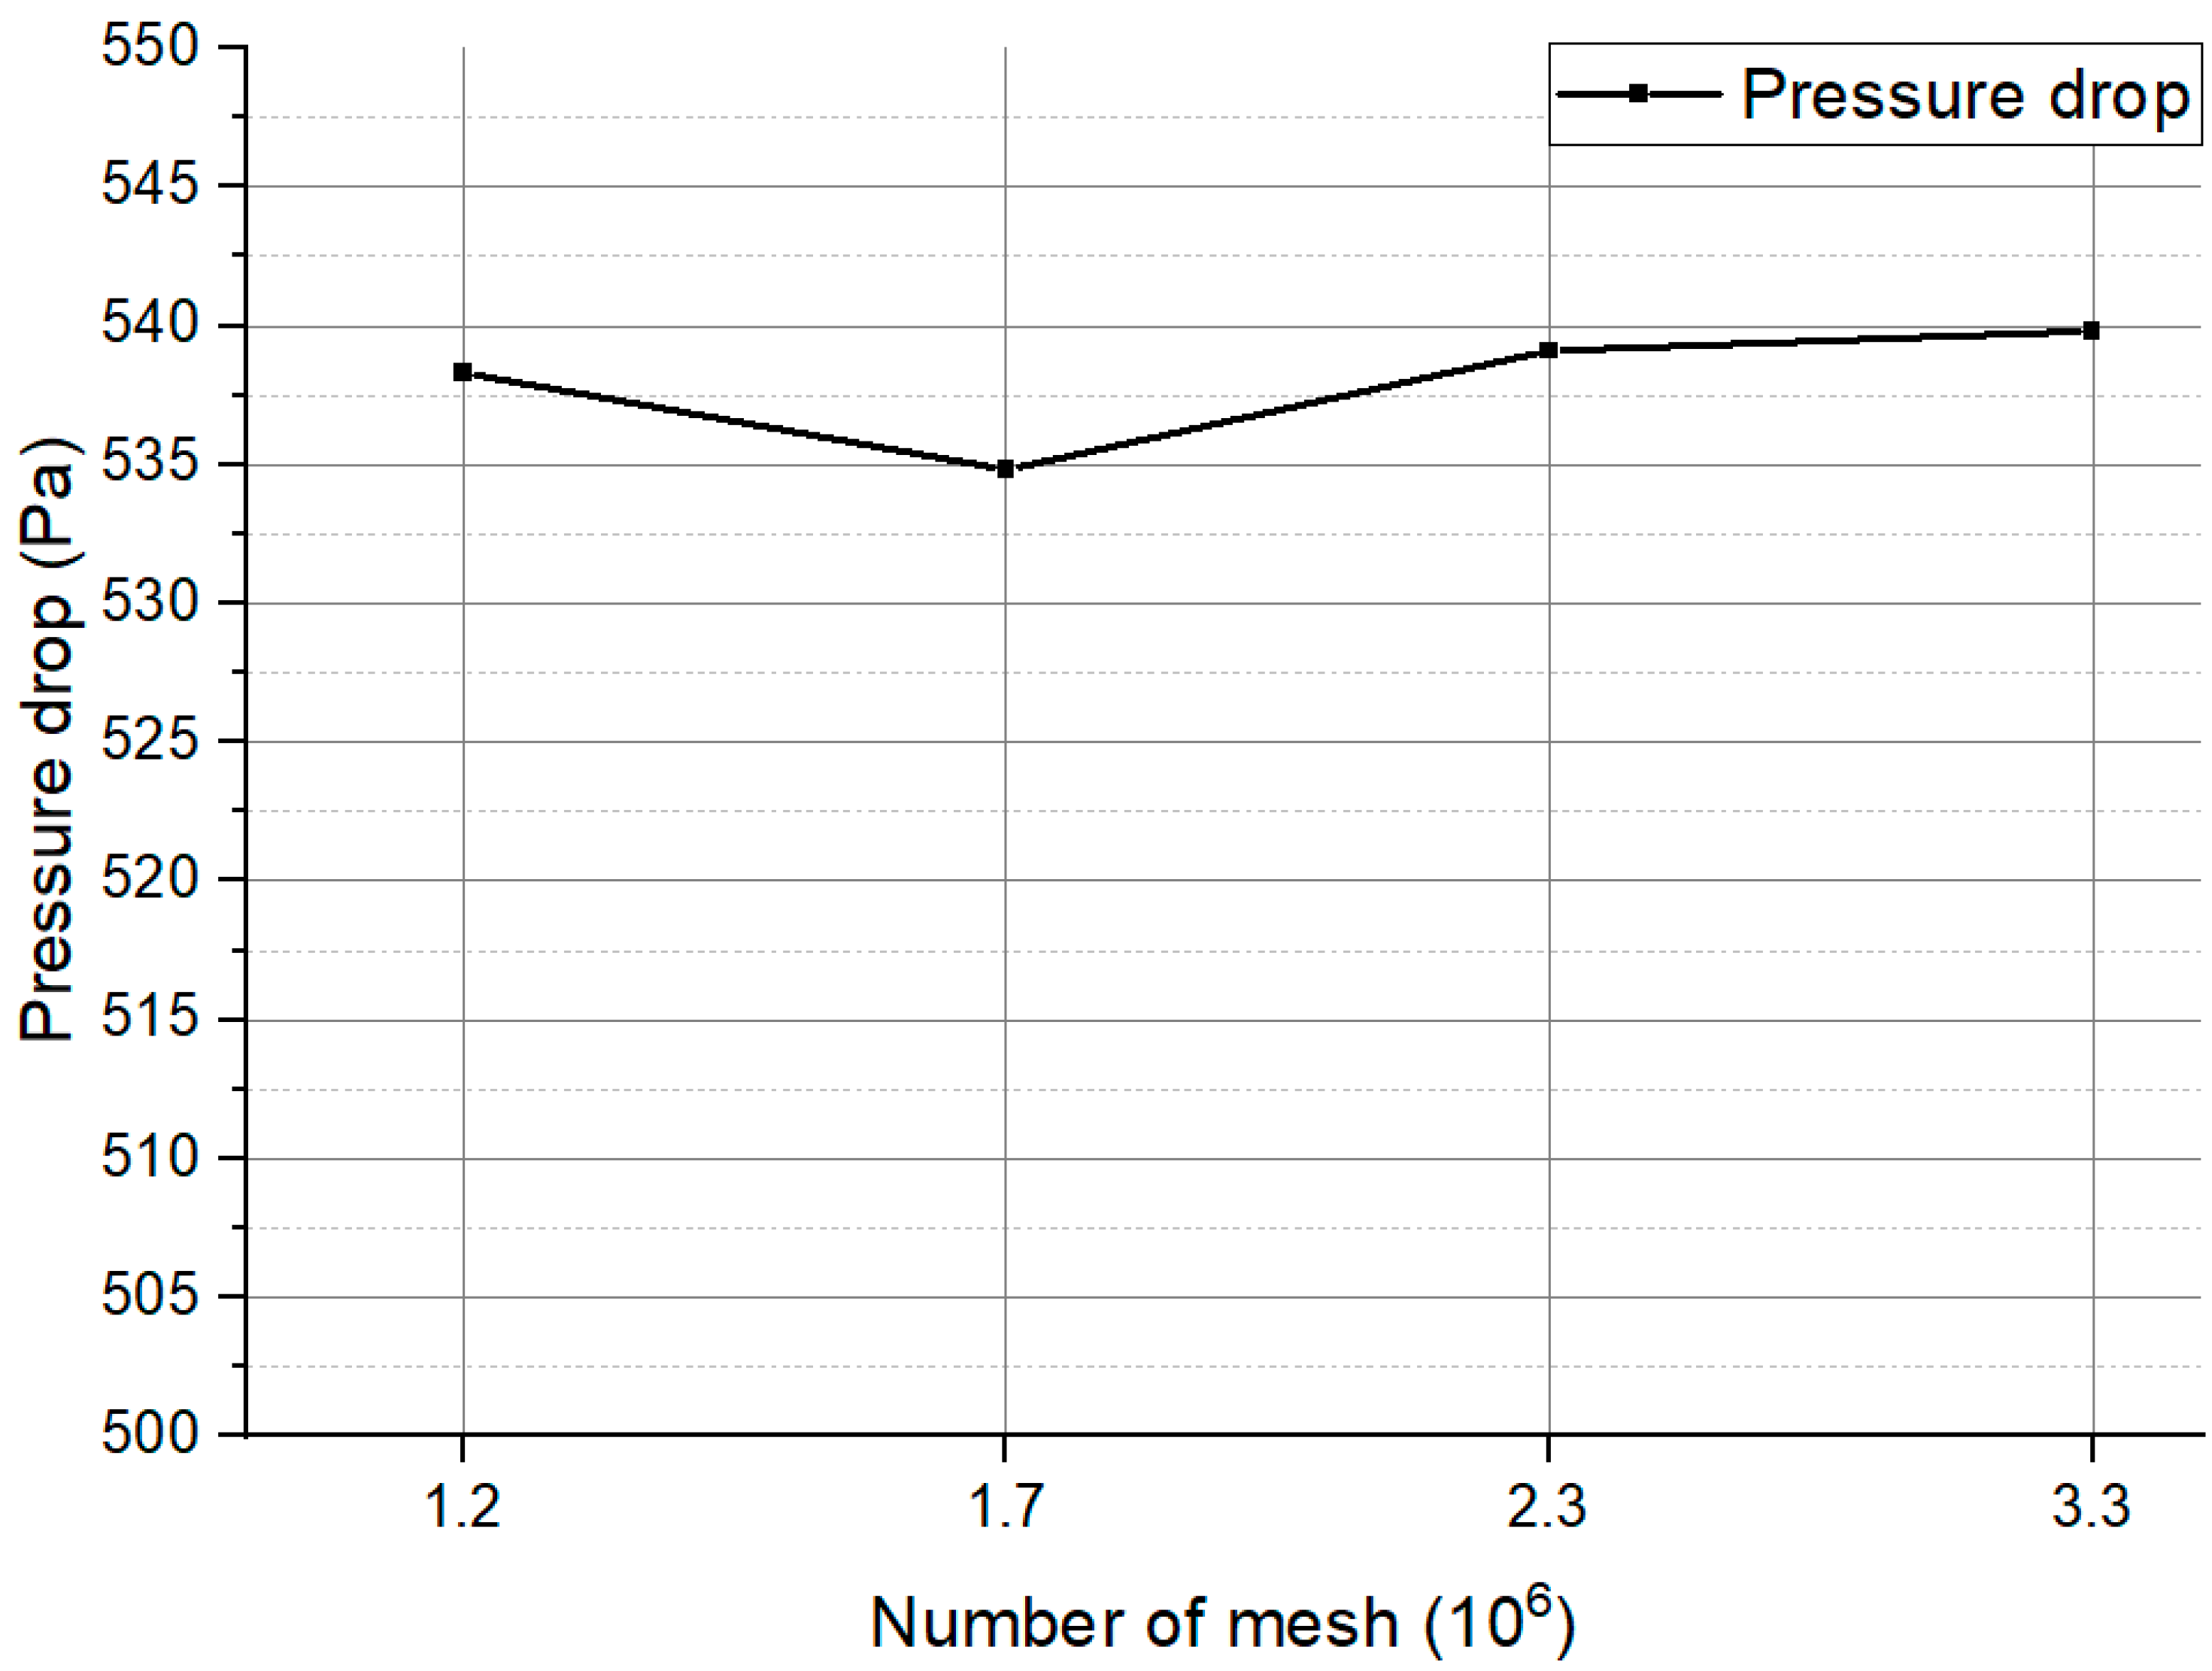
2.2.1. Flow Calculation

Figure 1 is a mesh for flow analysis created using ICEM CFD (Ansys Inc.: Canonsburg, PA, USA). The complex shape was composed of a Tetra mesh, and the number of meshes was set to 1.2 million, 1.7 million, 2.3 million, and 3.3 million, and the effect of the number of meshes on the analysis was confirmed. Figure 2 shows the pressure drop according to the number of meshes. The effect of the number of meshes on the pressure drop was small and was stabilized from 3 million pieces. In this study, flow analysis was performed by selecting the number of meshes of 3.3 million in consideration of the mesh quality of complex shapes.

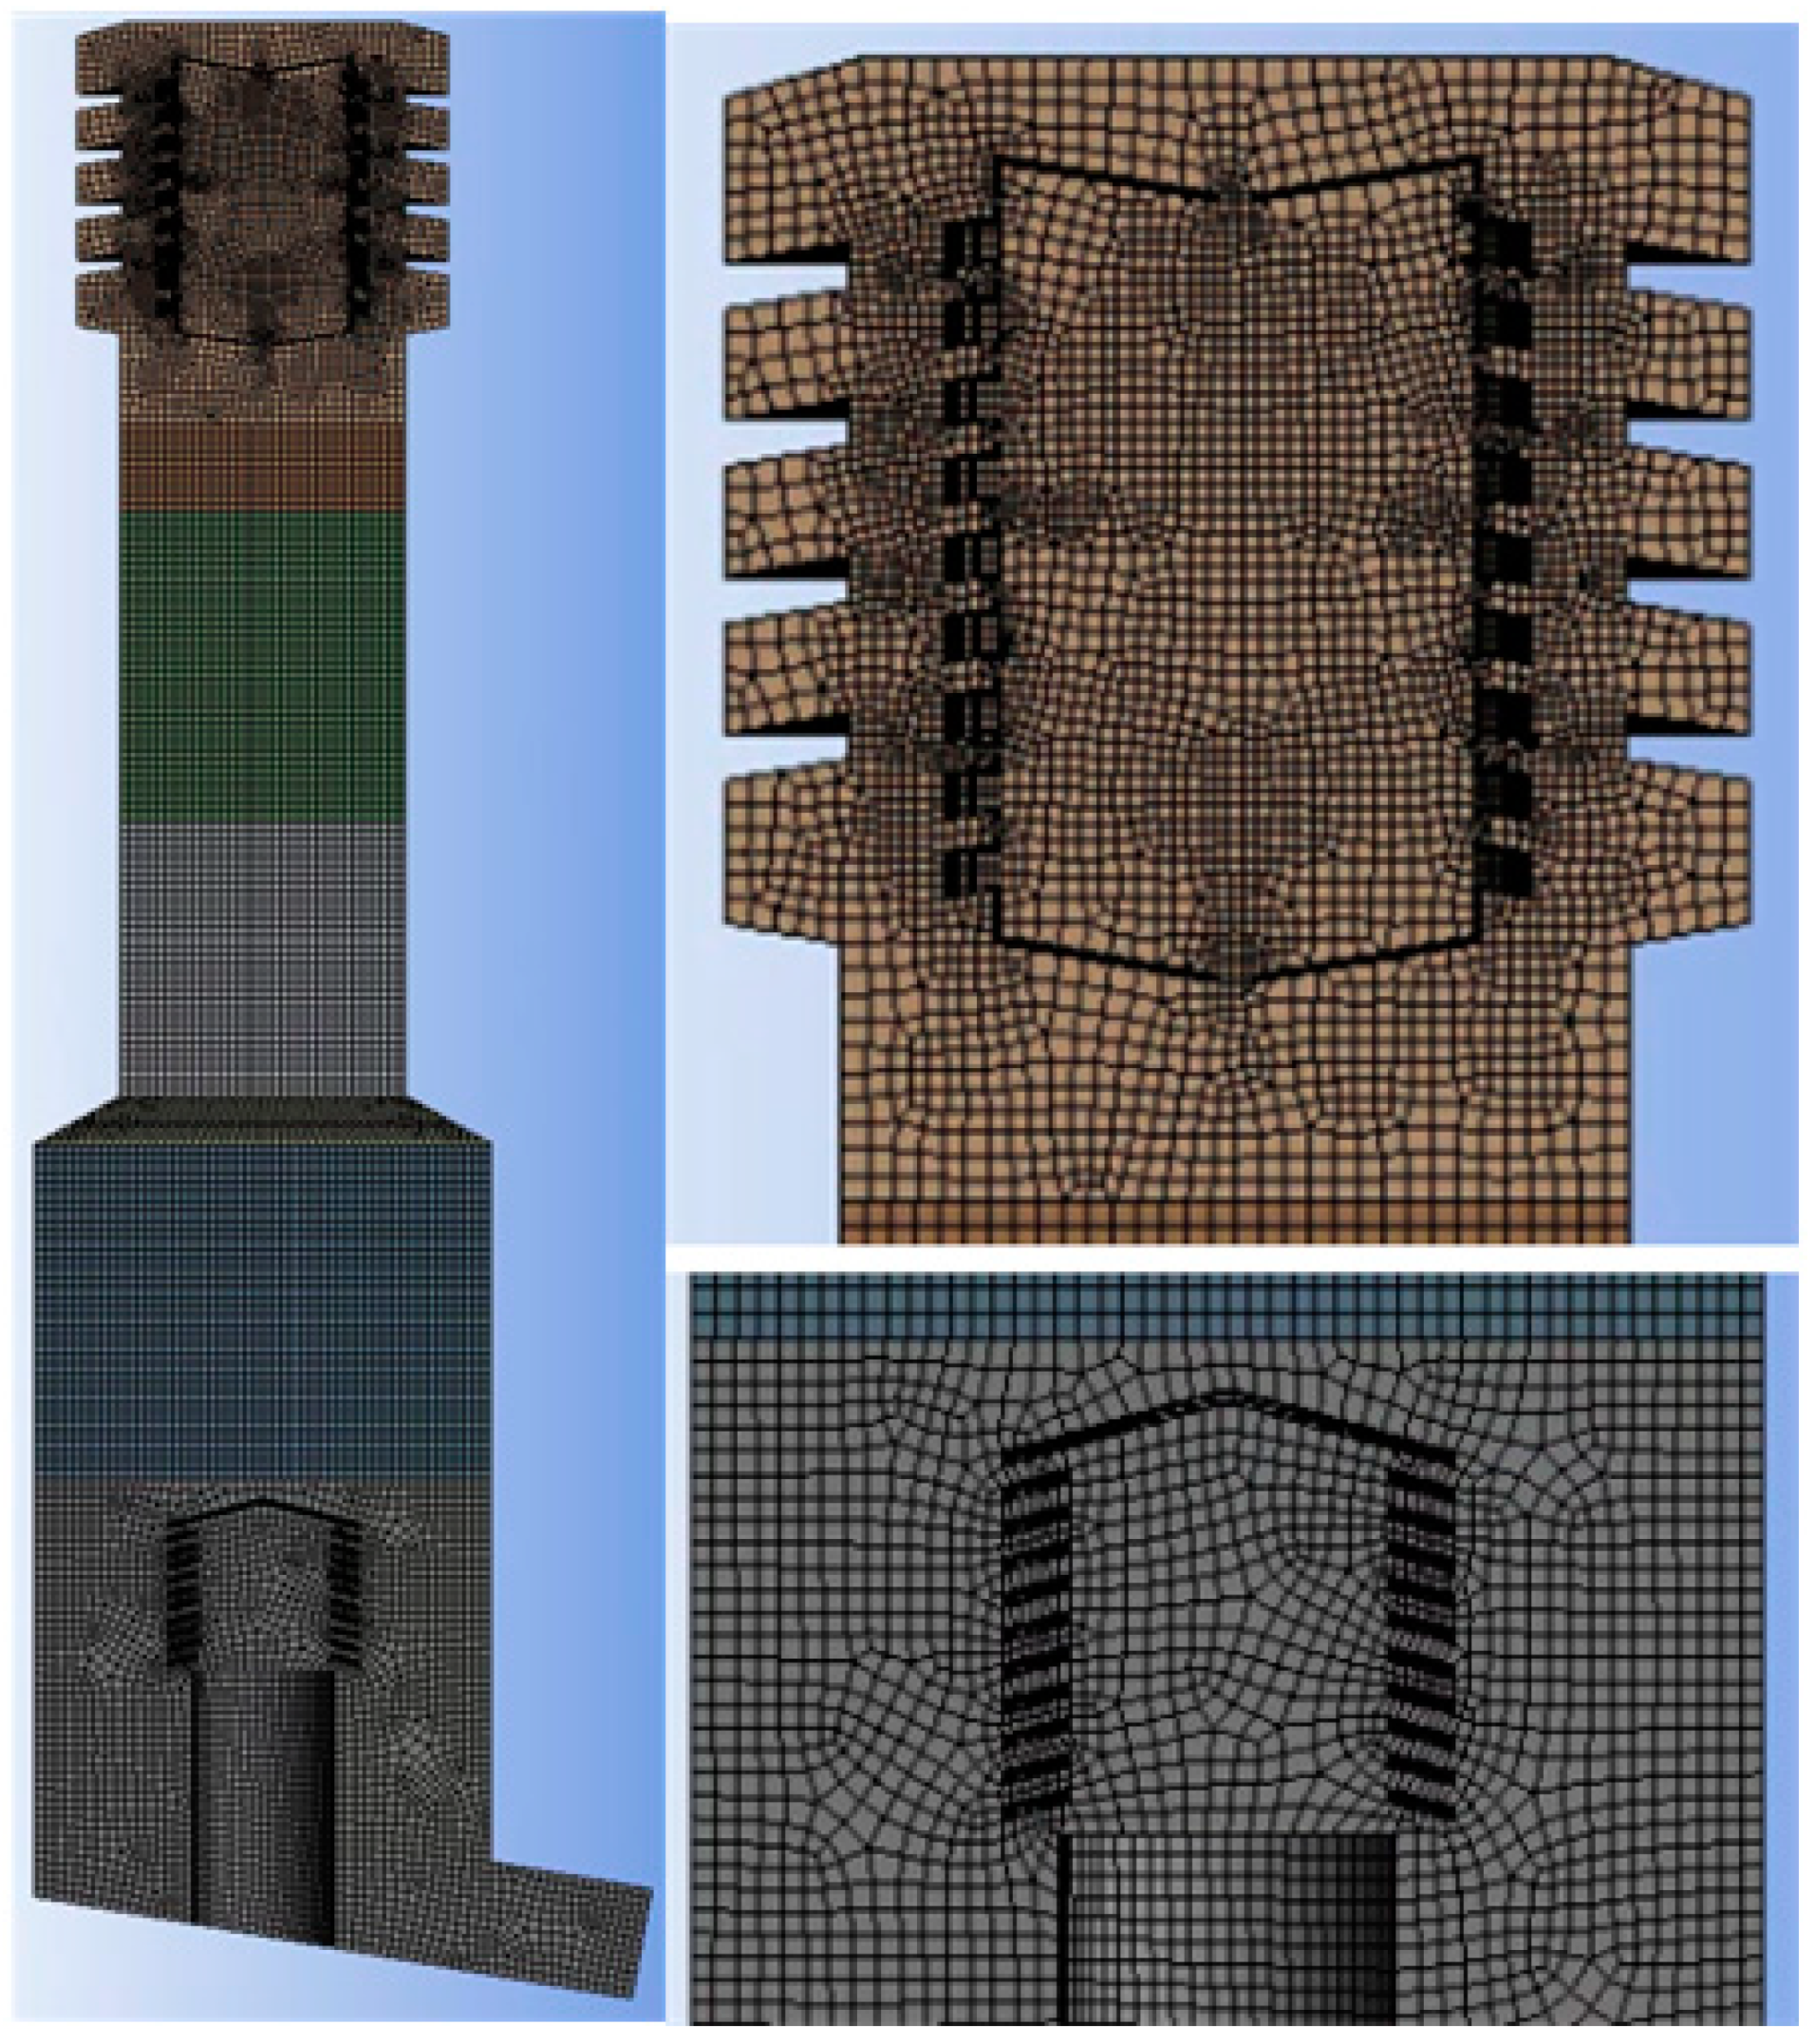
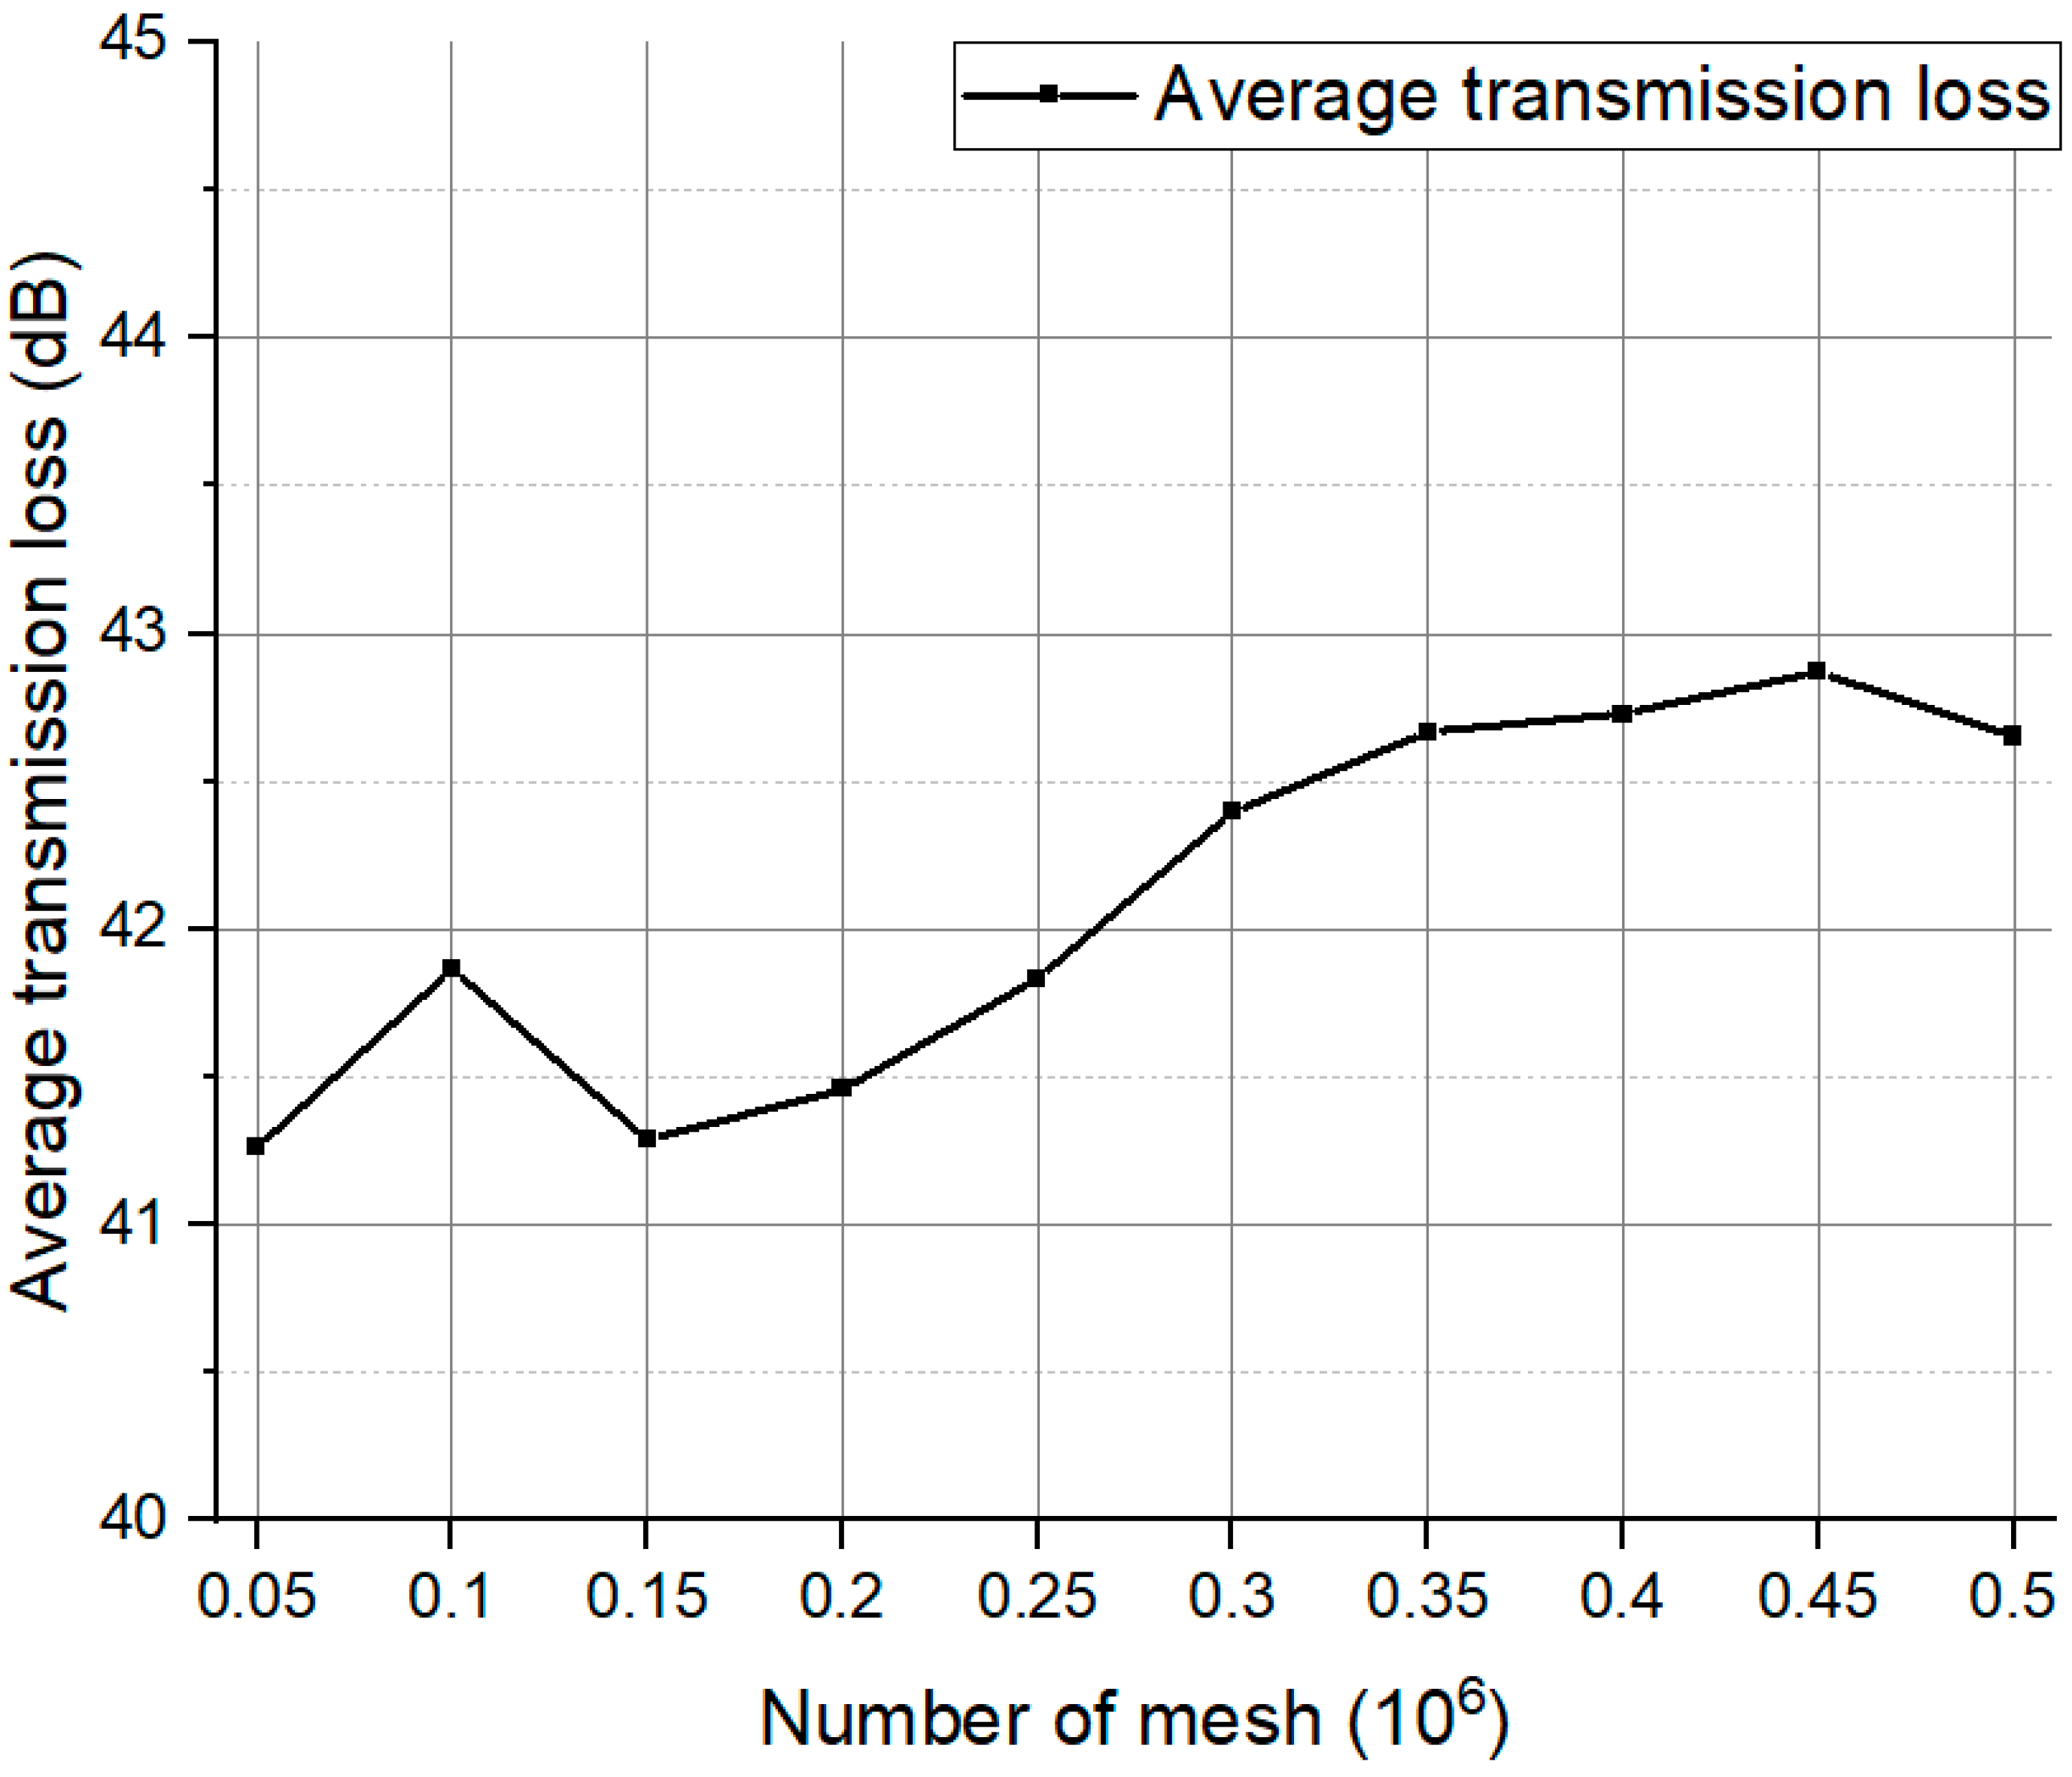
2.2.2. Acoustics Calculation

Figure 3 is a mesh for acoustic analysis created using ANSYS Mechanical mesh; 1/2 symmetry condition was used and it was created as a hexa mesh. The number of meshes was increased by 50,000 from 50,000 to 500,000 and the effect on the analysis results was evaluated. Figure 4 shows the average transmission loss from 100 to 2000 Hz, according to the number of meshes. As a result of analyzing the effect of the mesh, it was confirmed that the average transmission loss converges from 350,000 pieces, and this mesh was applied to the acoustics calculation.

2.3. Calculation Reliability

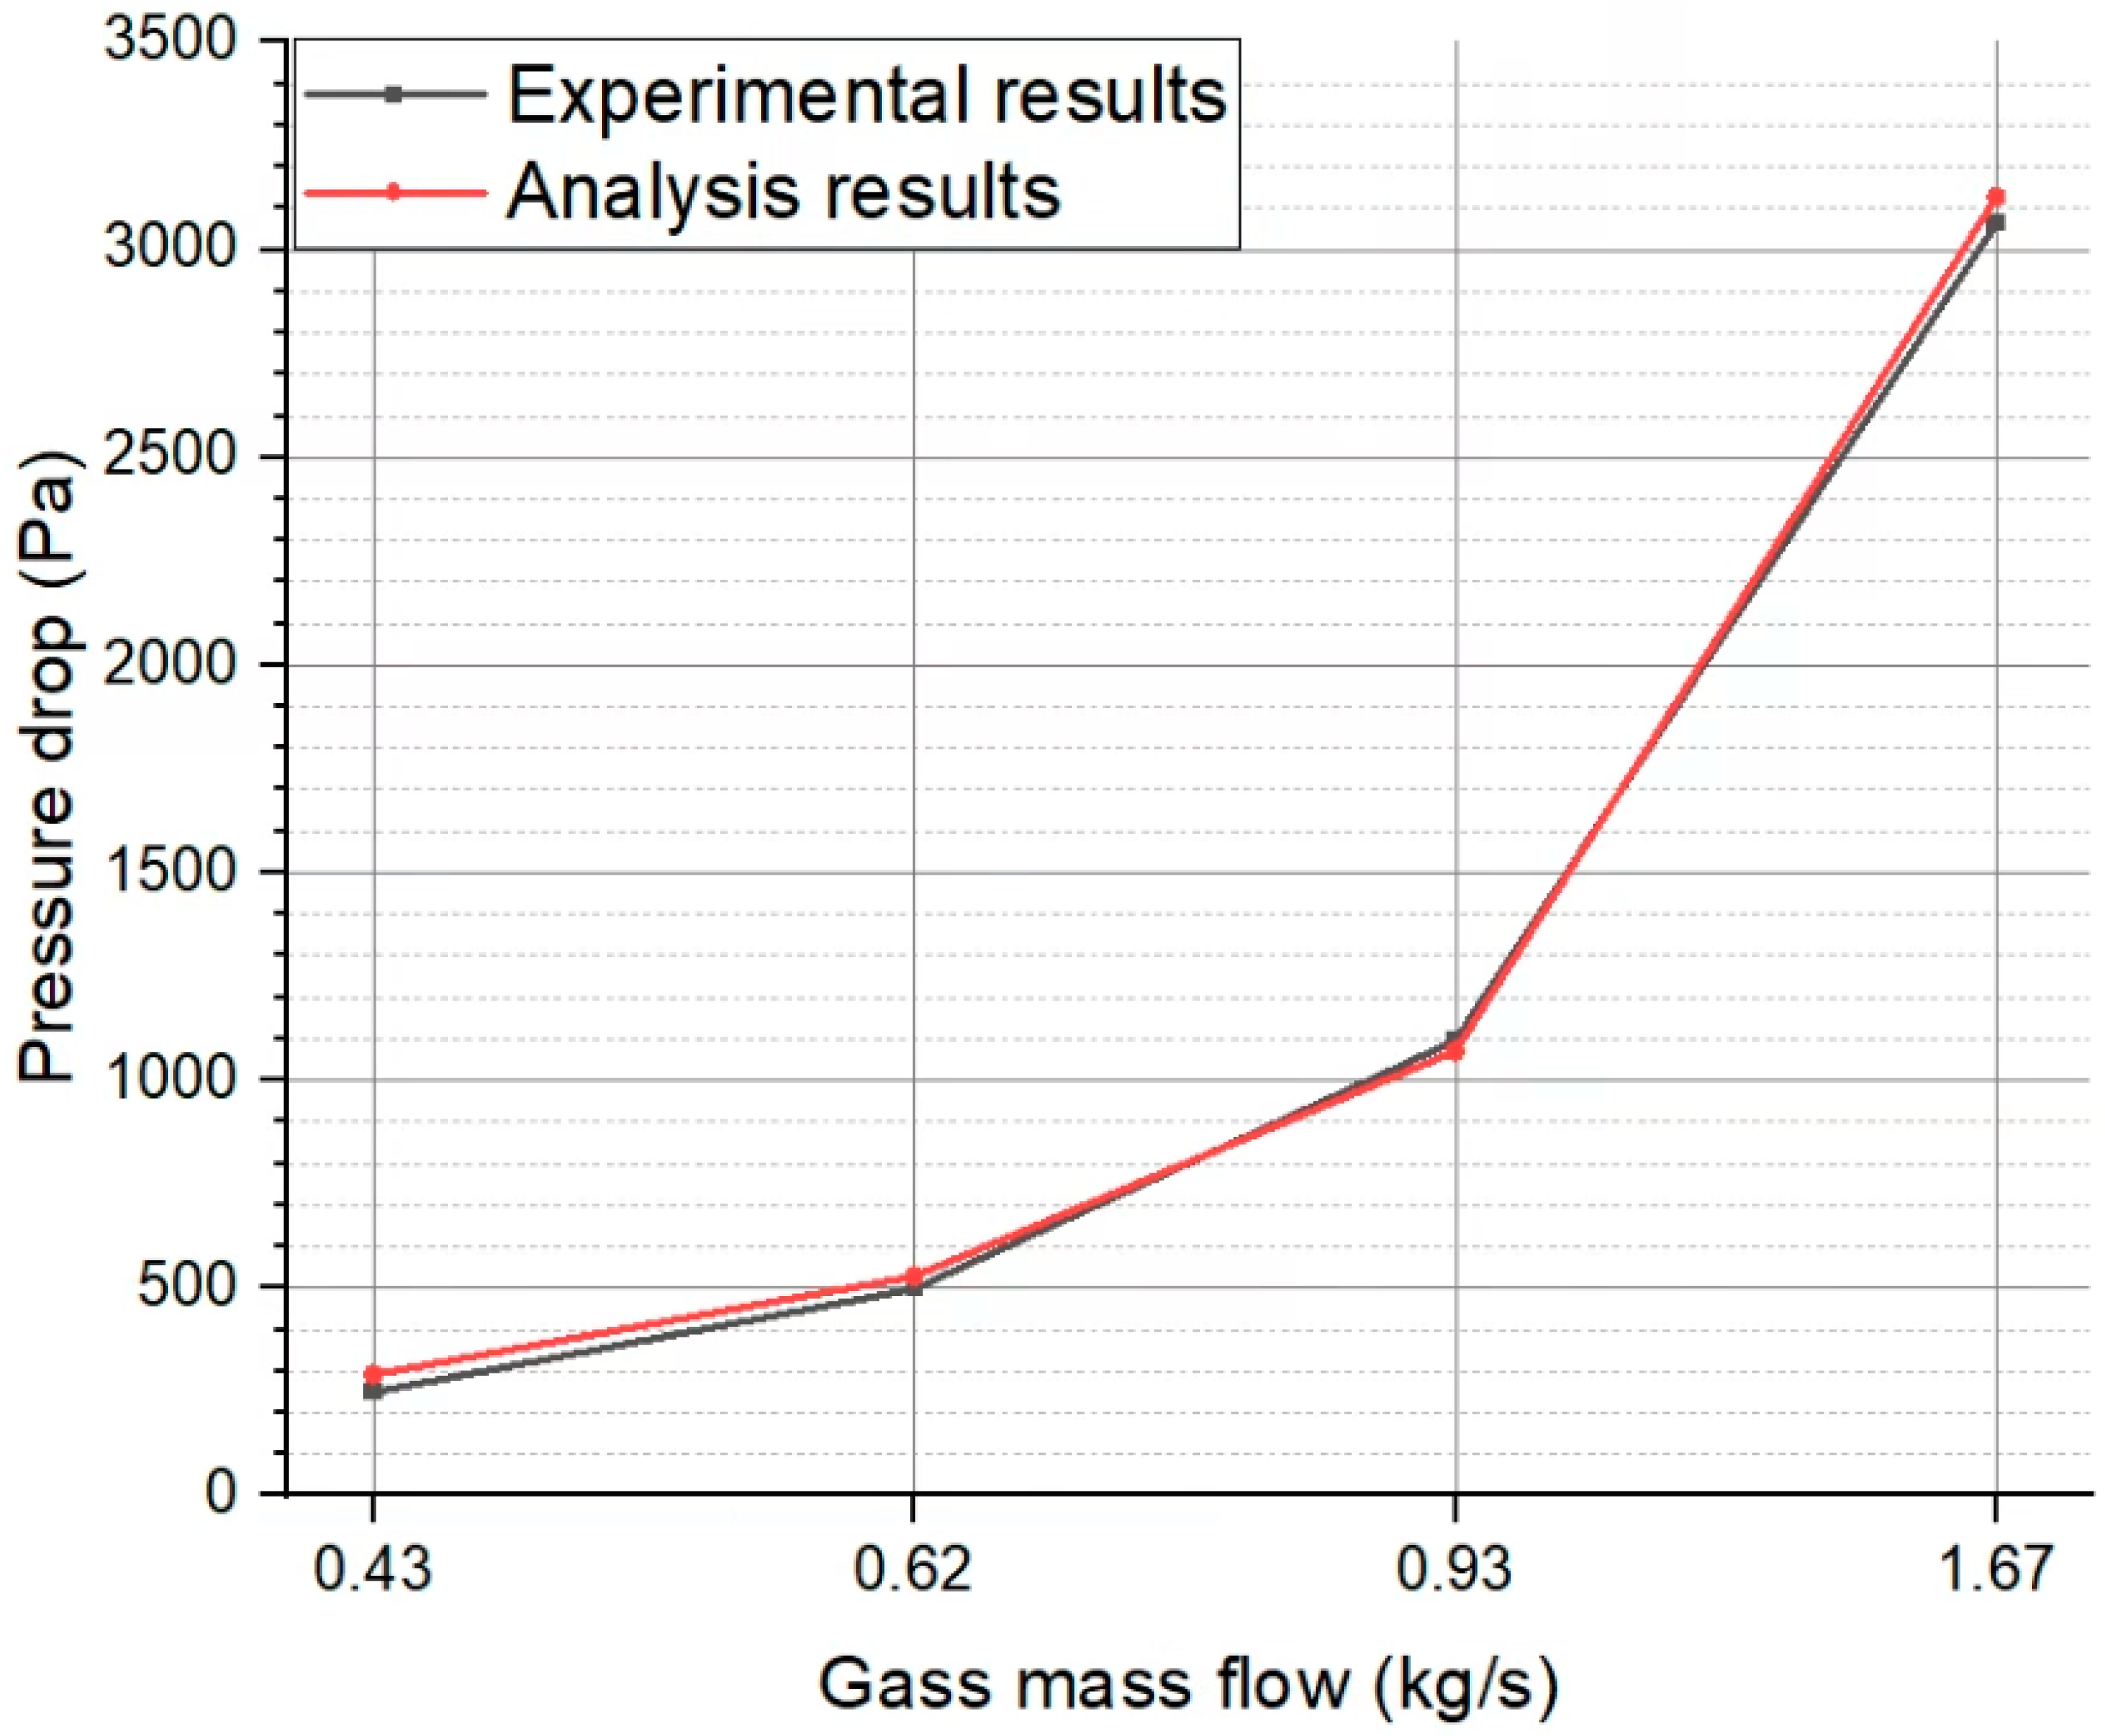
2.3.1. Flow Calculation

The ANSYS CFX program used to analyze the flow was used for various flow analysis as a commercial code and had sufficient reliability. However, for the porous condition that simulates the filling layer, the conditions must be set according to the filler used in this study, and it is necessary to compare it with the performance of the actual product. The filler used in this study is a plastic pall ring. Porous conditions were set using the pressure drop values of one-inch pall rings given in [30] (p. 12), and the pressure drop values were compared under the same conditions. Figure 5 compares the simulated value and the experimental value of the pressure drop. The comparison shows that the results are similar values in the overall area.

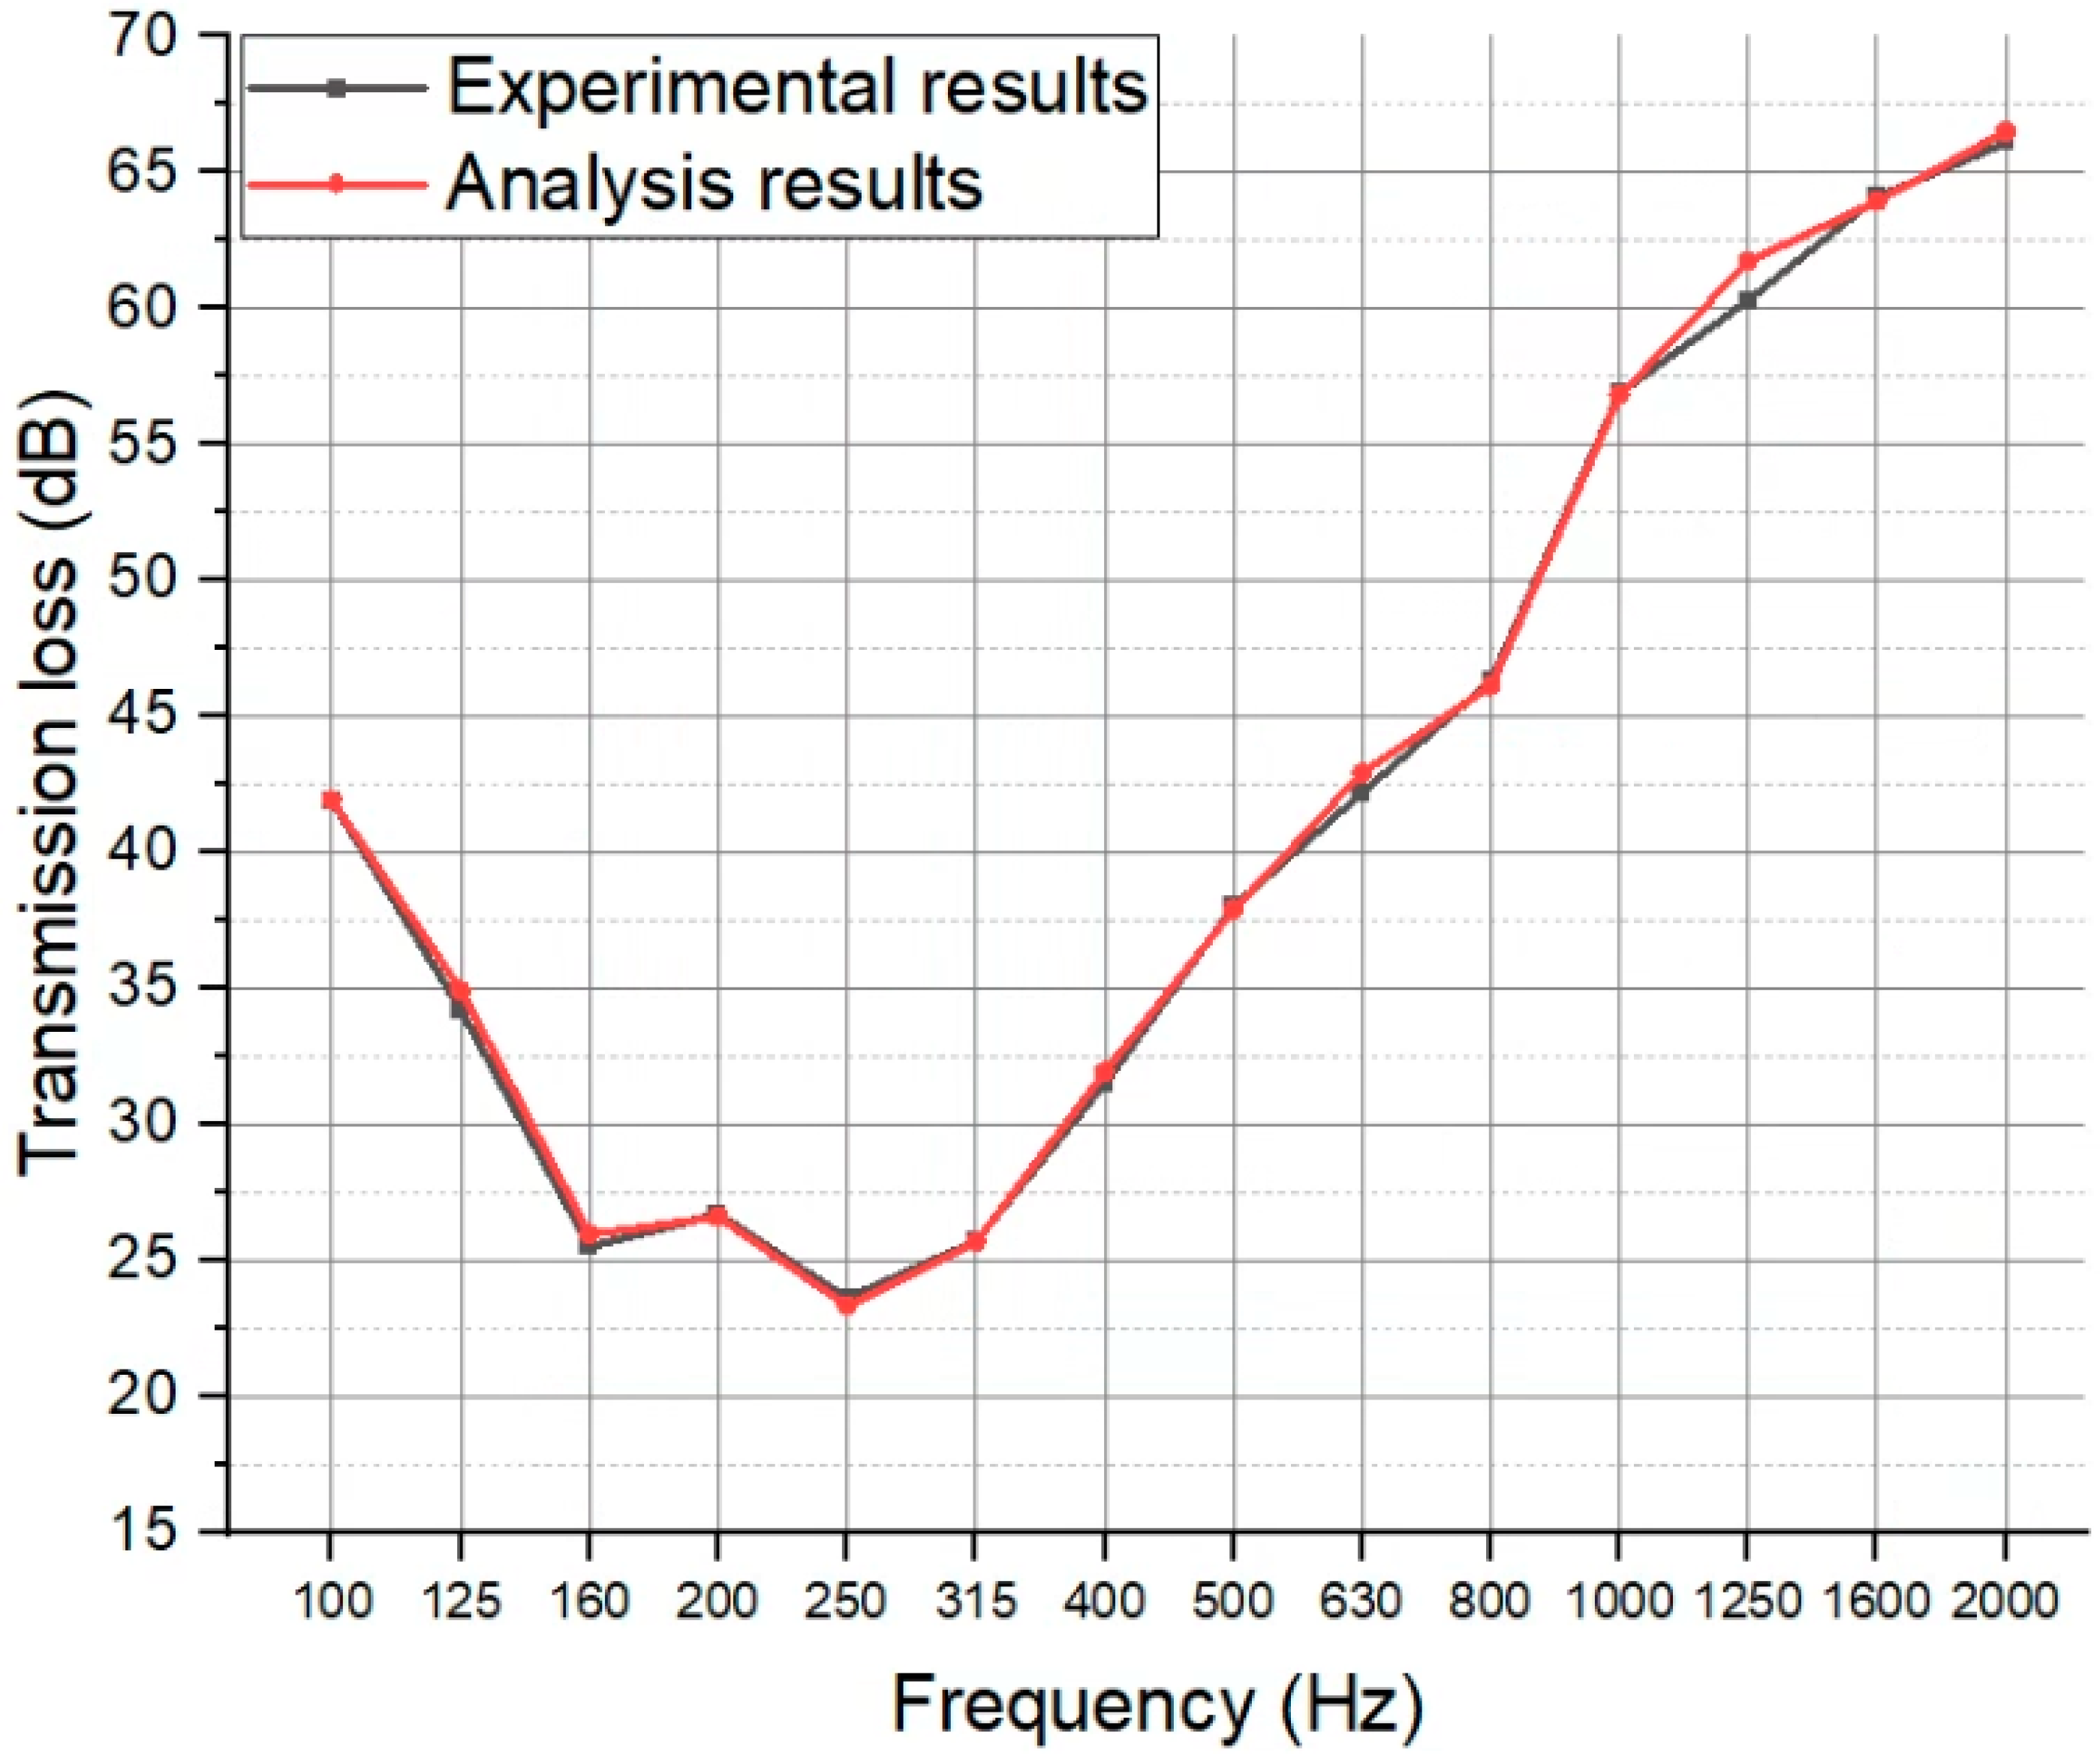
2.3.2. Acoustics Calculation

Acoustic behavior was analyzed using Acoustics ACT provided by ANSYS. In order to secure the reliability of the acoustic analysis, test report through experiments were requested. Moreover, the experimental and analysis values were compared. The sound loss was measured by generating a sound source inside the reverberation room and calculating the difference between the sound pressure level L1 (dB) measured 1 m in front of the speaker and the sound pressure level L2 (dB) measured after passing through the scrubber. Figure 6 is a graph comparing the experimental and analysis values. As a result of comparing the experimental and analysis values, the error was less than 2 dB.

2.4. Calculation Condition

Figure 7 shows the structure and cross-sectional view of the composite scrubber. The structure of the composite scrubber is divided into four parts: inlet, spray, porous, and silencer. The diameter of the inlet area is 800 mm, the diameter of the porous area and the spray area is 500 mm, and the diameter of the silencer area is 650 mm. The heights of the inlet, porous, spray, and silencer area are 1500, 500, 600, and 600 mm, respectively. Five sprays are located 400 mm above the bottom of the spray domain and are 150 mm apart from the center in four directions: top, bottom, and both sides. The bottom of the inlet area was inclined by 10° to facilitate the discharge of washing water. A guide vane was installed above the inlet to prevent the sprayed water from flowing back into the inlet. The inclination of the vanes was 10°, the number of vanes was 11, and the distance between the vanes was 10 mm.
Table 1 shows the test cases. Vane type and resonate type were applied to the scrubber. Vane surface was covered with a sound-absorbing material of polyether 24. The length and inclination direction of the vane had a great effect on the sound waves due to the phase change of the sound waves, and had a great influence on the sound absorption performance, according to the area variation of the sound absorption material. Therefore, the effect was analyzed by increasing the length of the vane by 25 mm, from 150 mm to 250 mm, and the effect was analyzed by changing the inclination direction angle of the vane by 10° in the forward and reverse directions to the flow direction of the fluid. In the Resonate type, the same sound absorbing material was attached to the inner wall of the resonate tube, and the hole location and number of holes were expected to affect the sound wave synthesis. The effect was analyzed by increasing the number of holes by 30 from 60 to 150.
Table 2 shows the specifications of the target engine used in the study. Allowable pressure means the limit of engine back pressure (it was 1200 Pa).
Table 3 shows the calculation conditions used for flow analysis. Applied materials are ideal air, water liquid, and water vapor, and the phase change between water liquid and vapor was considered. The number of sprays was five, at a flow rate of 1.1 kg/s. The gas inlet flow rate was 0.55 kg/s and the temperature was 230 °C. The outlet was set equal to atmospheric pressure, and the porosity of the porous domain was set to 0.902. The server’s CPU (Central Processing Unit) used for analysis is Intel® Xeon® 2nd generation (Intel corporation: Santa Clara, CA, USA), and the analysis time per each case was 10 to 12 h.
The pressure drop represents the difference in pressure between the inlet and outlet. Since the pressure is fixed at the atmospheric pressure at the outlet, the pressure generated by the inlet minus the atmospheric pressure becomes the pressure drop, which is the same as the engine back pressure. Considering various devices, such as the turbocharger and economizer mounted after the engine exhaust, the back pressure generated by the composite scrubber should not exceed 840 Pa, which is 70% of the allowable engine pressure. If it exceeds this value, the case is excluded from the optimal shape.
In the case of acoustic analysis, the inlet frequency condition is given as 100, 125, 160, 200, 250, 315, 400, 500, 630, 800, 1000, 1250, 1600, 2000 Hz. The sound absorption coefficient of polyester (24 kg/m3 25 mm) used for the inner wall of vane and resonance tube was given by [31] (p. 104).

3. Result and Discussion

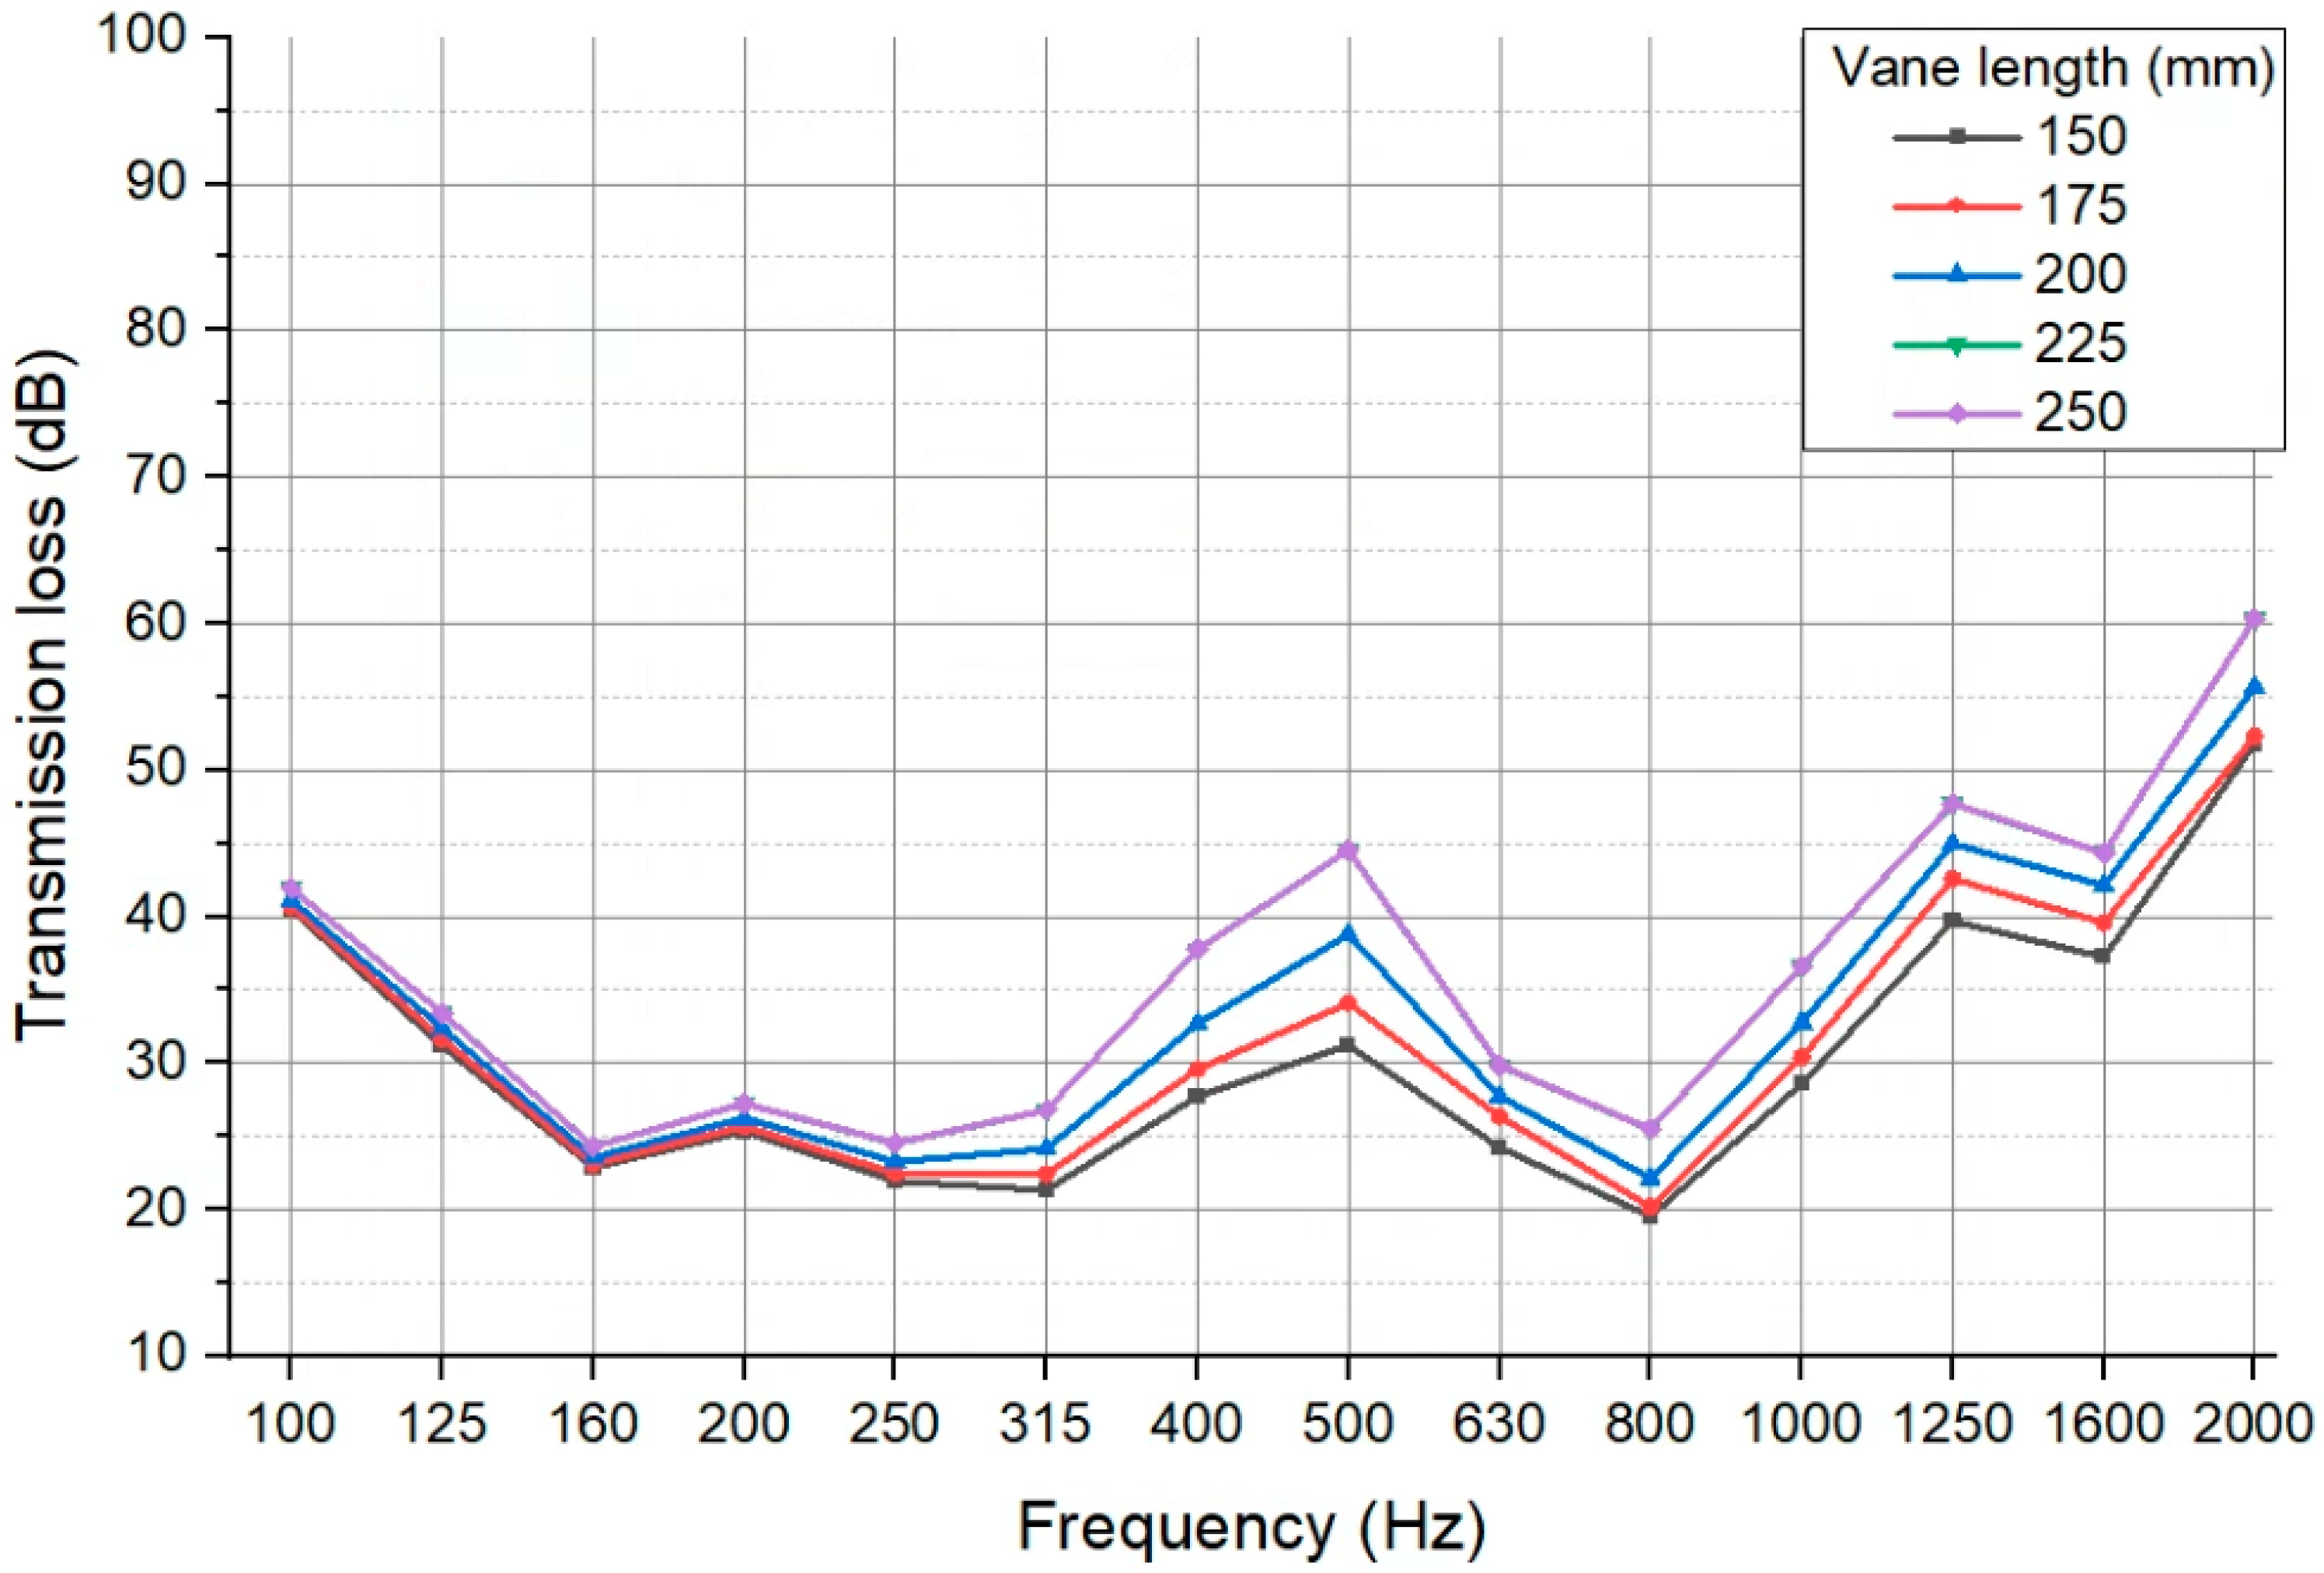
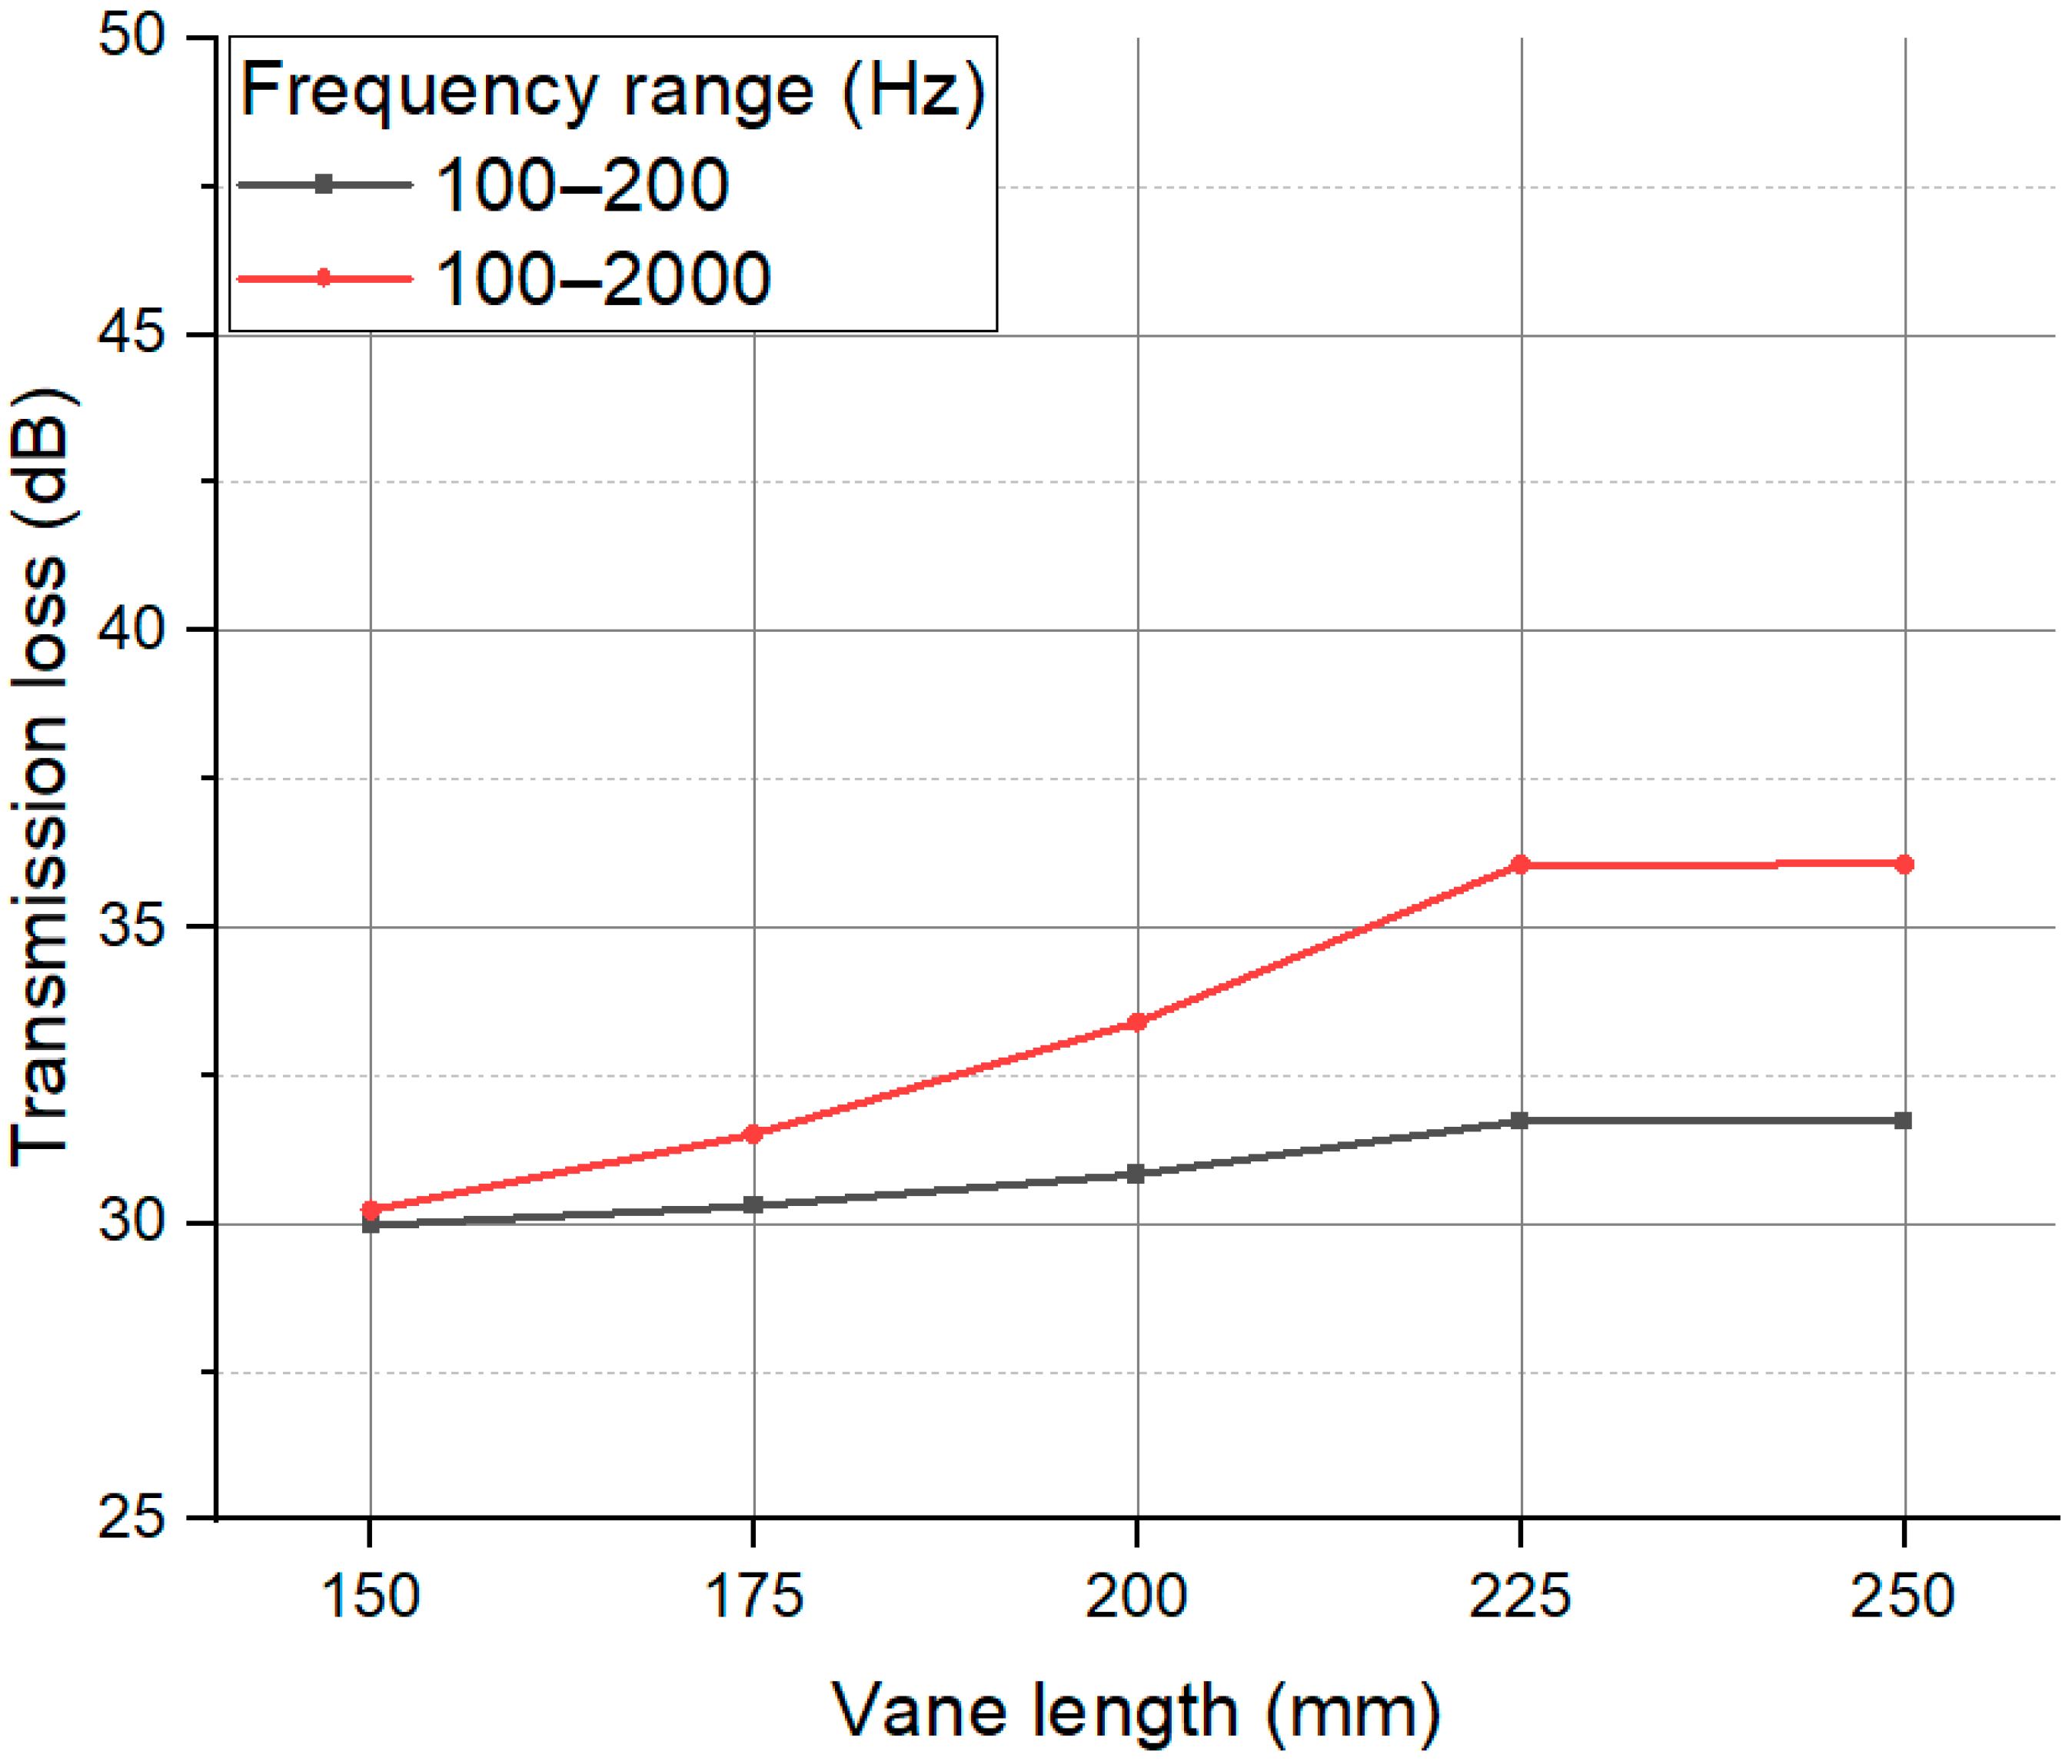
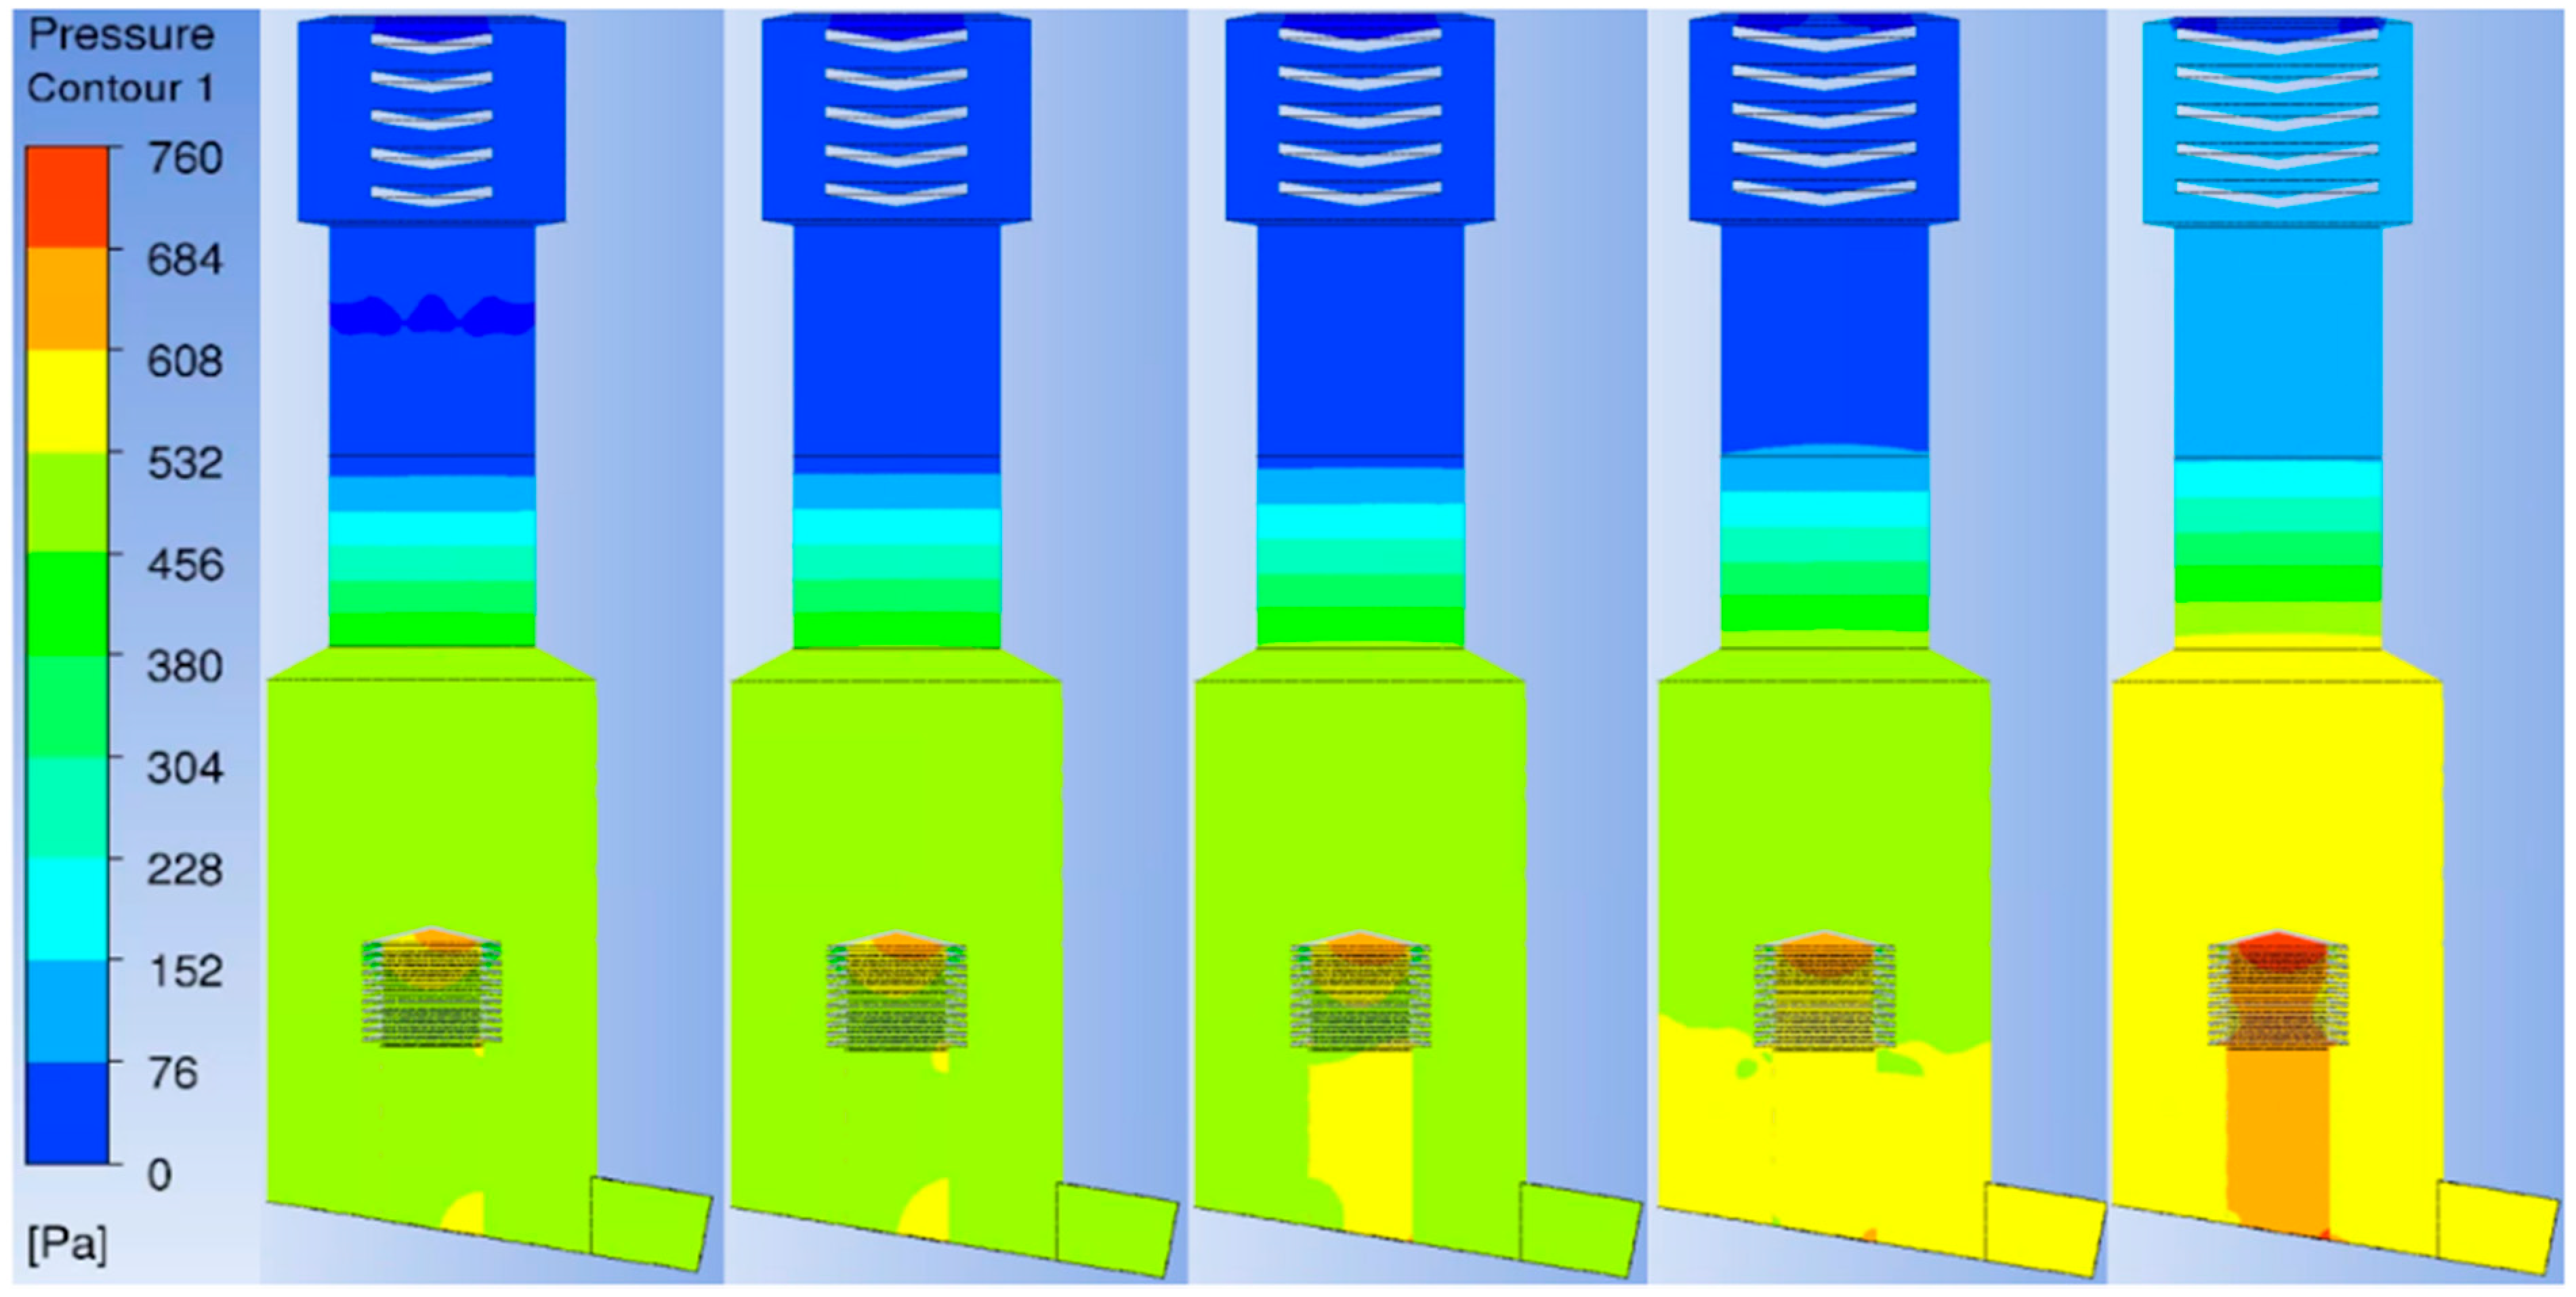
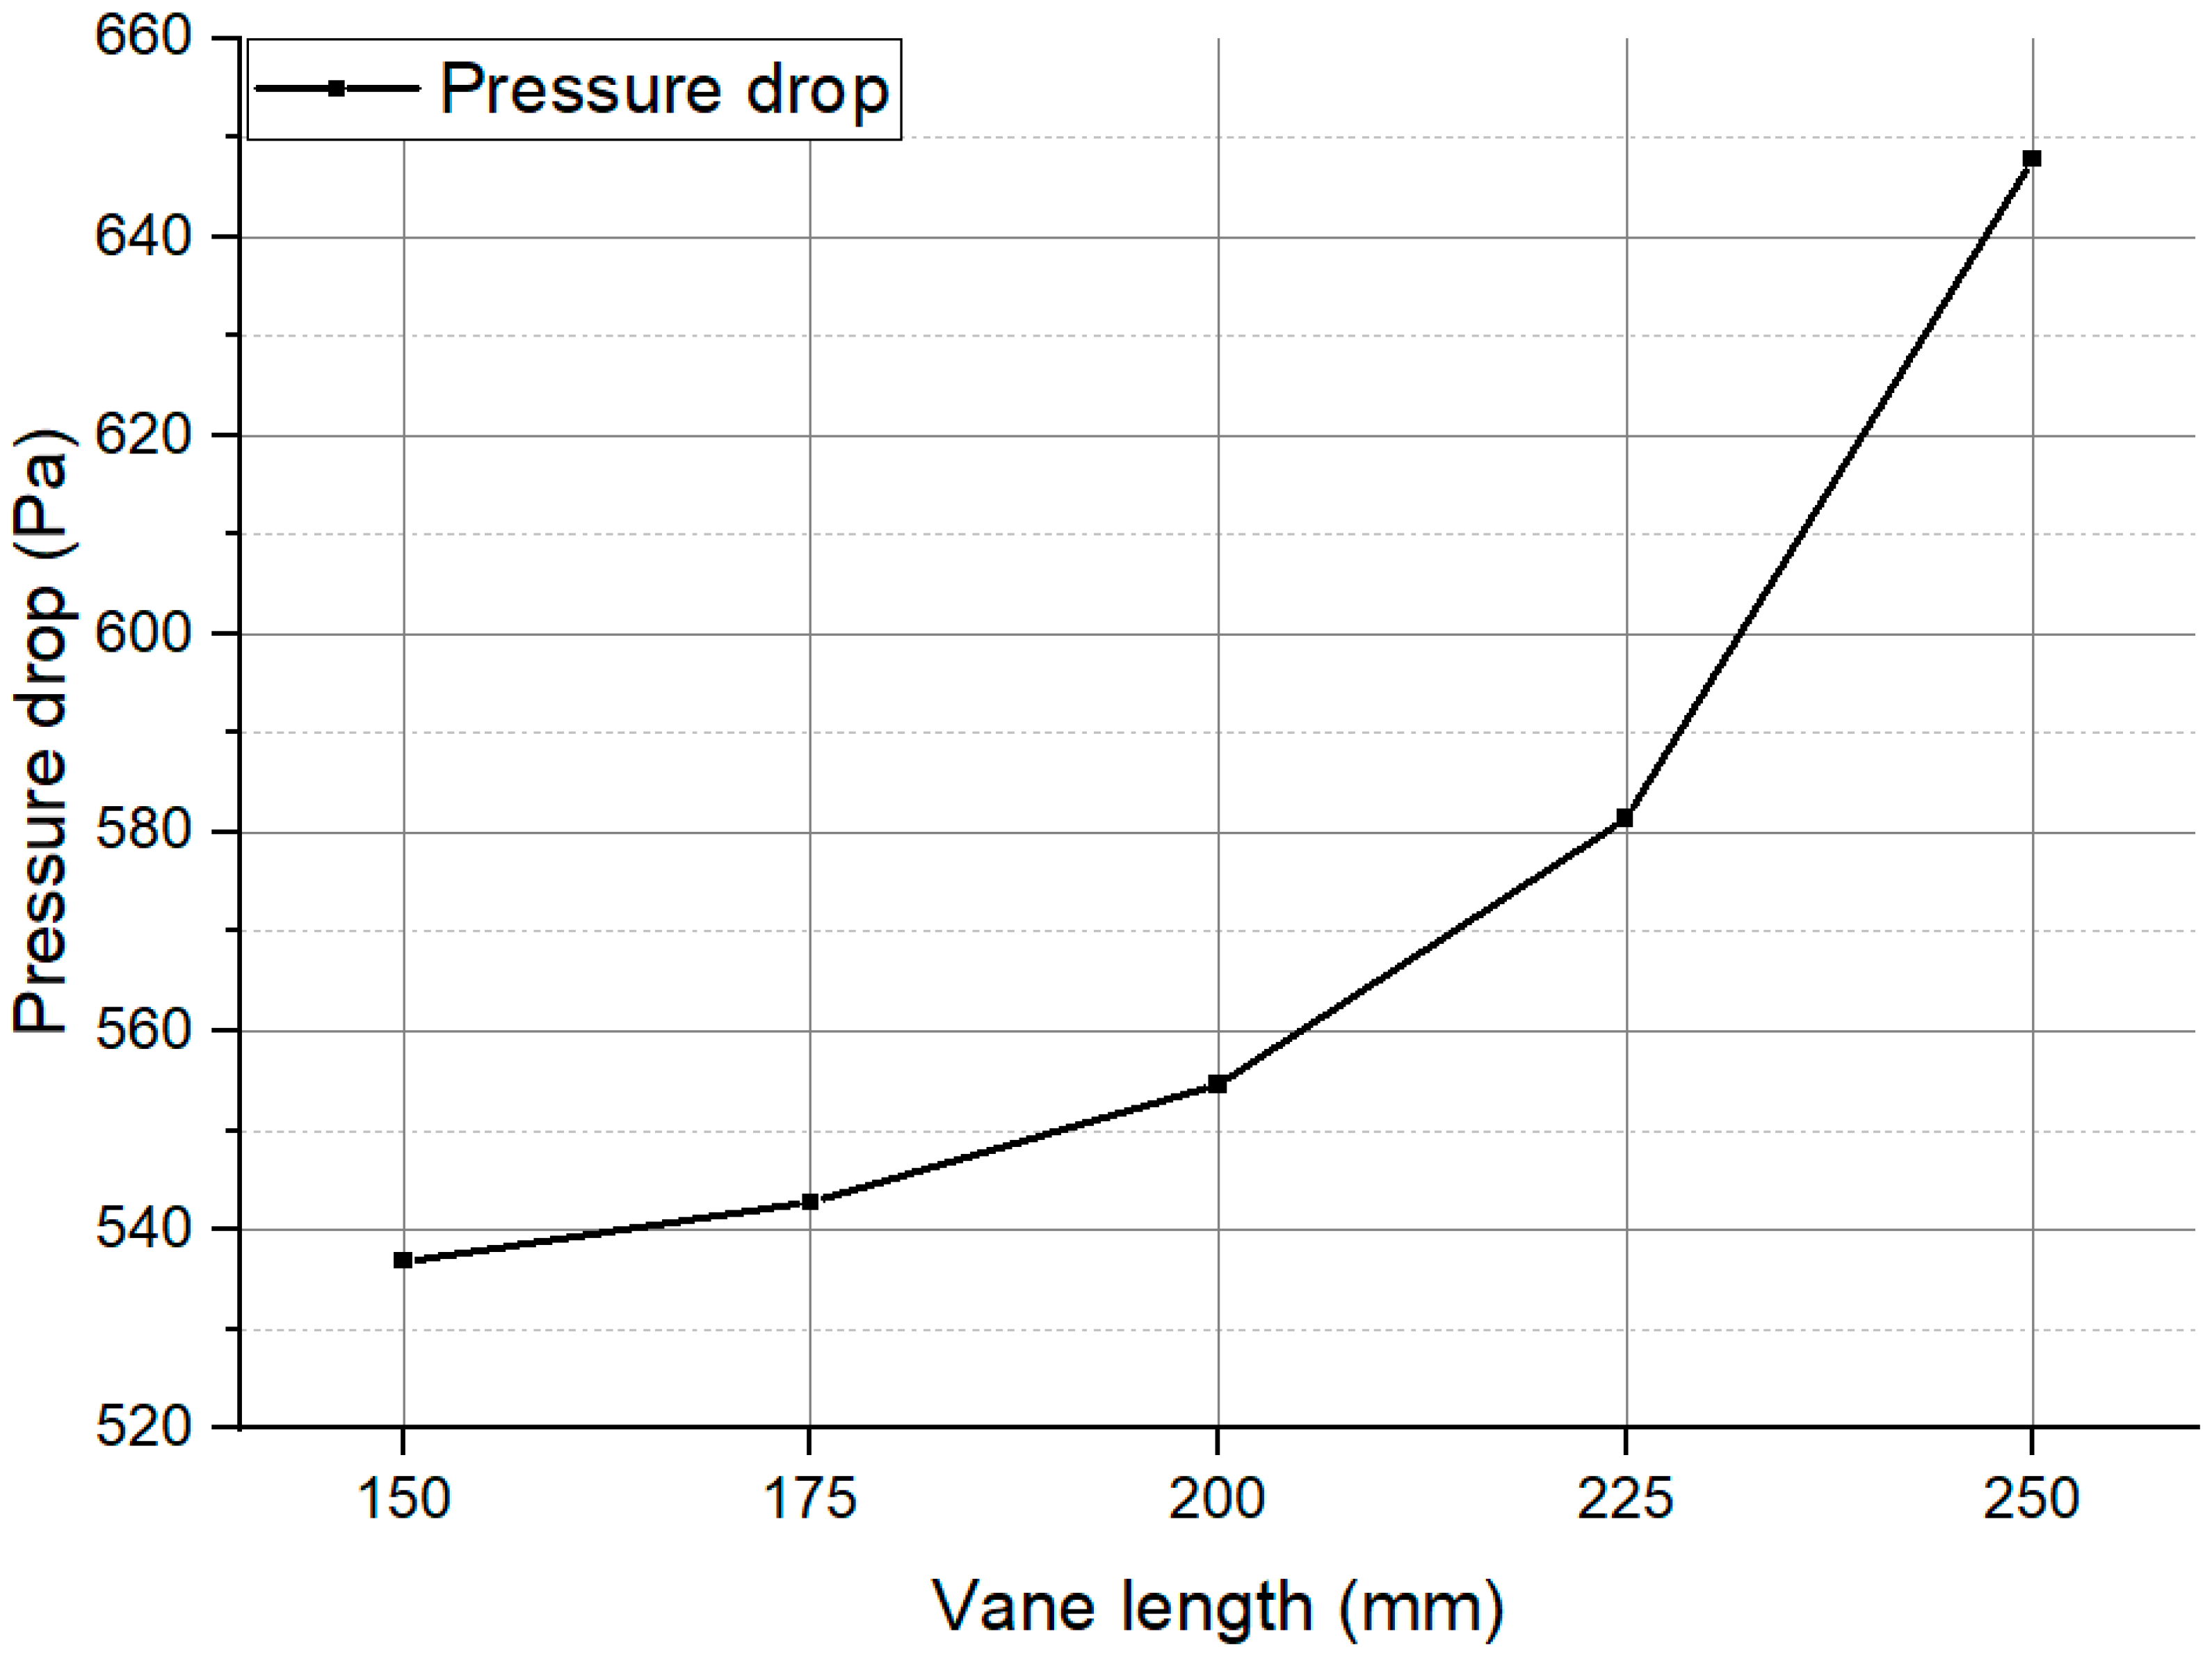
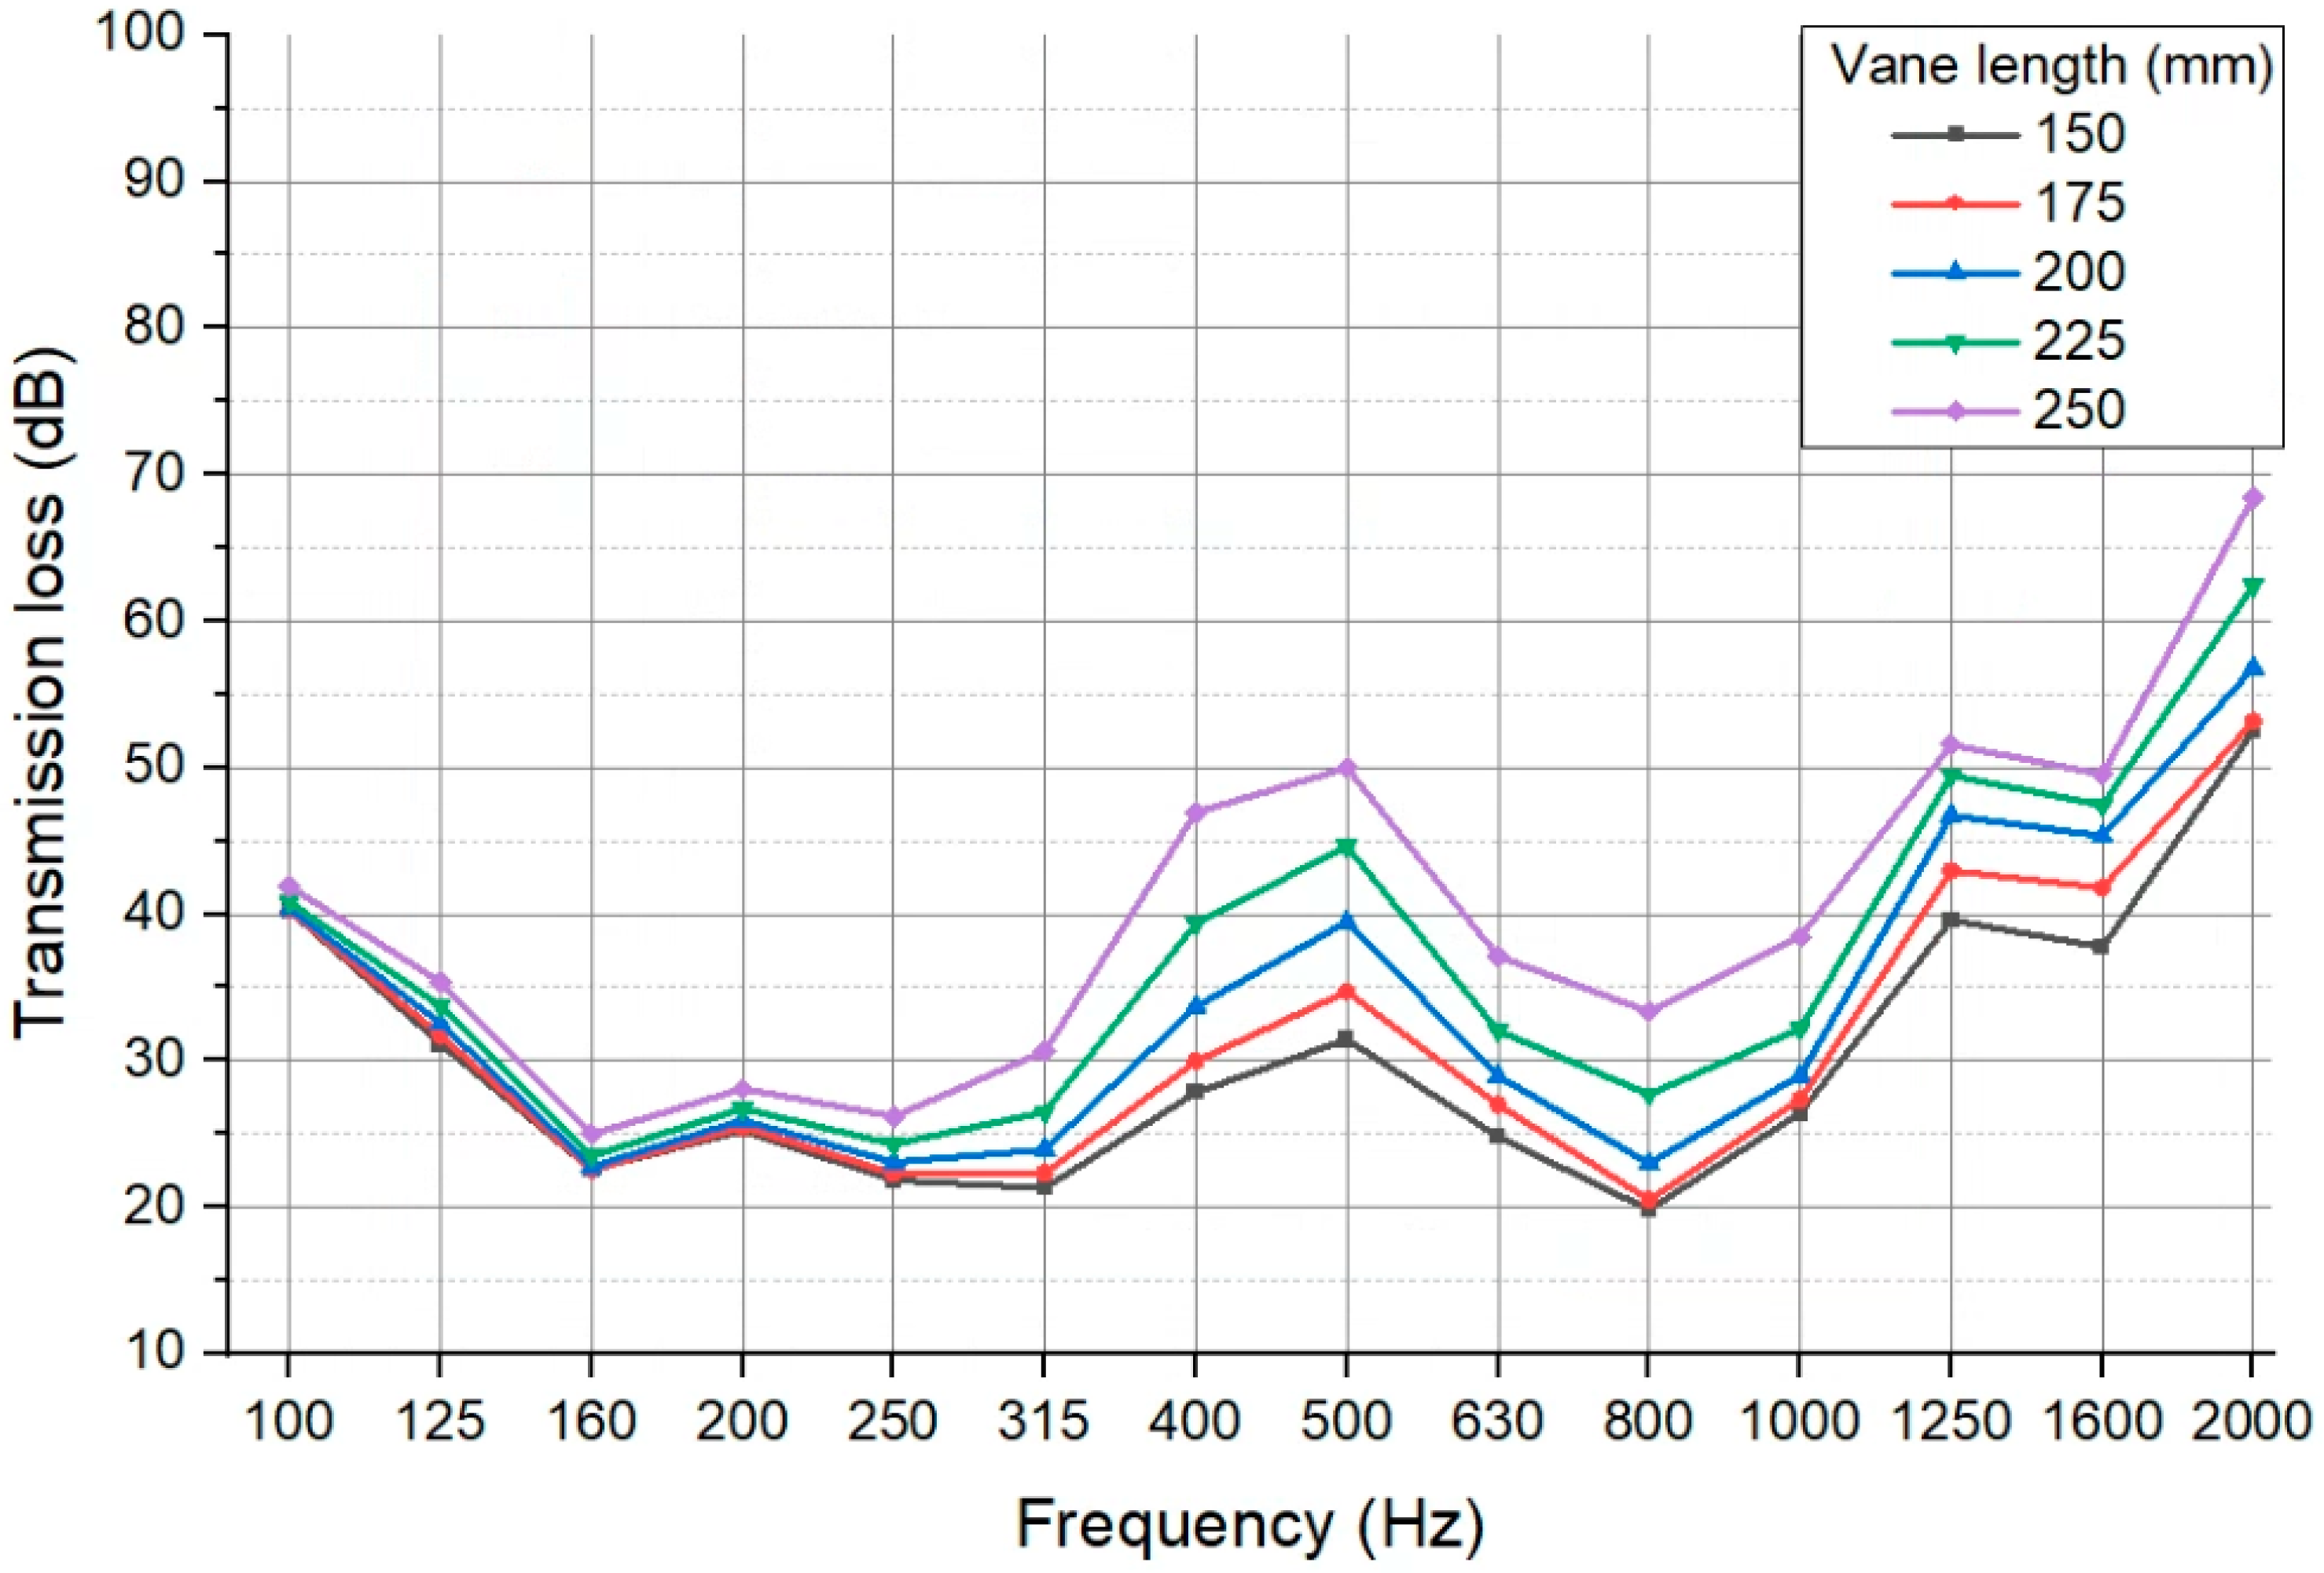
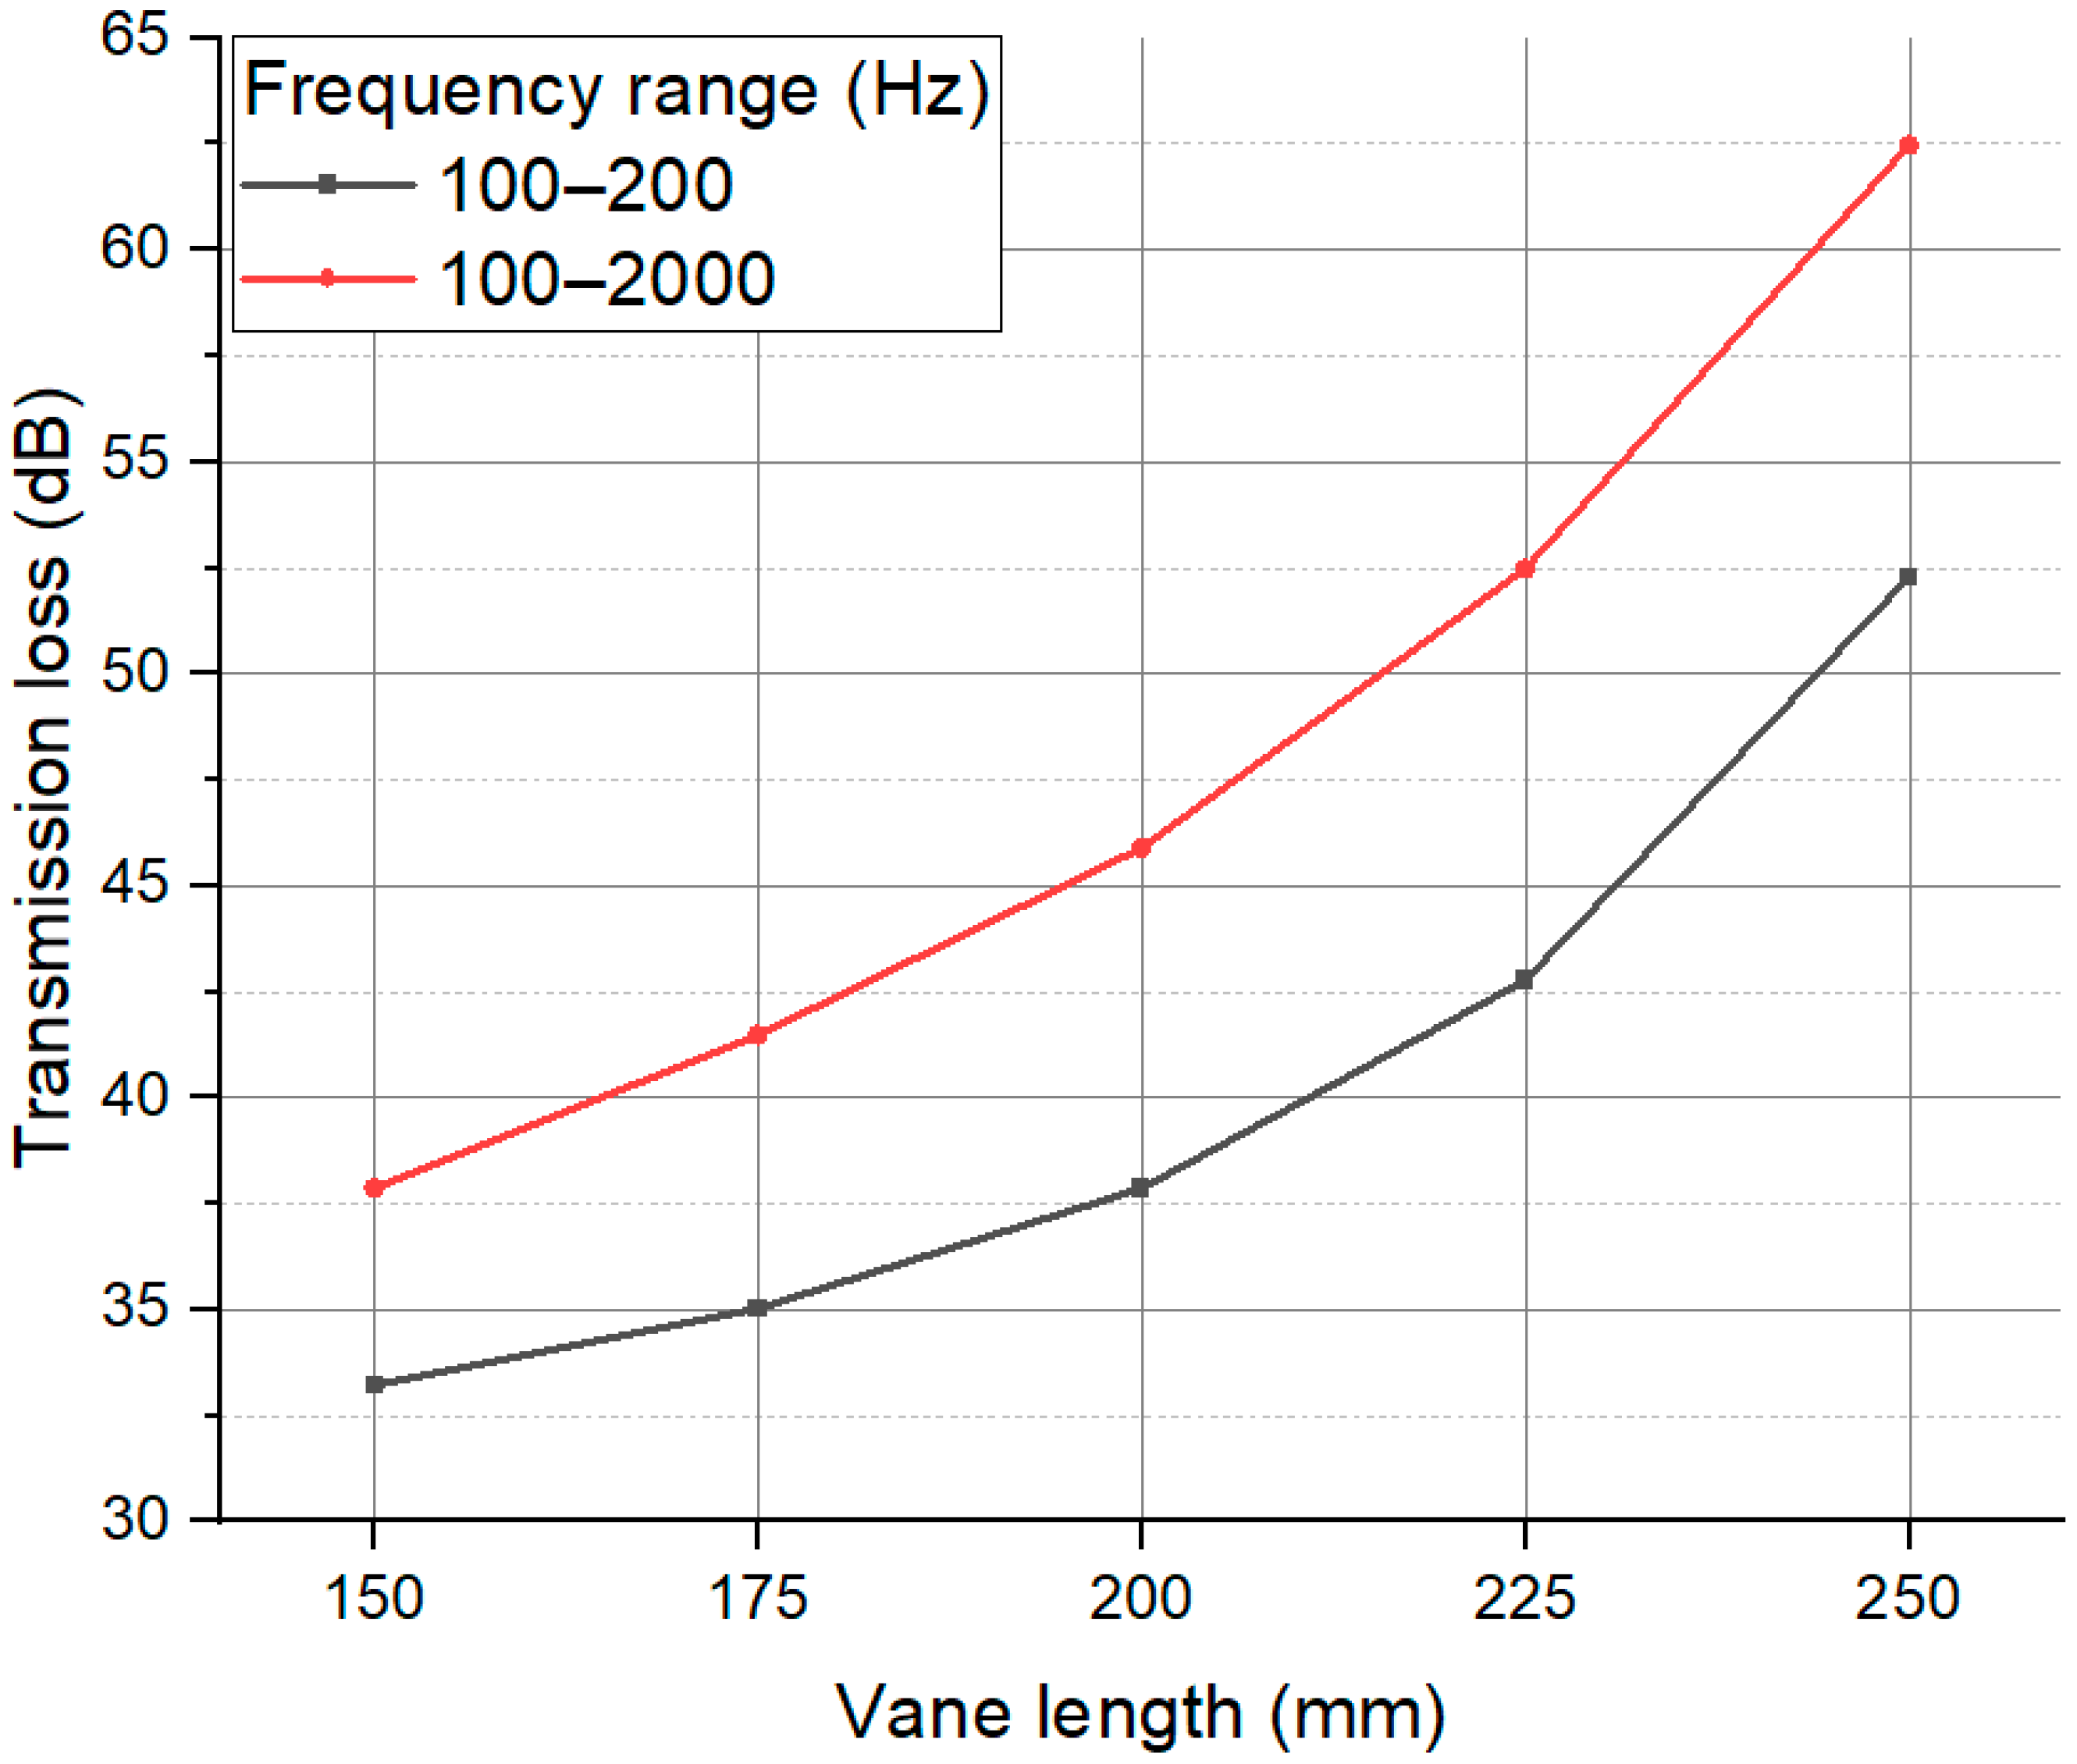
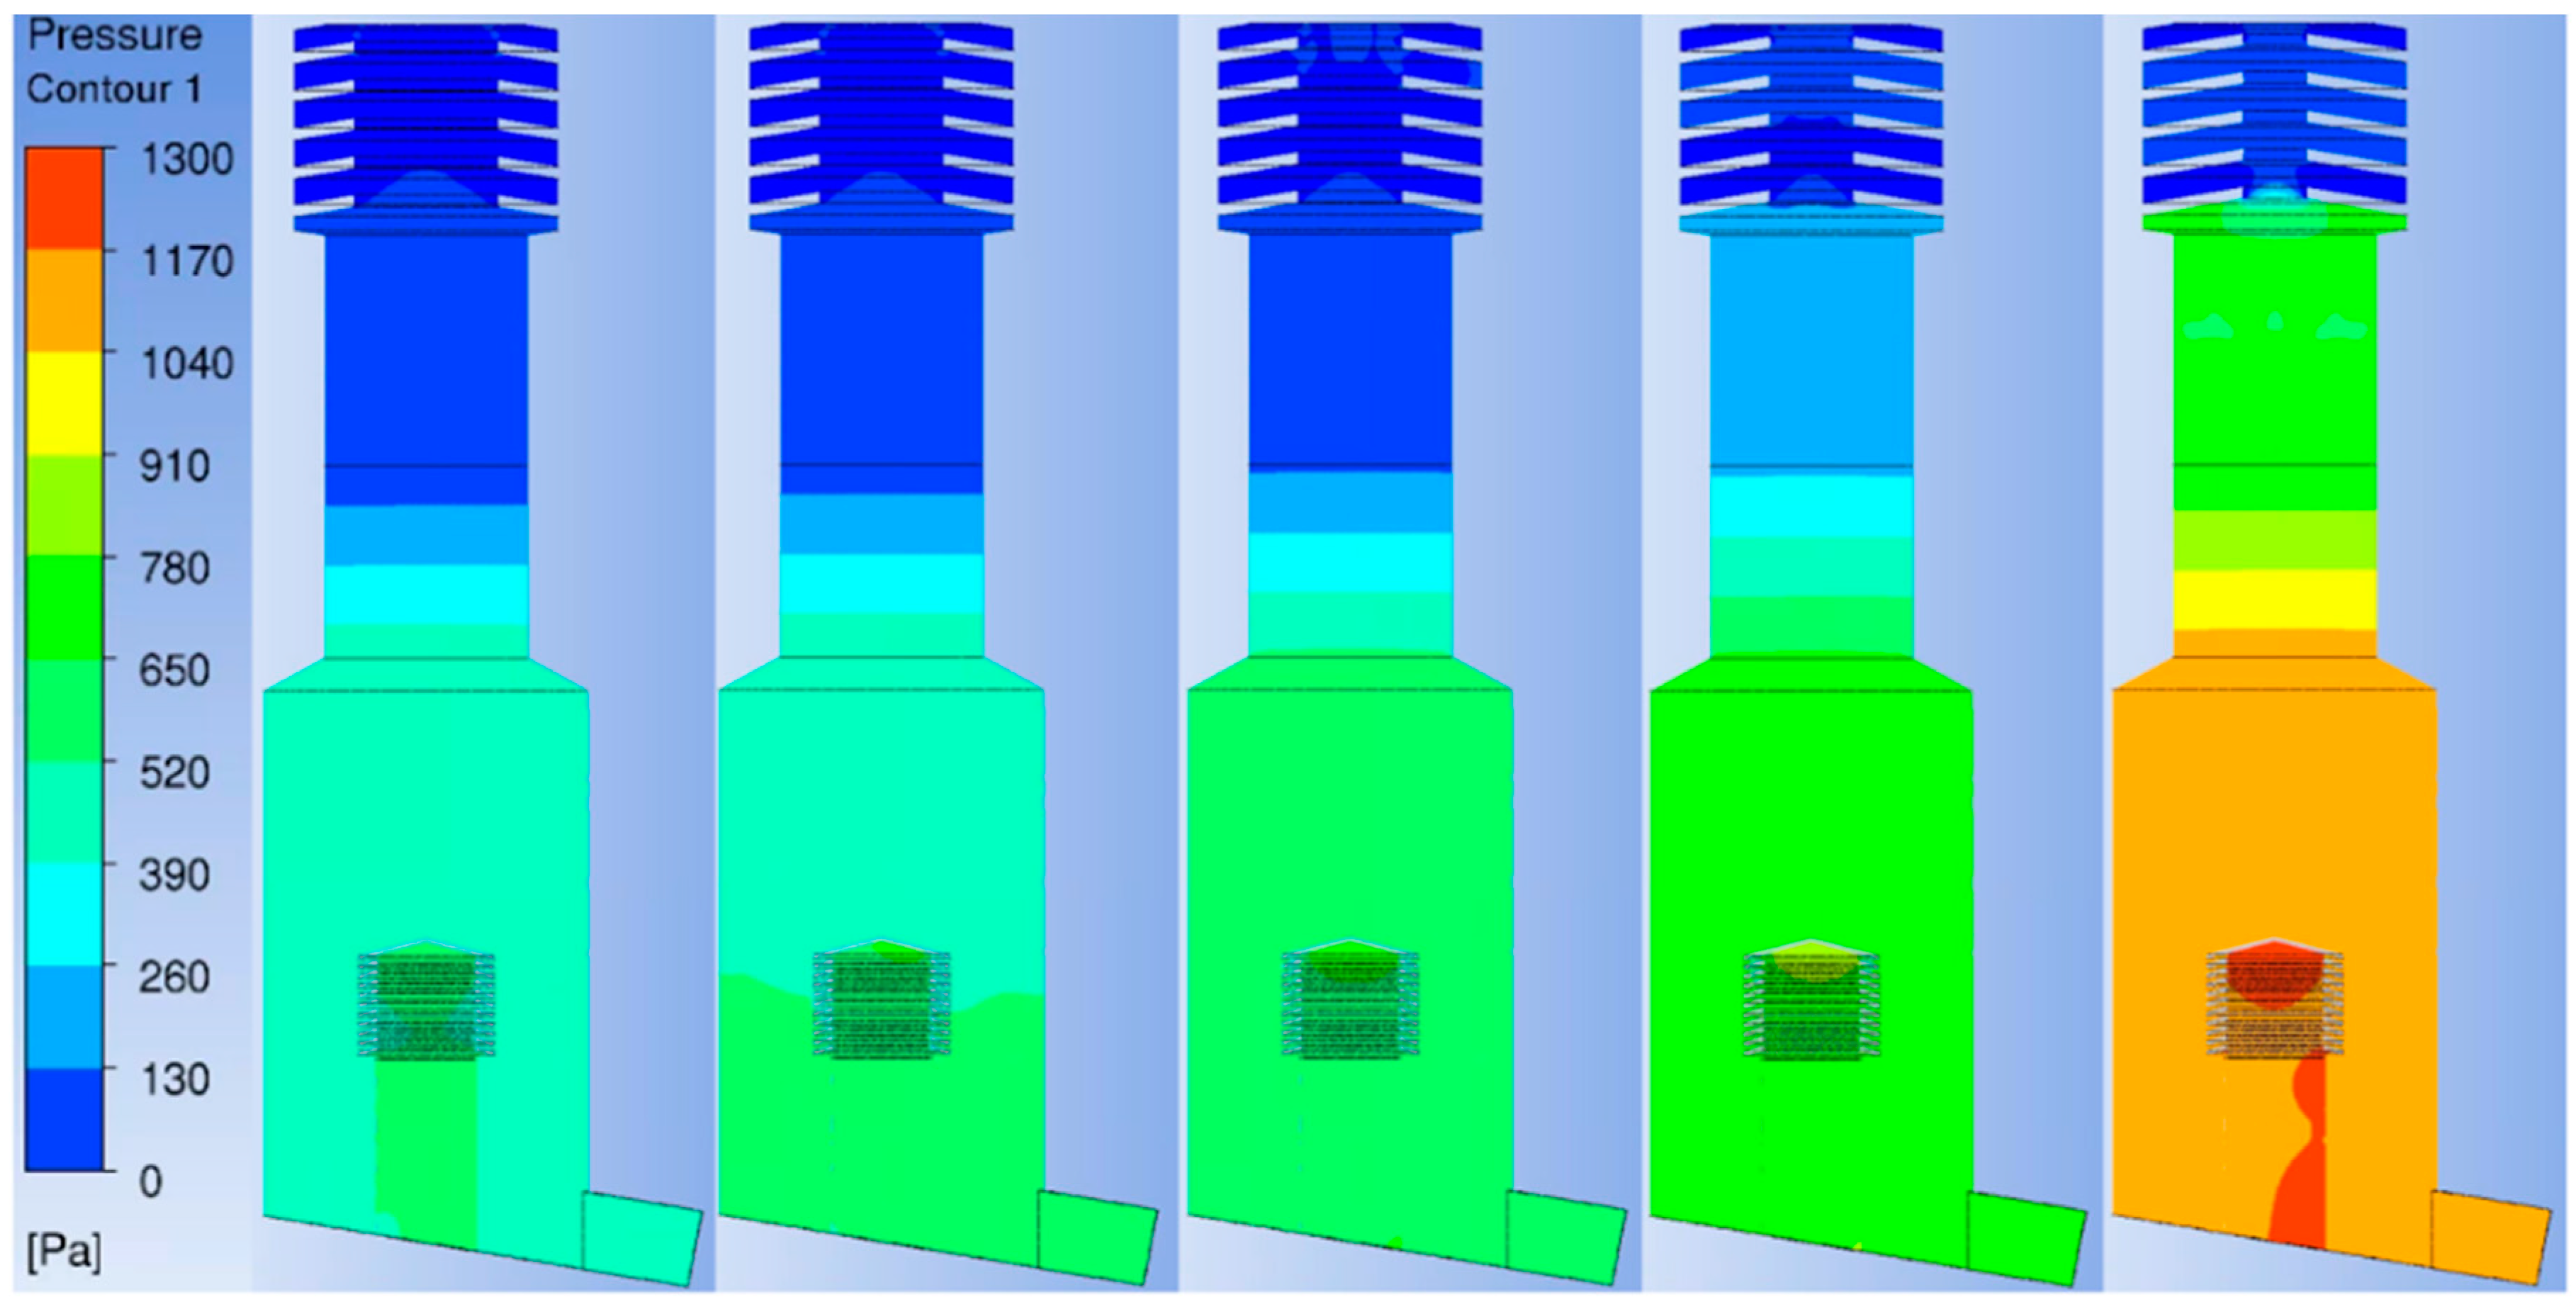
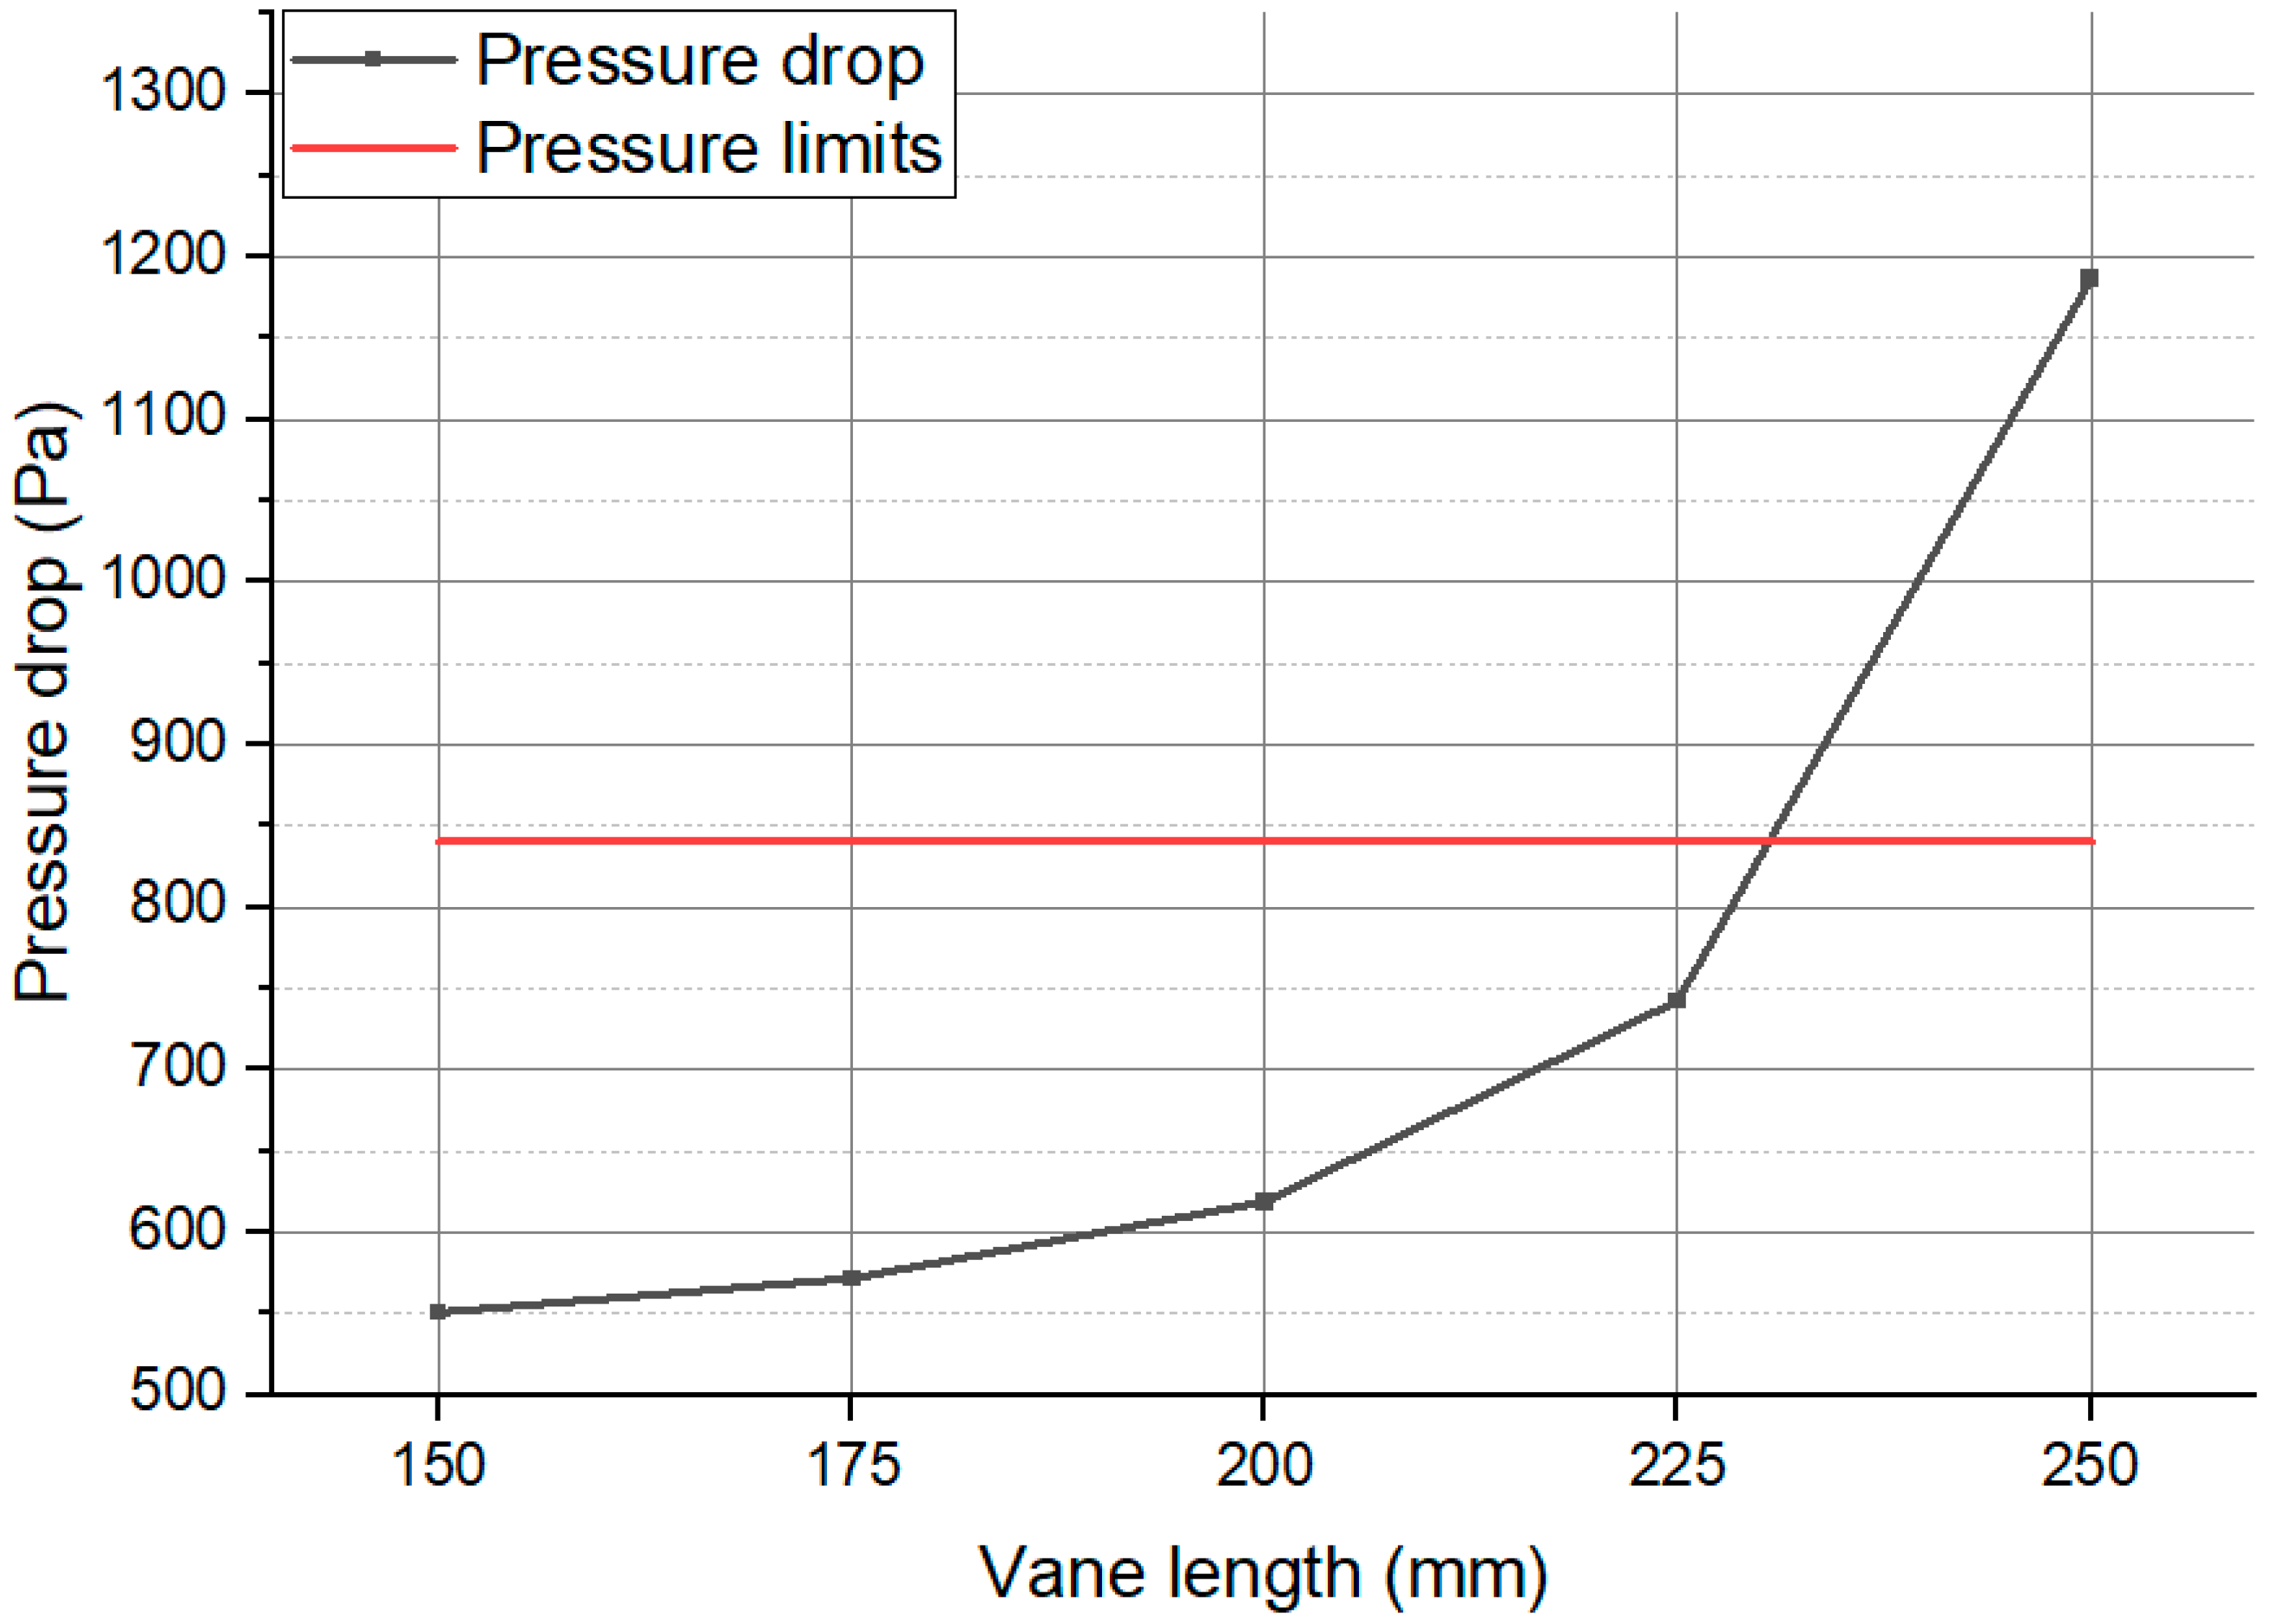
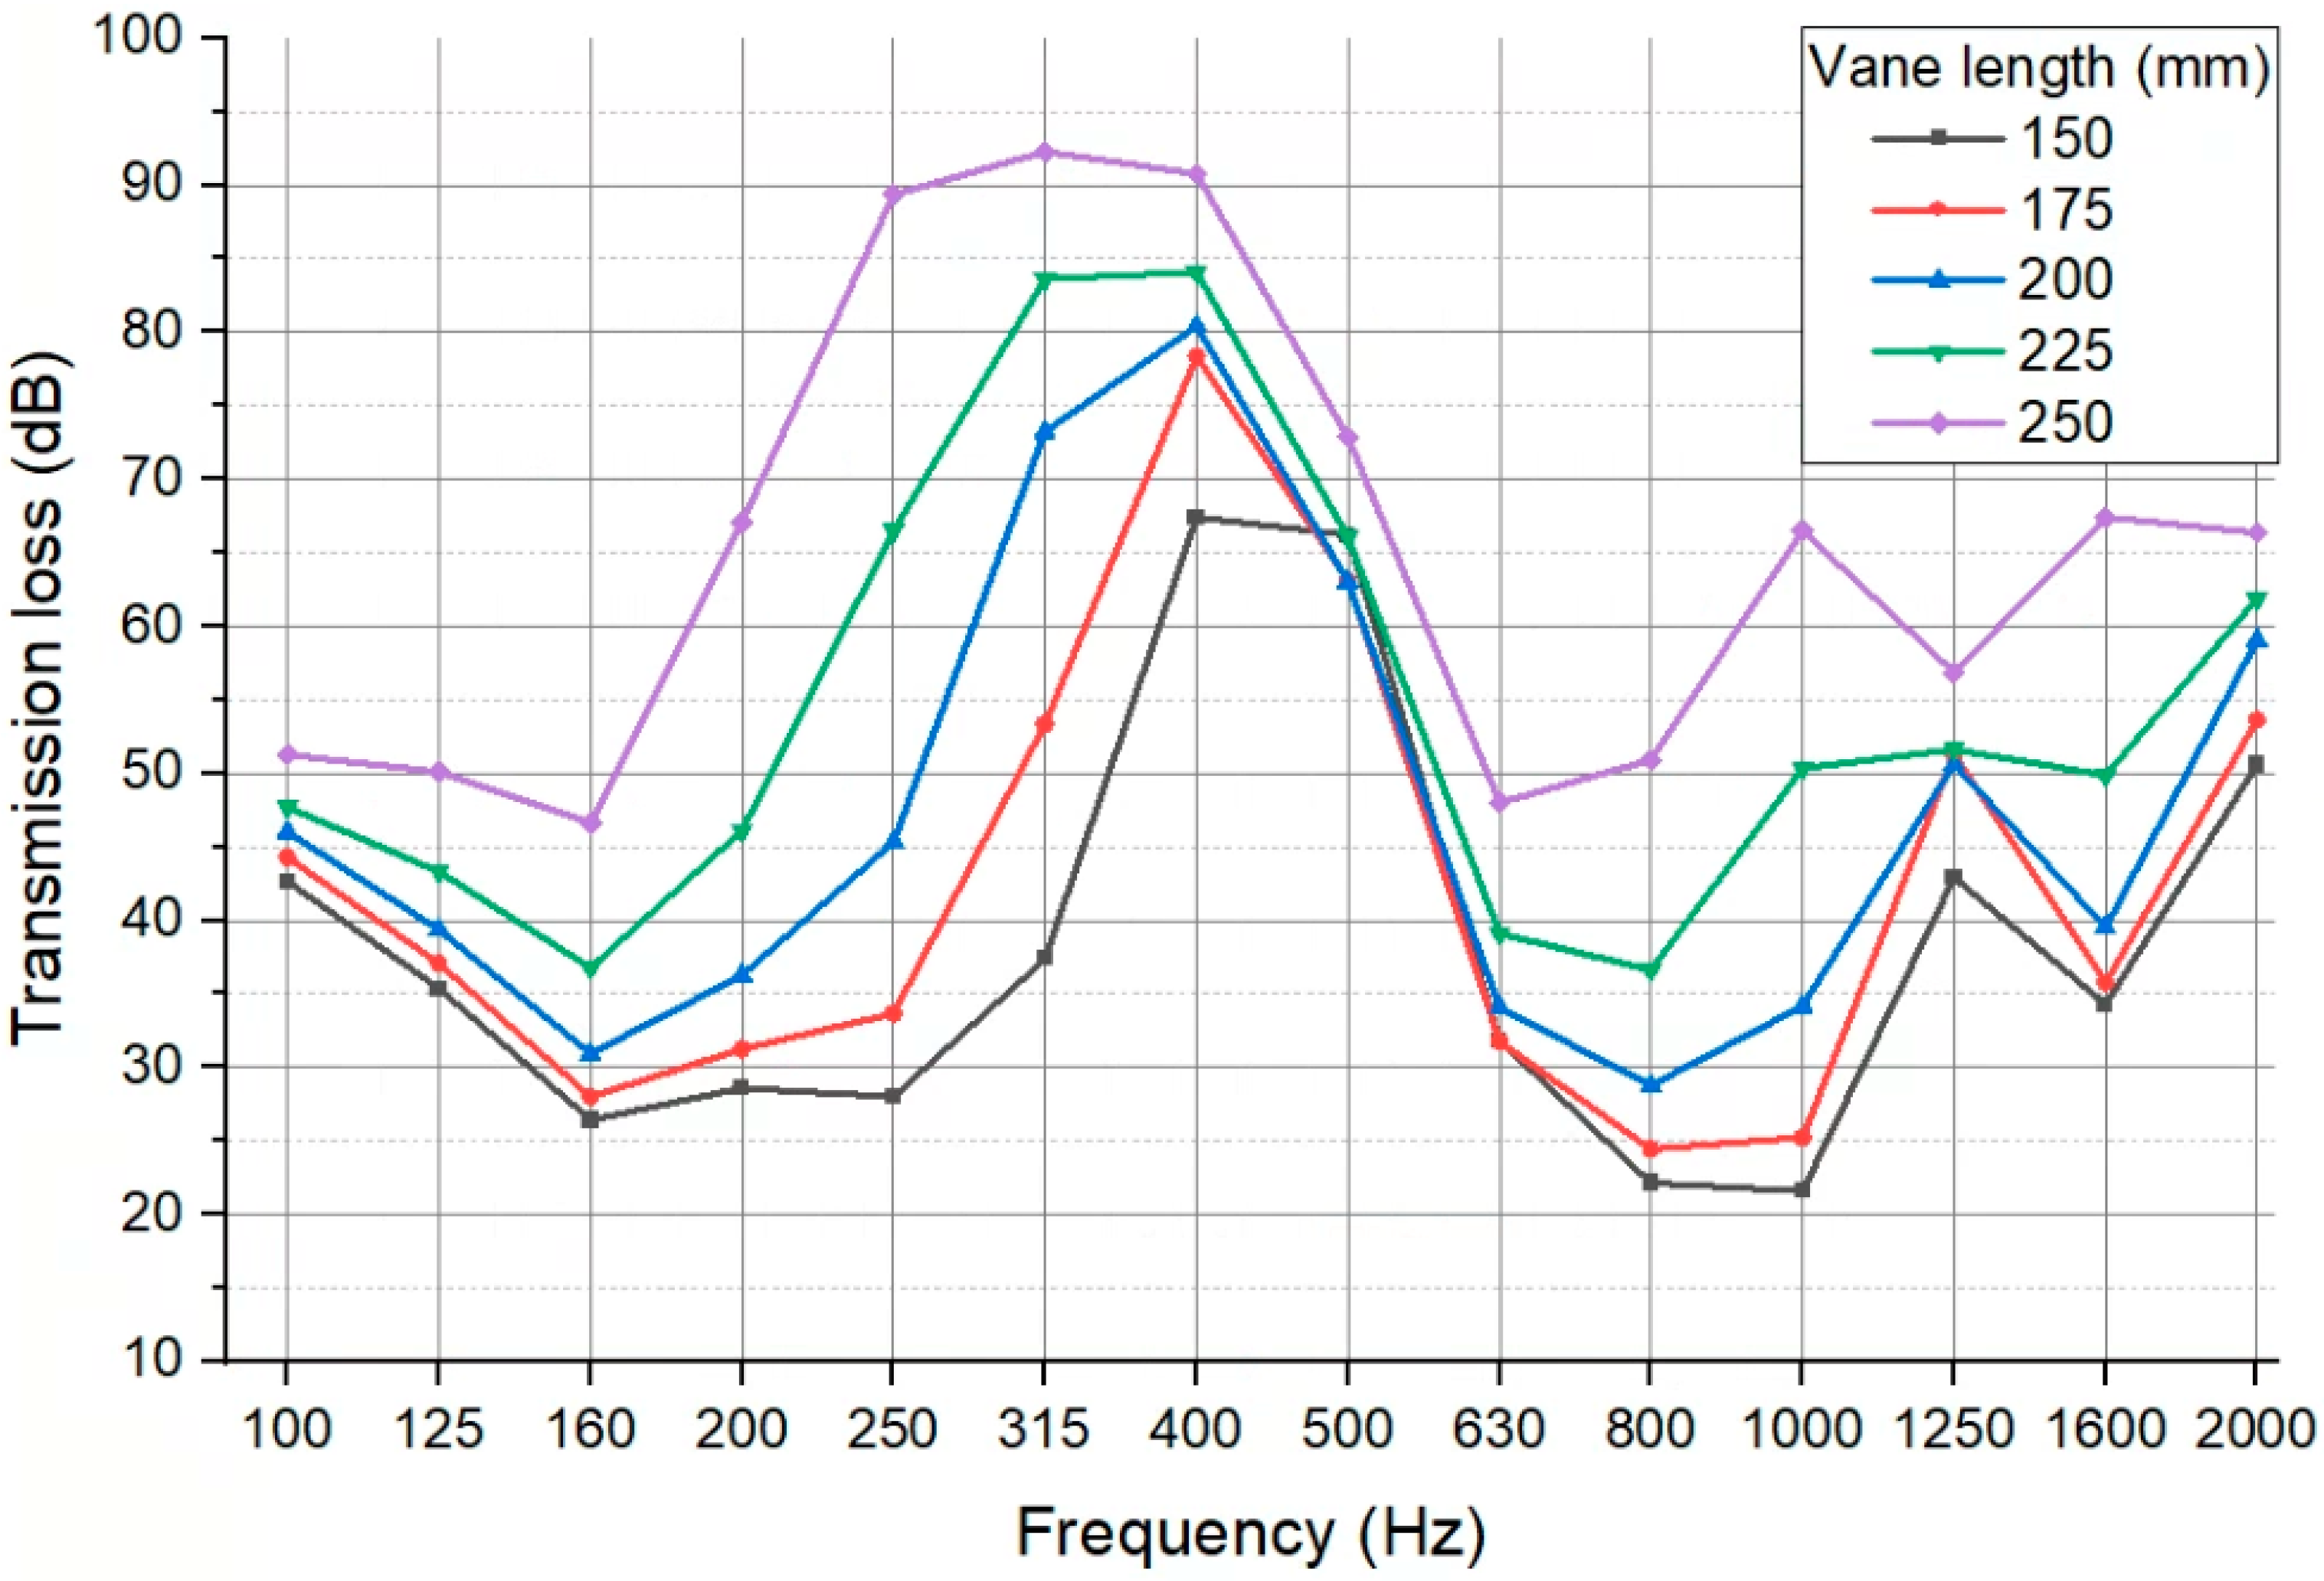
3.1. Inner Vane Type

Figure 8 shows the transmission loss in the entire frequency domain, according to the increase in the length of the inner vane type. At frequencies below 160 Hz, the effect of the vane length on transmission loss was small, and at frequencies above 160 Hz, transmission loss increased as the length increased. In the case of the inner vane type, the transmission loss decreased at 100–160 Hz, 500–750 Hz and 1250–1600 Hz, and the transmission loss increased at 315–500 Hz, 800–1250 Hz and 1600–2000 Hz.
Figure 9 shows the average transmission loss in the low frequency range of 100–200 Hz and the entire frequency range of 100–2000 Hz, according to the change in the length of the vane. The average transmission loss in the low frequency region increased a little, but the transmission loss increased as the length increased. However, there was almost no difference in transmission loss over 225 mm. The average transmission loss at all the frequencies also showed the same trend and the increase was larger. The average transmission loss in the entire frequency region showed maximum values of 36.1 dB.
Figure 10 and Figure 11 show the pressure distribution and pressure drop of the scrubber according to the vane length in the inner vane type. As the length of the vane increases, the pressure inside the scrubber increases and the pressure drop increases. As the length increases, the pressure drop increases rapidly. The pressure drop increases from 537 to 648 Pa.
In the inner vane type, increasing the vane length increases the transmission loss and pressure drop. However, after 225 mm, there is no effect on the transmission loss and only the pressure drop value increases significantly.

3.2. Inner Vane Reverse Type

Figure 12 shows the transmission loss according to the increase in the length of the vane in the inner vane reverse type. It has similar characteristics and trends to the inner vane type.
Figure 13 shows the average transmission loss in the low frequency and the entire frequency range according to the vane length. The transmission loss in the low frequency region and entire frequency region showed a similar shape to that of the inner vane type, but the difference was further increased at the length of 250 mm. Transmission losses in the low frequency and whole frequency domains were 32.6 and 40.2 dB at 250 mm, respectively.
Figure 14 and Figure 15 show the pressure contour and pressure drop of the scrubber according to the length of the vane in the inner vane reverse type. The pressure change inside the scrubber is similar to the inner vane type. The pressure drop increases from 535 to 650 Pa with increasing length. In particular, it increases rapidly when it exceeds 225 mm.

3.3. Outer Vane Type

Figure 16 shows the transmission loss in the entire frequency range according to the increase of the vane length in the outer vane type. Unlike the inner vane type, the transmission loss increases as the length of the vane increases at all frequencies. At 100–160 Hz and 500–630 Hz, it shows a clear decrease regardless of the length, and it shows an increase in the 200–250 Hz region. The transmission loss increases as the length increase, and the maximum loss appears in the region of 250–400 Hz. The increase and decrease are repeated in the region after 750 Hz, but the overall transmission loss tends to increase.
Figure 17 shows the transmission loss in the low and entire frequency regions, according to the change in the length of the vane. In the low frequency and entire frequency regions, the transmission loss increases as the length increases. The maximum transmission losses in the low frequency region and in the entire frequency region are 52.3 and 62.5 dB at 250 mm, respectively.
Figure 18 and Figure 19 show the pressure contour and pressure drop of the scrubber according to the length of the vane in the outer vane type. The red line in Figure 19 represents 840 Pa, which is 70% of the allowable engine pressure. As the length of the vane increases, the pressure inside the scrubber increases and the pressure drop increases. As the length increases, the pressure drop increases and it increases significantly after 225 mm. When increasing from 150 to 250 mm, the pressure drop increases from 551 to 1186 Pa.
In the outer vane type, increasing the length of the vane greatly increases the transmission loss and pressure drop, and the pressure drop at 250 mm greatly exceeds 840 Pa, which may have a negative effect on the engine.

3.4. Outer Vane Reverse Type

Figure 20 shows the transmission loss in the entire frequency range as the length of the vane increases in the outer vane reverse type. It has similar characteristics and tendencies to the outer vane type, but overall transmission loss is high.
Figure 21 shows the transmission loss in the low frequency and the entire frequency regions according to the change in the length of the vane. It has a similar tendency to the outer vane type, and the increase in transmission loss is higher. The maximum transmission loss is 65.4 dB at 250 mm.
Figure 22 and Figure 23 shows the pressure contour and pressure drop of the scrubber according to the length of the vane in the outer vane reverse type. It shows a similar tendency and characteristics to the outer vane type, but the increase in pressure drop is higher. The pressure drop increases from 555 to 1286 Pa.
In the outer vane reverse type, increasing the length of the vane greatly increases both the transmission loss and pressure drop. At 250 mm, the pressure drop value greatly exceeds the allowable engine value of 840 Pa, which can negatively affect the engine.

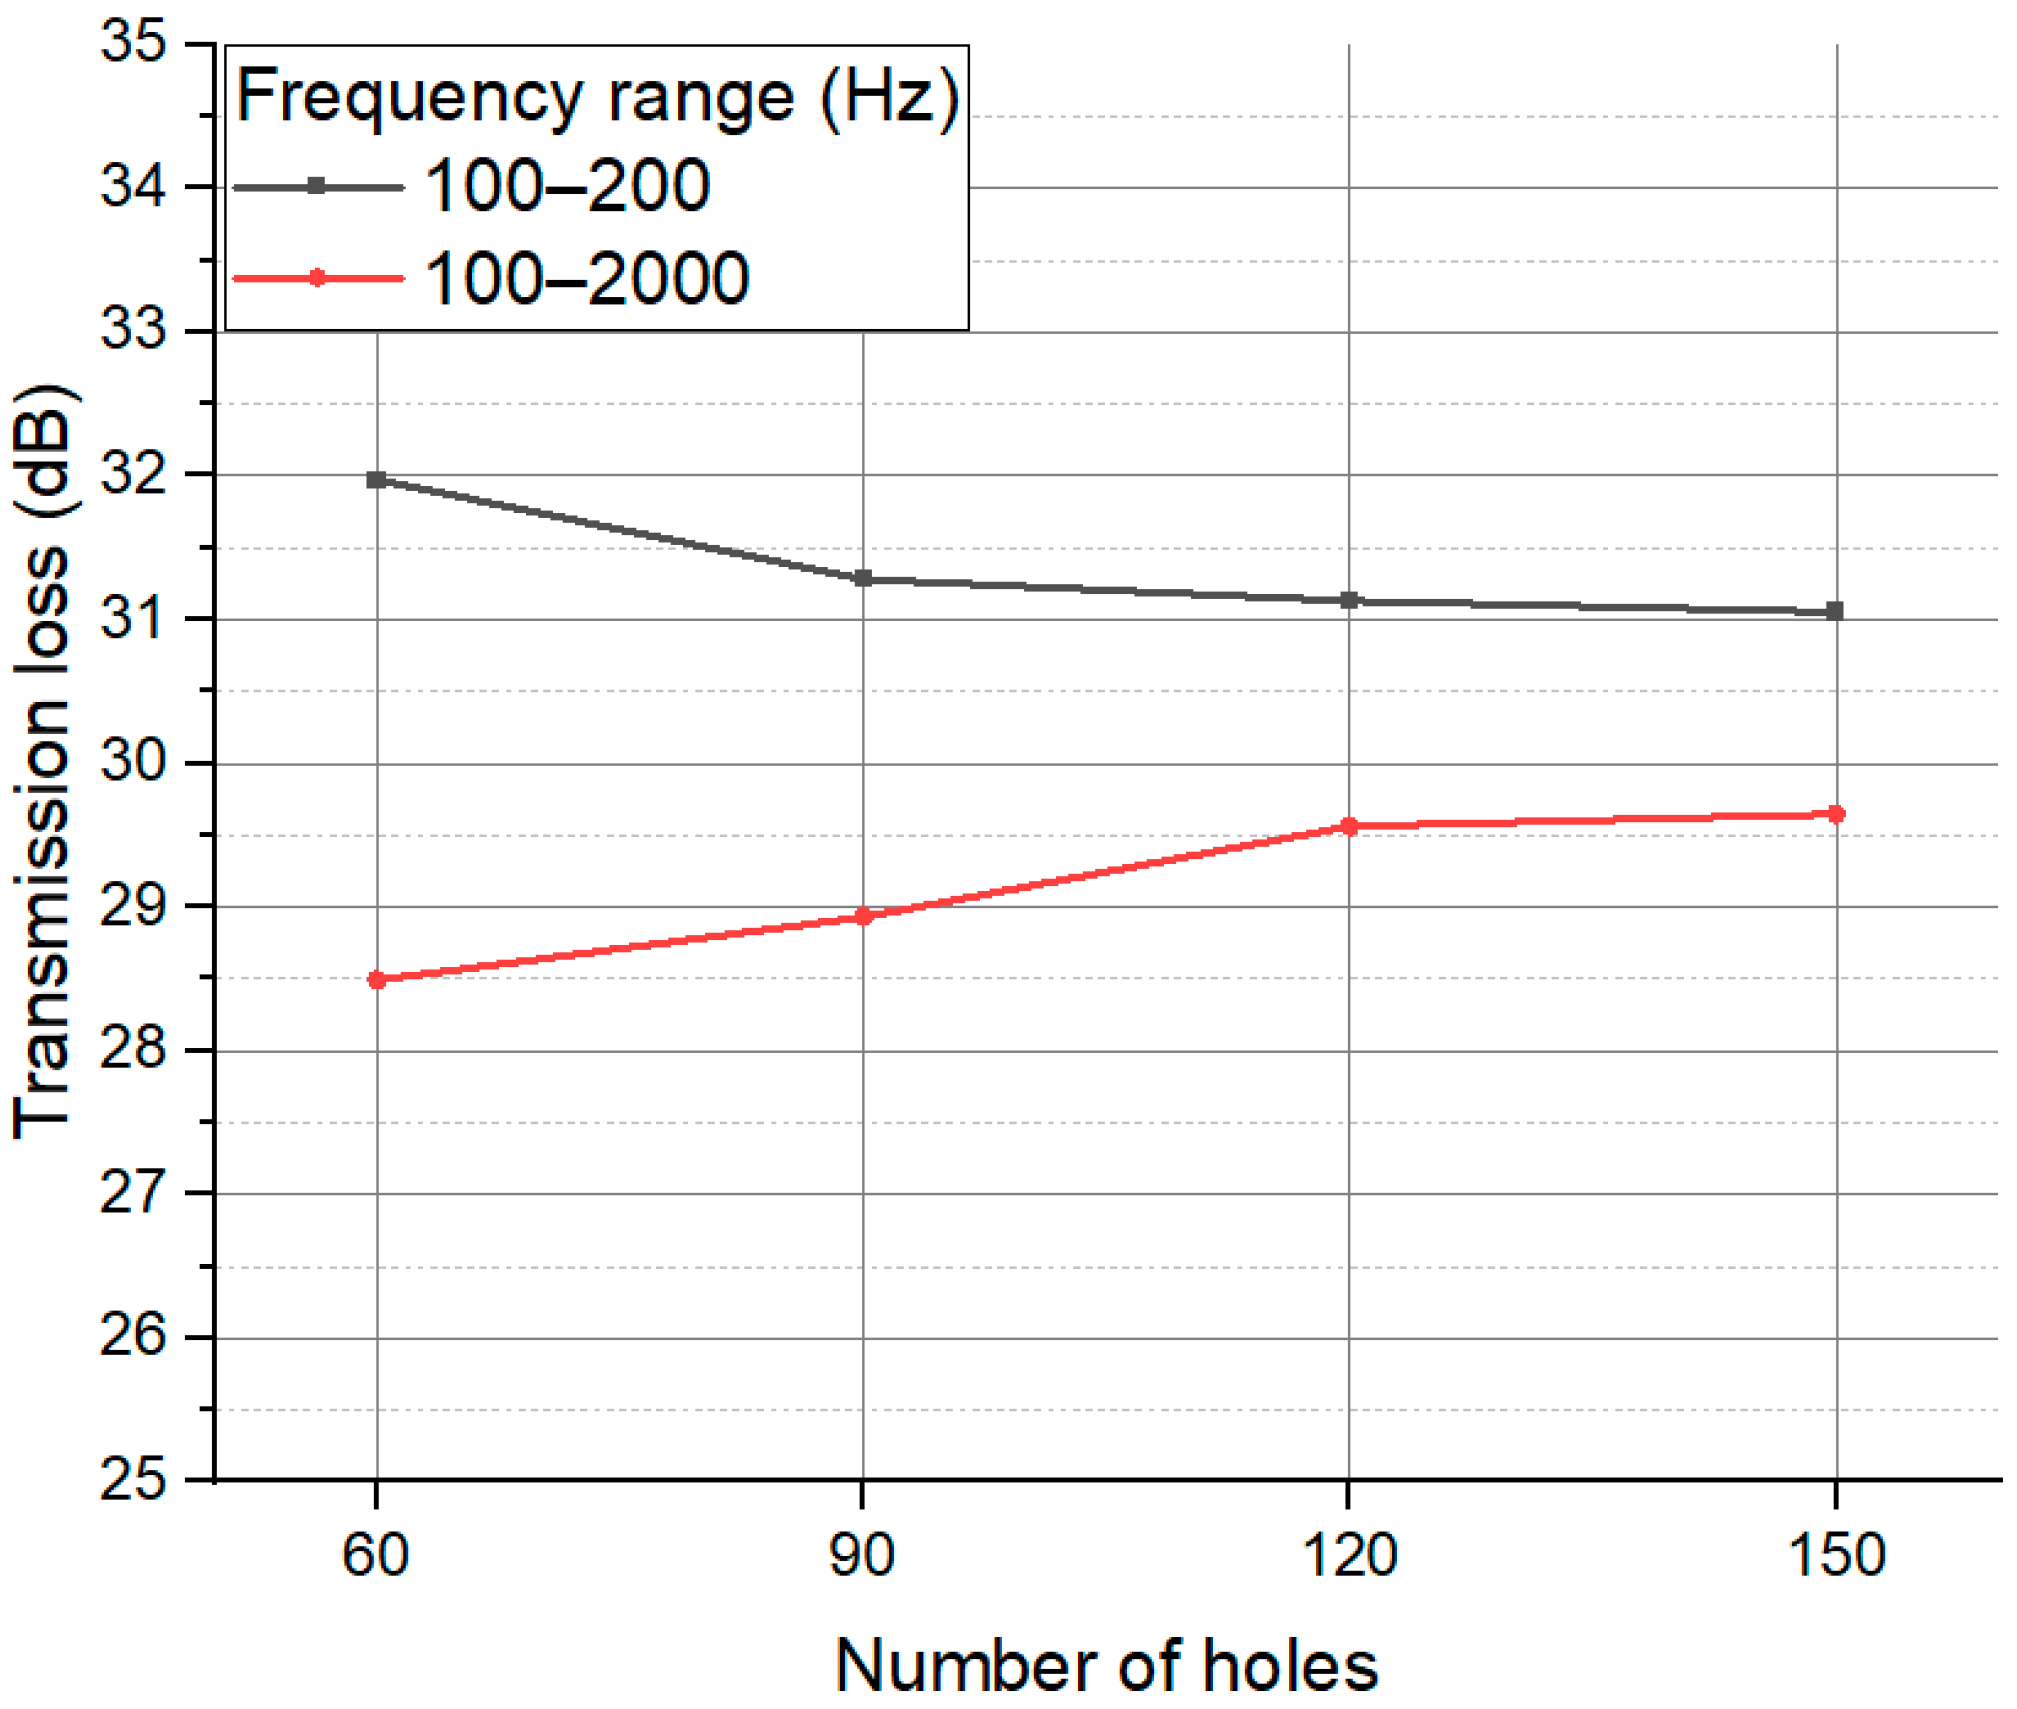
3.5. Inner Resonate Type

Figure 24 shows the transmission loss in the entire frequency domain according to the number of holes in the inner resonate type. Except for the 200–500 Hz and 2000 Hz regions, the effect of the number of holes on the transmission loss was not much. Transmission loss decreased in the range of 100–160 Hz, 400–800 Hz, and increased in other regions.
Figure 25 shows the average transmission loss in the low frequency and the entire frequency regions according to the change in the number of holes. The average transmission loss in the low frequency region tends to decrease as the number of holes increases, but the average transmission loss in the entire frequency region repeats the increase and decrease and is not significantly affected by the number of holes. The maximum transmission loss was 32 dB at 60 holes in the low frequency region, and 33 dB at 90 holes in the entire frequency region.
Figure 26 and Figure 27 show the pressure contour and pressure drop of the scrubber according to the change in the number of holes in the inner resonate type. The number of holes does not have much of an effect on the pressure inside the scrubber, and the pressure drop does not show a big difference. When increasing from 60 to 150 holes, the pressure drop increases from 601.6 to 602.8 Pa.
In the inner resonate type, as the number of holes increases, the average transmission loss in the entire frequency region is not that different, and the pressure drop increases slightly from 601.6 to 602.8 Pa.

3.6. Outer Resonate Type

Figure 28 shows the transmission loss in the entire frequency domain according to the increase in the number of holes in the outer resonate type. Except for the 200–800 Hz region, the effect of the number of holes on the transmission loss was not much. The transmission loss shows a decrease in the range of 100–160 Hz, 400–800 Hz, and tends to rise in the other ranges.
Figure 29 shows the average transmission loss in the low frequency and the entire frequency regions according to the change in the number of holes. The average transmission loss in the low frequency region tends to decrease as the number of holes increases, and the average transmission loss in the entire frequency region tends to increase. Unlike other types, the average transmission loss at low frequencies was higher than the average transmission loss in the entire frequency region. In the low frequency region, the average transmission loss was the highest at 32 dB at 60 holes, and the average transmission loss in the entire frequency region was the highest at 29.6 dB at 150 holes.
Figure 30 and Figure 31 show the pressure contour and pressure drop of the scrubber according to the change in the number of holes in the outer resonate type. The number of holes has little effect on the pressure inside the scrubber, and the pressure drop slightly increases as the number of holes increases. The pressure drop is 530.8 Pa at 120 holes and 531.1 Pa at 150 holes, which are the minimum and maximum values.
In the outer resonate type, an increase of the number of holes decreases the average transmission loss in the low frequency region and increases the average transmission loss in the entire frequency region.

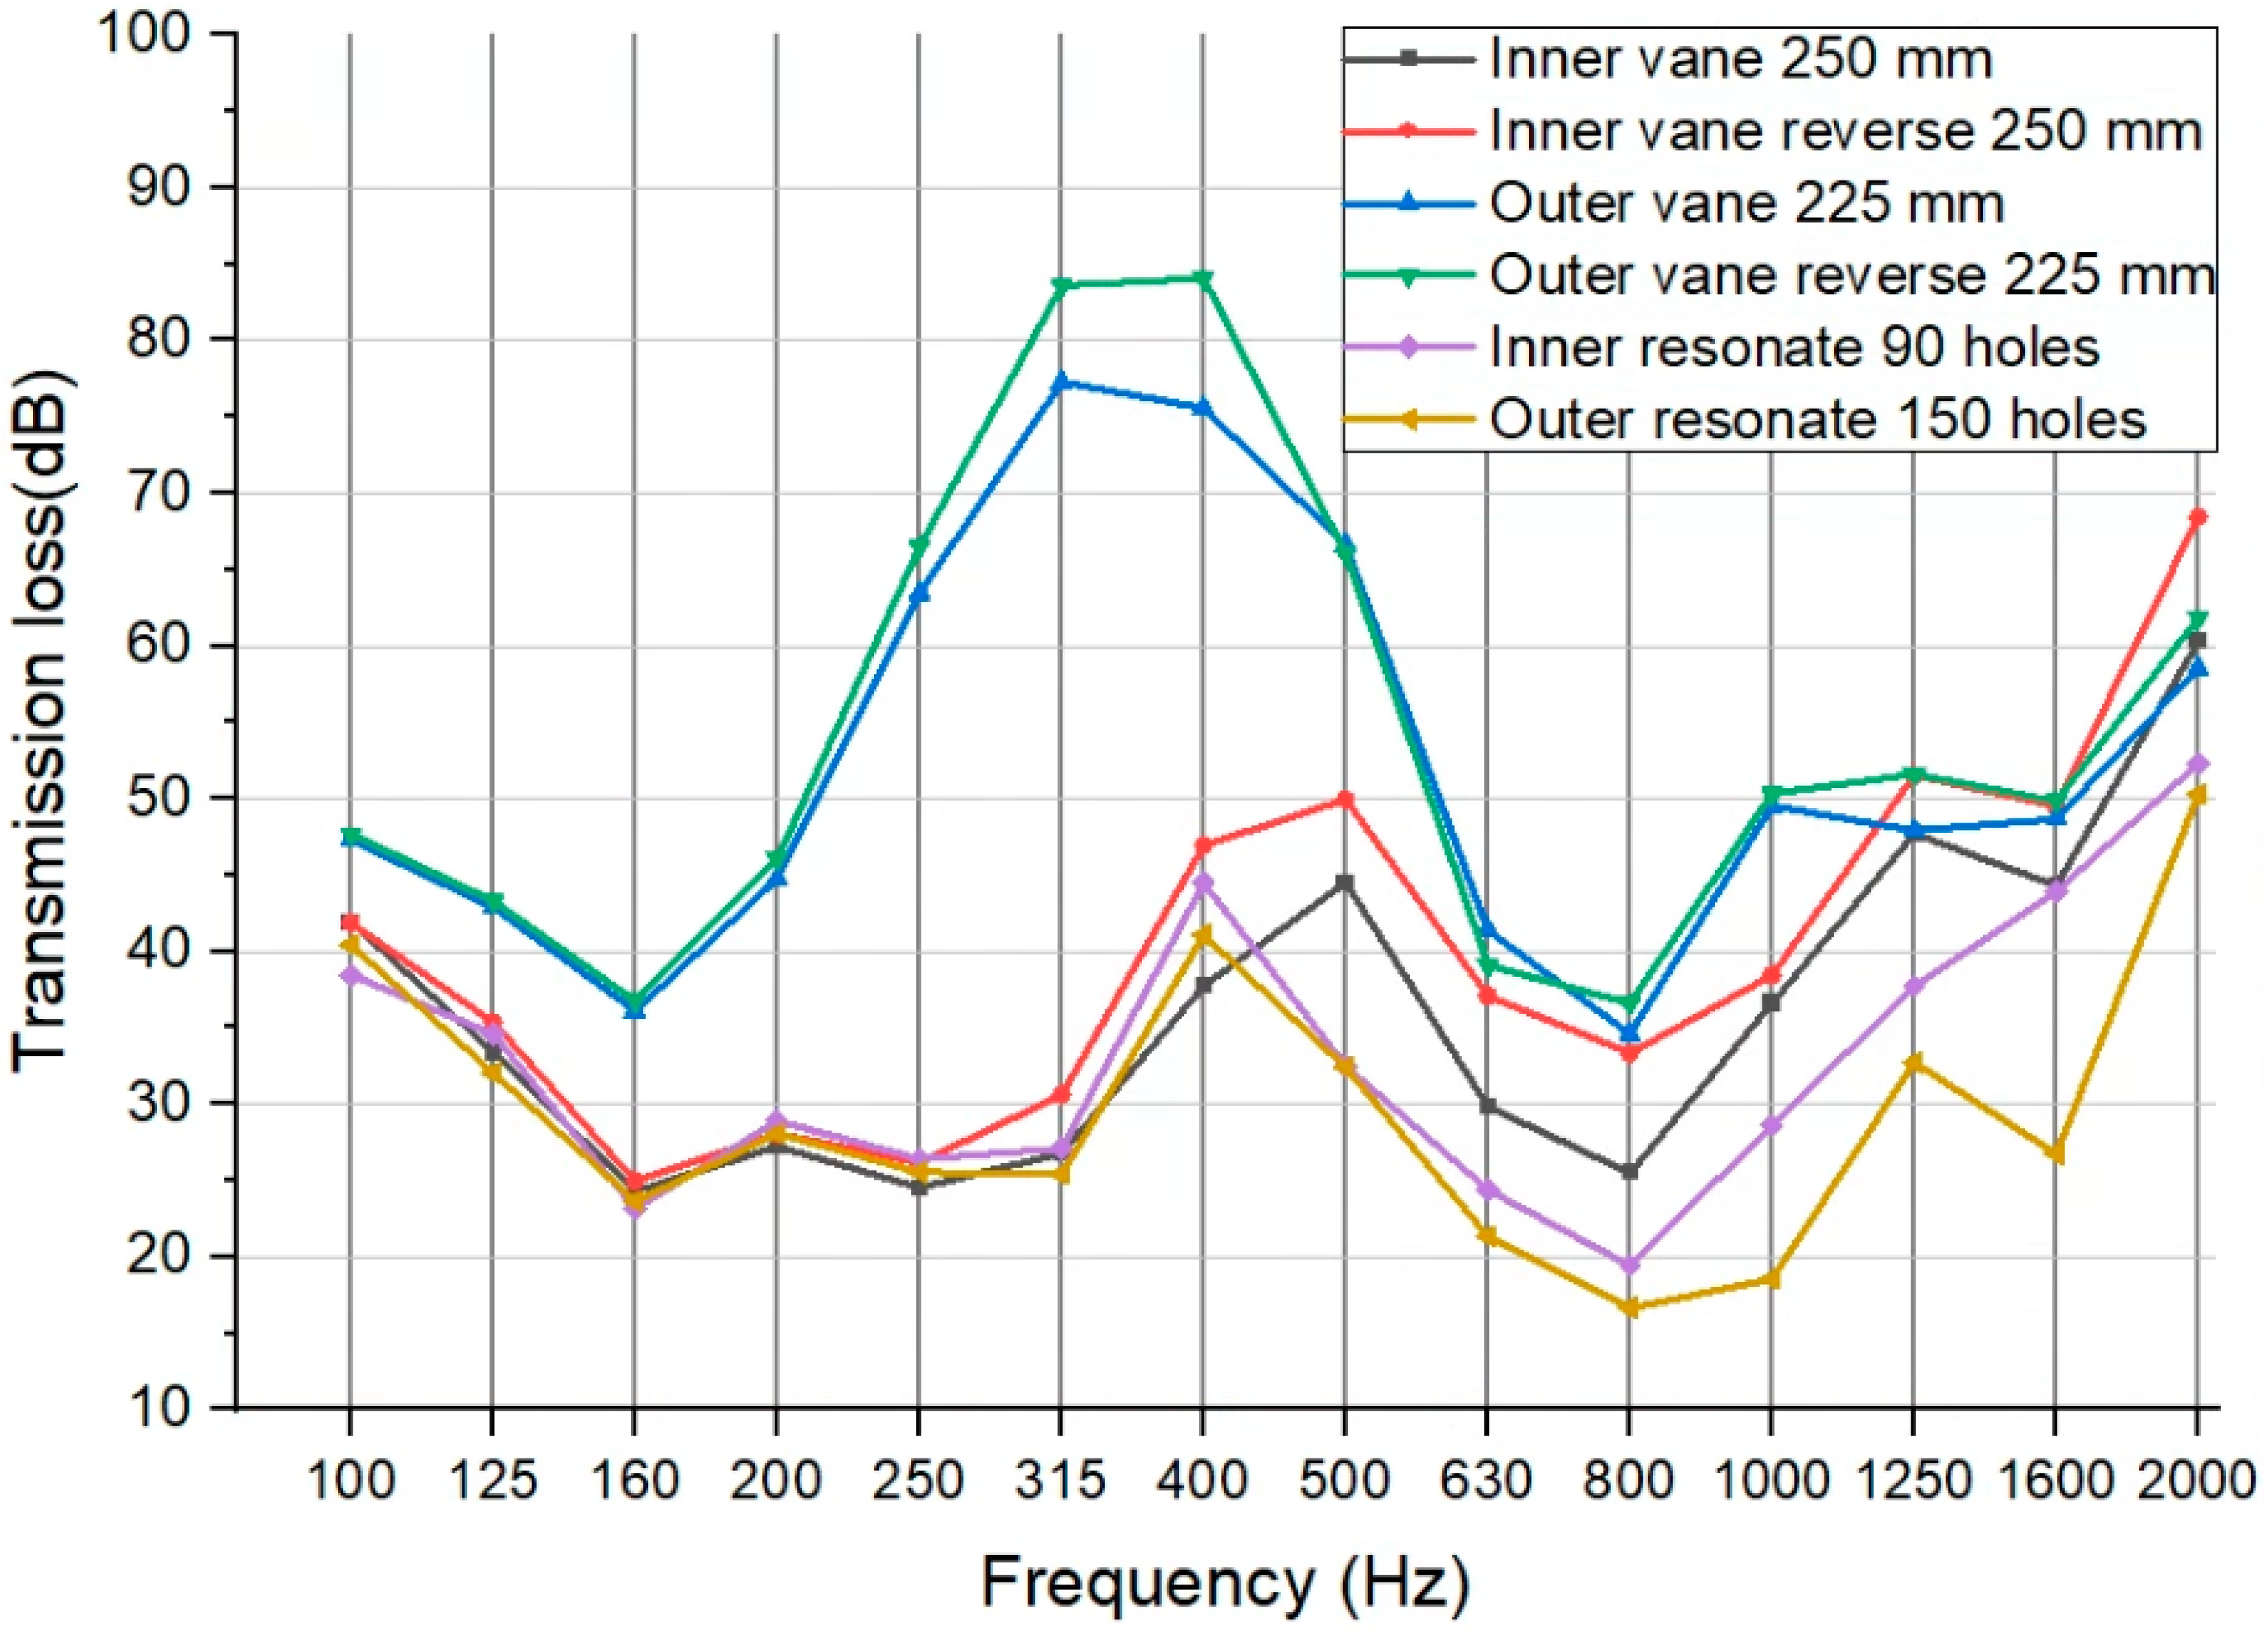
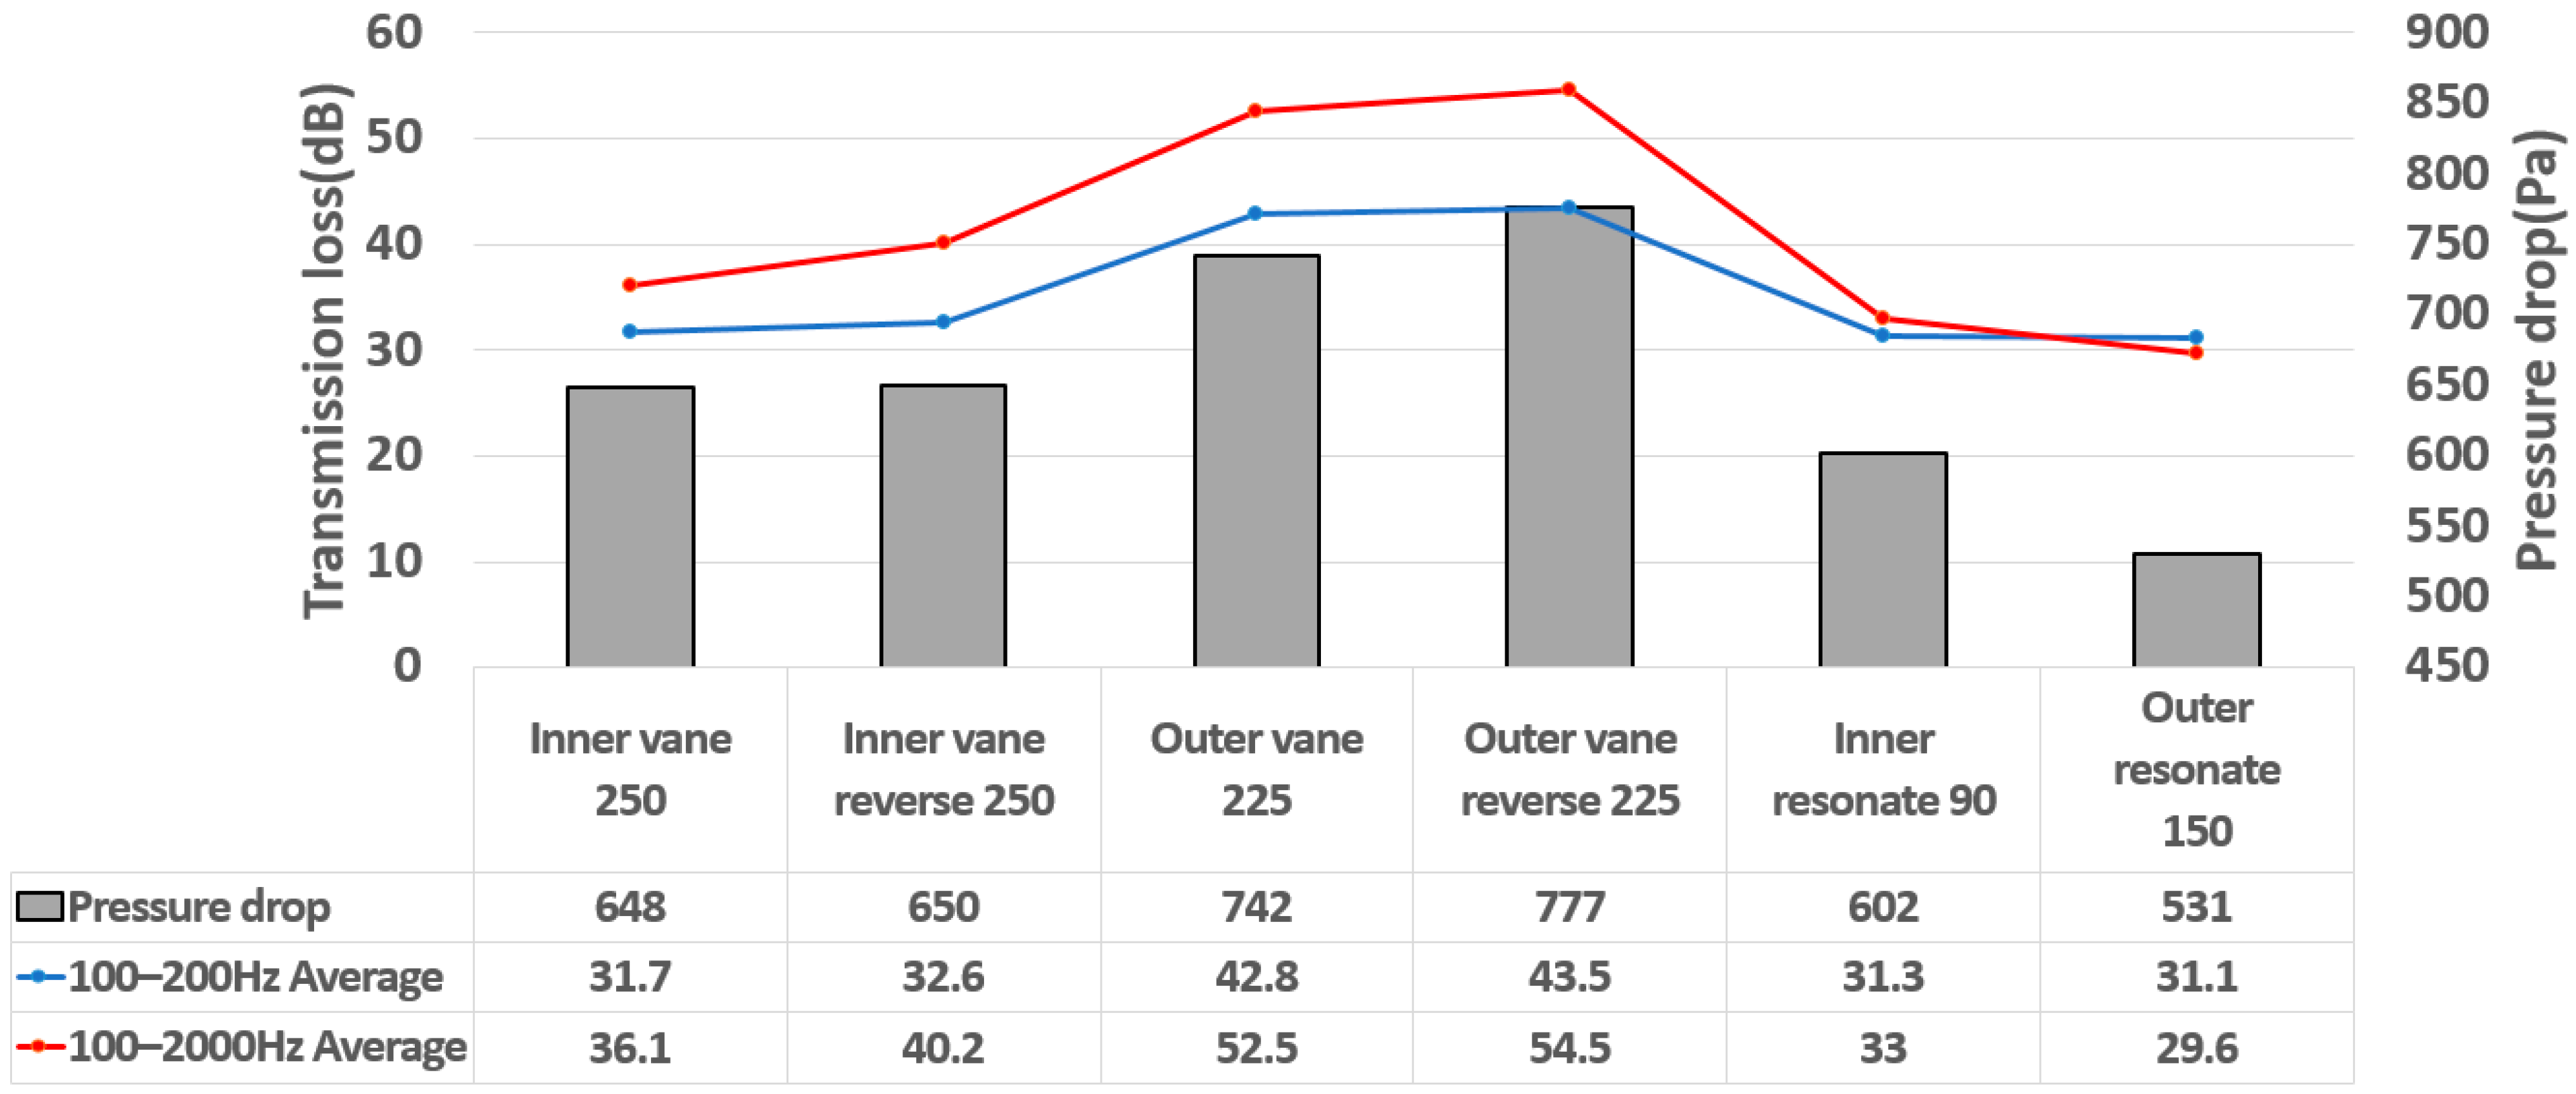
3.7. Comparison of Optimal Cases by Type

Figure 32 shows the transmission loss in the entire frequency domain according to the optimal case of each type. Figure 33 shows the pressure drop and the average transmission loss in the low frequency and entire frequency regions. The trend of increasing and decreasing transmission loss was similar for all types, but the outer vane type and outer vane reverse type showed high transmission loss in the 160–500 Hz range. Except for the resonate type, the average transmission loss tends to increase as the pressure drop increases. The pressure drop and average transmission loss were higher in the order of the outer vane type, inner vane type, and resonate type.
Regarding the vane direction in the vane type, both the average transmission loss and pressure drop were higher in the reverse direction than in the forward direction. In the case of the average transmission loss in the entire frequency region, there is a clear difference depending on the direction of the vane, but in the case of average transmission loss at low frequencies, there is no significant difference. In the outer vane reverse type, when the vane length was 225 mm, the pressure drop was 777 Pa, and the average transmission loss in low frequency and entire frequency regions were 43.5 and 54.5 dB, respectively.

4. Conclusions

A composite scrubber for ships that simultaneously reduces sulfur oxide and noise was proposed; moreover, the flow characteristics and noise characteristics were analyzed. The results, according to the shape of the silencer in the composite scrubber, are summarized as follows.
(1) In the case of the vane type—as the length of the vane increased, the pressure drop and average transmission loss increased. The pressure drop and average transmission loss were higher when the vane was installed outside rather than inside. They were higher when the vane tilted in the reverse direction rather than the forward direction.
(2) In the case of the inner resonate type—as the number of holes increased, the pressure drop and average transmission loss in the entire frequency region tended to increase, and the average transmission loss in the low frequency region tended to decrease. In the case of the outer resonate type—the pressure drop decreased as the number of holes increased. The optimal performance was shown at 90 holes in the case of the inner resonate type, while the optimal performance was shown at 150 holes in the case of the outer resonate type.
(3) When comparing the optimal cases for each type—the pressure drop and average transmission loss were highest when the vane was installed outside and tilted in the reverse direction (in the case of the vane type).
The condition for maximally reducing noise in the range not exceeding 840 Pa, which is 70% of the allowable engine back pressure, is a vane length of 225 mm in the outer vane reverse type. The pressure drop under this condition was 777 Pa, and the average transmission loss in the entire frequency region was 54.5 dB.

Author Contributions

Conceptualization, M.-r.R. and K.P.; methodology, M.-r.R.; software, M.-r.R.; validation, M.-r.R. and K.P.; formal analysis, M.-r.R.; investigation, M.-r.R.; resources, M.-r.R.; data curation, M.-r.R.; writing-original draft preparation, M.-r.R.; writing-review and editing, K.P.; supervision, K.P.; project administration, M.-r.R. Both authors have read and agreed to the published version of the manuscript.

Funding

This research received no external funding.

Institutional Review Board Statement

Not applicable.

Informed Consent Statement

Not applicable.

Data Availability Statement

Not applicable.

Conflicts of Interest

The authors declare no conflict of interest.

References

  1. Lee, S.M.; Kwon, B.M.; Park, K. Flow characteristics according to internal structure of square wet scrubber. J. Korean Soc. Mar. Eng. 2019, 43, 1–7. [Google Scholar]
  2. Reynolds, K.J. Exhaust Gas Cleaning Systems Selection Guide, Prepared for Ship Operations Cooperative Program (SOCP); The Glosten Associates: Seattle, WA, USA, 2011. [Google Scholar]
  3. Han, B.W.; Kim, H.J.; Kim, Y.J.; Han, K.S. Removal characteristics of gaseous contaminants by a wet scrubber with different packing materials. J. Korean Soc. Atmos. Environ. 2007, 23, 744–751. [Google Scholar] [CrossRef] [Green Version]
  4. Byeon, S.H.; Lee, B.K.; Mohan, B.R. Removal of ammonia and particulate matter using a modified turbulent wet scrubbing system. Sep. Purif. Technol. 2012, 98, 221–229. [Google Scholar] [CrossRef]
  5. Lee, B.K.; Mohan, B.R.; Byeon, S.H.; Lim, K.S.; Hong, E.P. Evaluating the performance of a turbulent wet scrubber for scrubbing particulate matter. J. Air Waste Manag. Assoc. 2012, 43, 499–506. [Google Scholar] [CrossRef] [Green Version]
  6. Son, K.; Lee, J.Y.; Park, K. The effect of spray flow rate, aspect ratio, and filling rate of wet scrubber on smoke reduction. J. Korean Soc. Mar. Eng. 2015, 39, 217–222. [Google Scholar]
  7. Lee, W.J.; Kim, I.S.; Choi, Y.S.; Choi, J.H. A numerical study on the basic design of scrubber for marine diesel engines. J. Korean Soc. Mar. Environ. Saf. 2017, 23, 549–557. [Google Scholar] [CrossRef]
  8. Hu, S.Y.; Gao, Y.; Feng, G.; Hu, F.; Liu, C.; Li, J. Experimental study of the dust-removal performance of a wet scrubber. Int. J. Coal Sci. Technol. 2021, 8, 228–239. [Google Scholar] [CrossRef]
  9. Fang, P.; Cen, C.; Tang, Z.; Zhong, P.; Chen, D.; Chen, Z. Simultaneous removal of SO2 and NOX by wet scrubbing using urea solution. Chem. Eng. J. 2011, 168, 52–59. [Google Scholar] [CrossRef]
  10. Fang, P.; Cen, C.P.; Wang, X.M.; Tang, Z.J.; Tang, Z.X.; Chen, D.S. Simultaneous removal of SO2, NO and HG0 by wet scrubbing using urea + KMnO4 solution. Fuel Process. Technol. 2013, 106, 645–653. [Google Scholar] [CrossRef]
  11. Raghunath, C.V.; Mondal, M.K. Experimental scale multi component absorption of SO2 and NO by NH3/NaClO scrubbing. Chem. Eng. J. 2017, 314, 537–547. [Google Scholar] [CrossRef]
  12. Yang, S.; Pan, X.; Han, Z.; Zhao, D.; Liu, B.; Zheng, D. Removal of NOX and SO2 from simulated ship emissions using wet scrubbing based on seawater electrolysis technology. Chem. Eng. J. 2018, 331, 8–15. [Google Scholar] [CrossRef]
  13. Meikpa, B.C.; Kundu, G.; Biswas, M.N. Modeling of a novel multi-stage bubble column scrubber for flue gas desulfurization. Chem. Eng. J. 2002, 86, 331–342. [Google Scholar] [CrossRef]
  14. D’Addio, L.; Carotenuto, C.; Balachandran, W.; Lancia, A.; Di Natale, F. Experimental analysis on the capture of submicron particles (PM0.5) by wet electrostatic scrubbing. Chem. Eng. Sci. 2014, 106, 222–230. [Google Scholar] [CrossRef]
  15. Park, H.W.; Choi, S.S.; Park, D.W. Simultaneous treatment of NO and SO2 with aqueous NaClO2 solution in a wet scrubber combined with a plasma electrostatic precipitator. J. Hazard. Mater. 2015, 285, 117–126. [Google Scholar] [CrossRef]
  16. Lim, J.Y.; Kim, H.S.; Bang, S.Y.; Bum, B.S.; Kim, J.H. Effects on the removal of sulfur compounds by microbubble supply to circulation tank in a scrubber. J. Odor Indoor Environ. 2019, 18, 10–17. [Google Scholar] [CrossRef]
  17. Sun, W.; Shao, Y.; Zhao, L.; Wang, Q. Co-removal of CO2 and particulate matter from industrial flue gas by connecting an ammonia scrubber and a granular bed filter. J. Clean. Prod. 2020, 257, 120511. [Google Scholar] [CrossRef]
  18. Xie, R.; Ji, J.; Guo, K.; Lei, D.; Fan, Q.; Leung, D.Y.C.; Huang, H. Wet scrubber coupled with UV/PMS process for efficient removal of gaseous VOCs: Roles of sulfate and hydroxyl radicals. Chem. Eng. J. 2019, 356, 632–640. [Google Scholar] [CrossRef]
  19. Lee, S.H.; Kim, N.S.; Jin, B.M.; You, J.C.; Do, C.S. Sound insulation case of diesel engine low frequency exhaust noise problem. In Proceedings of the Annual Autumn Meeting, Mokpo, Korea, 3–4 November 2011; pp. 634–637. [Google Scholar]
  20. Hwang, W.G.; Lee, Y.Y.; Oh, J.E.; Kim, K.S.; Song, Y.H. A Study on the Transmission Loss and Back pressure of Muffler Elements. J. Korean Soc. Precis. Eng. 2002, 19, 147–153. [Google Scholar]
  21. Kwon, J.; Jeong, W.B.; Hong, C.S. Effects of Fluid Velocity on Acoustic Transmission Loss of Simple Expansion Chamber. Trans. Korean Soc. Noise Vib. Eng. 2012, 22, 994–1002. [Google Scholar] [CrossRef]
  22. Kim, Y.W.; Jeong, W.B. Numerical Analysis of Noise Reduction and Back-pressure for a Simple Expansion Chamber with a Partition. Trans. Korean Soc. Noise Vib. Eng. 2014, 24, 883–889. [Google Scholar] [CrossRef] [Green Version]
  23. Yi, C.S.; Lee, T.E.; Lee, C.W. Numerical analysis of the Internal Flow of 8kW Grade Diesel Generator Muffler. J. Korean Soc. Manuf. Process. Eng. 2018, 17, 45–50. [Google Scholar] [CrossRef]
  24. Secgin, E.; Arslan, H.; Birgören, B. A statistical design optimization study of a multi-chamber reactive type silencer using simplex centroid mixture design. J. Low Freq. Noise Vib. Act. Control 2020, 40, 623–638. [Google Scholar] [CrossRef] [Green Version]
  25. Nursal, R.S.; Hashim, A.H.; Nordin, N.I.; Hamid, M.A.A.; Danuri, M.R. CFD Analysis of the Effects of Exhaust Backpressure Generated by Four-Stroke Marine Diesel Generator After Modification of Silencer and Exhaust Flow Design. ARPN J. Eng. Appl. Sci. 2017, 12, 1271–1280. [Google Scholar]
  26. Kakade, S.K.; Sayyad, F.B. Optimization of Exhaust Silencer for Weight and Size by Using Noise Simulation for Acoustic Performance. J. Inf. Comput. Sci. 2017, 10, 49–60. [Google Scholar]
  27. Kim, S.A. Silencer structure for exhaust noise attenuation performance in the high frequency range. J. Korean Soc. Fish. Ocean Technol. 2018, 54, 255–261. [Google Scholar] [CrossRef]
  28. ANSYS CFX-Theory Guide V14.0. Available online: https://www.researchgate.net/publication/321628826_Study_on_Design_of_Pressure_Chamber_in_a_Linear-Jet_Type_Air_Curtain_System_for_Prevention_of_Smoke_Spread/fulltext/5a29ec470f7e9b63e5353c2d/Study-on-Design-of-Pressure-Chamber-in-a-Linear-Jet-Type-Air-Curtain-System-for-Prevention-of-Smoke-Spread.pdf (accessed on 1 September 2021).
  29. ANSYS AACTx_R170_L. V17.0. Available online: https://www.ansys.com/news-center/press-releases/01-27-16-ansys-unveils-release-17-0 (accessed on 1 September 2021).
  30. Strigle, R.F., Jr. Random and Structured Packings. In Packed Tower Design and Applications, 2nd ed.; Gulf Publishing Company: Houston, TX, USA, 1987. [Google Scholar]
  31. Kang, D.J.; Lee, W.S.; Lee, J.W.; Hong, J.K.; Jo, Y.H.; Lee, S.J. Survey of the Soundproof Materials Effect—On Absorptive Materials. In Survey of the Soundproof Materials Effect; Air Quality Research Department, National Institute of Environmental Research: Hwangyong-ro, Korea, 2004; MONO1200503777. Available online: http://dl.nanet.go.kr/law/SearchDetailView.do?cn=MONO1200503777 (accessed on 6 September 2021).
Figure 1. Mesh shape for flow calculation.
Jmse 09 00962 g001
Figure 2. Pressure drop with the number of grids.
Jmse 09 00962 g002
Figure 3. Mesh for acoustics calculation.
Jmse 09 00962 g003
Figure 4. Transmission loss with the number of grids.
Jmse 09 00962 g004
Figure 5. Comparison of experimental and analysis pressure drop results.
Jmse 09 00962 g005
Figure 6. Comparison of experimental results and simulation results.
Jmse 09 00962 g006
Figure 7. Overall shape and sectional view of composite scrubber.
Jmse 09 00962 g007
Figure 8. Transmission loss according to the vane length in the inner vane type.
Jmse 09 00962 g008
Figure 9. Average transmission loss according to the vane length in the inner vane type.
Jmse 09 00962 g009
Figure 10. Pressure contour according to the vane length in the inner vane type.
Jmse 09 00962 g010
Figure 11. Pressure drop according to the vane length in the inner vane type.
Jmse 09 00962 g011
Figure 12. Transmission loss according to the vane length in the inner vane reverse type.
Jmse 09 00962 g012
Figure 13. Average transmission loss according to the vane length in the inner vane reverse type.
Jmse 09 00962 g013
Figure 14. Pressure contour according to the vane length in the inner vane reverse type.
Jmse 09 00962 g014
Figure 15. Pressure drop according to the vane length in the inner vane reverse type.
Jmse 09 00962 g015
Figure 16. Transmission loss according to the vane length in the outer vane type.
Jmse 09 00962 g016
Figure 17. Average transmission loss according to the vane length in the outer vane type.
Jmse 09 00962 g017
Figure 18. Pressure contour according to the vane length in the outer vane type.
Jmse 09 00962 g018
Figure 19. Pressure drop according to the vane length in the outer vane type.
Jmse 09 00962 g019
Figure 20. Transmission loss according to the vane length in the outer vane reverse type.
Jmse 09 00962 g020
Figure 21. Average transmission loss according to the vane length in the outer vane reverse type.
Jmse 09 00962 g021
Figure 22. Pressure contour according to the vane length in the outer vane reverse type.
Jmse 09 00962 g022
Figure 23. Pressure drop graph according to the vane length in the outer vane reverse type.
Jmse 09 00962 g023
Figure 24. Transmission loss according to the number of holes in the inner resonate type.
Jmse 09 00962 g024
Figure 25. Average transmission loss according to the number of holes in the inner resonate type.
Jmse 09 00962 g025
Figure 26. Pressure contour according to the number of holes in the inner resonate type.
Jmse 09 00962 g026
Figure 27. Pressure drop graph according to the number of holes in the inner resonate type.
Jmse 09 00962 g027
Figure 28. Transmission loss according to the variation of the number of holes in the outer resonate type.
Jmse 09 00962 g028
Figure 29. Average transmission loss according to the variation of the number of holes in the outer resonate type.
Jmse 09 00962 g029
Figure 30. Pressure contour according to the number of holes in the outer resonate type.
Jmse 09 00962 g030
Figure 31. Pressure drop graph according to the number of holes in the outer resonate type.
Jmse 09 00962 g031
Figure 32. Transmission loss according to the frequency for optimal cases.
Jmse 09 00962 g032
Figure 33. Averaged transmission loss and pressure drop according to the optimal cases for each type.
Jmse 09 00962 g033
Table 1. Calculation cases.
CasesTypeVariableShape
Case 1Inner vane typeVane length (mm)150 Jmse 09 00962 i001
Case 2175
Case 3200
Case 4225
Case 5250
Case 6Inner vane reverse typeVane length (mm)150 Jmse 09 00962 i002
Case 7175
Case 8200
Case 9225
Case 10250
Case 11Outer vane typeVane length (mm)150 Jmse 09 00962 i003
Case 12175
Case 13200
Case 14225
Case 15250
Case 16Outer vane reverse typeVane length (mm)150 Jmse 09 00962 i004
Case 17175
Case 18200
Case 19225
Case 20250
Case 21Inner resonate typeNumber of holes60 Jmse 09 00962 i005
Case 2290
Case 23120
Case 24150
Case 25Outer resonate typeNumber of holes60 Jmse 09 00962 i006
Case 2690
Case 27120
Case 28150
Table 2. Target engine specification.
Engine ModelYANMAR 6-MAL
Number of cylinder4
Bore × stroke (mm)200 × 240
Combustion chamber typeDirect injection
Rated output (hp)640
Rated speed (rpm)900
Allowable pressure (Pa)1200
Table 3. Calculation conditions.
Analysis TypeSteady-State
Turbulence modelSST (Shear Stress Transport)
Constituent materialAir, water vapor, water liquid
Wall condensation modelConcentration boundary layer model
H2O/H2Ol component pair detailsLiquid evaporation model
Particle injectionCone angle (°)30
Particle diameter (mm)2
Particle mass flow rate (kg/s)1.1
The number of injection Regions5
Initial conditions Static pressure (atm)1
Temperature (°C)30
Air inlet Mass flow rate (kg/s)0.55
Static temperature (°C)230
Air outletOpening pressure (atm)1
Porous domain Volume porosity0.902
Publisher’s Note: MDPI stays neutral with regard to jurisdictional claims in published maps and institutional affiliations.

