1. Introduction
As intelligent platforms that can be used for marine monitoring, unmanned surface ships need to complete complex and orderly autonomous operation tasks such as target recognition and obstacle avoidance when operating at high speeds on complex and uncertain surface environments. Accurate recognition and automatic obstacle avoidance place high requirements on the high-speed information processing capabilities of the vision system of an unmanned ship [
1].
In recent years, deep learning has been widely used in the entire target detection field including in face recognition [
2,
3], in vehicle detection and recognition [
4,
5], in autonomous driving [
6], and in the medical industry [
7]. Compared to the SIFT algorithm [
8] and what was proposed by David in the texture extraction algorithm [
9,
10,
11], which are from among the representative traditional algorithms, as well as the HOG algorithm [
12] proposed by the Navneet team, the deep learning target detection algorithm has made a great leap in performance and accuracy, and its model network’s anti-scale change and anti-translation capabilities have been significantly improved.
Unmanned platforms are developing rapidly and becoming more mature. Equipment such as unmanned aerial vehicles and unmanned vehicles has gradually become more widely used. Research on unmanned offshore equipment has gradually begun to receive more attention, especially regarding surface unmanned boats, which has caused extensive research by scholars such as that on automatic collision avoidance [
13] and path planning [
14,
15]. Environmental perception and target recognition technology are not only the core keys to realizing the autonomous decision-making functions and autonomous obstacle avoidance functions of surface unmanned boats, but they also improve the safety guarantee for the navigation of the unmanned boat. Therefore, the establishment of a visual inspection system for ships has become a hot issue for autonomous ships at sea. In terms of ship detection, considering real-time requirements, current mainstream algorithms include TWO-STAGE and ONE-STAGE algorithms. In an algorithm based on area detection, Su J. [
16] and Wang G. H. [
17] used feature enhancement, pre-training model parameter tuning, and fine-tuning of the classification framework to achieve higher detection accuracy with the SSD algorithm for inland watercraft. This detection algorithm is slower because it needs to generate a region candidate frame first. In 2016, Redmon proposed YOLO (you only look once) [
18]. This kind of regression-based algorithm is used to locate and identify achieved outstanding performance in the field of target detection. Yu Y. [
19] and Jiang W. Z. [
20] improved YOLOv2 and YOLOv3 by adjusting the network structure and changing the input scale to increase
mAP to about 80%. However, this method still has room for improvement in the detection of small targets with complex maritime conditions.
Real-time detection of ship targets has high requirements for accuracy. As the latest representative algorithm of the YOLO series, YOLOv5 is characterized by faster speed, higher recognition accuracy, and smaller-sized files, and it can be carried on mobile devices with lower configurations [
21], which gives it high research value. In this research, the model was applied to ship detection based on an unmanned ship platform. Aiming at the problem of poor detection of small targets, structure and detection accuracy were improved.
2. Experimental Platform
2.1. Hardware Platform
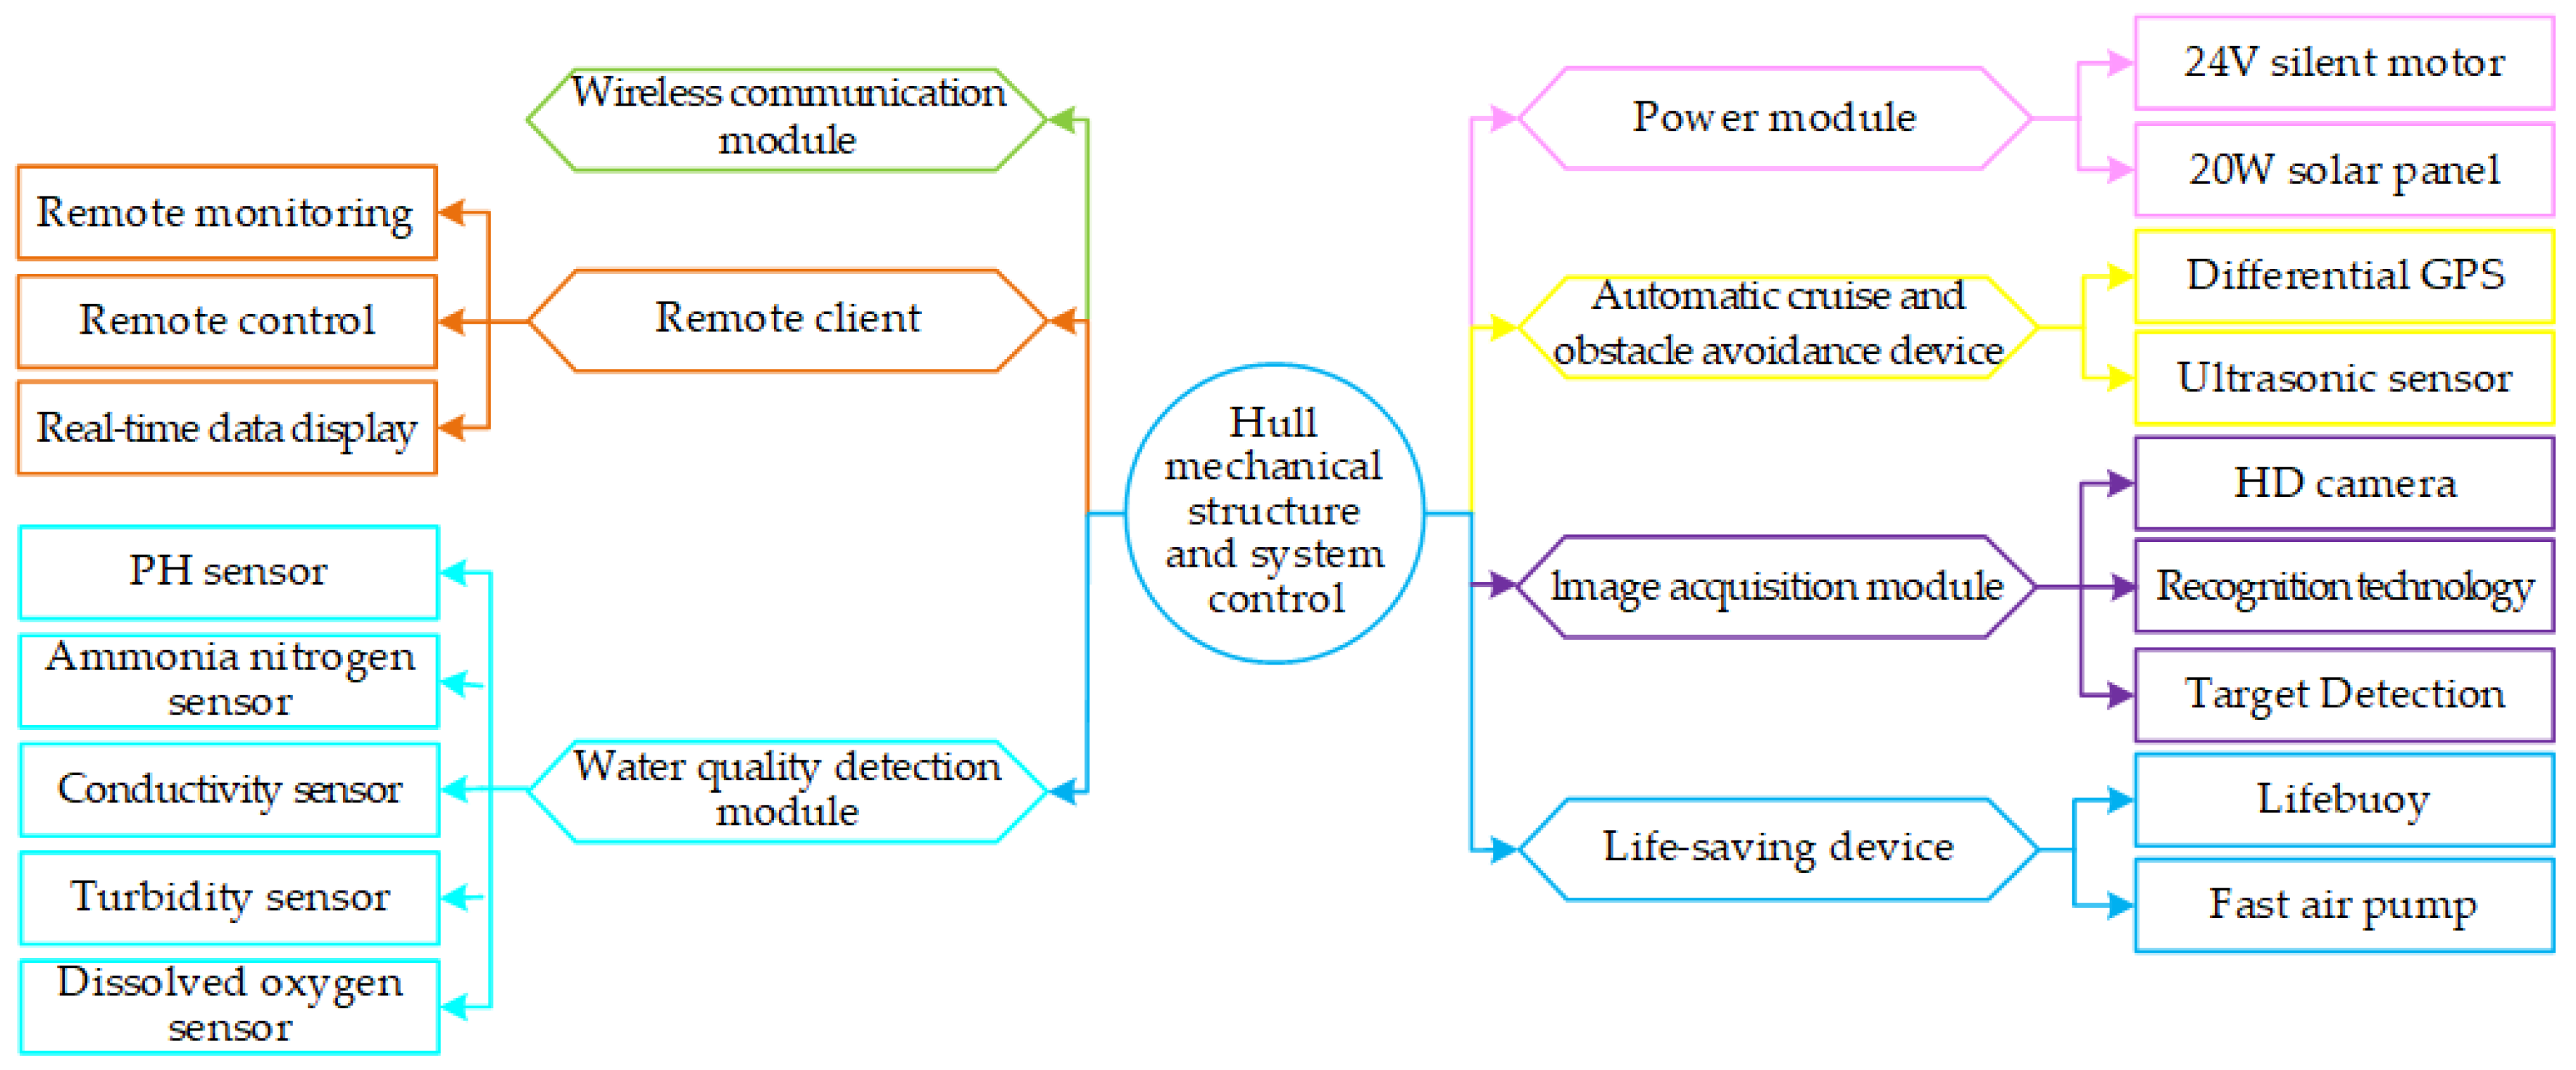
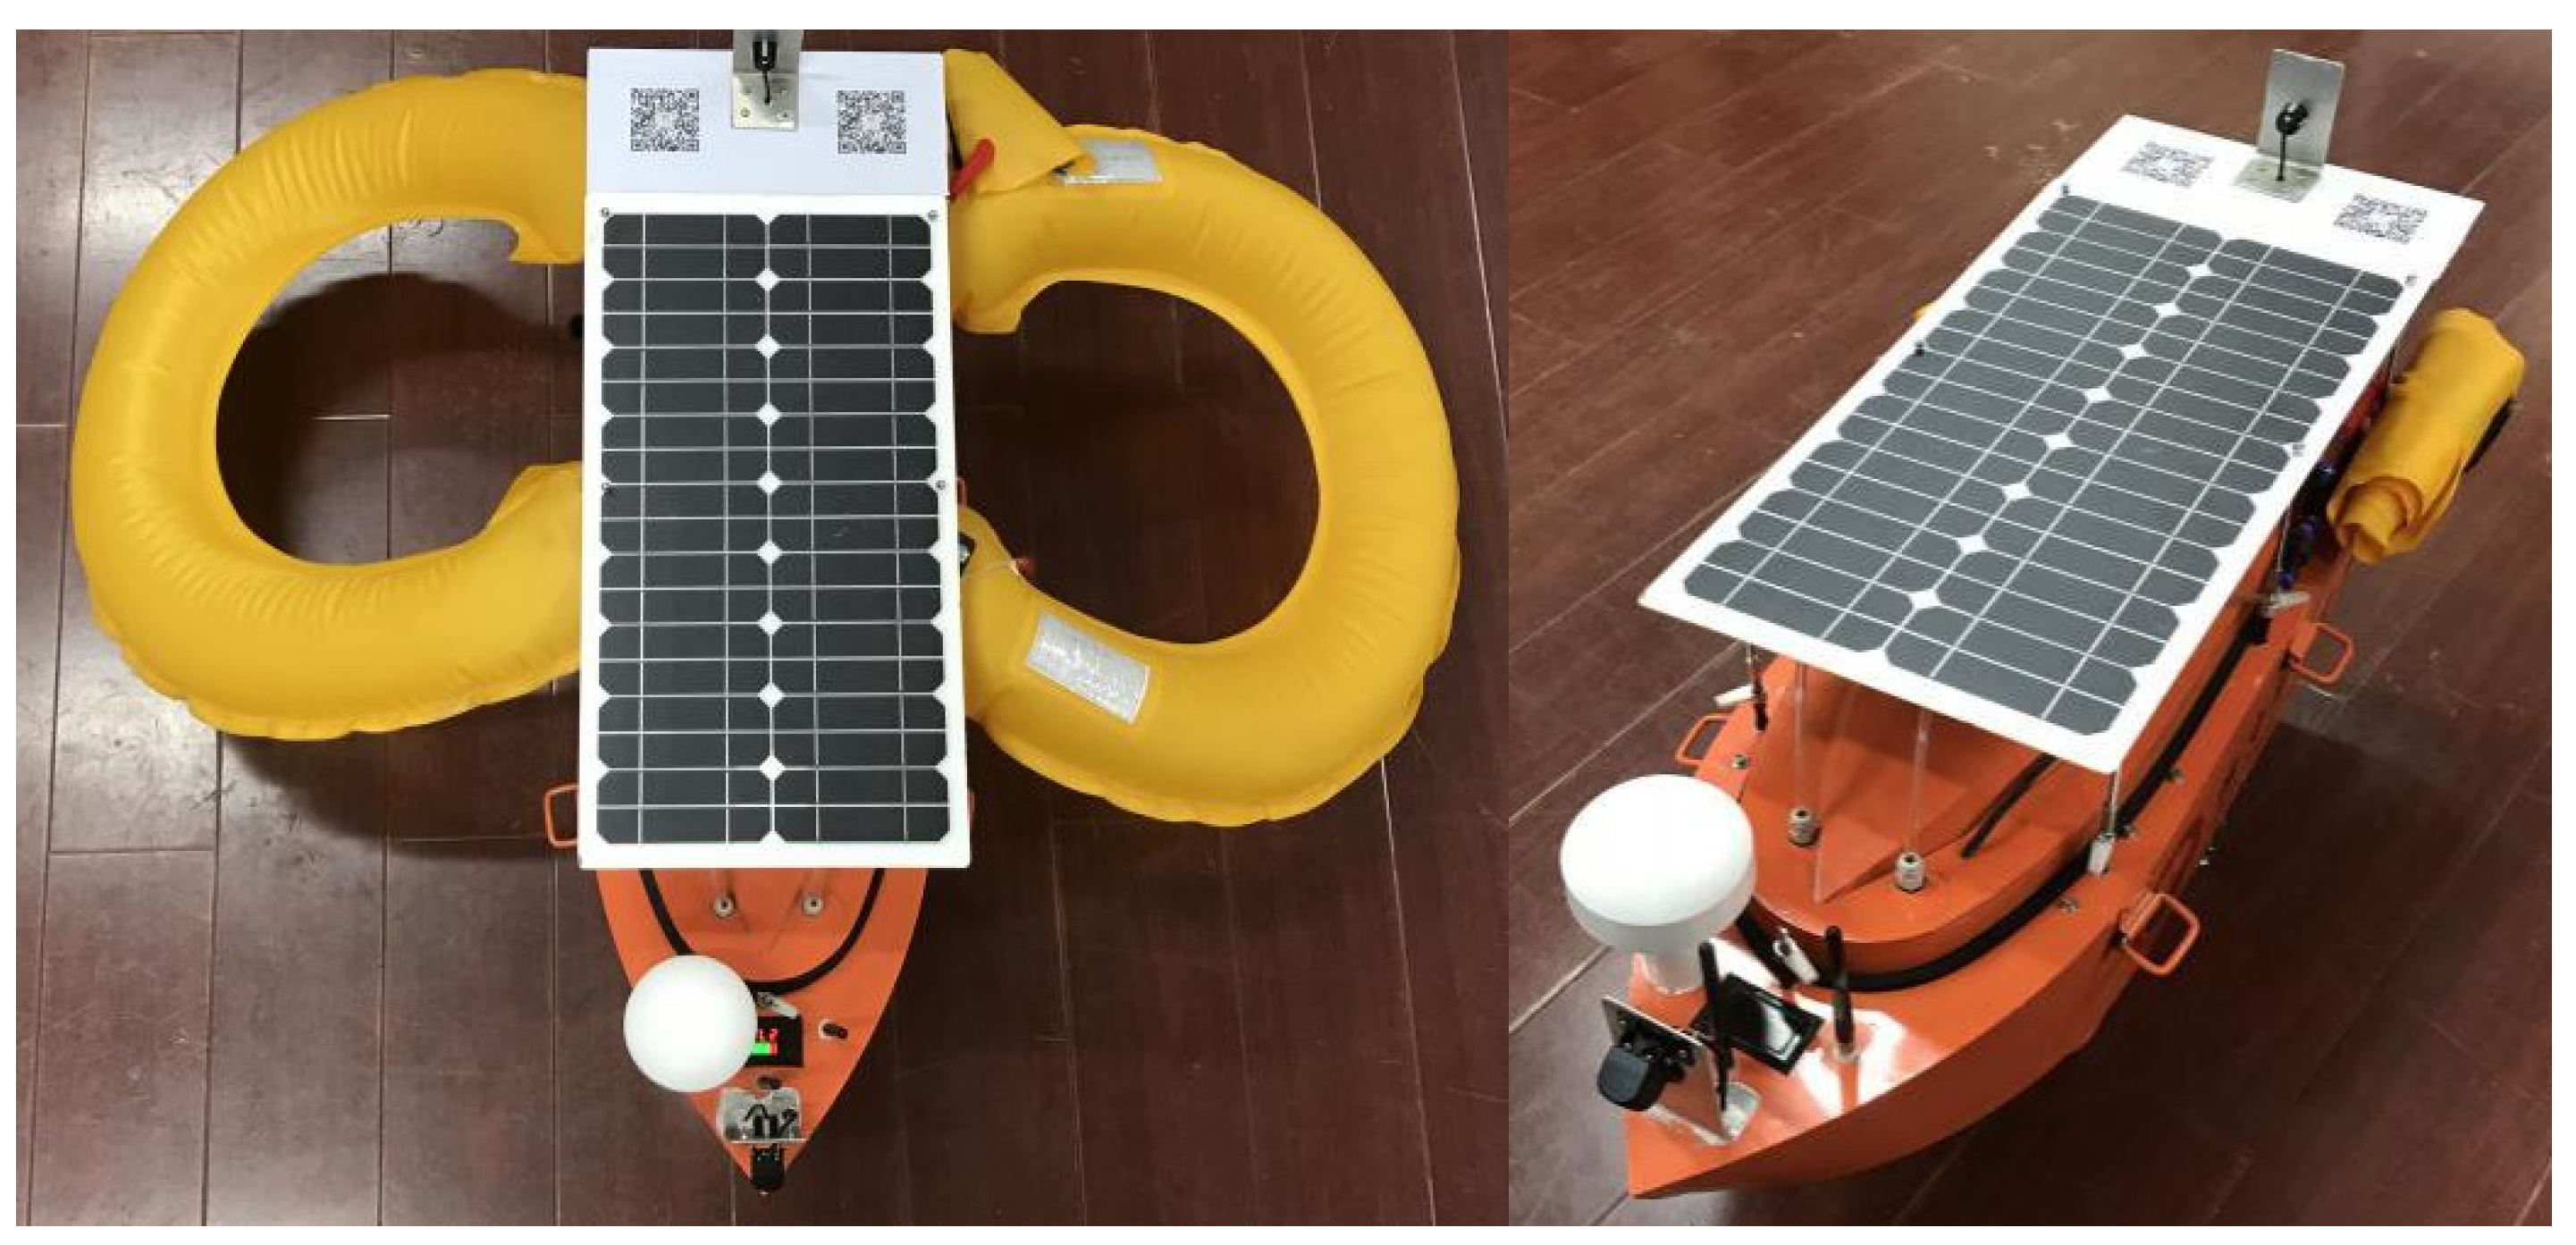
Figure 1 shows the perception platform based on the target visual detection system, which was an intelligent, water-fishing, unmanned speedboat that integrated water quality detection, automatic bait throwing, automatic obstacle avoidance, unmanned driving, image processing, and other technologies. The mechanical structure of the device was mainly composed of a 304 stainless steel hull and a 304 stainless steel drive shaft seal. The size was 800 mm × 280 mm × 320 mm, and it used a V-shaped bow structure design, which was beneficial for reducing resistance, reducing wake, lowering the center of gravity, enhancing stability, and accommodating more components.
2.2. Vision Platform System
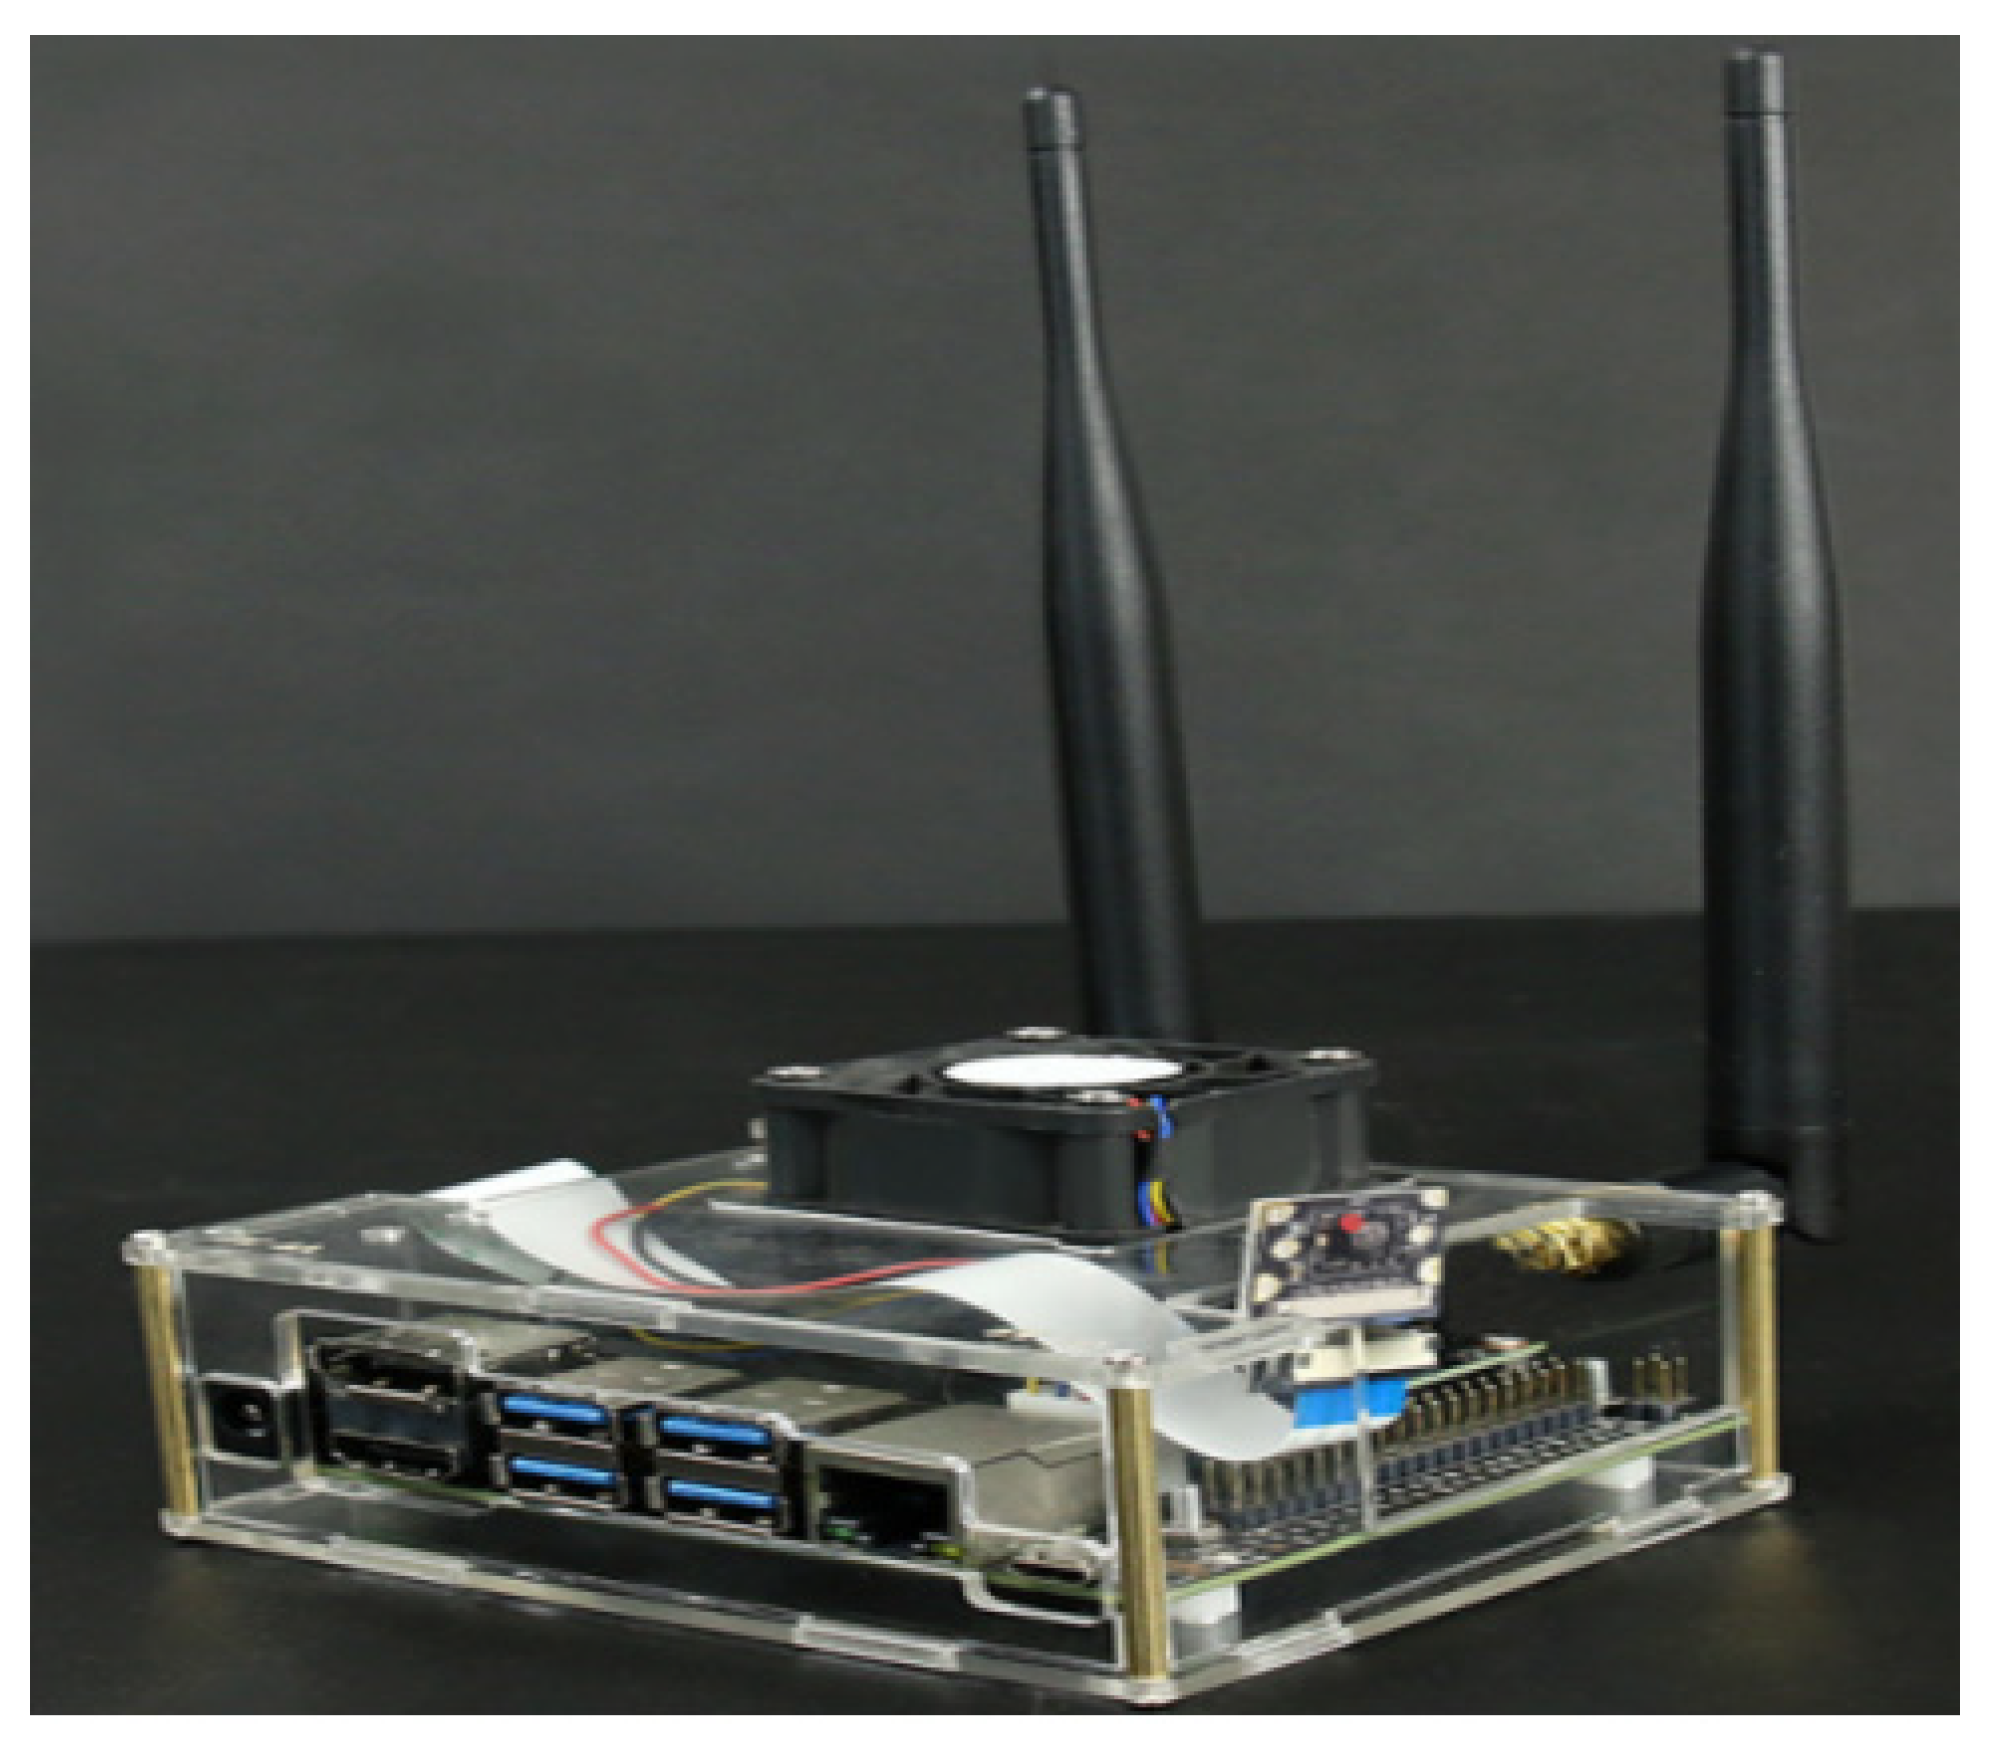
This article mainly focuses on image processing target detection. The image recognition module was an embedded Jetson nano development board, as shown in
Figure 2, which embedded the improved model algorithm that had been trained in advance and realized wireless communication, remote monitoring, and remote control through a 4G network module.
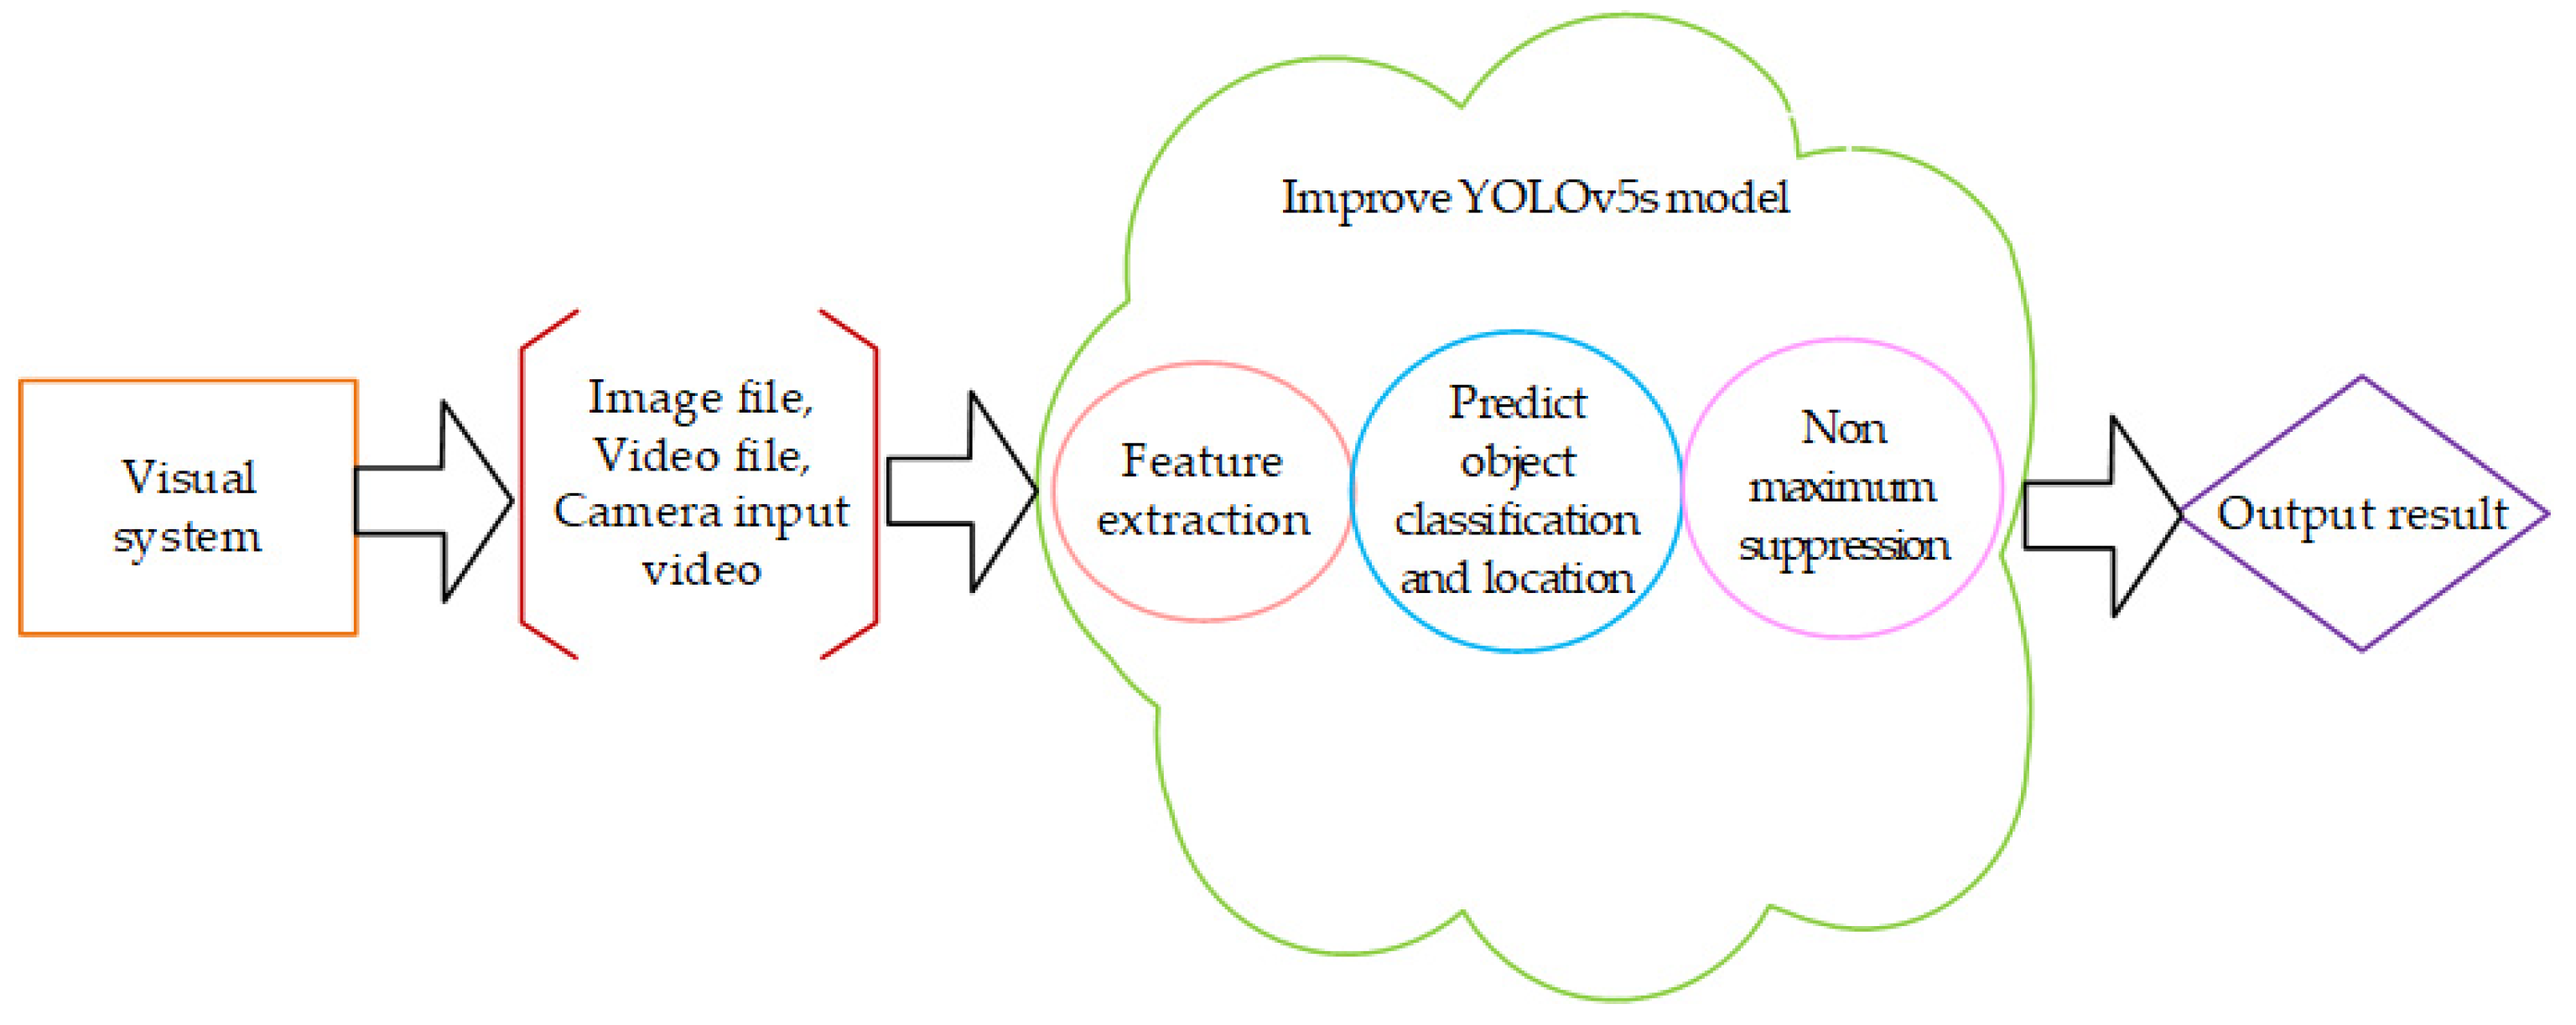
The communication system was divided into an unmanned ship terminal, a cloud server terminal, and a client terminal, which realized the transmission and storage of information and could also realize the remote wireless control of the ship. We performed “end-to-end” calculations through the captured videos and pictures and returned the results to the terminal to issue instructions to the ship. The detection steps are shown in
Figure 3.
2.3. Vision Platform System
The graphics card used was an NVIDIA GeForce GTX 1660Ti; the CPU was INTEL Core I7-9750H@2.60 GHz six-core with 16GB of memory. The environment configuration was Windows 10, Python3.8, Pytorch1.8.1, and Cuda10.1, and the framework was TensorFlow. The parameter settings are shown in
Table 1.
3. Principles and Methods
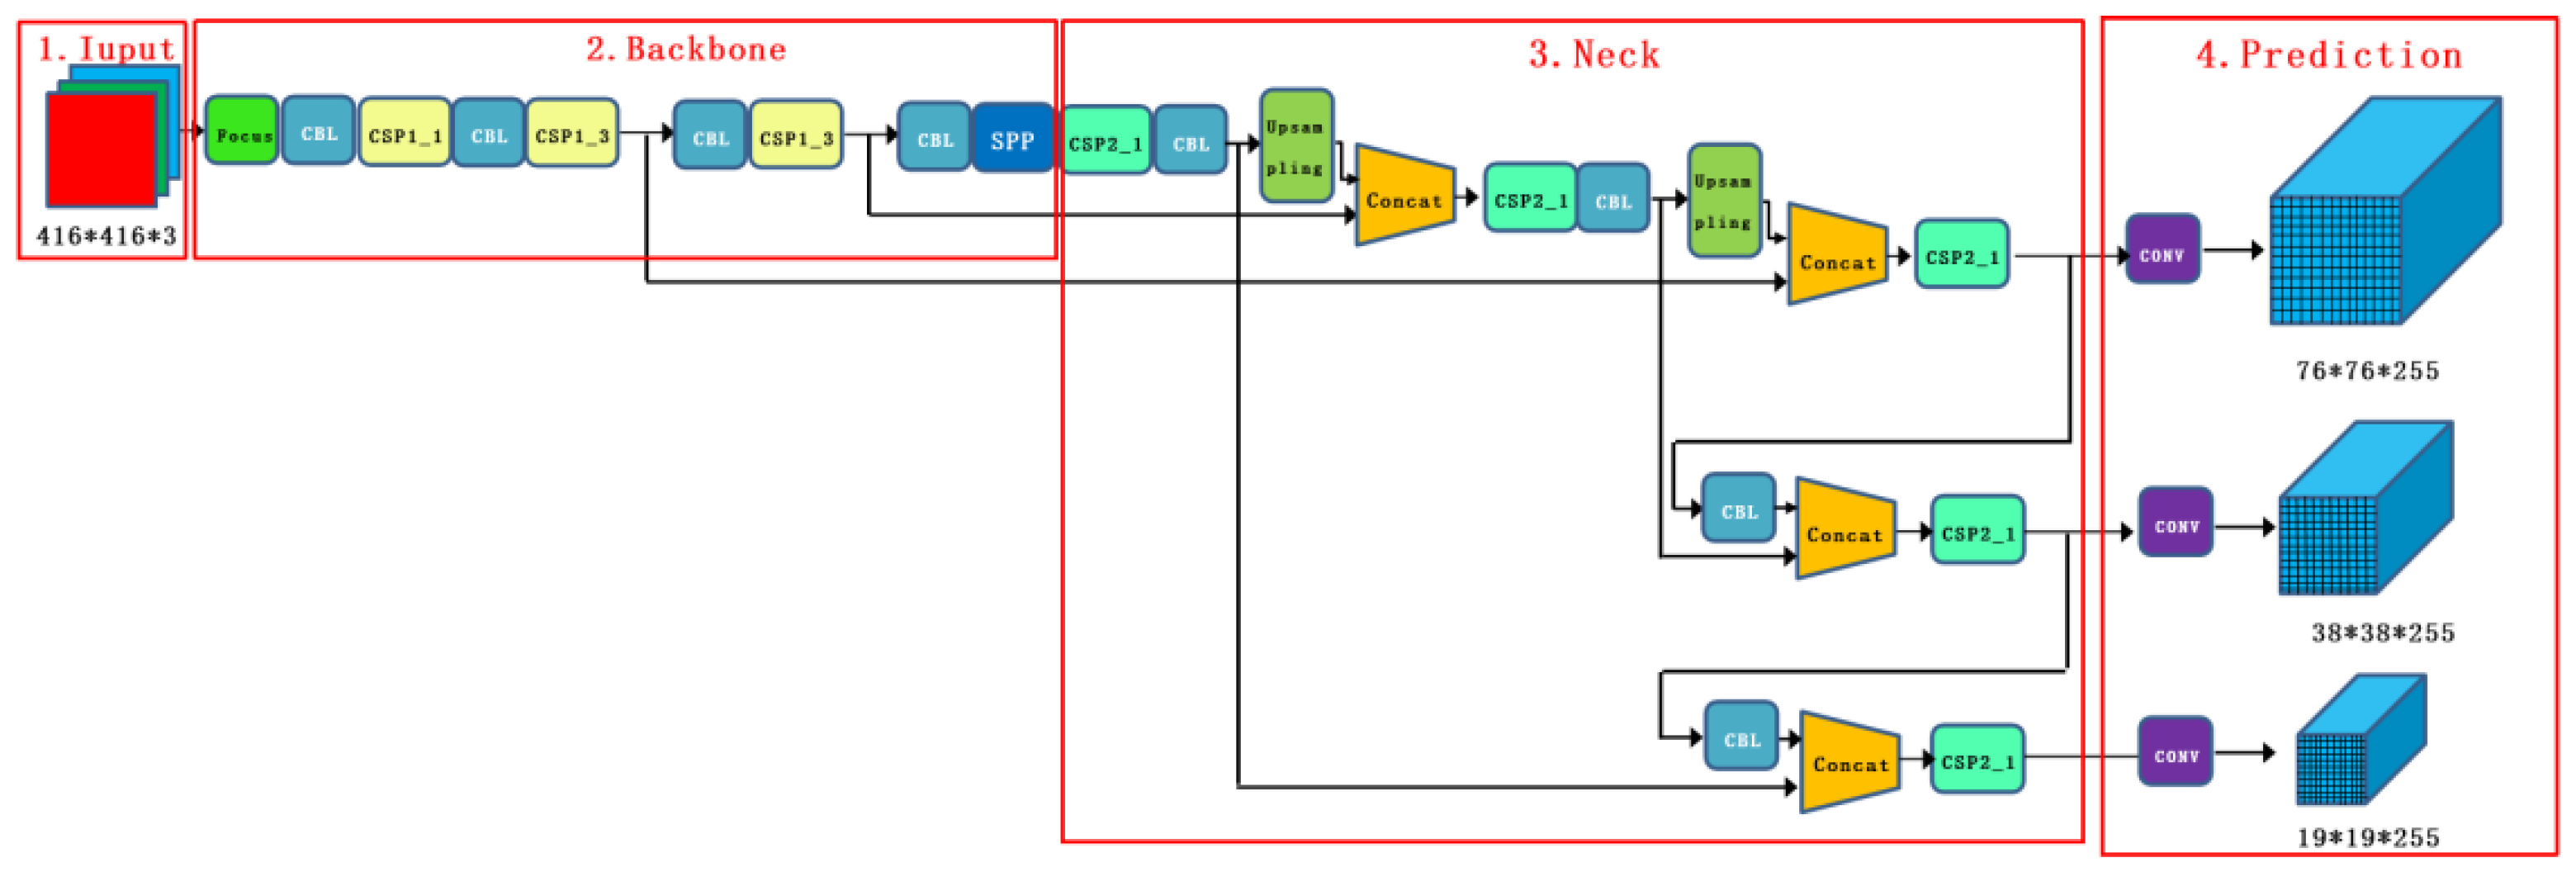
The YOLOv5 model structure is similar to that of other YOLO algorithm series divided into four parts: input, backbone, neck, and prediction.
Figure 4 shows the main structure of YOLOv5s.
The input part can realize data enhancement, adaptive anchor frame calculation, and adaptive image scaling. The feature extraction part mainly adopts the focus structure that can complete slicing and convolution operations and the CSP structure that enhances the learning ability of the feature network. Because the Focus and CBL of different networks have different numbers of convolution kernels, and the number of residual modules of the CSP is different, the model can show different performances by controlling the width and depth of the network. The neck part uses FPN and PAN structures, using the information extracted from the backbone part to strengthen the network feature fusion ability. The output layer is divided into three convolutional layer channels, which are calculated through the loss function, and the result is subjected to maximum value suppression processing to give the prediction result.
3.1. Dataset Preparation and Preprocessing
The experiments in this article are divided into public datasets and self-made datasets. The public dataset is the SeaShips dataset, in which the images are from a monitoring system deployed on the coastline, and the pictures obtained from each frame of the image have been intercepted. The self-made dataset was collected from common ships in the river.
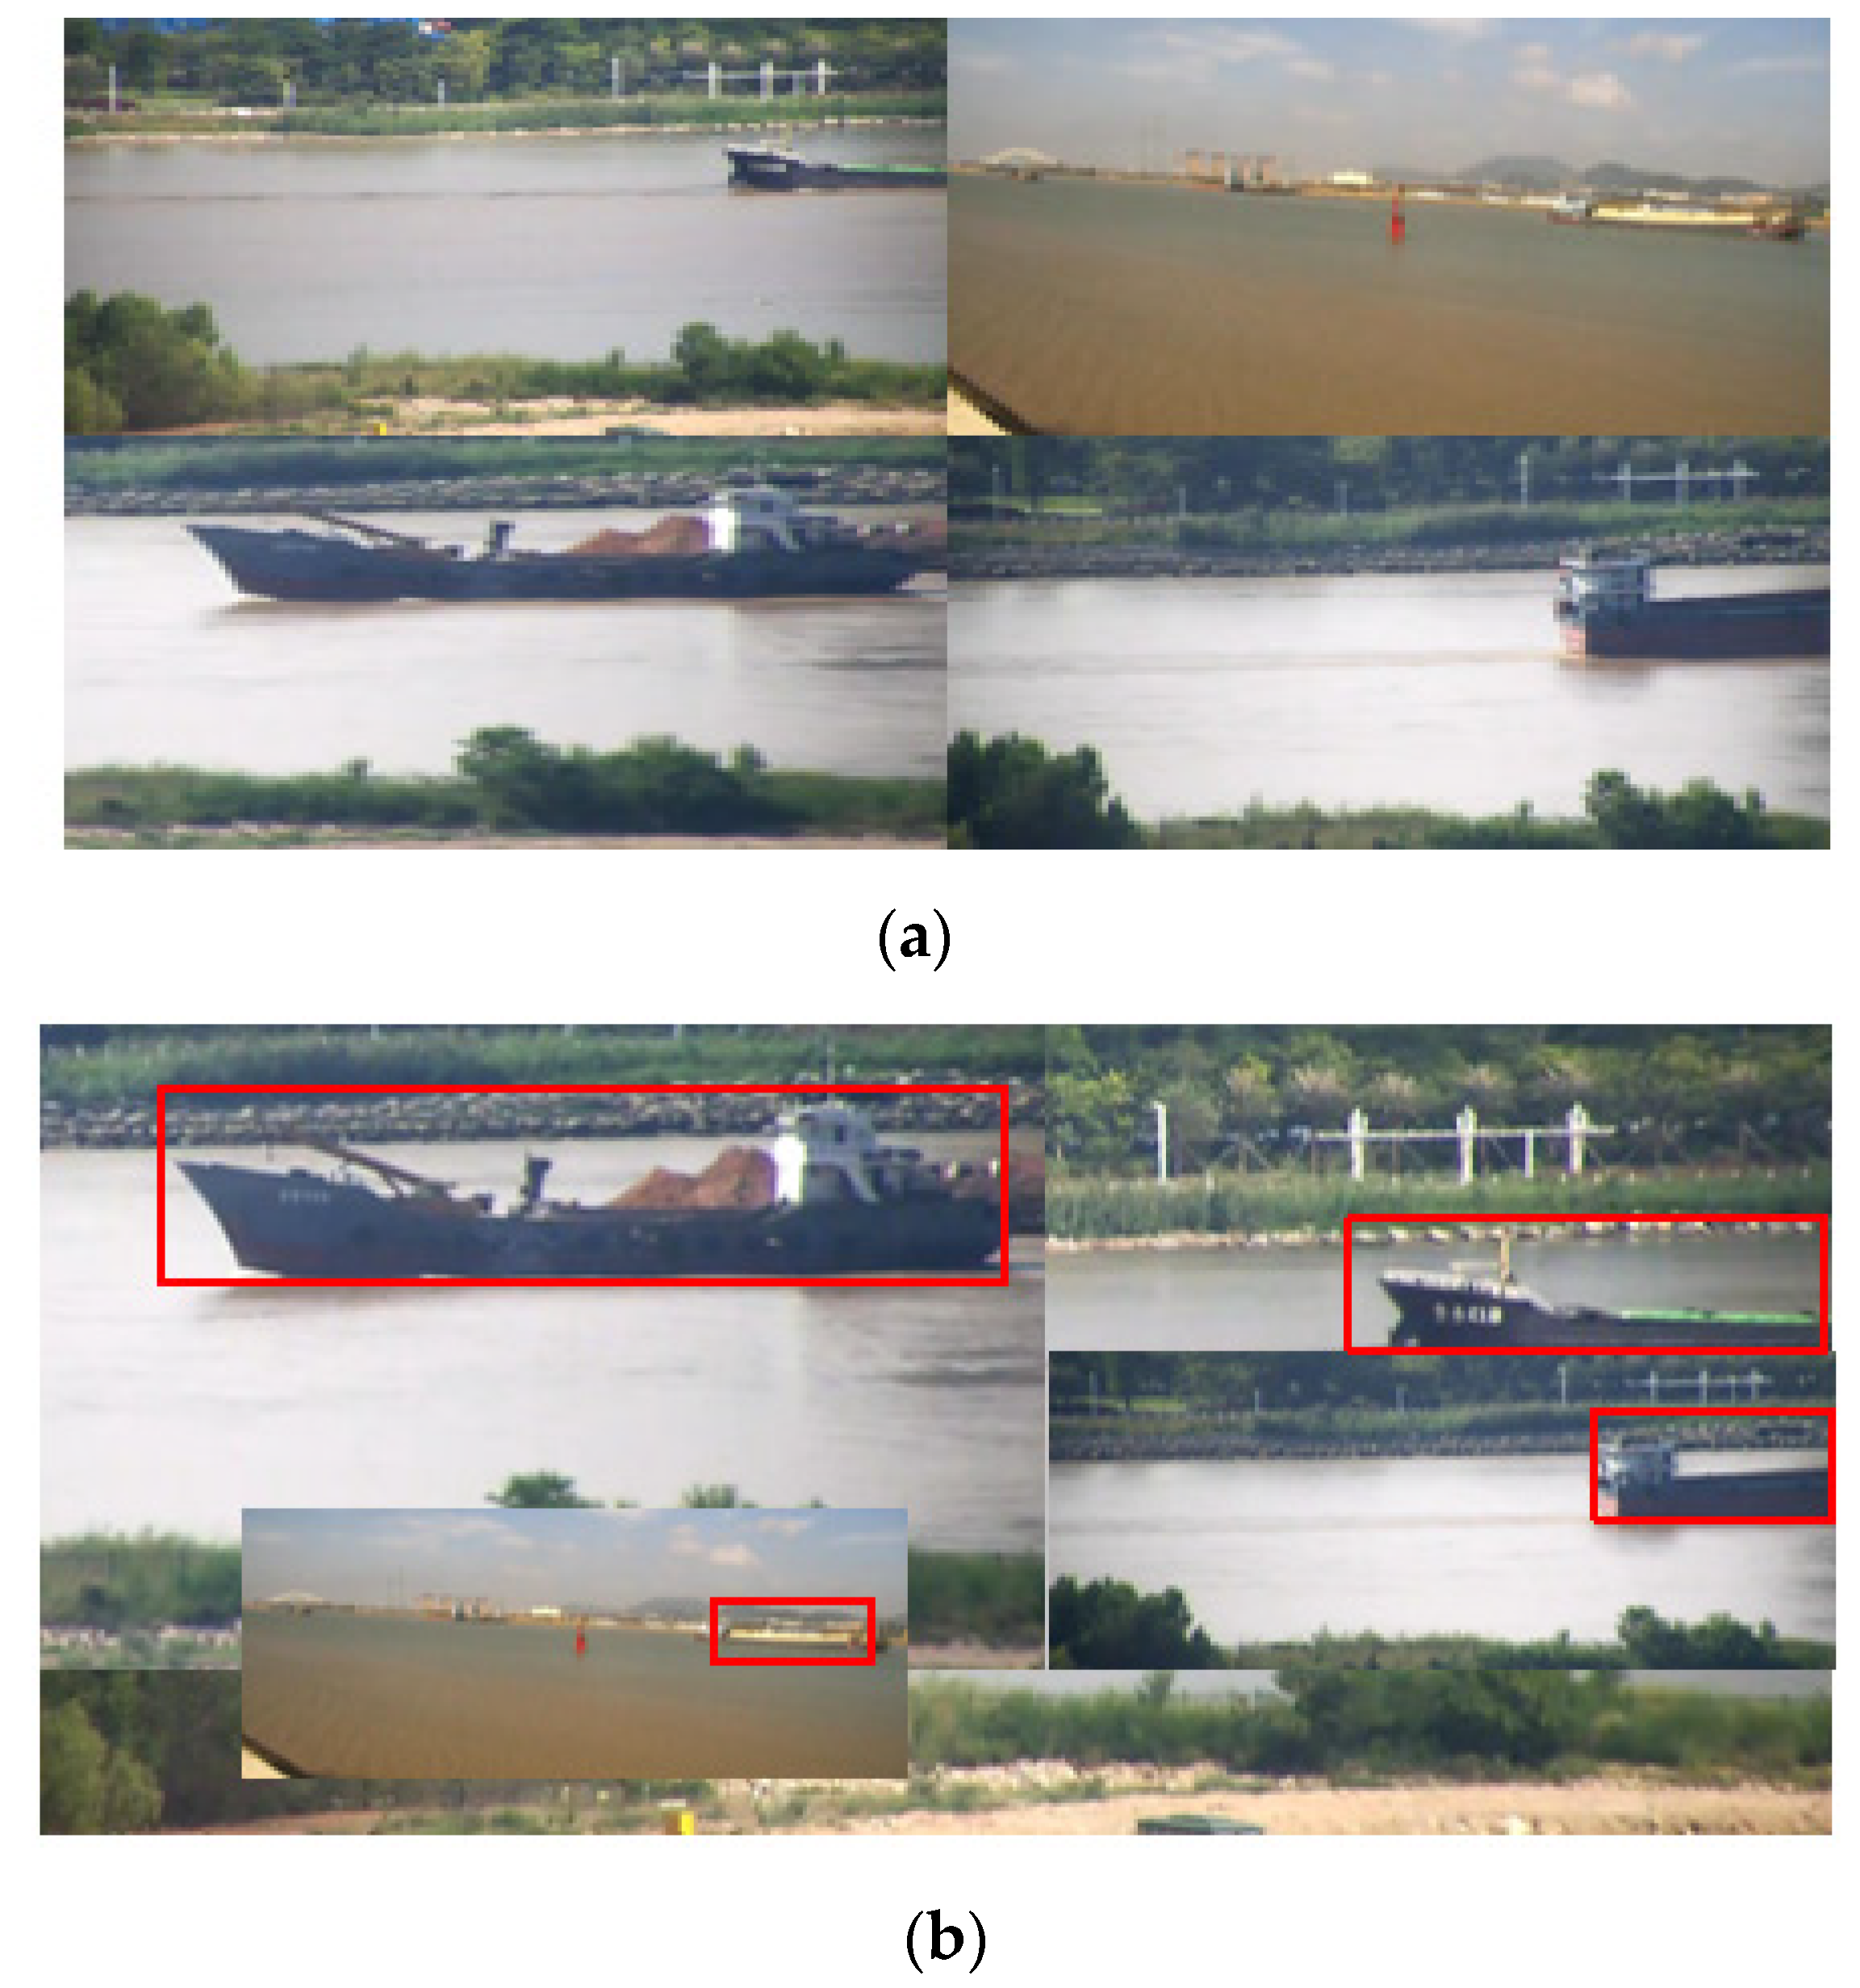
The mosaic enhancement method was used to randomly select four pictures for random scaling and then randomly distribution for splicing, which greatly enriched the detection dataset, especially because the random scaling added a lot of small targets, making the network more robust. The enhanced effect is shown in
Figure 5.
When the image was zoomed on the input end, there were different black borders around it as well as information redundancy, which affected the training speed. We used Equation (1) to calculate the adaptive zoom:
where
x and
y represent the length and width of the input, respectively;
c and
d represent the scaled size;
e is the original height that needs to be filled; and
f is the sum of the two sides that need to be filled.
3.2. YOLOv5s Algorithm Network Structure Improvement
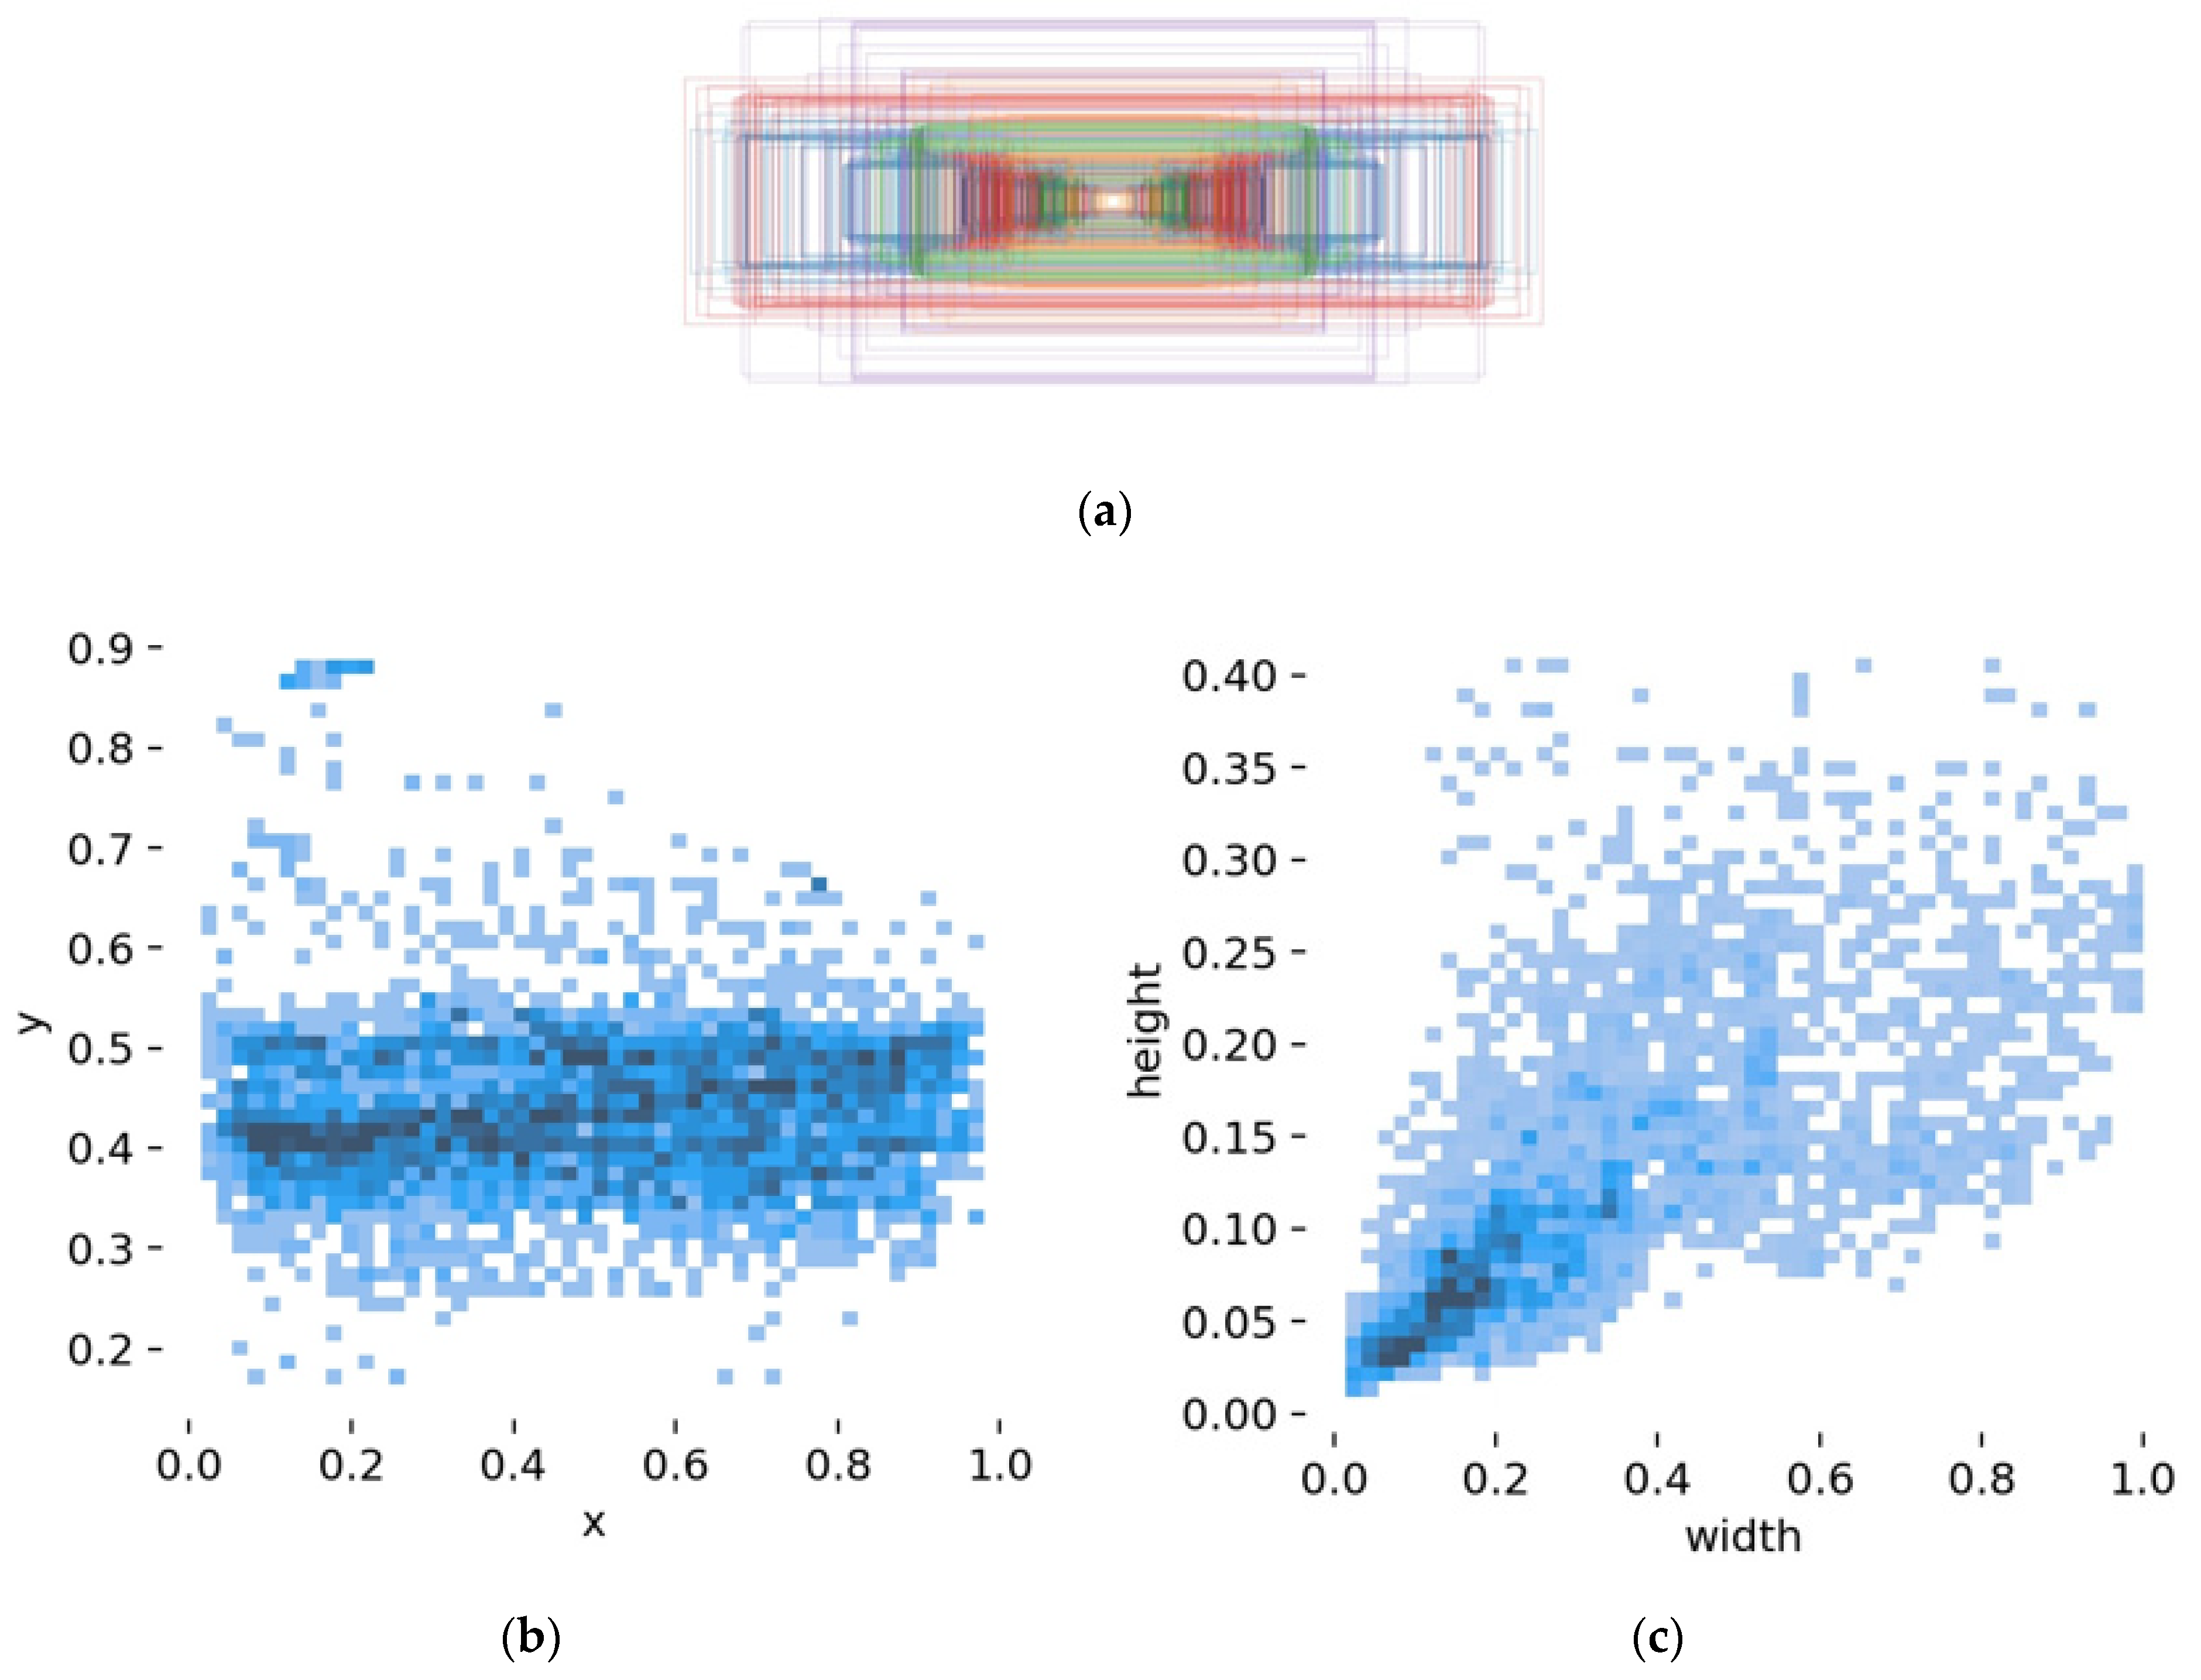
Figure 6a is an anchor frame distribution map to show the intuitive situation of data labels, and an overall analysis of the target position and target size on the label data obtained a target relative position map, as shown in
Figure 6b, as well as a target relative size map, as shown in
Figure 6c.
Figure 6b shows that the lower left corner of the data set picture was set as the coordinate origin to establish a rectangular coordinate system, and the relative coordinate values of the abscissa x and the ordinate y were used to evaluate the relative position of the target. The results show that the horizontal direction of the target runs through the entire coordinate axis, and the vertical direction is more concentrated but somewhat discrete.
Figure 6c shows that the width of the target mostly occupied 2~5% of the image width, and the target height mostly occupied 5~8% of the image height.
It can be seen from the above analysis that there was a large gap between the initial set of regional candidate frames and the distribution of the dataset because the target sample dataset had a rich variety of objects in different sizes, resulting in the insufficient detection of small targets and unbalanced targets. Therefore, the initial frame of the target was clustered first, and the loss function module and the receptive field area were improved.
3.2.1. K-Means Dimensional Clustering
To improve the accuracy of ship identification, the direct use of the original a priori box cannot fully meet demands. Therefore, the K-means clustering algorithm was used to cluster the target frame of the labeled dataset. The purpose was to give the anchor frame and the detection frame a greater intersection ratio to select the best a priori frame. The calculation formula is as Equation (2):
where
represents the intersection ratio of the predicted frame and the true frame. The prior boxes obtained by re-clustering were (12,16), (17,39), (30,52), (54,60), (33,26), (126,183), (227,283), (373,326), and (407,486). The allocation was carried out according to the principle of using large a priori boxes for small scales and small a priori boxes for large scales.
3.2.2. Expanding the Receptive Field Area
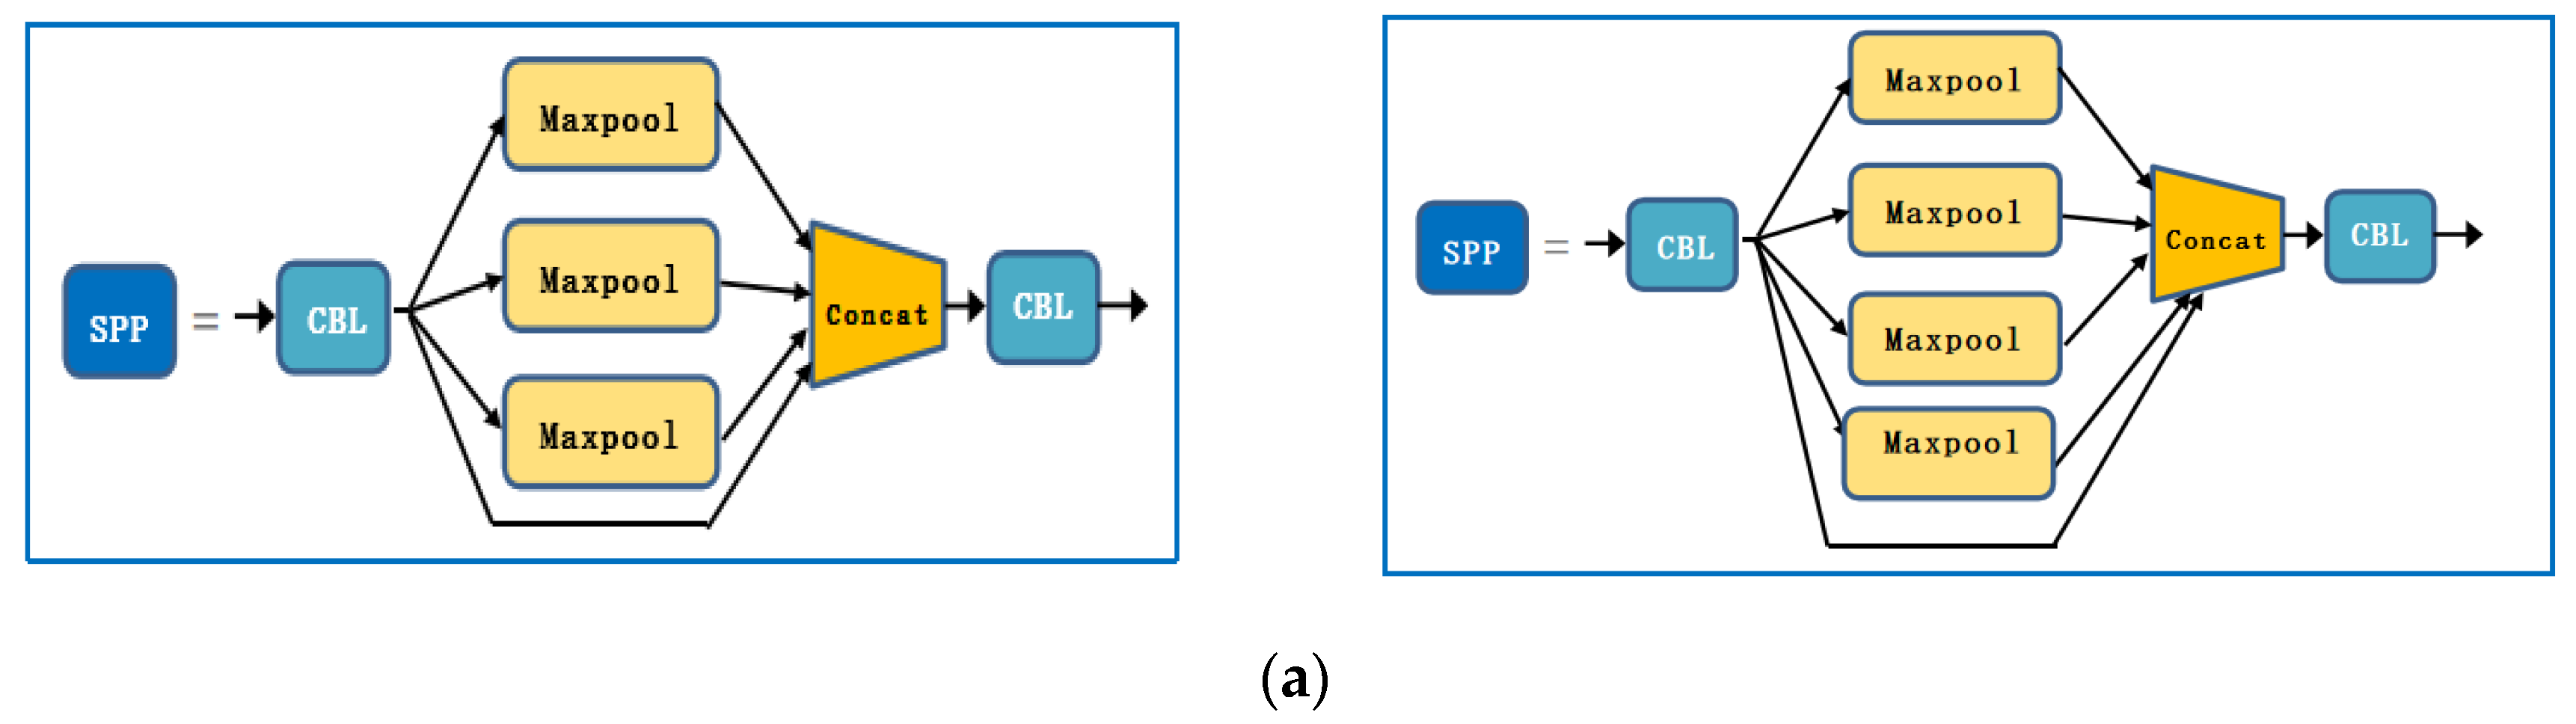
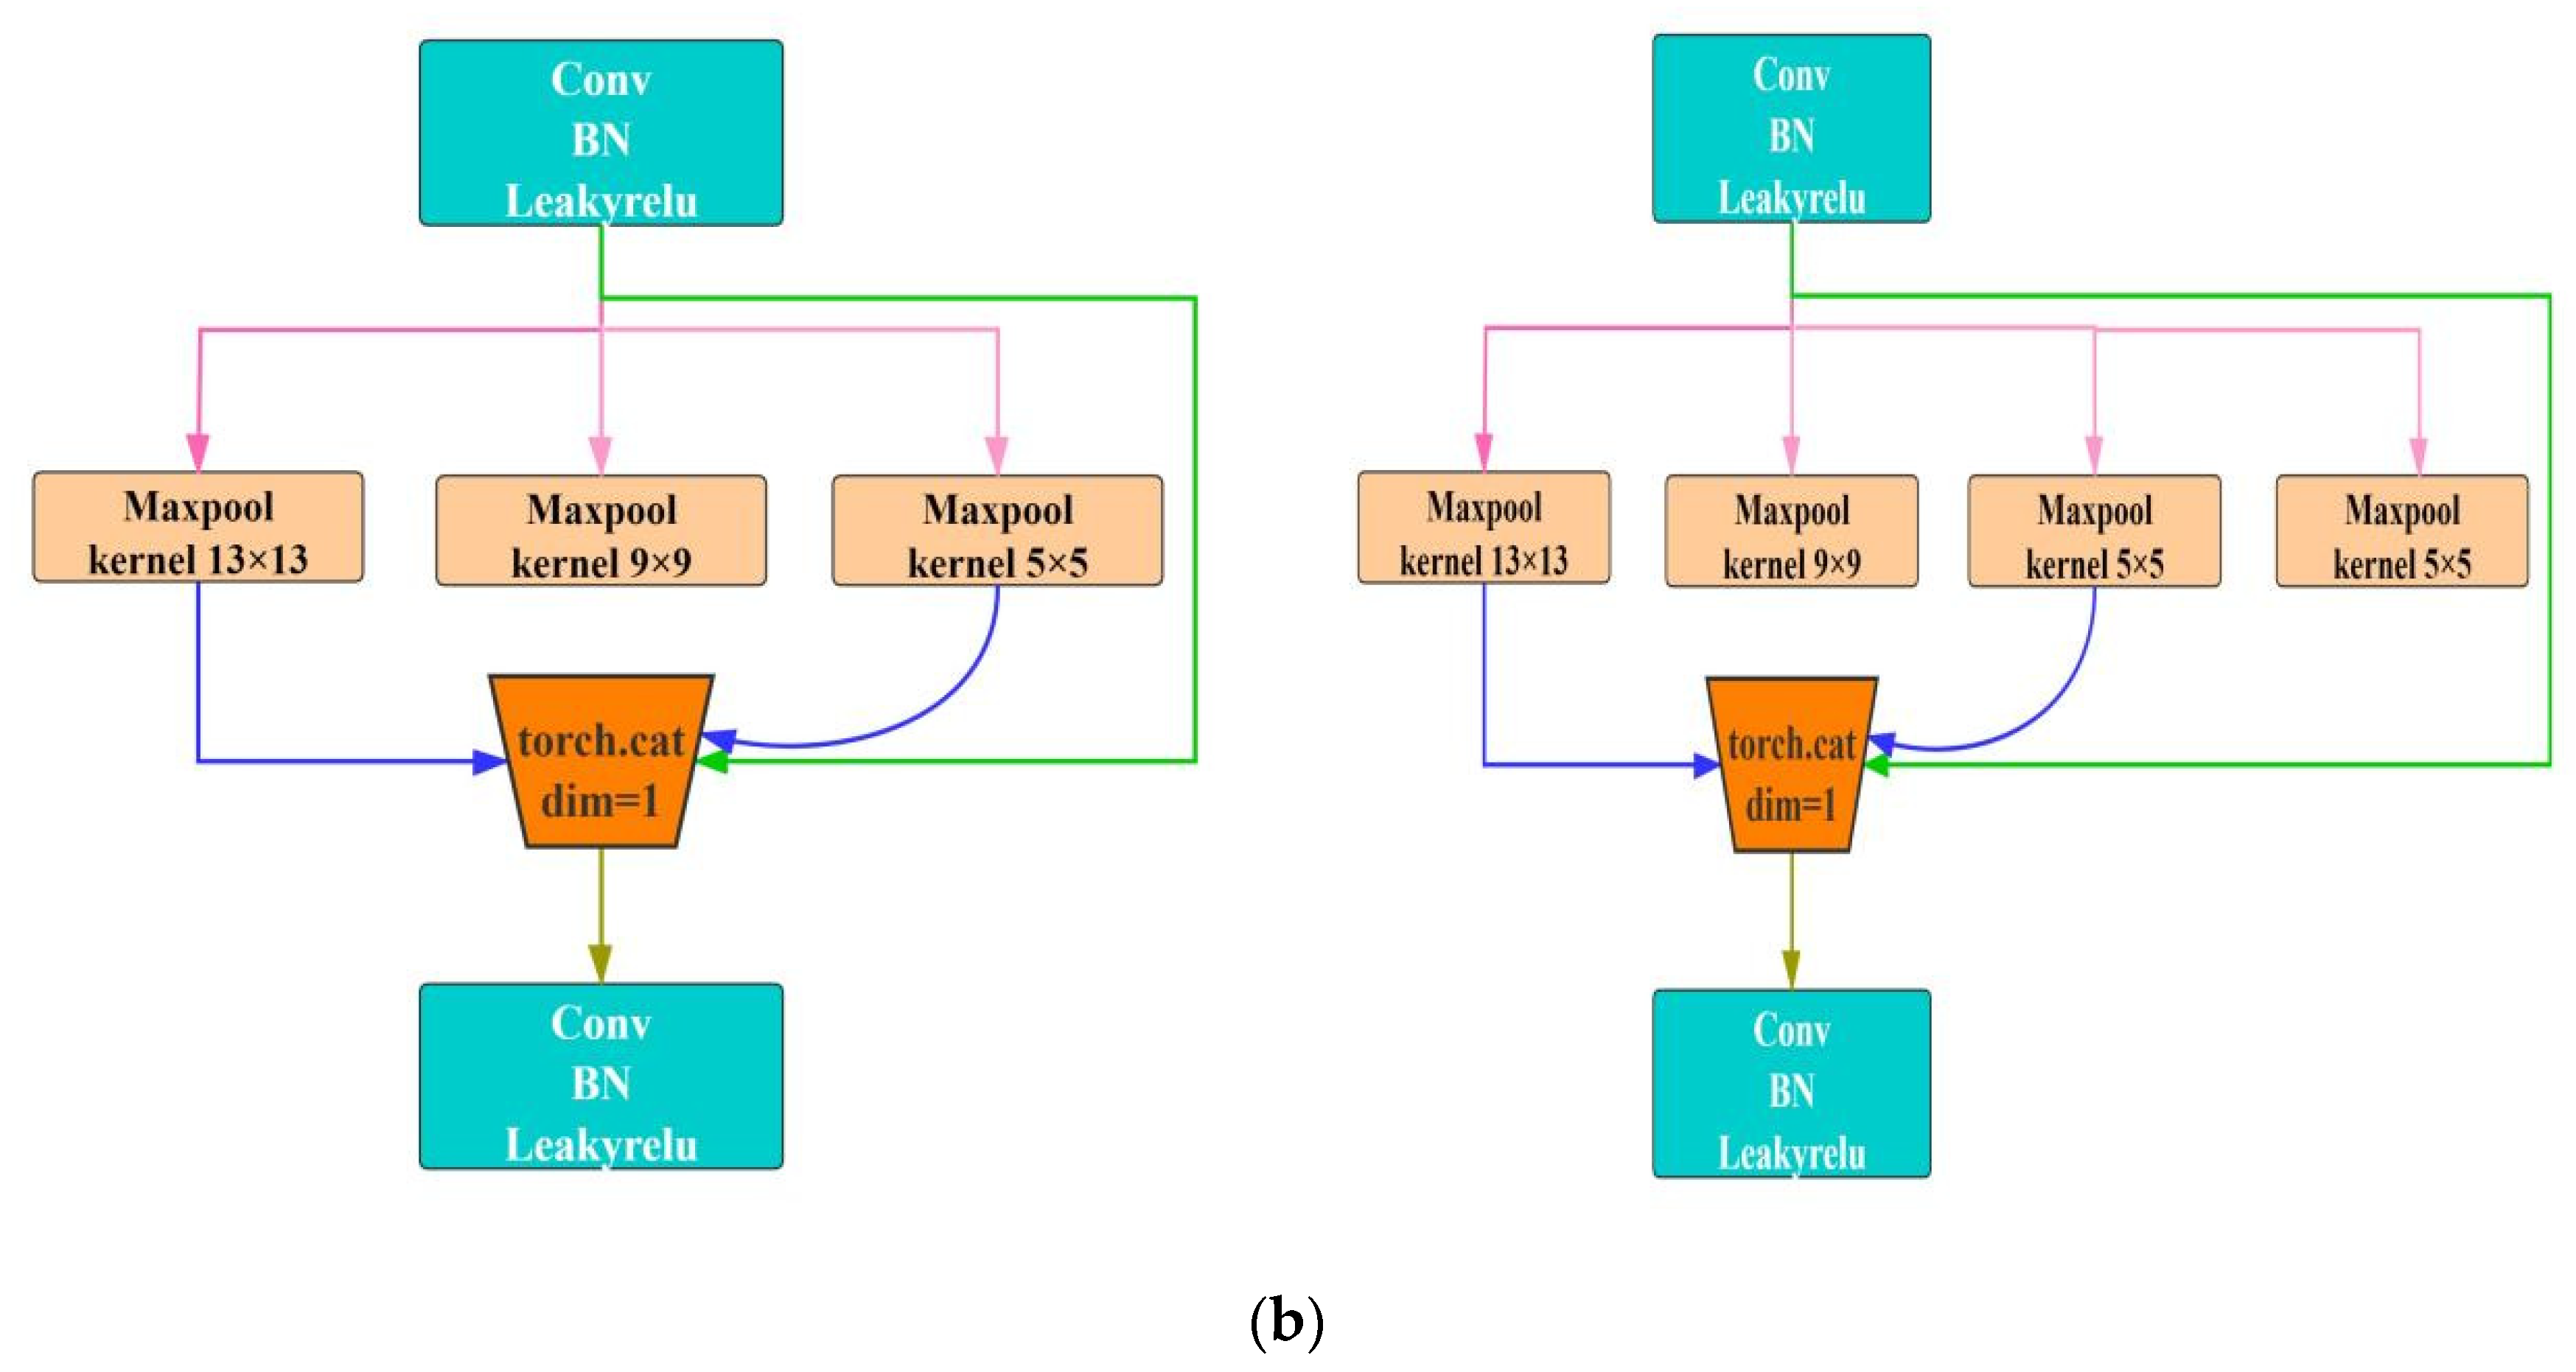
In many vision tasks, the size of the receptive field is a key issue because each pixel in the output feature map must respond to a large enough area in the image to capture information about large objects. Therefore, we chose to add a maximum pooling layer in the space pyramid to improve multiple receptive fields fusion, thereby improving the detection accuracy of small targets. The improved structure is shown in
Figure 7.
Figure 7a is the macro structure, which visually shows that a maximum pooling layer has been added.
Figure 7b shows the microstructure. In the figure, SPP is a spatial pyramid pooling module, and CBL is a combination module comprising a convolutional layer, a BN layer, and an activation function layer. From a microscopic point of view, we increased the receptive field of the model by adding a 3 × 3 maximum pooling filter.
3.2.3. Improved Loss Function
Equations (2)–(5) are the loss functions of the original YOLOv5 algorithm that was used for the bounding box,
GIOU_Loss, which has certain limitations. When there is a phenomenon contained between the detection box and the real box, the overlapping part is unable to be optimized. For confidence and category loss, the original algorithm uses a two-category, cross-entropy loss function, which, to a certain extent, is not conducive to the classification of positive and negative samples.
where
C represents the smallest bounding rectangle between the detection frame and the prior frame and
Q represents the difference between the smallest bounding rectangle and the union of the two boxes.
where
and
indicate whether there is a target in the
th detection frame in the
th grid,
is the loss weight of the positioning error,
and
are training values, and
and
are predicted values.
According to the above problems, the improved loss function of Equations (6)–(8) was adopted. The bounding box of the improved algorithm used the
CIOU_Loss loss function to increase the restriction mechanism for the aspect ratio so that the prediction box would be more in line with the real box. Confidence and category loss functions adopted an improved cross-entropy function, which made the separation of positive and negative samples flexible by changing their weights and reduced the impact on them.
where
is the Euclidean distance between the center point of the detection frame and the prior frame,
is the diagonal length of the two smallest enclosing rectangles, and
is the weight coefficient.
The distance between the overlapping area and the center point is considered, but the aspect ratio is not considered, so the following parameters are added to the penalty term of DIOU:
where
is a parameter for measuring the consistency of the aspect ratio.
where
and
represent coordination parameters.
4. Results and Discussion
The evaluation index system of this experiment included mean average precision, recall rate, and precision rate. The closer a
mAP value was to 1, the better the overall performance of the model. There were six types of ships in the dataset used in this study, so the
mAP calculation was the average of the six types of AP, the value of which was the area enclosed by the recall and precision curves, as in Equation (10):
where
TP represents the number of correctly identified ship images,
FP represents the number of misrecognized ship images, and
FN represents the number of missed ship images.
4.1. Model Training
By controlling the depth and width of the model, the four models could be trained in groups to determine which model was suitable for the detection of ships on the water. The four models (s, m, l, x) ranged from shallow to deep and from narrow to wide. The depth of the model was related to the number of residual components, and the width was related to the number of convolution kernels. The parameter settings are shown in
Table 2.
The results of group training are shown in
Table 3. Although the YOLOv5s model performed slightly worse, the
mAP values of the other three models were all around 98%.
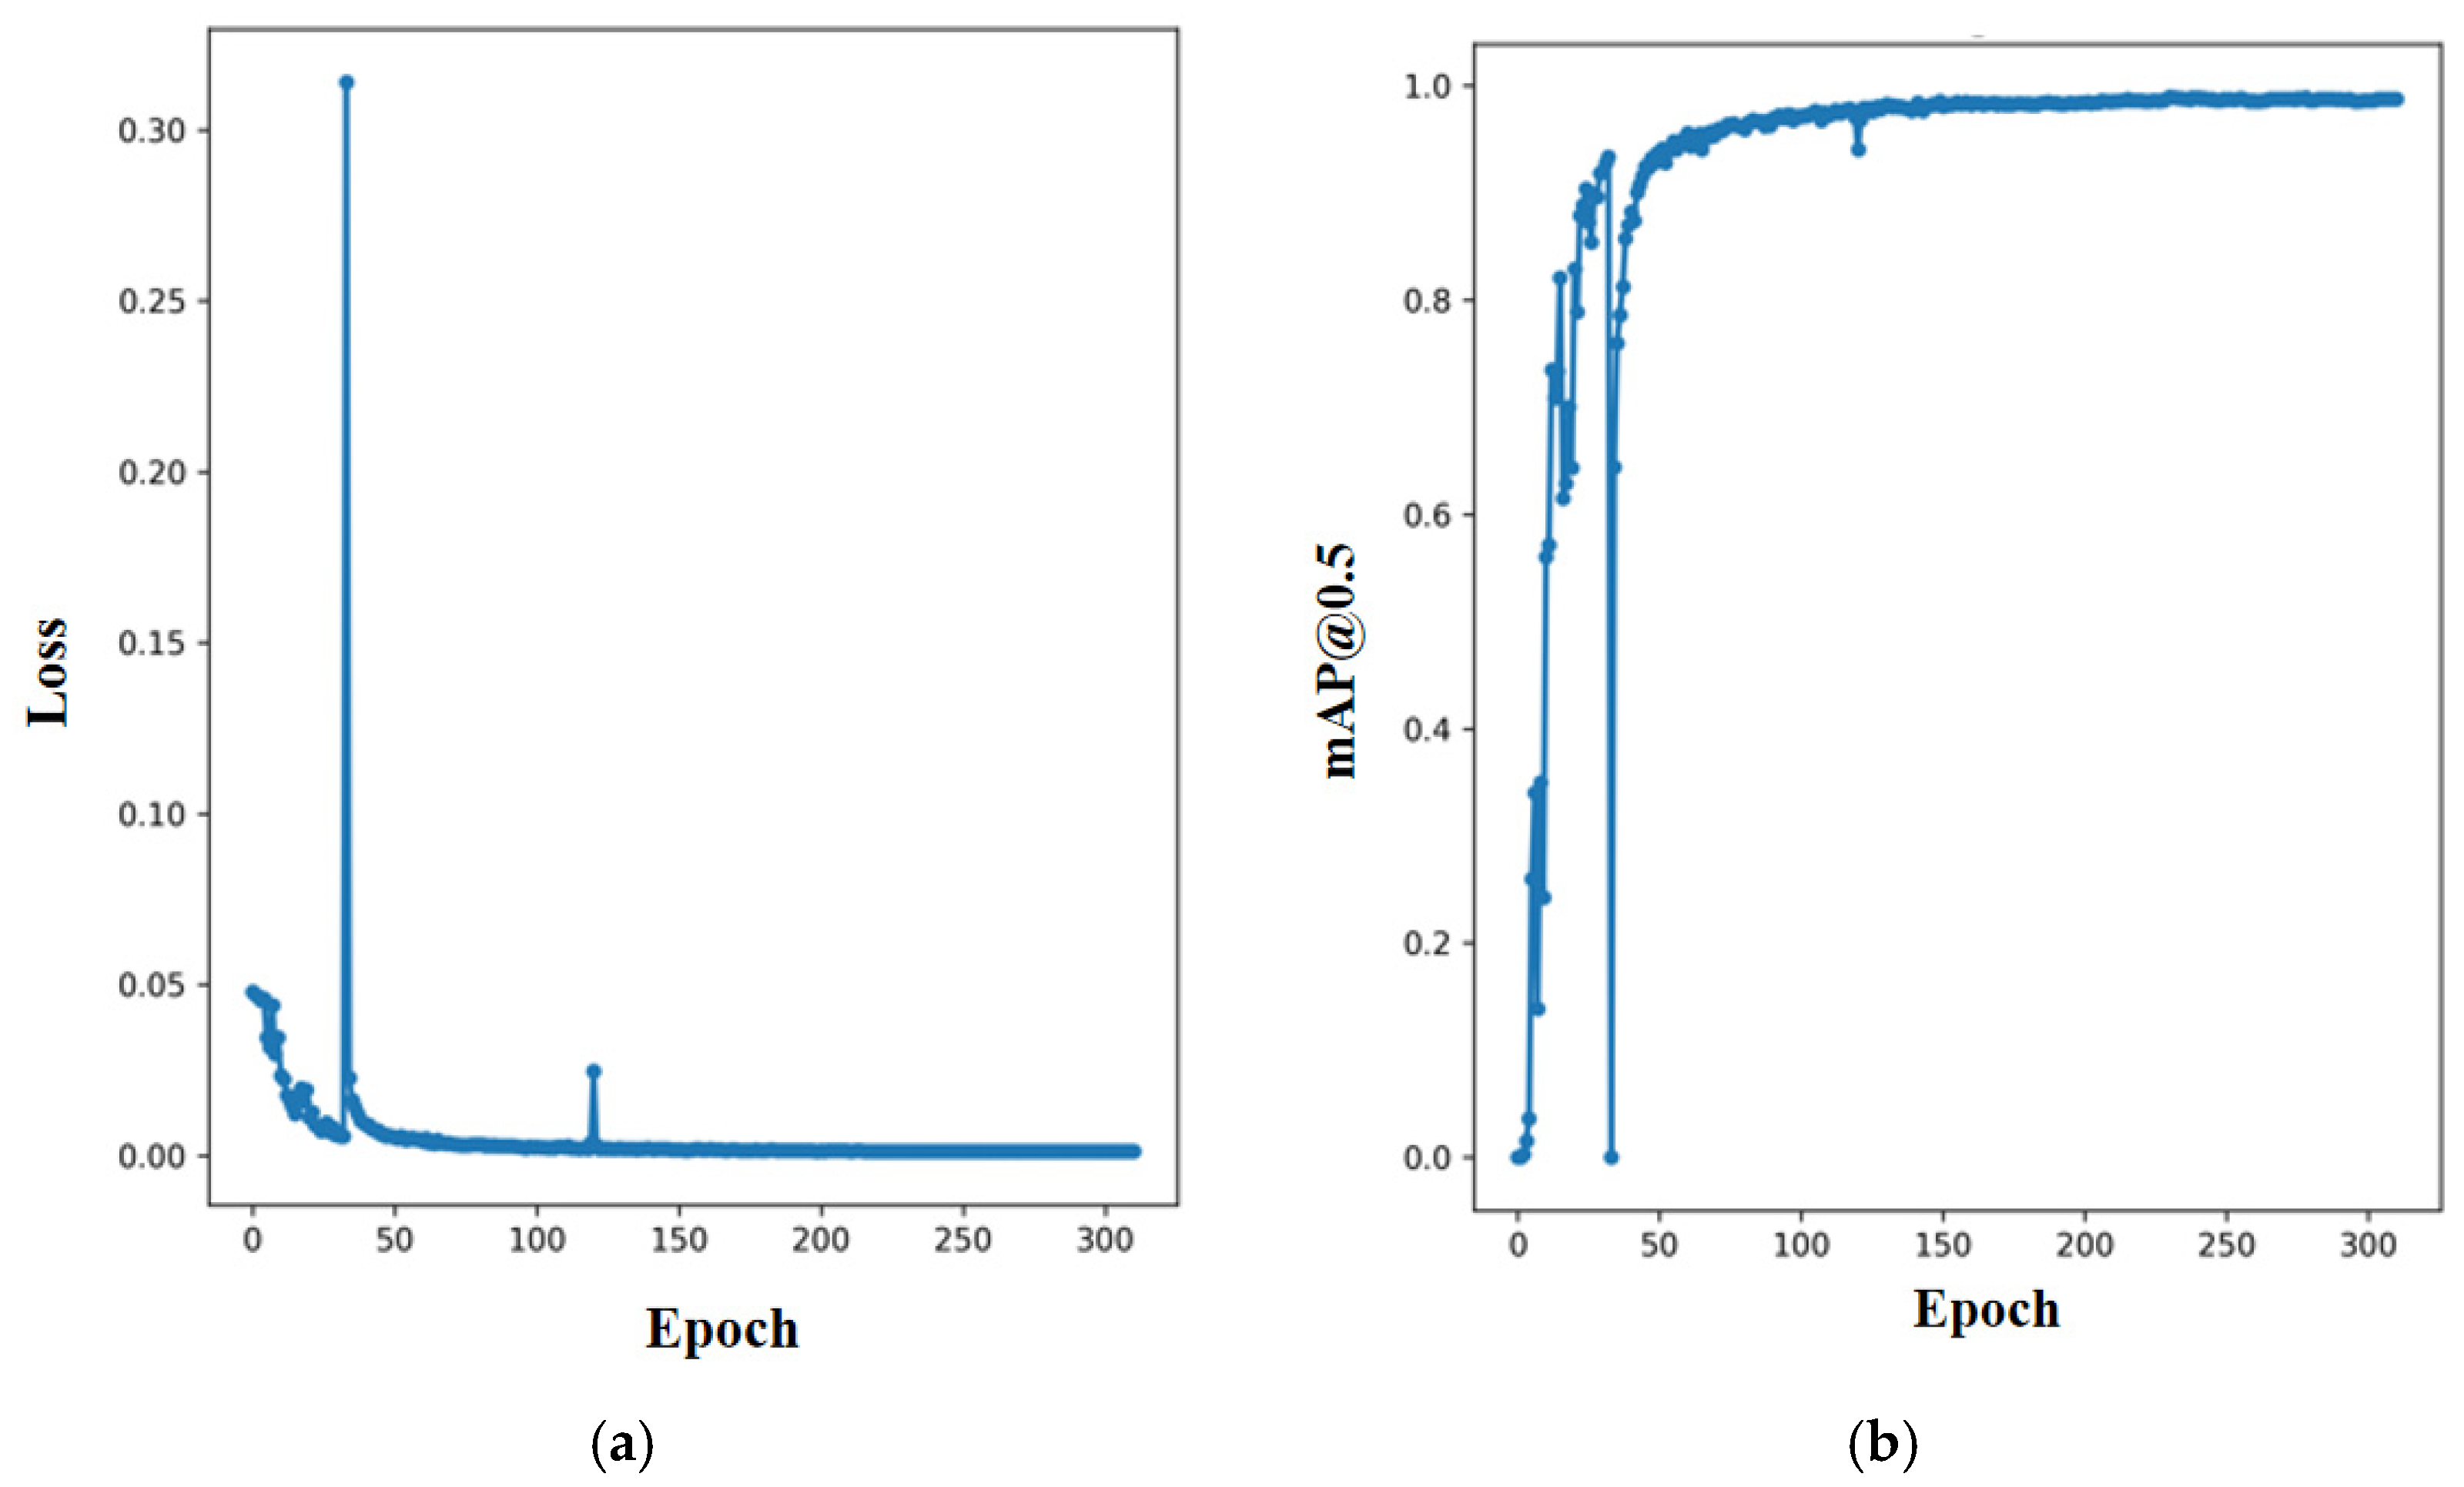
Each parameter of the 5× model had a strong fluctuation in the 0–50 rounds; it was judged that the model had great instability for the detection of small targets. The specific situation is shown in
Figure 8. The abscissa in the two figures is the epoch, and the ordinate is the value of the loss and
mAP@0.5.
Among them, the 5l and 5m model detection times were too long and did not have good real-time performance; the 5S model had a short detection time, so it had real-time requirements. A reason for its poor accuracy may be that the model is not effective for small target recognition, and the output frame is biased. This study has made improvements to this situation.
4.2. Improved Model Result Analysis and Comparison
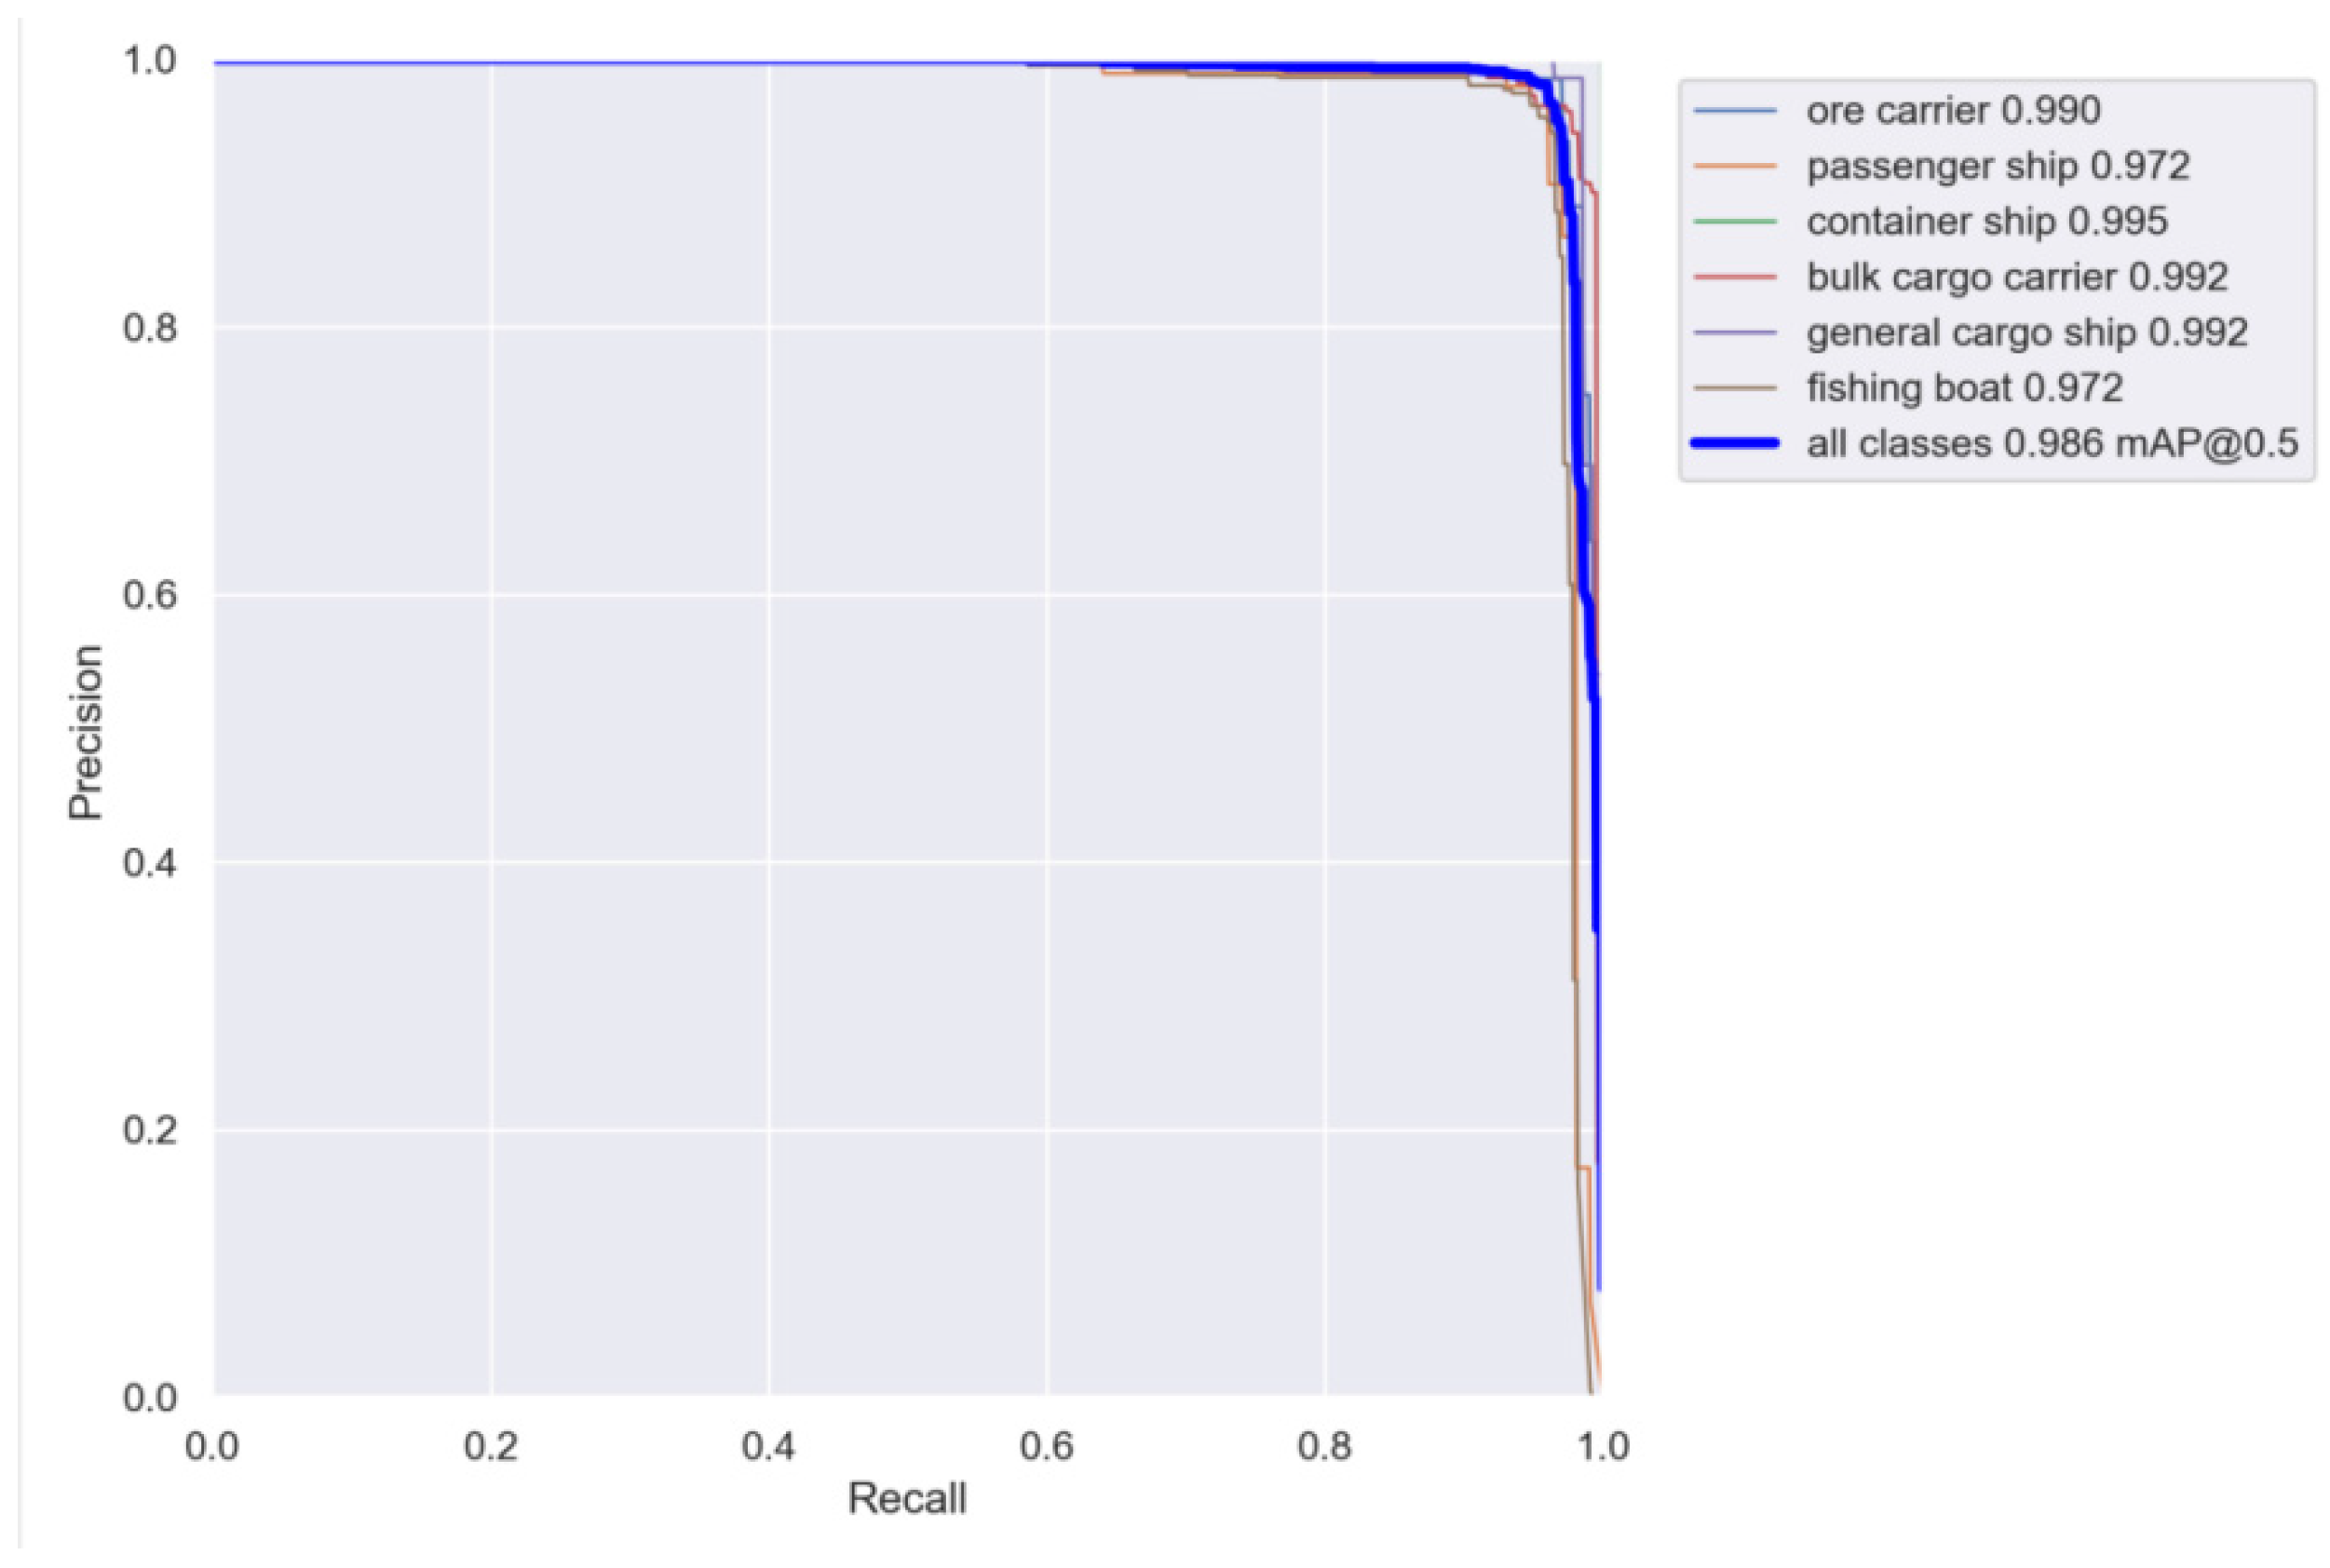
Figure 9 shows the improved PR curve of the 5s model. It can be seen that the improved model achieved good recognition results for all types of ships, and the AP value for container ships reached 99.5%.
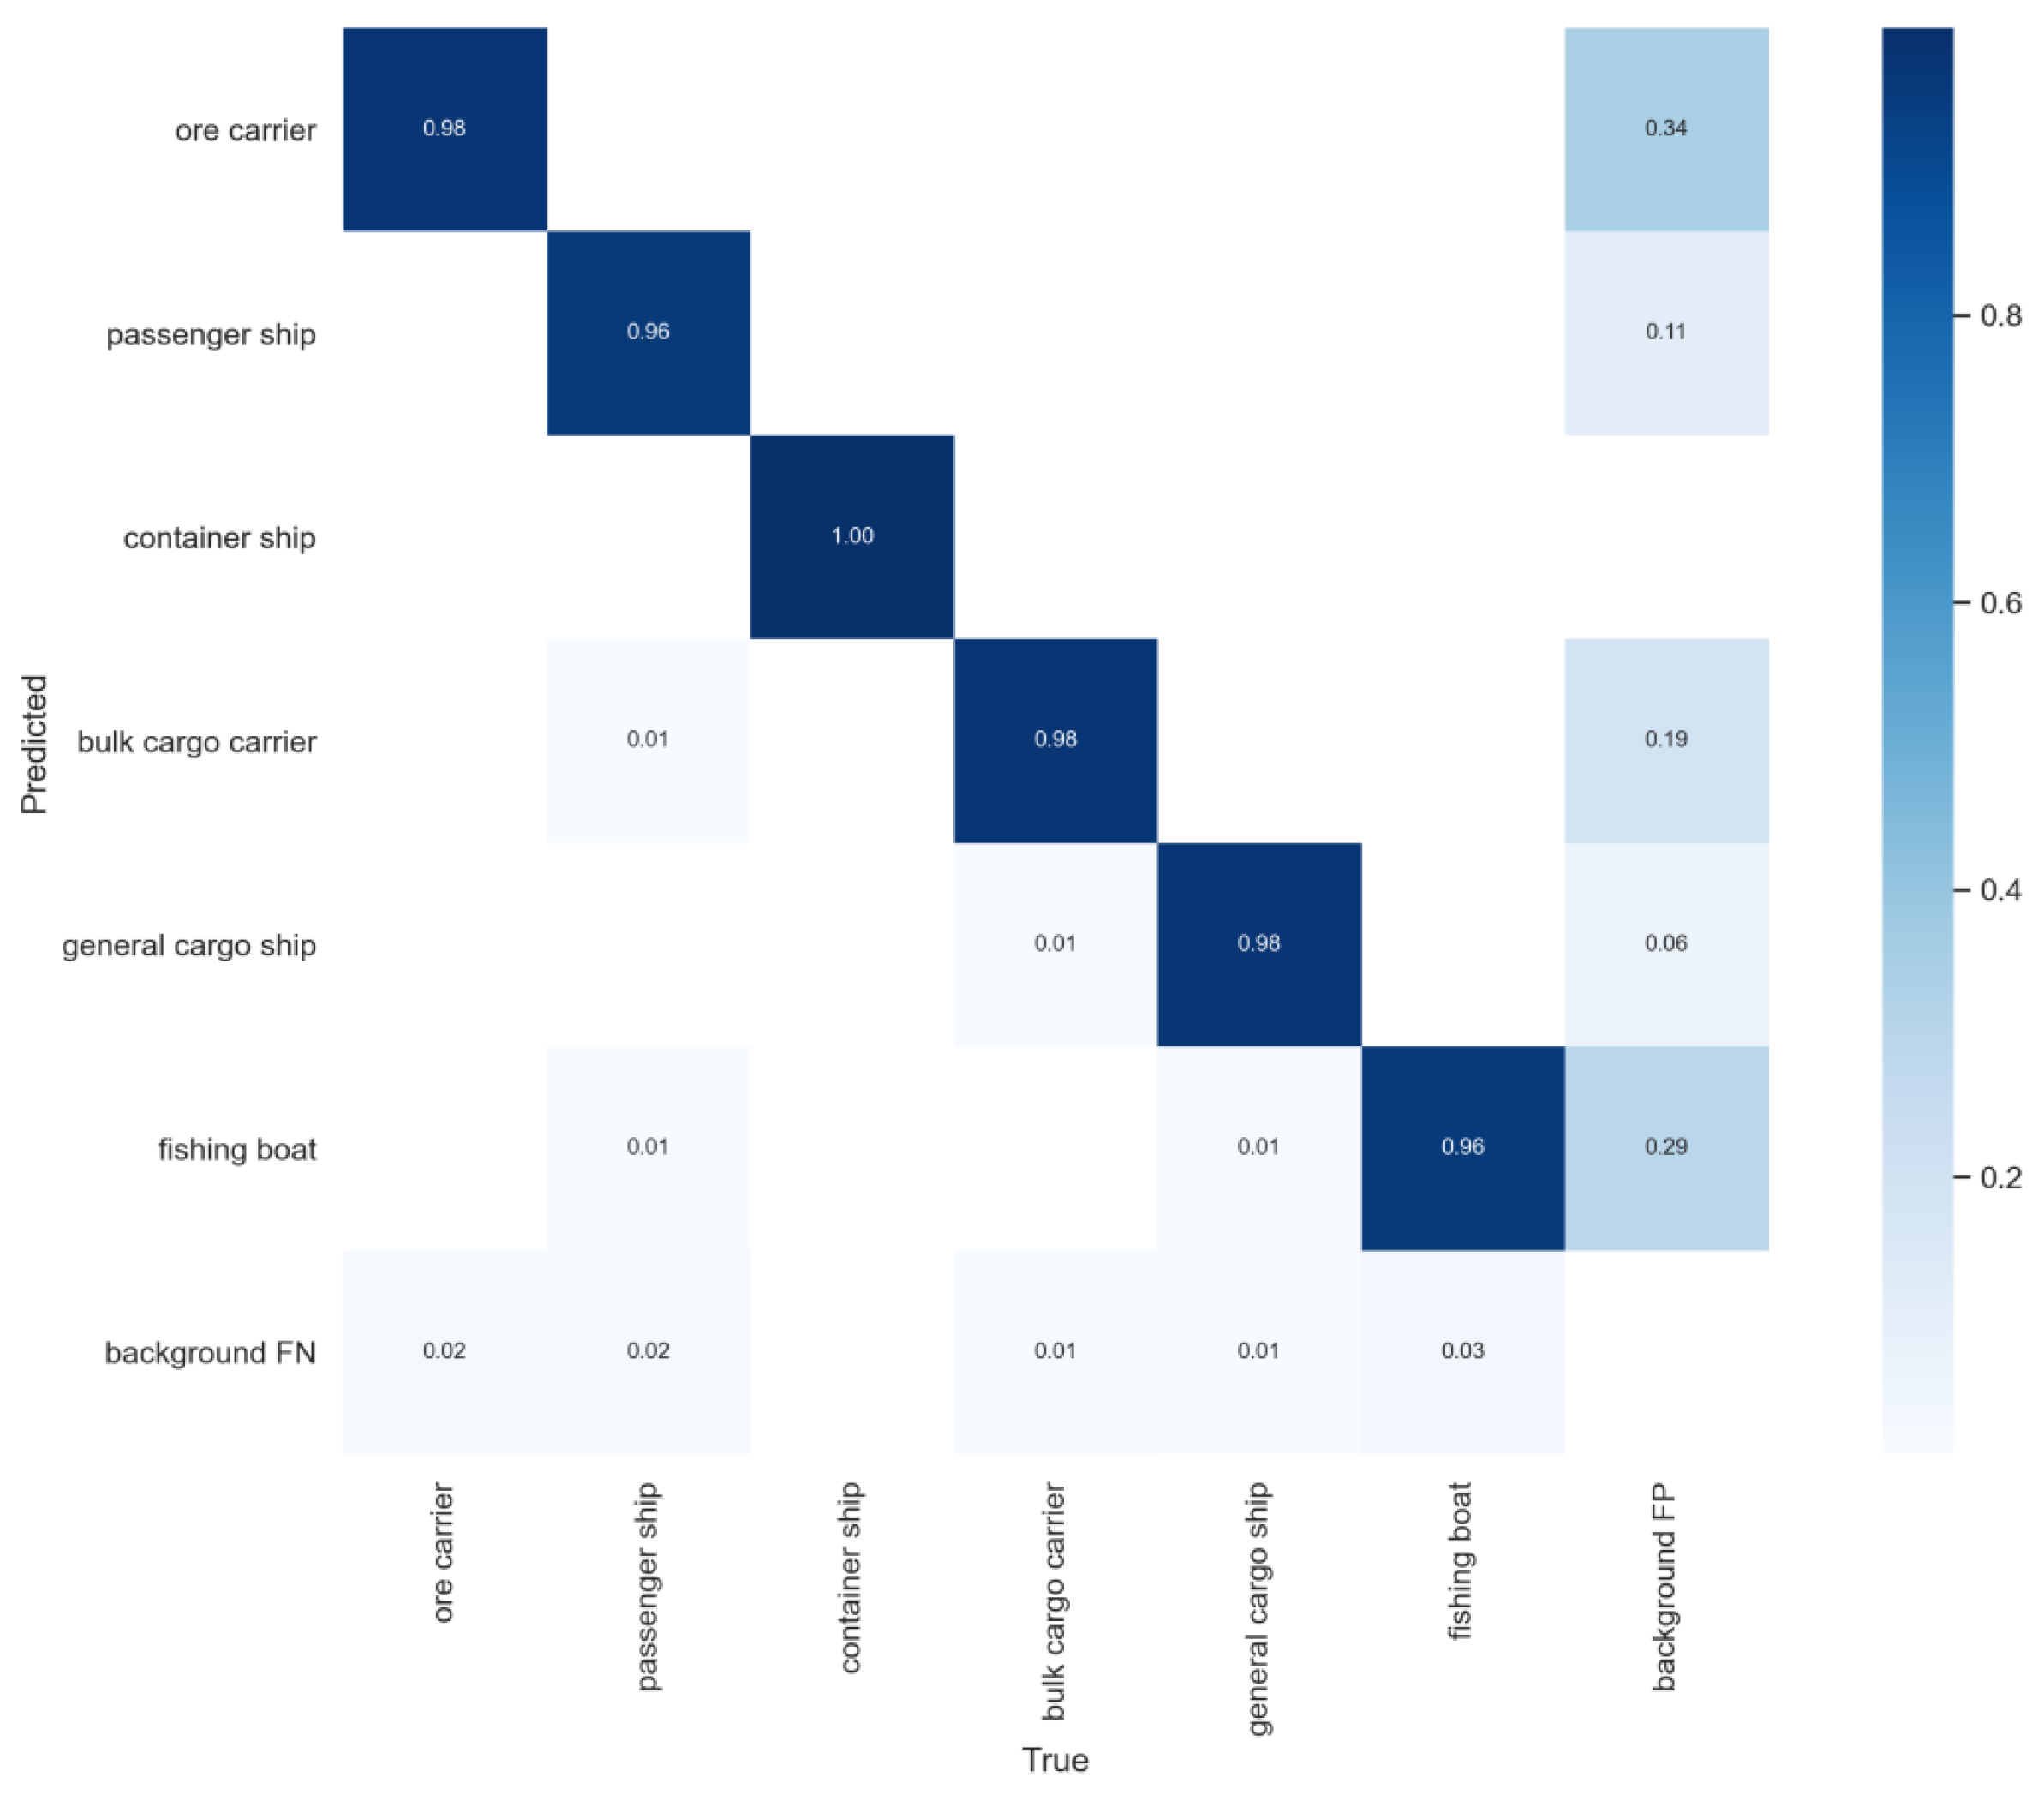
The confusion matrix displayed in
Figure 10, each column of which representing the predicted category, the total number and value in each column indicating the number of data predicted to be the category and the number of real data predicted to be the category, each row representing the true attribution category of the data, and the total amounts of data in each row representing the number of data instances of that category, shows good stability in detecting various types of ships.
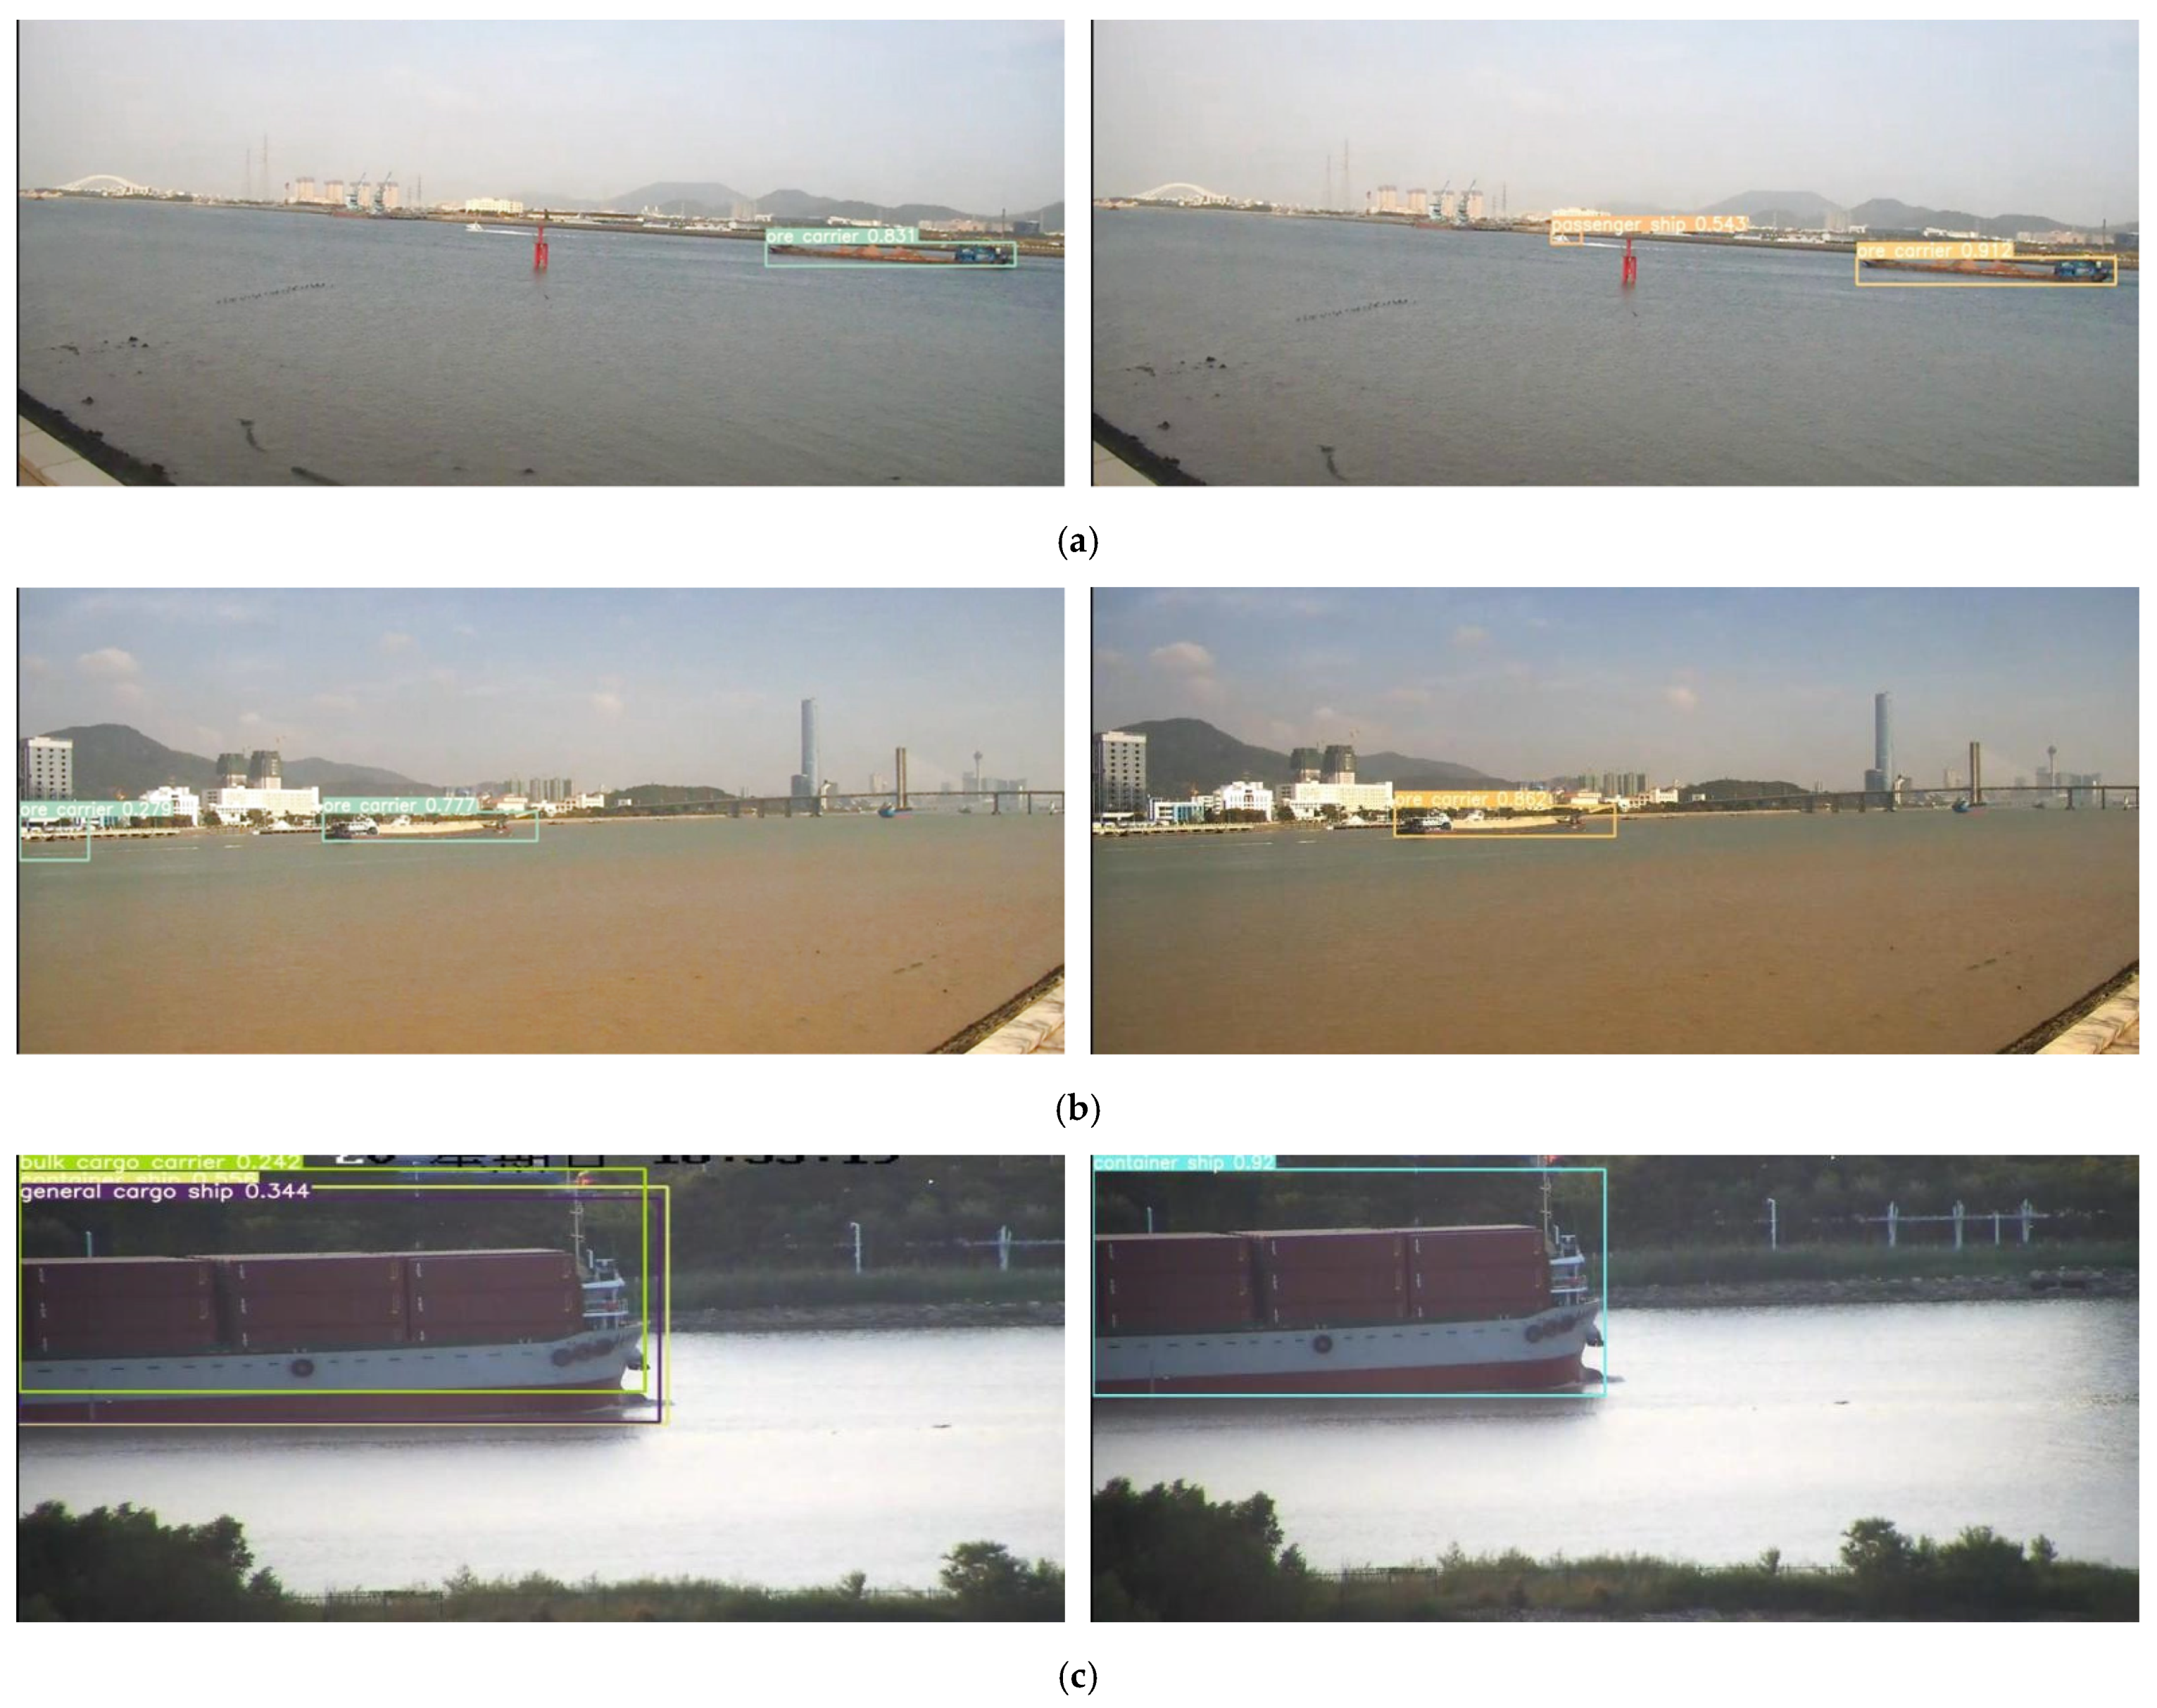
Figure 11 shows comparisons of the pictures before and after model detection. Through the comparison pictures, it was found that the small target of the passenger ship that was not originally recognized was detected after the improvement in
Figure 11a, which improved the ability for small target detection.
The original algorithm of
Figure 11b misidentified the distant shore as an ore ship; the improved algorithm corrected the misidentification of the target and improved the confidence of the original algorithm for the ore ship.
The original algorithm of
Figure 11c output multiple sets of prediction boxes, predicting that the target object was a cargo ship, a container ship, or a bulk carrier, but the confidence was low. The improved algorithm improved this situation and made a correct prediction.
Based on the above situation, the algorithm’s ability to detect small targets and various types of ships was significantly improved, and the error rate was reduced. Although the detection time increased by 2.2 ms, the
mAP increased by 4.4% compared with the original algorithm, which indicates that the improved network performance can meet the needs of real-time and accuracy and shows greater improvement compared to YOLOv2 and YOLOv3. The performance comparison is shown in
Table 4.
5. Conclusions
Autonomous navigation of unmanned ships at sea is inseparable from accurate detection of maritime targets. The images returned by a camera combined with accurate image analysis techniques can provide powerful preconditions for the perception systems of unmanned ships.
This study analyzed four models by adjusting the width and depth of YOLOv5. The results showed that the 5S model had a low accuracy rate, which may be due to insufficient detection capabilities for small targets, resulting in low accuracy. Therefore, to retain its high detection speed, advantages to improve it are required. By performing K-means dimensional clustering on the target frame of the dataset, the input end adopted mosaic enhancement and image scale transformation, added the largest pooling layer, and optimized the improvement method of the loss function, so that the mAP of the improved YOLOv5s reached 98.6%, which was an increase of 4.4% compared to the original; this improved the problem of low detection accuracy for small targets, indicating that the proposed improved method has a better recognition effect and can provide a strong guarantee for automatic driving of unmanned ships.
This research largely concerns the detection of several common ship types. Multi-frame recognition of dynamic targets is the key to dynamic obstacle avoidance at sea. The next step in this research will be to analyze the correlations between the data to identify a variety of other types of targets through transfer learning, improving the generalization ability of the model. This article will provide information support for future research:
- (1)
A combination of ultrasonic and Doppler radars for water and underwater detection combined with an onboard camera and drone shooting to achieve obstacle avoidance and real-time path planning;
- (2)
Weather detection equipment used to transmit weather conditions in a rescue area in real-time;
- (3)
Real-time water depth and velocity detection through echo sounders and ADCP to achieve water rescue in difficult conditions.
Author Contributions
Conceptualization, J.Z. and W.H.; methodology, P.J. and W.H.; software, J.Z. and X.C.; validation, J.Z. and W.H.; formal analysis, A.Z.; investigation, J.Z. and X.C.; data curation, A.Z.; writing—original draft preparation, J.Z.; writing—review and editing, J.Z., P.J. and W.H.; visualization, J.Z.; supervision, P.J. and W.H.; project administration, P.J. and W.H.; funding acquisition, P.J. and W.H. All authors have read and agreed to the published version of the manuscript.
Funding
This research was funded by the Youth Fund Project of the Hunan Science and Technology Department (No. 2020JJ5234), the Innovation and Entrepreneurship Training Project for College Students in Hunan Province (S202110537052), and the Excellent Youth Project of the Hunan Education Department (No. 20B292).
Institutional Review Board Statement
Not applicable.
Informed Consent Statement
Not applicable.
Data Availability Statement
Not applicable.
Conflicts of Interest
The authors declare no conflict of interest.
References
- Liu, H. Research on Detection and Segmentation Algorithm of Unmanned Ship Surface Target Based on Deep Learning. Master’s Thesis, Wuhan University of Technology of China, Wuhan, China, 2019. [Google Scholar]
- Wang, Y.Q.; Feng, Y.W. An Improved Face Recognition Algorithm Based on Convolutional Neural Network. Semicond. Optoelectron. 2020, 41, 582–586. [Google Scholar]
- Tian, X.; Su, H.; Liu, G.; Liu, T. Improved Classroom Face Recognition Algorithm Based on Insight Face and Its Application. Laser Optoelectron. Prog. 2020, 57, 221501. [Google Scholar] [CrossRef]
- Wang, D.; Chen, X.; Zhao, F.; Sun, H. Vehicle Detection Algorithm Based on Convolutional Neural Network and RGB-D Images. Laser Optoelectron. Prog. 2019, 56, 181003. [Google Scholar] [CrossRef]
- Yang, L.; Luo, J.; Song, X.; Li, M.; Wen, P.; Xiong, Z. Robust Vehicle Speed Measurement Based on Feature Information Fusion for Vehicle Multi-Characteristic Detection. Entropy 2021, 23, 910. [Google Scholar] [CrossRef] [PubMed]
- Wang, Z.Y.; Ni, X.Y.; Shang, Z.D. Autonomous driving semantic segmentation with convolution neural networks. Opt. Precis. Eng. 2019, 27, 2429–2438. [Google Scholar] [CrossRef]
- Dang, H.; Lu, X.; Sun, J.; Wu, C.; Tao, Y. Design of Vision-Based Drug-Grabbing Robot System. Laser Optoelectron. Prog. 2021, 58, 0210009. [Google Scholar] [CrossRef]
- Lowe, D.G. Object recognition from local scale-invariant features. In Proceedings of the Seventh IEEE International Conference on Computer Vision (ICCV), Kerkyra, Greece, 20–27 September 1999; pp. 1150–1157. [Google Scholar]
- Lin, C.; Xu, G.L.; Cao, Y.; Liang, C.H. Improved contour detection model with spatial summation properties based on nonclassical receptive field. J. Electron. Imaging 2016, 25, 043018. [Google Scholar] [CrossRef]
- Suh, H.K.; Hofstee, J.W.; De Ijsselmui, N.J.; Henten, E.V. Sugar beet and volunteer potato classification using Bag-of-Visual-Words model, Scale-Invariant Feature Transform, or Speeded Up Robust Feature descriptors and crop row information. Biosyst. Eng. 2018, 166, 210–226. [Google Scholar] [CrossRef] [Green Version]
- Mukherjee, P.; Lall, B. Saliency and KAZE features assisted object segmentation. Image Vis. Comput. 2017, 65, 82–97. [Google Scholar] [CrossRef]
- Dalal, N.; Tniggs, B. Histograms of oriented gradients for human detection. In Proceedings of the 2005 IEEE Computer Society Conference on Computer Vision and Pattern Recognition (CVPR’05), San Diego, CA, USA, 20–25 July 2005; pp. 886–893. [Google Scholar]
- Deng, F.; Jin, L.; Hou, X.; Wang, L.; Li, B.; Yang, H. COLREGs: Compliant Dynamic Obstacle Avoidance of USVs Based on theDynamic Navigation Ship Domain. J. Mar. Sci. Eng. 2021, 9, 837. [Google Scholar] [CrossRef]
- Xu, H.; Paulo, O.; Guedes Soares, C. L1 adaptive backstepping control for path-following of underactuated marine surface ships. Eur. J. Control. 2020, 58, 357–372. [Google Scholar] [CrossRef]
- Xu, H.; Hinostroza, M.A.; Guedes Soares, C. Modified Vector Field Path-Following Control System for an Underactuated Autonomous Surface Ship Model in the Presence of Static Obstacles. J. Mar. Sci. Eng. 2021, 9, 652. [Google Scholar] [CrossRef]
- Su, J.; Yang, L.; Huang, H.; Jin, G. Improved SSD algorithm for small-sized SAR ship detection. Syst. Eng. Electron. 2020, 42, 1026–1034. [Google Scholar]
- Wang, G.; Xie, S.; Chu, X.; Luo, T. Image Recognition Method of Ships in front of Unmanned Surface Vessel Based on Deep Learning. Ship Eng. 2018, 40, 19–22, 99. [Google Scholar]
- Redmon, J.; Divvala, S.; Girshick, R.; Farhadi, A. You Only Look Once:Unified, Real-Time Object Detection. In Proceedings of the 2016 IEEE Conference on Computer Vision and Pattern Recognition (CVPR), Las Vegas, NV, USA, 27–30 June 2016. [Google Scholar]
- Yu, Y.; Li, S.; Chen, L.; Liu, Y. Ship Target Detection Based on Improved YOLO v2. Comput. Sci. 2019, 46, 332–336. [Google Scholar]
- Jiang, W.; Li, B.; Gu, J.; Liu, K. Ship Target Detection Algorithm based on Improved YOLO V3. Electron. Opt. Control 2021, 28, 52–56, 67. [Google Scholar]
- Tan, S.; Bie, X.; Lu, G.; Tan, X.H. Real-time detection for mask-wearing of personnel based on YOLOv5 network model. Laser J. 2021, 42, 147–150. [Google Scholar]
| Publisher’s Note: MDPI stays neutral with regard to jurisdictional claims in published maps and institutional affiliations. |
© 2021 by the authors. Licensee MDPI, Basel, Switzerland. This article is an open access article distributed under the terms and conditions of the Creative Commons Attribution (CC BY) license (https://creativecommons.org/licenses/by/4.0/).


