
Investigations of Hydraulic Power Take-Off Unit Parameters Effects on the Performance of the WAB-WECs in the Different Irregular Sea States

 , and
, and
Abstract
:1. Introduction
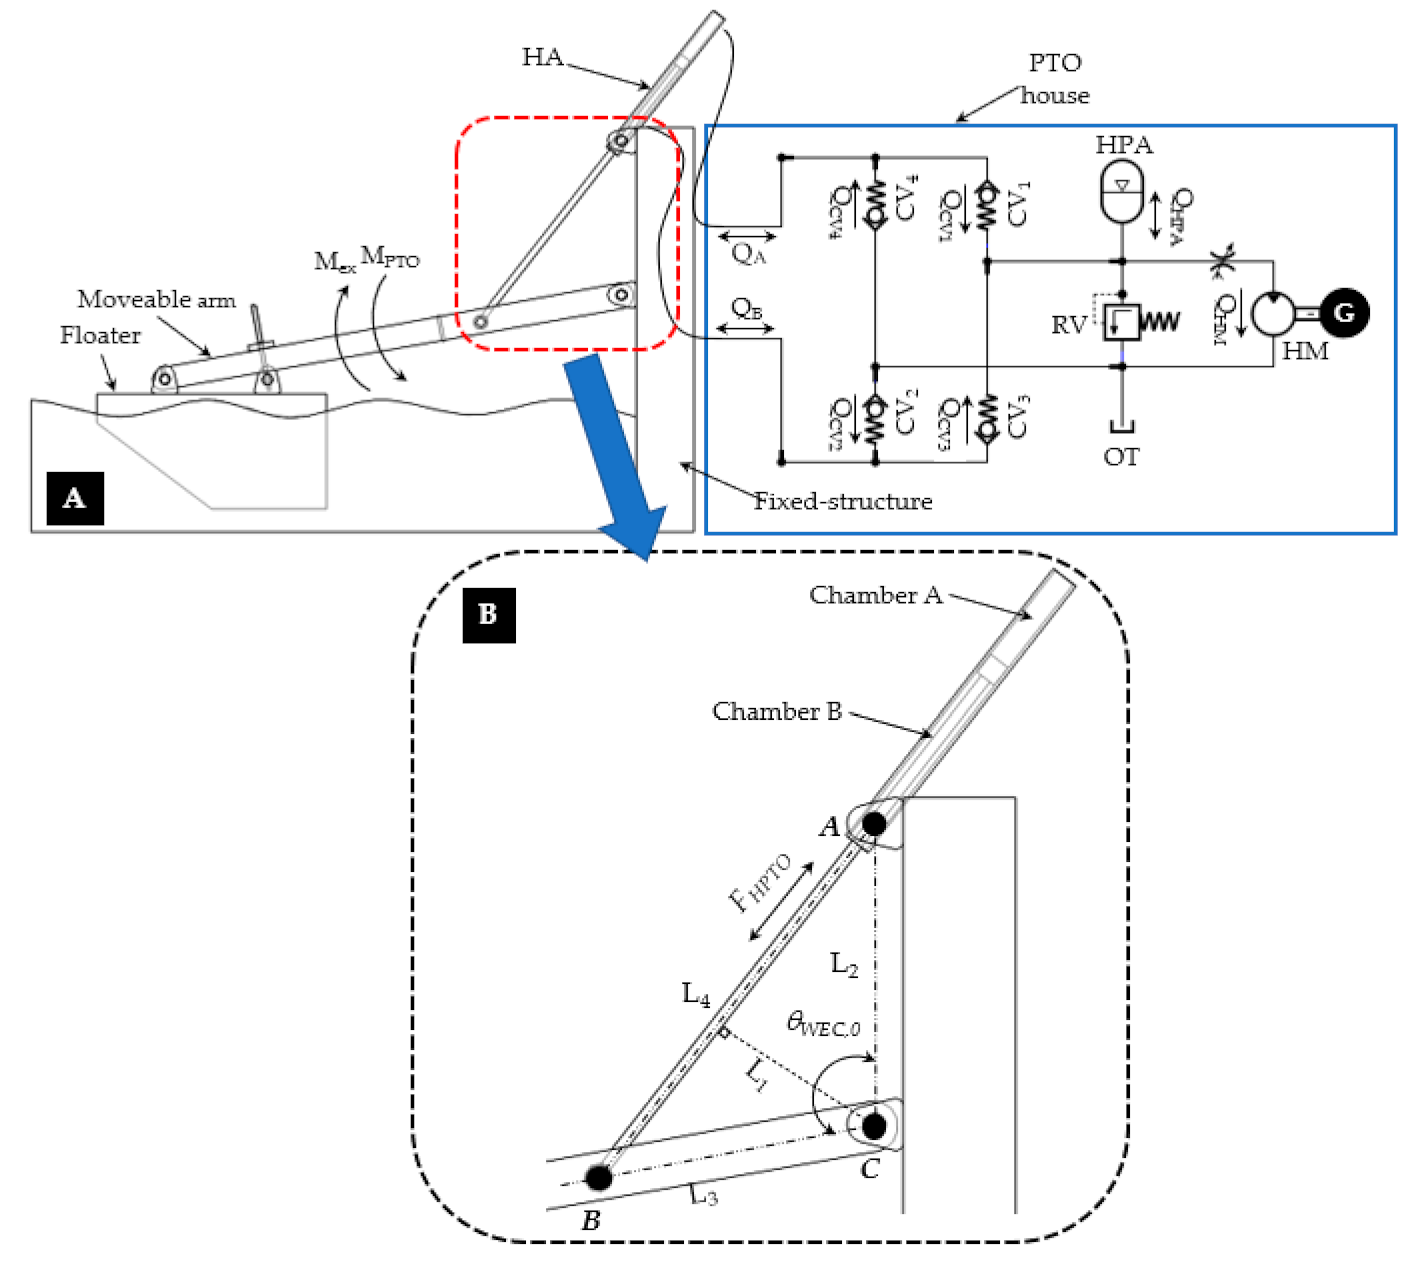
2. Design of WEC with HPTO Unit
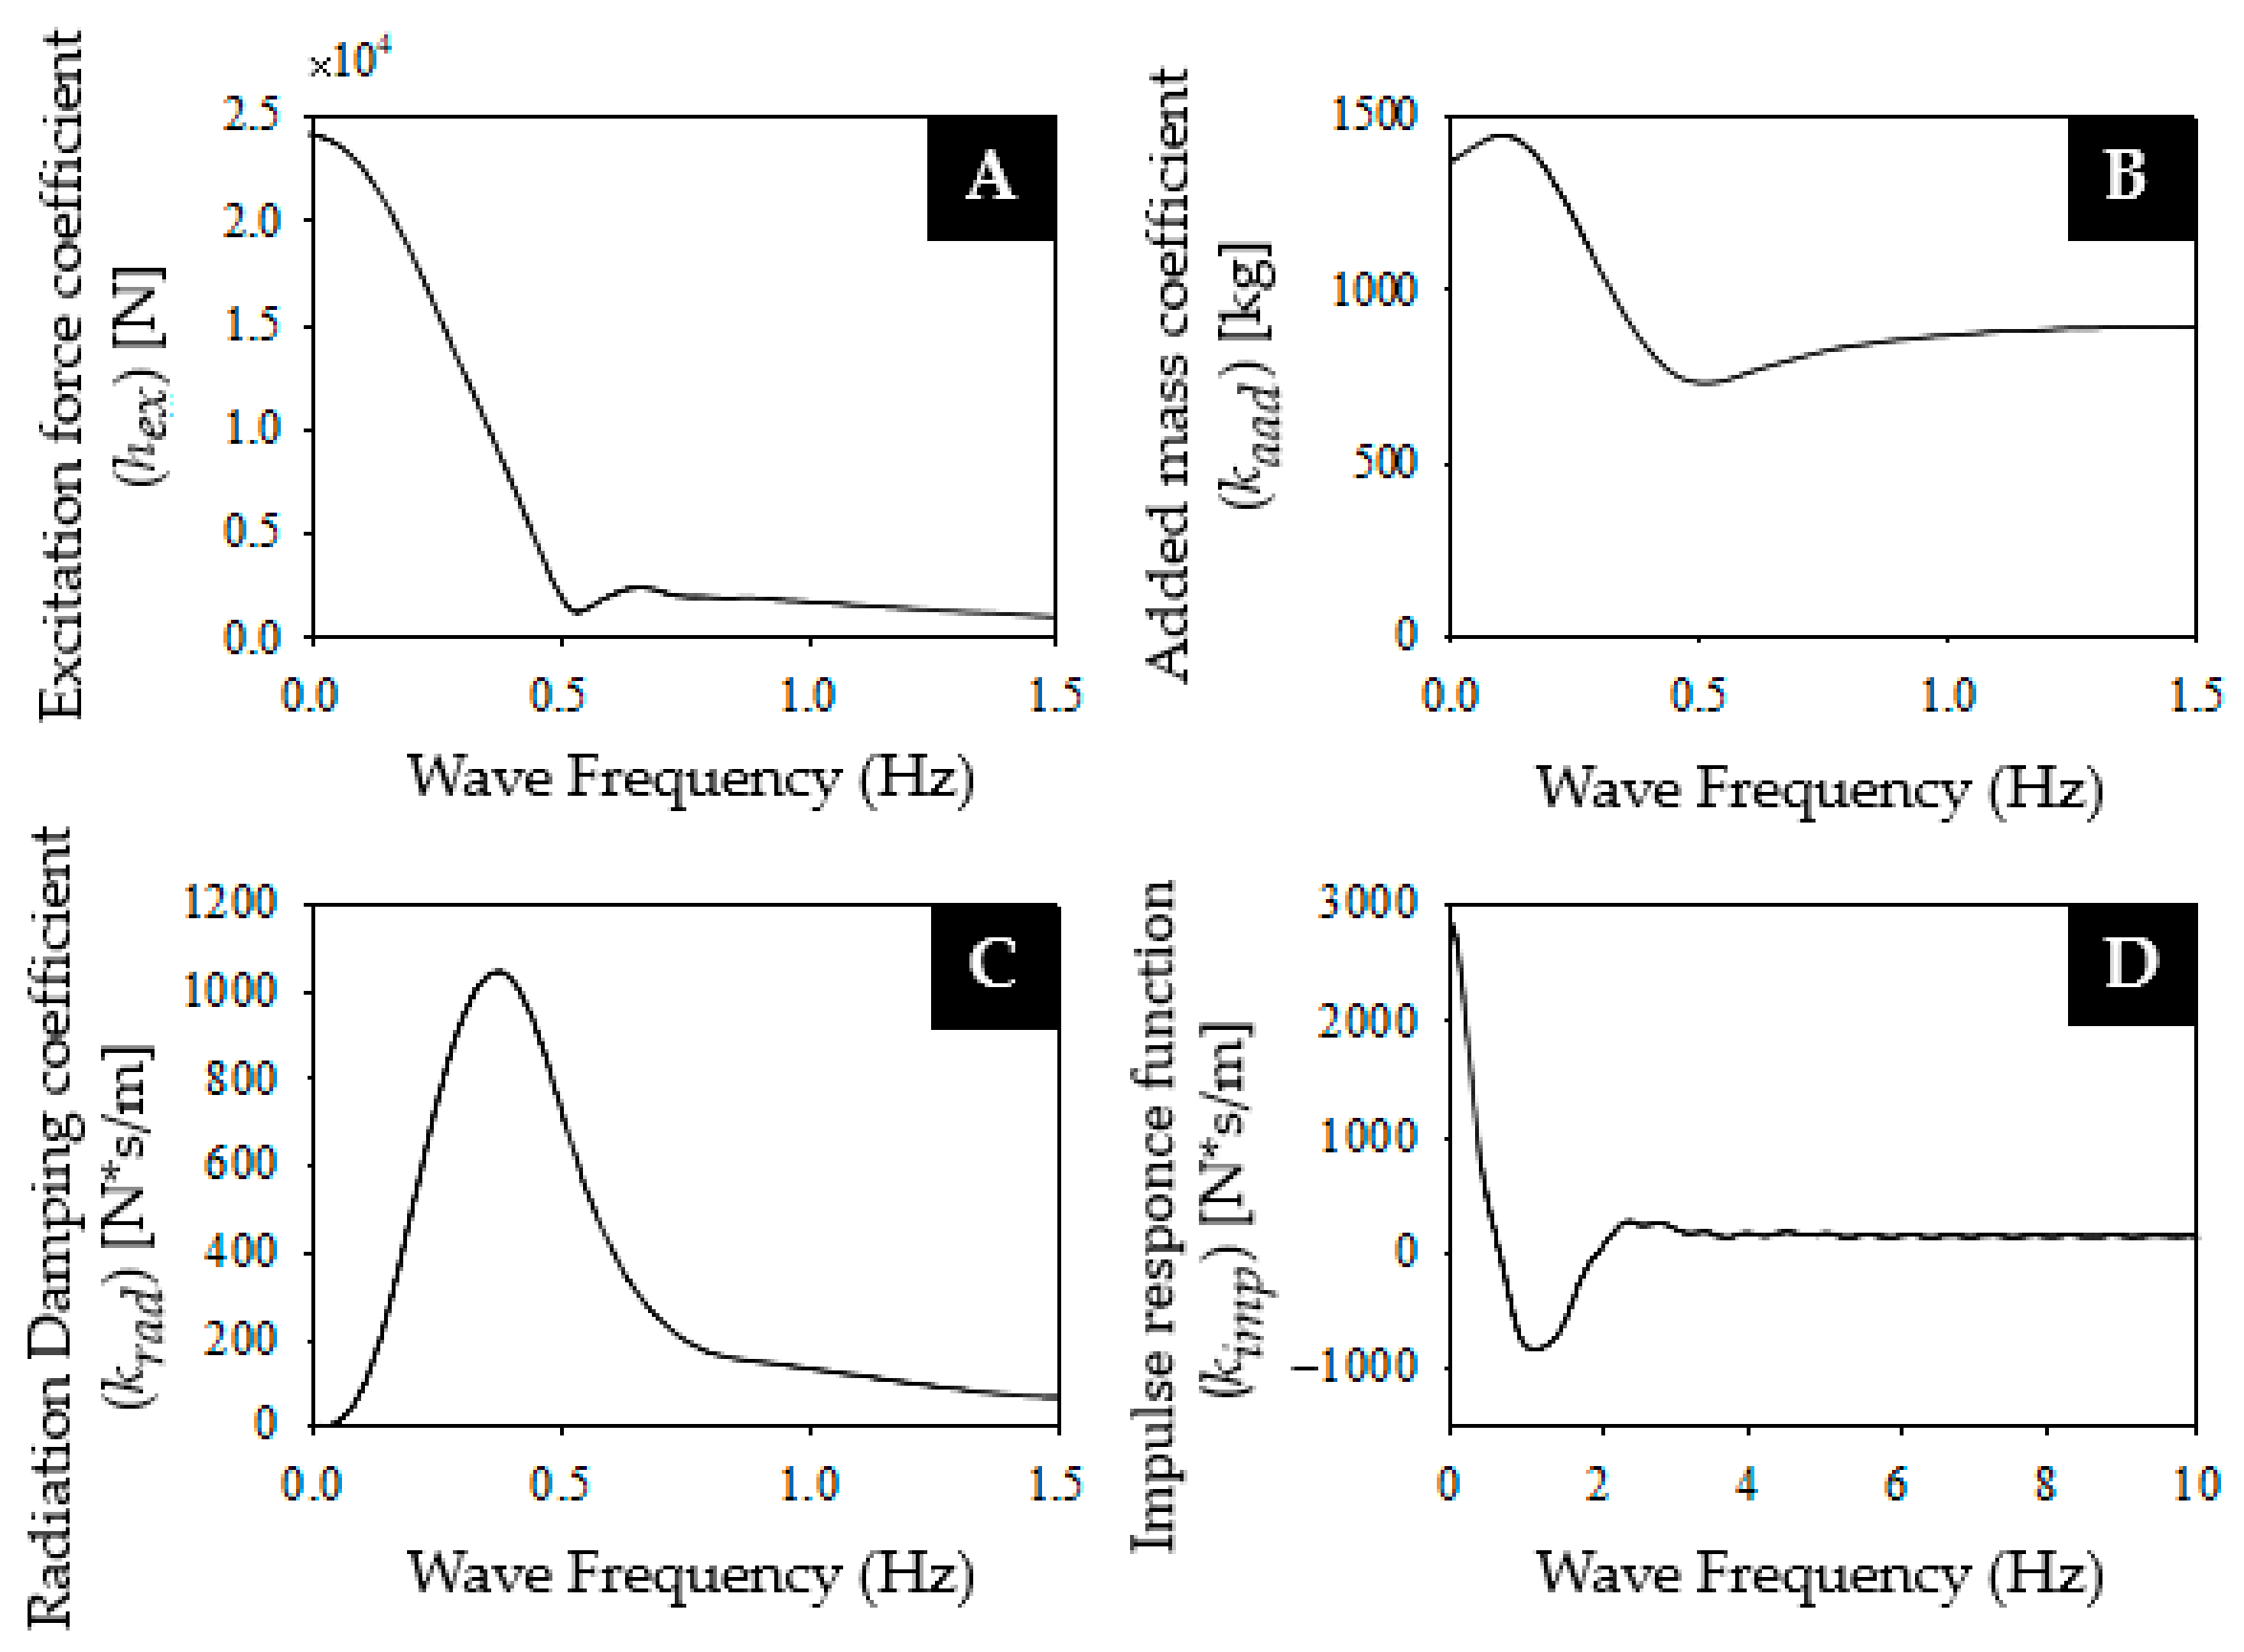
2.1. Formulation of Hydrodynamic Pitch Motion of WEC
2.2. Formulation of HPTO Unit
2.3. Main Parameters of HPTO Unit
3. Simulation Investigation of HPTO Unit Parameters
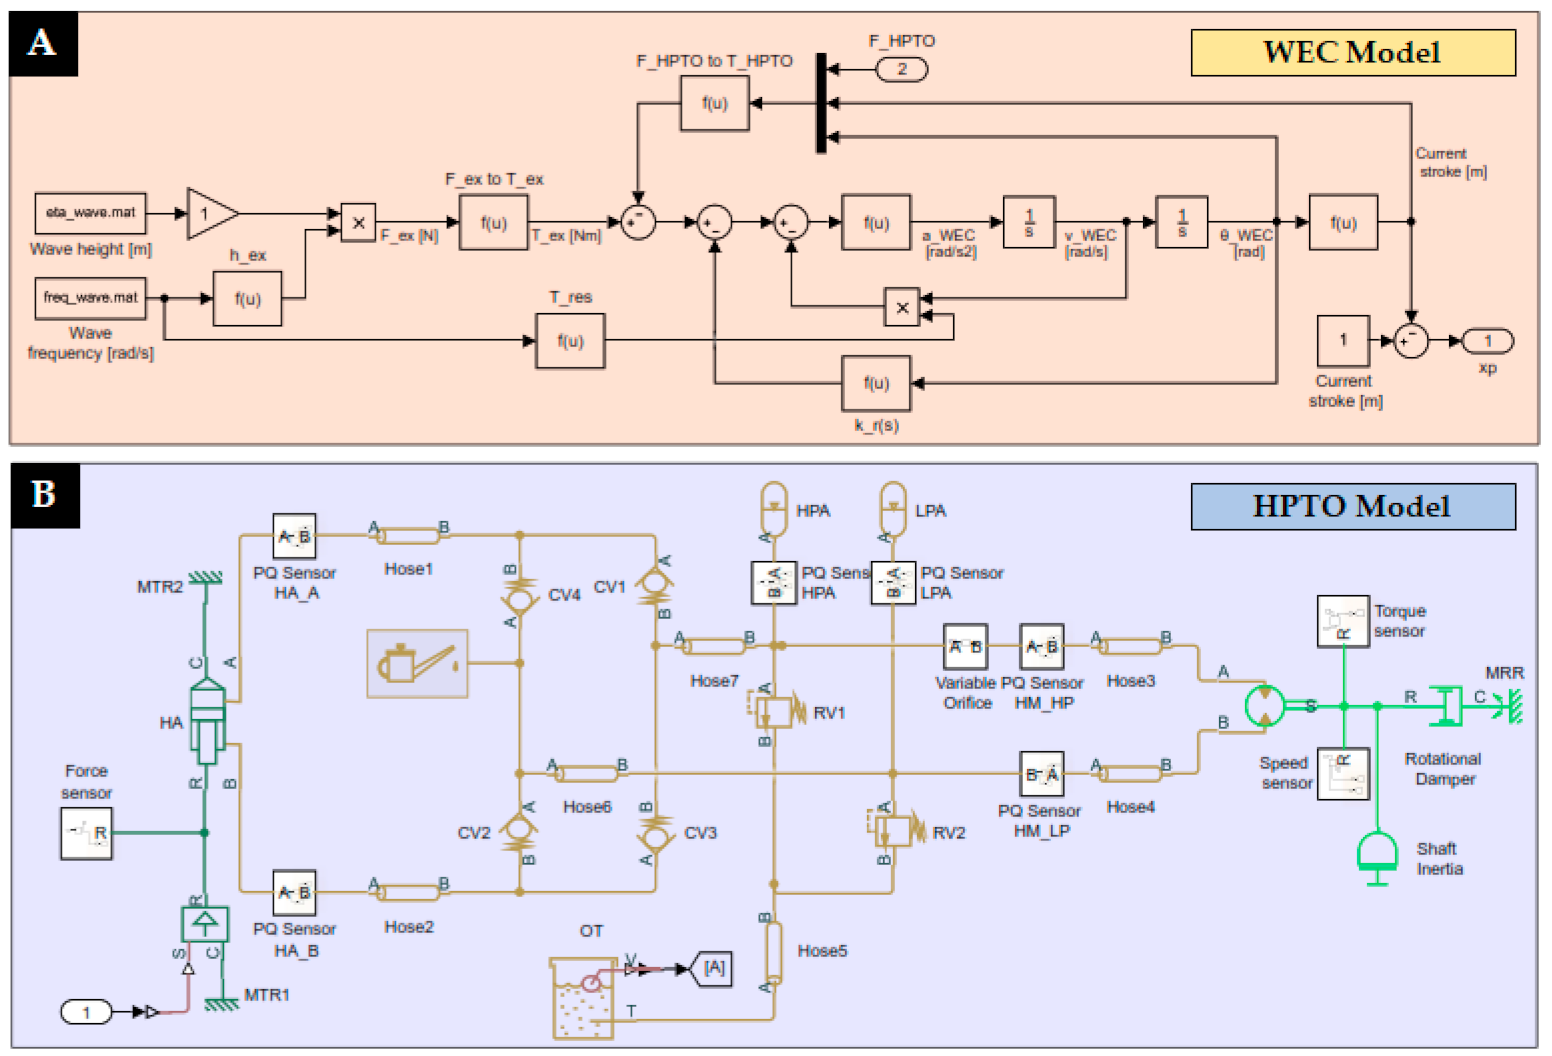
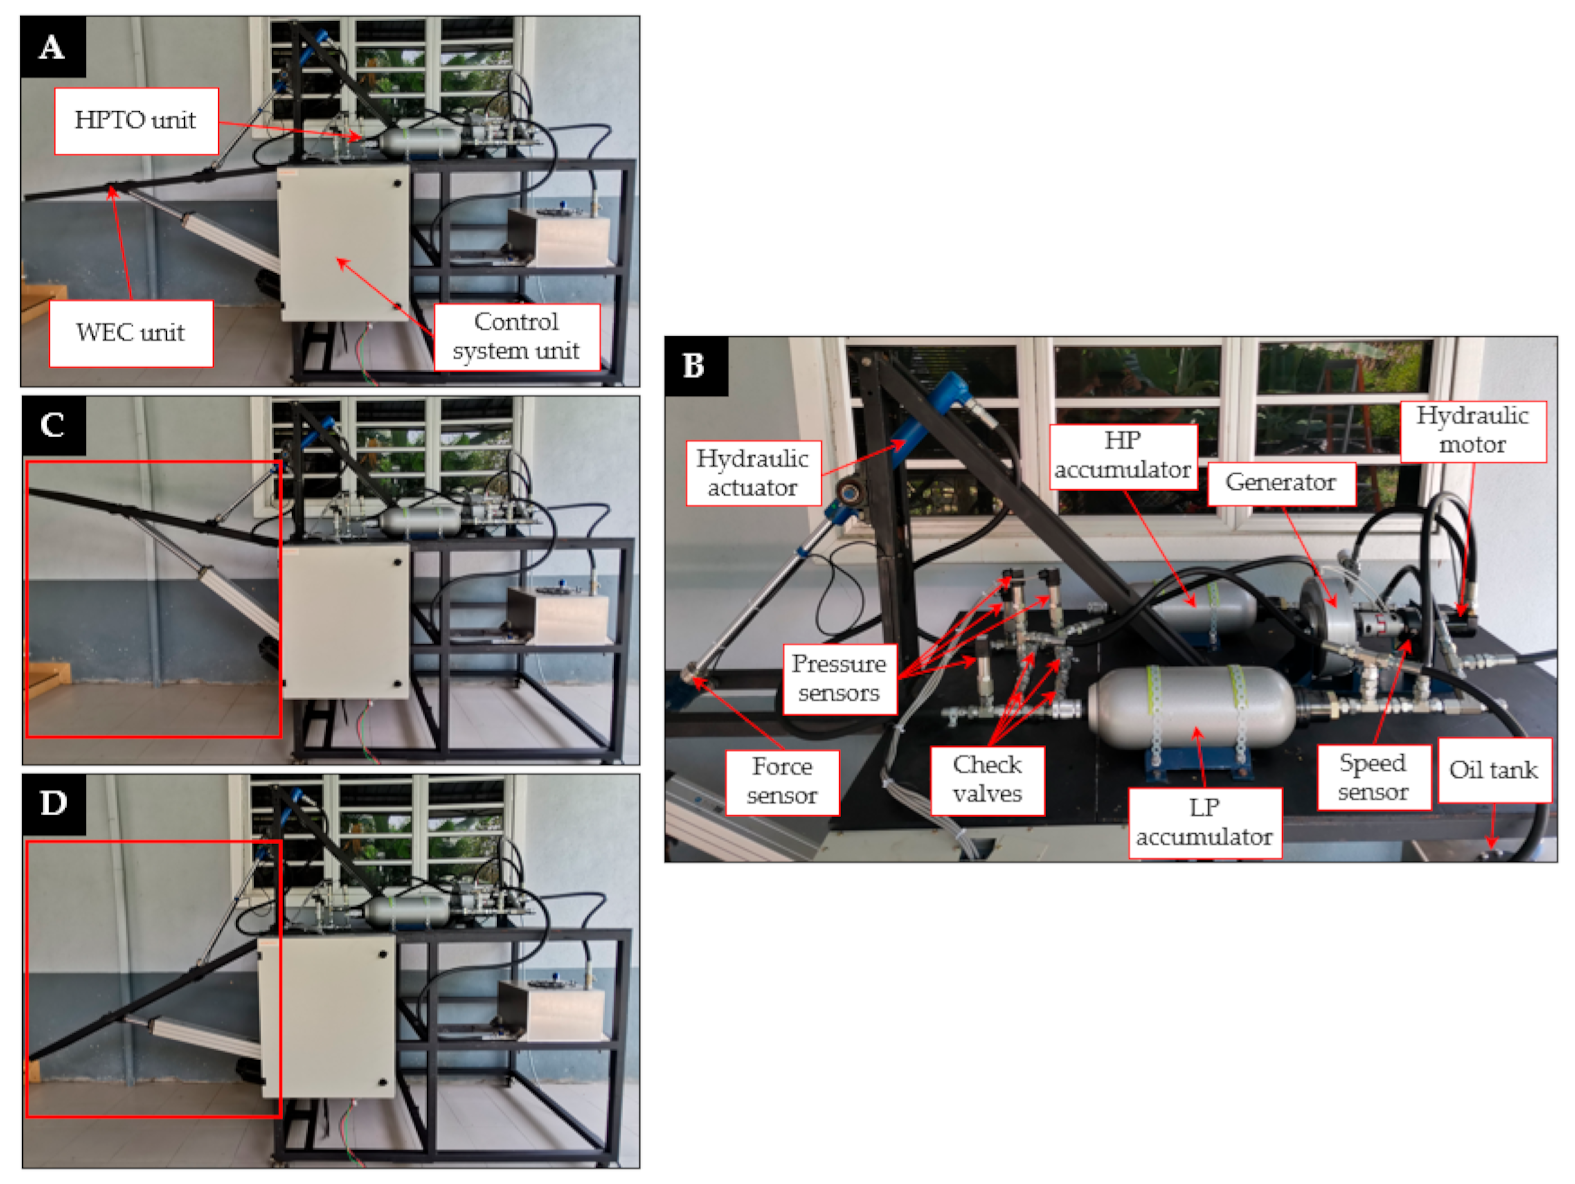
3.1. Simulation Set-up of WEC with HPTO Unit
3.2. Simulation of WEC with HPTO Unit Using Five Irregular Sea States
3.3. Investigation Studies of HPTO Unit Parameters
4. Results and Discussion
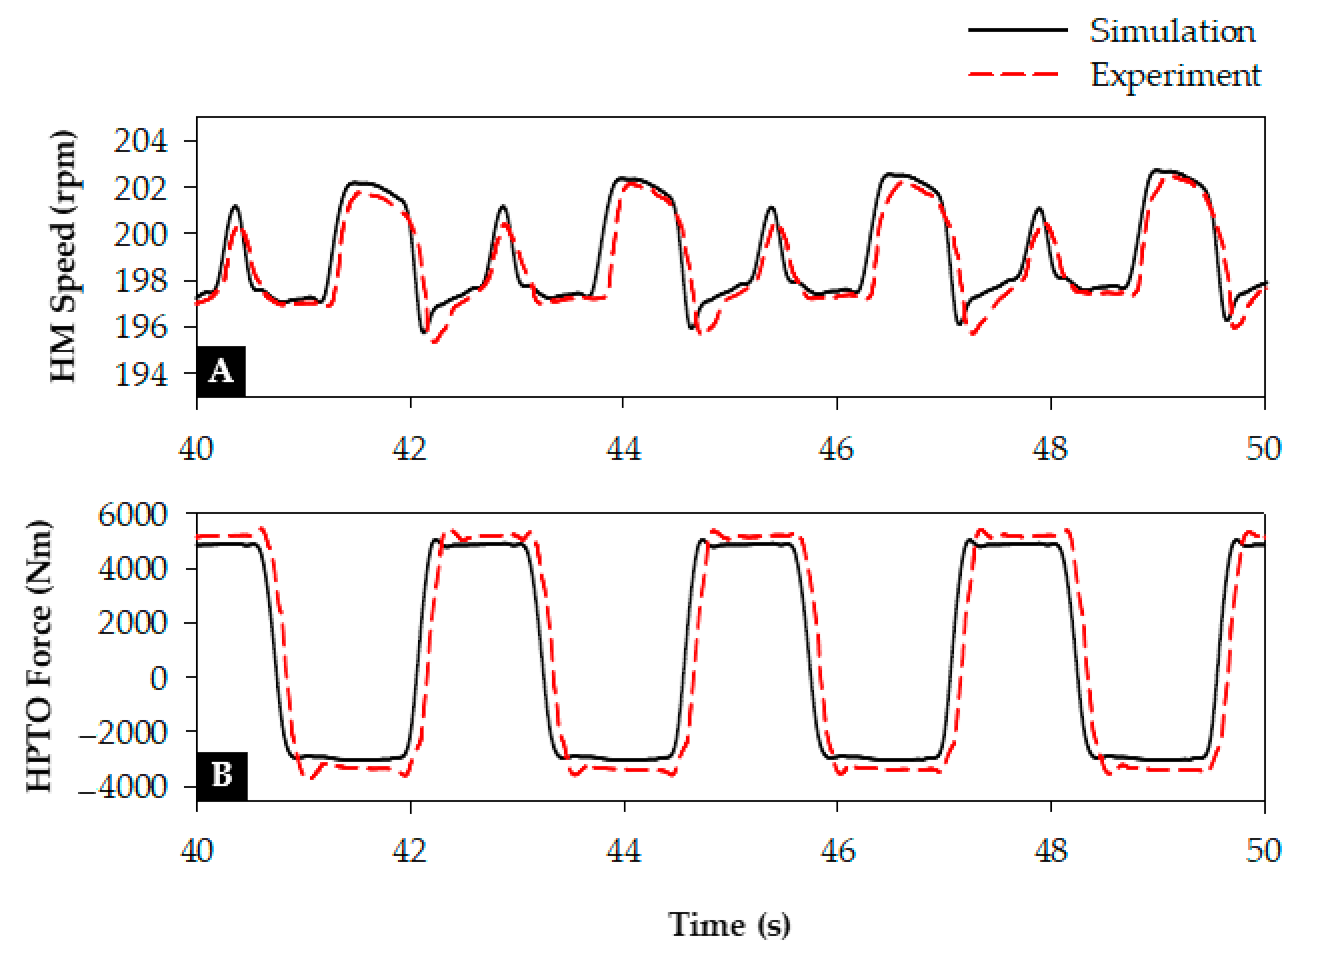
4.1. Experimental Validation of the HPTO Model
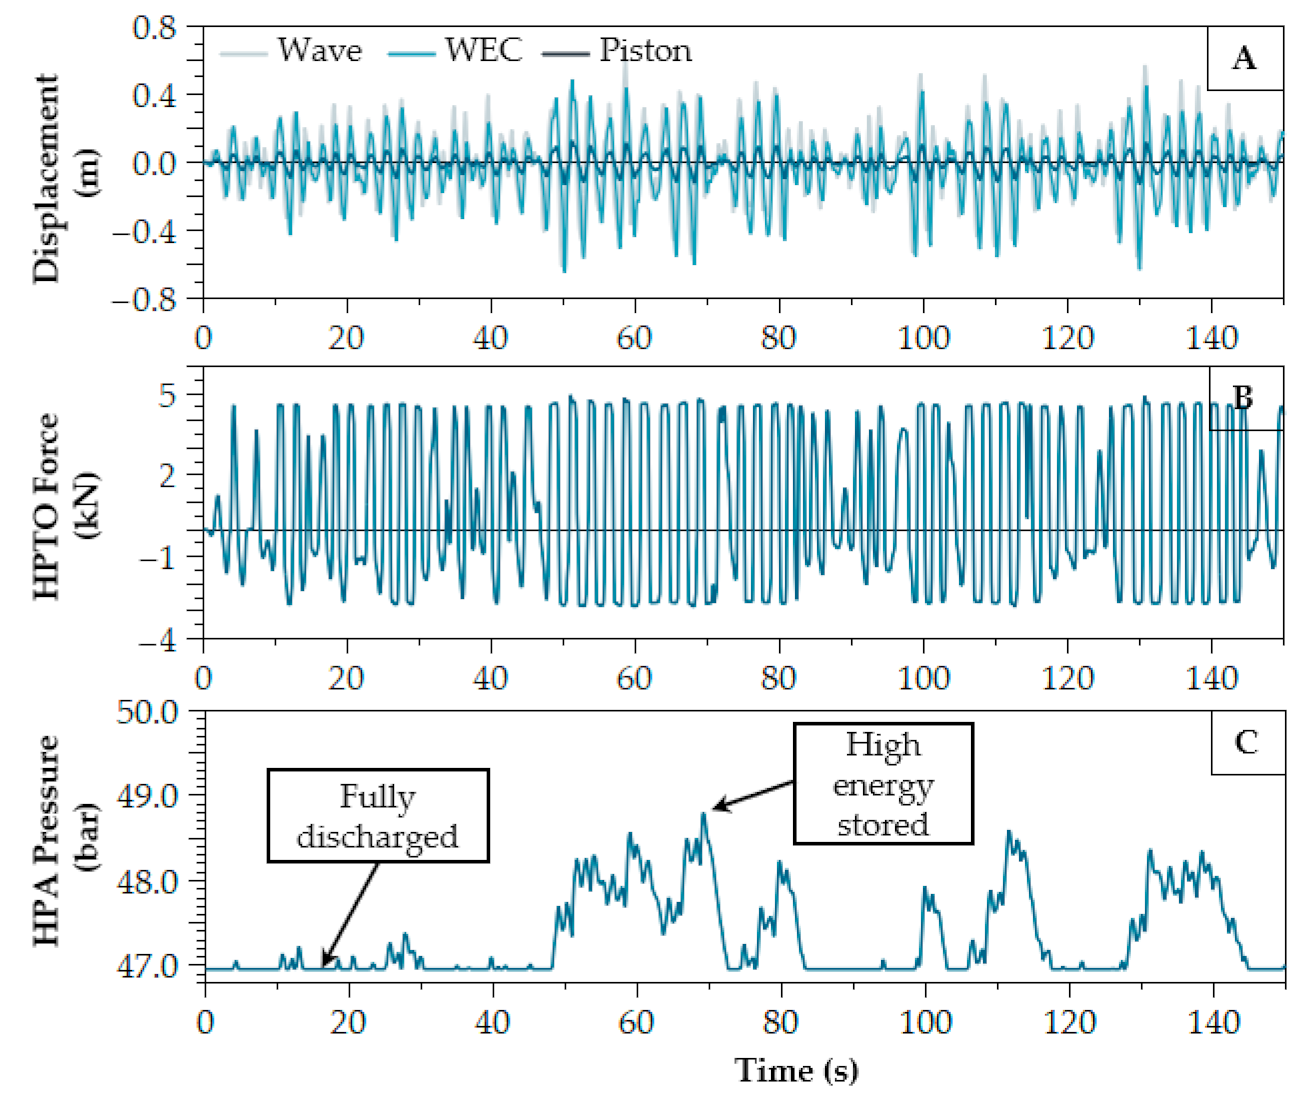
4.2. Performance of WEC with HPTO Model in Five Irregular Sea States
4.3. Investigation Studies of HPTO Unit Parameters
4.3.1. Case 1: Position of Hydraulic Cylinder
4.3.2. Case 2: Piston Size of the Hydraulic Actuator
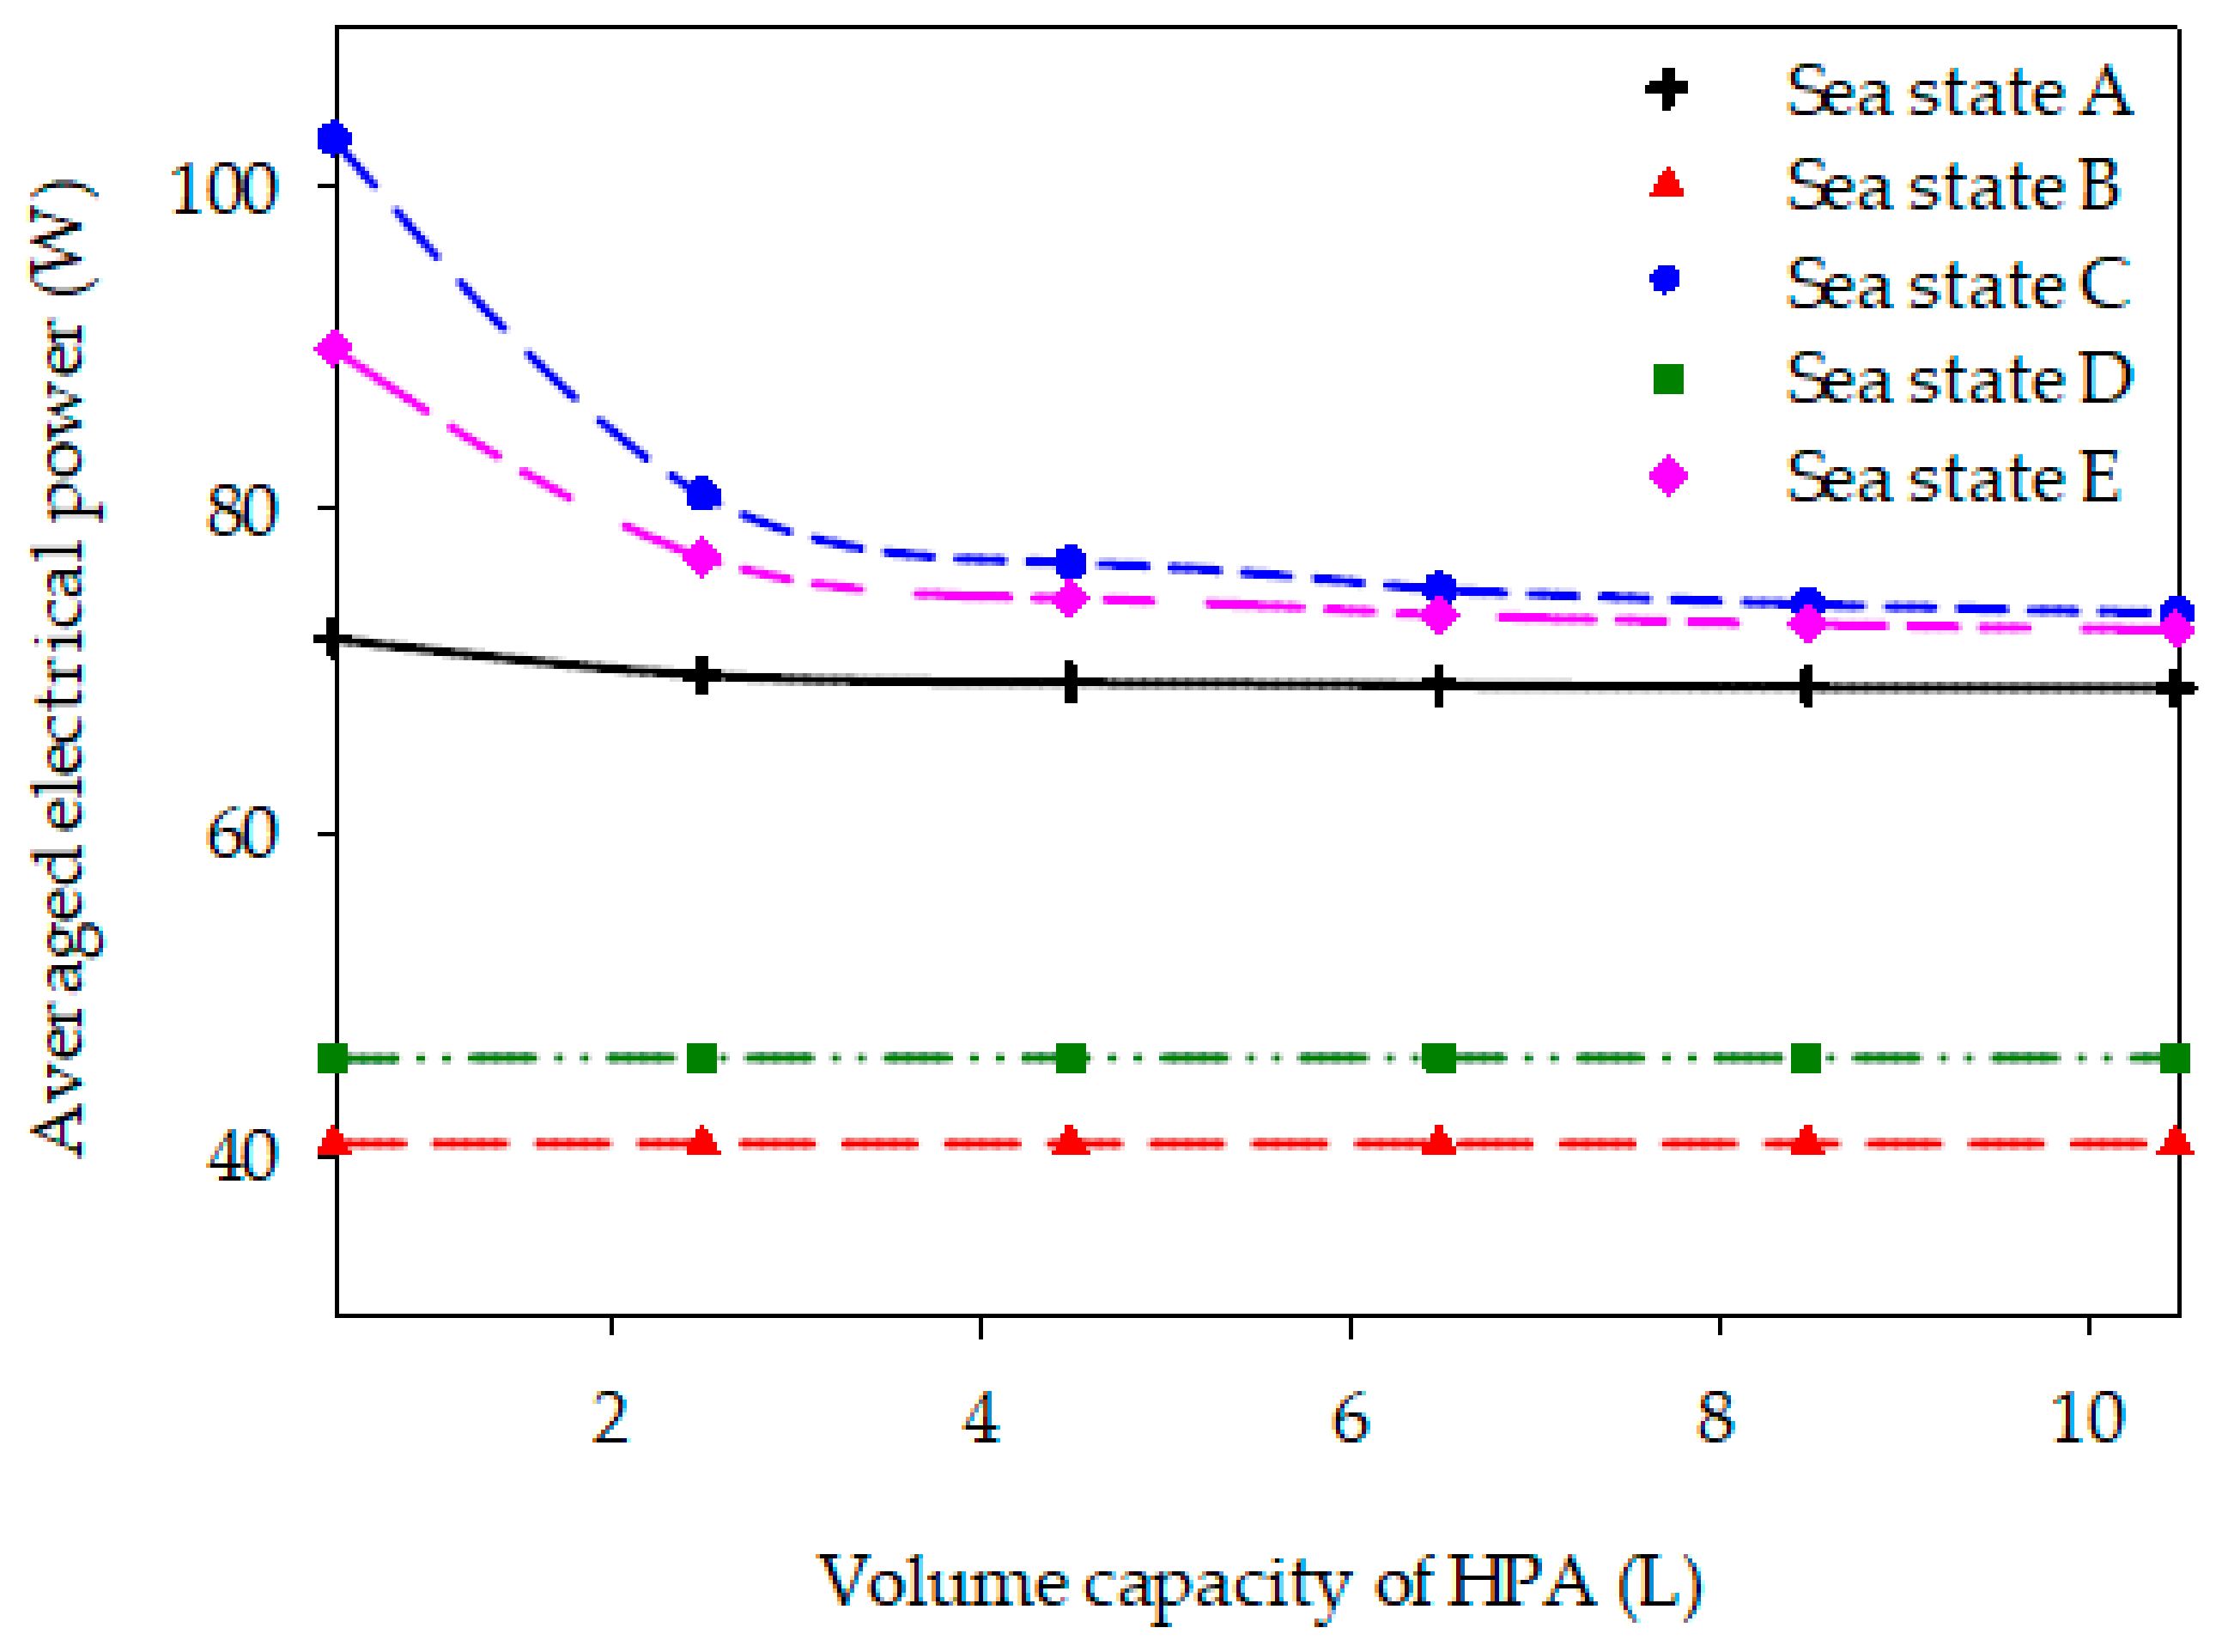
4.3.3. Case 3: Volume Capacity of HPA
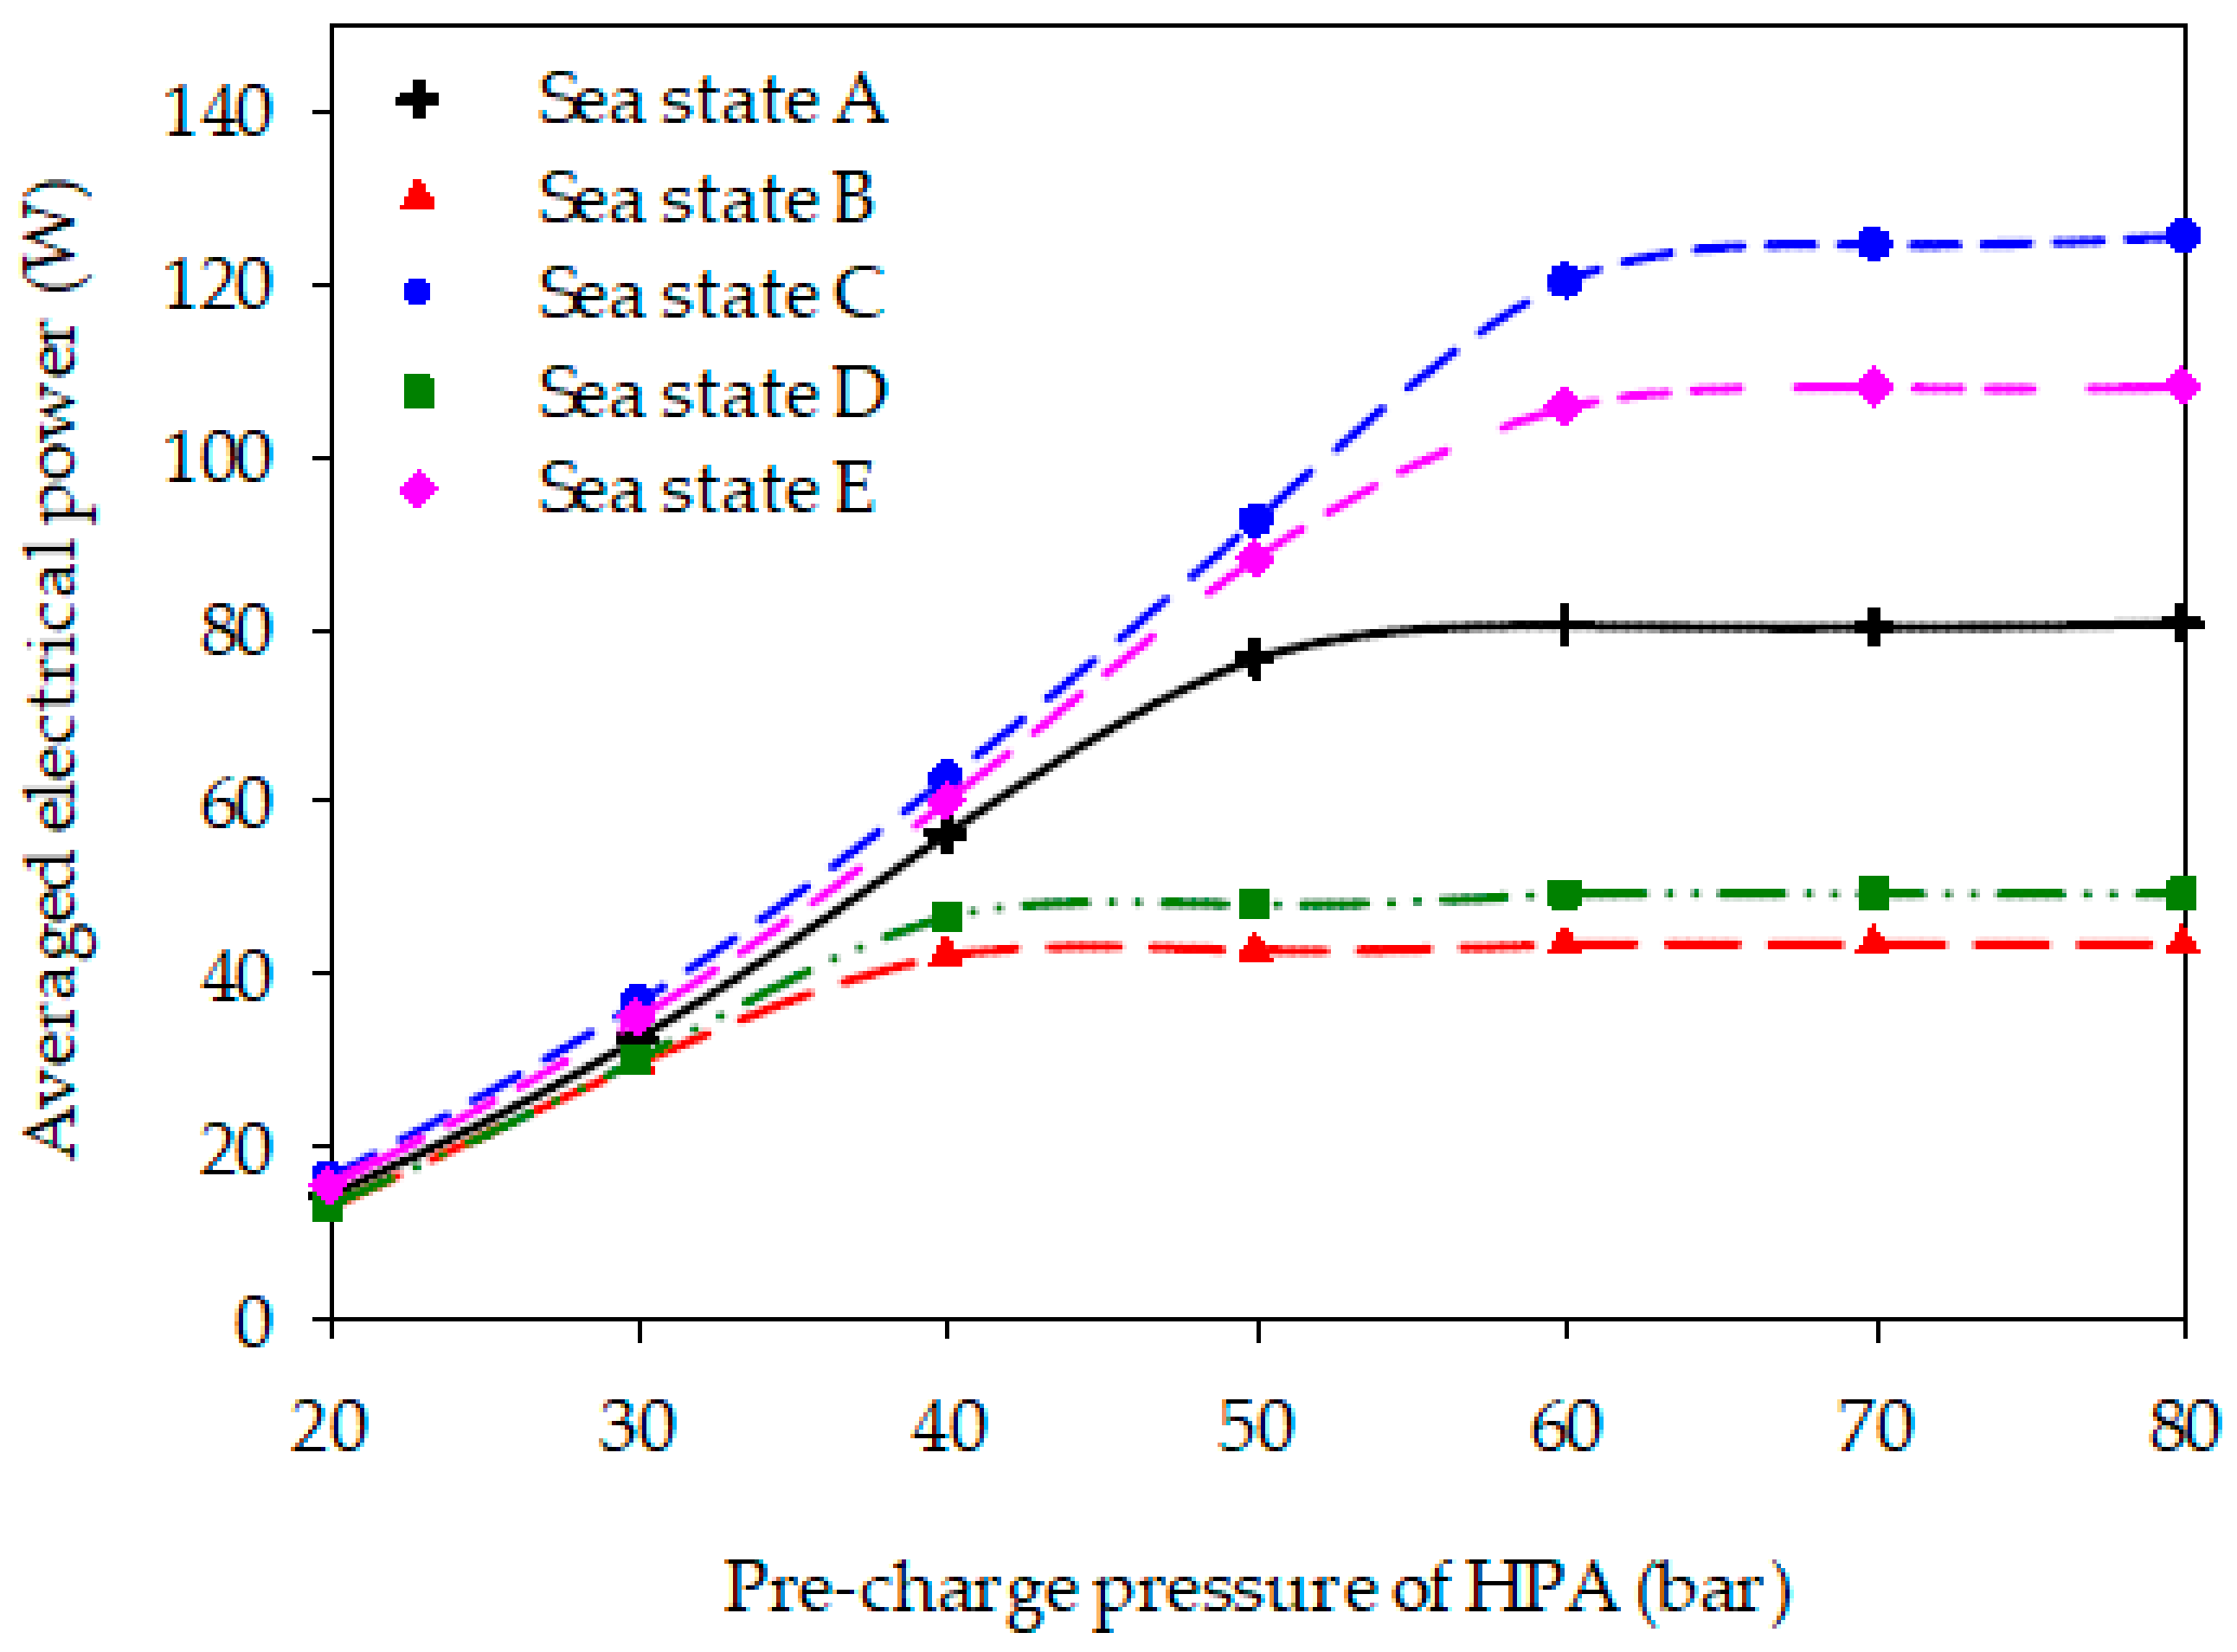
4.3.4. Case 4: Pre-Charge Pressure of HPA
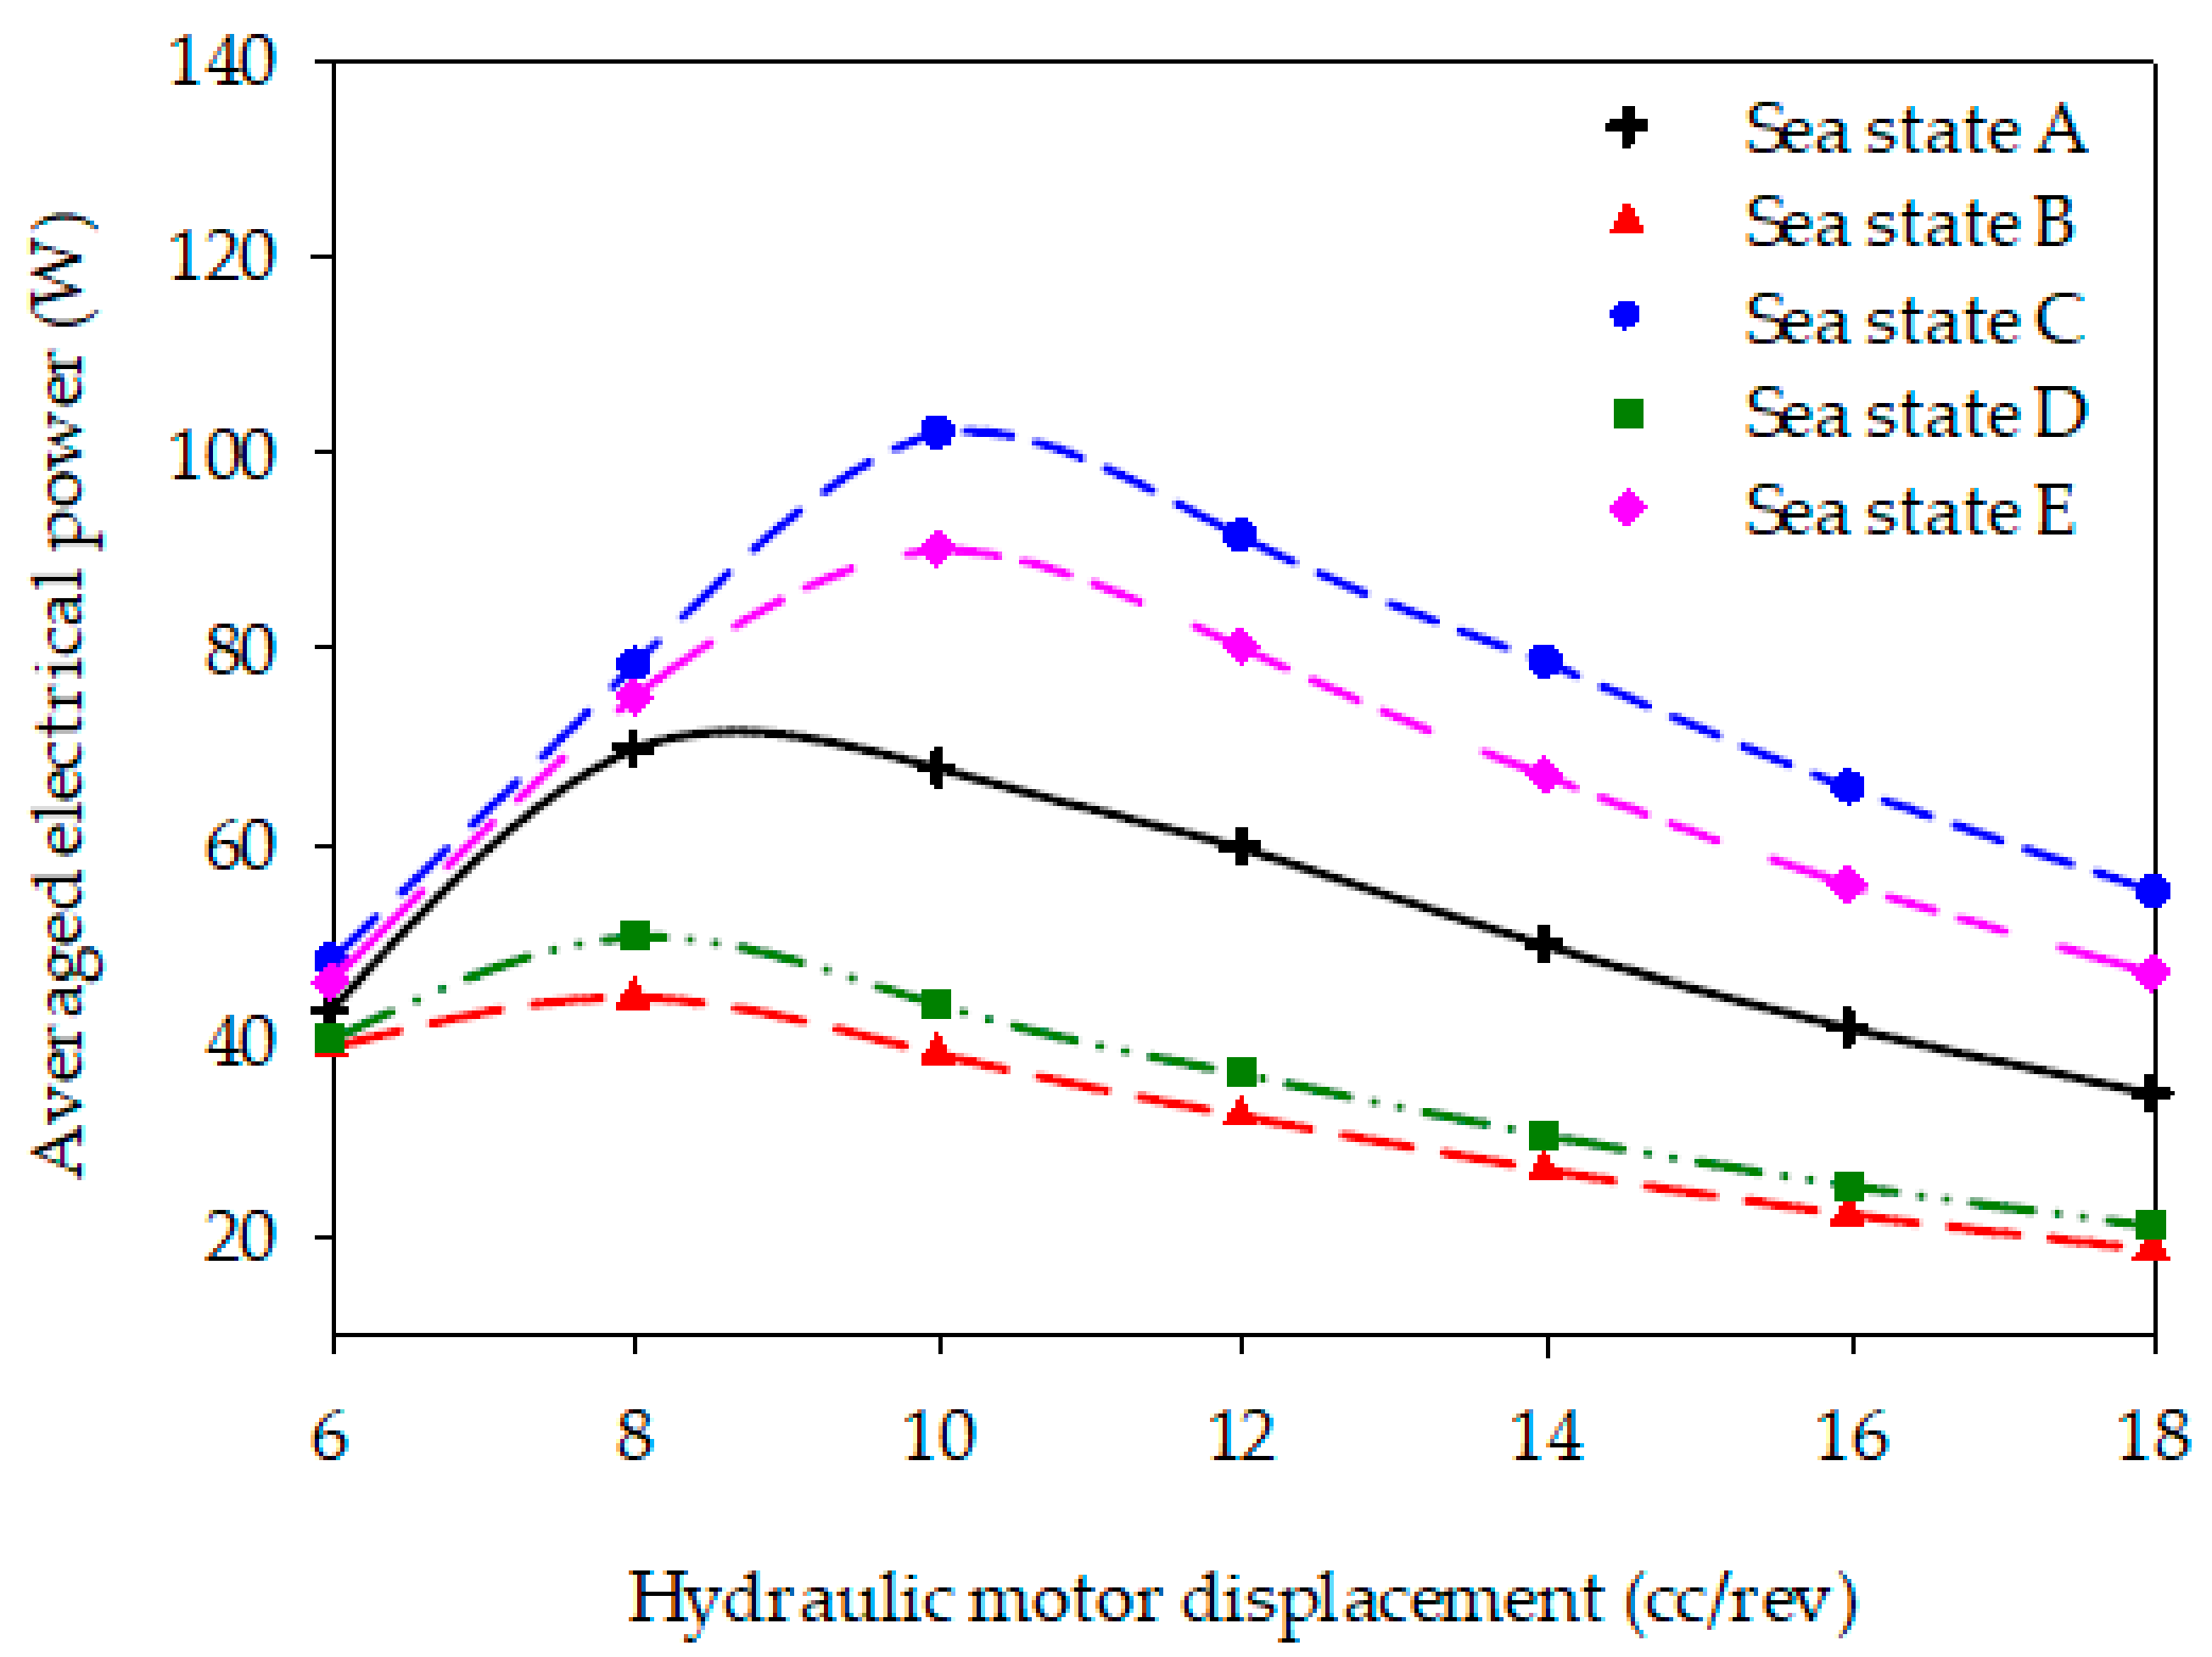
4.3.5. Case 5: Displacement of Hydraulic Motor
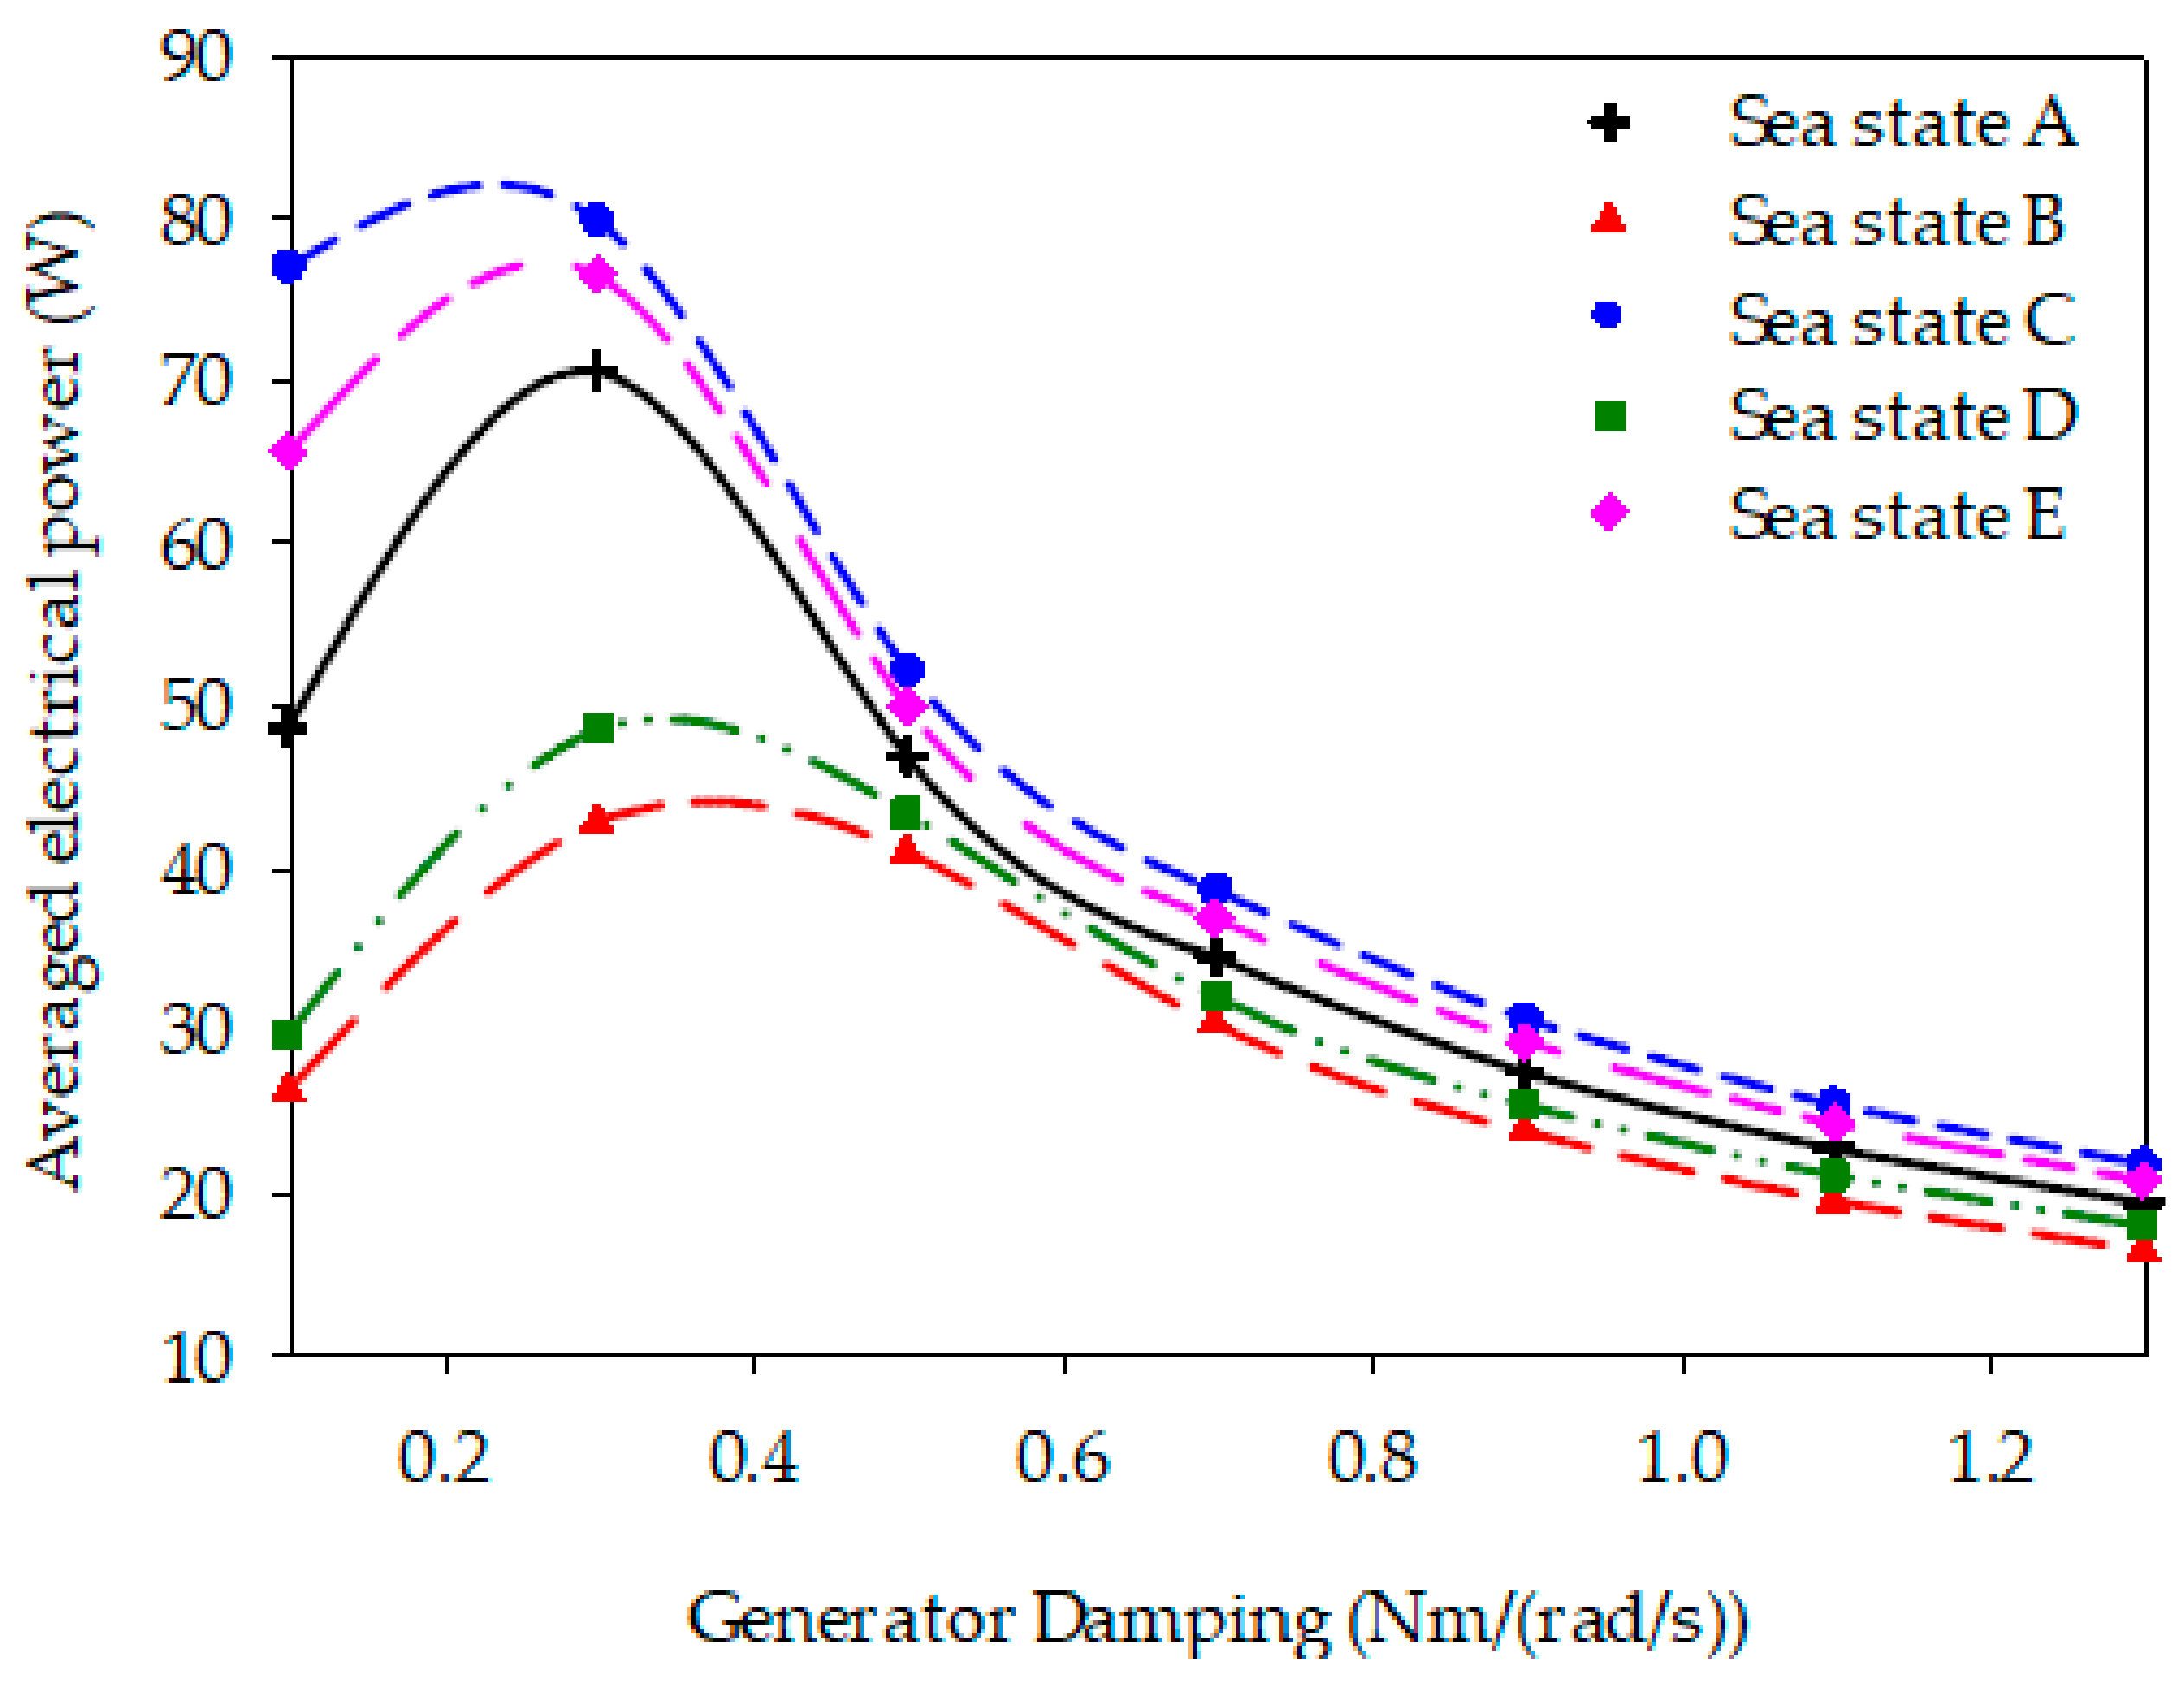
4.3.6. Case 6: Damping Coefficient of Electrical Generator
5. Conclusions
- (1)
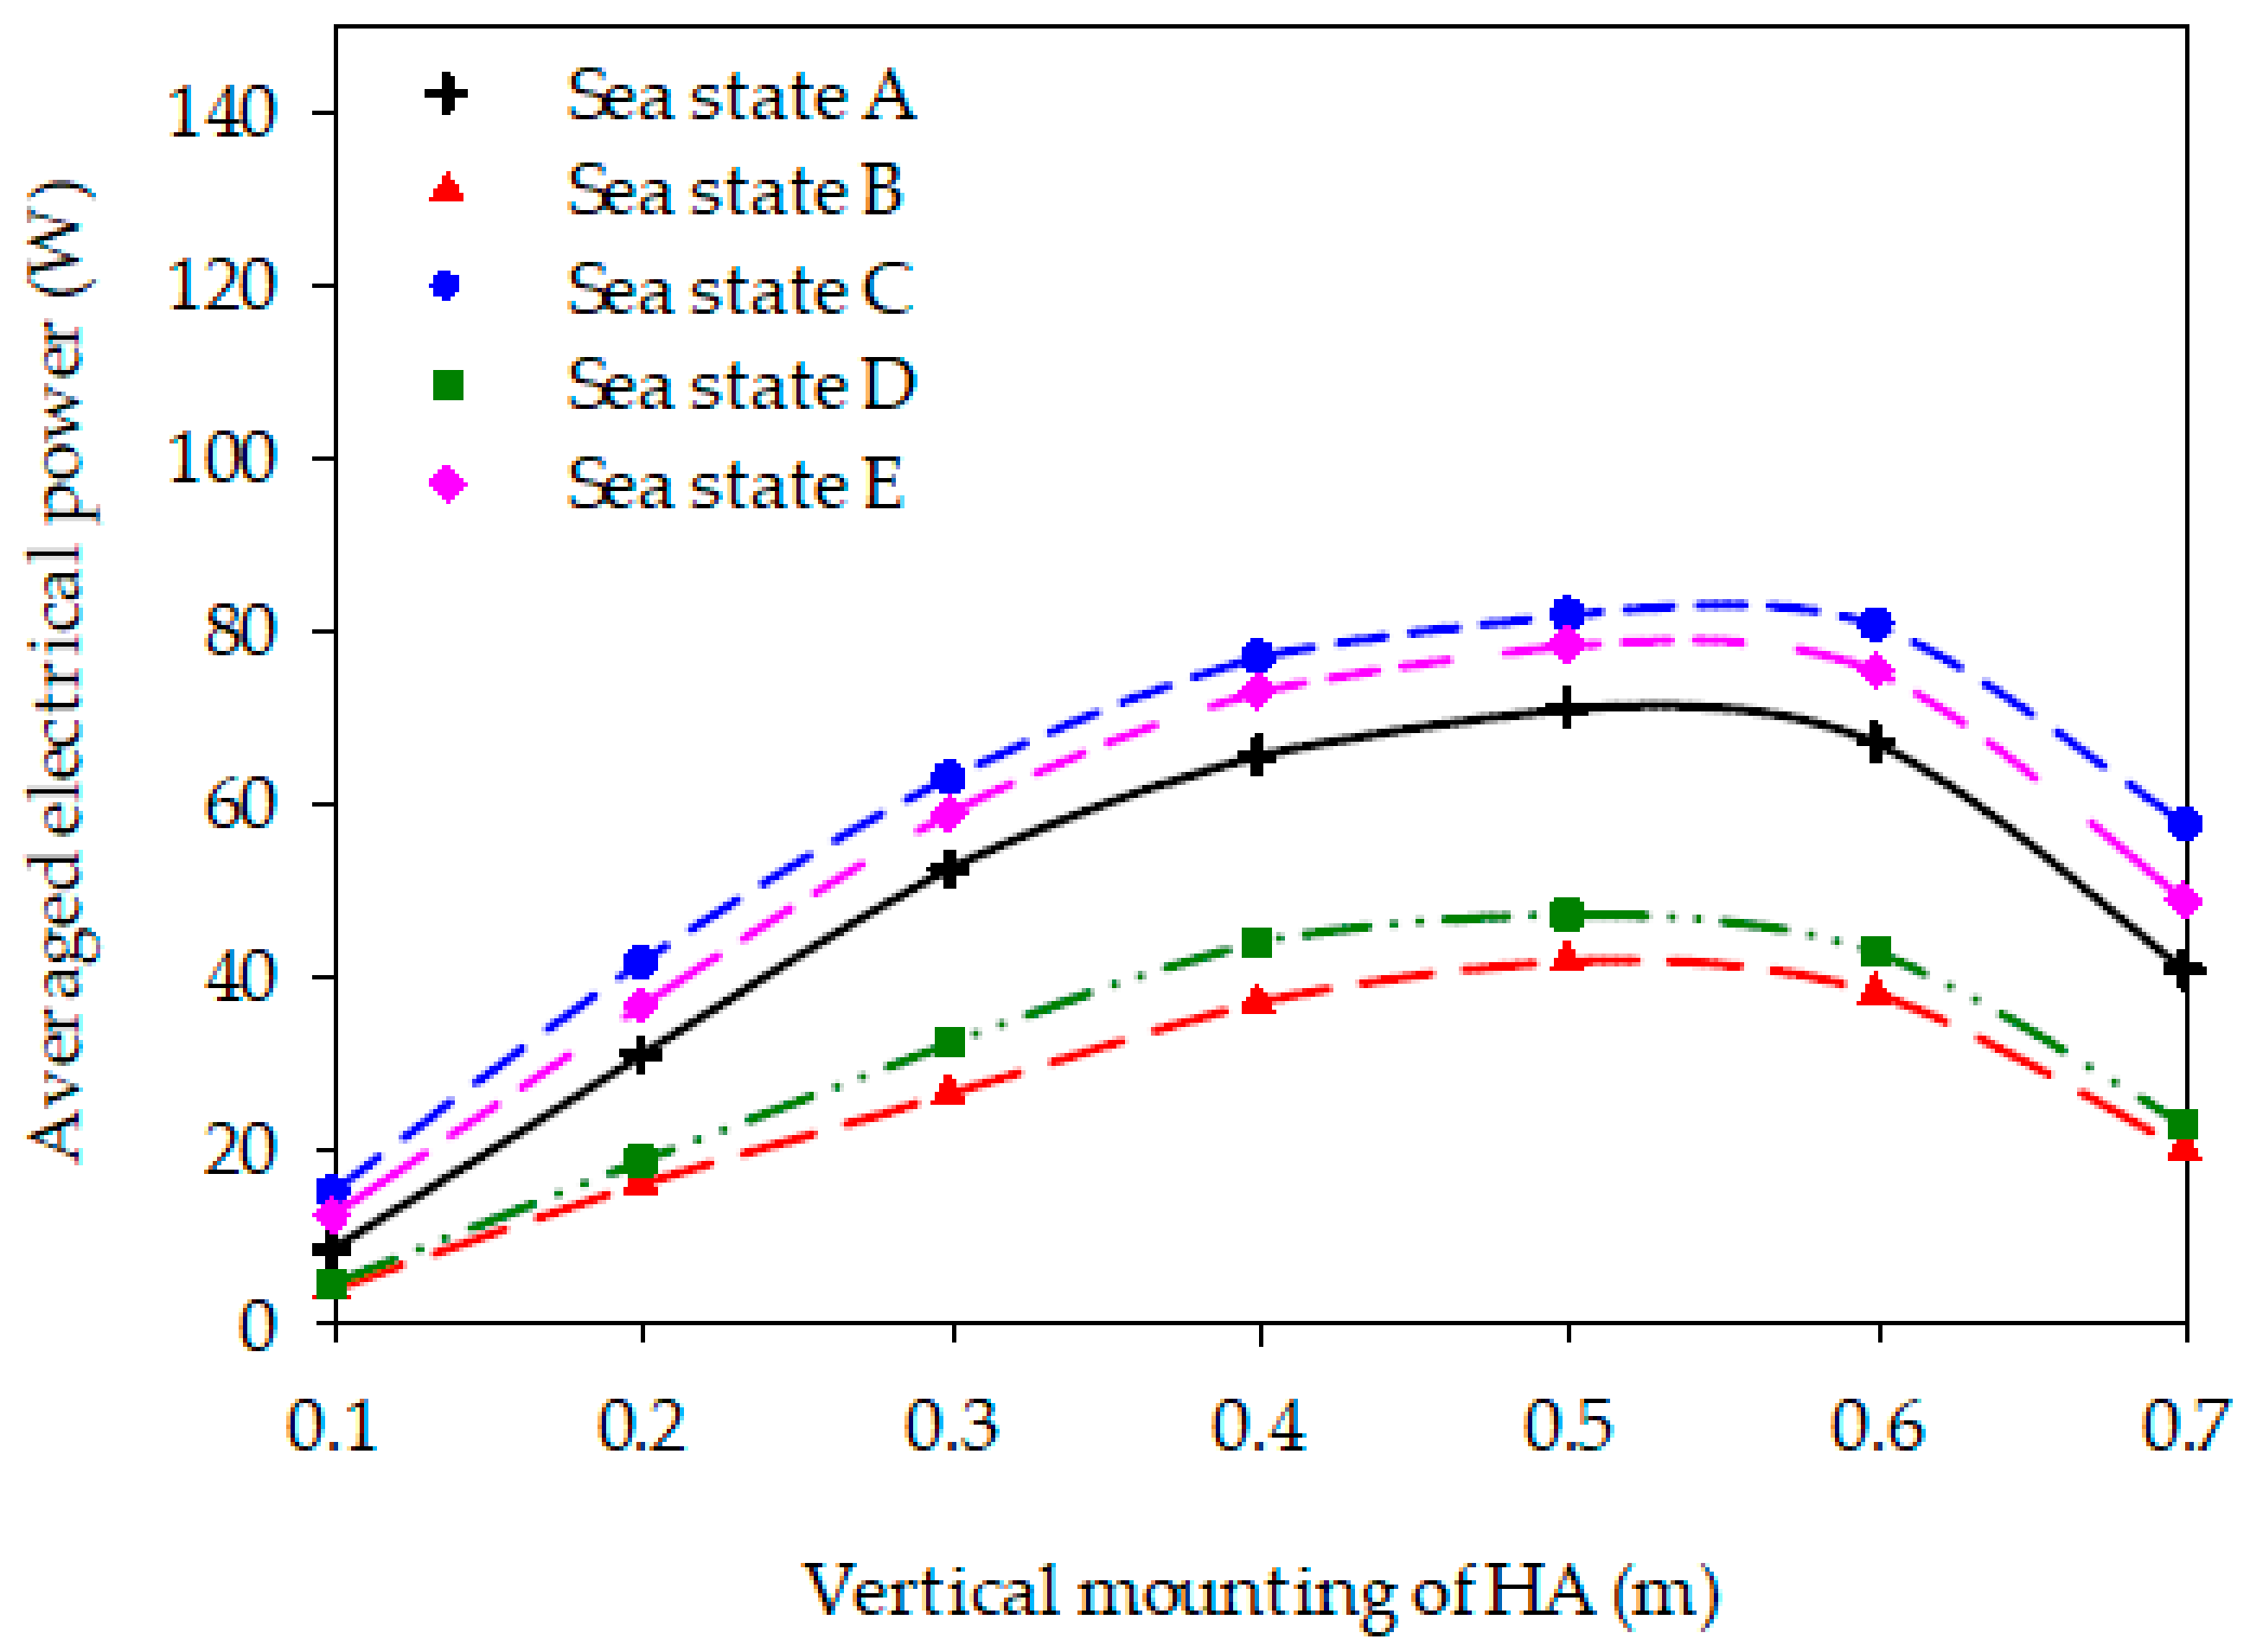
- For case 1, the effect of the vertical mounting position () of the hydraulic actuator on the power generated by the generator was obtained. From the simulation result, it was found that the averaged power generated increased along with an increase of for all sea states and then decreased after reaching the optimal distance. At smaller (0.1 m), the averaged generated power for sea states A to E was reduced by 88%, 91%, 82%, 90% and 84% of their optimal values, respectively. The value of is sensitive to the significant wave height and peak wave period, in which the best of is larger during the large significant wave height and peak wave period sea state.
- (2)
- For case 2, the averaged power generated was increased along with the increase of piston size () for all sea states. However, the average power was decreased for the over-sized of state. The simulation result shows a sensitive to the significant wave height and peak wave period. Thus, a large size of should be used in the large significant wave height and peak wave period sea state.
- (3)
- For case 3, the simulation results demonstrate that the volume capacity of HPA () is less sensitive to changes in small significant wave height and peak wave period sea state, and inversely for a large significant wave height and peak wave period sea state, where the increase of reduced the averaged power generated. This is due to more power accumulated in the HPA rather than directly flowing to the hydraulic motor. Thus, an appropriate should be selected based on the HPTO capacity to avoid this power reduction.
- (4)
- For case 4, the simulation result shows that the pre-charge pressure of HPA () should be higher for the large significant wave height and peak wave period sea state rather than the small significant wave height and peak wave period sea state.
- (5)
- For case 5, the investigation results reveal that the underestimated and overestimated hydraulic motor displacement () was significantly sensitive to wave height and peak wave period. Thus, a variable displacement hydraulic motor with a robust control strategy should be considered.
- (6)
- For case 6, the simulation results found that overestimated damping coefficient of the generator () hardly reduced the averaged generated power. Thus, needs to be optimally controlled using appropriate damping control strategies to maximize power absorption from the ocean waves.
Author Contributions
Funding
Institutional Review Board Statement
Informed Consent Statement
Data Availability Statement
Acknowledgments
Conflicts of Interest
References
- Melikoglu, M. Current status and future of ocean energy sources: A global review. Ocean Eng. 2018, 148, 563–573. [Google Scholar] [CrossRef]
- Farrok, O.; Ahmed, K.; Tahlil, A.D.; Farah, M.M.; Kiran, M.R.; Islam, M.R. Electrical power generation from the oceanic wave for sustainable advancement in renewable energy technologies. Sustainability 2020, 12, 2178. [Google Scholar] [CrossRef] [Green Version]
- Ahamed, R.; McKee, K.; Howard, I. Advancements of wave energy converters based on power take off (PTO) systems: A review. Ocean Eng. 2020, 204, 107248. [Google Scholar] [CrossRef]
- Al Shami, E.; Zhang, R.; Wang, X. Point absorber wave energy harvesters: A review of recent developments. Energies 2019, 12, 47. [Google Scholar] [CrossRef] [Green Version]
- Falcão, A.F. Wave energy utilization: A review of the technologies. Renew. Sustain. Energy Rev. 2010, 14, 899–918. [Google Scholar] [CrossRef]
- Yusop, Z.M.; Ibrahim, M.Z.; Jusoh, M.A.; Albani, A.; Rahman, S.J.A. Wave-Activated Body Energy Converter Technologies: A Review. J. Adv. Res. Fluid Mech. Therm. Sci. 2020, 76, 76–104. [Google Scholar] [CrossRef]
- Sheng, W.; Lewis, A. Power takeoff optimization for maximizing energy conversion of wave-activated bodies. IEEE J. Ocean. Eng. 2016, 41, 529–540. [Google Scholar] [CrossRef]
- Drew, B.; Plummer, A.R.; Sahinkaya, M.N. A review of wave energy converter technology. Proc. Inst. Mech. Eng. Part A J. Power Energy 2009, 223, 887–902. [Google Scholar] [CrossRef] [Green Version]
- Titah-Benbouzid, H.; Benbouzid, M. An up-to-date technologies review and evaluation of wave energy converters. Int. Rev. Electr. Eng. 2015, 10, 52–61. [Google Scholar] [CrossRef]
- Kukner, A.; Erselcan, İ.Ö. A review of power take-off systems employed in wave energy. J. Nav. Sci. Eng. 2014, 10, 32–44. [Google Scholar]
- Jusoh, M.A.; Ibrahim, M.Z.; Daud, M.Z.; Albani, A.; Yusop, Z.M. Hydraulic power take-off concepts for wave energy conversion system: A review. Energies 2019, 12, 4510. [Google Scholar] [CrossRef] [Green Version]
- He, X.; Xiao, G.; Hu, B.; Tan, L.; Tang, H.; He, S.; He, Z. The applications of energy regeneration and conversion technologies based on hydraulic transmission systems: A review. Energy Convers. Manag. 2020, 205, 112413. [Google Scholar] [CrossRef]
- Hansen, R.H.; Kramer, M.M.; Vidal, E.; Hansen, R.H.; Kramer, M.M.; Vidal, E. Discrete displacement hydraulic power take-off system for the wavestar wave energy converter. Energies 2013, 6, 4001–4044. [Google Scholar] [CrossRef]
- Liu, C.; Yang, Q.; Bao, G. Influence of hydraulic power take-off unit parameters on power capture ability of a two-raft-type wave energy converter. Ocean Eng. 2018, 150, 69–80. [Google Scholar] [CrossRef]
- Zou, S.; Abdelkhalik, O. Control of Wave Energy Converters with Discrete Displacement Hydraulic Power Take-Off Units. J. Mar. Sci. Eng. 2018, 6, 31. [Google Scholar] [CrossRef] [Green Version]
- Ding, B.; Cazzolato, B.S.; Arjomandi, M.; Hardy, P.; Mills, B. Sea-state based maximum power point tracking damping control of a fully submerged oscillating buoy. Ocean Eng. 2016, 126, 299–312. [Google Scholar] [CrossRef]
- Jianan, X.; Tao, X. MPPT Control of Hydraulic Power Take-Off for Wave Energy Converter on Artificial Breakwater. J. Mar. Sci. Eng. 2019, 8, 304. [Google Scholar] [CrossRef]
- Liu, C.; Yang, Q.; Bao, G. Performance investigation of a two-raft-type wave energy converter with hydraulic power take-off unit. Appl. Ocean Res. 2017, 62, 139–155. [Google Scholar] [CrossRef]
- Xuhui, Y.; Qijuan, C.; Zenghui, W.; Dazhou, G.; Donglin, Y.; Wen, J.; Weiyu, W. A novel nonlinear state space model for the hydraulic power take-off of a wave energy converter. Energy 2019, 180, 465–479. [Google Scholar] [CrossRef]
- Jusoh, M.A.; Ibrahim, M.Z.; Daud, M.Z.; Yusop, Z.M.; Albani, A. An Estimation of Hydraulic Power Take-off Unit Parameters for Wave Energy Converter Device Using Non-Evolutionary NLPQL and Evolutionary GA Approaches. Energies 2020, 14, 79. [Google Scholar] [CrossRef]
- Jusoh, M.A.; Ibrahim, M.Z.; Daud, M.Z.; Yusop, Z.M.; Albani, A.; Rahman, S.J.; Mohad, S. Parameters estimation of hydraulic power take-off system for wave energy conversion system using genetic algorithm. In Proceedings of the IOP Conference Series: Earth and Environmental Science; Institute of Physics Publishing: Bristol, UK, 2020; Volume 463, p. 12129. [Google Scholar]
- Hansen, A.H.; Asmussen, M.F.; Bech, M.M. Model predictive control of a wave energy converter with discrete fluid power power take-off system. Energies 2018, 11, 635. [Google Scholar] [CrossRef] [Green Version]
- Gaspar, J.F.; Calvário, M.; Kamarlouei, M.; Soares, C.G. Design tradeoffs of an oil-hydraulic power take-off for wave energy converters. Renew. Energy 2018, 129, 245–259. [Google Scholar] [CrossRef]
- Gaspar, J.F.; Calvário, M.; Kamarlouei, M.; Guedes Soares, C. Power take-off concept for wave energy converters based on oil-hydraulic transformer units. Renew. Energy 2016, 86, 1232–1246. [Google Scholar] [CrossRef]
- Penalba, M.; Sell, N.P.; Hillis, A.J.; Ringwood, J.V.; Penalba, M.; Sell, N.P.; Hillis, A.J.; Ringwood, J.V. Validating a wave-to-wire model for a wave energy converter—Part I: The hydraulic transmission system. Energies 2017, 10, 977. [Google Scholar] [CrossRef] [Green Version]
- Shadman, M.; Estefen, S.F.; Rodriguez, C.A.; Nogueira, I.C.M. A geometrical optimization method applied to a heaving point absorber wave energy converter. Renew. Energy 2018, 115, 533–546. [Google Scholar] [CrossRef]
- Coiro, D.P.; Troise, G.; Calise, G.; Bizzarrini, N. Wave energy conversion through a point pivoted absorber: Numerical and experimental tests on a scaled model. Renew. Energy 2016, 87, 317–325. [Google Scholar] [CrossRef]
- Chen, Z.; Zhou, B.; Zhang, L.; Sun, L.; Zhang, X. Performance evaluation of a dual resonance wave-energy convertor in irregular waves. Appl. Ocean Res. 2018, 77, 78–88. [Google Scholar] [CrossRef]
- Sun, P.; Li, Q.; He, H.; Chen, H.; Zhang, J.; Li, H.; Liu, D. Design and optimization investigation on hydraulic transmission and energy storage system for a floating-array-buoys wave energy converter. Energy Convers. Manag. 2021, 235, 113998. [Google Scholar] [CrossRef]
- Liu, Z.; Qu, N.; Han, Z.; Zhang, J.; Zhang, S.; Li, M.; Shi, H. Study on energy conversion and storage system for a prototype buoys-array wave energy converter. Energy Sustain. Dev. 2016, 34, 100–110. [Google Scholar] [CrossRef]
- Liang, C.; Ai, J.; Zuo, L. Design, fabrication, simulation and testing of an ocean wave energy converter with mechanical motion rectifier. Ocean Eng. 2017, 136, 190–200. [Google Scholar] [CrossRef]
- Zurkinden, A.S.; Ferri, F.; Beatty, S.; Kofoed, J.P.; Kramer, M.M. Non-linear numerical modeling and experimental testing of a point absorber wave energy converter. Ocean Eng. 2014, 78, 11–21. [Google Scholar] [CrossRef]
- Rahmati, M.T.; Aggidis, G.A. Numerical and experimental analysis of the power output of a point absorber wave energy converter in irregular waves. Ocean Eng. 2016, 111, 483–492. [Google Scholar] [CrossRef] [Green Version]
- Jama, M.A.; Noura, H.; Wahyudie, A.; Assi, A. Enhancing the performance of heaving wave energy converters using model-free control approach. Renew. Energy 2015, 83, 931–941. [Google Scholar] [CrossRef]
- Forehand, D.I.M.; Kiprakis, A.E.; Nambiar, A.J.; Wallace, A.R. A Fully Coupled Wave-to-Wire Model of an Array of Wave Energy Converters. IEEE Trans. Sustain. Energy 2016, 7, 118–128. [Google Scholar] [CrossRef] [Green Version]
- Windt, C.; Davidson, J.; Ringwood, J.V. High-fidelity numerical modelling of ocean wave energy systems: A review of computational fluid dynamics-based numerical wave tanks. Renew. Sustain. Energy Rev. 2018, 93, 610–630. [Google Scholar] [CrossRef] [Green Version]


| No. | Important Parameters of HPTO | Unit |
|---|---|---|
| 1 | m | |
| 2 | m | |
| 3 | L | |
| 4 | bar | |
| 5 | cc/rev | |
| 6 | Nm/(rad/s) |
| Component Descriptions | Value | Unit | |
|---|---|---|---|
| Hydraulic actuator | Piston diameter, | 0.035 | m |
| Piston rod diameter, | 0.022 | m | |
| Stroke length, | 0.3 | m | |
| Initial stroke length, | 0.15 | m | |
| Vertical distance mounting, | 0.5 | m | |
| Horizontal distance mounting, | 0.5 | m | |
| Initial rod length (point A to B), | 0.766 | m | |
| High-pressure accu- mulator | Pre-charge pressure, | 46.9 | bar |
| Volume capacity, | 2.8 | L | |
| Adiabatic index, γ | 1.4 | - | |
| Low-pressure accu- mulator | Pre-charge pressure, | 3.2 | bar |
| Volume capacity, | 4.0 | L | |
| Adiabatic index, γ | 1.4 | - | |
| Hydraulic motor | Displacement, | 8.4 | cc/rev |
| Nominal shaft angular velocity, | 200 | rpm | |
| Volumetric efficiency at nominal condition, | 0.92 | - | |
| No-load torque, | 0.05 | Nm | |
| Electric generator | Rated power, | 100 | W |
| Rated speed, | 200 | rpm | |
| Rated torque, | 6.0 | Nm | |
| Damping coefficient, | 0.03 | Nm/(rad/s) | |
| Moment of inertia | 0.0036 | kg/m2 | |
| Fluid properties | Density, | 50 | kg/m3 |
| Viscosity, | 850 | cSt | |
| Sea State | Significant | Remarks | |
|---|---|---|---|
| A | 0.8 | 2.5 | Nominal wave condition |
| B | 0.6 | 2.5 | Wave height case |
| C | 1.0 | ||
| D | 0.8 | 2.0 | Wave period case |
| E | 3.0 | ||
| Case | Important Parameters of HPTO | Default Value | Regulating Condition | Unit | |
|---|---|---|---|---|---|
| Ranges | Step | ||||
| 1 | Vertical Mounting of HA, | 0.5 | 0.1–0.7 | 0.1 | m |
| 2 | Piston diameter, | 0.035 | 0.025–0.060 | 0.005 | m |
| 3 | Volume capacity of HPA, | 2.8 | 0.5–10.5 | 2.0 | L |
| 4 | Pre-charge gas pressure of HPA, | 46.9 | 20–80 | 10.0 | bar |
| 5 | Displacement of HM, | 8.4 | 6–18 | 2 | cc/rev |
| 6 | Damping coefficient of the generator, | 0.287 | 0.1–1.3 | 0.2 | Nm/(rad/s) |
| Performance Description (Unit) | Sea State | |||||
|---|---|---|---|---|---|---|
| A | B | C | D | E | ||
| Averaged Angular Displacement of WEC (°) | upward | 5.73 | 3.53 | 6.94 | 3.84 | 6.67 |
| downward | 6.95 | 5.26 | 8.87 | 5.49 | 8.17 | |
| Averaged piston displacement (m) | upward | 0.033 | 0.019 | 0.041 | 0.022 | 0.038 |
| downward | 0.035 | 0.026 | 0.043 | 0.028 | 0.040 | |
| Averaged HPTO force (kN) | upward | 3.64 | 3.49 | 4.45 | 3.54 | 4.09 |
| downward | 1.99 | 1.63 | 2.42 | 1.73 | 2.24 | |
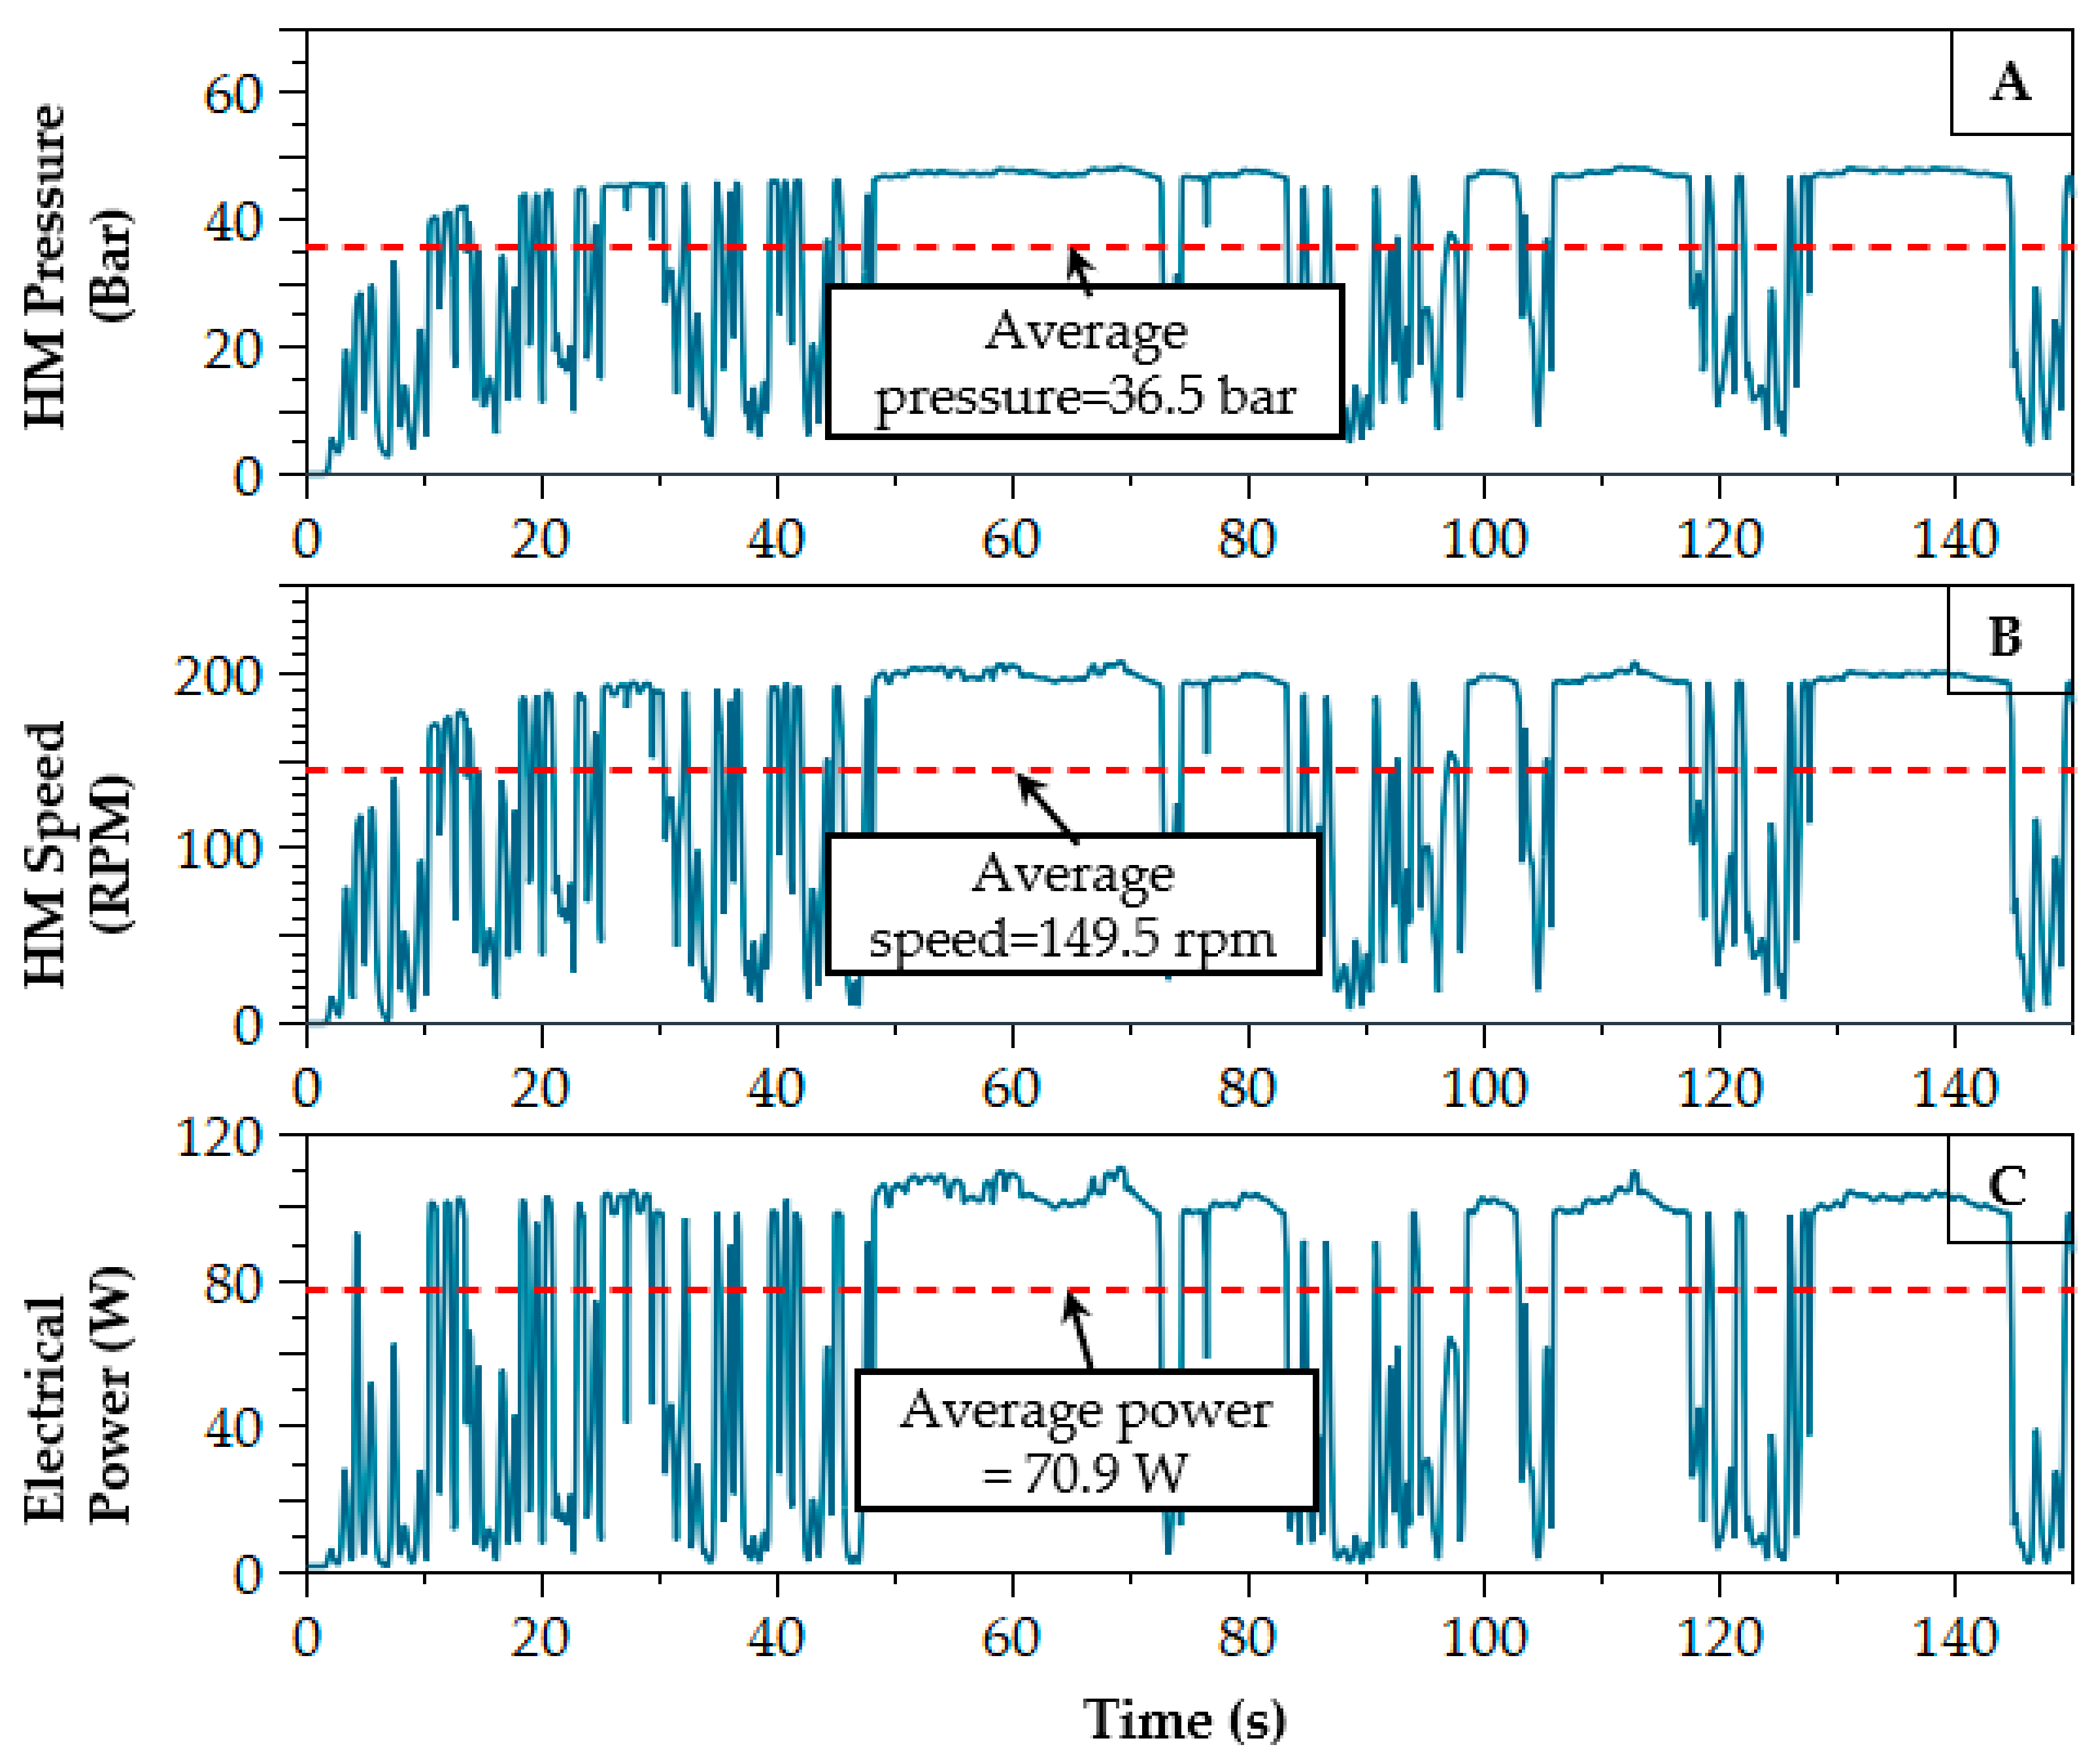
| Averaged operating pressure of HM (bar) | - | 36.5 | 27.4 | 41.9 | 29.2 | 39.7 |
| Averaged speed of generator (rpm) | - | 149.5 | 109.1 | 173.6 | 117.2 | 164.4 |
| Averaged generated electrical power (W) | - | 70.9 | 41.7 | 81.8 | 47.1 | 78.2 |
Publisher’s Note: MDPI stays neutral with regard to jurisdictional claims in published maps and institutional affiliations. |
© 2021 by the authors. Licensee MDPI, Basel, Switzerland. This article is an open access article distributed under the terms and conditions of the Creative Commons Attribution (CC BY) license (https://creativecommons.org/licenses/by/4.0/).
Share and Cite
Jusoh, M.A.; Yusop, Z.M.; Albani, A.; Daud, M.Z.; Ibrahim, M.Z. Investigations of Hydraulic Power Take-Off Unit Parameters Effects on the Performance of the WAB-WECs in the Different Irregular Sea States. J. Mar. Sci. Eng. 2021, 9, 897. https://doi.org/10.3390/jmse9080897
Jusoh MA, Yusop ZM, Albani A, Daud MZ, Ibrahim MZ. Investigations of Hydraulic Power Take-Off Unit Parameters Effects on the Performance of the WAB-WECs in the Different Irregular Sea States. Journal of Marine Science and Engineering. 2021; 9(8):897. https://doi.org/10.3390/jmse9080897
Chicago/Turabian StyleJusoh, Mohd Afifi, Zulkifli Mohd Yusop, Aliashim Albani, Muhamad Zalani Daud, and Mohd Zamri Ibrahim. 2021. "Investigations of Hydraulic Power Take-Off Unit Parameters Effects on the Performance of the WAB-WECs in the Different Irregular Sea States" Journal of Marine Science and Engineering 9, no. 8: 897. https://doi.org/10.3390/jmse9080897