
Analysis of the Makran Coastline of Iran’s Vulnerability to Global Sea-Level Rise

Abstract
:1. Introduction
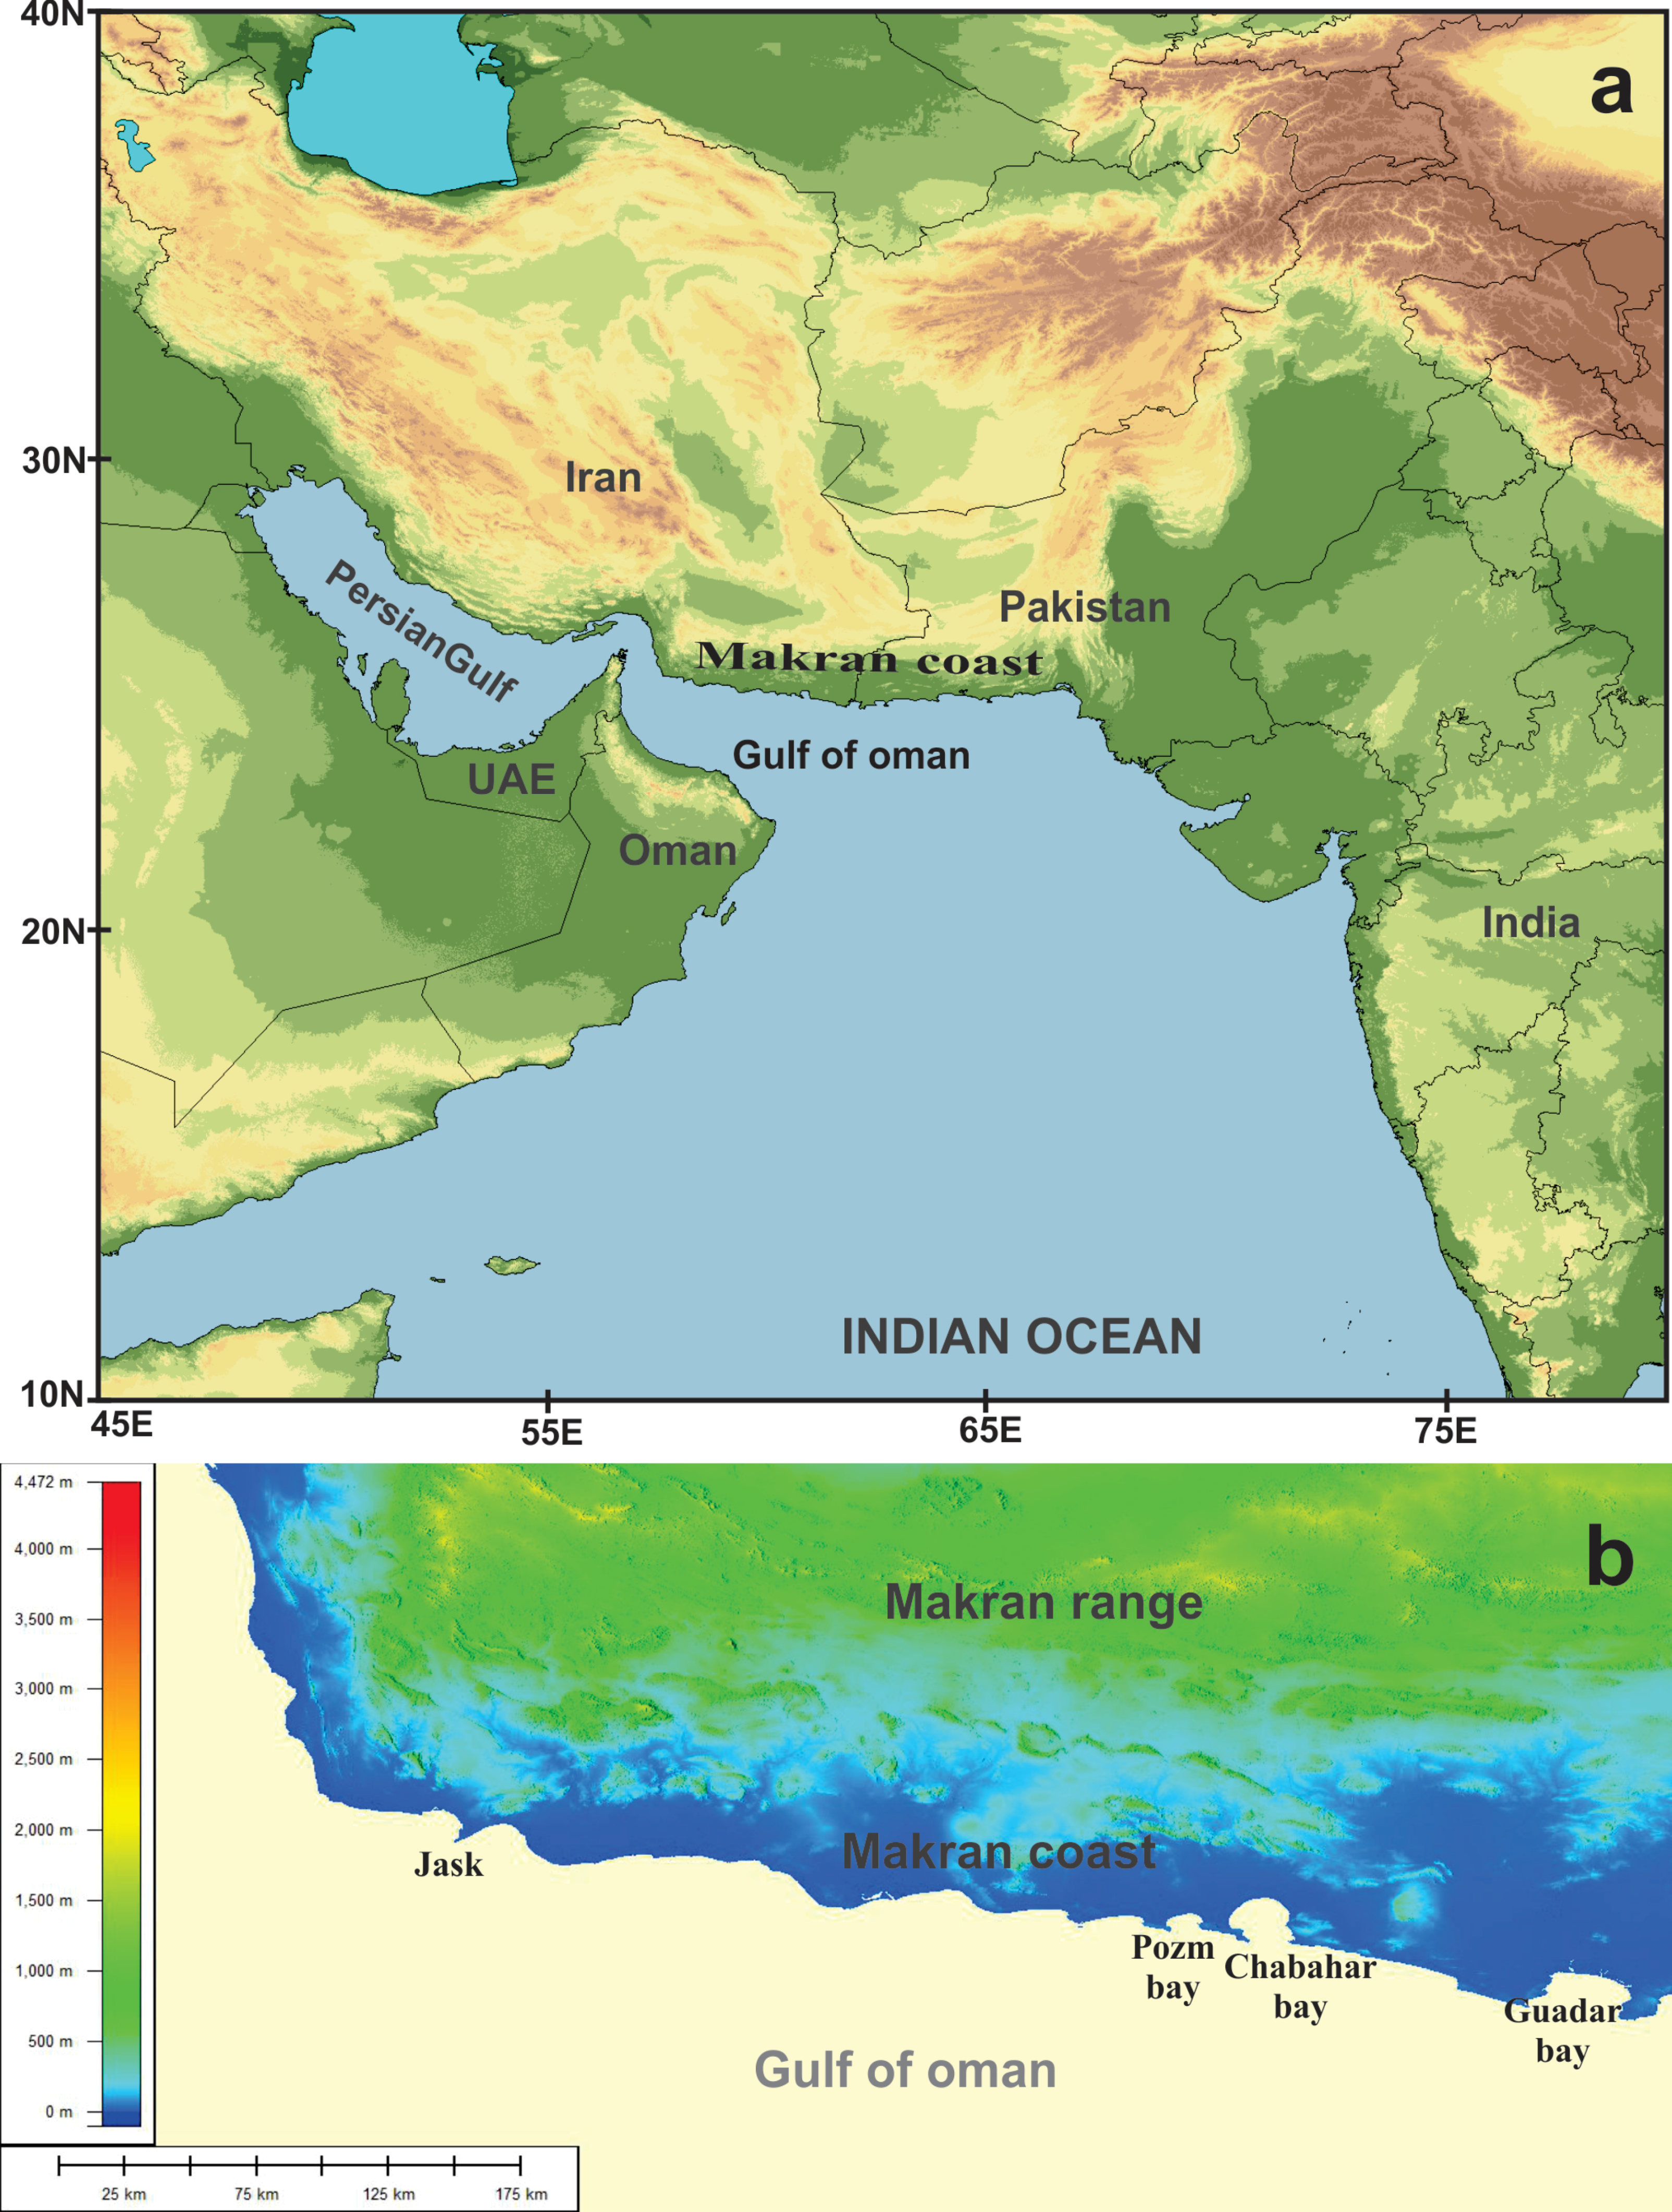
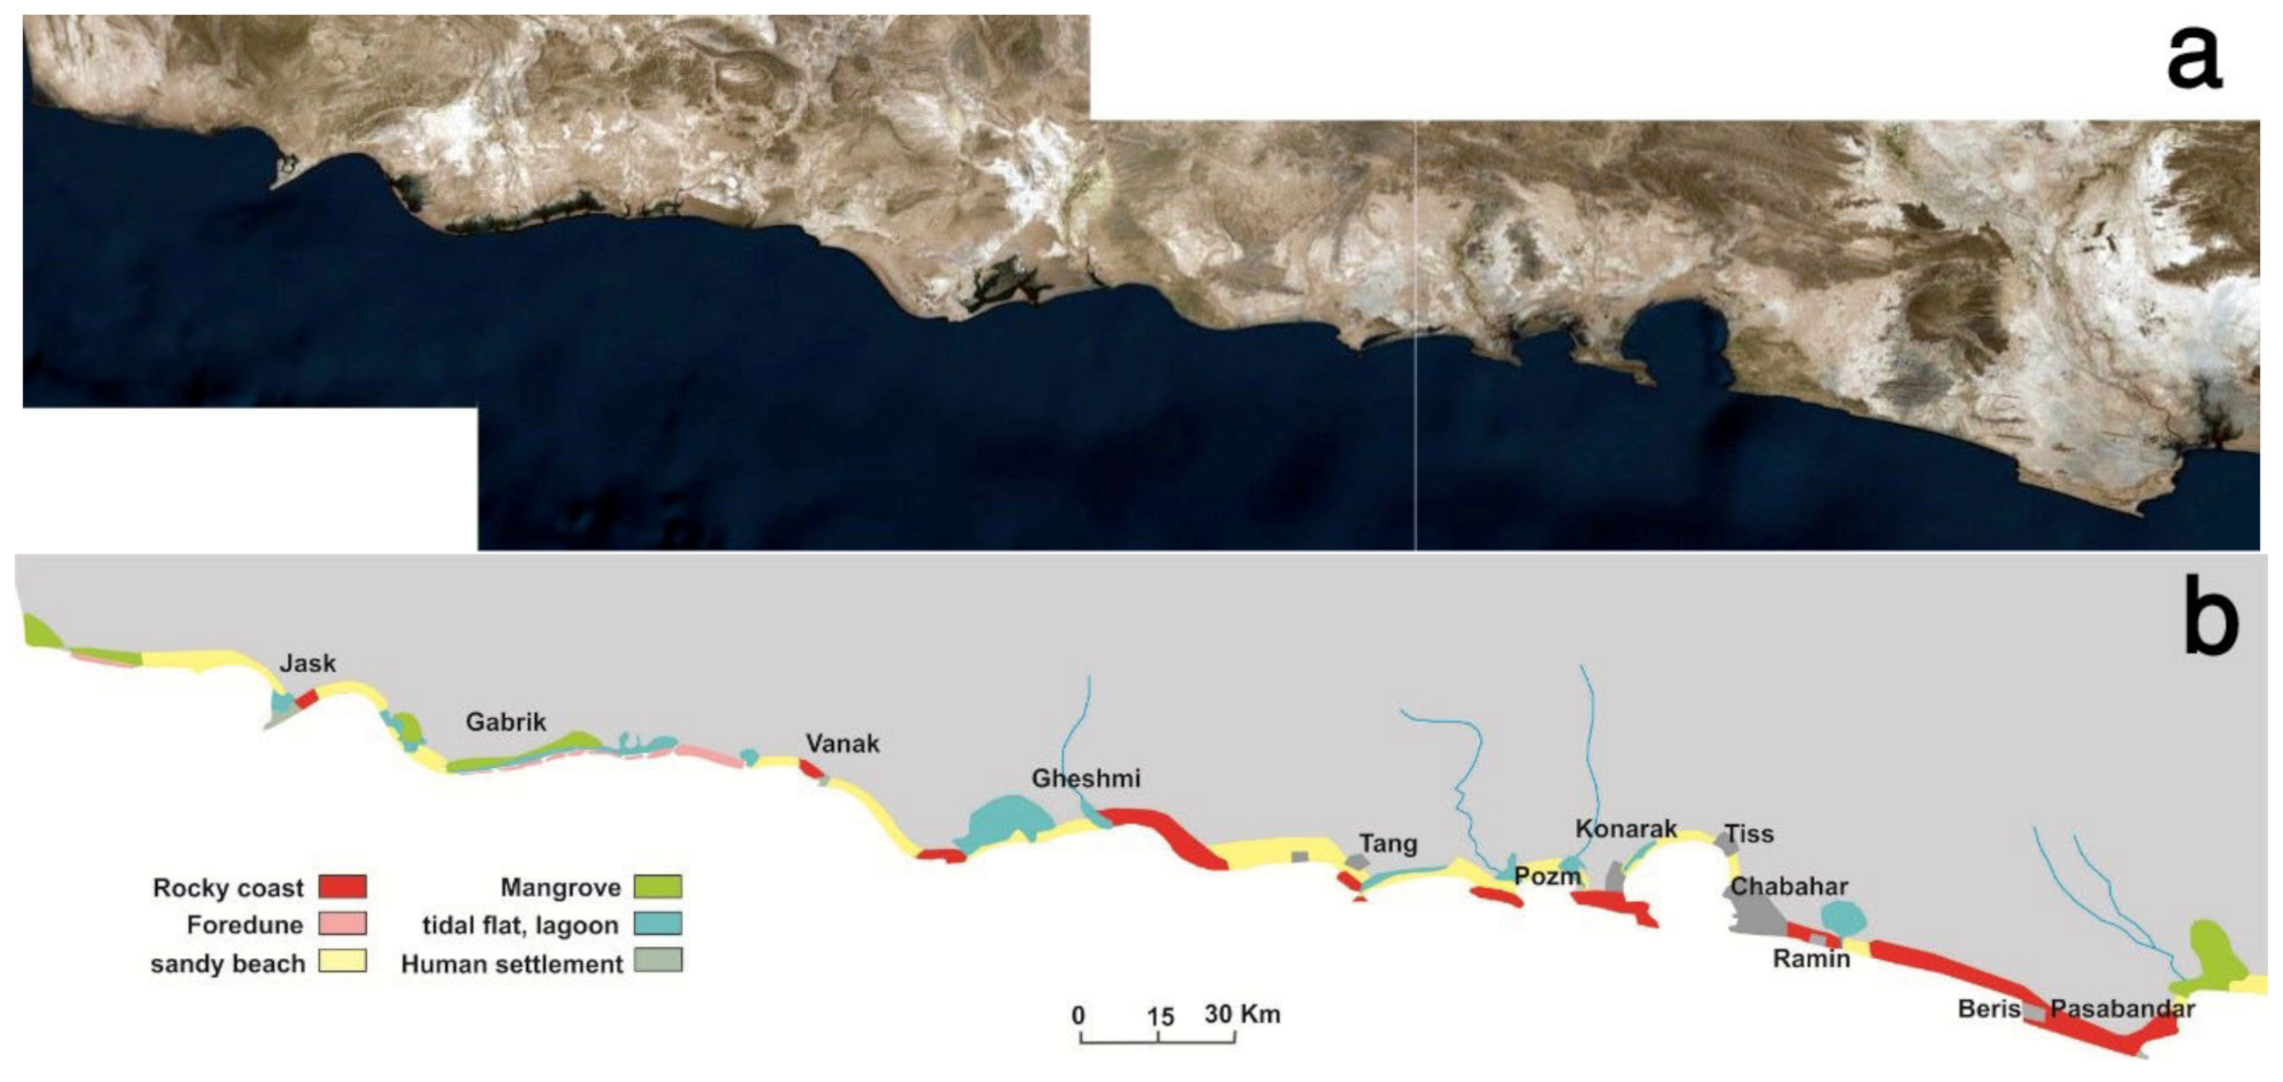
2. The Study Area
3. Methods
3.1. CVI Calculation
3.1.1. Coastal Slope
3.1.2. Regional Coastal Elevation
3.1.3. Mean Tidal Range
3.1.4. Significant Wave Height
3.1.5. Shoreline Change
3.1.6. Rate of Relative Sea Level Changes
3.1.7. Socioeconomic Variables
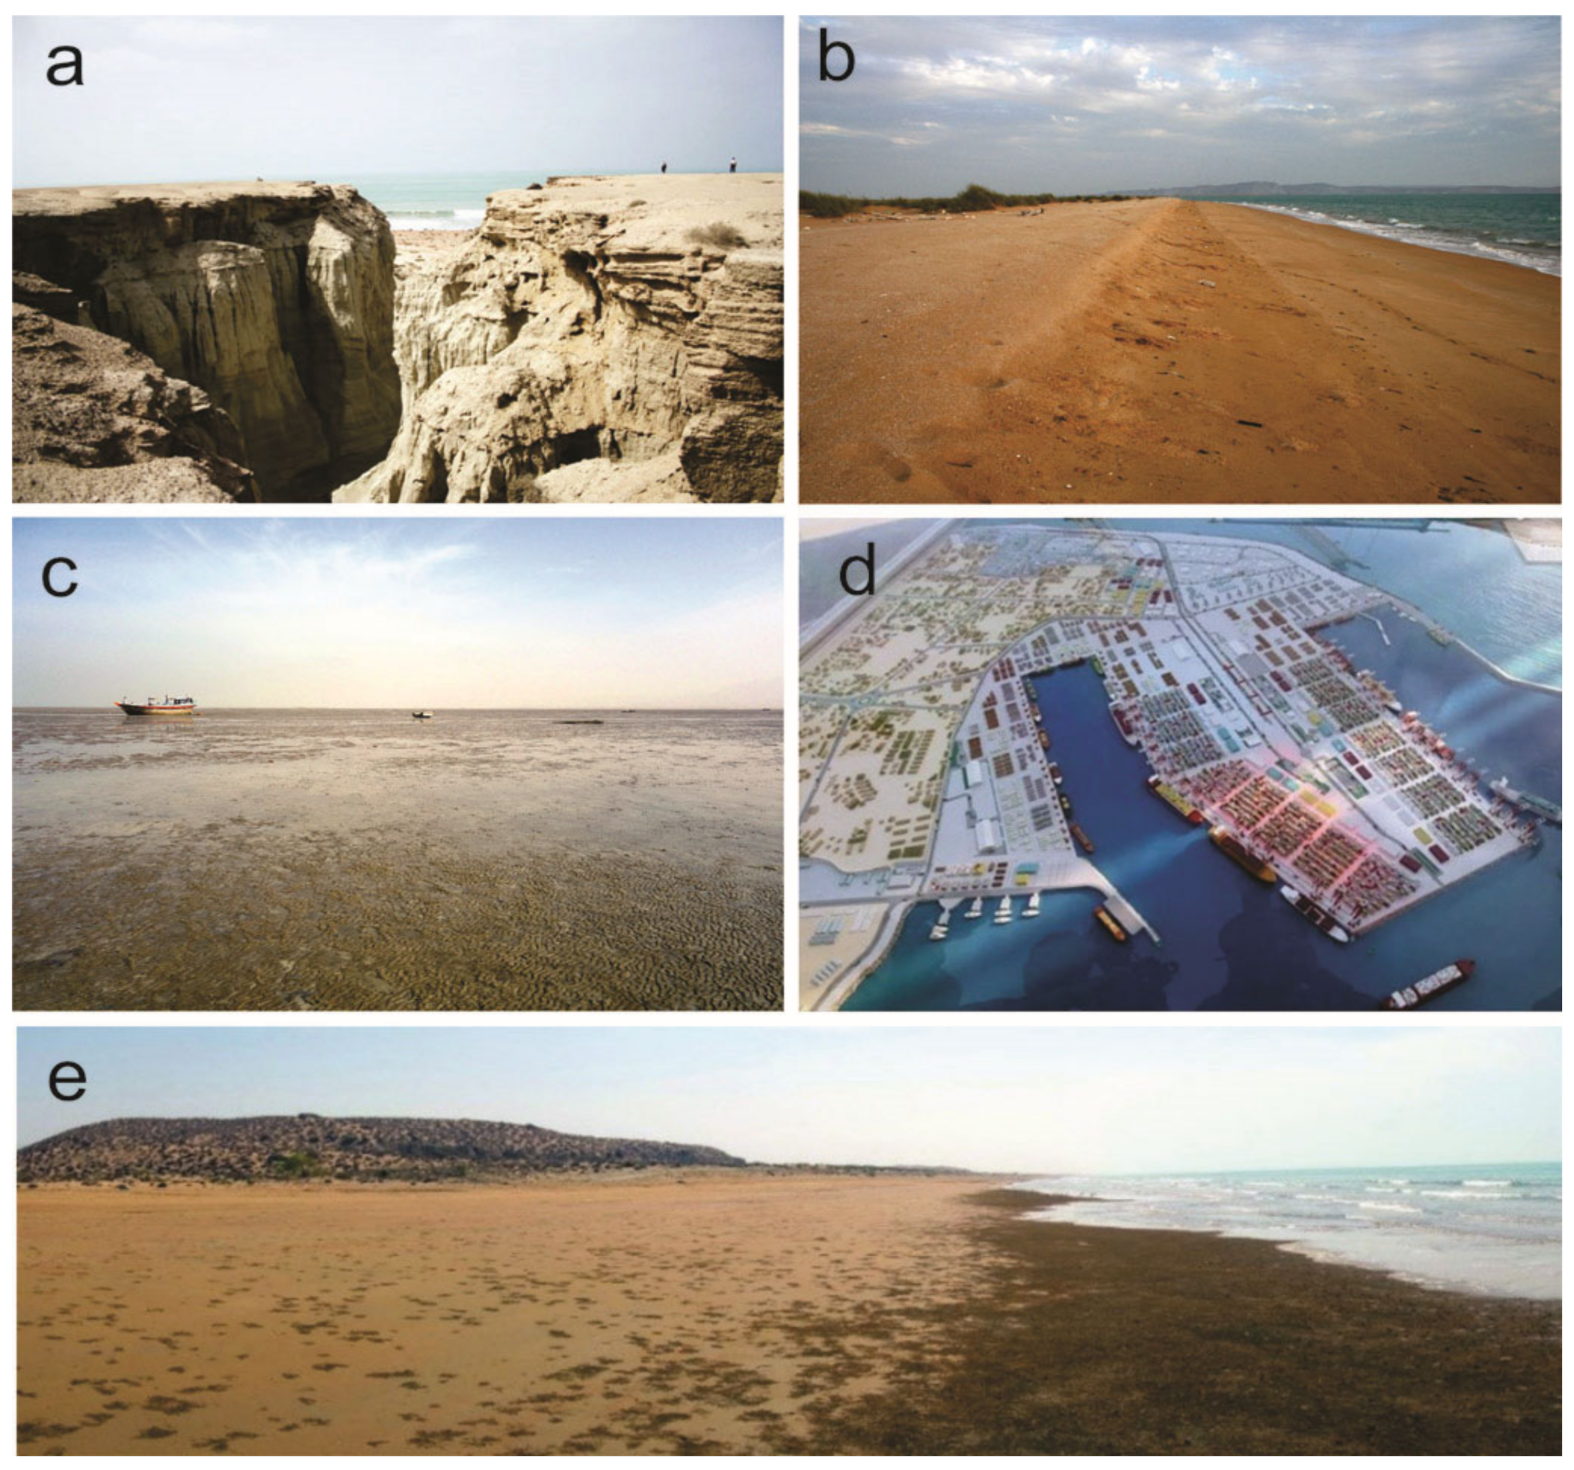
3.1.8. Geomorphological and Environmental Sensitivity
3.2. Risk Ranking
3.3. Calculation of the CVI
4. Results
4.1. Coastal Slope
4.2. Coastal Elevation
4.3. Mean Tidal Range
4.4. Mean Significant Wave Height
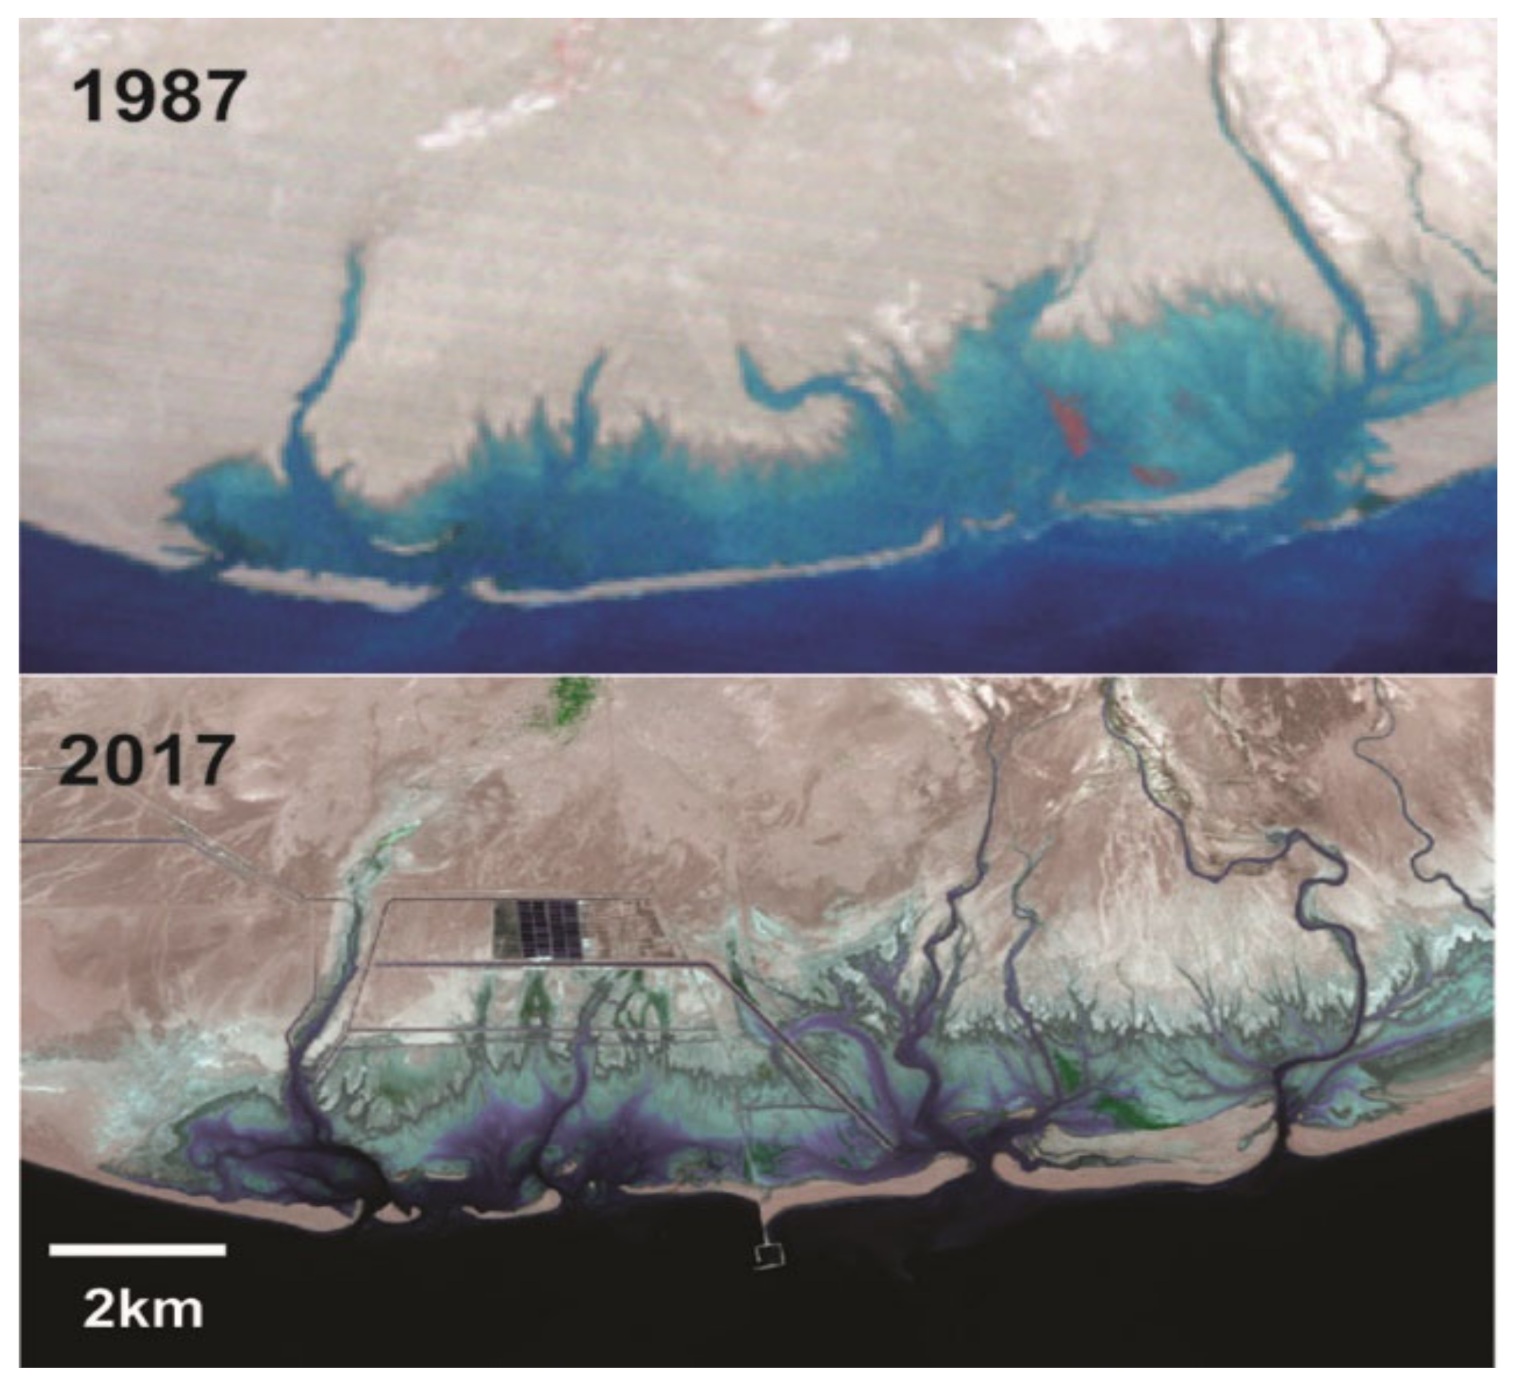
4.5. Rate of Shoreline Change
4.6. Relative Sea Level Change
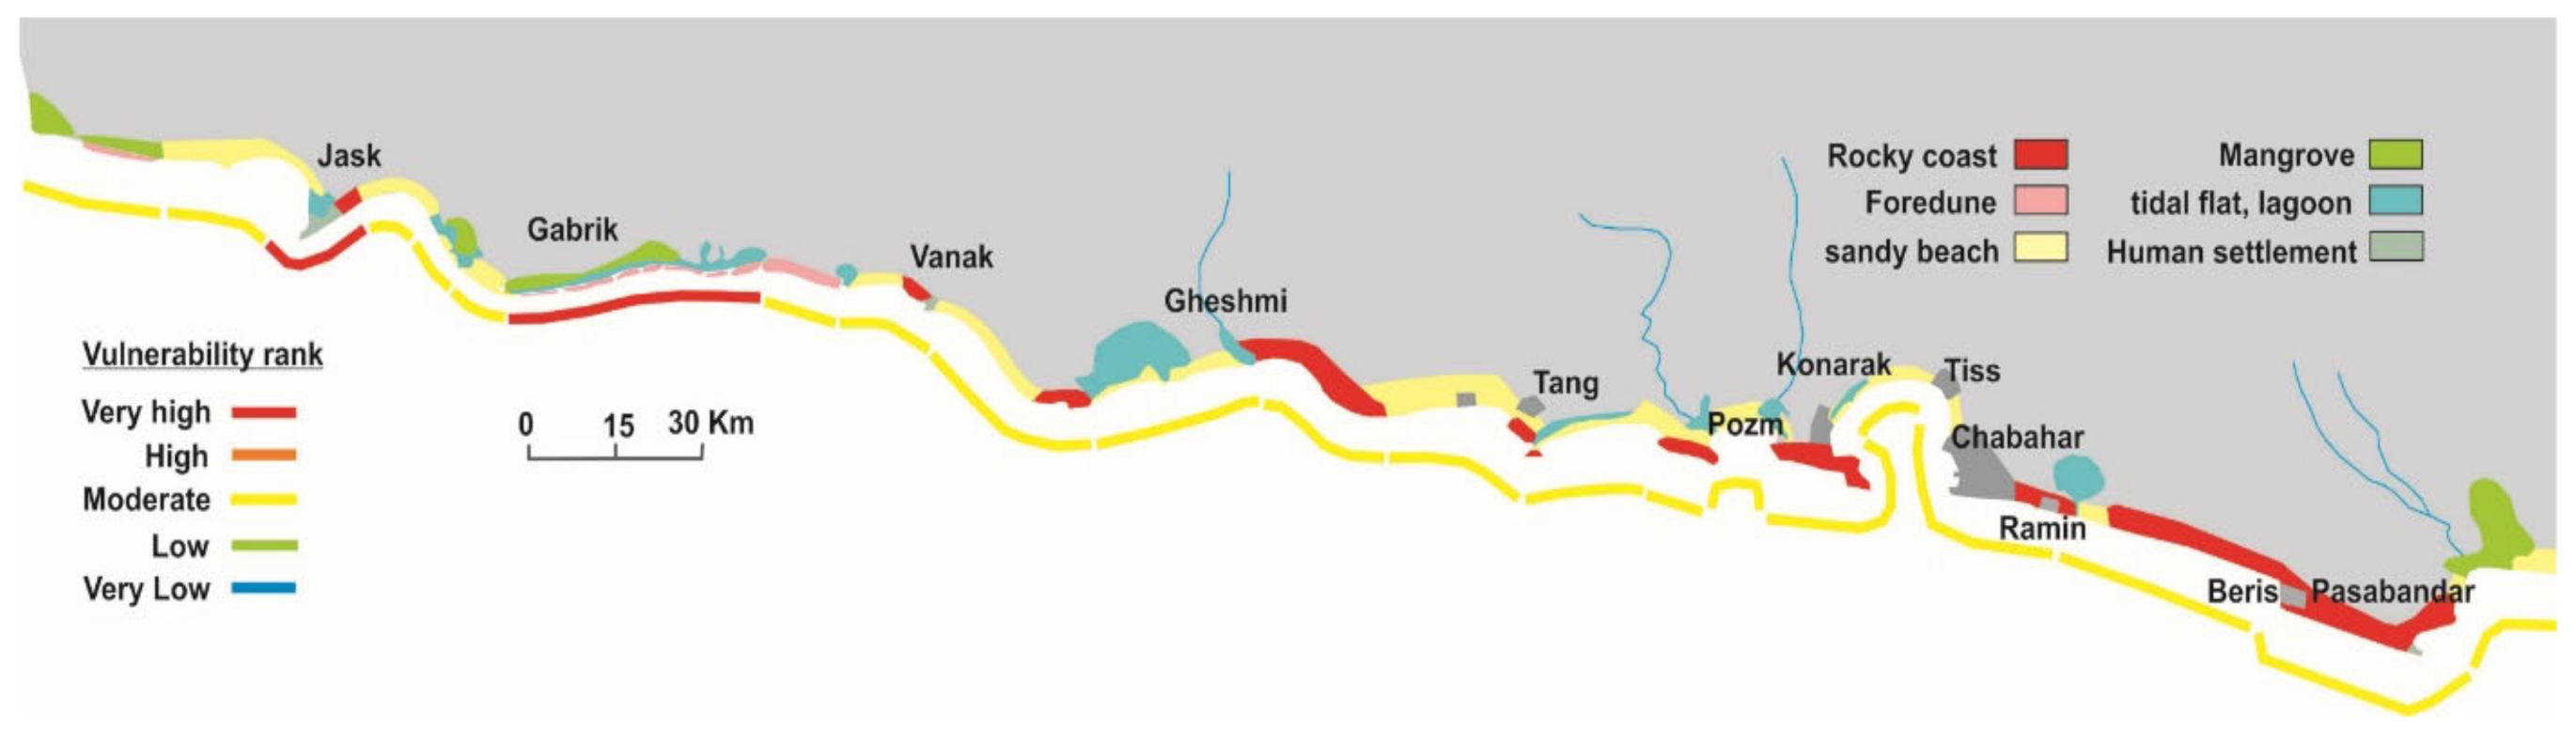
4.7. Geomorphological and Environmental Sensitivity
4.8. Socioeconomic Risk
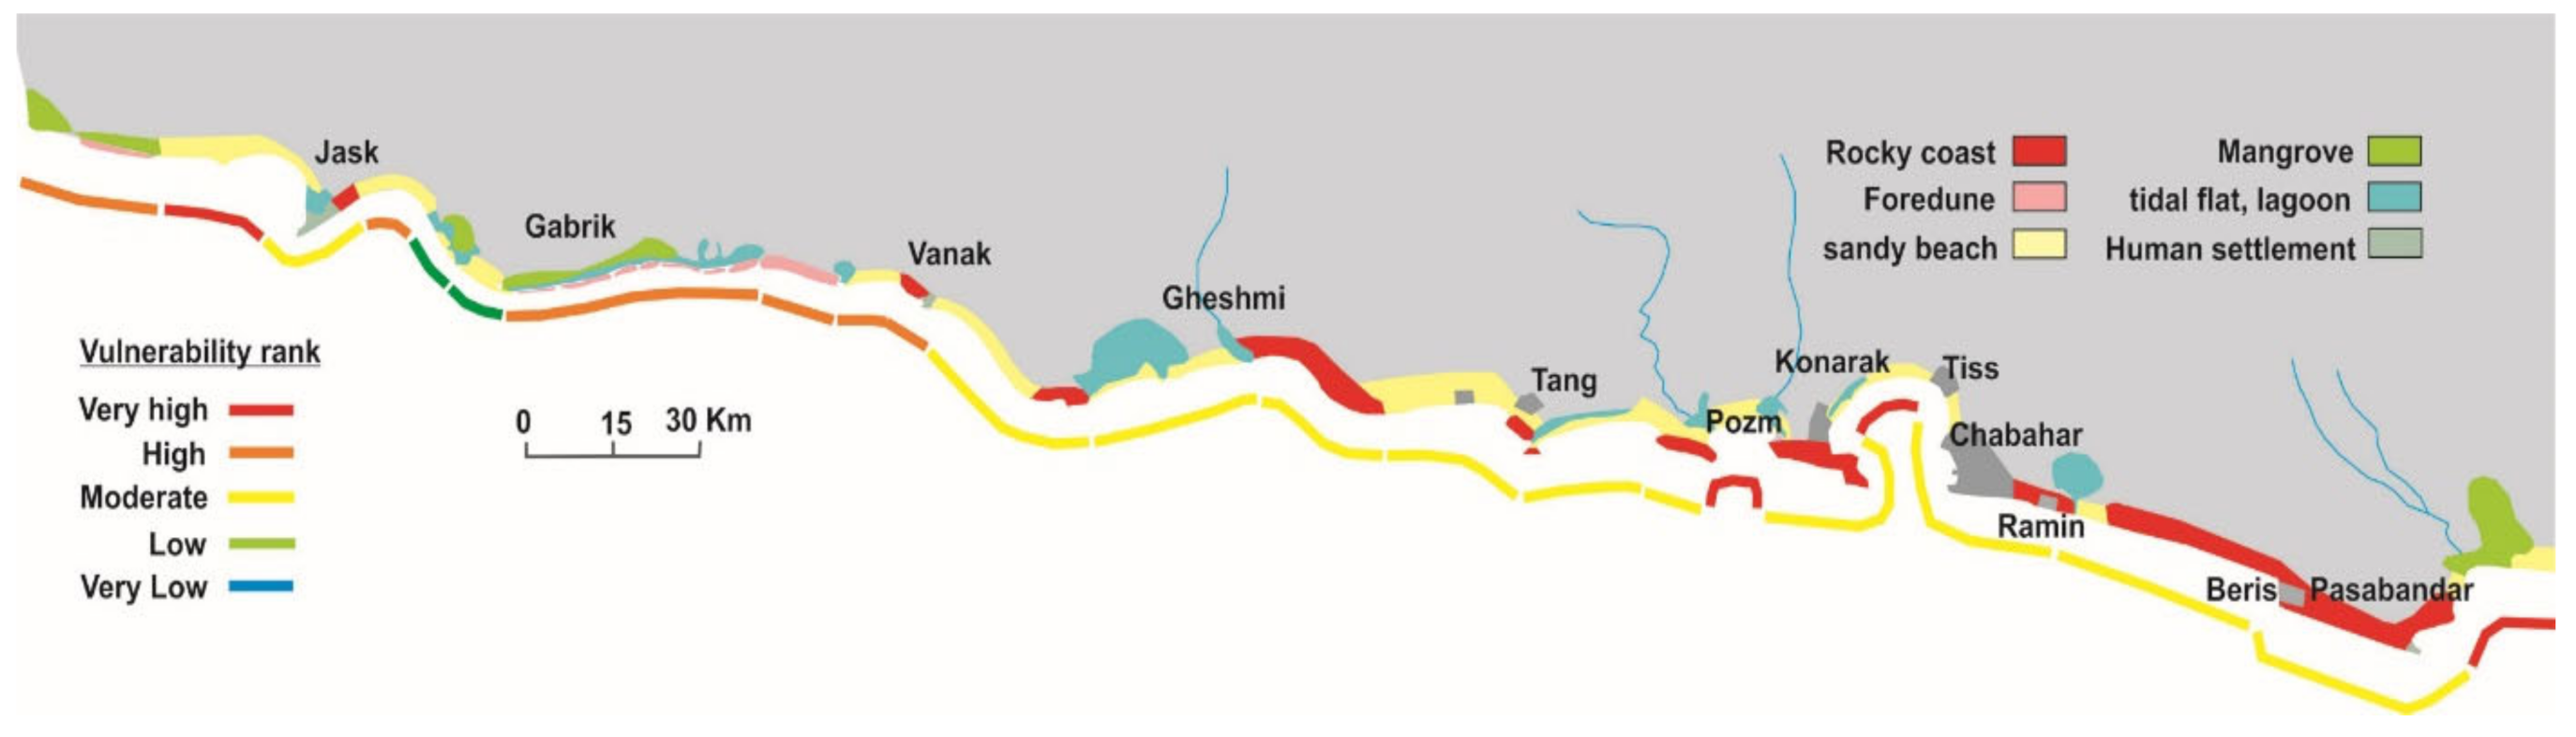
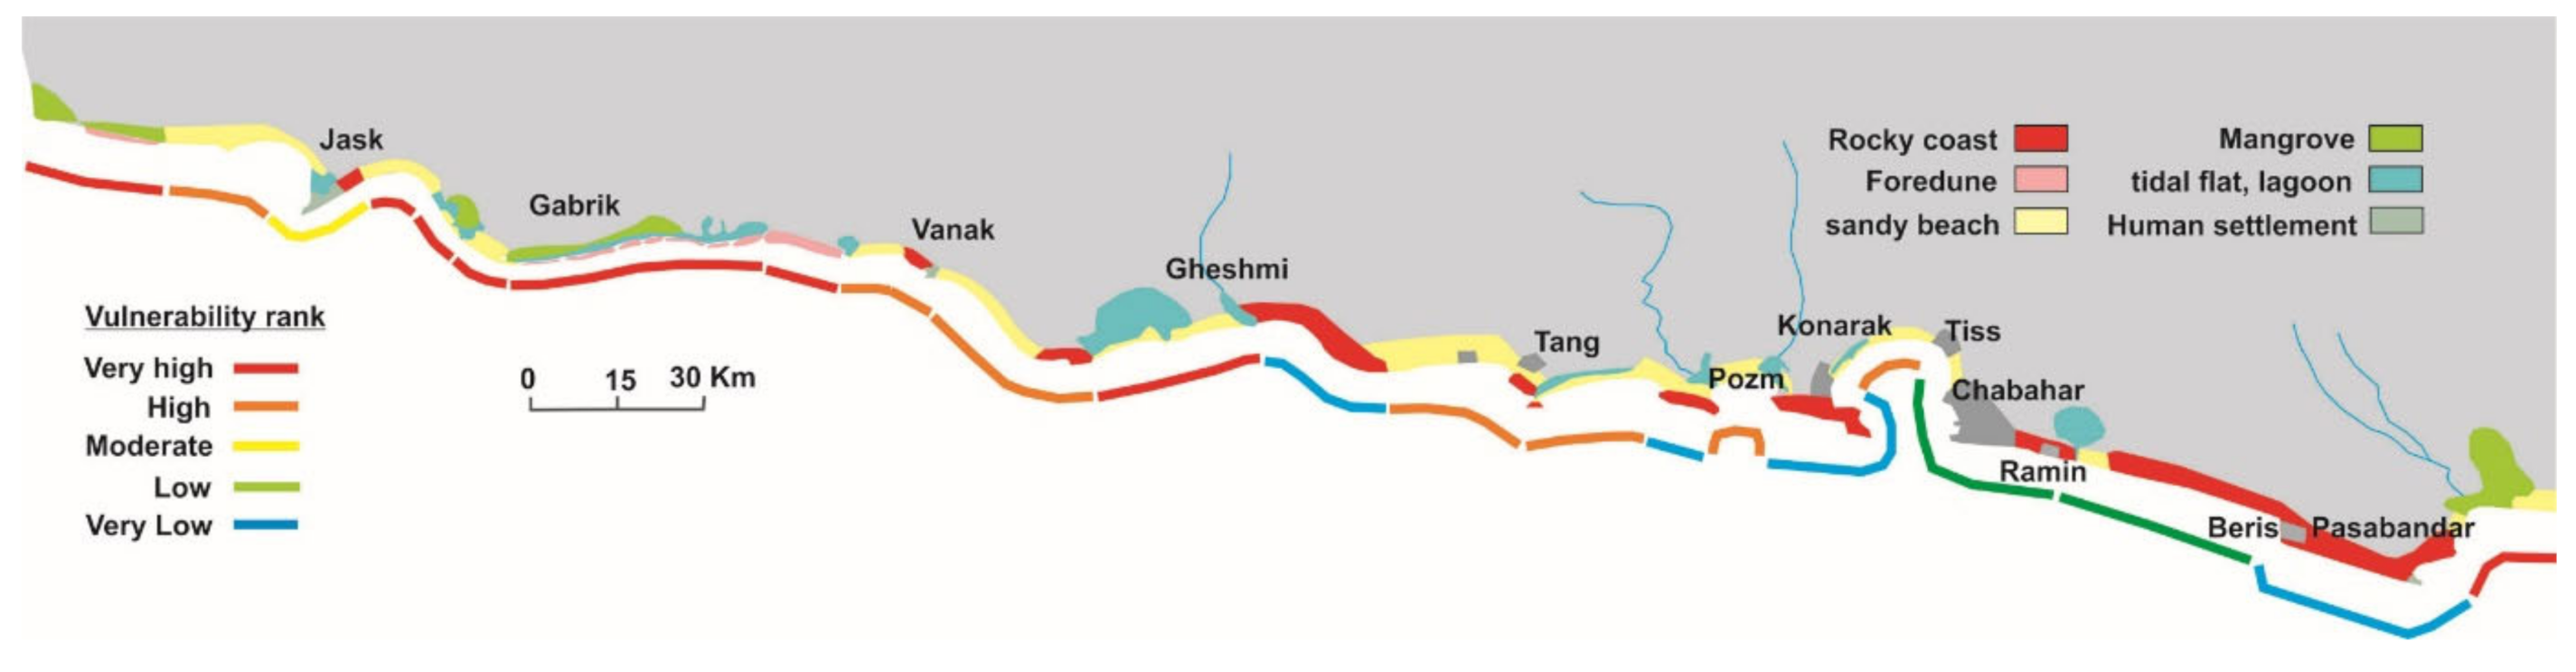
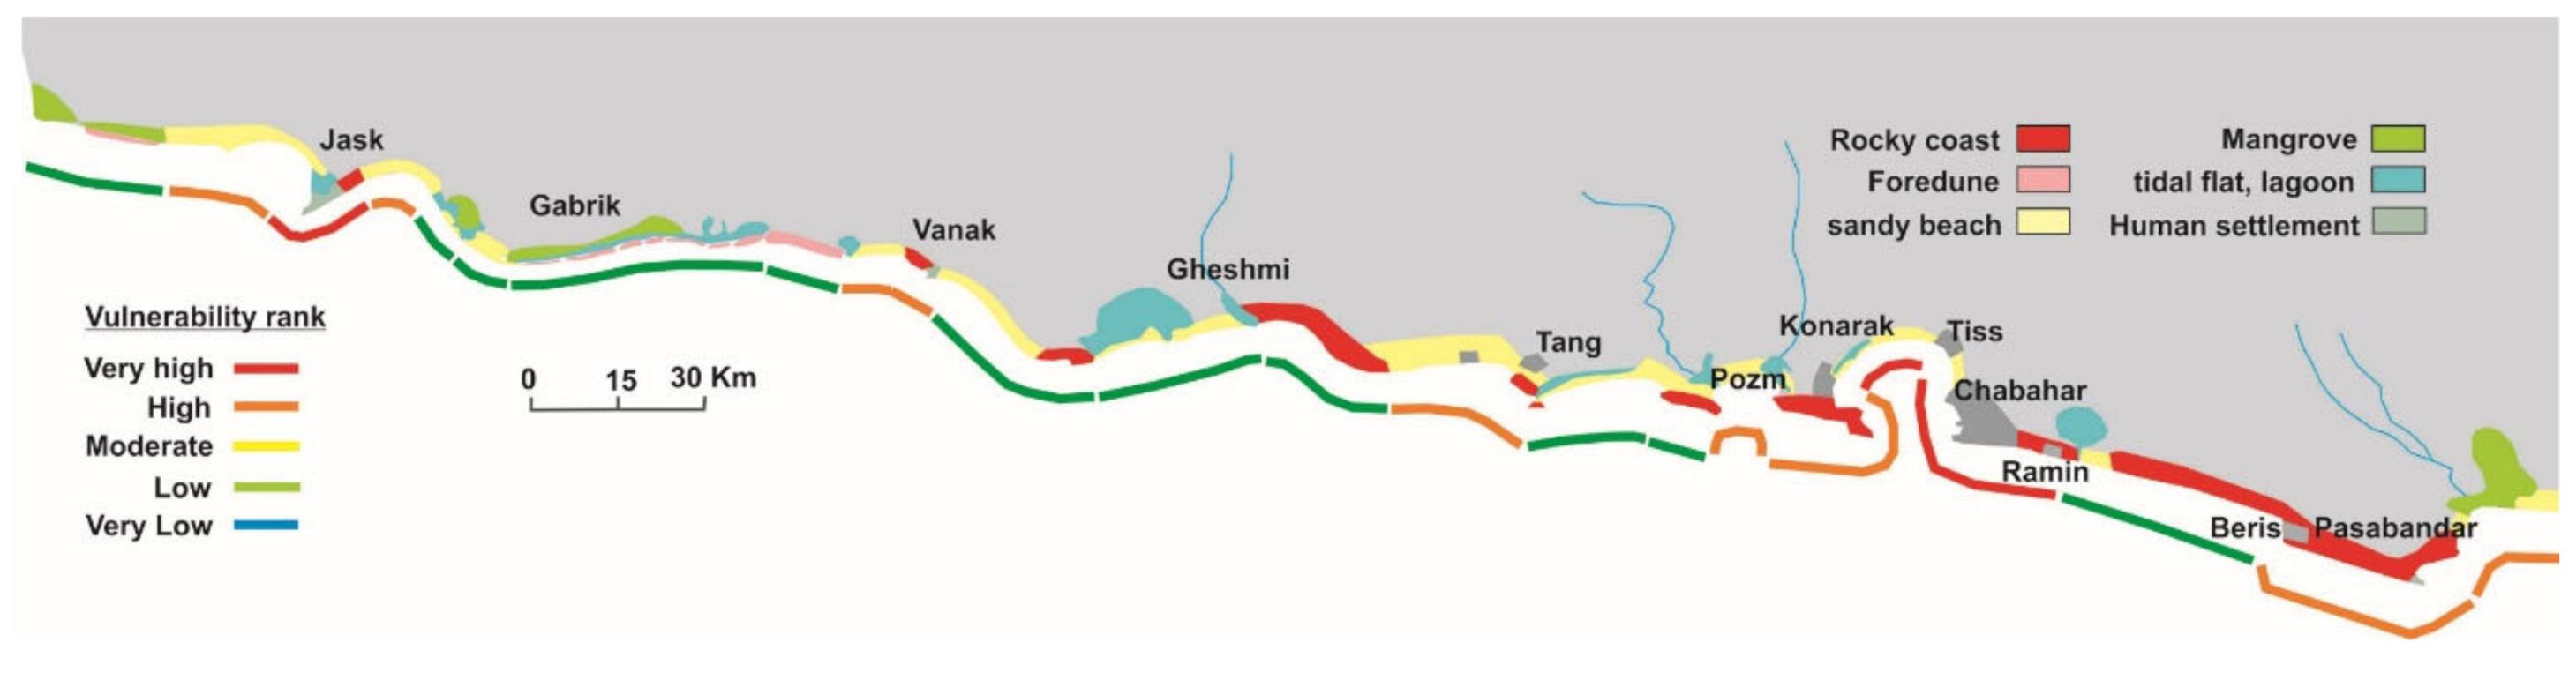
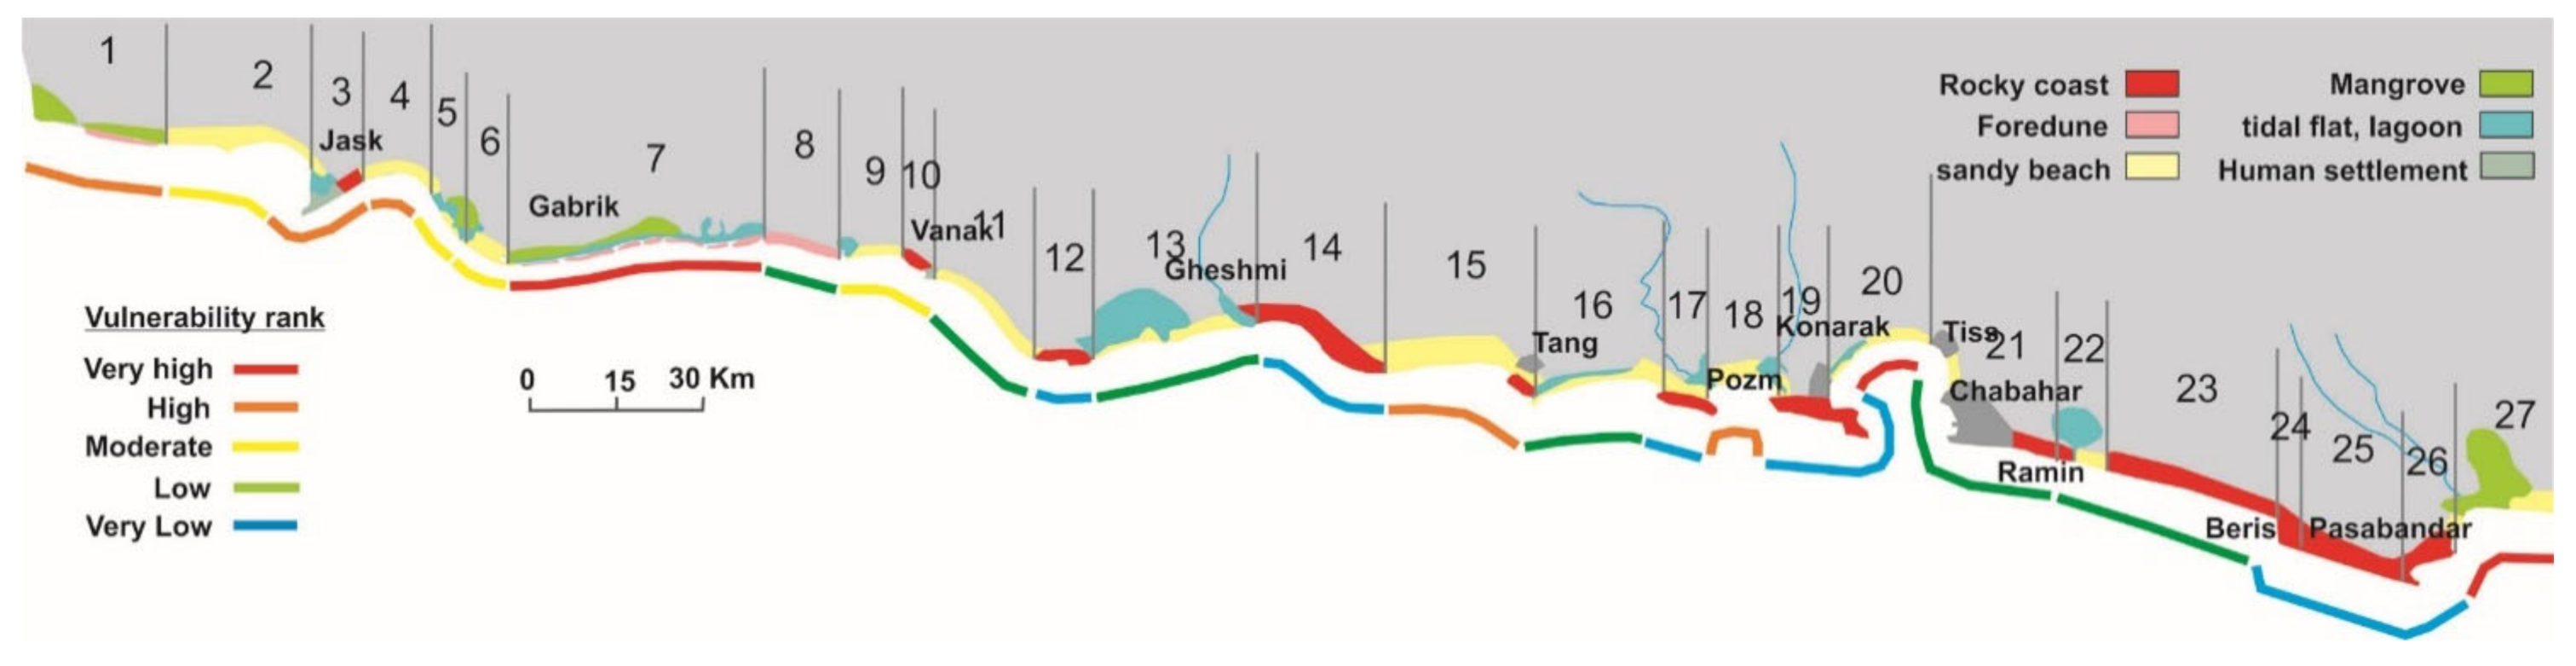
4.9. Overall Vulnerability of the Coast
5. Discussion
6. Conclusions
Author Contributions
Funding
Institutional Review Board Statement
Informed Consent Statement
Data Availability Statement
Conflicts of Interest
References
- De Pippo, T.; Donadio, C.; Pennetta, M.; Petrosino, C.; Terlizzi, F.; Valente, A. Coastal hazard assessment and mapping in Northern Campania, Italy. Geomorphology 2008, 97, 451–466. [Google Scholar] [CrossRef]
- Kunte, P.D.; Jauhari, N.; Mehrotra, U.; Kotha, M.; Hursthouse, A.; Gagnon, A.S. Multi-hazards coastal vulnerability assessment of Goa, India, using geospatial techniques. Ocean Coast. Manag. 2014, 95, 264–281. [Google Scholar] [CrossRef]
- Benassai, G.; Di Paola, G.; Aucelli, P.P.C. Coastal risk assessment of a micro-tidal littoral plain in response to sea level rise. Ocean Coast. Manag. 2015, 104, 22–35. [Google Scholar] [CrossRef]
- Pendleton, E.A.; Thieler, E.R.; Williams, S.J. Coastal Vulnerability Assessment of Golden Gate National Recreation Area to Sea-Level Rise; Open-File Report 2005-1058; USGS: Denver, CO, USA, 2005.
- Pendleton, E.; Barras, J.; Williams, S.; Twichell, D. Coastal Vulnerability Assessment of the Northern Gulf of Mexico to Sea-Level Rise and Coastal Change; Open-File Report 2010-1146; USGS: Denver, CO, USA, 2010.
- Field, C.B.; Barros, V.R.; Dokken, D.J.; Mach, K.J.; Mastrandrea, M.D.; Bilir, T.E.; Chatterjee, M.; Ebi, K.L.; Estrada, Y.O.; Genova, R.C.; et al. Intergovernmental Panel on Climate Change. Climate Change, Impacts, Adaptation, and Vulnerability. Part A: Global and Sectoral Aspects. Contribution of Working Group II to the Fifth Assessment Report of the Intergovernmental Panel on Climate Change; Cambridge University Press: Cambridge, UK; New York, NY, USA, 2014; p. 1132. [Google Scholar]
- Meehl, G.A.; Washington, W.M.; Collins, W.D.; Arblaster, J.M.; Hu, A.; Buja, L.E.; Strand, W.G.; Teng, H. How much more global warming and sea level rise? Science 2005, 307, 1769–1772. [Google Scholar] [CrossRef] [PubMed] [Green Version]
- Evan, A.T.; Camargo, S.J. A climatology of Arabian Sea cyclonic storms. J. Clim. 2011, 24, 140–158. [Google Scholar] [CrossRef] [Green Version]
- Murakami, H.; Vecchi, G.A.; Underwood, S. Increasing frequency of extremely severe cyclonic storms over the Arabian Sea. Nat. Clim. Chang. 2017, 7, 885–889. [Google Scholar] [CrossRef]
- Dwarakish, G.S.; Vinay, S.A.; Natesan, U.; Asano, T.; Kakinuma, T.; Venkataramana, K.; Pai, B.J.; Babita, M.K. Coastal vul-nerability assessment of the future sea level rise in Udupi coastal zone of Karnataka state, west coast of Indian Ocean. Coast. Manag. 2009, 52, 467–478. [Google Scholar]
- Gornitz, V.; Daniels, R.C.; White, T.W.; Birdwell, K.R. The development of a coastal risk assessment database: Vulnerability to sea-level rise in the US southeast. J. Coast. Res. 1994, 12, 327–338. [Google Scholar]
- Thieler, E.R.; Hammer-Klose, E.S. National Assessment of Coastal Vulnerability to Sea-Level Rise: Preliminary Results for the US Atlantic Coast; United States Geological Survey (USGS): Woods Hole, MA, USA, 1999.
- Gornitz, V. Global coastal hazards from future sea level rise. Glob. Planet. Chang. 1991, 3, 379–398. [Google Scholar] [CrossRef]
- Addo, K. Assessing coastal vulnerability index to climate change: The case of Accra e Ghana, Proceedings 12th International Coastal Symposium (Plymouth, England). J. Coast. Res. Spec. Issue 2013, 65, 1892–1897. [Google Scholar] [CrossRef]
- Koroglu, A.; Ranasinghe, R.; Jimenez, J.A.; Dastgheib, A. Comparison of Coastal Vulnerability Index applications for Barcelona Province. Ocean Coast. Manag. 2019, 178, 104799. [Google Scholar] [CrossRef]
- Normand, R.; Simpson, G.; Herman, F.; Biswas, R.H.; Bahroudi, A.; Schneider, B. Dating and morpho-stratigraphy of uplifted marine terraces in the Makran subduction zone (Iran). Earth Surf. Dyn. 2019, 7, 321–344. [Google Scholar] [CrossRef] [Green Version]
- Reyss, J.L.; Pirazzoli, P.A.; Haghipour, A.; Hatté, C.; Fontugne, M. Quaternary marine terraces and tectonic uplift rates on the south coast of Iran. Geol. Soc. Lond. Spéc. Publ. 1999, 146, 225–237. [Google Scholar] [CrossRef]
- Normand, R.; Simpson, G.; Bahroudi, A. Pleistocene Coastal Evolution in the Makran Subduction Zone. Front. Earth Sci. 2019, 7, 186. [Google Scholar] [CrossRef] [Green Version]
- Okal, E.A.; Synolakis, C.E. Far-field tsunami hazard from mega-thrust earthquakes in the Indian Ocean. Geophys. J. Int. 2008, 172, 995–1015. [Google Scholar] [CrossRef]
- Dibajnia, M.; Soltanpour, M.; Nairn, R.; Allahyar, M. Indian Ocean Tropical Cyclones and Climate Change; Charabi, Y., Ed.; Springer: Berlin/Heidelberg, Germany, 2010; 373p. [Google Scholar]
- Fritz, H.M.; Blount, C.D.; Albusaidi, F.B.; Al-Harthy, A.H.M. Cyclone Gonu storm surge in Oman. Estuarine Coast. Shelf Sci. 2010, 86, 102–106. [Google Scholar] [CrossRef]
- Goharnejad, H.; Shamsai, A.; Hosseini, S.A. Vulnerability assessment of southern coastal areas of Iran to sea level rise: Evaluation of climate change impact. Oceanologia 2013, 55, 611–637. [Google Scholar] [CrossRef] [Green Version]
- Mafi-Gholami, D.; Zenner, E.K.; Jaafari, A.; Bakhtyari, H.R.R.; Bui, D.T. Multi-hazards vulnerability assessment of southern coasts of Iran. J. Environ. Manag. 2019, 252, 109628. [Google Scholar] [CrossRef] [PubMed]
- Hadipour, V.; Vafaie, F.; Kerle, N. An indicator-based approach to assess social vulnerability of coastal areas to sea-level rise and flooding: A case study of Bandar Abbas city, Iran. Ocean Coast. Manag. 2019, 188, 105077. [Google Scholar] [CrossRef]
- Regard, V.; Bellier, O.; Thomas, J.-C.; Bourlès, D.; Bonnet, S.; Abbassi, M.R.; Braucher, R.; Mercier, J.; Shabanian, E.; Soleymani, S.; et al. Cumulative right-lateral fault slip rate across the Zagros-Makran transfer zone: Role of the Minab-Zendan fault system in accommodating Arabia-Eurasia convergence in southeast Iran. Geophys. J. Int. 2005, 162, 177–203. [Google Scholar] [CrossRef] [Green Version]
- Prins, M.; Postma, G.; Weltje, G. Controls on terrigenous sediment supply to the Arabian Sea during the late Quaternary: The Makran continental slope. Mar. Geol. 2000, 169, 351–371. [Google Scholar] [CrossRef]
- Haghipour, N.; Burg, J.-P.; Ivy-Ochs, S.; Hajdas, I.; Kubik, P.; Christl, M. Correlation of fluvial terraces and temporal steady-state incision on the onshore Makran accretionary wedge in southeastern Iran: Insight from channel profiles and 10Be exposure dating of strath terraces. GSA Bull. 2014, 127, 560–583. [Google Scholar] [CrossRef]
- Shah-Hosseini, M.; Ghanavati, E.; Morhange, C.; Beni, A.N.; Lahijani, H.A.; Hamzeh, M.A. The evolution of Chabahar beach ridge system in SE Iran in response to Holocene relative sea level changes. Geomorphology 2018, 318, 139–147. [Google Scholar] [CrossRef]
- Grando, G.; McClay, K. Morphotectonics domains and structural styles in the Makran accretionary prism, offshore Iran. Sediment. Geol. 2007, 196, 157–179. [Google Scholar] [CrossRef]
- Heidarzadeh, M.; Pirooz, M.D.; Zaker, N.H.; Yalciner, A.C.; Mokhtari, M.; Esmaeily, A. Historical tsunami in the Makran Subduction Zone off the southern coasts of Iran and Pakistan and results of numerical modeling. Ocean Eng. 2008, 35, 774–786. [Google Scholar] [CrossRef]
- Shah-Hosseini, M.; Morhange, C.; Beni, A.N.; Marriner, N.; Lahijani, H.; Hamzeh, M.A.; Sabatier, F. Coastal boulders as evidence for high-energy waves on the Iranian coast of Makran. Mar. Geol. 2011, 290, 17–28. [Google Scholar] [CrossRef]
- Page, W.D.; Alt, J.N.; Cluff, L.S.; Plafker, G. Evidence for the recurrence of large-magnitude earthquakes along the Makran coast of Iran and Pakistan. Tectonophysics 1979, 52, 533–547. [Google Scholar] [CrossRef]
- Von Rad, U.; Schaaf, M.; Michels, K.H.; Schulz, H.; Berger, W.H.; Sirocko, F. A 5000-year record of climatic change in varved sediments from the oxygen minimum zone off Pakistan, NE Arabian Sea. Quat. Res. 1999, 51, 39–53. [Google Scholar] [CrossRef]
- Von Rad, U.; Schulz, H.; Riech, V.; den Dulk, M.; Berner, U.; Sirocko, F. Multiple monsoon-controlled breakdown of oxy-gen-minimum conditions during the past 30,000 years documented in laminated sediments off Pakistan. Palaeogeogr. Palaeoclimatol. Palaeoecol. 1999, 152, 129–161. [Google Scholar] [CrossRef]
- Shaw, J.; Taylor, R.B.; Forbes, D.L.; Ruz, M.-H.; Solomon, S. Sensitivity of the Canadian Coast to Sea-Level Rise; Geological Survey of Canada: Ottawa, ON, USA, 1998. [Google Scholar]
- Thieler, E.R.; Hammer-Klose, E.S. National Assessment of Coastal Vulnerability to Sea-Level Rise: Preliminary Results for the U.S. Gulf of Mexico Coast; United States Geological Survey (USGS): Woods Hole, MA, USA, 2000.
- Thieler, E.R.; Hammer-Klose, E.S. National Assessment of Coastal Vulnerability to Sea-Level Rise: Preliminary Results for the U.S. Pacific Coast; United States Geological Survey (USGS): Woods Hole, MA, USA, 2000.
- Integrated Coastal Zone Management of Iran (ICZM). Ports and Maritime Organization of Iran. 2017. (In Persian). Available online: https://aquadocs.org/ (accessed on 1 March 2020).
- Doukakis, E. Coastal vulnerability and risk parameters. Eur. Water 2005, 11, 3–7. [Google Scholar]
- Gaki-Papanastassiou, K.; Karymbalis, E.; Poulos, S.E.; Seni, A.; Zouva, C. Coastal vulnerability assessment to sea-level rise based on geomorphological and oceanographical parameters: The case of Argolikos Gulf, Peloponnese, Greece. Hell. J. Geosci. 2010, 45, 109–121. [Google Scholar]
- Gorokhovich, Y.; Leiserowitz, A.; Dugan, D. Integrating coastal vulnerability and community-based subsistence resource mapping in Northwest Alaska. J. Coast. Res. 2014, 293, 158–169. [Google Scholar]
- Lopez, R.M.; Ranasinghe, R.; Jiménez, J.A. A rapid, low-cost approach to coastal vulnerability assessment at a national level. J. Coast. Res 2016, 32, 932–945. [Google Scholar] [CrossRef]
- Saket, A.; Etemad-Shahidi, A. Wave energy potential along the northern coasts of the Gulf of Oman, Iran. Renew. Energy 2012, 40, 90–97. [Google Scholar] [CrossRef] [Green Version]
- Church, J.A.; White, N.J.; Hunter, J.R. Sea-level rise at tropical Pacific and Indian Ocean islands. Glob. Planet. Chang. 2006, 53, 155–168. [Google Scholar] [CrossRef]
- Sweet, W.V.; Kopp, R.E.; Weaver, C.P.; Obeysekera, T.; Horton, R.M.; Thieler, E.R.; Zervas, C. Global and Regional Sea Level Rise Scenarios for the United States; NOAA Technical Report NOS CO-OPS 083; National Oceanic and Atmospheric Administration; National Ocean Service: Silver Spring, MD, USA, 2017; 75p.
- Climate Change, the Scientific Basis. Contribution of Working Group I to the Third Assessment Report of the Intergovernmental Panel on Climate Change (TAR-IPCC); Cambridge University Press: Cambridge, UK, 2001.
- Milne, G.A.; Gehrels, W.R.; Hughes, C.W.; Tamisiea, M.E. Identifying the causes of sea-level change. Nat. Geosci. 2009, 2, 471–478. [Google Scholar] [CrossRef] [Green Version]
- Gilman, E.; Ellison, J.; Jungblat, V.; Van Lavieren, H.; Wilson, L.; Areki, F.; Brighouse, G.; Bungitak, J.; Dus, E.; Henry, M.; et al. Adapting to Pacific Island mangrove responses to sea level rise and other climate change effects. Clim. Res. 2006, 32, 161–176. [Google Scholar] [CrossRef]
- Kumar, T.S.; Mahendra, R.S.; Nayak, S.; Radhakrishnan, K.; Sahu, K.C. Coastal Vulnerability Assessment for Orissa State, East Coast of India. J. Coast. Res. 2010, 263, 523–534. [Google Scholar] [CrossRef]
- McLaughlin, S.; Cooper, J.A.G. A multi-scale coastal vulnerability index: A tool for coastal managers? Environ. Hazards 2010, 9, 233–248. [Google Scholar] [CrossRef]
- Di Paola, G.; Iglesias, J.; Rodríguez, G.; Benassai, G.; Aucelli, P.P.C.; Pappone, G. Estimating Coastal Vulnerability in a Meso-Tidal Beach by Means of Quantitative and Semi-Quantitative Methodologies. J. Coast. Res. 2011, 61, 303–308. [Google Scholar] [CrossRef]
- Gharibreza, M. Evolutionary trend of paleoshorelines in the Coastal Makran zone (Southeast Iran) since the mid-Holocene. Quat. Int. 2016, 392, 203–212. [Google Scholar] [CrossRef]


| Risk Variable | Source of Data | Period |
|---|---|---|
| Coastal slope | Coastal profiles from Iran’s integrated coastal zone management. | 2014 |
| Coastal elevation | SRTM-DEM (90 m) | 2018 |
| Tidal range | Iran’s ports and maritime organization data center | 2018 |
| Mean significant wave height | Iran’s ports and maritime organization data center | 2018 |
| Shoreline change | Landsat-8 (2017), Landsat-5 (1987) | 1987–2017 |
| Relative sea level changes | Indian Ocean tide gauge stations, TOPEX/Poseidon satellite altimeter | Since 1950 |
| Geomorphology and environment | Landsat-8, field observations | 2018 |
| Population density | National statistical center of Iran | 2017 |
| Risk Variable | Coastal Vulnerability Rank | ||||
|---|---|---|---|---|---|
| Very Low (1) | Low (2) | Moderate (3) | High (4) | Very High (5) | |
| Coastal slope (%) | >1.2 | 0.9 to 1.2 | 0.6 to 0.9 | 0.3 to 0.6 | <0.3 |
| Regional Coastal Elevation (m) | >10 | 10 to 7 | 7 to 4 | 4 to 1 | <1 |
| Mean tide range (m) | >1 | 1 to 2 | 2.0 to 4.0 | 4.0 to 6.0 | >6 |
| Mean significant wave height (m) | <0.5 | 0.5 to 1 | 1 to 2 | 2 to 3 | >3 |
| Shoreline change (m/y) + (accretion)–(retraction) | >1 | 1 to 0.5 | 0.5 to 0 | 0 to −0.5 | <−1 |
| Relative sea level changes (mm/y) | ≤0 | 0 to 3 | 3 to 6 | 6 to 9 | > 9 |
| Socioeconomic factors Population Density (people/Km2) | PD ≤ 1500 No infrastructure | PD 1500–3000 Small fishing harbor | PD 3000–4500 Medium fishing harbor | PD 4500–6000 Town/small port | PD ≥ 6000 Main port |
| Geomorphological and environmental sensibility | Rocky coasts above 10 m | Rocky coast 3 to 10 m | Foredune higher than 3 m | Beaches | Tidal flats, mangroves, lagoon |
| Coastal Segment No. | Risk Variables | |||||||
|---|---|---|---|---|---|---|---|---|
| Coastal Slope | Regional Coastal Elevation | Mean Tidal Range | Mean Significant Wave Height | Rate of Shoreline Change | Relative Sea Level Change | Environmental Sensitivity | Socioeconomic Sensibility | |
| 1 | 4 | 4 | 3 | 3 | 3 | 2 | 5 | 2 |
| 2 | 5 | 4 | 3 | 3 | 3 | 2 | 3 | 2 |
| 3 | 3 | 3 | 3 | 3 | 5 | 2 | 3 | 5 |
| 4 | 4 | 3 | 3 | 3 | 3 | 2 | 4 | 2 |
| 5 | 2 | 4 | 3 | 3 | 3 | 2 | 5 | 2 |
| 6 | 2 | 4 | 3 | 3 | 3 | 2 | 4 | 2 |
| 7 | 4 | 4 | 3 | 3 | 5 | 2 | 5 | 2 |
| 8 | 4 | 4 | 3 | 3 | 3 | 2 | 3 | 1 |
| 9 | 4 | 4 | 3 | 3 | 3 | 2 | 4 | 2 |
| 10 | 4 | 3 | 3 | 3 | 3 | 2 | 3 | 3 |
| 11 | 3 | 3 | 3 | 3 | 3 | 2 | 3 | 1 |
| 12 | 3 | 1 | 3 | 3 | 3 | 2 | 1 | 3 |
| 13 | 3 | 3 | 3 | 3 | 3 | 2 | 5 | 1 |
| 14 | 3 | 1 | 3 | 3 | 3 | 2 | 1 | 2 |
| 15 | 3 | 3 | 3 | 3 | 3 | 2 | 4 | 4 |
| 16 | 3 | 3 | 3 | 3 | 3 | 2 | 4 | 1 |
| 17 | 3 | 1 | 3 | 3 | 3 | 2 | 1 | 2 |
| 18 | 5 | 3 | 3 | 3 | 3 | 2 | 4 | 4 |
| 19 | 3 | 1 | 3 | 3 | 3 | 2 | 1 | 4 |
| 20 | 5 | 3 | 3 | 3 | 3 | 2 | 4 | 5 |
| 21 | 3 | 1 | 3 | 3 | 3 | 2 | 2 | 5 |
| 22 | 3 | 2 | 3 | 3 | 3 | 2 | 3 | 2 |
| 23 | 3 | 2 | 3 | 3 | 3 | 2 | 2 | 2 |
| 24 | 3 | 1 | 3 | 3 | 3 | 2 | 1 | 4 |
| 25 | 3 | 1 | 3 | 3 | 3 | 2 | 1 | 2 |
| 26 | 3 | 1 | 3 | 3 | 3 | 2 | 1 | 4 |
| 27 | 5 | 4 | 3 | 3 | 3 | 2 | 5 | 5 |
| Coastal Section No. | CVI | CVI Ranking |
|---|---|---|
| 1 | 32.9 | High |
| 2 | 28.5 | Moderate |
| 3 | 39.0 | High |
| 4 | 36.0 | High |
| 5 | 23.2 | Moderate |
| 6 | 20.8 | Moderate |
| 7 | 42.4 | Very High |
| 8 | 18.0 | Low |
| 9 | 29.4 | Moderate |
| 10 | 27.0 | Moderate |
| 11 | 13.5 | low |
| 12 | 7.8 | Very low |
| 13 | 17.4 | Low |
| 14 | 6.4 | Very low |
| 15 | 31.2 | High |
| 16 | 15.6 | Low |
| 17 | 6.4 | Very low |
| 18 | 40.2 | High |
| 19 | 9.0 | Very low |
| 20 | 45.0 | Very High |
| 21 | 14.2 | Low |
| 22 | 15.6 | Low |
| 23 | 12.7 | Low |
| 24 | 9.0 | Very low |
| 25 | 6.4 | Very low |
| 26 | 9.0 | Very low |
| 27 | 52.0 | Very High |
Publisher’s Note: MDPI stays neutral with regard to jurisdictional claims in published maps and institutional affiliations. |
© 2021 by the authors. Licensee MDPI, Basel, Switzerland. This article is an open access article distributed under the terms and conditions of the Creative Commons Attribution (CC BY) license (https://creativecommons.org/licenses/by/4.0/).
Share and Cite
Ghanavati, E.; Shah-Hosseini, M.; Marriner, N. Analysis of the Makran Coastline of Iran’s Vulnerability to Global Sea-Level Rise. J. Mar. Sci. Eng. 2021, 9, 891. https://doi.org/10.3390/jmse9080891
Ghanavati E, Shah-Hosseini M, Marriner N. Analysis of the Makran Coastline of Iran’s Vulnerability to Global Sea-Level Rise. Journal of Marine Science and Engineering. 2021; 9(8):891. https://doi.org/10.3390/jmse9080891
Chicago/Turabian StyleGhanavati, Ezatollah, Majid Shah-Hosseini, and Nick Marriner. 2021. "Analysis of the Makran Coastline of Iran’s Vulnerability to Global Sea-Level Rise" Journal of Marine Science and Engineering 9, no. 8: 891. https://doi.org/10.3390/jmse9080891