
Effects of Notches and Defects on Dwell Fatigue Mechanism and Fatigue Life of Ti-6Al-4V ELI Alloy Used in Deep-Sea Submersibles


Abstract
:1. Introduction
2. Materials and Methods
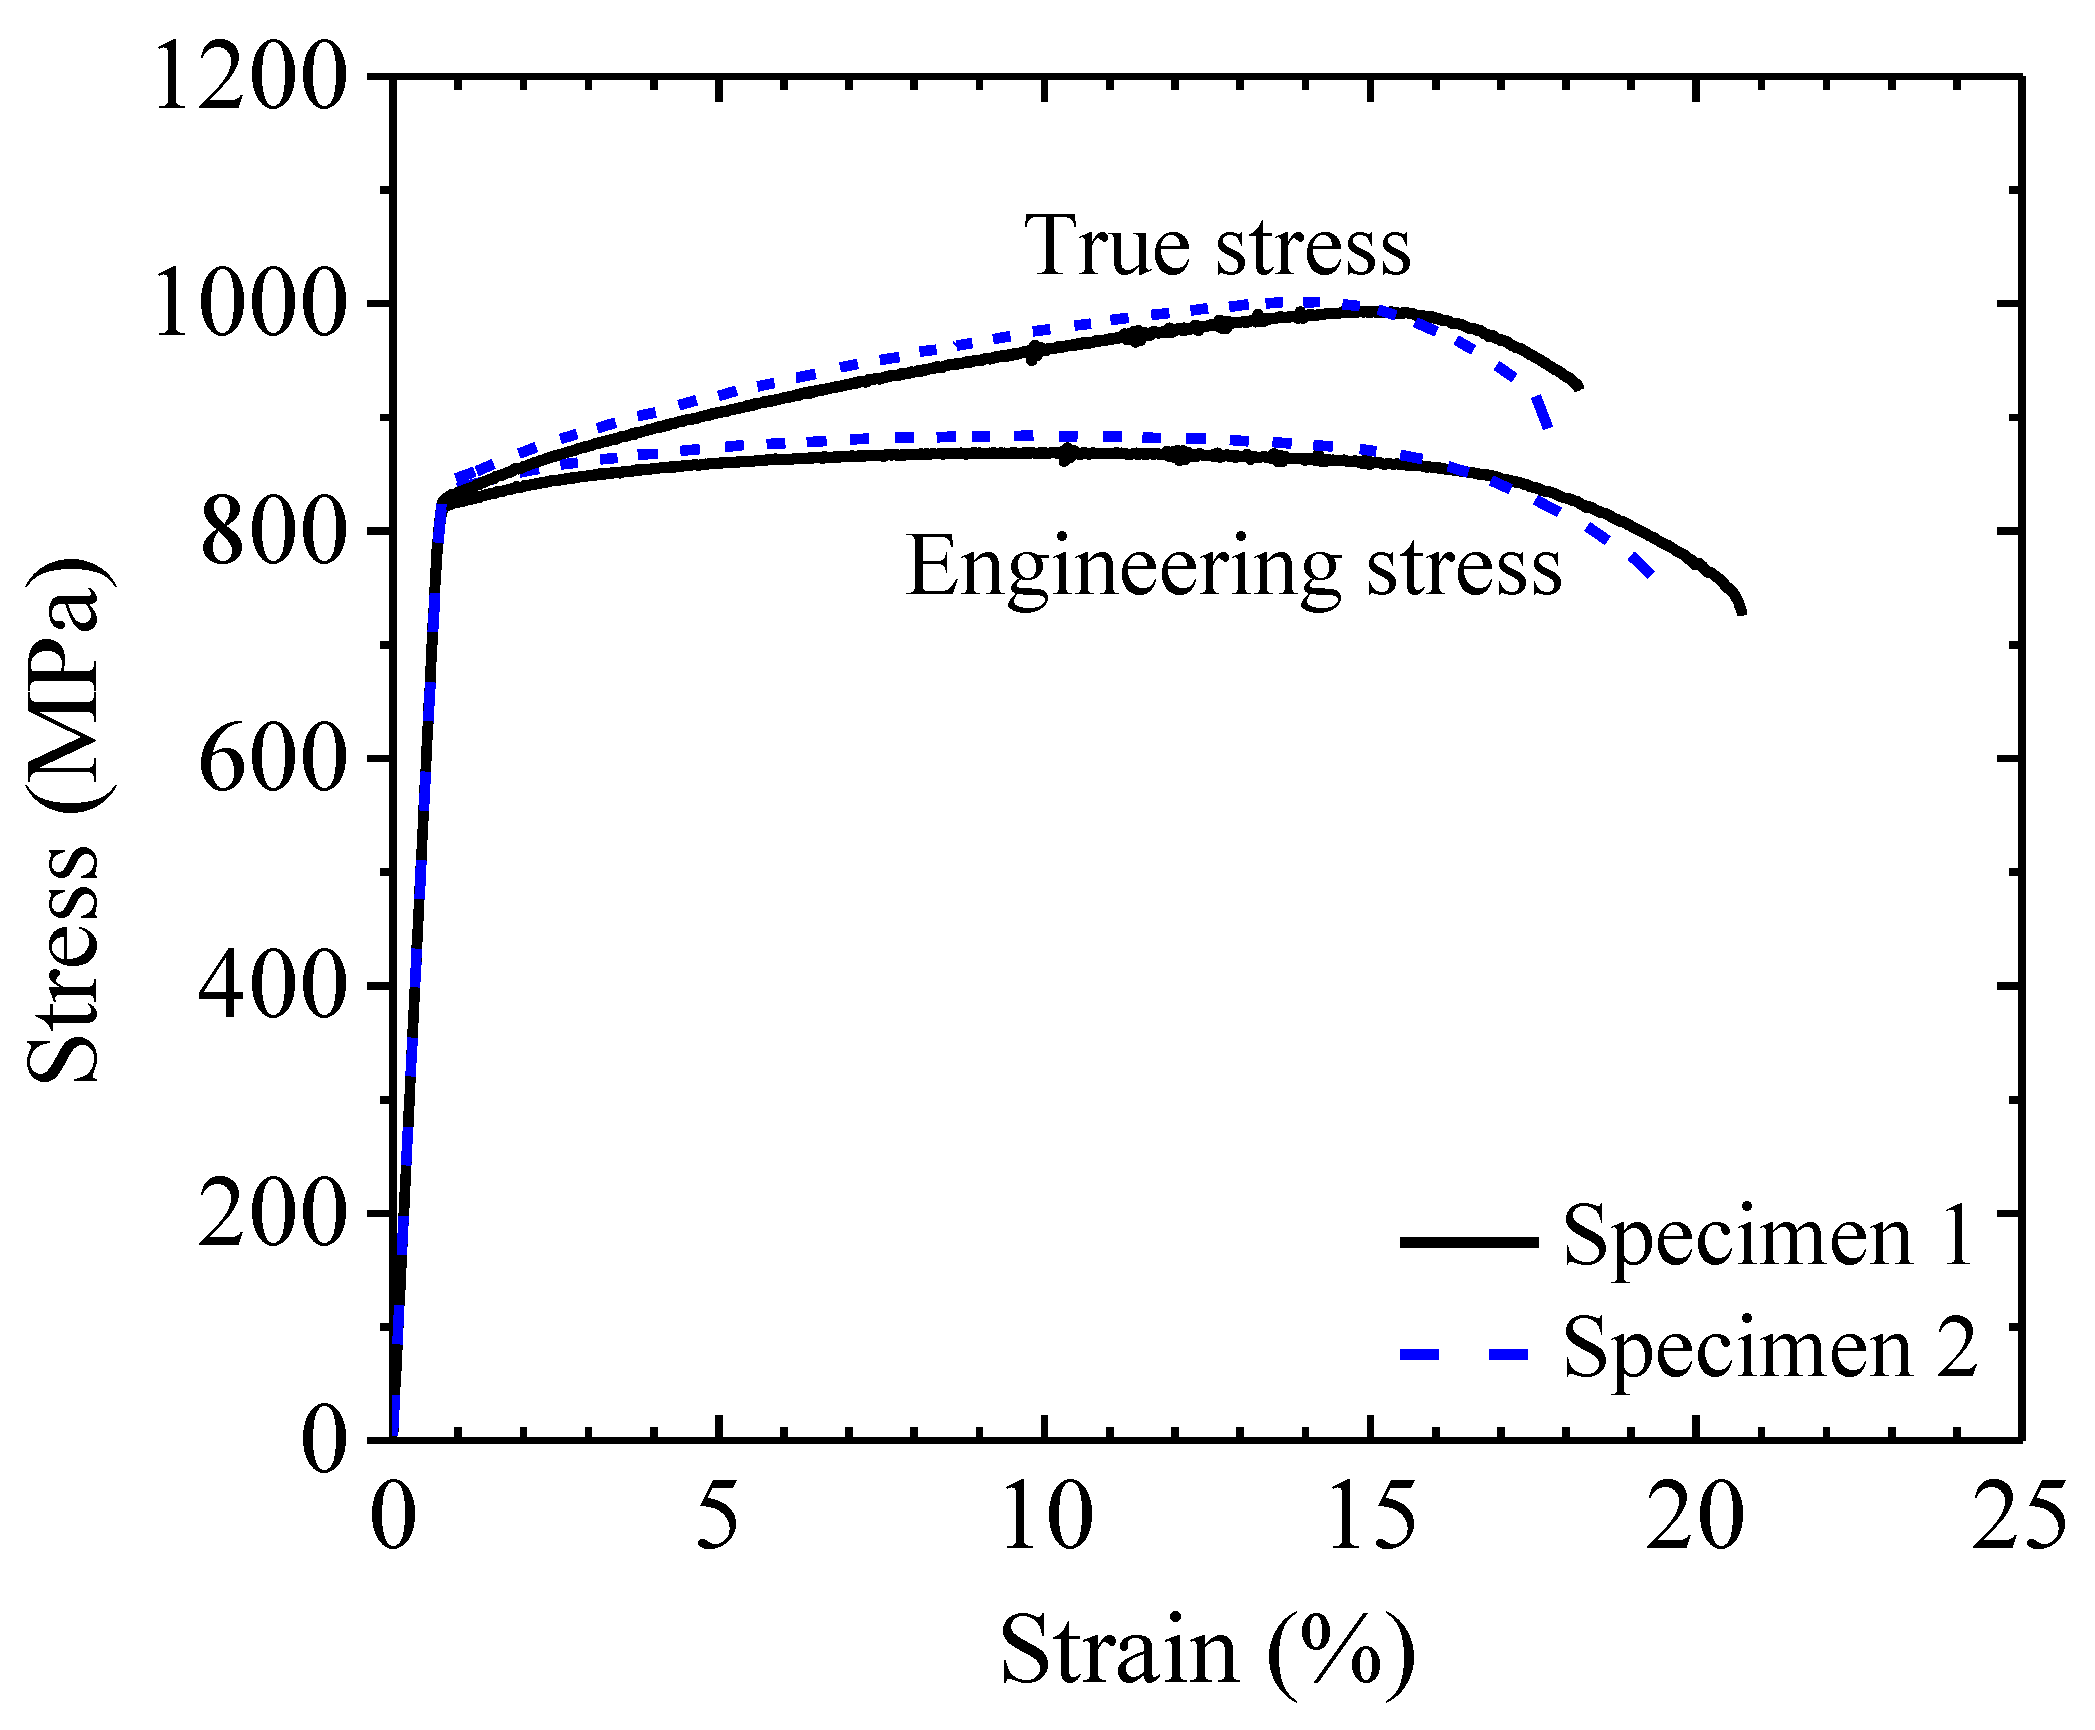
2.1. Materials
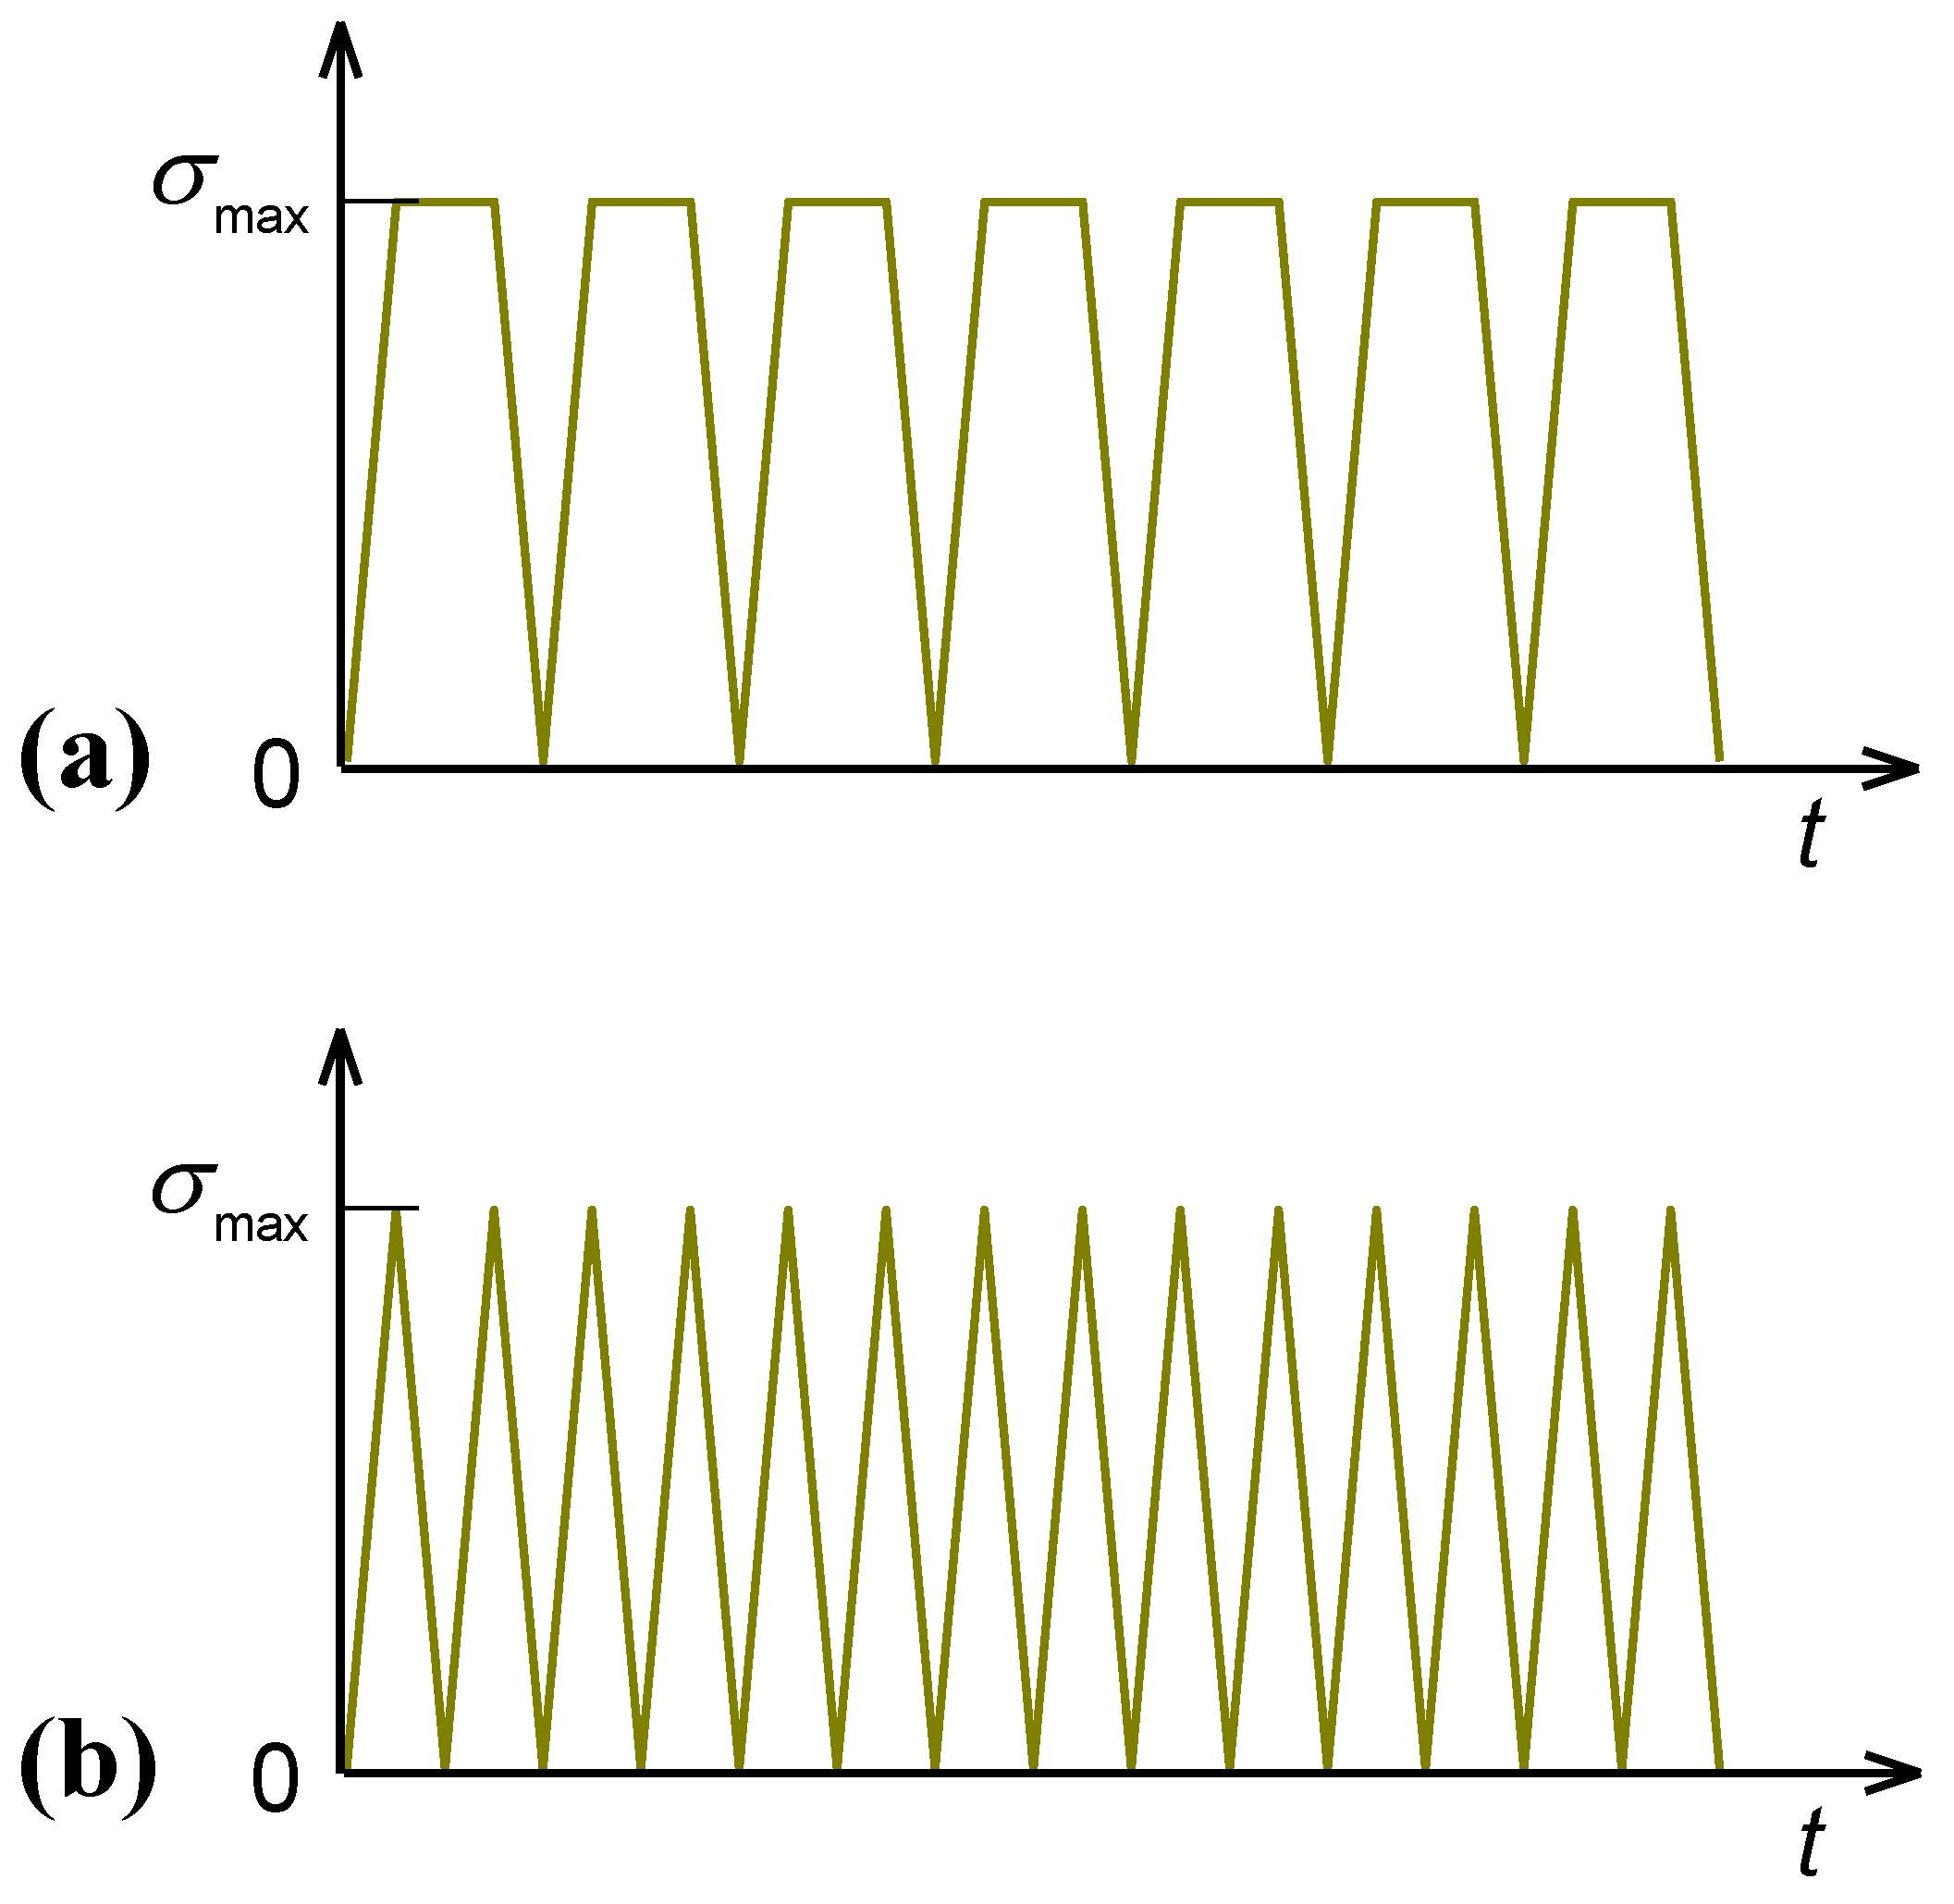
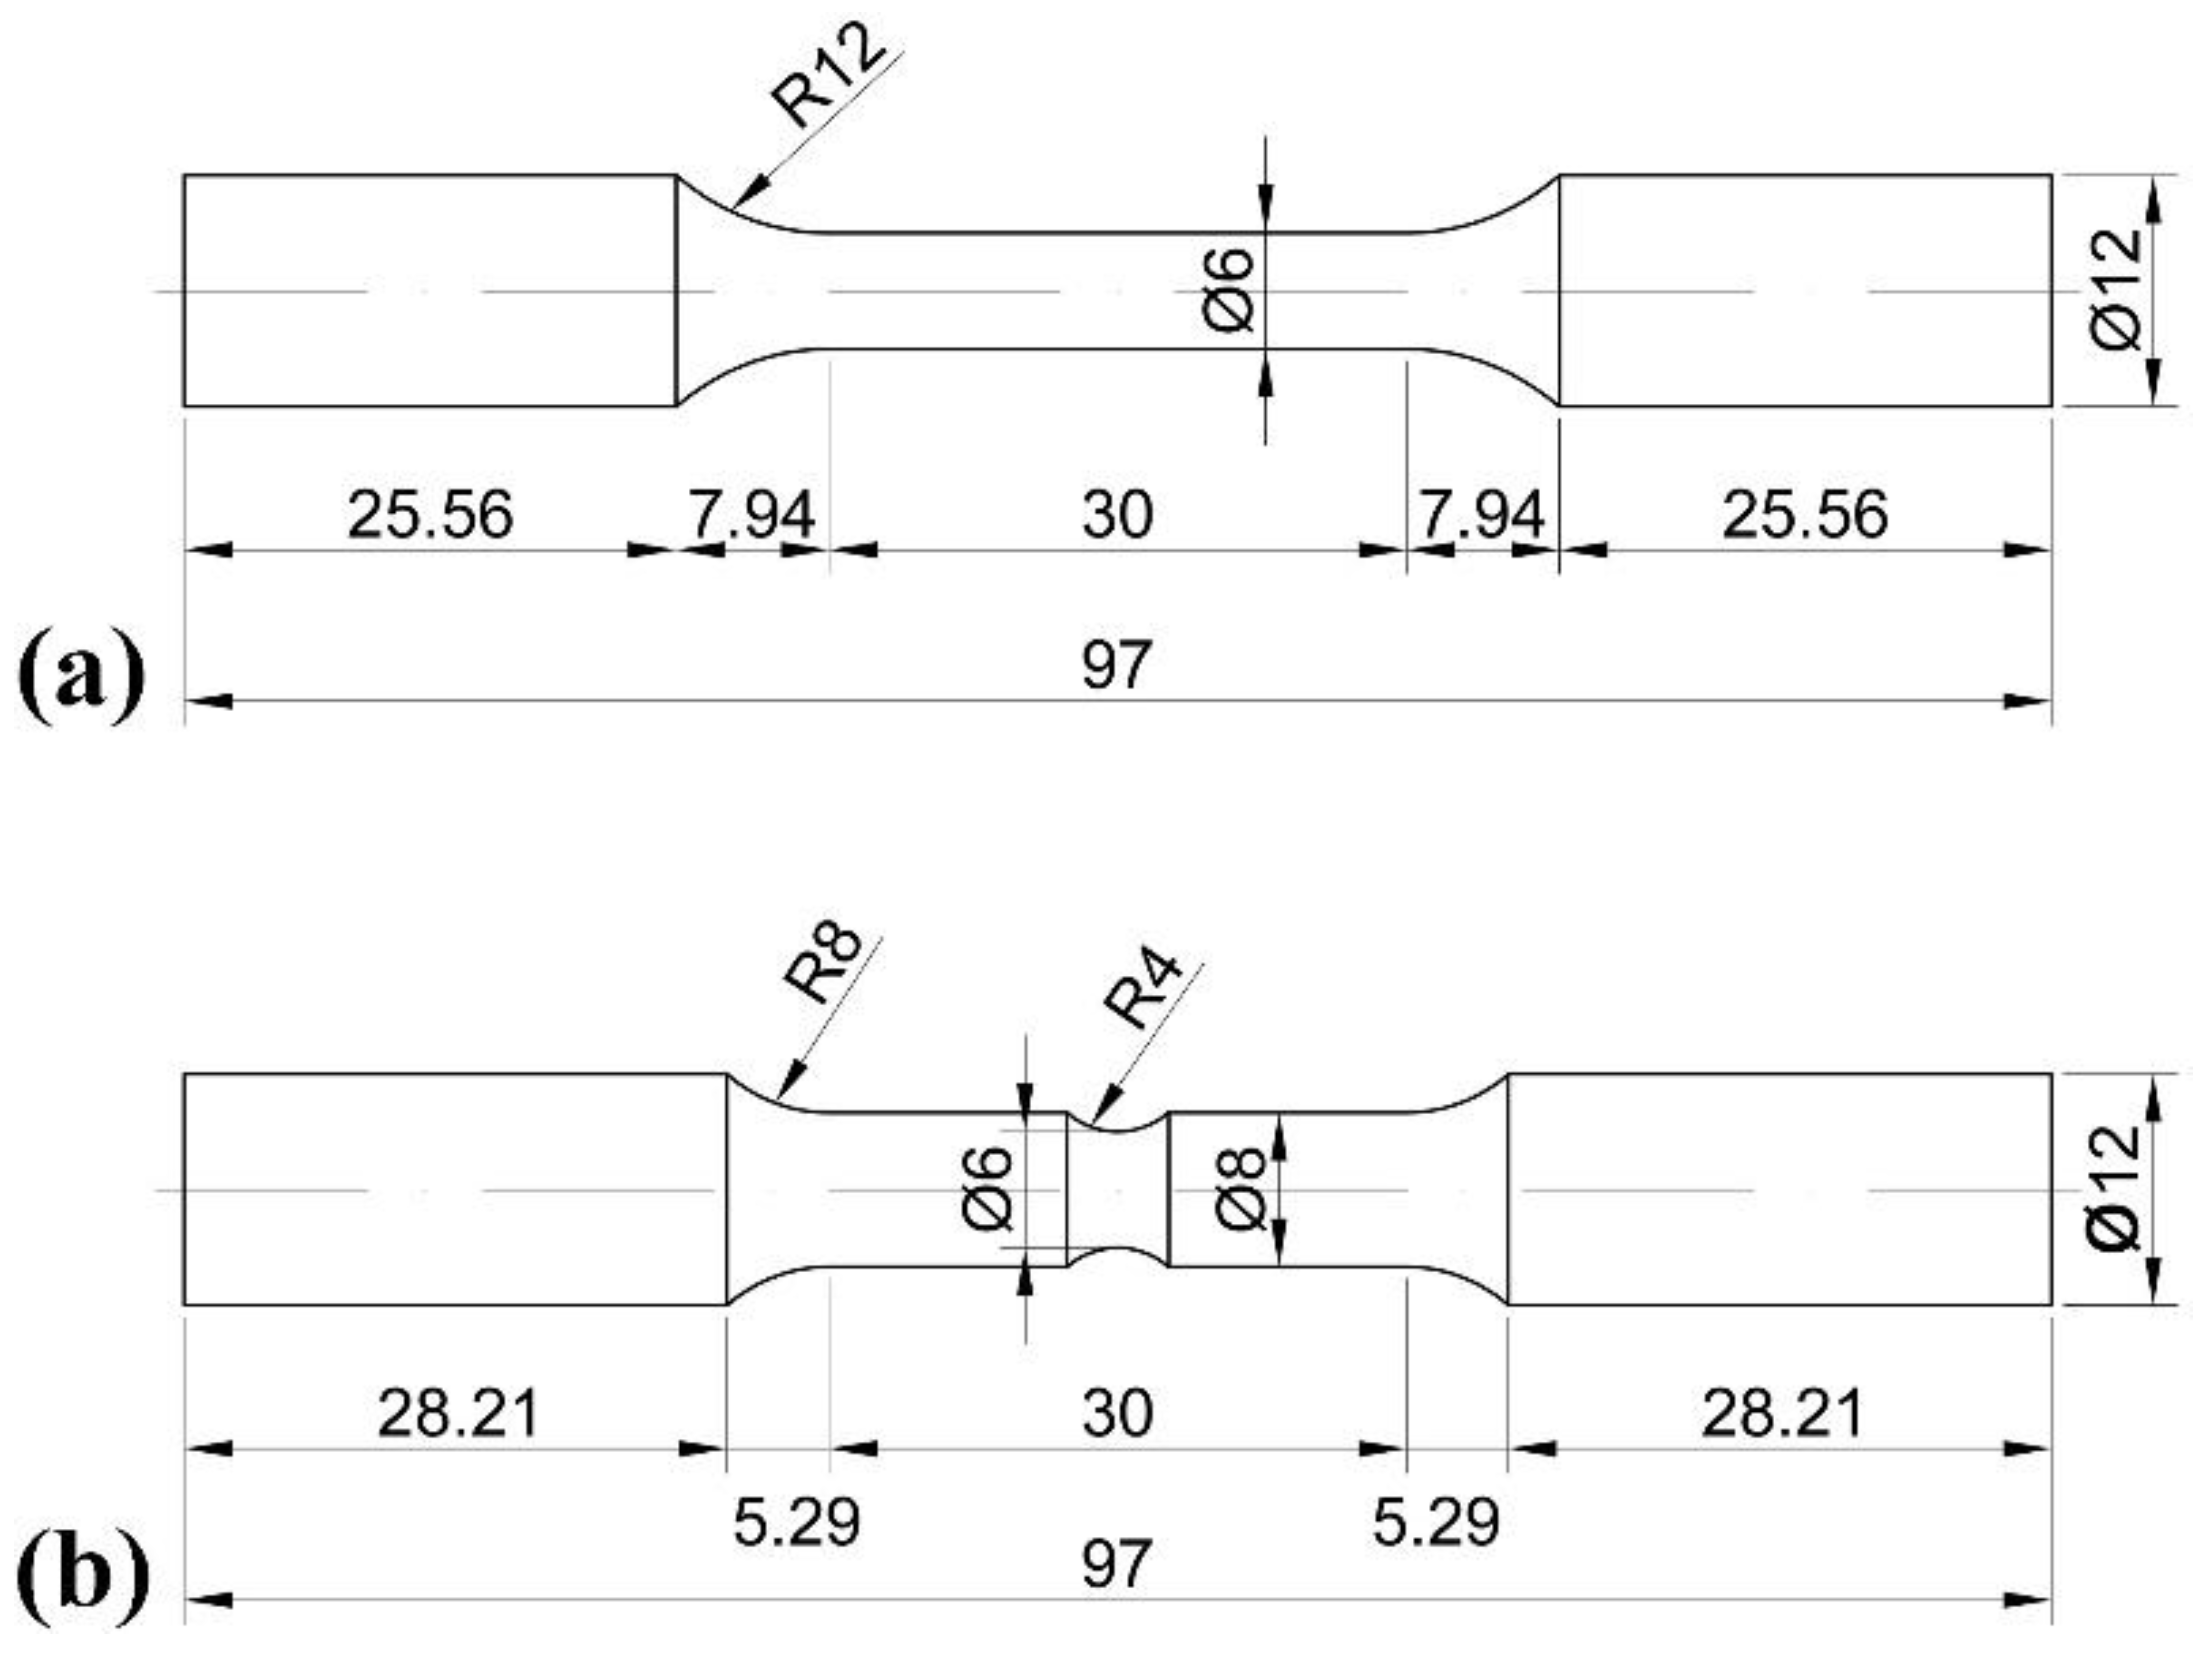
2.2. Test Methods
2.3. Observation Methods
3. Experimental Results and Analyses
3.1. Fatigue Performance of Tested Specimens
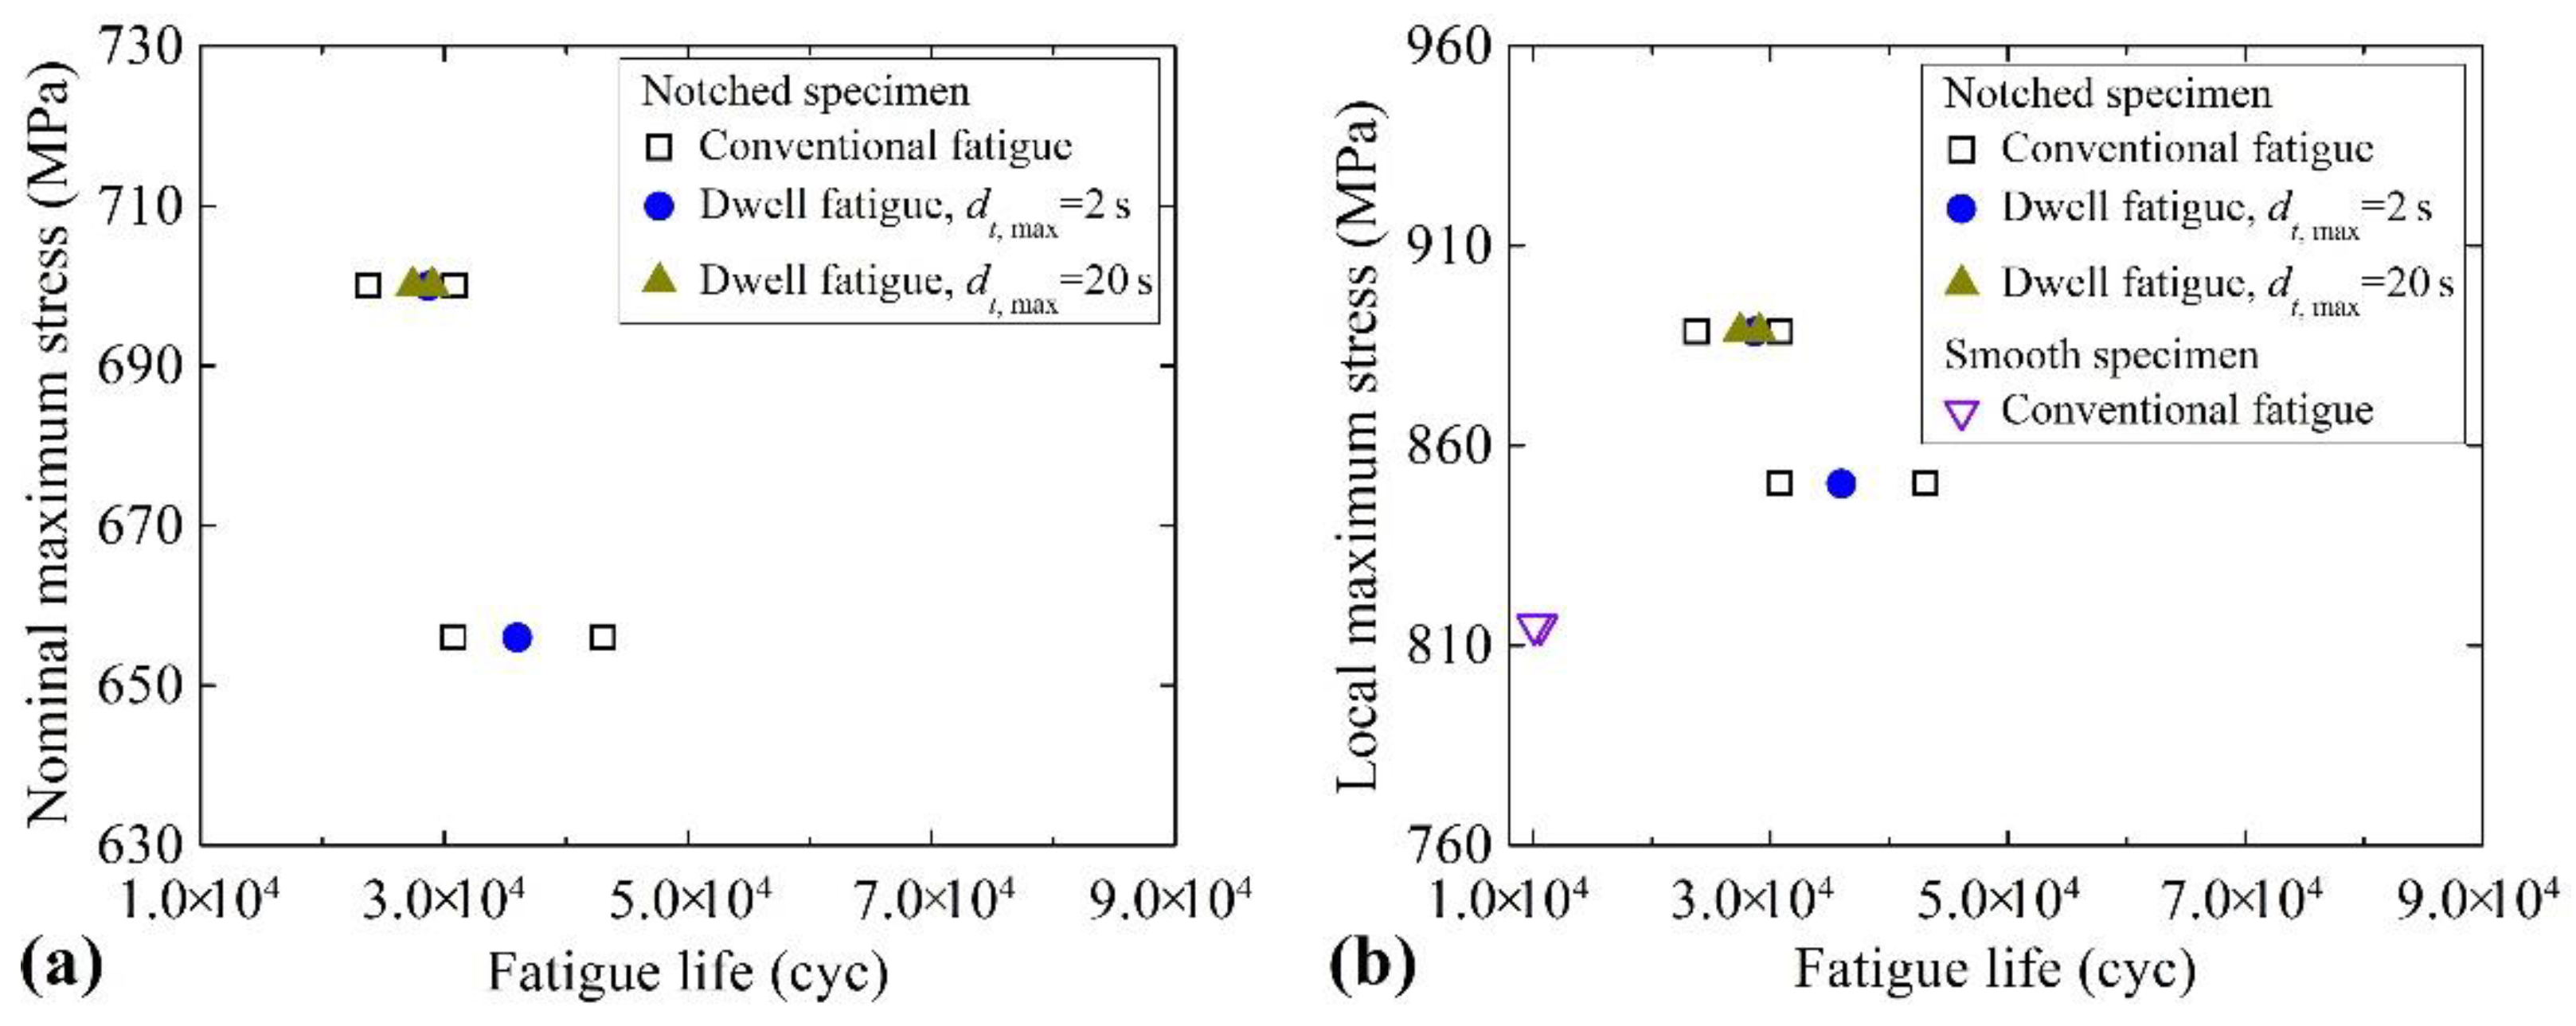
3.1.1. S-N Data of Notched Specimens
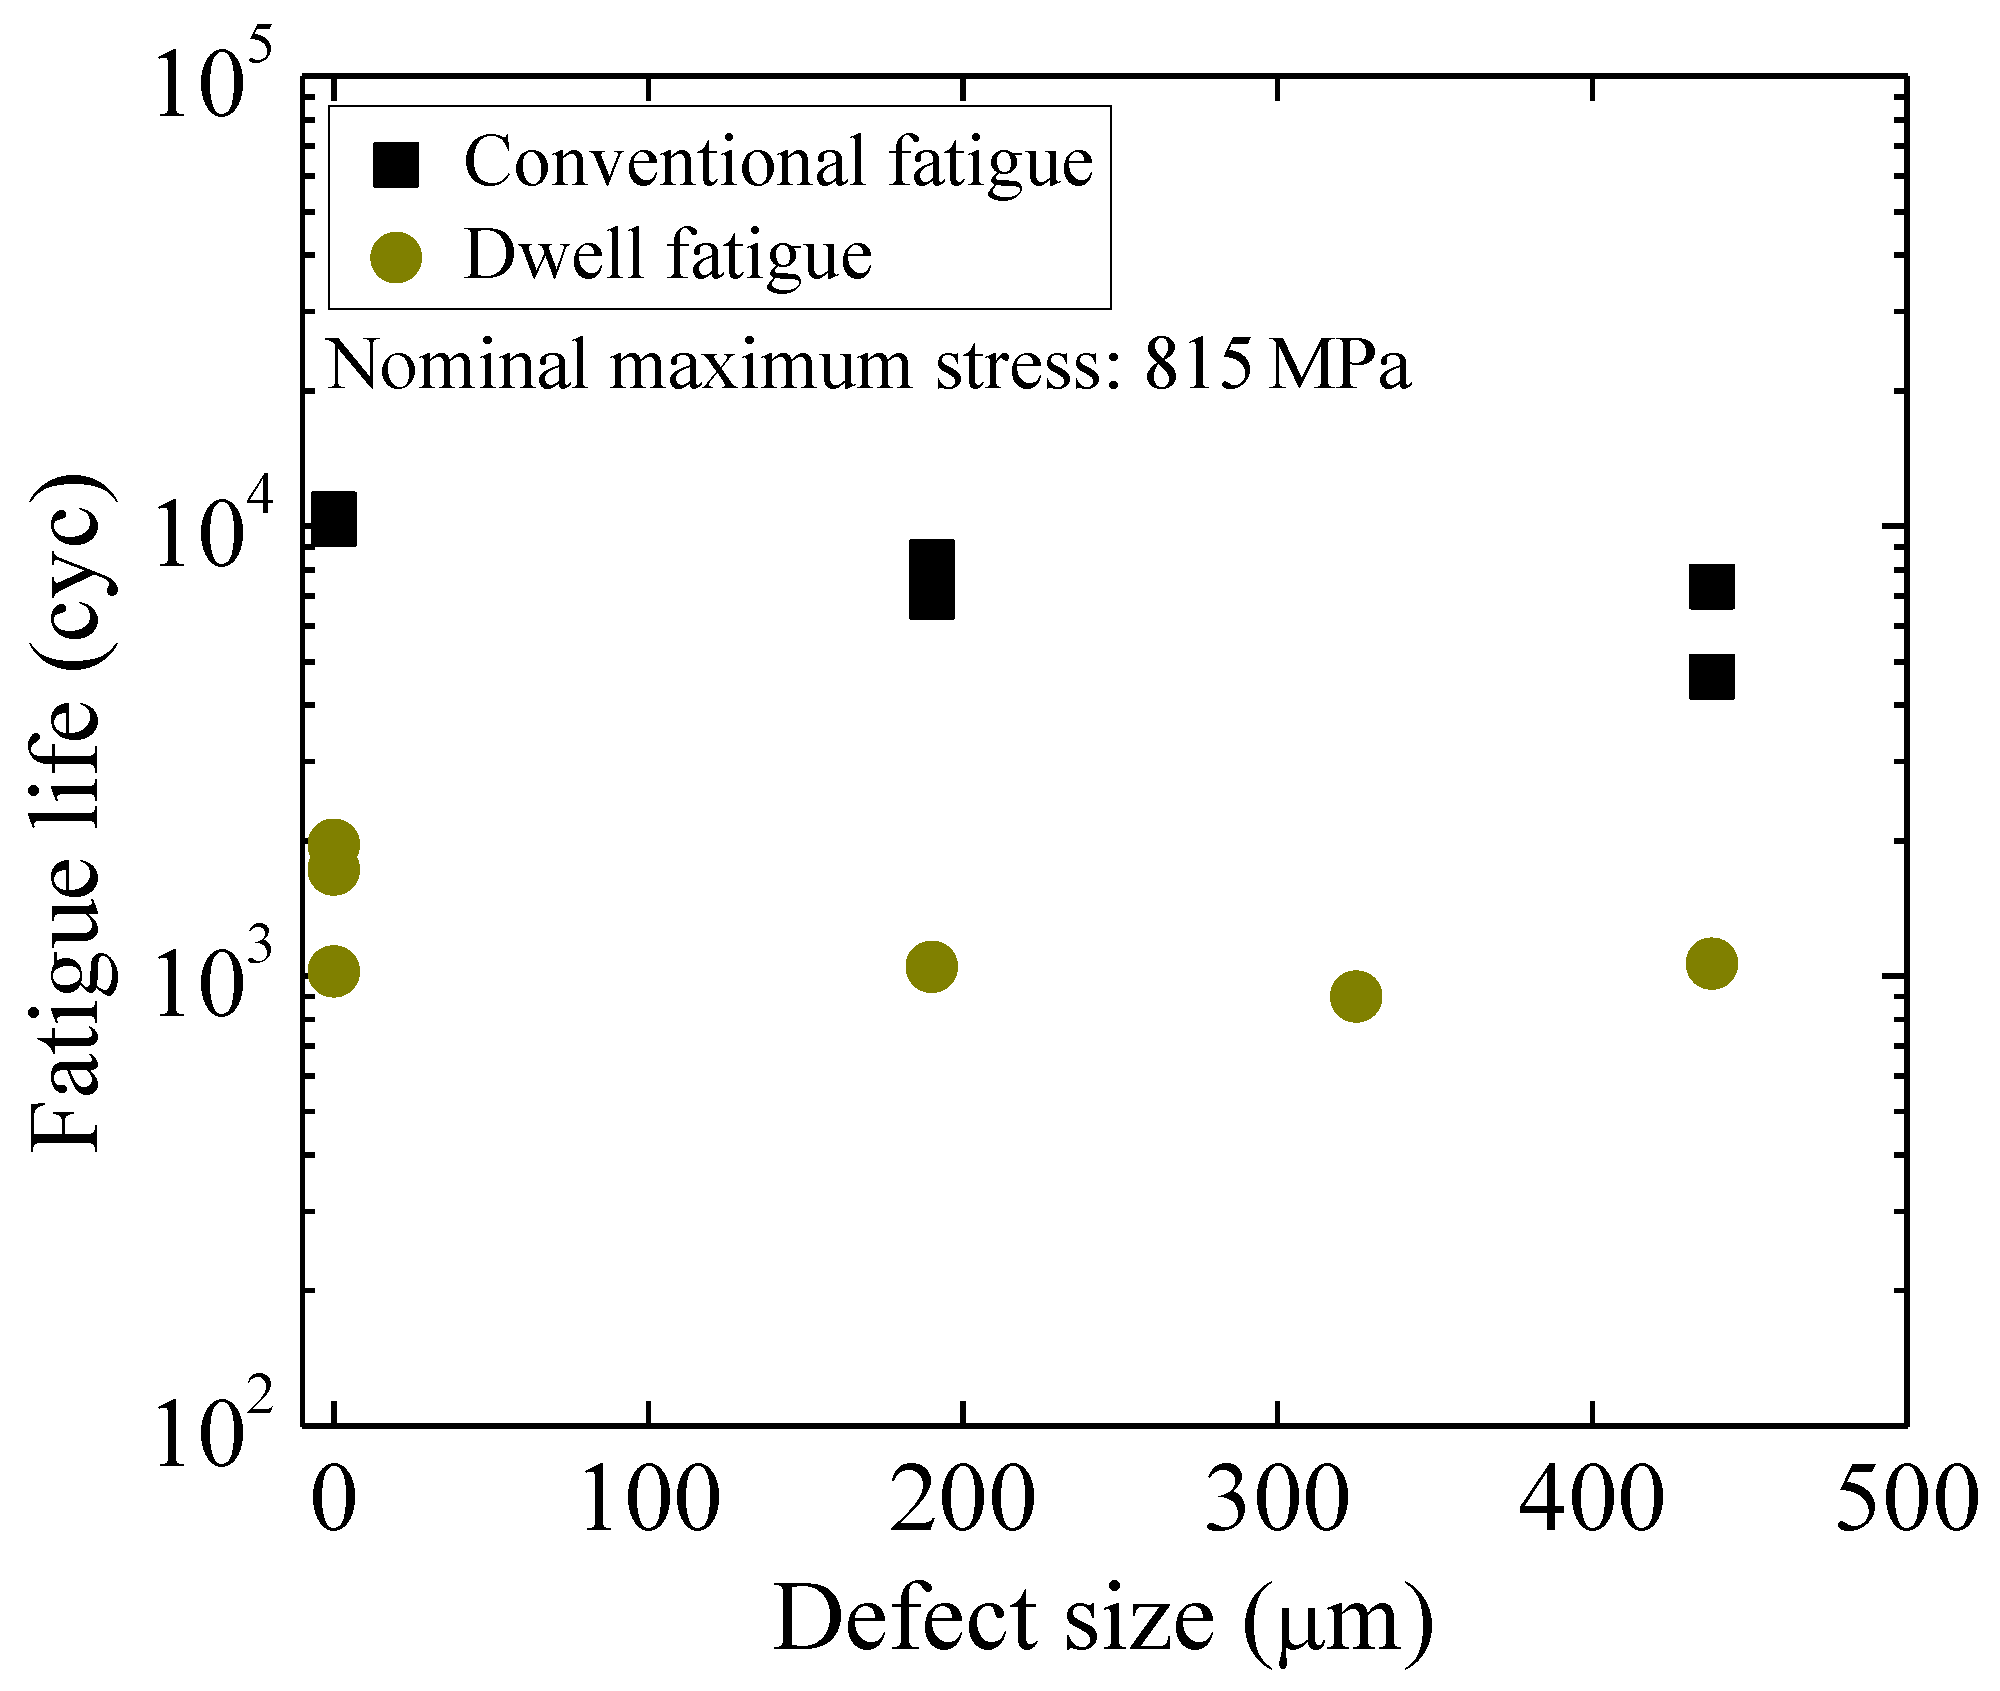
3.1.2. Fatigue Life Data of Defective Specimens
3.2. Fatigue Fracture Surface Observation
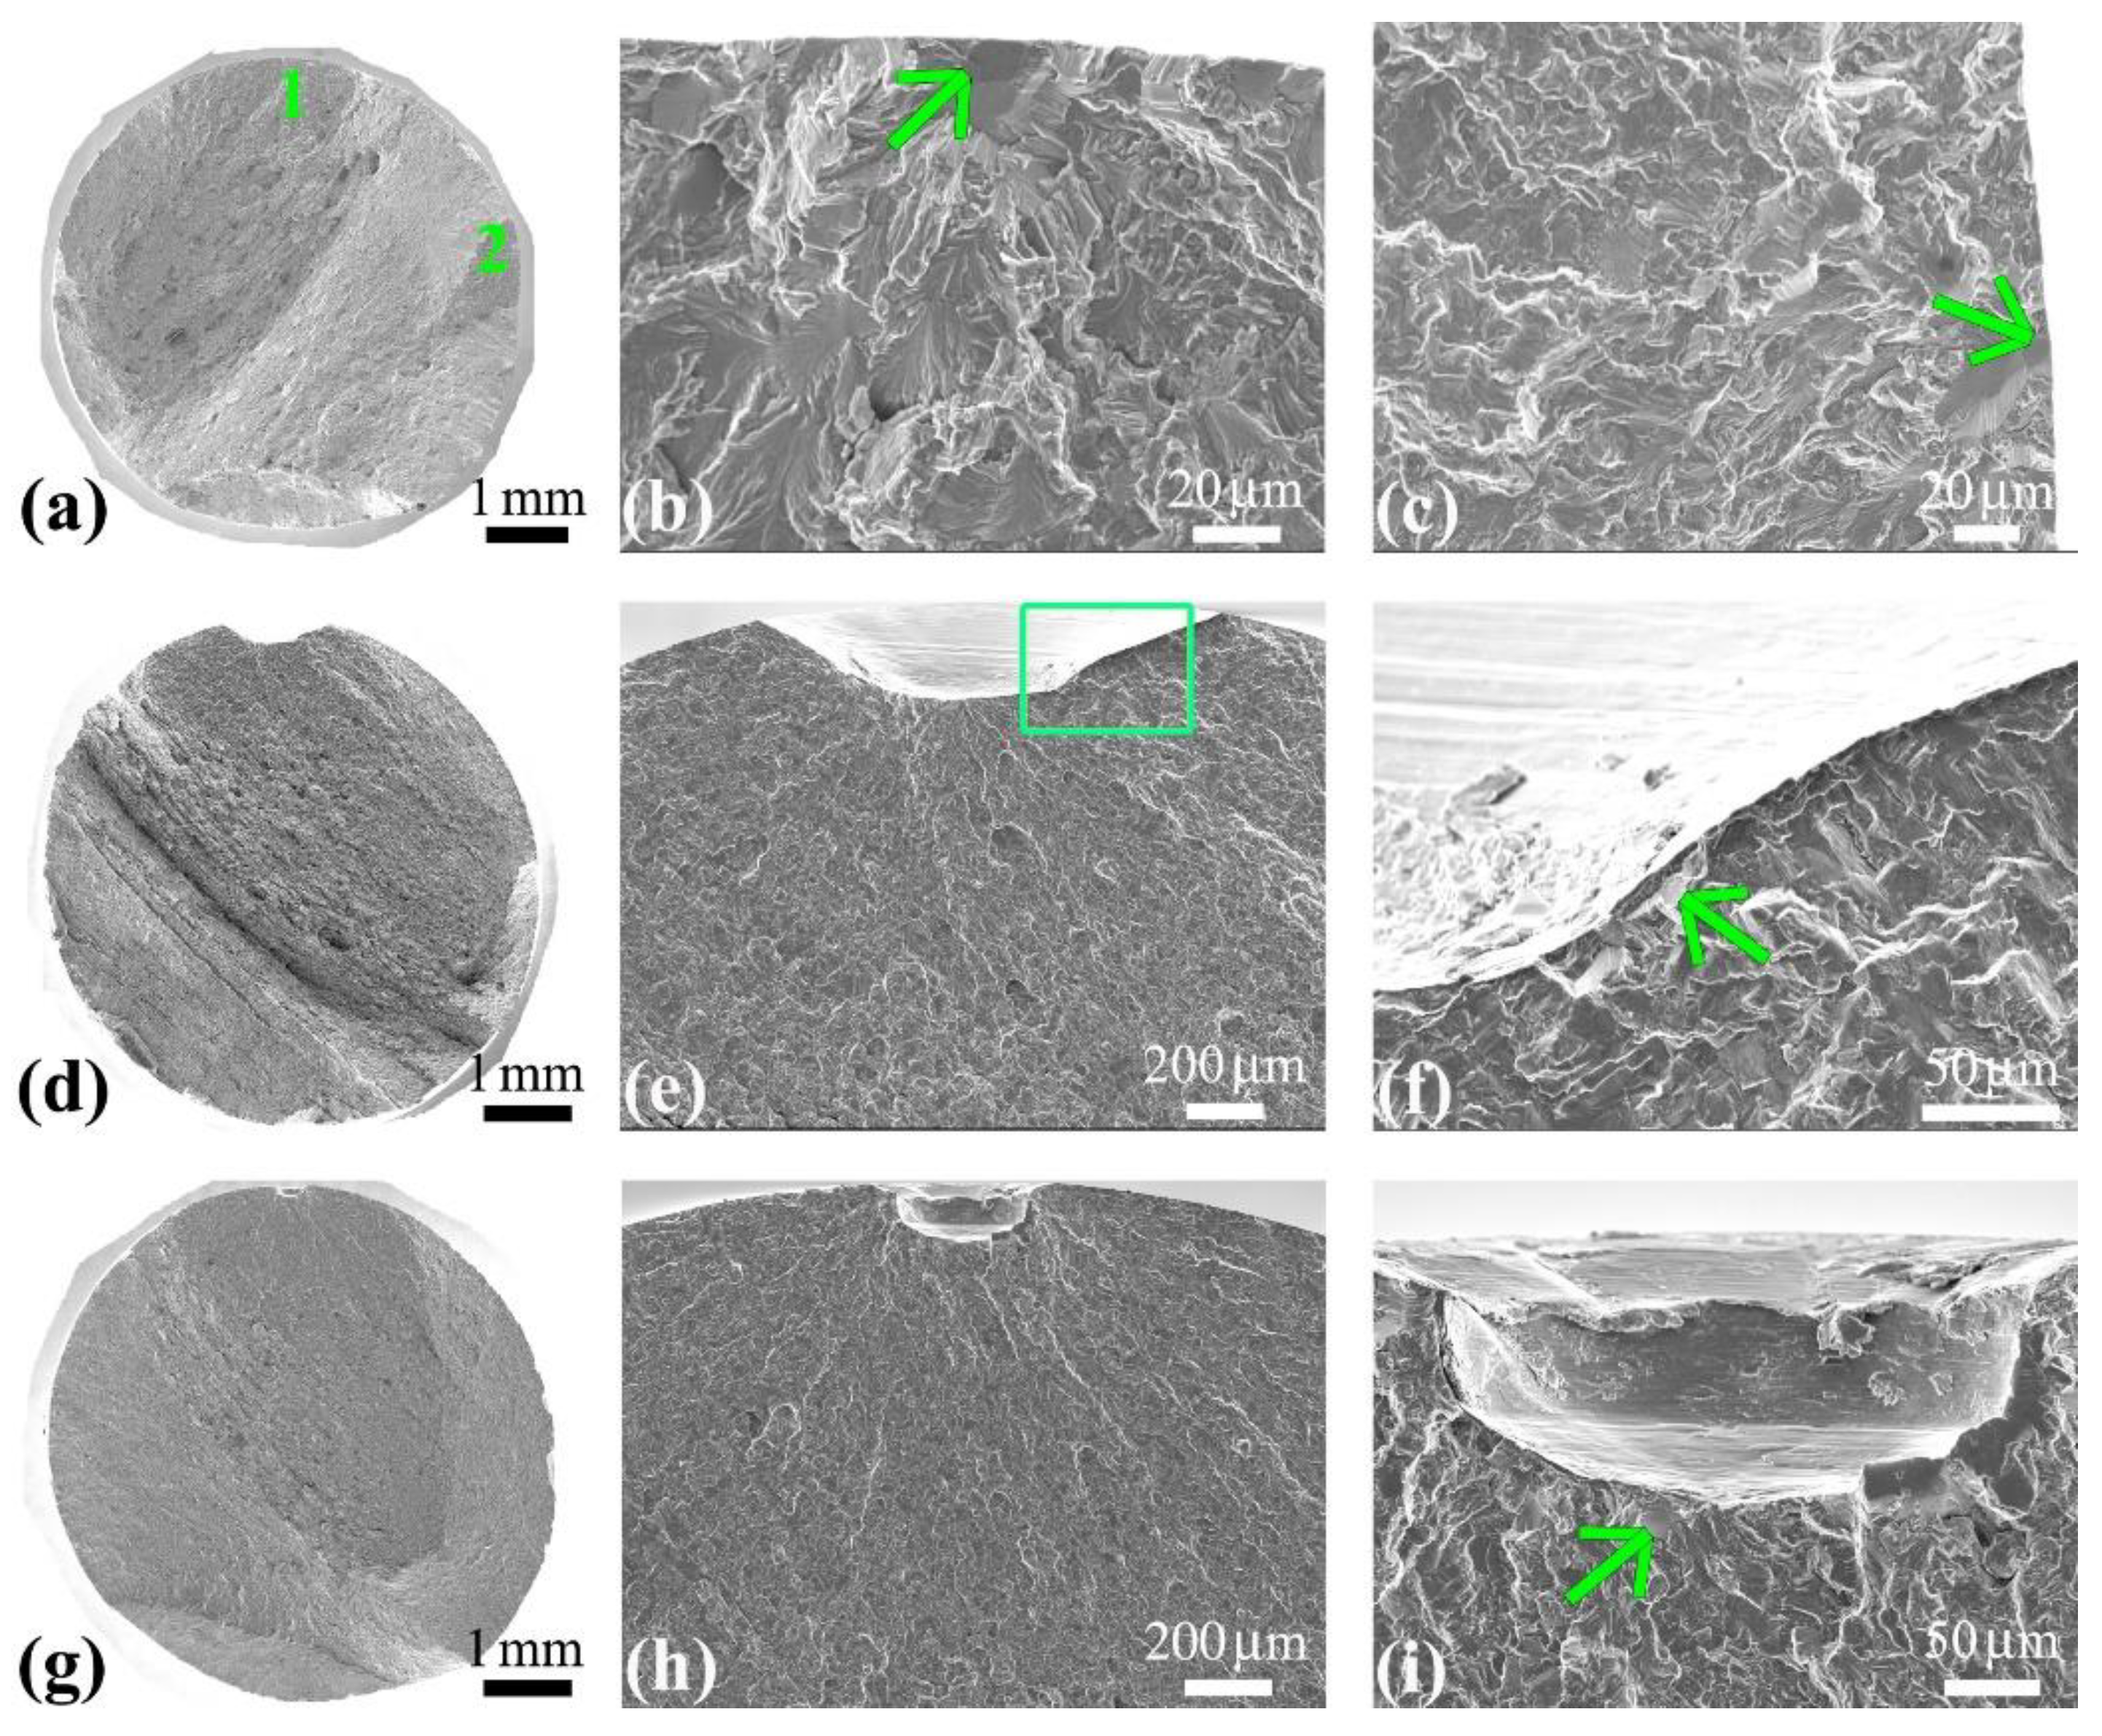
3.2.1. Smooth Specimens and Defective Specimens under Conventional Fatigue Testing
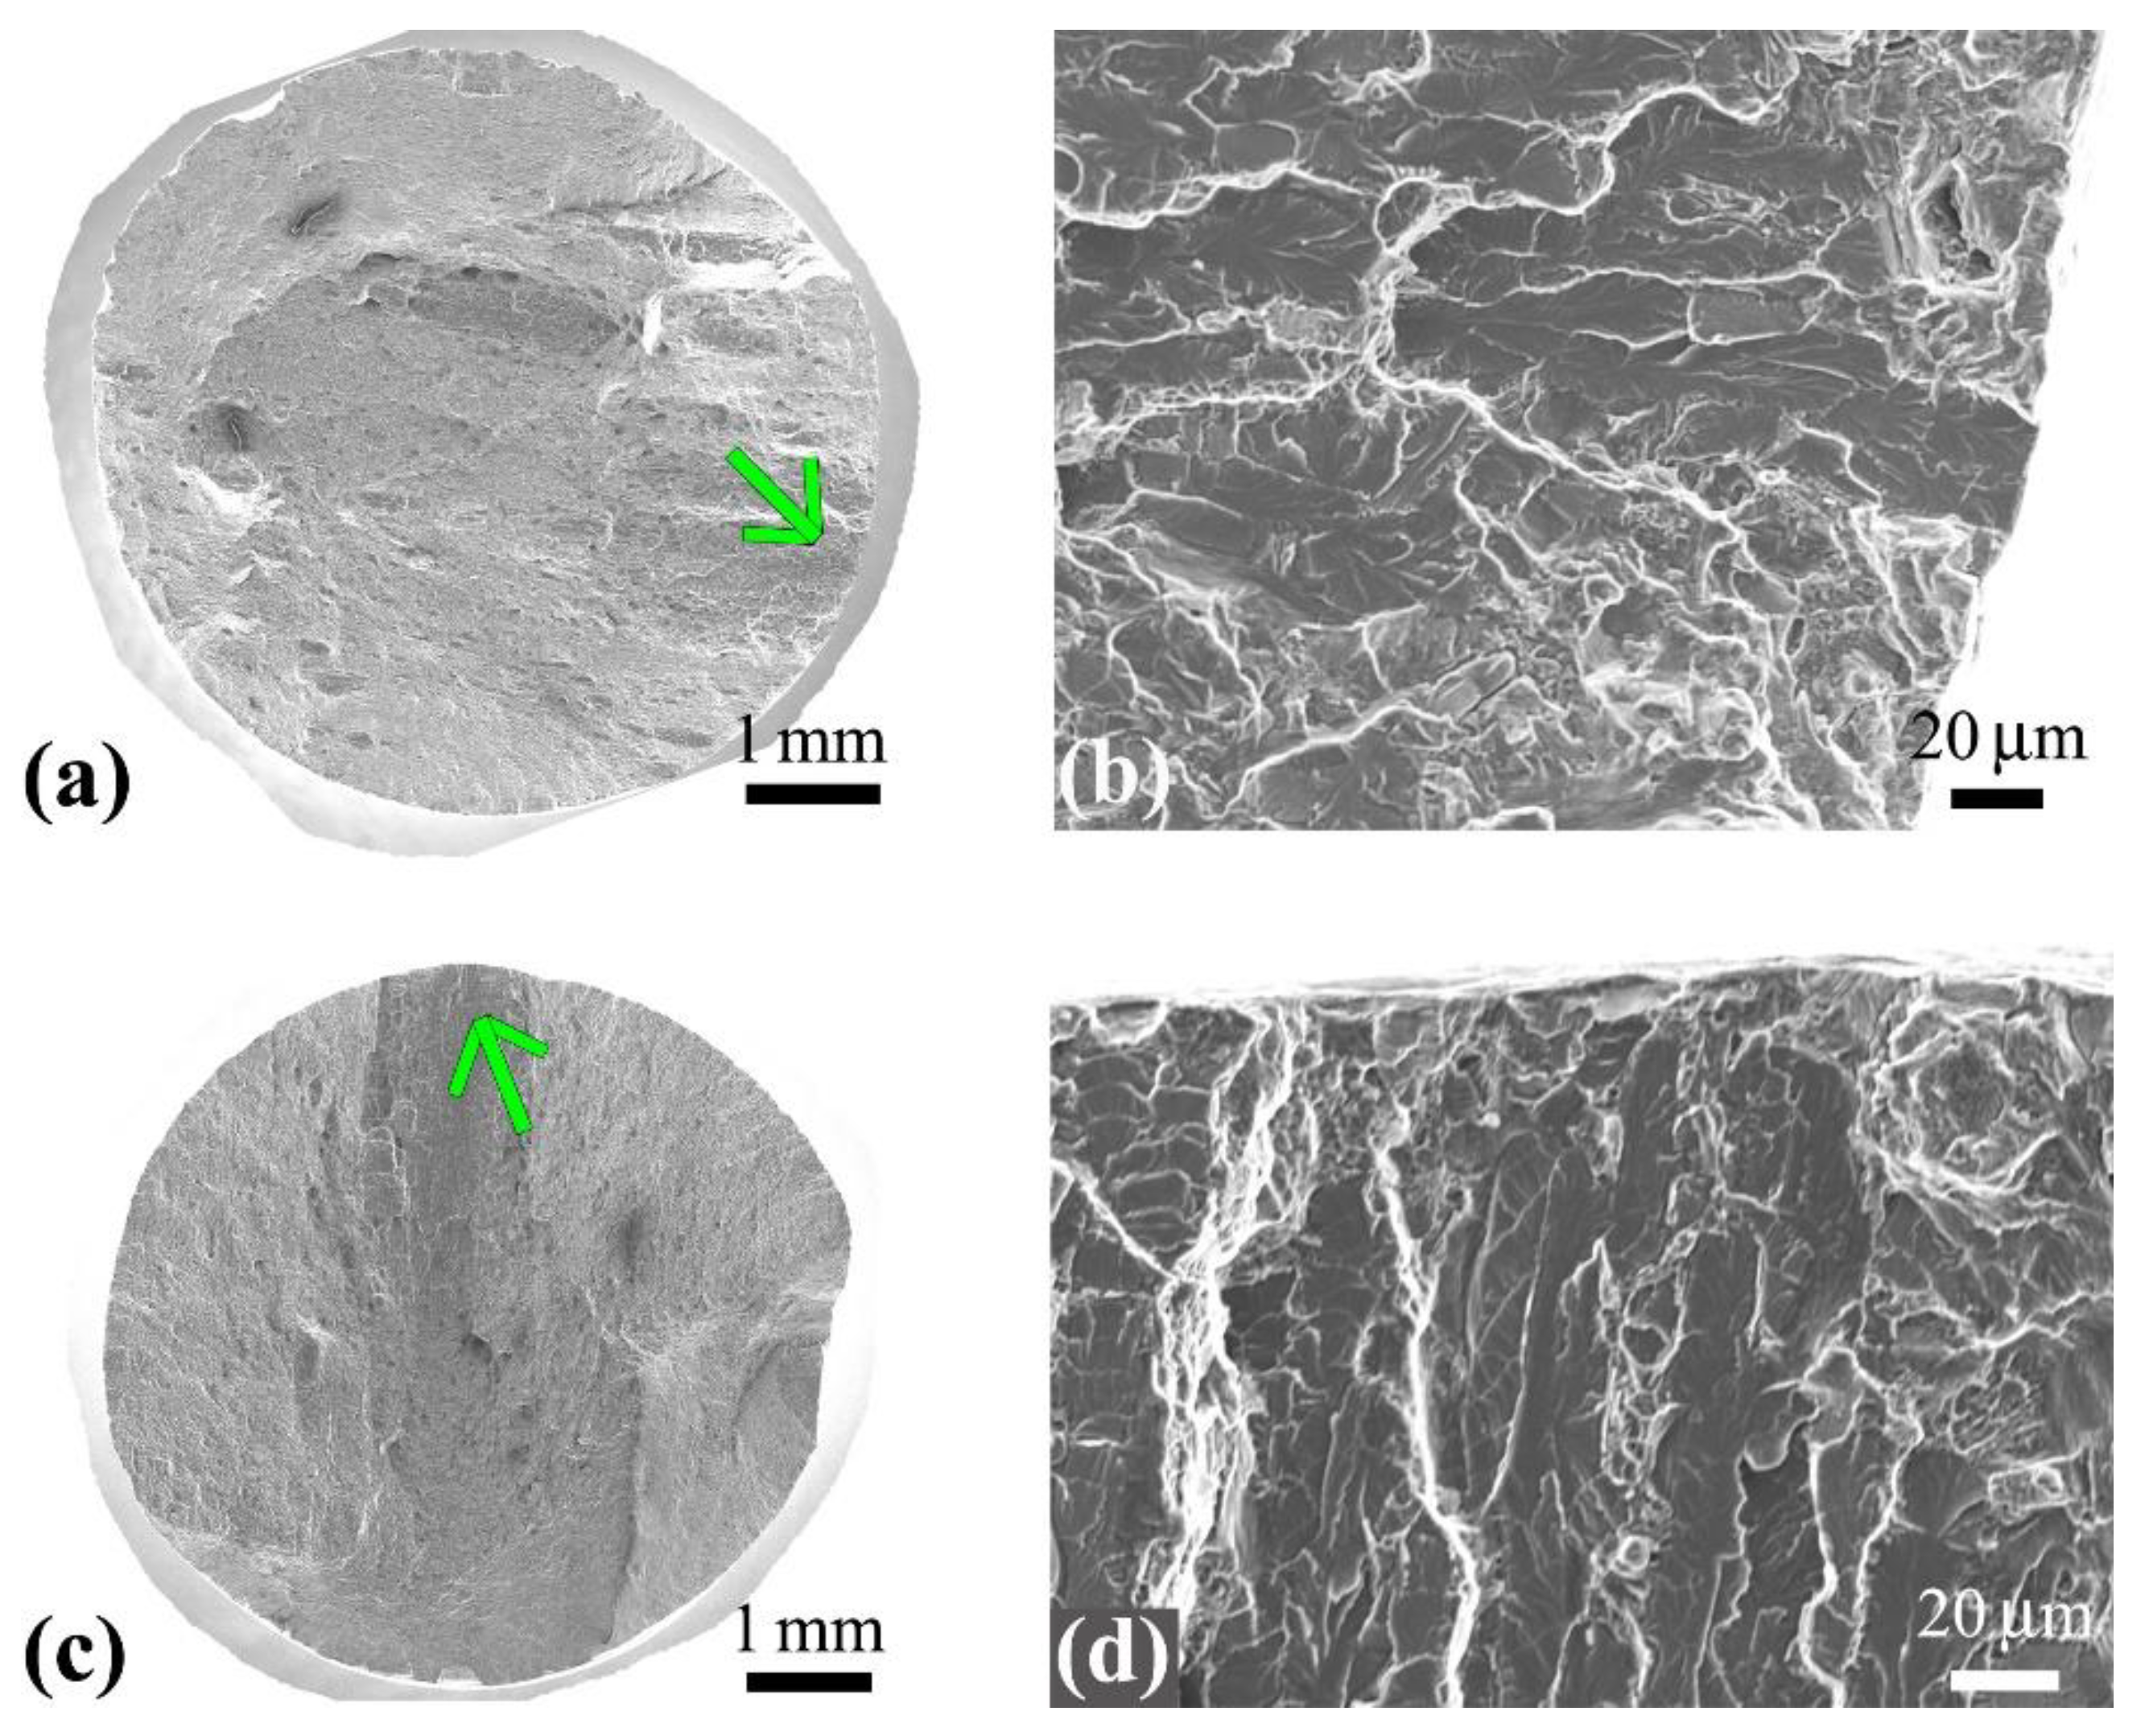
3.2.2. Smooth Specimens and Defective Specimens under Dwell Fatigue Test
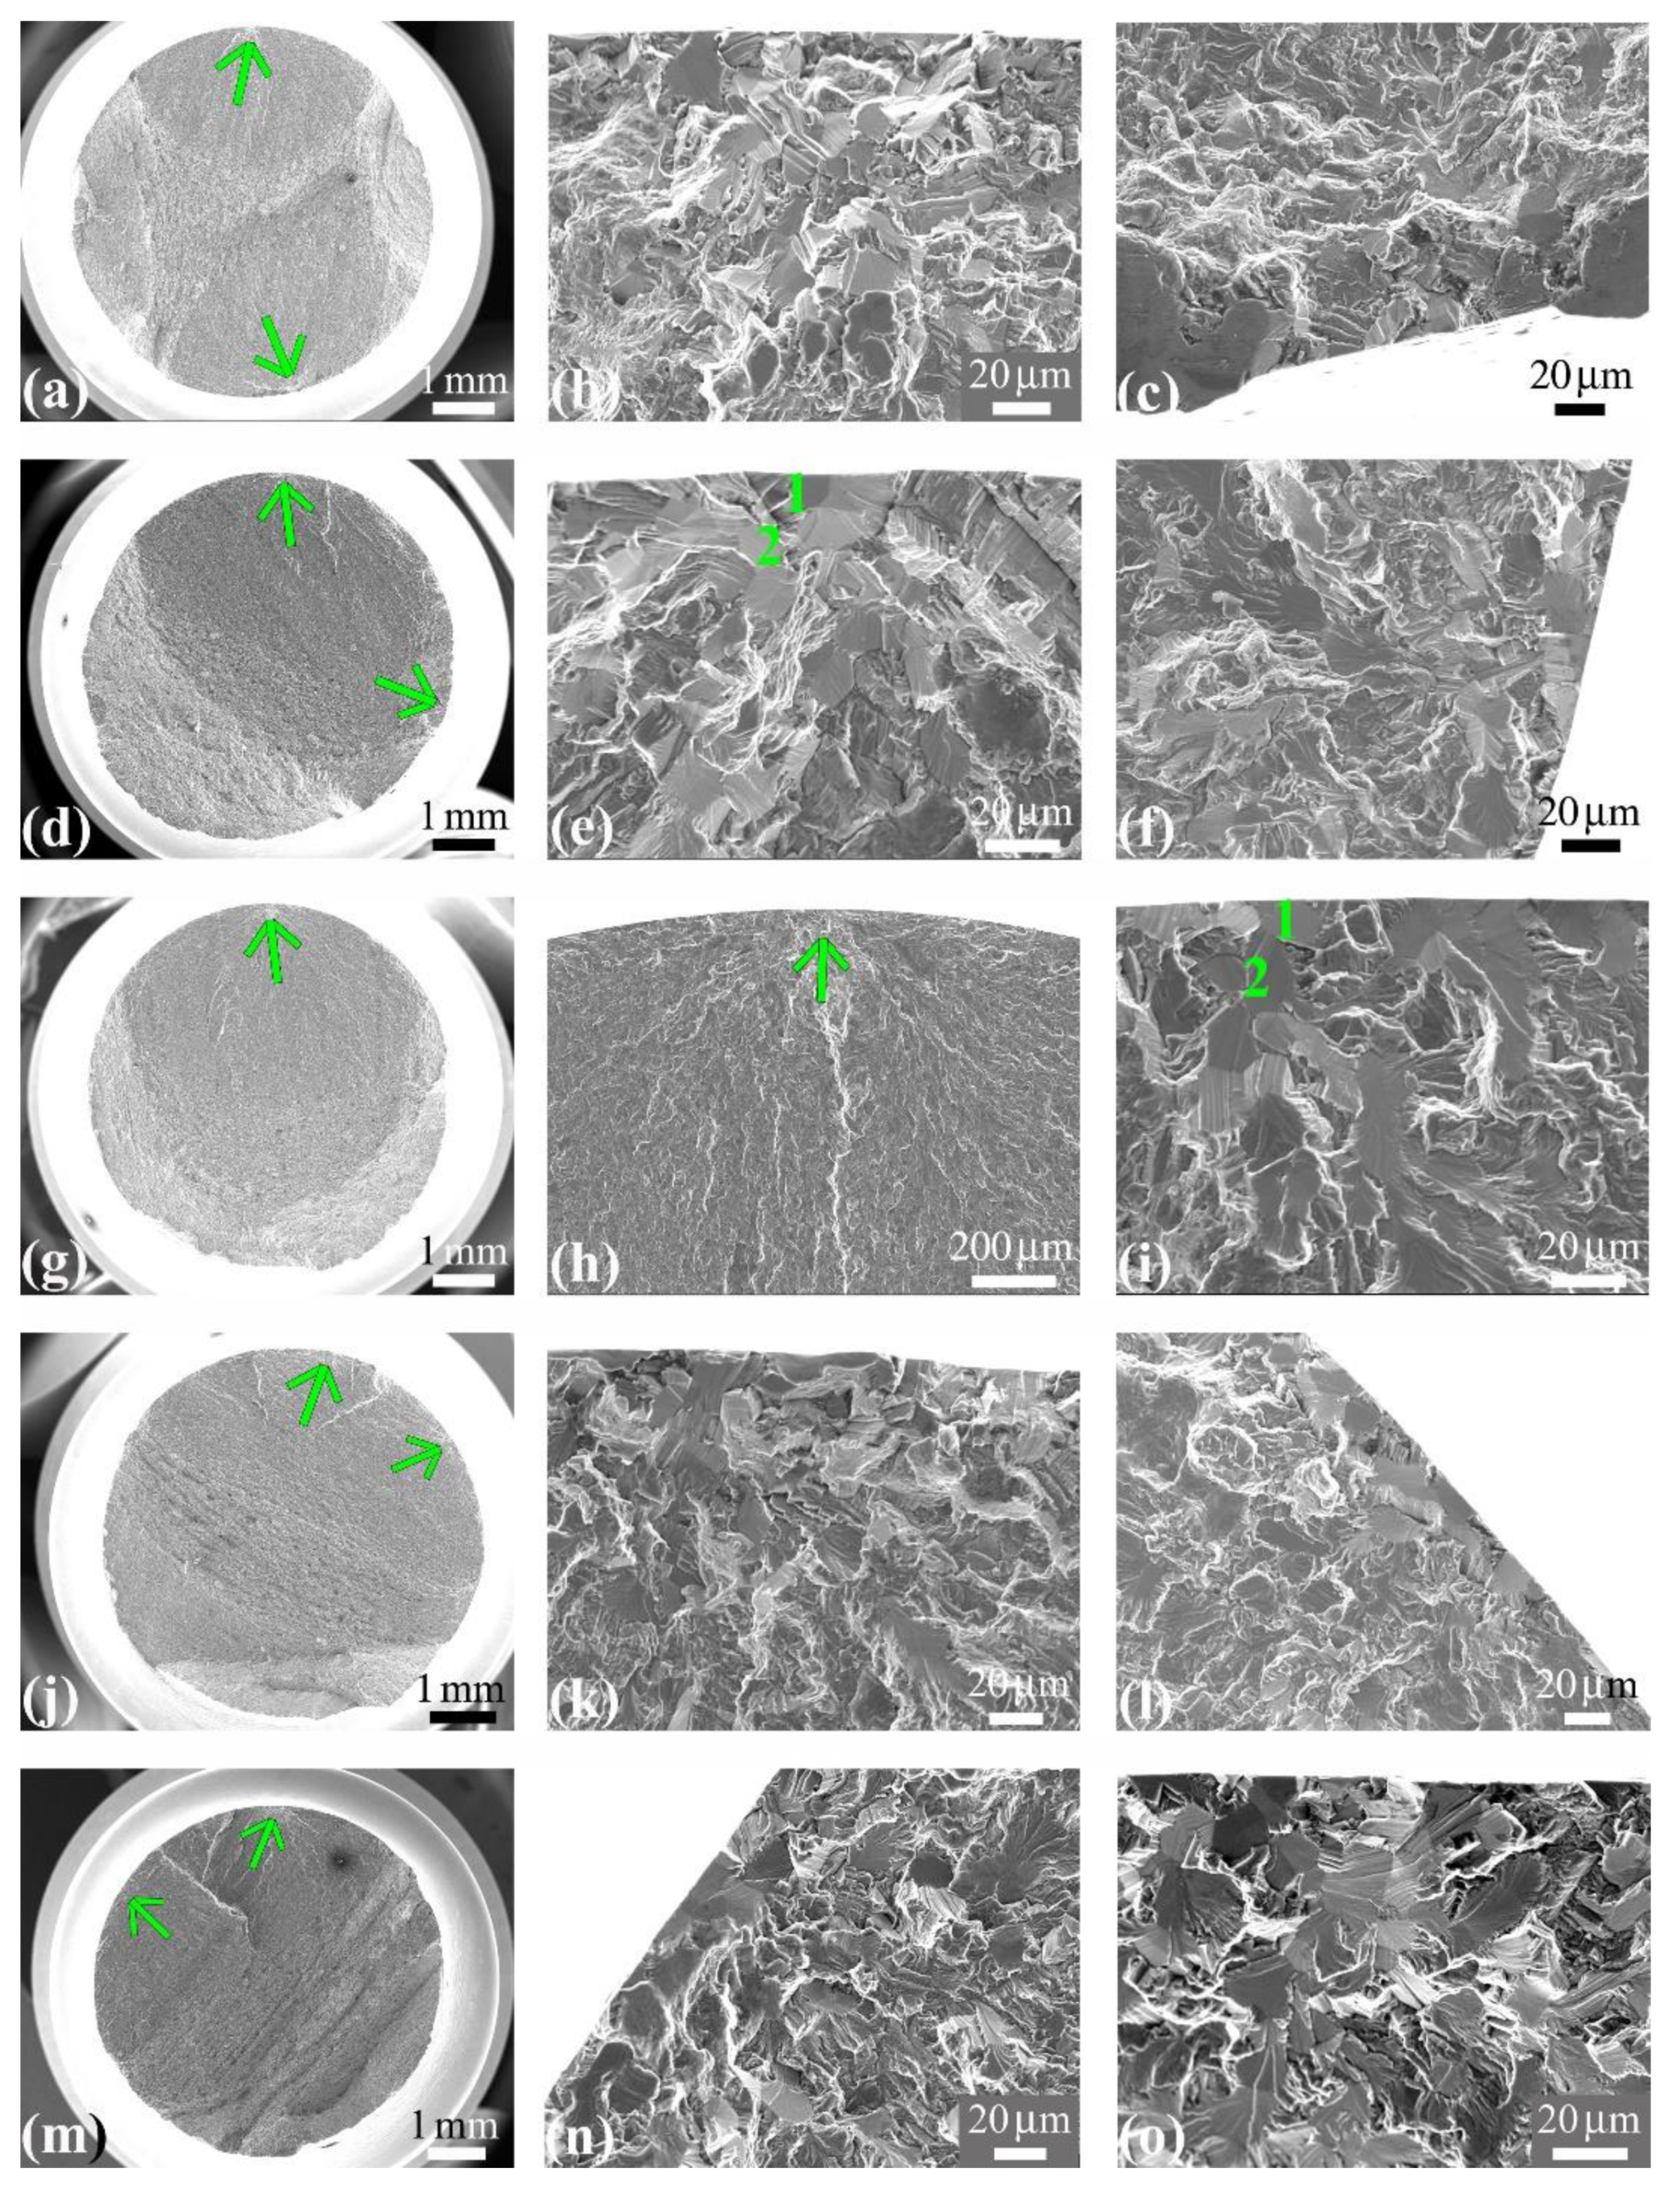
3.2.3. Notched Specimens under Conventional and Dwell Fatigue Tests
4. Discussion
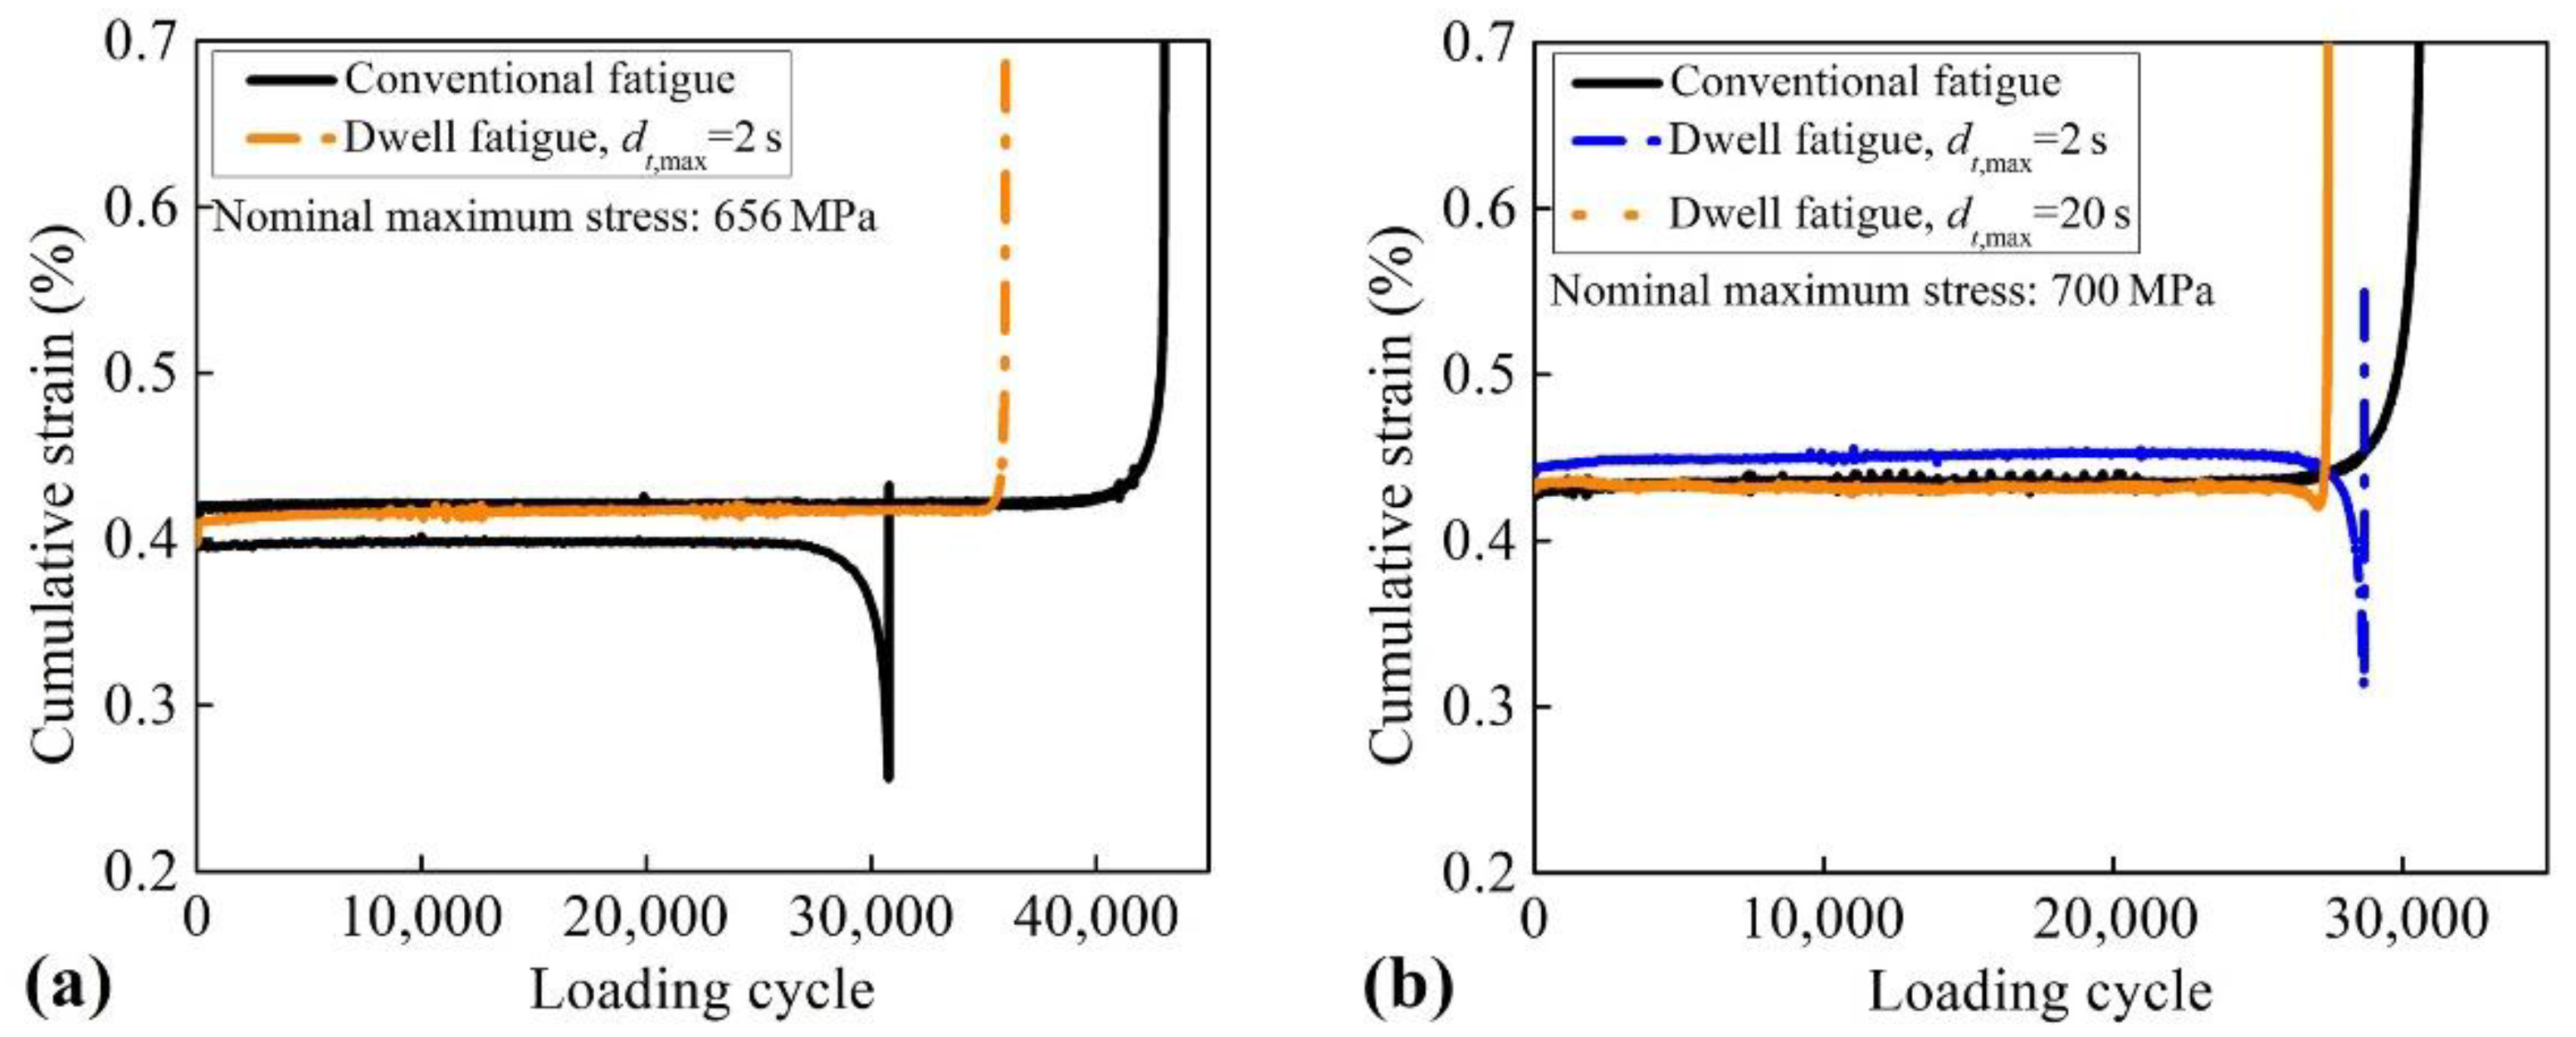
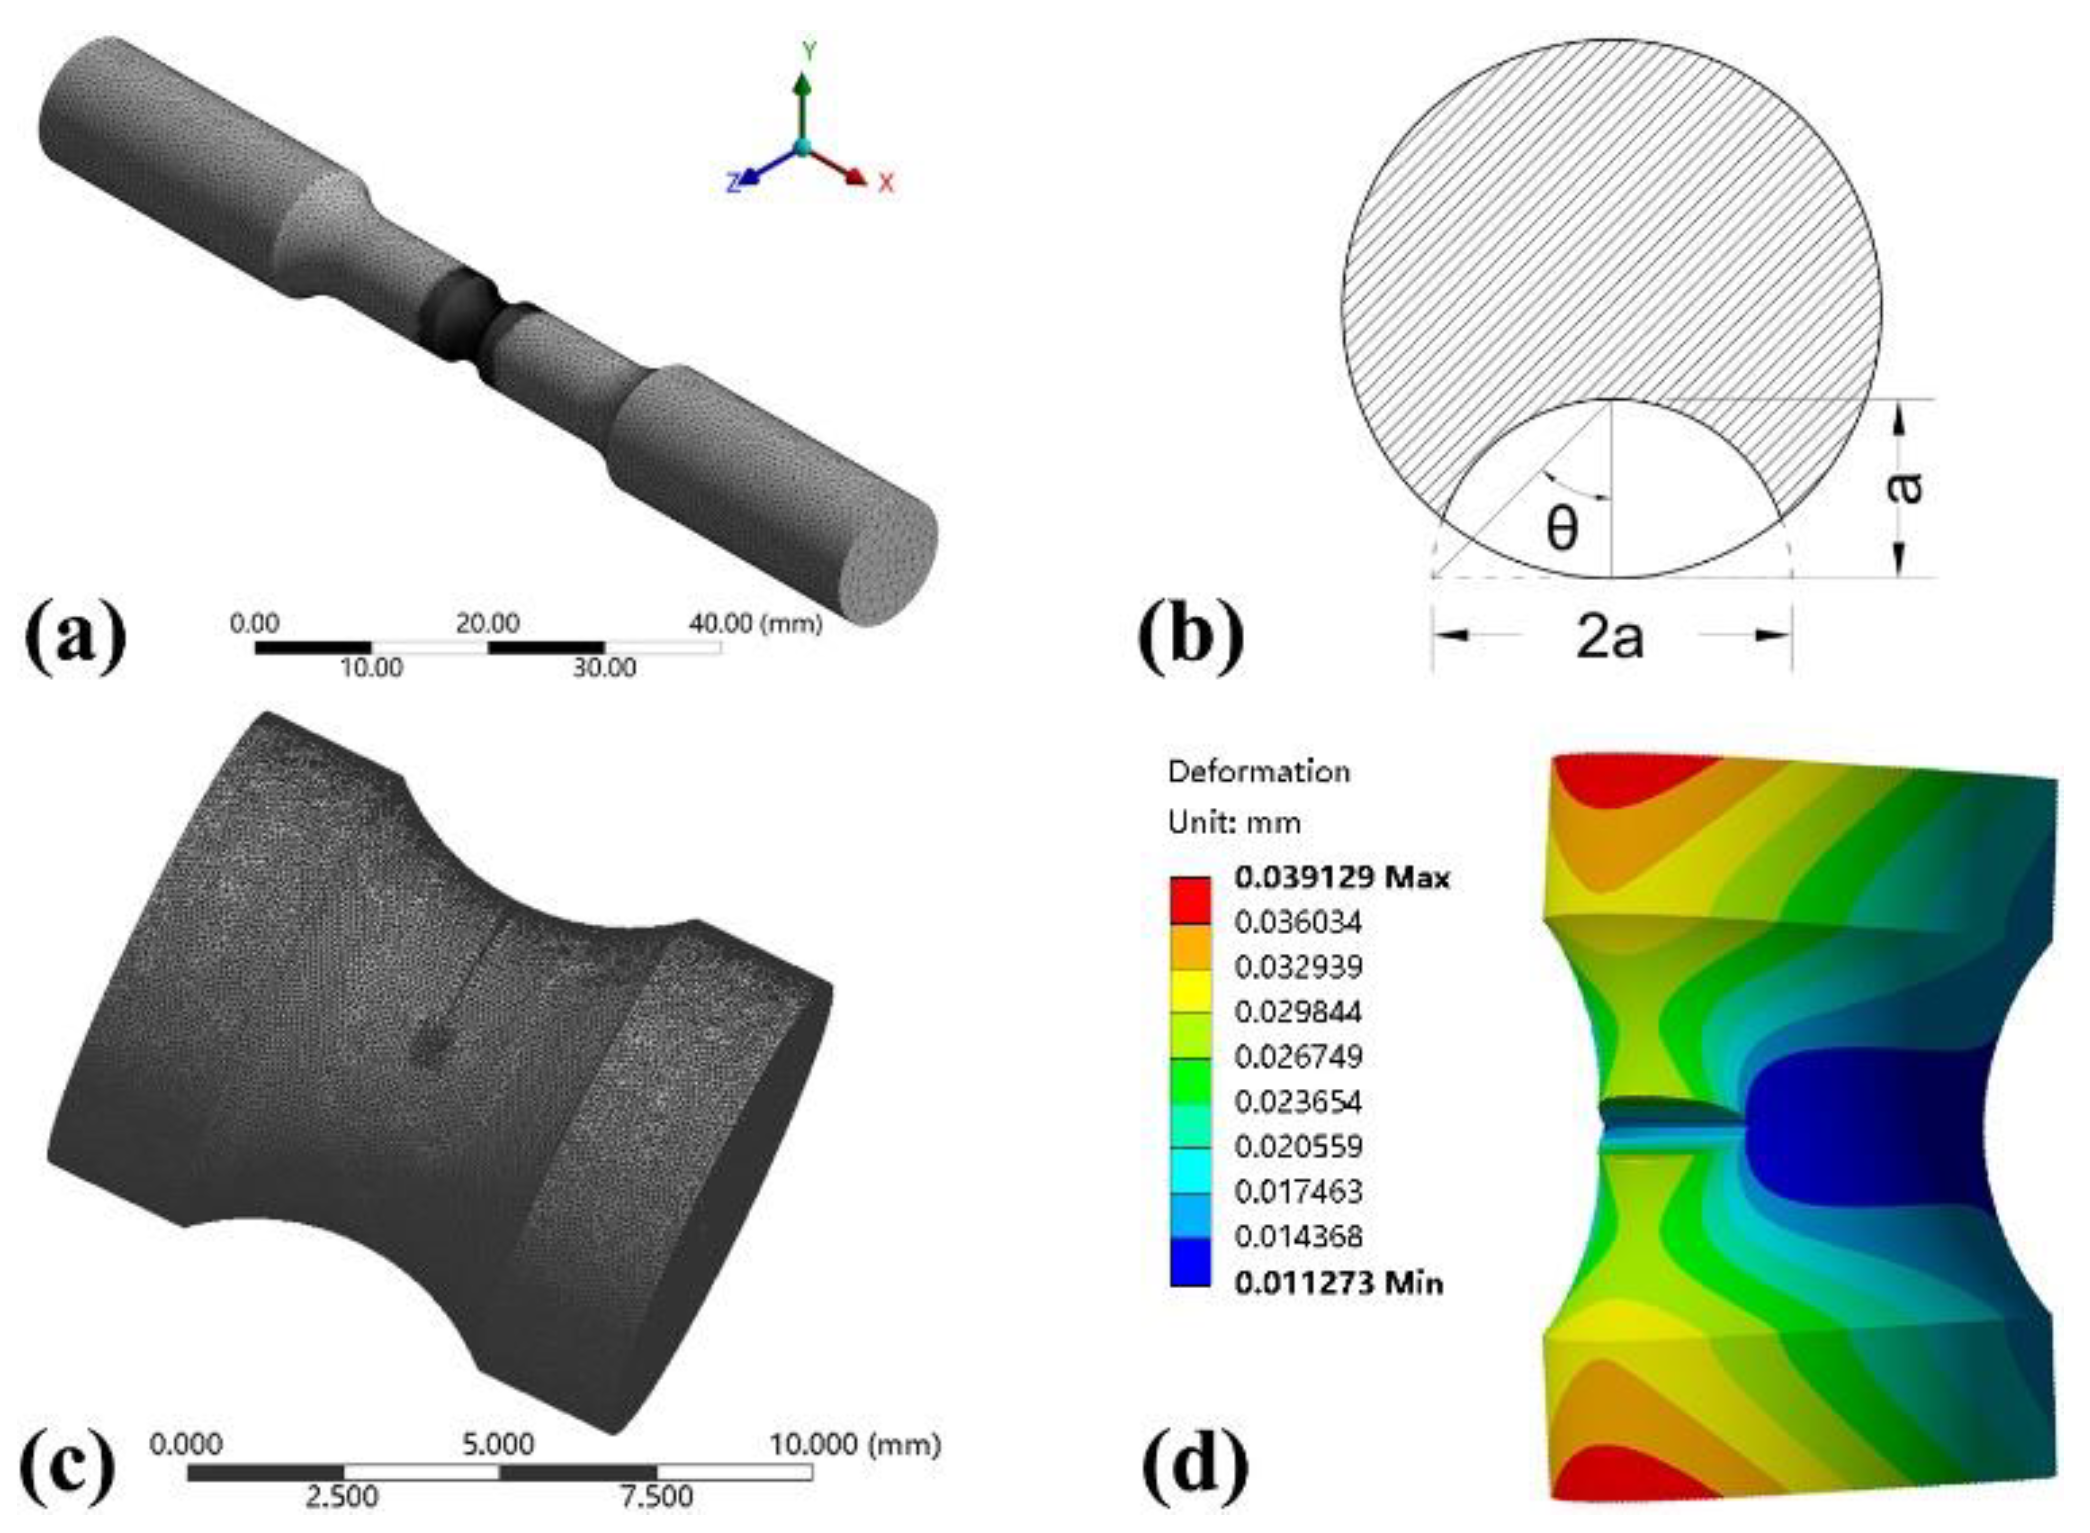
4.1. Effect of Dwell Loading on Cumulative Strain for Notched Specimens
4.2. Effect of Dwell Loading on Fatigue Life of Notched Specimens
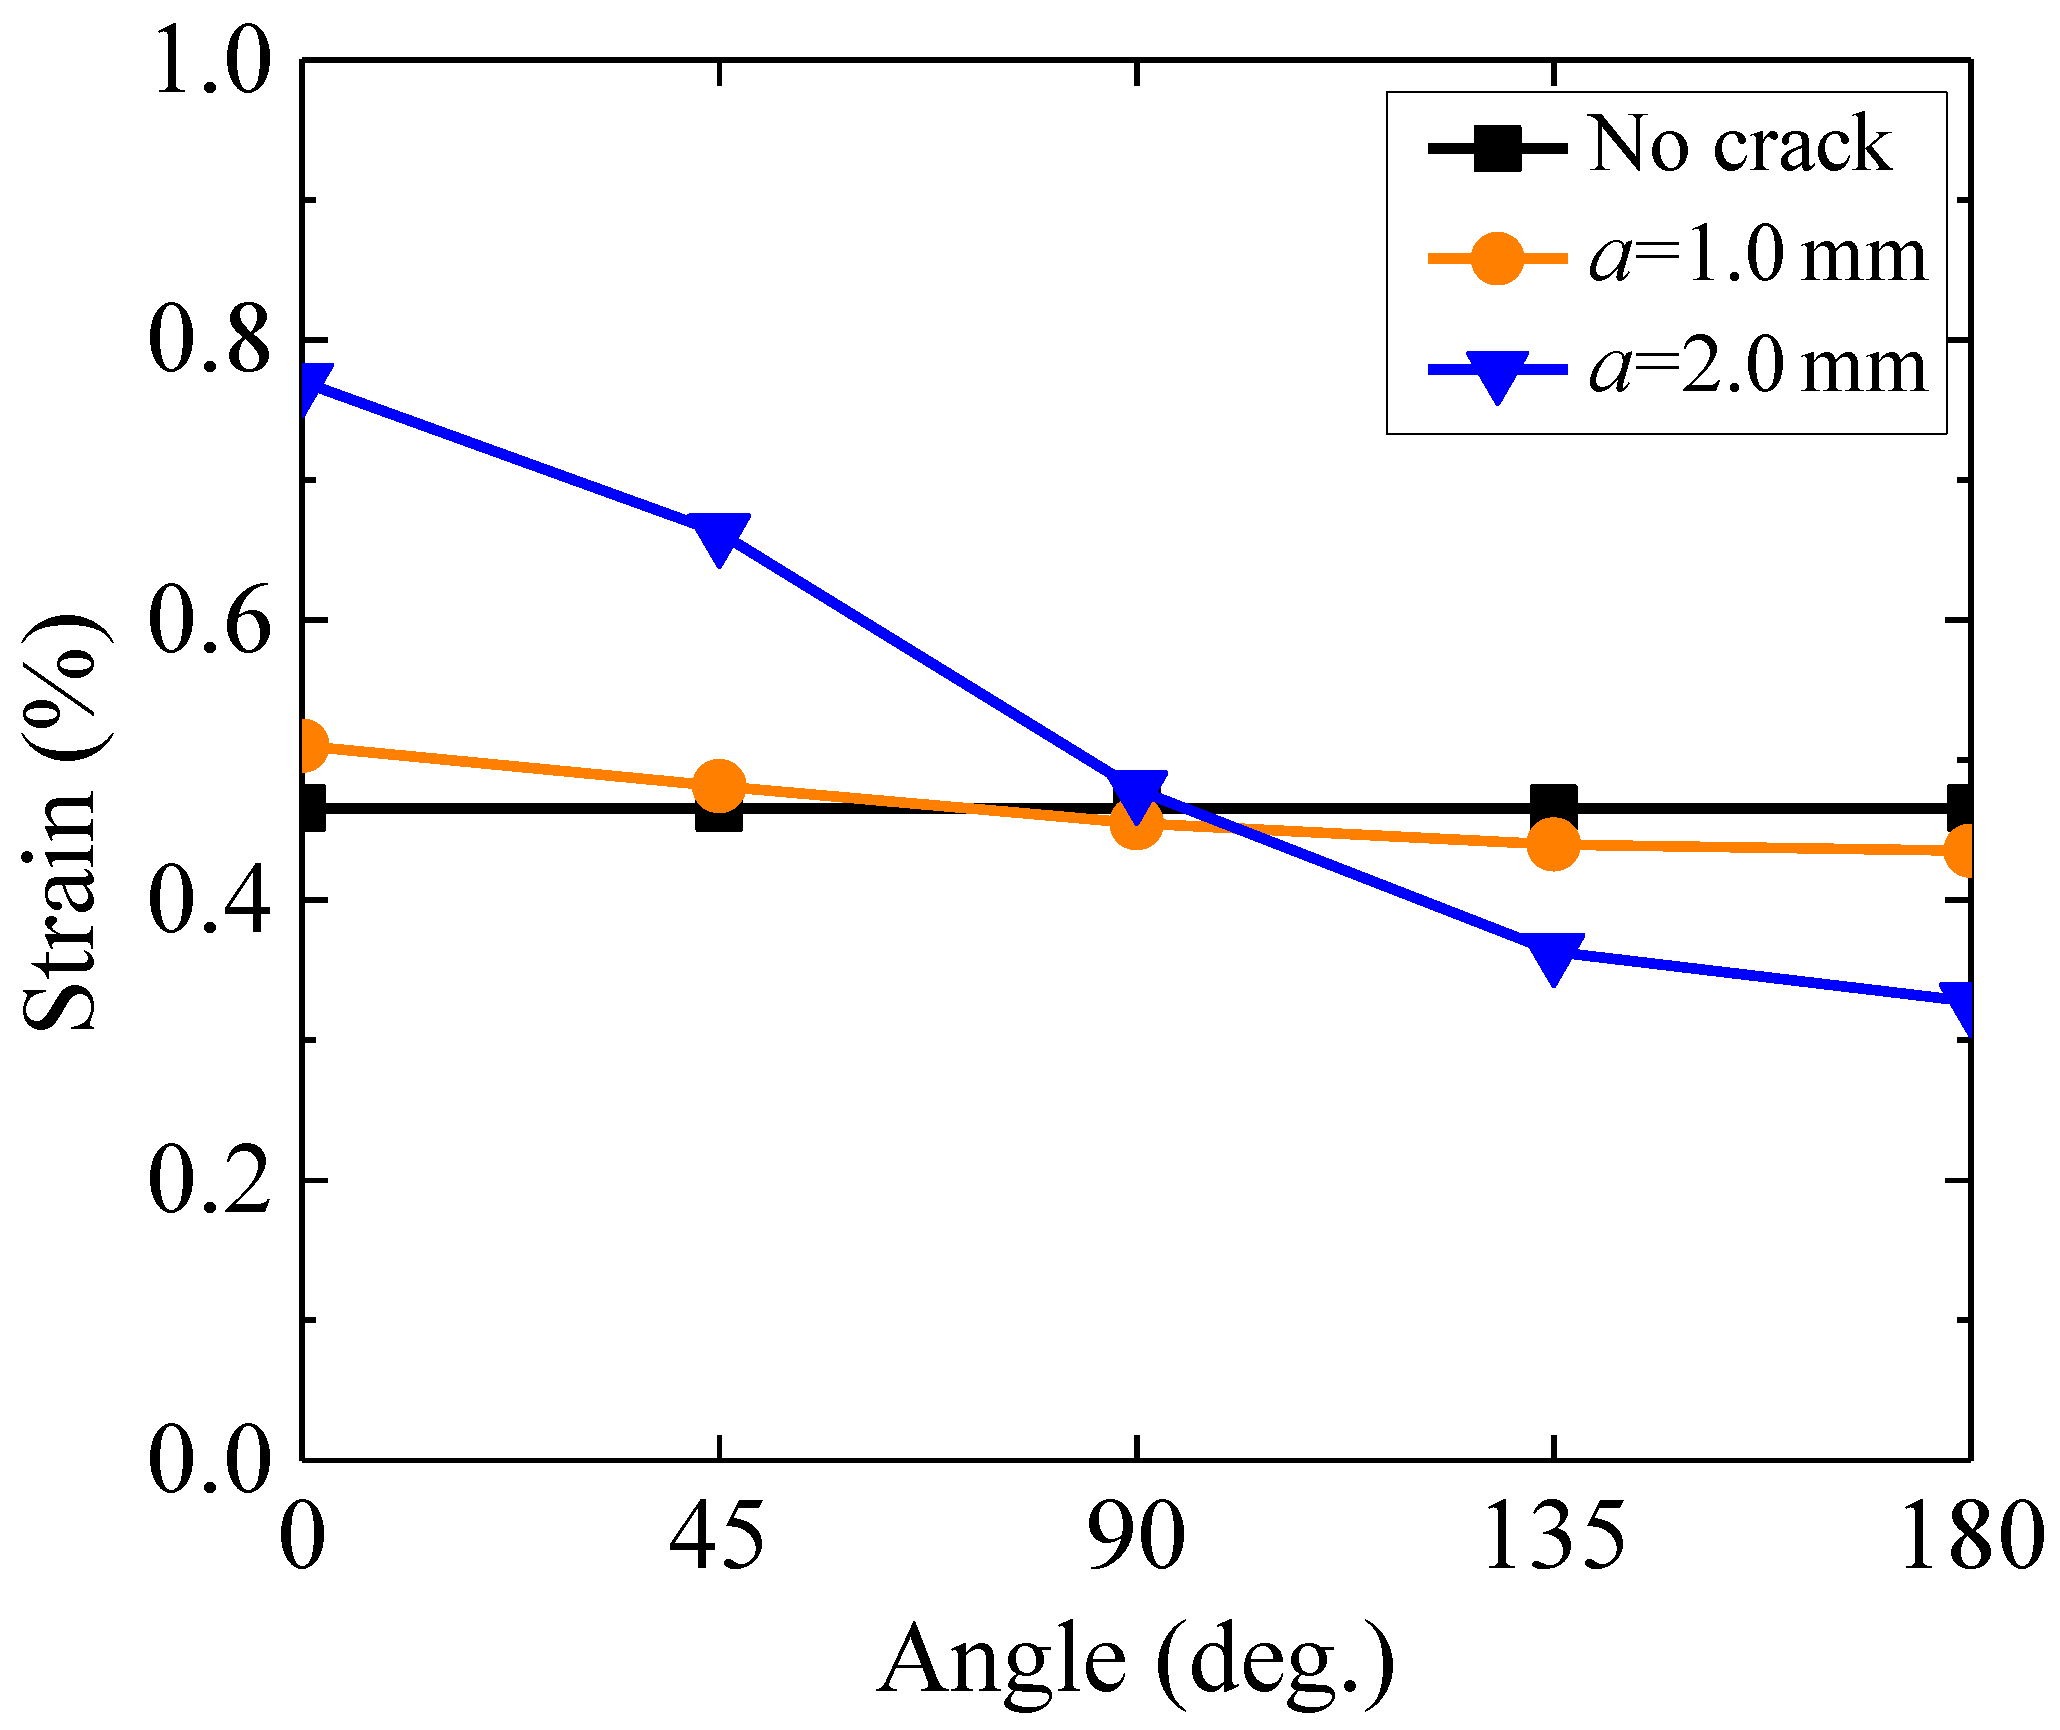
4.3. Effect of Defect on Dwell Fatigue Life
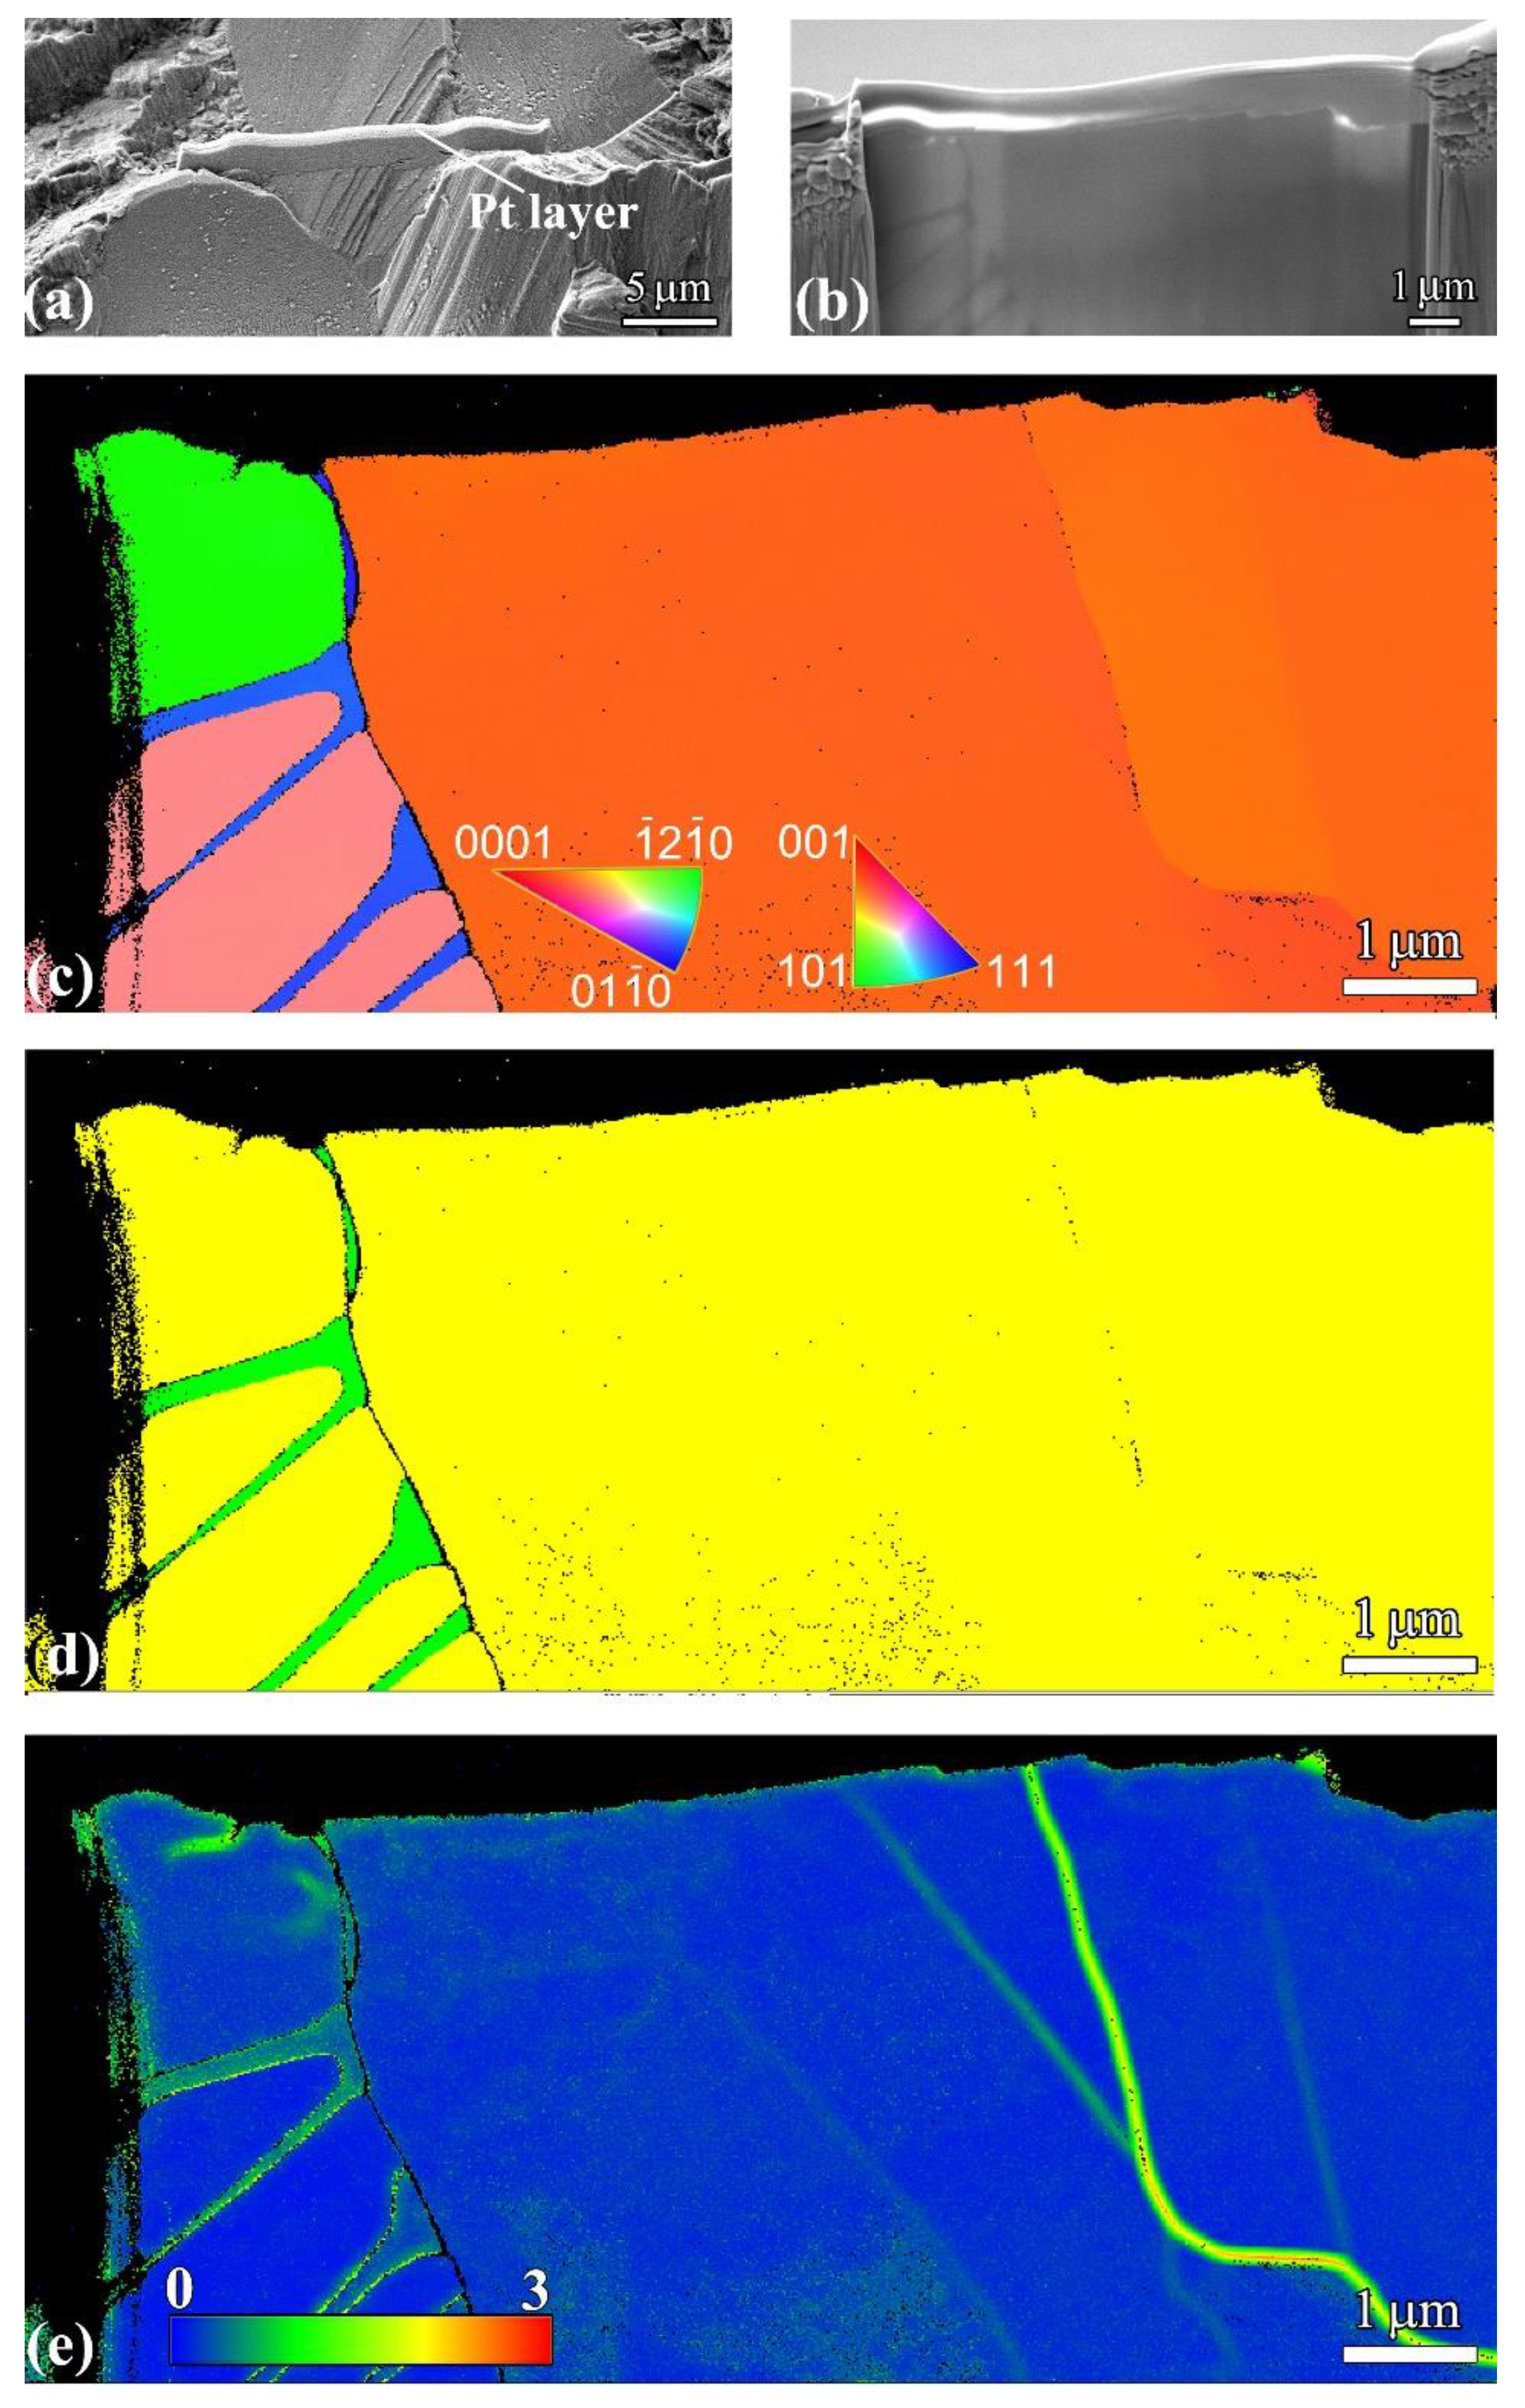
4.4. Mechanism of Facet Formation
5. Conclusions
Author Contributions
Funding
Institutional Review Board Statement
Informed Consent Statement
Data Availability Statement
Conflicts of Interest
References
- Bache, M.R. A review of dwell sensitive fatigue in titanium alloys: The role of microstructure, texture and operating conditions. Int. J. Fatigue 2003, 25, 1079–1087. [Google Scholar] [CrossRef]
- Qiu, J.K.; Ma, Y.J.; Lei, J.F.; Liu, Y.Y.; Huang, A.J.; Rugg, D.; Yang, R. A Comparative study on dwell fatigue of Ti-6Al-2Sn-4Zr-xMo (x = 2 to 6) alloys on a microstructure-normalized basis. Metall. Mater. Trans. A 2014, 45, 6075–6087. [Google Scholar] [CrossRef]
- Waheed, S.; Zheng, Z.; Balint, D.S.; Dunne, F.P.E. Microstructural effects on strain rate and dwell sensitivity in dual-phase titanium alloys. Acta Mater. 2019, 162, 136–148. [Google Scholar] [CrossRef]
- Li, Y.Z.; Bian, C.; Wang, K.; Sun, X.P.; Qin, C. Experimental study on dwell-fatigue of titanium alloy Ti-6Al-4V for offshore structures. J. Ship Mech. 2018, 22, 1124–1135. [Google Scholar]
- Wang, F.; Jiang, Z.; Cui, W.C. Low-cycle dwell-fatigue life and failure mode of a candidate titanium alloy material TB19 for full-ocean-depth manned cabin. J. Ship Mech. 2018, 22, 727–735. [Google Scholar]
- Zhang, Z.; Dunne, F.P.E. Phase morphology, variants and crystallography of alloy microstructures in cold dwell fatigue. Int. J. Fatigue 2018, 113, 324–334. [Google Scholar] [CrossRef]
- Lavogiez, C.; Hémery, S.; Villechaise, P. Analysis of deformation mechanisms operating under fatigue and dwell fatigue loadings in an α/β titanium alloy. Int. J. Fatigue 2020, 131, 105341. [Google Scholar] [CrossRef]
- Evans, W.J.; Gostelow, C.R. The effect of hold time on the fatigue properties of a β-processed titanium alloy. Metall. Trans. A 1979, 10, 1837–1846. [Google Scholar] [CrossRef]
- Bache, M.R.; Cope, M.; Davies, H.M.; Evans, W.J.; Harrison, G. Dwell sensitive fatigue in a near alpha titanium alloy at ambient temperature. Int. J. Fatigue 1997, 19, S83–S88. [Google Scholar] [CrossRef]
- Wang, F.; Cui, W.C. Experimental investigation on dwell-fatigue property of Ti-6Al-4V ELI used in deep-sea manned cabin. Mater. Sci. Eng. A 2015, 642, 136–141. [Google Scholar] [CrossRef]
- Evans, W.J. Time dependent effects in fatigue of titanium and nickel alloys. Fatigue Fract. Eng. Mater. Struct. 2004, 27, 543–557. [Google Scholar] [CrossRef]
- Yang, L.N.; Liu, J.R.; Tan, J.; Chen, Z.; Wang, Q.; Yang, R. Dwell and normal cyclic fatigue behaviours of Ti60 Alloy. J. Mater. Sci. Technol. 2014, 30, 706–709. [Google Scholar] [CrossRef]
- Song, Q.Y.; Li, Y.Q.; Wang, L.; Huang, R.X.; Sun, C.Q. Effect of rise and fall time on dwell fatigue behavior of a high strength titanium alloy. Metals 2019, 9, 914. [Google Scholar] [CrossRef] [Green Version]
- Sun, C.Q.; Li, Y.Q.; Xu, K.L.; Xu, B.T. Effects of intermittent loading time and stress ratio on dwell fatigue behavior of titanium alloy Ti-6Al-4V ELI used in deep-sea submersibles. J. Mater. Sci. Technol. 2021, 77, 223–236. [Google Scholar] [CrossRef]
- Jiang, Q.Q.; Sun, C.Q.; Liu, X.L.; Hong, Y.S. Very-high-cycle fatigue behavior of a structural steel with and without induced surface defects. Int. J. Fatigue 2016, 93, 352–362. [Google Scholar] [CrossRef] [Green Version]
- Schonbauer, B.M.; Mayer, H. Effect of small defects on the fatigue strength of martensitic stainless steels. Int. J. Fatigue 2019, 127, 362–375. [Google Scholar] [CrossRef]
- Kevinsanny; Okazaki, S.; Takakuwa, O.; Ogawa, Y.; Okita, K.; Funakoshi, Y.; Yamabe, J.; Matsuoka, S.; Matsunaga, H. Effect of defects on the fatigue limit of Ni-based superalloy 718 with different grain sizes. Fatigue Fract. Eng. Mater. Struct. 2019, 42, 1203–1213. [Google Scholar] [CrossRef]
- Hu, Y.N.; Wu, S.C.; Withers, P.J.; Zhang, J.; Bao, H.Y.X.; Fu, Y.N.; Kang, G.Z. The effect of manufacturing defects on the fatigue life of selective laser melted Ti-6Al-4V structures. Mater. Des. 2020, 192, 108708. [Google Scholar] [CrossRef]
- Haritos, G.K.; Nicholas, T.; Lanning, D.B. Notch size effects in HCF behavior of Ti-6Al-4V. Int. J. Fatigue 1999, 21, 643–652. [Google Scholar] [CrossRef]
- Wang, J.K.; Yang, X.G. HCF strength estimation of notched Ti–6Al–4V specimens considering the critical distance size effect. Int. J. Fatigue 2012, 40, 97–104. [Google Scholar] [CrossRef]
- Li, C.M.; Hu, Z.; Sun, C.Q.; Song, Q.Y.; Zhang, W.H. Probabilistic control volume method for evaluating the effects of notch size and loading type on fatigue life. Acta Mech. Solida Sin. 2020, 33, 141–149. [Google Scholar] [CrossRef]
- Li, Y.B.; Song, Q.Y.; Yang, K.; Chen, Y.P.; Sun, C.Q.; Hong, Y.S. Probabilistic control volume method for the size effect of specimen fatigue performance. J. Theor. App. Mech-Pol. 2019, 51, 1363–1371. (In Chinese) [Google Scholar]
- Gao, J.W.; Dai, G.Z.; Li, Q.Z.; Zhang, M.N.; Zhu, S.P.; Correia, J.A.F.O.; Lesiuk, G.; De Jesus, A.M.P. Fatigue assessment of EA4T railway axles under artificial surface damage. Int. J. Fatigue 2021, 146, 106157. [Google Scholar] [CrossRef]
- Sun, C.Q.; Song, Q.Y. A method for predicting the effects of specimen geometry and loading condition on fatigue strength. Metals 2018, 8, 811. [Google Scholar] [CrossRef] [Green Version]
- Murakami, Y. Metal Fatigue: Effects of Small Defects and Nonmetallic Inclusions; Academic Press: Oxford, UK, 2002. [Google Scholar]
- Lei, Z.; Zhao, A.; Xie, J.; Sun, C.; Hong, Y. Very high cycle fatigue for GCr15 steel with smooth and hole-defect specimens. Theor Appl. Mech. Lett. 2012, 2, 031003. [Google Scholar] [CrossRef] [Green Version]
- Zhang, J.; Li, H.; Yang, B.; Wu, B.; Zhu, S. Fatigue properties and fatigue strength evaluation of railway axle steel: Effect of micro-shot peening and artificial defect. Int. J. Fatigue 2020, 132, 105379. [Google Scholar] [CrossRef]
- Akiniwa, Y.; Miyamoto, N.; Tsuru, H.; Tanaka, K. Notch effect on fatigue strength reduction of bearing steel in the very high cycle regime. Int. J. Fatigue 2006, 28, 1555–1565. [Google Scholar] [CrossRef]
- Liu, X.L.; Sun, C.Q.; Hong, Y.S. Effects of stress ratio on high-cycle and very-high-cycle fatigue behavior of a Ti–6Al–4V alloy. Mater. Sci. Eng. A 2015, 622, 228–235. [Google Scholar] [CrossRef]
- Nalla, R.K.; Boyce, B.L.; Campbell, J.P.; Peters, J.O.; Ritchie, R.O. Influence of microstructure on high-cycle fatigue of Ti-6Al-4V: Bimodal vs. lamellar structures. Metall. Mater. Trans. A 2002, 33, 899–918. [Google Scholar] [CrossRef]
- Traupe, M.; Jenne, S.; Lütkepohl, K.; Varfolomeev, I. Experimental Validation of Inspection Intervals for Railway axles accompanying the engineering process. Int. J. Fatigue 2016, 86, 44–51. [Google Scholar] [CrossRef]
- Szczepanski, C.J.; Jha, S.K.; Larsen, J.M.; Jones, J.W. Microstructural influences on very high cycle fatigue crack initiation in Ti-6246. Metall. Mater. Trans. A 2008, 39, 2841–2851. [Google Scholar] [CrossRef] [Green Version]
- Everaerts, J.; Verlinden, B.; Wevers, M. Investigation of fatigue crack initiation facets in Ti-6Al-4V using focused ion beam milling and electron backscatter diffraction. J. Microsc. 2017, 267, 57–69. [Google Scholar] [CrossRef]
- Sun, C.Q.; Li, Y.Q.; Huang, R.X.; Wang, L.; Liu, J.L.; Zhou, L.L.; Duan, G.H. Crack initiation mechanism and fatigue life of titanium alloy Ti-6Al-2Sn-2Zr-3Mo-X: Effects of stress ratio and loading frequency. Mater. Sci. Eng. A 2020, 798, 140265. [Google Scholar] [CrossRef]
- Neal, D.F.; Blenkinsop, P.A. Internal fatigue origins in alpha-beta titanium-alloys. Acta Metall. 1976, 24, 59–63. [Google Scholar] [CrossRef]
- Rui, S.S.; Shang, Y.B.; Su, Y.; Qiu, W.; Niu, L.S.; Shi, H.J.; Matsumoto, S.; Chuman, Y. EBSD analysis of cyclic load effect on final misorientation distribution of post-mortem low alloy steel: A new method for fatigue crack tip driving force prediction. Int. J. Fatigue 2018, 113, 264–276. [Google Scholar] [CrossRef]
- Liu, X.L.; Xue, Q.Q.; Wang, W.; Zhou, L.L.; Jiang, P.; Ma, H.S.; Yuan, F.P.; Wei, Y.G.; Wu, X.L. Back-stress-induced strengthening and strain hardening in dual-phase steel. Materiallia 2019, 7, 100376. [Google Scholar] [CrossRef]


| Elements | Al | V | Fe | C | H | O | Ti |
|---|---|---|---|---|---|---|---|
| wt.% | 6.45 | 4.08 | 0.19 | 0.0055 | 0.0033 | 0.11 | balance |
| Type of Specimen | Maximum Stress/MPa | Dwell Time dt,max/s | Minimum Stress/MPa | Fatigue Life/cycle | Defect Size/μm | Failure Mode |
|---|---|---|---|---|---|---|
| Smooth | 815 | 0 | 0 | 10,623 | - | Fatigue |
| Smooth | 815 | 0 | 0 | 10,100 | - | Fatigue |
| Smooth | 815 | 120 | 0 | 1956 | - | Mixed |
| Smooth | 815 | 120 | 0 | 1724 | - | Mixed |
| Smooth | 815 | 120 | 0 | 1024 | - | Mixed |
| Defective | 815 | 0 | 0 | 7342 | 438 | Fatigue |
| Defective | 815 | 0 | 0 | 4621 | 438 | Fatigue |
| Defective | 815 | 0 | 0 | 8310 | 190 | Fatigue |
| Defective | 815 | 0 | 0 | 6961 | 190 | Fatigue |
| Defective | 815 | 120 | 0 | 1066 | 438 | Mixed |
| Defective | 815 | 120 | 0 | 900 | 325 | Mixed |
| Defective | 815 | 120 | 0 | 1049 | 190 | Mixed |
| Notched | 656 | 0 | 0 | 43,046 | - | Fatigue |
| Notched | 656 | 0 | 0 | 30,800 | - | Fatigue |
| Notched | 700 | 0 | 0 | 30,815 | - | Fatigue |
| Notched | 700 | 0 | 0 | 23,747 | - | Fatigue |
| Notched | 700 | 2 | 0 | 28,701 | - | Fatigue |
| Notched | 656 | 2 | 0 | 35,989 | - | Fatigue |
| Notched | 700 | 20 | 0 | 29,059 | - | Fatigue |
| Notched | 700 | 20 | 0 | 27,441 | - | Fatigue |
Publisher’s Note: MDPI stays neutral with regard to jurisdictional claims in published maps and institutional affiliations. |
© 2021 by the authors. Licensee MDPI, Basel, Switzerland. This article is an open access article distributed under the terms and conditions of the Creative Commons Attribution (CC BY) license (https://creativecommons.org/licenses/by/4.0/).
Share and Cite
Sun, J.; Wu, L.; Sun, C. Effects of Notches and Defects on Dwell Fatigue Mechanism and Fatigue Life of Ti-6Al-4V ELI Alloy Used in Deep-Sea Submersibles. J. Mar. Sci. Eng. 2021, 9, 845. https://doi.org/10.3390/jmse9080845
Sun J, Wu L, Sun C. Effects of Notches and Defects on Dwell Fatigue Mechanism and Fatigue Life of Ti-6Al-4V ELI Alloy Used in Deep-Sea Submersibles. Journal of Marine Science and Engineering. 2021; 9(8):845. https://doi.org/10.3390/jmse9080845
Chicago/Turabian StyleSun, Jian, Lei Wu, and Chengqi Sun. 2021. "Effects of Notches and Defects on Dwell Fatigue Mechanism and Fatigue Life of Ti-6Al-4V ELI Alloy Used in Deep-Sea Submersibles" Journal of Marine Science and Engineering 9, no. 8: 845. https://doi.org/10.3390/jmse9080845