Article

Experimental Investigation of Load-Bearing Mechanism of Underwater Mined-Tunnel Lining

1
School of Civil Engineering, Southwest Jiaotong University, Chengdu 610031, China
2
Key Laboratory of Transportation Tunnel Engineering, Southwest Jiaotong University, Ministry of Education, Chengdu 610031, China
*
Author to whom correspondence should be addressed.
J. Mar. Sci. Eng. 2021, 9(6), 627; https://doi.org/10.3390/jmse9060627
Submission received: 9 May 2021 / Revised: 1 June 2021 / Accepted: 1 June 2021 / Published: 4 June 2021
(This article belongs to the Special Issue Instability and Failure of Subsea Structures)

Abstract

:
A series of model tests were performed to investigate the load-bearing mechanism of a mined railway tunnel lining under water pressure. To investigate the load-bearing characteristics of different types of linings, a fully closed water pressure exerting device for a noncircular section tunnel was invented. A large-scale model test (1:30) under combined water and soil pressures was conducted to investigate the mechanical characteristics, deformation, stress distribution, crack development process, and failure mode of the underwater mined-tunnel lining. The test results indicated that for the high-speed railway tunnel of Class IV surrounding rock with a design speed of 350 km/h, both the drainage lining and the waterproof lining were controlled by a small eccentric compression under the two test conditions. One had only water pressure, and the other had a variable water pressure and constant soil pressure. The key sections for controlling instability were the bottom of the wall and the inverted arch. The ultimate water head of the drainage lining was 49 m, and the ultimate water head of the waterproof lining was 78 m. In comparison with the drainage lining, the waterproof lining could significantly improve the water-pressure resistance. Thus, design loads of 30 and 60 m are recommended for the drainage and waterproof lining structures, respectively.

1. Introduction

Developed countries in the world have been building underwater tunnels continuously since the 1930s. So far, the countries with underwater tunnels mainly include Japan, Norway, Denmark, Britain, France, and China. Some of the famous projects are the Seikan Tunnel in Japan, the Channel Tunnel between Britain and France, the Channel Tunnel in Norway, the Xiang’an Tunnel in Xiamen, and the Shiziyang Tunnel in China [1,2,3,4,5,6]. Compared with the rapid development of underwater tunnel engineering, the corresponding design theory has been lagging behind the engineering construction, and a series of technical problems need to be solved, such as the calculation theory of tunnel lining water pressure, the distribution law of lining water pressure of different waterproof and drainage methods, and the stress characteristics of lining structure under the combined action of soil and water pressure [7,8,9,10,11,12]. For such problems, domestic and foreign related scholars have undertaken a lot of research.
In Switzerland, Chabot studied the limited bearing water pressure of the waterproof lining, and the results indicated that the waterproof lining is relatively suitable for the water head range of 30–60 m. Thus, the lower limit of the water head is 30 m, and the upper limit is 60 m. For a tunnel whose water head is >60 m, a drainage system must be installed for reducing the water pressure in the lining structure [13]. In Finland, Lipponen et al. examined the effects of geological factors on the long-term stability of rock cracks in a rich water tunnel and recommended a special supporting method for such conditions [14]. In Turkey, Mustafa Ayhan et al. investigated the Dicle–Kralkizi tunnel, which has a high water pressure. They studied the main factors related to the over-breaking and surface settlement, which affect the stability of the surrounding rock, and analyzed the relationship between the excavation speed and the tunnel stability [15]. Jin-Hung Hwang examined the seepage characteristics of a tunnel via two- and three-dimensional (3D) numerical simulations [16]. Wang et al. proposed a lining structure based on controlled drainage. Analyses, numerical simulations, and modeling tests revealed that a grouting circle can significantly reduce the water pressure behind the lining structure. The optimal radius of the grouting circle was proposed [17]. For a multiple-arch tunnel and a small-distance tunnel, Li et al. adopted a fluid–solid coupled approach to obtain the distributions of the seepage field and pore water pressure [18]. Fernandez et al. studied the impact of tunnel excavation on the water flow field around the tunnel structure. They reported that changes in the permeability coefficient of the surrounding rock directly affect the amount of water discharged during excavation and the stability of the surrounding rock. However, the interaction between the seepage field and the soil stress is not fully understood [19]. Moon and Jeong studied the effects of geological characteristics and the joint spacing distribution of the tunnel site on the seepage field and water discharge. It was concluded that geological characteristics were among the major factors causing the water burst of the tunnel [20]. Hund-Der Yeh et al. summarized several closed-form, semi-empirical, numerical, and other related analysis methods for vertical-well water simulation and applications to underground engineering [21]. Wang et al. studied a diversion tunnel across a slope via a 3D numerical simulation and examined a series of uncertainty problems caused by the flood discharge tunnel, such as the effect of the stability and various mechanical properties [22]. Li and Zhou adopted the hyperstatic reaction method to study the mechanical performance and section optimization of a lining structure. The optimized section significantly improved the mechanical characteristics of the lining structure and reduced the lining deformation [23]. Fang et al. developed a simulation test device for determining the external water pressure of a tunnel lining according to the pressure difference between the inside and outside of the tunnel structure model and studied the mechanical characteristics of a large-section highway tunnel lining structure under external water pressure [24]. Li et al. analytically investigated the undrained responses for deep circular tunnels with reinforcement in saturated ground. An idealized model of an axisymmetric tunnel with an initial hydrostatic stress field was proposed [25]. To study the structural response of the tunnel lining in the loess region in a local hydrodynamic environment, experimental testing at 1 g and a numerical simulation were performed by Qiu et al., and the results were verified and found to be in good agreement [26]. Guo et al. studied the mechanical characteristics of shield tunnel structures under the combined action of soil and water through a series of model tests. They concluded that under the action of a high internal water pressure, structural cracks first appeared at the hance of secondary lining and then at the vault and arch bottom [27].
Literature reviews on the water pressure around tunnel structures have indicated that the research on tunnel seepage model tests is in the initial stage, and few studies have been performed in which the mechanism of the support system in the construction and operation stages was simulated with consideration of the water–soil coupling action [28,29,30,31,32,33,34,35]. Tunnel excavation causes redistribution of the initial stress and seepage fields in the surrounding rock and soil. Changes in the seepage lead to changes in the stress field, and changes in the stress field change the surrounding rock, affecting the seepage characteristics [36,37,38,39,40,41,42,43]. Hence, the interaction between the surrounding rock and the support structures is complex, owing to the interaction between the stress and the seepage field. This is a coupled process that is difficult to model and poses a threat to the lining structure, as the combined loading from water pressure and soil pressure can exceed the design capacity. Under the combination of water and soil pressures, the stability of the surrounding rock is reduced, and the forces acting on the support structures are increased. In severe cases, catastrophic accidents can occur, such as tunnel collapse, mud burst, and water inrush [44,45,46,47,48,49,50]. Thus, in the present study, to obtain the stress distribution law of the support structure under the influence of external water pressure during the construction and operation of a high-stress water-rich tunnel, a model test system capable of simultaneously considering the water and soil pressures was developed. The water effect is simulated indirectly using the hoop loading method according to the principle of mechanical equivalence. Models are constructed using similar materials to study the stress evolution process, progressive failure characteristics, and most unfavorable stress sections and failure modes of the tunnel main structure under water and soil pressures. In particular, obtaining the limit indices for waterproof and drainage tunnels to withstand external water pressure can provide a basis for the safety design and construction-scheme selection of the underwater tunnel support structures, which has practical significance and considerable theoretical value.

2. Materials and Methods

2.1. Description of Project

The Liuyanghe Tunnel is a controlling project for the Wuhan–Guangzhou Passenger Dedicated Line. It is located in the east of Changsha City and crosses the Niujiaochong Interchange between the Beijing–Zhuhai Expressway and the Changyong Expressway, the dense plant area of Xingsha Town, Yuanda Road, Changsha City, People’s East Road, Liuyang River, and Airport Expressway; it exits the ground in Lituo Township and ends at the new Changsha Station, as shown in Figure 1. The tunnel ground structure is complex, and its exposed strata are mainly quaternary artificial fill, silty clay, sandy gravel stratum, Cretaceous argillaceous sandstone, conglomerate, sandstone, and calcareous sandstone. From top to bottom, the groundwater of the tunnel comprises loose rock pore water, clastic rock pore fissure water, and clastic rock pore fissure–karst cave water. The fault structure of the tunnel site area is not developed, and there are no large faults. However, there are factors such as uneven weathering, an uneven lithology, and the development of karst caves. The seismic basic intensity in this area is VI degree, and the peak acceleration of the ground motion is divided into 0.05 g.
The design speed of Liuyanghe Tunnel is 350 km/h, the line spacing is 5.0 m, and the total length is 10,100 m. The tunnel consists of an open cut and buried section (including a 1484-m-long buffer structure) at the entrance, an undercut section (7416-m-long), an open and buried section at the exit (including a 1020-m-long buffer structure), and a 180-m-long open section of the approach road at the exit. The length of the excavation crossing the Liuyang River is 362 m. The width of the Liuyang River, through which the tunnel passes, is 210 m, and the absolute elevation of the riverbed across the river reaches 22.8–23.0 m. The elevation of the tunnel roof is 4.0–8.7 m, and the thickness of the tunnel roof is 19.1–23.8 m. The tunnel crossing area is rich in groundwater, and the water pressure is high. During the tunnel excavation process, disasters such as lining damage, seepage, and high-water pressure inrush can easily occur.

2.2. Water-Pressure Loading Simulation and Principle

To investigate the stress characteristics and failure modes of different types of waterproof lining tunnel structures, the secondary lining of the standard section of a double-track high-speed railway tunnel of Class IV surrounding rock with a design speed of 350 km/h was examined in this study.
There are two methods for simulating the water pressure in laboratory tests: directly applying pressure around a scaled model and applying a similitude equivalent water pressure based on the superposition method. Direct water-pressure application is simple and easy; however, the whole scaled model made of plaster is soaked in water, resulting in instability and degradation of the mechanical properties, which are derived using the similitude law. Additionally, directly soaking the scaled model in water to apply the water pressure affects the application of soil pressure to the scaled model, sometimes even causing a failure to apply soil pressure in the tests. Hence, in this study, the similitude equivalent water pressure method was adopted, and a device was developed to achieve indirect water-pressure application.
The actual water pressure at the lining of the mountain tunnel is unevenly distributed along the tunnel section, exhibiting a “bulb-like” distribution with a small top and a large bottom. It is difficult to simulate the loading mode of a nonuniform water pressure in laboratory model tests. Therefore, according to the principle of mechanical equivalence, the method of piecewise uniform water pressure superposition was adopted to simplify the simulation of the radial water pressure, as shown in Figure 2a.
To apply a uniform water pressure in the test, several steel stranded wire hoop lining structures were adopted to apply a water pressure to each section of the circular arch via hoop tension, to realize complete and close loading along the model section. According to the principle of structural mechanics, the relationship between the hoop tension and the uniform water pressure can be determined, as shown in Figure 2b.
With the external radius of the lining demoted as R, the longitudinal width denoted as B, the average compression stress acting on surface of the structure denoted as q, the number of strands denoted as n, and the single-strand hoop tension force (which is evenly distributed on the lining in the longitudinal direction) denoted as F, according to the equilibrium relationship of force, we obtain:
2 n F y = B α 1 α 2 q R sin θ d θ
Integrating once yields
F y = 1 2 n B q R cos θ α 1 α 2
Additionally,
q = γ w H
The relationship between the hoop tension force and the height of the water head is given as follows:
F y = 1 2 n B γ w H R cos θ α 1 α 2
Thus,
F x = F y × tan α 1
F = F y / cos α 1
For a noncircular high-speed railway tunnel structure, the cross section mainly consists of the top arch sections (arch crown and arch foot) and bottom arch sections (inverted arch). Hence, the uneven water pressure acting on the tunnel structure is simplified as the evenly distributed load acting on the top and bottom sections. Using Equations (4)–(6), the hoop tension forces in the top part (F1) and bottom part (F2) were determined according to the accumulations of the equivalent force acting on each arch section. The internal stress from the simulation matched the actual water-pressure effect.

2.3. Equivalence Verification of Water-Pressure Loading Simulation
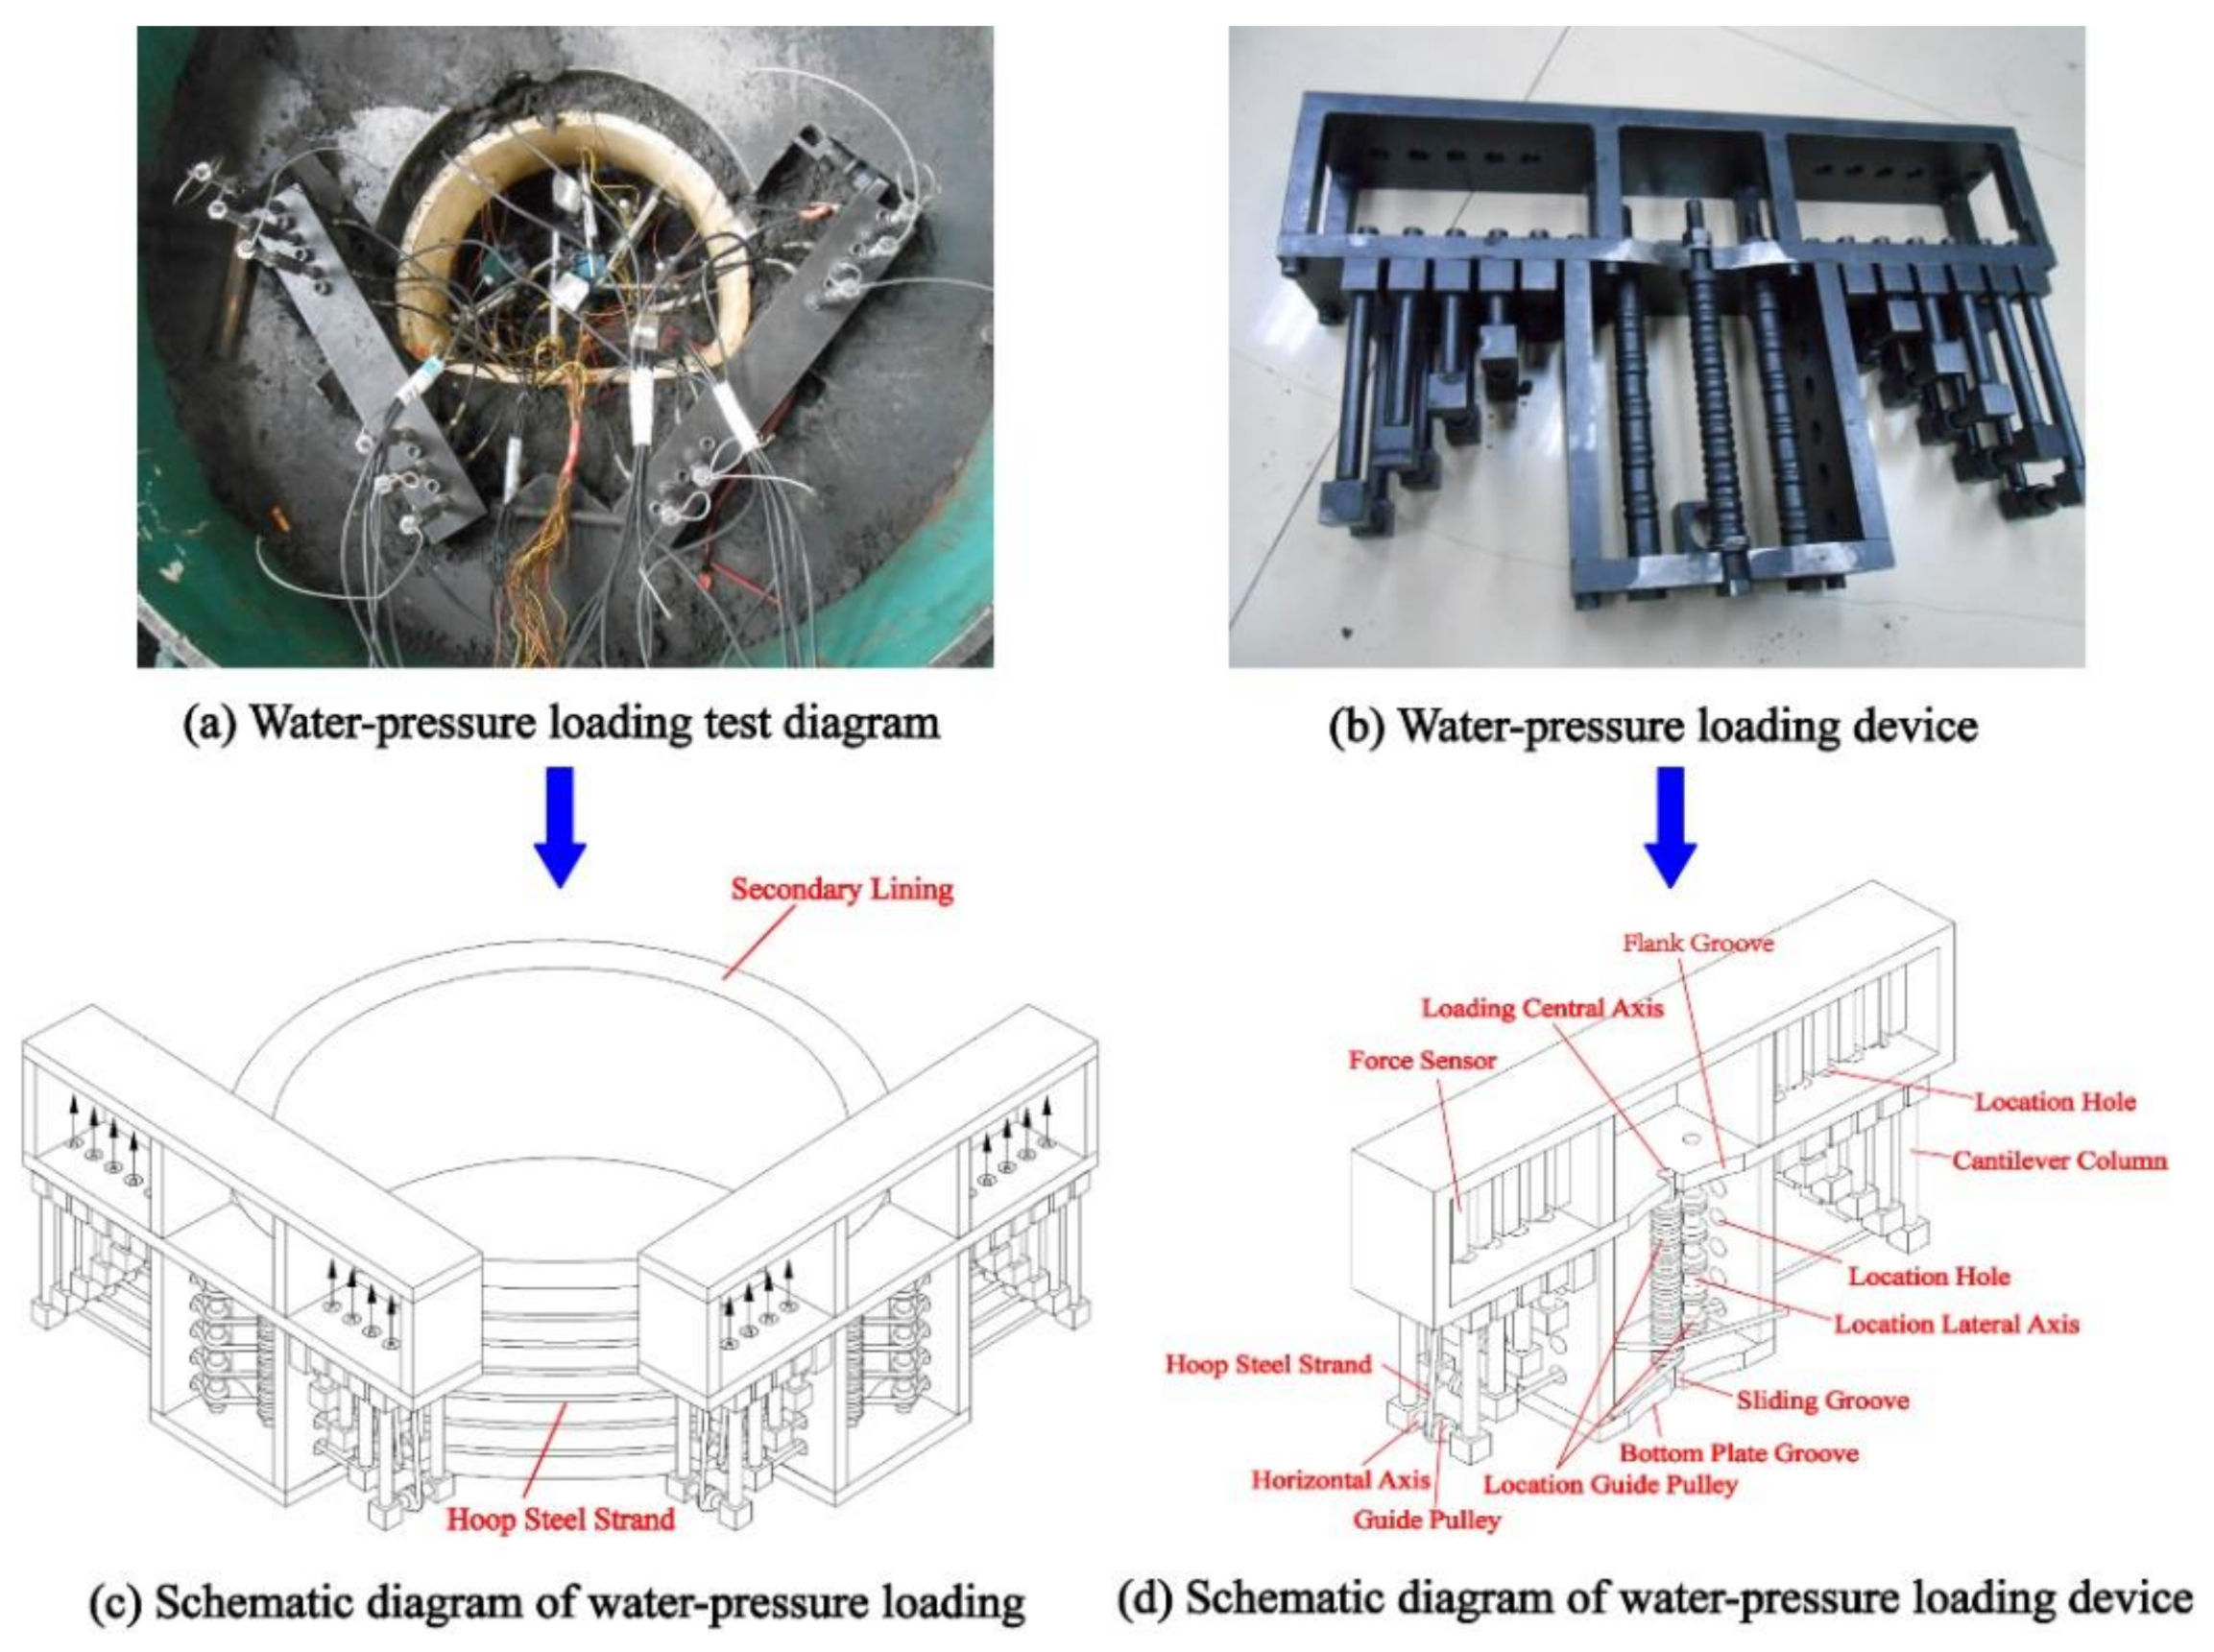
Depending on whether the secondary lining structure can withstand the water pressure, lining designs can be divided into two types: waterproof and drainage. The cross-sectional dimensions (secondary lining) of both lining types are shown in Figure 3a. To verify the equivalence of the water-pressure loading simulation, taking the waterproof-type lining section of a 350 km/h high-speed railway tunnel as example, a finite-element model was established for the comparative analysis of the internal lining stress between the actual water pressure and the simulated water pressure within the depth range of 10~100 m. The actual water pressure was applied directly to the lining (as shown in Figure 3b) through equivalent nodal loading, and the simulated water pressure was applied through a prestressed hoop tension load at both ends of the top and bottom sections of the lining, as shown in Figure 3c. The hoop tension forces (x- and y-axis components) in the top and bottom sections were calculated using Equations (4) and (5) and are presented in Table 1.
Two-dimensional load structure models of actual water pressure and equivalent water pressure were established, respectively, with finite element software ANSYS 15.0 to test the reliability of equivalent simulated water pressure loading. The internal forces (moment and axial loading) in the waterproof lining under a 60 m water level for the actual water pressure and the equivalent simulated water pressure are compared in Figure 4. The comparison indicates that the internal lining stress distribution under the simulated water pressure agreed well with the actual water pressure. The maximum positive and negative bending moments occurred at the inverted arch and bottom of the wall, and the maximum and minimum axial forces occurred at the bottom of the wall and the inverted arch, shown in Figure 4. The internal forces were largest at the inverted arch and the bottom of the wall. Hence, these locations were adopted to examine the consistency between the actual water pressure and the equivalent simulated water pressure with the underground water level ranging from 10 to 100 m. The relative error between the actual and simulated cases is shown in Table 2.
Overall, according to the comparison shown in Table 2, for the noncircular section, the difference between the internal stresses of the lining under the actual water pressure and the equivalent simulated water pressure was extremely small, the bending-moment error was <1%, and the axial-force error was <5%. Hence, the equivalent simulated water pressure obtained by adjusting the hoop forces was reasonable, and the bulb-shaped water-pressure distribution could be achieved in laboratory tests.

2.4. Test Device

2.4.1. Equivalent Water Pressure (Hoop) Loading Device

To achieve the foregoing loading procedure for the similitude model, a fully closed prestressed equivalent water pressure (hoop) loading device for the tunnel model test of the noncircular section was designed and used in this study, as shown in Figure 5. In the scaled laboratory tests, the top section forces (calculated and presented in Table 1) were evenly divided into five stages, and the bottom forces were divided into six stages. These forces were applied to the scaled tunnel lining structure using the unique device. The forces at the different stages were applied stepwise to the tunnel structure, so that the complete full loading closed simulated water pressure on the noncircular section tunnel was fulfilled. As described previously, the uneven (bulb-shaped) water pressure was accurately simulated, and the internal forces in the model were almost identical to the calculated internal forces under the actual water pressure. Thus, the high-speed highway tunnel under high water levels can be comprehensively studied using the proposed method. The unique device developed in this study is called a fully closed prestressed radial equivalent water pressure (hoop) loading device and is specifically designed and built for the noncircular section tunnel model water pressure.

2.4.2. Ground Stress Loading Test Device

In the similitude model test, the device used to apply the soil pressure around the tunnel was horizontally laid on the ground, and its dimensions were 3.60 m × 3.60 m × 0.30 m, as shown in Figure 6. The scaled tunnel model and similitude soil were placed inside this loading device. The hydraulic jacks and loading panels were installed in the perpendicular direction of the tunnel cross section so that the scaled tunnel remained in the plane stain deformation state during the loading process. Soil pressure was provided by horizontally installed hydraulic jacks on four sides and applied to the main structural model using similitude soil. The soil-pressure coefficients on different sides were simulated by changing the outputs of the hydraulic jacks in two directions and their ratio.

2.4.3. Test Data Measuring System

The layout of the stress and strain gauges on the scaled tunnel model is shown in Figure 7. Differential voltage displacement sensors with a resolution of 1/100 were placed at the arch crown, spandrel, haunch, arch springing, bottom of the wall, and inverted arch, and the interface contact pressure between the primary lining and the secondary lining was measured using a soil-pressure load cell. Gauges were also placed at corresponding locations on the excavation surface, along with a precise soil-pressure box, to measure the soil pressure on the secondary lining. Strain gauges were installed both inside and outside the lining structure to measure its deformations under loading. The internal stress of the lining was then calculated using the strain measurements.
During the scaled-model laboratory test, the applied water and soil pressures were closely monitored, and the changes in the strain on the scaled tunnel structure were carefully recorded. Using the collected data, the internal forces, e.g., the moment and axial loading, were calculated as follows:
N = 1 2 E ( ε i n + ε o u t ) b h
M = 1 12 E ( ε i n ε o u t ) b h 2
where b represents the unit length (1 m was used for all cases), and h represents the height of the scaled model.

2.5. Test Materials

In the scaled-model test, the dimension scale factor was 1:30, the volume weight similitude ratio was 1:1, and the similitude of all the physical quantities was derived according to the elastic scenario. According to the similitude law, the Poisson’s ratio, strain, and internal friction angle had a scale factor of 1:1 ( C μ = C ε = C ϕ = 1 ). The scale factor for the strength, stress, cohesion, and elastic modulus was 30 ( C R = C σ = C c = C E = 30 ). These ratios indicate that the similitude materials of the surrounding rocks were composed of barite powder, coal ash, fine sand, and engine oil.
For examining the mechanical characteristics of Class IV surrounding rock with different types of tunnels, a direct shear test was performed to determine the physical and mechanical parameters of the similitude soil model under different loads. The soil shear strengths under different pressures were determined in these tests. Additionally, the shear-strength indices were determined, including the cohesion C and internal friction angle φ. The parameter measurement device is shown in Figure 8, and the prototype and scaled-model mechanical properties are presented in Table 3.
The prototype lining structure was made of C35 concrete. Hence, for the scaled model, the lining structure was constructed using plaster, with a water-to-plaster weight ratio of 1:1.18. The model was prefabricated and assembled onsite to simulate the real site conditions. The mechanical properties of the prototype and scaled model are presented in Table 4.

2.6. Test Program

As mentioned previously, for the high-speed (350 km/h) railway tunnel of Class IV surrounding rock, a fully closed prestressed equivalent water pressure (hoop) loading device and ground stress compound loading devices were utilized in the scaled tunnel tests. By performing a series of tests involving only water pressure and both water and soil pressures, the incremental failure characteristics, worst loading cross section (rebar control design), and failure mode (particularly the limited status of extreme external loading) were investigated for both waterproof- and drainage-type tunnels.
According to the limited status index, the experiments were divided into two working conditions: water pressure alone and simultaneous water and soil pressures. Details are presented in Table 5.

3. Results and Discussion

3.1. Failure Model under Only Water Pressure

For load condition 1 (only water pressure), model tests with the scaled lining structure (both waterproof and drainage types) were performed in which prestressed radial forces were applied stepwise to the top and bottom parts, separately. The initial water pressure was 10 m; the equivalent hoop tension force is presented in Table 1. At each step, an additional water pressure of 10 m was applied to the scaled model until the model failed. Hence, through the tests, the patterns of the internal force regular patterns for both the waterproof and drainage linings under changes in the water pressure were obtained. Additionally, the ultimate water pressures and failure modes were determined.
The general stress state and ultimate failure state of the lining structure in the initial stage were taken as research objects, and the internal force distribution of the key parts of the tunnel lining structure, such as the arch crown, spandrel, haunch, arch springing, bottom of the wall, and inverted arch, under the two stress states was analyzed. For the drainage lining, the water head was 10 m (corresponding to 100 kPa, representing the general state of stress) and 49 m (corresponding to 490 kPa, representing the state of ultimate failure). For the waterproof lining, the water head was 20 m (corresponding to 200 kPa, representing the general state of stress) and 78 m (corresponding to 780 kPa, representing the state of ultimate failure). The distributions of the bending moment and axial force for the two types of lining structures (drainage and waterproof) in the general stress state and ultimate failure state are shown in Figure 9.
As shown in Figure 9, under the action of water pressure alone, the two types of lining structures exhibited similar distribution patterns of the internal forces (bending moment and axial force) from the general stress state to the ultimate failure state. The bending moment was distributed in a butterfly shape, with the arch crown, haunch, and bottom of the wall facing outward, and the arch springing and inverted arch facing inward. The bending moment of the inverted arch was larger than that of the arch crown. Among the locations, the inverted arch had the largest positive bending moment, and the bottom of the wall had the largest negative bending moment. In contrast, the axial force exhibited a flat and round distribution, and the whole section was under compression, which was relatively uniform. The axial force was relatively large for the inverted arch and the bottom of the wall, and relatively small for the arch crown and haunch.
The curves of the internal forces at key points of the drainage and waterproof lining with changes in the water pressure for the entire test are presented in Figure 10. As shown, the positive bending moment of the inverted arch and the negative bending moment of the bottom of the wall increased linearly, with an increase in the water pressure in a certain range (drainage lining: water pressure of <0.3 MPa; waterproof lining: water pressure of <0.6 MPa), and then exhibited the change characteristic of nonlinear failure. Among the parts of the tunnel lining, the absolute values of the positive and negative bending moments were the largest for the inverted arch and the bottom of the wall, respectively. The bending moments of the other parts were essentially unchanged, with small absolute values and minimal differences. The axial force increased linearly with an increase in the water pressure in a certain range (drainage lining: water pressure of <0.4 MPa; waterproof lining: water pressure of <0.6 MPa) and exhibited little difference among different parts. Thus, the bottom of the wall and the inverted arch were the two weakest parts of the lining structure under the action of water pressure.
The curves of the safety factor for key points of the drainage and waterproof lining structures under water pressure are presented in Figure 11. The following observations are made.
  • With an increase in the water pressure, the safety factor of the lining structure decreased nonlinearly. During the early stages of water-pressure growth, the safety factor declined rapidly and then became relatively flat.
  • Both the drainage-type and waterproof-type lining structures were controlled by a small eccentric compression. Among the parts, the bottom of the wall and inverted arch always had the smallest safety factors; thus, they were the key sections determining the failure of the lining structure.
  • Because the thickness of the bottom of the wall and the inverted arch of the waterproof lining were relatively large (the thickness of the inverted arch was 80 cm), the safety factor of the waterproof lining was significantly larger than that of the drainage lining (for which the thickness of the inverted arch was 60 cm). Thus, the structural design of the waterproof lining is more reasonable.
  • For the drainage lining, when the water pressure was <0.3 MPa, the safety factor of the lining structure was >2.4, indicating that the structure was safe. When the water pressure was between 0.3 and 0.49 MPa, the safety factors of the inverted arch and the bottom of the wall were <2.4 but >1.0, indicating that the structural safety reserve was small and in a dangerous stage. When the water pressure was >0.49 MPa, the safety factor of the lining structure was <1.0, and the structure failed.
  • For the waterproof lining, when the water pressure was <0.6 MPa, the safety factor of the lining structure was >2.4, indicating that the structure was safe. When the water pressure was between 0.6 and 0.78 MPa, the safety factors of the inverted arch and the bottom of the wall were <2.4 but >1.0, indicating that the structural safety reserve was small and in a dangerous stage. When the water pressure was >0.78 MPa, the safety factor of the lining structure was <1.0, and the structure failed.
Throughout the loading process, the failure modes of the drainage- and waterproof-type lining structures were roughly similar, indicating that the arch crown and inverted arch were concave towards the excavation face and that the bottom of the wall on both sides was convex outwards. For both types of lining structures, first, compression and shear failure occurred at the bottom of the wall, and then cracks appeared on the outside of the bottom of the wall. Then, compression and shear failure occurred in the inverted arch, and cracks appeared on the inner surface. The failure of the lining structure under the action of only water pressure is shown in Figure 12.
The test results indicate the following.
  • The ultimate water head of the drainage lining of the high-speed railway tunnel of Class IV surrounding rock with a design speed of 350 km/h was 49 m (490 kPa), and that of the waterproof lining was 78 m (780 kPa). For both types of lining structures, the critical sections for ensuring safety were the bottom of the wall and the inverted arch.
  • Under the action of only water pressure, the waterproof lining significantly improved the water-pressure resistance (by approximately 59%) compared with the drainage lining.
  • According to the test results indicating that the bending moment of the structure with a water head of 60 m (0.6 MPa) had a catastrophe point and the safety factor was <2.4, it is reasonable to take a 60 m water head as the design load index in the design of the waterproof tunnel lining. Similarly, for the drainage-type lining, it is appropriate to take a 30 m water head as the design load index.

3.2. Failure Model under Variable Water Pressure and Constant Soil Pressure

According to the statistical results for a large number of tunnel engineering field measurements, the surrounding rock pressure of the lining structure is <0.8 MPa in most cases. Therefore, test condition 2 involved applying water pressure to the lining under a constant soil pressure of 0.8 MPa, to study the lining stress failure characteristics under the combined action of water and soil pressures and investigate the effects of changes in the water pressure on the cracking failure of the tunnel during operation. In the model test of two types of lining structures (drainage and waterproof) in test condition 2, soil pressure was first slowly applied to the lining structures until it reached 0.8 MPa; then, it was kept constant (the lateral pressure coefficient was 0.5). Then, water pressure was applied stepwise (100 kPa in each step) until the lining structure failed, to determine the distribution law of the internal forces of the two lining types (drainage and waterproof) with changes in the water pressure under a constant soil pressure, the ultimate water pressure that could be borne, and the mechanical evolution process of gradual failure.
For the drainage lining, the following two water pressures were selected: 0 kPa (constant soil pressure of 0.8 MPa) and 750 kPa (ultimate failure state). For the waterproof lining, the following two water pressures were selected: 0 kPa (constant soil pressure of 0.8 MPa) and 1180 kPa (ultimate failure state). The distributions of the bending moment and axial force for the two linings (drainage and waterproof) are shown in Figure 13.
As shown in Figure 13, under the effect of the variable water pressure and constant soil pressure (0.8 MPa), the two lining structures (drainage and waterproof) exhibited different distribution patterns and characteristics of the internal forces (bending moment and axial force) from the general stress state to the ultimate failure state. The distributions of the internal forces (bending moment and axial force) for the two lining structures (drainage and waterproof) from the general stress state to the ultimate failure state are described as follows.
  • Under only the constant soil pressure (0.8 MPa), the bending moment of the lining structure under the general stress state exhibited a butterfly-shaped distribution dominated by the upper part of the structure (arch). The maximum positive bending moment occurred at the arch crown, and the maximum negative bending moment occurred at the haunch.
  • For both the drainage- and waterproof-type lining structures, when the ultimate failure state was reached, the locations of the maximum positive moment and negative moment changed from the upper part (arch crown, haunch) to the lower part (inverted arch, bottom of the wall). Thus, the inverted arch and the bottom of the wall became the key control sections for the design of the drainage- and waterproof-type lining structures under the variable water pressure and constant soil pressure.
  • From the general stress state of constant soil pressure (0.8 MPa) to the ultimate failure state, the axial force of the lining structure generally exhibited a flat circular distribution and remained relatively uniform. The axial force distributions of the drainage- and waterproof-type lining structures exhibited a gradual increase from the arch crown to the inverted arch.
The curves of the internal forces at key points of the drainage and waterproof lining structures with changes in the water pressure for the entire test are presented in Figure 14. The following observations are made.
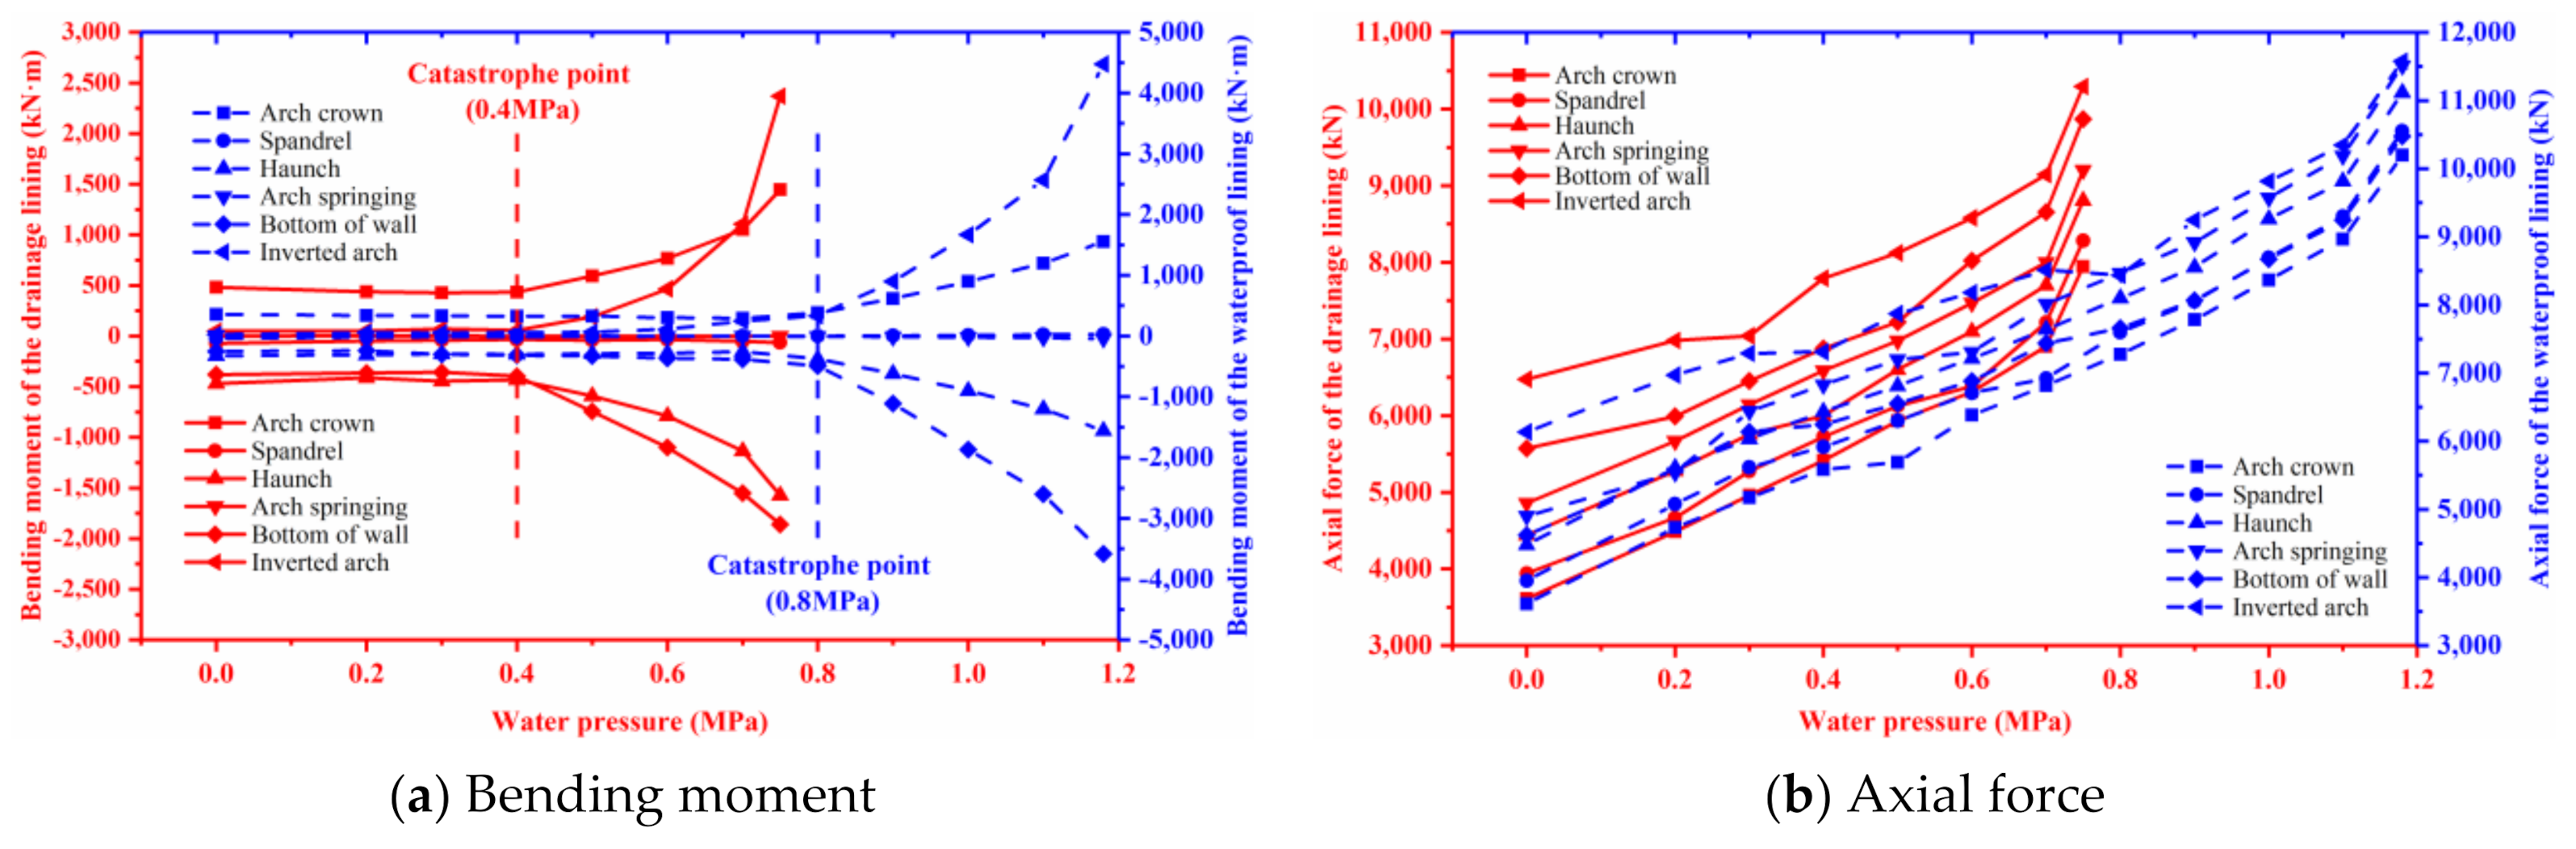
  • The internal forces of the two types of linings changed similarly with respect to the water pressure. The positive bending moments of the inverted arch and the arch crown and the negative bending moments of the bottom of the wall and the haunch increased approximately linearly with the increasing water pressure, within a certain range (drainage lining: water pressure of <0.4 MPa; waterproof lining: water pressure of <0.8 MPa) and then exhibited the change characteristic of nonlinear failure.
  • For both the lining structures, with the increasing water pressure, the location of the maximum positive bending moment changed from the arch crown to the inverted arch, and the location of the maximum negative bending moment changed from the haunch to the bottom of the wall. Thus, when the water pressure was low, the arch crown and haunch were the key control sections for the lining-structure failure. With the increasing water pressure, the inverted arch and the bottom of the wall were the key control sections for the lining-structure failure.
  • For both linings, the axial force increased linearly with the increasing water pressure.
The curves of the safety factor for key points of the drainage and waterproof linings with respect to the water pressure are presented in Figure 15. The following observations are made.
  • The safety factor decreased nonlinearly with the increasing water pressure, and all sections were controlled by a small eccentric compression. The safety factors of the haunch, bottom of the wall, and inverted arch, which were the key control sections of the lining structure, were small.
  • For the drainage lining, when the water pressure was <0.4 MPa, the safety factor of the lining structure was >2.4, indicating that the structure was safe. When the water pressure was between 0.4 and 0.78 MPa, the safety factors of the inverted arch and the bottom of the wall were <2.4 but >1.0, indicating that the structural safety reserve was small and in a dangerous stage. When the water pressure was >0.78 MPa, the safety factor of the lining structure was <1.0, and the structure failed.
  • For the waterproof lining, when the water pressure was <0.85 MPa, the safety factor of the lining structure was >2.4, indicating that the structure was safe. When the water pressure was between 0.85 and 1.18 MPa, the safety factors of the inverted arch and the bottom of the wall were <2.4 but >1.0, indicating that the structural safety reserve was small and in a dangerous stage. When the water pressure was >1.18 MPa, the safety factor of the lining structure was <1.0, and the structure failed.
Throughout the loading process, the failure modes of the drainage- and waterproof-type lining structures were approximately identical. For both lining structures, first, compression and shear failure occurred at the bottom of the wall, and cracks appeared on the outside of the bottom of the wall. Then, compression and shear failure occurred in the inverted arch, and cracks appeared on the inner surface. As the load increased, cracks appeared on the outside of the haunch and finally on the inside of the arch crown. The failure of the lining structures under the variable water pressure and constant soil pressure (0.8 MPa) is shown in Figure 16.
The test results indicate the following.
  • When the constant soil pressure was 0.8 MPa, the ultimate bearing water head of the drainage lining of the high-speed railway tunnel of Class V surrounding rock with a design speed of 350 km/h was 75 m (750 kPa), and the ultimate bearing water head of the waterproof lining was 118 m (1180 kPa). For both linings, the key control sections for the failure of the lining structure were the bottom of the wall and the inverted arch.
  • Under a variable water pressure and constant soil pressure (0.8 MPa), compared with the drainage lining, the waterproof lining had a significantly higher water-pressure resistance (by approximately 59%) than the drainage lining.
  • The test results indicated that the safety factor of the waterproof lining was <2.4 when the water head was 85 m (0.85 MPa); thus, it is reasonable to take 85 m as the design load index for the waterproof lining. Similarly, for the drainage lining, a design load index of 40 m is recommended.
  • Compared with the condition of only water pressure, the ultimate bearing capacities of the drainage and waterproof linings were increased by 26 and 40 m, respectively, and the design heads were increased by 10 and 25 m, respectively. Thus, the condition of only water pressure was the most unfavorable condition. Therefore, in the lining-structure design for the water-rich mined tunnel for the high-speed railway with a design speed of 350 km/h, it can be concluded that the ultimate bearing head is 49 m (0.49 MPa) and 78 m (0.78 MPa) for the drainage- and waterproof-type lining structures, respectively. Design load indices of 30 m (0.30 MPa) and 60 m (0.60 MPa) are recommended for the drainage and waterproof linings, respectively.

4. Conclusions

  • According to the principle of mechanical equivalence, by using the “indirect” simulation method of hoop loading, a full-circle closed equivalent water pressure (hoop pull) loading device was developed for the model test of a tunnel with a noncircular section, to achieve the nonuniform water loading of the mined-tunnel lining. Using the finite-element method, the “indirect” simulation of the bulb-shaped water-pressure distribution under hoop loading was confirmed to be equivalent and reasonable, which enabled accurate predictions of the effect of the water pressure on the tunnel structure.
  • For the high-speed railway tunnel of Class IV surrounding rock with a design speed of 350 km/h, a large-scale (similitude ratio of 1:30) model test was performed using a nonuniform fully closed equivalent water (hoop) loading device and a surrounding rock pressure complex loading device. The progressive failure characteristics of different types of lining structures (waterproof and drainage), the most unfavorable stress section (reinforcement control section), and the failure modes of instability were investigated. Additionally, the limit index of the tunnel lining structure in a water-rich stratum under an external load and a calculation method for it was proposed.
  • For the high-speed railway tunnel of Class IV surrounding rock with a design speed of 350 km/h, both the drainage and waterproof linings were controlled by a small eccentric compression under the two test conditions of only water pressure and a variable water pressure and constant soil pressure, and the key control sections for instability were the bottom of the wall and the inverted arch. In comparison with the drainage lining, the waterproof lining had a significantly higher water-pressure resistance (by approximately 59%) than the drainage lining.
  • Considering the high-speed railway tunnel of Class IV surrounding rock with a design speed of 350 km/h as an example, the ultimate bearing head of the drainage lining structure is 49 m (0.49 MPa), and the ultimate bearing head of the waterproof lining structure is 78 m (0.78 MPa). The proposed design load index for the drainage-type lining structure is 30 m (0.3 MPa), and that for the waterproof-type lining structure is 60 m (0.6 MPa).

Author Contributions

Z.Z. helped perform the analysis with constructive discussions; B.C. performed the data analyses and wrote the manuscript; Q.L. contributed to the graphing and data analyses. All authors have read and agreed to the published version of the manuscript.

Funding

This research was funded by the High Speed Railway and Natural Science United Foundation of China (U1934213).

Institutional Review Board Statement

Not applicable.

Informed Consent Statement

Not applicable.

Data Availability Statement

The data presented in this study are available on request from the corresponding author. The data are not publicly available because the funding project has not ended.

Acknowledgments

The authors are very grateful for the High Speed Railway and Natural Science United Foundation of China (U1934213).

Conflicts of Interest

The authors declare that they have no conflict of interest to this work. We declare that we do not have any commercial or associative interest that represents a conflict of interest in connection with the work submitted.

References

  1. Bian, K.; Xiao, M.; Chen, J. Study on coupled seepage and stress fields in the concrete lining of the underground pipe with high water pressure. Tunn. Undergr. Space Technol. 2009, 24, 287–295. [Google Scholar] [CrossRef]
  2. Cheng, P.; Zhao, L.-H.; Li, L.; Zou, J.-F.; Luo, W. Limiting drainage criterion for groundwater of mountain tunnel. J. Cent. South Univ. 2014, 21, 4660–4668. [Google Scholar] [CrossRef]
  3. Khave, G.J. Delineating subterranean water conduits using hydraulic testing and machine performance parameters in TBM tunnel post-grouting. Int. J. Rock Mech. Min. Sci. 2014, 70, 308–317. [Google Scholar] [CrossRef]
  4. Yang, G.; Wang, X.; Wang, X.; Cao, Y. Analyses of seepage problems in a subsea tunnel considering effects of grouting and lining structure. Mar. Georesources Geotechnol. 2016, 34, 65–70. [Google Scholar] [CrossRef]
  5. Zhu, B.; Wu, L.; Peng, Y.; Zhou, W.; Chen, C. Risk assessment of water inrush in tunnel through water-rich fault. Geotech. Geol. Eng. 2018, 36, 317–326. [Google Scholar] [CrossRef]
  6. Li, Y.; Zhang, D.; Fang, Q.; Yu, Q.; Xia, L. A physical and numerical investigation of the failure mechanism of weak rocks surrounding tunnels. Comput. Geotech. 2014, 61, 292–307. [Google Scholar] [CrossRef]
  7. Guan, B.S. The loading conditions of shotcrete rock bolt tunnel support. Chin. J. Geotech. Eng. 1982, 4, 183–192. [Google Scholar]
  8. Kitterød, N.O.; Colleuille, H.; Wong, W.; Pedersen, T.S. Simulation of groundwater drainage into a tunnel in fractured rock and numerical analysis of leakage remediation, Romeriksporten tunnel, Norway. Hydrogeol. J. 2000, 8, 480–493. [Google Scholar]
  9. Li, X.-B.; Zhang, W.; Li, D.-Y.; Wang, Q.-S. Influence of underground water seepage flow on surrounding rock deformation of multi-arch tunnel. J. Cent. South Univ. Technol. 2008, 15, 69–74. [Google Scholar] [CrossRef]
  10. Coli, N.; Pranzini, G.; Alfi, A.; Boerio, V. Evaluation of rock-mass permeability tensor and prediction of tunnel inflows by means of geostructural surveys and finite element seepage analysis. Eng. Geol. 2008, 101, 174–184. [Google Scholar] [CrossRef]
  11. Lei, M.; Peng, L.; Shi, C. Model test to investigate the failure mechanisms and lining stress characteristics of shallow buried tunnels under unsymmetrical loading. Tunn. Undergr. Space Technol. 2015, 46, 64–75. [Google Scholar] [CrossRef]
  12. Long, Y.Y.; Tan, Y. Soil arching due to leaking of tunnel buried in water-rich sand. Tunn. Undergr. Space Technol. 2020, 95, 103158. [Google Scholar] [CrossRef]
  13. Chabot, J.D. Entwaesserung bergmaennischer Tunnel/Draining underground tunnels. Tunnel 2002, 21, 18–24. [Google Scholar]
  14. Lipponen, A.; Manninen, S.; Niini, H.; Rönkä, E. Effect of water and geological factors on the long-term stability of fracture zones in the Päijänne Tunnel, Finland: A case study. Int. J. Rock Mech. Min. Sci. 2005, 42, 3–12. [Google Scholar] [CrossRef]
  15. Ayhan, M.; Topal, E. Excavation and support design of the Dicle–Kralkizi water tunnel: An overview. Tunn. Undergr. Space Technol. 2005, 20, 81–87. [Google Scholar] [CrossRef]
  16. Hwang, J.H.; Lu, C.C. A semi-analytical method for analyzing the tunnel water inflow. Tunn. Undergr. Space Technol. 2007, 22, 39–46. [Google Scholar] [CrossRef]
  17. Wang, X.; Tan, Z.; Wang, M.; Zhang, M.; Ming, H. Theoretical and experimental study of external water pressure on tunnel lining in controlled drainage under high water level. Tunnell. Undergr. Space Technol. 2008, 23, 552–560. [Google Scholar] [CrossRef]
  18. Li, D.; Li, X.; Li, C.C.; Huang, B.; Gong, F.; Zhang, W. Case studies of groundwater flow into tunnels and an innovative water-gathering system for water drainage. Tunn. Undergr. Space Technol. 2009, 24, 260–268. [Google Scholar] [CrossRef]
  19. Fernandez, G.; Moon, J. Excavation-induced hydraulic conductivity reduction around a tunnel–Part 1: Guideline for estimate of ground water inflow rate. Tunn. Undergr. Space Technol. 2010, 25, 560–566. [Google Scholar] [CrossRef]
  20. Moon, J.; Jeong, S. Effect of highly pervious geological features on ground-water flow into a tunnel. Eng. Geol. 2011, 117, 207–216. [Google Scholar] [CrossRef]
  21. Yeh, H.D.; Chang, Y.C. Recent advances in modeling of well hydraulics. Adv. Water Resour. 2013, 51, 27–51. [Google Scholar] [CrossRef]
  22. Wang, T.; Wu, H.; Li, Y.; Gui, H.; Zhou, Y.; Chen, M.; Xiao, X.; Zhou, W.; Zhao, X. Stability analysis of the slope around flood discharge tunnel under inner water exosmosis at Yangqu hydropower station. Comput. Geotech. 2013, 51, 1–11. [Google Scholar] [CrossRef]
  23. Li, P.; Zhou, X. Mechanical behavior and shape optimization of lining structure for subsea tunnel excavated in weathered slot. China Ocean. Eng. 2015, 29, 875–890. [Google Scholar] [CrossRef]
  24. Fang, Y.; Guo, J.; Grasmick, J.; Mooney, M. The effect of external water pressure on the liner behavior of large cross-section tunnels. Tunn. Undergr. Space Technol. 2016, 60, 80–95. [Google Scholar] [CrossRef]
  25. Li, P.; Wang, F.; Fang, Q. Undrained analysis of ground reaction curves for deep tunnels in saturated ground considering the effect of ground reinforcement. Tunn. Undergr. Space Technol. 2018, 71, 579–590. [Google Scholar] [CrossRef]
  26. Qiu, J.; Qin, Y.; Lai, J.; Wang, K.; Niu, F.; Wang, H.; Zhang, G. Structural response of the metro tunnel under local dynamic water environment in loess strata. Geofluids 2019, 2019, 1–16. [Google Scholar] [CrossRef] [Green Version]
  27. Guo, R.; Zhang, M.; Xie, H.; He, C.; Fang, Y.; Wang, S. Model test study of the mechanical characteristics of the lining structure for an urban deep drainage shield tunnel. Tunn. Undergr. Space Technol. 2019, 91, 103014. [Google Scholar] [CrossRef]
  28. Bazant, Z.P. Mechanics of Geomaterials, Rocks, Concrete, Soils; Wiley: Hoboken, NJ, USA, 1985. [Google Scholar]
  29. Eisenstein, Z.D. Large undersea tunnels and the progress of tunnelling technology. Tunn. Undergr. Space Technol. 1994, 9, 283–292. [Google Scholar] [CrossRef]
  30. Park, I.J.; Park, M.J.; Kim, S.I.; Kwak, C.-W.; Jang, S.-Y. Stability analysis of tunnel spillway under internal water pressure. J. Korean Tunn. Undergr. Space Assoc. 2005, 7, 63–72. [Google Scholar]
  31. He, C.; Feng, K.; Su, Z.X. Development and application of loading test system of prototype structure for underwater shield tunnel with large cross-section. Chin. J. Rock Mech. Eng. 2011, 30, 254–266. [Google Scholar]
  32. Zhou, Y.; Su, K.; Wu, H. Hydro-mechanical interaction analysis of high pressure hydraulic tunnel. Tunn. Undergr. Space Technol. 2015, 47, 28–34. [Google Scholar] [CrossRef]
  33. Xue, X.; Zhang, J.; Zhou, X. Reliability evaluation of water-rich loess tunnel with lining crack based on extension theory. Adv. Civ. Eng. 2019, 2019, 1–10. [Google Scholar] [CrossRef]
  34. Zhou, Z.; Tan, Z.; Liu, Q.; Zhao, J.; Dong, Z. Experimental investigation on mechanical characteristics of waterproof system for Near-Sea tunnel: A case study of the Gongbei Tunnel. Symmetry 2020, 12, 1524. [Google Scholar] [CrossRef]
  35. Lyu, H.M.; Shen, S.L.; Zhou, A.; Chen, K.-L. Calculation of pressure on the shallow-buried twin-tunnel in layered strata. Tunn. Undergr. Space Technol. 2020, 103, 103465. [Google Scholar] [CrossRef]
  36. Shimojima, E.; Tanaka, T.; Hoso, Y.; Yoshioka, R.; Davis, G. Using short-and long-term transients in seepage discharge and chemistry in a mountain tunnel to quantify fracture and matrix water fluxes. J. Hydrol. 2000, 234, 142–161. [Google Scholar] [CrossRef]
  37. Lee, I.M.; Nam, S.W.; Ahn, J.H. Effect of seepage forces on tunnel face stability. Can. Geotech. J. 2003, 40, 342–350. [Google Scholar] [CrossRef]
  38. Xuhua, R.; Xiangrong, C.; Zhigang, S. Water problems and corresponding countermeasures in projects of deep-lying long tunnels located in water-rich regions. Chin. J. Rock Mech. Eng. 2004, 23, 1924–1929. [Google Scholar]
  39. Xie, X.-L.; Su, H.-D. Mechanical behavior of prestressed double composite linings of Yellow-river-crossing tunnel. J. Yangtze River Sci. Res. Inst. 2011, 28, 180. [Google Scholar]
  40. Zhang, J.; Li, S.; Li, L.; Zhang, Q.; Xu, Z.; Wu, J.; He, P. Grouting effects evaluation of water-rich faults and its engineering application in Qingdao Jiaozhou Bay Subsea Tunnel, China. Geomech. Eng. 2017, 12, 35–52. [Google Scholar] [CrossRef]
  41. Pan, Q.; Dias, D. Three dimensional face stability of a tunnel in weak rock masses subjected to seepage forces. Tunn. Undergr. Space Technol. 2018, 71, 555–566. [Google Scholar] [CrossRef]
  42. Zhang, J.; Li, S.; Zhang, Q.; Zhang, X.; Li, P.; Wang, D.; Weng, X. Mud inrush flow mechanisms: A case study in a water-rich fault tunnel. Bull. Eng. Geol. Environ. 2019, 78, 6267–6283. [Google Scholar] [CrossRef]
  43. Li, Z.; He, C.; Chen, Z.; Yang, S.; Ding, J.; Pen, Y. Study of seepage field distribution and its influence on urban tunnels in water-rich regions. Bull. Eng. Geol. Environ. 2019, 78, 4035–4045. [Google Scholar] [CrossRef]
  44. Wei, W.B.; Cheng, Y.M. Stability analysis of slope with water flow by strength reduction method. Soils Found. 2010, 50, 83–92. [Google Scholar] [CrossRef] [Green Version]
  45. Mengshu, W.; Zhongsheng, T. The construct technology of tunnel and underground engineering in China. Eng. Sci. 2010, 12, 4–10. [Google Scholar]
  46. Kværner, J.; Snilsberg, P. Groundwater hydrology of boreal peatlands above a bedrock tunnel—Drainage impacts and surface water groundwater interactions. J. Hydrol. 2011, 403, 278–291. [Google Scholar] [CrossRef]
  47. Feng, K.; He, C.; Fang, Y.; Jiang, Y. Study on the mechanical behavior of lining structure for underwater shield tunnel of high-speed railway. Adv. Struct. Eng. 2013, 16, 1381–1399. [Google Scholar] [CrossRef]
  48. Ma, D.; Miao, X.; Bai, H.; Huang, J.; Pu, H.; Wu, Y.; Zhang, G.; Li, J. Effect of mining on shear sidewall groundwater inrush hazard caused by seepage instability of the penetrated karst collapse pillar. Nat. Hazards 2016, 82, 73–93. [Google Scholar] [CrossRef]
  49. Sun, Z.; Zhang, J.; Su, Z.; Xue, X. Seepage-Stress Coupling Analysis of Water-Rich Loess Tunnel. In Proceedings of the 4th International Conference on Sensors, Measurement and Intelligent Materials, Shenzhen, China, 27–28 December 2015; Atlantis Press: Zhengzhou, China, 2016; Volume 43, pp. 1187–1190. [Google Scholar]
  50. Zhang, N.; Shen, J.S.; Zhou, A.; Arulrajah, A. Tunneling induced geohazards in mylonitic rock faults with rich groundwater: A case study in Guangzhou. Tunn. Undergr. Space Technol. 2018, 74, 262–272. [Google Scholar] [CrossRef]
Figure 1. Topographic and geomorphological sketch of the study area.
Jmse 09 00627 g001
Figure 2. Principle of equivalent water-pressure loading for noncircular cross section.
Jmse 09 00627 g002
Figure 3. Comparison of the equivalent simulated water pressure and actual water-pressure loading.
Jmse 09 00627 g003
Figure 4. Comparison of the equivalent simulated water pressure and actual water-pressure loading.
Jmse 09 00627 g004
Figure 5. Fully closed prestressed equivalent water pressure (hoop) loading device.
Jmse 09 00627 g005
Figure 6. Soil-pressure loading test device.
Jmse 09 00627 g006
Figure 7. Measurement system.
Jmse 09 00627 g007
Figure 8. Model material parameter measurement.
Jmse 09 00627 g008
Figure 9. Distributions of the internal forces in the general stress state and ultimate failure state.
Jmse 09 00627 g009
Figure 10. Relationship between the internal forces and the water pressure.
Jmse 09 00627 g010
Figure 11. Relationship between the safety factor and the water pressure.
Jmse 09 00627 g011
Figure 12. Failure of the lining structure.
Jmse 09 00627 g012
Figure 13. Distributions of the internal forces in the general stress state and ultimate failure state.
Jmse 09 00627 g013
Figure 14. Relationship between the internal forces and the water pressure.
Jmse 09 00627 g014
Figure 15. Relationship between the safety factor and the water pressure.
Jmse 09 00627 g015
Figure 16. Failure of the lining structure.
Jmse 09 00627 g016
Table 1. Equivalent simulated hoop tension forces of the top and bottom sections with different underground water levels (based on Equations (4) and (5)). (Note: top half of the arch: α 1 = 32 ° , α 2 = 148 ° ; bottom half of the arch: α 1 = 70 ° , α 2 = 250 ° ).
Underground Water LevelHoop Tension of Top Tension SectionHoop Tension of Bottom Tension Section
FX1(N)FY1(N)FX2(N)FY2(N)
10 m460,945750,1363,547,8231,278,244
20 m822,1871,338,0175,199,5861,873,357
30 m1,183,4291,925,8986,851,3502,468,471
40 m1,544,6712,513,7798,503,1133,063,584
50 m1,905,9143,101,66010,154,8773,658,698
60 m2,267,1563,689,54111,806,6404,253,811
70 m2,628,3984,277,42213,458,4044,848,924
80 m2,989,6404,865,30315,110,1675,444,038
90 m3,350,8825,453,18416,761,9306,039,151
100 m3,712,1246,041,06518,413,6946,634,265
Table 2. Comparison between the actual water pressure and the equivalent simulated water pressure at the inverted arch and the bottom of the wall.
Underground Water LevelRelative Error
Bending MomentAxial Force
Inverted ArchBottom of WallInverted ArchBottom of Wall
10 m460,945750,1363,547,8231,278,244
20 m822,1871,338,0175,199,5861,873,357
30 m1,183,4291,925,8986,851,3502,468,471
40 m1,544,6712,513,7798,503,1133,063,584
50 m1,905,9143,101,66010,154,8773,658,698
60 m2,267,1563,689,54111,806,6404,253,811
70 m2,628,3984,277,42213,458,4044,848,924
80 m2,989,6404,865,30315,110,1675,444,038
90 m3,350,8825,453,18416,761,9306,039,151
100 m3,712,1246,041,06518,413,6946,634,265
Table 3. Mechanical parameters of the prototype and scaled model of the surrounding rock.
Surrounding RockCohesion
C/MPa
Internal Friction Angle
φ
Elastic Modulus
E/GPa
Volume Weight γ/(kN·m−3)
Prototype0.2–0.727–391.3–620–23
Scaled model0.01737.20.11722
Similitude ratio301301
Table 4. Physical and mechanical parameters of the prototype and scaled model of the lining structure.
LiningPrototypeScaled ModelScaled-Back PrototypeError (%)
Elastic modulus/GPa32.51.0732.11.23
Uniaxial compression stress/MPa26.00.8926.72.69
Table 5. Experimental category and load condition.
Load ConditionLoading Applied to Lining StructureExplanation
Load condition 1: only water pressure Jmse 09 00627 i001
(1)
This represents the situation where the lining structure is mainly under water pressure (i.e., the failure of the structure is controlled by the water pressure).
(2)
According to experimental results, the limited water pressures for both the waterproof and drainage lining types were determined.
(3)
The applicability of the two types (waterproof and drainage) of lining structures was assessed.
Load condition 2: first apply 0.8 MPa soil pressure and then apply water pressure Jmse 09 00627 i002
(1)
This represents the most common load condition for lining structures with a soil pressure of <0.8 MPa.
(2)
At a 0.8 MPa soil pressure, the water pressure was gradually increased to determine the maximum water pressures for both the waterproof and drainage linings.
(3)
The failure mode of the lining structure was determined for both water and soil pressure.
Publisher’s Note: MDPI stays neutral with regard to jurisdictional claims in published maps and institutional affiliations.

