Article

The Comparative Study of Adaptation Measure to Sea Level Rise in Thailand

by
Sompratana Ritphring
1,
Pattrakorn Nidhinarangkoon
1,*,
Keiko Udo
2 and
Hiroaki Shirakawa
3
1
Department of Water Resources Engineering, Kasetsart University, Bangkok 10900, Thailand
2
International Research Institute of Disaster Science, Tohoku University, Sendai 9808572, Japan
3
Graduate School of Environmental Studies, Nagoya University, Nagoya 4648601, Japan
*
Author to whom correspondence should be addressed.
J. Mar. Sci. Eng. 2021, 9(6), 588; https://doi.org/10.3390/jmse9060588
Submission received: 4 May 2021 / Revised: 24 May 2021 / Accepted: 25 May 2021 / Published: 28 May 2021
(This article belongs to the Special Issue Sea Level Rise: Drivers, Variability and Impacts)

Abstract

:
In the 21st century, global sea level rise associated with climate change will affect beach areas, which provide a number of benefits that include benefits to the recreational sector of the economy. In Thailand, the adoption of structural measures in order to slow down beach erosion and handle the impact of sea level rise is commonly implemented. However, structural measures often bring about negative effects on nearby coastal areas. For this reason, suitable adaptation measures should be determined, in order to protect beach areas and to sustain the tourism carrying capacity of the beach. This study analyzed historical shoreline changes using satellite images, and assessed beach value with the hedonic pricing method. We used a benefit–cost ratio analysis to evaluate the economic valuation assessment of Pattaya beach and Chalatat beach. The results showed that the beach values of Pattaya beach and Chalatat beach were 1,072,250 and 92,092 USD, respectively. The benefit–cost ratio analysis proposed that it is worth implementing beach nourishment for the adaptation measure to address all climate change scenarios. In response to climate change, recommendations could be applied to support beach tourism.

1. Introduction

Coastal areas provide benefits to humans and coastal ecosystems. Beaches act as buffers between the ocean and land, and tend to change dynamically in response to natural and human activities. The Intergovernmental Panel on Climate Change (IPCC) reports that global sea level rise associated with climate change is expected to be between 8–16 mm/y in the 21st century [1]. Between 1972 and 2011, measurements of sea levels from 22 tide gauge stations in the Gulf of Thailand and the Andaman Sea showed that sea levels had risen at an average rate of 6.5 mm/y [2]. Using the Bruun rule, the national beach loss rate projections between 2081–2100 are 45.8% for a scenario in which representative concentration pathway (RCP) is 2.6, and 71.8% for a scenario in which RCP is 8.5. In addition, 23 of 64 beach zones in Thailand will be completely lost during this same time period [3].
Shoreline retreat associated with sea level rise affects the tourism carrying capacity (TCC), which is a tool used to analyze beach development [4]. Many studies use TCC to assess the management of areas for tourism and recreation. For example, on South Andaman Island (India), TCC varied with changes between the physical and biotic environments [5]. Another study of TCC at Fandoqloo in Iran estimated TCC by using physical, real, and effective carrying capacity [
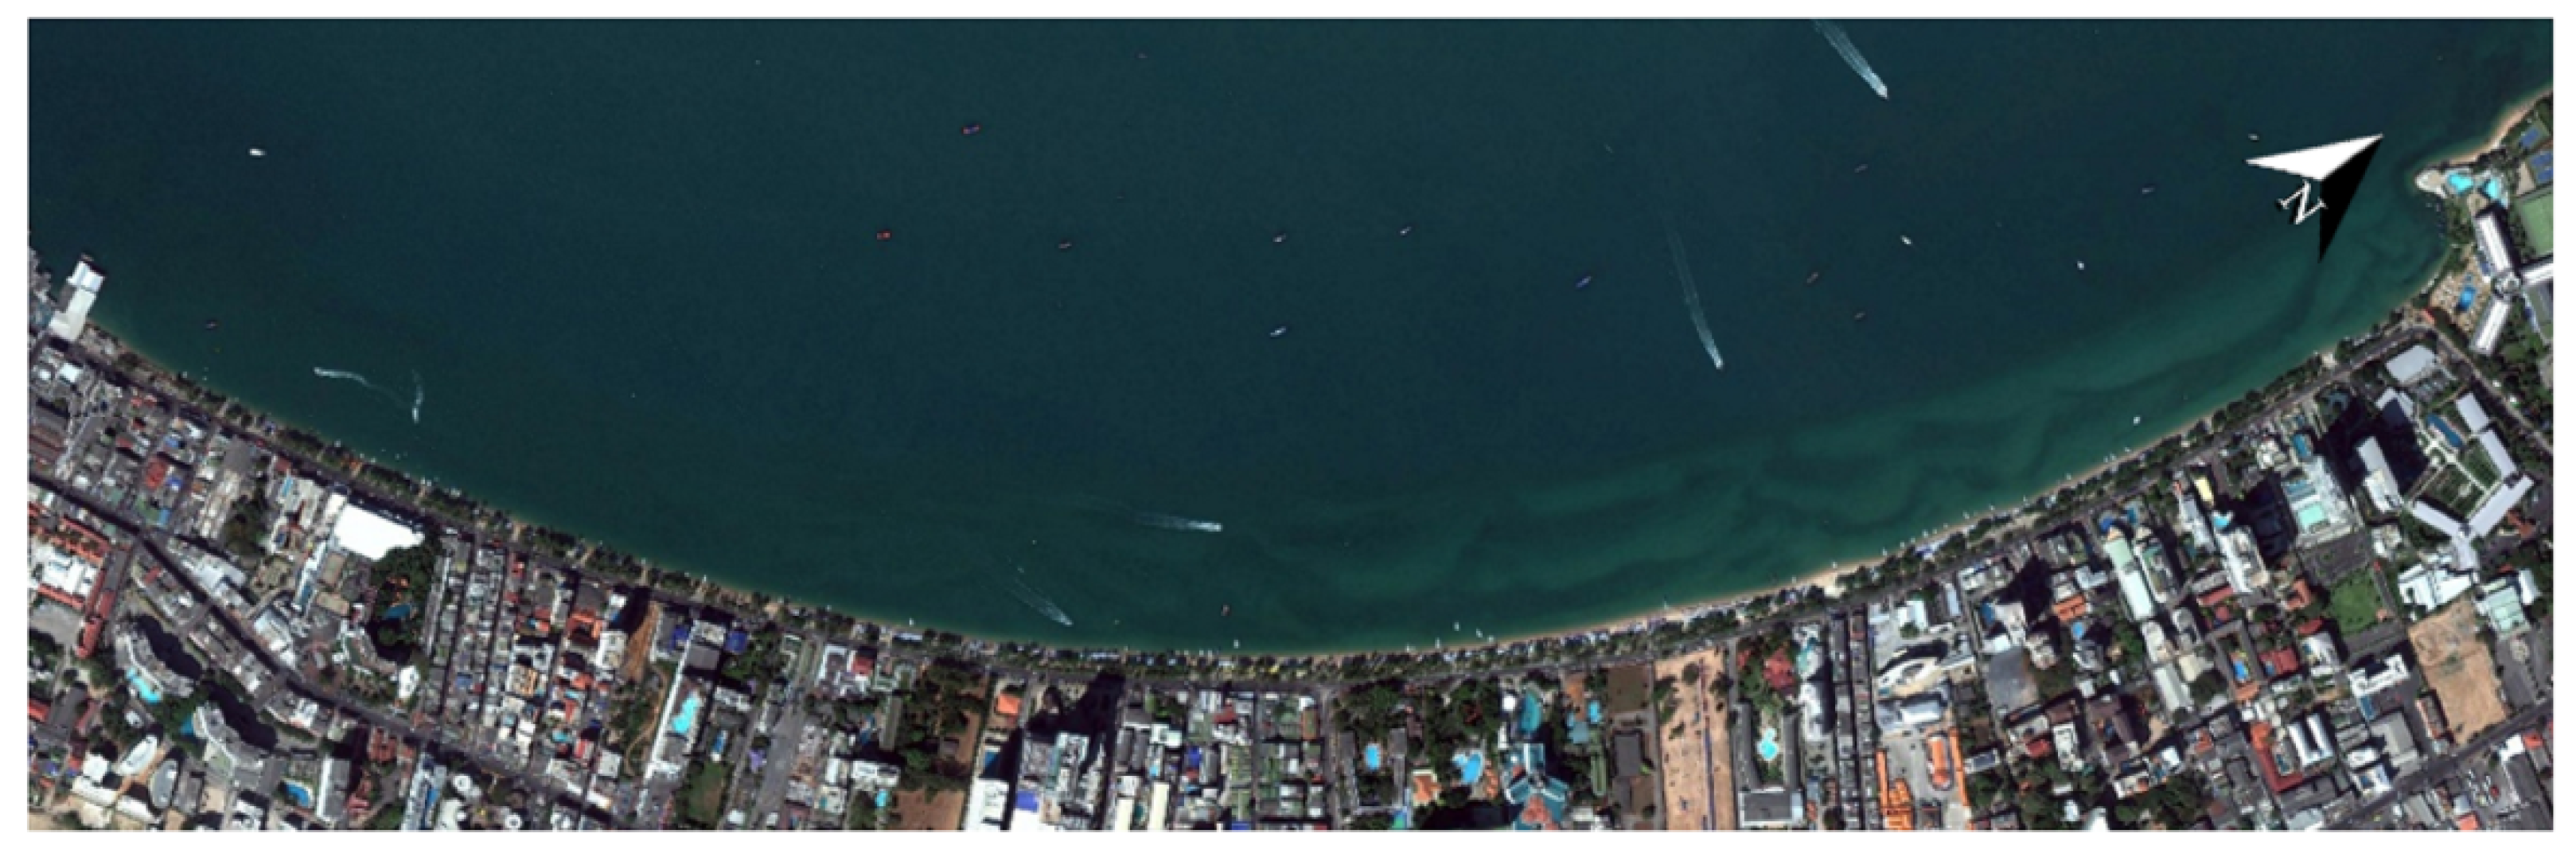
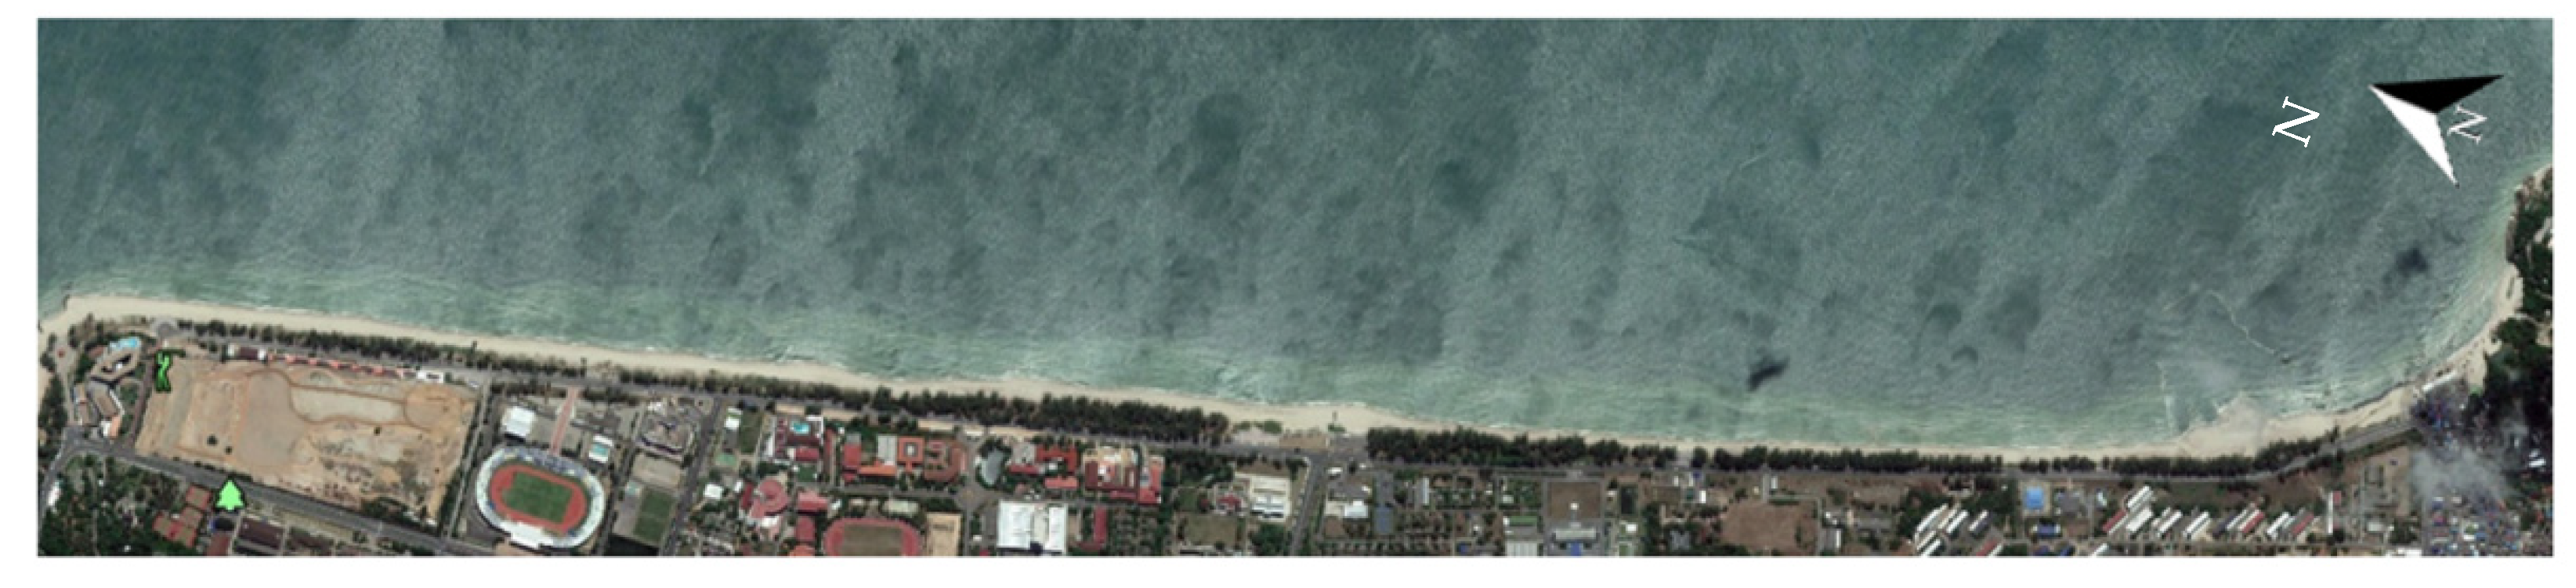
6]. The current effective carrying capacity (ECC) of Pattaya beach is about 200,000 visitors/day, whereas the ECC of Chalatat beach is 49,000 visitors/day, based on our previous study of the impact of sea level rise on TCC in Thailand [7]. Adaptation measures should be applied to help retain beach area and support the recreational needs associated with the Pattaya beach and Chalatat beach.
In this study, beach nourishment, seawall and setback were chosen to determine the suitable adaption measures to sea level rise for tourism beaches. The solutions that involve hard structures for beach protection affect the beach and nearby areas, and several coastal protection agencies have used beach nourishment adaptations to deal the impacts of beach erosion. Examples include more than 30 beaches in Florida, North Atlantic Coast, U.S. Pacific Coast (all USA) and Quintana Roo (Mexico) [8,9]. The seawall is one of the widely used coastal structures that protect the areas behind the wall from waves effect. It stabilizes the position of the upland. The coastal setback is the buffer area in which permanent constructions are not allowed [10]. The setback line was determined to save the coastal development areas from the natural areas and hazard such as erosion, storm surge and sea level rise. For example, Denmark, Canada, France, Germany, Australia selected setback to improve the coastal zone management [11,12].
In Thailand, beach nourishment was the earliest strategy used at Pattaya beach (Chonburi province) in 2017, with a total volume of 362,200 m3 of sediment taken from offshore. This project’s construction cost was approximately 14 million USD. In Songkhla, the ongoing beach nourishment construction cost at Chalatat beach was approximately 8.98 million USD for 40,929 m3 of sediment taken from the downdrift side of the beach. There are various seawall constructions along the Thai coast, of which the average construction price is 3,231,642 USD/km (https://govspending.data.go.th; accessed on 1 September 2020). Since then, several coastal areas have used seawalls to combat erosion, but it was not found to protect the beach fronting and adjacent seawall [13,14,15]. However, setback regulation has not yet been implemented in Thailand.
The economic value of ocean and beach tourism in Thailand is 30% of the country’s gross domestic product (GDP), and the value of tourism is about 2.81 billion USD/y (source: www.bltbangkok.com; accessed on 1 September 2020). Beaches are natural resources with intrinsic value, and as such, it is difficult to calculate their value. However, beach value can be assessed with the hedonic pricing method, which is an indirect method used to calculate a value that cannot be observed directly, but can be deduced from the value of observable market transactions. Considering that the value of characteristics is non-observable because it cannot be traded individually in the market [16], hedonic pricing models have been widely used to analyze the effect of factors on room rates [17].
The aim of this study to compare the adaptation measures to sea level rise in Thailand comprising beach nourishment, seawall and coastal setback. The shoreline changes was detected by using satellite images with the tidal correction method. In addition, we estimated the beach value with the hedonic pricing method. Shoreline retreat associated with sea level rise and TCC were analyzed in our previous study [7]. Beach nourishment was designed to restore the shoreline changes due to sea level rise back to the present situation in order to sustain the beach areas and TCC. Seawall is the adaptation that protects the beach and areas behind the seawall, but it does not cover the nearby areas. The coastal setback was determined to be the adaptation policy, which made the shoreline retreat by doing nothing. The economic valuation assessment was conducted using a benefit–cost ratio analysis that determined the beach value and the beach nourishment construction cost needed to protect the beach from sea level rise and beach erosion. The results can be applied more broadly for the planning and management of coastal tourism.

2. Study Areas and Data

2.1. Study Areas

The study areas are sandy beaches, which are located in Pattaya beach and Chalatat beach in Thailand (Figure 1). These coastal areas experience the effects of northeastern monsoons from the middle of October to the middle of February, which cause heavy rain and high waves. The average foreshore beach slope is 6.43 degrees for Chalatat beach and 9.34 degrees for Pattaya beach. The average sediment grain size is 0.27 mm for Chalatat beach and 0.30 mm for Pattaya beach. Pattaya beach represents a beach dominated by international tourism, whereas Chalatat beach represents a beach dominated by domestic tourism.

2.2. Data

Satellite images were taken from Google Earth. In addition, this study observed foreshore beach slope and sediment grain size. TCC and beach areas for four climate change scenarios, hotel room price, beach nourishment construction cost, seawall construction cost and cost of construction price for the setback were calculated.

2.2.1. Satellite Images

In this study, satellite images from Google Earth were used to measure shoreline position for Pattaya and Chalatat beaches for the dates listed in Table 1.

2.2.2. Tourism Carrying Capacity, Projected Shoreline Retreat, and Beach Areas for Each Climate Change Scenario

In our previous study of the impact of sea level rise on TCC in Thailand, we analyzed the shoreline retreat using the Bruun rule, beach area from satellite images, and TCC, which are physical carrying capacity (PCC), real carrying capacity (RCC) and effective carrying capacity (ECC) of Pattaya beach and Chalatat beach (Table 2 and Table 3) [7]. PCC is calculated from dividing beach areas by area required per user and rotation factor. RCC is the PCC multiplied by the correction factors. ECC was the RCC multiplied by the management capacity [5,18].

2.2.3. Hotel Room Price

Hotel attributes [16] in the study areas were collected from the websites www.booking.com (accessed on 19 June 2018) and www.agoda.com (accessed on 19 June 2018) for the units. These are online sites for booking the hotels, and were used as the source of empirical observation between 13 and 20 January 2019 (Table 4). There are 204 hotels at Pattaya beach spread along 2.84 km, and 14 hotels at Chalatat beach spread along 4.06 km within 5 km offset from the beach.

2.2.4. Beach Nourishment Construction Cost

Beach nourishment was adopted as the adaptation measure to cope with sea level rise at the two beaches. The quantity of beach nourishment was analyzed to retain the present condition of tourism carrying capacity.
The cost appraisal for sand in this study was estimated from the beach construction project at Pattaya beach and Chalatat beach. The sand cost was appraised at 23.21 USD/m3. The dune height and beach length of the study areas are shown in Table 5. The construction cost (present value) was determined from dune height, beach length, shoreline retreat, and sand appraisal per cubic meter (Table 6 and Table 7). The maintenance cost of the beach nourishment project was estimated using a Marine Department of Thailand report [19,20] and was calculated at 34,000 USD/y.

2.2.5. Seawall Construction Cost

There are many seawall construction projects aiming to protect the coastal areas in Thailand. Most of them are projects from the government. The construction cost was collected as the budget project from Thai government spending system (https://govspending.data.go.th; accessed on 1 September 2020). The average seawall construction cost is 3,231,642 USD/km. Thus, the seawall construction cost of Pattaya beach and Chalatat beach were assessed by multiplied beach length with seawall construction cost as shown in Table 8.

2.2.6. Setback Compensation Cost

Compensation cost for setback was evaluated by the damage cost, which are the land prices and construction cost. The damage cost was estimated from the Google Earth images and the erosion of shoreline changes analysis, based on the effect of sea-level rise. In this study, the shoreline change from sea-level rise will affect the road and parking courtyard. The standard of infrastructure construction price list for the government compensation (Table 9) was examined by the Valuers Association of Thailand (http://www.vat.or.th; accessed on 15 January 2021).

3. Methods

3.1. Detection of the Shoreline Changes

Satellite images from Google Earth were used to detect shoreline change. The tidal correction method corrected the captured time of images for the effect of tide on the position of the waterline relative to shoreline position [21,22]. Image processing is a technique used to analyze the shoreline position from pixels in the images. The satellite images were rectified with ground control points (GCPs), and the shoreline positions were detected with MATLAB software version 9.4 (accessed on 22 June 2020) [23]. The shoreline change rates were calculated using the different of shoreline positions in the consecutive time periods.

3.2. Hedonic Price Method

We used the hedonic pricing method of Lancaster [24] and Rosen [16], which identifies the attributes that affect the price of differentiated and compound products. This study aimed to evaluate the relationship between the price of a hotel room and the series of attributes described in Table 4 by generating a set of implicit prices for each attribute. The log-linear hedonic pricing regression is defined as follows:
P i = f i ( q i 1 , q i 2 , q i 3 , q i n )
In this equation, Pi is the price of the hotel room, and qi represents the set of hotel attributes.

3.3. Benefit–Cost Analysis

The profitability of the investment project was assessed with a benefit–cost ratio (BCR), which is calculated using the present value of benefits divided by the present value of costs.
B C R = t = 0 T B t ( 1 + r ) t t = 0 T C t ( 1 + r ) t
In the equation for BCR, Bt is the benefit at time t, Ct are the costs at time t, r is the discount rate, and T is the time at the end of the study period. If BCR exceeds 1, the project is expected to return a positive net present value to the investor.

4. Results and Discussions

4.1. Historical and Projected Shoreline Changes

The historical shoreline change rates of Pattaya beach (Figure 2 and Figure 3) and Chalatat beach (Figure 4 and Figure 5) are shown in Figure 6 and Figure 7, respectively. The average shoreline change rates had positive values of 0.09 m/y in Pattaya and 0.59 m/y in Chalatat. Deposition associated with seasonal and natural change occurred on these beaches. However, shoreline change rates have negative values in some years, so the beaches eroded during this time. Pattaya beach shoreline changes before the beach nourishment construction (2002–2017) had positive shoreline change rates, but it increased to a greater extent after the beach nourishment construction was installed. The historical shoreline change rates were analyzed for the background of beach dynamics overtime. It will not apply in the analysis of future beach loss.
The projected shoreline change due to sea level rise was analyzed with the Bruun rule in a previous study [7]. Based on the present conditions, the average shoreline retreat at Pattaya beach was 19.70 m for RCP 2.6 and 33.08 m for RCP 8.5. At Chalatat beach, the average shoreline retreat was 22.76 m for RCP 2.6 and 37.58 m for RCP 8.5. Projected shoreline changes due to sea level rise are less than the historical shoreline changes at Pattaya beach, because of the completion of beach nourishment in 2019 (Figure 3 and Figure 5). In contrast, projected shoreline changes were greater than historical shoreline changes at Chalatat beach. Through this analysis, we confirmed that beach nourishment is a viable solution to deal with beach loss due to sea level rise.

4.2. Beach Values from Hedonics Pricing Method

Using the hedonic pricing method, the coefficient of the variable “Sea view/Beach view” is 0.3335. This suggests that the price of hotel room is 40% higher in the rooms with a sea view or a beach view (from ln e β 1 , when β is the coefficient of “Sea view/Beach view” attribute). The beach value of Pattaya beach and Chalatat beach presented in Table 10 are based on the occupancy rates and the number of tourists obtained from the Ministry of Tourism and Sports in 2018. The study areas were detected using 2018 Google Earth images, and the currency exchange rate in 2018 was 32.932 Thai Baht = 1 USD. The number of tourists and the beach area affected the high value of the beach at Pattaya beach.

4.3. Benefit–Cost of Adaptation Measures

Table 11 and Table 12 present the benefit–cost ratio analysis of Pattaya beach and Chalatat beach. The benefits and costs of beach nourishment and seawalls were evaluated from a future value in 2100 and transferred into the present value, assuming that benefits were associated with the same conditions every year. The cost of the setback method was estimated from the beach value and damage cost of the land and infrastructure.
There were no benefits for the setback method at either of the two beaches. When the BCR is greater than 1, the adaptation measure is worth the investment. The BCR of beach nourishment and seawalls at Pattaya beach is higher than at Chalatat beach because Pattaya beach provides greater benefits than Chalatat beach, due to its higher beach value.
The benefit, cost and BCR of setback shown that it is not worth taking no action with the tourism beaches when the sea level is rising. However, the setback method will be suitable for the beaches which were not used for the tourism as the main advantage, because those beaches will not have great beach value based on the hotel room prices.

5. Conclusions

Natural and human activities make coastal areas extremely dynamic. In the 21st century, global sea levels will rise due to climate change, which will cause shorelines to retreat and this will affect beach areas that provide human and ecosystem benefits. Adaptation measures present a solution that protects against beach loss and helps maintain beach TCC. In Thailand, structural measures to protect beaches have been widely used, but these efforts also affect nearby coastal areas, forcing other beaches unsuitable for tourism to be used. On the other hand, beach nourishment increases the beach width and promotes recreation on tourism beaches. This study analyzed the historical shoreline changes from satellite images, and evaluated the beach value using the hedonic pricing method. The benefit–cost ratio analysis was used to assess the economic valuation assessment. It was identified that the average shoreline change rates have a positive value in these two study areas. The price of a hotel room is higher by 40% in rooms with a sea view. In addition, the beach values of Pattaya beach and Chalatat beach are 1,072,250 and 92,092 USD, respectively. For the overall value of the beach, this estimate is the lower bound calculated from the indirect valuation method. The BCR of seawalls is smaller than that of beach nourishment. The BCR analysis suggests that it is worth implementing beach nourishment to mitigate against the effects of climate change. On the other hand, it is necessary to evaluate the environmental impact assessment and sand resources before the implementation of beach nourishment. Moreover, the monitoring of impacts from beach nourishment projects ought to be carried out cautiously. In addition, BCR of setback shows that it is not worth retreating when the sea level is rising. The results will be useful in the process of preliminary decision making for the policymakers.

Author Contributions

Project administration, S.R.; supervision, S.R., K.U. and H.S.; validation, S.R.; formal analysis, P.N.; data curation, P.N.; writing—original draft preparation, P.N. and S.R.; writing—review and editing, S.R. and P.N. All authors have read and agreed to the published version of the manuscript.

Funding

This research received no external funding.

Acknowledgments

This research was supported by Advancing Co-design of Integrated Strategies with Adaptation to Climate Change on Thailand (ADAP-T) supported by the Science and Technology Research Partnership for Sustainable Development (SATREPS), JST-JICA.

Conflicts of Interest

The authors declare no conflict of interest.

References

  1. IPCC. Working Group I Contribution to the IPCC Fifth Assessment Report Climate Change 2013, the Physical Science Basis; Final Draft Underlying Scientific-Technical Assessment IPCC, Stockholm; Cambridge University Press: Cambridge, UK, 2013. [Google Scholar]
  2. Patcharapitchakorn, K.; Ritphring, S. Sea Level Change in Thailand. Ladkrabang Eng. J. 2012, 29, 56–60. [Google Scholar]
  3. Ritphring, S.; Somphong, C.; Udo, K.; Kazama, S. Projections of Future Beach Loss due to Sea Level Rise for Sandy Beaches along Thailand’s Coastlines. J. Coast. Res. 2018, 85, 541–545. [Google Scholar] [CrossRef] [Green Version]
  4. Zacarias, D.A.; Williams, A.T.; Newton, A. Recreation carrying capacity estimations to support beach management at Praia de Faro, Portugal. Appl. Geogr. 2011, 31, 1075–1081. [Google Scholar] [CrossRef]
  5. Sridhar, R.; Yuvaraj, E.; Sachithanandam, V.; Mageswaran, T.; Purvaja, R.; Ramesh, R. Tourism Carrying Capacity for Beaches of South Andaman Island, India. Tour. Empir. Res. Pract. Appl. 2016, 61. [Google Scholar] [CrossRef] [Green Version]
  6. Hamed, H.K.; Fataei, E. Estimation of tourism carrying capacity of Fandoqloo Forest in Ardebil Province, Iran. Bull. Environ. Pharmacol. Life Sci. 2013, 2, 64–70. [Google Scholar]
  7. Nidhinarangkoon, P.; Ritphring, S.; Udo, K. Impact of Sea Level Rise on Tourism Carrying Capacity in Thailand. J. Mar. Sci. Eng. 2020, 8, 104. [Google Scholar] [CrossRef] [Green Version]
  8. Campbell, T.J.; Benedet, L. Beach nourishment magnitudes and trends in the U.S. J. Coast. Res. 2006, 39, 57–64. [Google Scholar]
  9. Morán, D.K.; Salles, A.; de A, P.; Sánchez, J.C.; Espinal, J.C. Beach nourishment evolution in the Cancun beach, Quintana Roo, Mexico. Coast. Sediments 2007, 7, 2279–2291. [Google Scholar]
  10. Sano, M.; Jiménez, J.A.; Medina, R.; Stanica, A.; Sanchez-Arcilla, A.; Trumbic, I. The role of coastal setbacks in the context of coastal erosion and climate change. Ocean Coast. Manag. 2011, 54, 943–950. [Google Scholar] [CrossRef]
  11. Portman, M.E.; Esteves, L.S.; Le, X.Q.; Khan, A.Z. Improving integration for integrated coastal zone management: An eight country study. Sci. Total Environ. 2012, 439, 194–201. [Google Scholar] [CrossRef] [PubMed] [Green Version]
  12. Fenster, M.S. Setbacks. In Encyclopedia of Coastal Science; Schwartz, M.L., Ed.; Springer: Dordrecht, The Netherlands, 2012; pp. 863–866. [Google Scholar]
  13. Kraus, N.C. The effects of seawalls on the beach: An extended literature review. J. Coast. Res. 1988, 4, 1–28. [Google Scholar]
  14. Charusrojthanadech, N. Effect of Coastal Prevention by Beach and Serious Problems in Some Coasts of the Gulf of Thailand. In Proceedings of the Twenty-First International Offshore and Polar Engineering Conference, International Society of Offshore and Polar Engineers, Maui, HI, USA, 19–24 June 2011. [Google Scholar]
  15. Plant, N.G.; Griggs, G.B. Interactions between nearshore processes and beach morphology near a seawall. J. Coast. Res. 1992, 8, 183–200. [Google Scholar]
  16. Rosen, S. Hedonic prices and implicit markets: Product differentiation in pure competition. J. Political Econ. 1974, 82, 34–55. [Google Scholar] [CrossRef]
  17. Fleischer, A. A room with a view—A valuation of the Mediterranean Sea view. Tour. Manag. 2012, 33, 598–602. [Google Scholar] [CrossRef] [Green Version]
  18. Bera, S.; Majumdar, D.D.; Paul, A. Estimation of tourism carrying capacity for Neil Island, South Andaman, India. J. Coast. Sci. 2015, 2, 46–53. [Google Scholar]
  19. Marine Department of Thailand. The Master Plan of Beach Nourishment Construction in Pattaya Beach; Marine Department of Thailand: Chonburi, Thailand, 2010. (In Thai)
  20. Marine Department of Thailand. The Detail Design of Beach Nourishment Construction in Chalatat Beach; Marine Department of Thailand: Songkhla, Thailand, 2013. (In Thai)
  21. Boak, E.H.; Turner, I.L. Shoreline definition and detection: A review. J. Coast. Res. 2005, 21, 688–703. [Google Scholar] [CrossRef] [Green Version]
  22. Hoang, V.; Tanaka, H.; Mitobe, Y. A method for correcting tidal effect on shoreline position extracted from an image with unknown capture time. Geosciences 2017, 7, 62. [Google Scholar] [CrossRef] [Green Version]
  23. Nidhinarangkoon, P.; Ritphring, S.; Tanaka, H. Shoreline changes by using google earth images with tidal correction: A case study of samui island, Thailand. In International Conference on Fluid Mechanics 8; Tohoku University: Sendai, Japan, 2018. [Google Scholar]
  24. Lancaster, K.J. A new approach to consumer theory. J. Political Econ. 1966, 74, 132–157. [Google Scholar] [CrossRef]
Figure 1. Study areas.
Jmse 09 00588 g001
Figure 2. Pattaya beach.
Jmse 09 00588 g002
Figure 3. Shoreline position of Pattaya beach.
Jmse 09 00588 g003
Figure 4. Chalatat beach.
Jmse 09 00588 g004
Figure 5. Shoreline position of Chalatat beach.
Jmse 09 00588 g005
Figure 6. Rate of shoreline change at Pattaya beach.
Jmse 09 00588 g006
Figure 7. Rate of shoreline at Chalatat beach.
Jmse 09 00588 g007
Table 1. Time series of satellite images.
Study Areas
Pattaya BeachChalatat Beach
11 December 200231 December 2004
5 January 200516 March 2006
29 December 20063 October 2007
21 December 20098 August 2010
8 April 201031 July 2011
16 October 201417 April 2014
19 August 20156 April 2015
8 February 20169 July 2017
30 December 20176 August 2018
16 February 2019
Table 2. Pattaya beach.
ScenarioShoreline Retreat (m)Beach Area (m2)PCCRCCECC
30 December 2017 (Past)-54,480145,280103,48772,441
16 February 2019 (Present)-153,373408,995291,339203,937
RCP 2.6−19.70103,716276,575197,013137,909
RCP 4.5−24.3592,011245,362174,778122,345
RCP 6.0−25.1390,057240,151171,067119,747
RCP 8.5−33.0870,019186,717133,00493,103
Table 3. Chalatat beach.
ScenarioShoreline Retreat (m)Beach Area (m2)PCCRCCECC
9 July 2017 (Past)-196,946143,23377,30738,653
6 August 2018 (Present)-253,666184,48499,57149,786
RCP 2.6−22.76137,27299,83453,88326,942
RCP 4.5−28.05112,52981,83944,17122,085
RCP 6.0−28.84108,83279,15042,71921,360
RCP 8.5−37.5867,87749,36526,64413,322
Table 4. Hotel attribute variables.
VariableDescription
PriceRoom price in USD (two people for seven nights)
Beach widthWidth in meters of the beach
Hotel starsStar rating system (1–5 stars)
Room sizeSize of a hotel room in m2
Breakfast=1 if breakfast is included
Deluxe room=1 if the room is described as a deluxe room
Superior room=1 if the room is described as a superior or suite room
Mountain view=1 if there is a mountain view
Sea view/Beach view=1 if there is a sea view or beach view
City view=1 if there is a city view
Kids’ club=1 if there is a kids’ club
Balcony=1 if the room has a balcony
Airport service=1 if there is an airport shuttle bus service
Clean=1 if there is a daily room cleaning service
Laundry=1 if there is a laundry service
Location=1 if the hotel is located on the desirable location
Table 5. Dune height and beach length.
Study AreasDune Height (m.MSL)Beach Length (m)
Pattaya beach+4.52845
Chalatat beach+2.54060
Table 6. Beach nourishment construction cost of Pattaya beach.
ScenarioShoreline Retreat (m)Construction Cost (USD)
RCP 2.6−19.705,854,439
RCP 4.5−24.357,236,325
RCP 6.0−25.137,468,125
RCP 8.5−33.089,830,703
Table 7. Beach nourishment construction cost of Chalatat beach.
ScenarioShoreline Retreat (m)Construction Cost (USD)
RCP 2.6−22.765,362,442
RCP 4.5−28.056,608,809
RCP 6.0−28.846,794,940
RCP 8.5−37.588,854,155
Table 8. Seawall construction cost.
Study AreasBeach Length (m)Construction Cost (USD)
Pattaya beach28458,402,268
Chalatat beach406012,926,567
Table 9. The structure of infrastructure construction price list.
Areas TypeConstruction Cost (USD/m²)
Concrete road40
Concrete courtyard23
Table 10. Beach value.
Study AreasOccupancy (%)Number of Tourists (Person/y)Beach Area (m2)Beach Value (USD)
Pattaya beach77.9114,680,66944,2701,072,250
Chalatat beach73.727,635,378253,66692,092
Table 11. Benefit–cost ratio analysis of Pattaya beach.
ScenarioBenefit of Beach Nourishment (USD)Cost of Beach Nourishment (USD)B/C Ratio of Beach NourishmentBenefit of Seawall (USD)Cost of Seawall (USD)B/C Ratio of SeawallBenefit of Setback (USD)Cost of Setback (USD)B/C Ratio of Setback
RCP 2.615,966,319513,34631.102415,966,3199,727,2011.6414015,966,319-
RCP 4.515,966,319518,19930.811215,966,3199,727,2011.6414015,966,319-
RCP 6.015,966,319519,01330.762815,966,3199,727,2011.6414015,966,319-
RCP 8.515,966,319527,31130.278815,966,3199,727,2011.6414015,966,319-
Table 12. Benefit–cost ratio analysis of Chalatat beach.
ScenarioBenefit of Beach Nourishment (USD)Cost of Beach Nourishment (USD)B/C Ratio of Beach NourishmentBenefit of Seawall (USD)Cost of Seawall (USD)B/C Ratio of SeawallBenefit of Setback (USD)Cost of Setback (USD)B/C Ratio of Setback
RCP 2.61,371,299511,6182.68031,371,29914,964,9240.091601,371,299-
RCP 4.51,371,299515,9952.65761,371,29914,964,9240.091601,374,346-
RCP 6.01,371,299516,6492.65421,371,29914,964,9240.091601,374,933-
RCP 8.51,371,299523,8812.61761,371,29914,964,9240.091601,419,602-
Publisher’s Note: MDPI stays neutral with regard to jurisdictional claims in published maps and institutional affiliations.

