Article

An Interactive WebGIS Framework for Coastal Erosion Risk Management

1
Department of Civil, Environmental, Land, Construction and Chemistry (DICATECh), Politecnico di Bari, via Orabona 4, 70125 Bari, Italy
2
Department of Engineering for Innovation, University of Salento, Ecotekne, 73047 Lecce, Italy
3
Interdepartmental Center for Industrial Research-Building and Construction (CIRI-EC), University of Bologna, 40131 Bologna, Italy
4
Dipartimento di Ingegneria Civile, Chimica Ambientale e dei Materiali (DICAM), University of Bologna, 40131 Bologna, Italy
*
Author to whom correspondence should be addressed.
J. Mar. Sci. Eng. 2021, 9(6), 567; https://doi.org/10.3390/jmse9060567
Submission received: 9 March 2021 / Revised: 10 May 2021 / Accepted: 19 May 2021 / Published: 24 May 2021

Abstract

:
The Italian coastline stretches over about 8350 km, with 3600 km of beaches, representing a significant resource for the country. Natural processes and anthropic interventions keep threatening its morphology, moulding its shape and triggering soil erosion phenomena. Thus, many scholars have been focusing their work on investigating and monitoring shoreline instability. Outcomes of such activities can be largely widespread and shared with expert and non-expert users through Web mapping. This paper describes the performances of a WebGIS prototype designed to disseminate the results of the Italian project Innovative Strategies for the Monitoring and Analysis of Erosion Risk, known as the STIMARE project. While aiming to include the entire national coastline, three study areas along the regional coasts of Puglia and Emilia Romagna have already been implemented as pilot cases. This WebGIS was generated using Free and Open-Source Software for Geographic information systems (FOSS4G). The platform was designed by combining Apache http server, Geoserver, as open-source server and PostgreSQL (with PostGIS extension) as database. Pure javascript libraries OpenLayers and Cesium were implemented to obtain a hybrid 2D and 3D visualization. A user-friendly interactive interface was programmed to help users visualize and download geospatial data in several formats (pdf, kml and shp), in accordance with the European INSPIRE directives, satisfying both multi-temporal and multi-scale perspectives.

1. Introduction

The morphology of Italian coastal areas has been radically moulded since the end of World War II to meet the emerging needs triggered by a persistent demographic growth, new economic interests, as well as modern lifestyles [1]. Jointly, these factors have encouraged the continuous exploitation of coastal zones, which compromises their stability [2] and, consequently, activates serious environmental problems connected to soil degradation, such as coastal erosion, sea level rising, shoreline retreatment and hydrogeological risk [3,4,5]. Among them, coastal erosion, caused by the combination of natural processes [6] and anthropogenic interventions [7], plays a leading role as it involves a considerable loss of sediment volumes along emerged as well as submerged beaches. This phenomenon affects about a third of Italian shorelines [8] and, consequently, identifying an effective strategy against it is essential to preserve marine-coastal areas [9,10,11,12,13]. Specific guidelines to minimize this problem have been issued at national level on the base of 2014/89/UE Directive [14]. Accordingly, the optimal policy to manage coastal erosion can only be achieved if the development of coastal defence interventions is supported by a reliable and extensive monitoring plan. As demonstrated by [15,16,17,18], both the spatial and temporal resolution of input data strongly impacts on the ability of different methods to evaluate coastal erosion.
In such a context, the possibility of storing and sharing different types of data covering wide temporal and spatial spans plays a relevant role. The Web Geographic Information System (WebGIS), a web tool aimed at handling geospatial data and disseminating both historical and contemporary information [19], represents a good option to analyse the current state of coastal areas and its evolution over time in a simple and inexpensive way to support decision-making processes. Additionally, the WebGIS allows both experts and unskilled users to handle a large amount of geospatial data [18,20]. It provides the possibility to query, download and overlay raster, vector, three-dimensional (3D) data and thematic maps, carrying out multi-scale and multi-temporal analyses. Based on a typical client-server structure [19], its architecture consists of hardware parts (Web server), numerous software components (operating system, Web browsers, programming languages, geospatial data management and DataBase Management System (DBMS) software) and applicative procedures (generally developed using function libraries), besides involving a number of people [20,21]. It is also implemented with an iterative and user-friendly interface allowing users to interact with the WebGIS application [22]. Such platform can be generated through proprietary software, such as Environmental Systems Research Institute (ESRI, Redlands, CA, USA), Arc Server (ArcServer, Redlands, CA, USA), Arc Internet Map Server (ArcIMS, Intergraph, Redlands, CA, USA), GeoMedia Web Map. Alternatively, open-source tools may be used. Among them, Quantum Geographic Information System (QGIS), PostGre Structured Query Language (PostGreSQL) database system, HTTP Apache Tomcat Server and Geoserver, MapServer and Mapfish are the most common.
All Free Open-Source Software (FOSS) is equipped with free licenses and an open structure that users can adapt to their own needs, which makes this platform an extremely versatile [23,24,25] and high-performing solution if compared to those provided by other competitors within the market [23]. Additionally, such software totally complies with the European directive named Infrastructure for Spatial InfoRmation in the European Community (INSPIRE) and numerous Italian directives aimed at making the information free through publicly accessible Databases.
As a result, over the last few years, WebGIS has become a popular tool, proving to be particularly useful in protecting and monitoring several ecosystems, such as coastal and marine environments [17,18,21]. Depending on their purpose, webGIS tools can be built by integrating various approaches, mainly aimed at visualizing and sharing data or, alternatively, at their geo-processing to personalize further analysis [25]. WebGIS applications can also be classified considering additional features based on the users’ needs, such as the scale selection and the viewer type. Most of them are equipped with a two-dimensional viewer. Just in a few cases, a three-dimensional geo-spatial data visualization is also implemented. To follow, some WebGIS frameworks developed to tackle coastal issues focused on various aspects and at different scales are reported. For instance, Lathrop et al., [26] developed an application to prop up ocean planning related to a Mid-Atlantic area; conversely, EMODnet [27] and SeaGIS Abruzzo [28] provide an atlas involving data on uses and natural resources at European and Adriatic sea levels, respectively; Copernicus platform [29] instead provides land use information as well as changes at European level covering the period between 2012 and 2018. Other platforms have also been designed for coastal risk assessment. Specifically, seawater quality and marine pollution problems have been addressed by Kitsiou et al., [25], Ippoliti et al., [30] and de Castro et al., [31], Tian et al., [32]. Flood prediction and monitoring have been performed by several platforms in both 2D [33,34] and 3D viewers [35]. All the above applications are not limitation-free: the platforms designed for treating information at large scale integrate low spatial resolution data, while the others cover a restricted area of interest. Moreover, although coastal erosion is a very sensitive topic, any platforms addressing such issue have been implemented at large and field scales.
This research was aimed at filling such a scientific gap providing a web tool that could be helpful for both IT and non-IT users (such as Italian public administration operators, coastal engineers, technicians, and any representatives of the scientific community interested in such topic) to assess coastal erosion risk. Specifically, it is mainly intended to publish and share data concerning Italian coastal morphology and erosion risk, freely available as open portal data or produced within the Italian project Innovative Strategies for the Monitoring and Analysis of Erosion Risk (STIMARE) [16]. To such purpose, after exploring FOSS4G potential in the making of an interactive free-accessible WebGIS [36,37], a user-friendly prototype, based on a two and three- dimensional visualization of geospatial data, was designed to monitor the status of Italian shores. Moreover, this platform involves a few modules allowing users to interact with the available data as well, generating vector layers to select specific areas, measuring erosion amount and, lastly, analysing the coastline evolution. System performance was tested on two Italian regions (Puglia and Emilia Romagna) selected within the STIMARE project because of the critical conditions of their shorelines. The developed webGIS presented different original aspects. Firstly, to the best of our knowledge, any pre-existing web-based applications did not focus on coastal erosion risk. In addition, although it covers the whole Italian nation, conversely to other platforms, coastal morphology and erosion risk information was provided by implementing medium and high-resolution data both in 2D and 3D format. For, a 3D viewer was also added to integrate metric reconstructions produced by adopting high-detailed techniques, as photogrammetry and laser scanner. Such viewer had only been previously used to evaluate flooding issues.
The next sections are organized as follows: Section 2 describes the two selected case studies, the regions of Puglia (Section 2.1.1) and Emilia-Romagna (Section 2.1.2), as well as the methodology adopted to design and implement the web-based platform (Section 2.2). Once the potential users have been identified and all requirements to satisfy have been illustrated (Section 2.2.1), the design and implementation phases of the WebGIS are described, paying particular attention to architecture, software, and tools (Section 2.2.2). Lastly, collected data (Section 2.3) and methods adopted to assess erosion risk are illustrated with respect to Puglia (Section 2.4) and Emilia-Romagna (Section 2.5). Outcomes in terms of performances, user interface and utility of the web-platform are described and discussed in Section 3 and Section 4, respectively. Further improvements and criticality are described in the Discussion (Section 3) and Conclusion (Section 4) sections too.

2. Materials and Methods
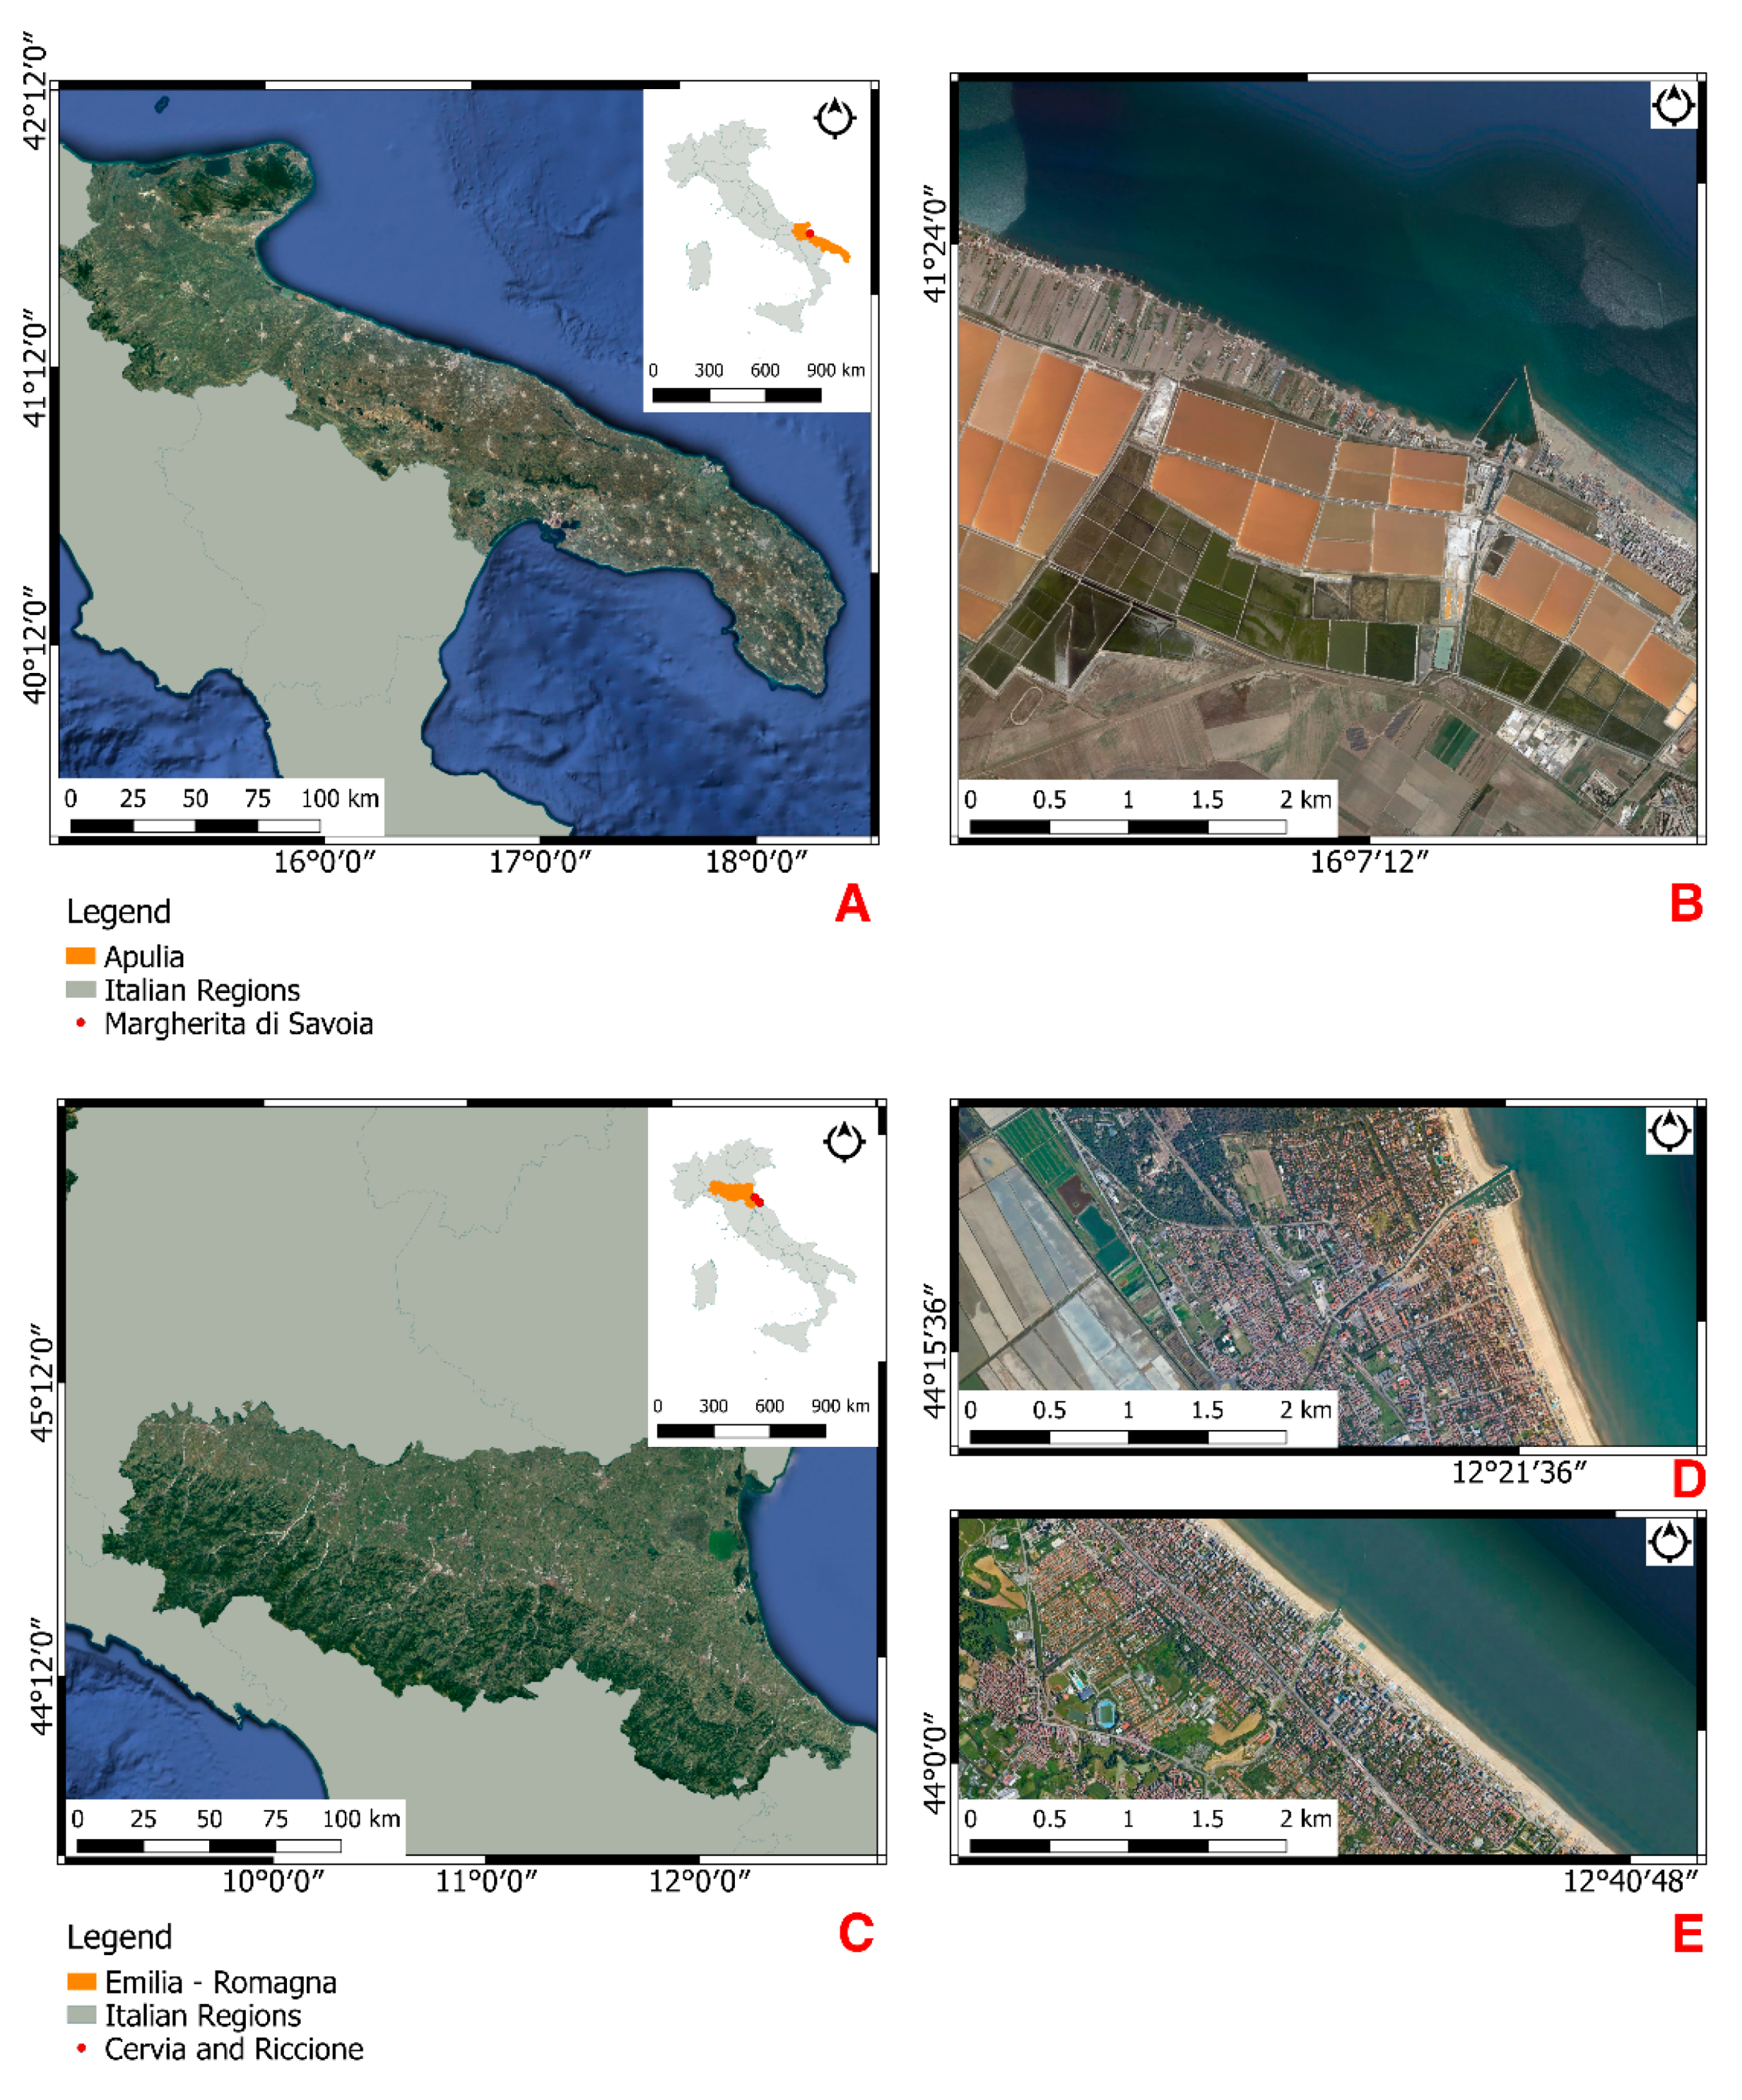
2.1. Study Areas

Two regions (Emilia Romagna and Puglia), located along the Italian Adriatic coastline of the Mediterranean Sea, were selected as test areas because of: (i) the relevance of coastal risk phenomena and (ii) the importance of shoreline management for local economy.

2.1.1. Puglia

Extending over about 975 km, Apulian coastline shows extremely different scenarios in terms of elevation and morphology (Figure 1A). The shoreline is characterized by sandy and rocky beaches, coastal cliffs and stretches of mixed sediments (including pebbly beaches) for about 33%, 33%, 21% and 12%, respectively. The analysis of wave data collected by offshore buoys belonging to the Apulian Monitoring Network [38] and the Italian Wave Network (IWN) shows that the wave climate of Puglia is almost moderate, characterized by low-medium energy sea-states. The annual significant wave height ranges from 0.25 m to 1.5 m, with a small percentage (about 5%) of waves higher than 1.5 m. Waves are in general most frequently characterized by peak periods in the interval 3 ÷ 6 s [11].
Over the years, despite the implementation of massive defence interventions, Apulian coasts have been experiencing a significant retreat, mainly due to coastal morphology, anthropogenic pressure, gradual disappearance of dune belts and inadequate protection strategies. Particularly, Margherita di Savoia has been recognized as one of the hot-spots for coastal erosion risk among the most unstable zones within the region [11] (Figure 1B) and, therefore, selected as test site under the STIMARE project. Its shoreline extends for about 18 km and has lately experienced a serious retreat and the sliding of the port breakwaters towards the valley (downdrift), despite the presence of an area dune protection and the implementation of massive defence interventions, due to the construction in 1952 of the new port of the city. Predominant risk factors are essentially linked to the local coastal morphology mainly characterized by long sandy coastlines and low inland heights, which increases the exposure to both coastal erosion and flooding phenomena [39,40]. Such a condition makes it essential to implement new solutions for managing the littoral system and mitigating erosive phenomena and hydrogeological risk. Indeed, regional local administrations are carrying out an extensive campaign of beach monitoring [41], protection and restoration interventions [42], also testing alternative strategies [43], since standard coastal protection strategies have often proved inadequate to counteract the erosive action of waves, the reduction of sediments supply and flooding events.

2.1.2. Emilia-Romagna

Emilia-Romagna, the second region under this study, stretches from the wetlands of River Po delta down to the area of Cattolica, further south, along some 120 km of sandy beaches (Figure 1C). Its wide coastal area is undergoing erosion problems whose causes started around the 1950s. The erosion has both natural and anthropogenic origins. Land subsidence is one of the main causes: geologically speaking, the young age of the sediments which characterize the Pianura Padana area together with underground water and gas drilling have exacerbated this process, mostly offshore Ravenna. The main causes of the erosive trend are the reduction in sediments transported by the Po and the numerous rivers reaching the coast and the high coastal exploitation for tourism with consequent modification of the natural dynamics of the beach (for example the reduction or removal of the natural dunes in the back of the beaches). Moreover, as shown by Ciavola et al., [44] and Idroser [45], its wave climate is characterized by a low energy with a spring tidal range of about 80–90 cm and a neap range of 30–40 cm. Bora (from E–NE) and Scirocco (SE) winds are predominant. Mainly the latter are responsible for the highest surge levels. Wave data and tides were collected by the Datawell Directional Waverider of ARPA-SIMC (the regional hydrometeorological service), and the gauge of the ISPRA RMN (National Institute for Research and Environment Protection-National Tide Gauging Network), respectively.
In order to contrast erosion, many coastal defence structures were built in the past, with approx. 50% of Emilia Romagna’s coast being protected by hard structures, parallel or perpendicular to the coast. Now, the Regional Government is looking for nature-based solutions for future coastal management, such as the introduction of new vegetated sand dunes, besides a continuous program of nourishment with submerged offshore sand. Two municipalities along its littoral, Cervia (Figure 1D) and Riccione (Figure 1E), were selected as pilot sites. Cervia’s coastline extends over 9 km with sandy beaches showing a high sedimentary transport to the south, mainly due to the construction of the city′s tourist port in the 1970s. This changed the natural sedimentary flow of the area, causing silting up of the port itself and massive erosion in the southern area of the coast, minimized by the expansion of the docks carried out in 2009 [16]. Moreover, this coastal stretch was also chosen for the application of the innovative monitoring technologies of the STIMARE Project, with a new plan aimed at keeping the small harbour entrance clean from sand accumulation [46,47]. Riccione’s coastline is split into two different zones by the port of Riccione: the former, fine-grained sandy beach, extends over 6 km; the latter, the southern section of the port, which reaches the border of the area of Misano, is defended by almost 3 km of submerged sandbags placed 150 m from the shoreline in the 1980s and 1990s. Despite all actions carried out by the Region Government over the last few years, including nourishment interventions (from 1983 to 2016), the area is still affected by evident erosive phenomena, caused by sediment transport from south to north [16].

2.2. WebGIS Design Procedures

A WebGIS application is recognized as a successful tool if able to meet users’ expectations quickly and efficiently. Therefore, our prototype was designed according to the well-based workflow proposed by Huxhold and Levinsohm [48] (Figure 2) which involves six essential steps. Each of them should be interpreted more as a dynamic process than as a fixed phase. Thus, the architecture configuration with the hardware and software tools needed were determined after identifying potential users, data to be implemented and system processing capabilities (requirement analysis). Once the design phase was completed, the pilot project was developed and its performance assessed to identify further refinements to be implemented to improve its quality. Lastly, after launching the application, the performance of the overall system, in terms of users’ satisfaction and efficiency, were also assessed.

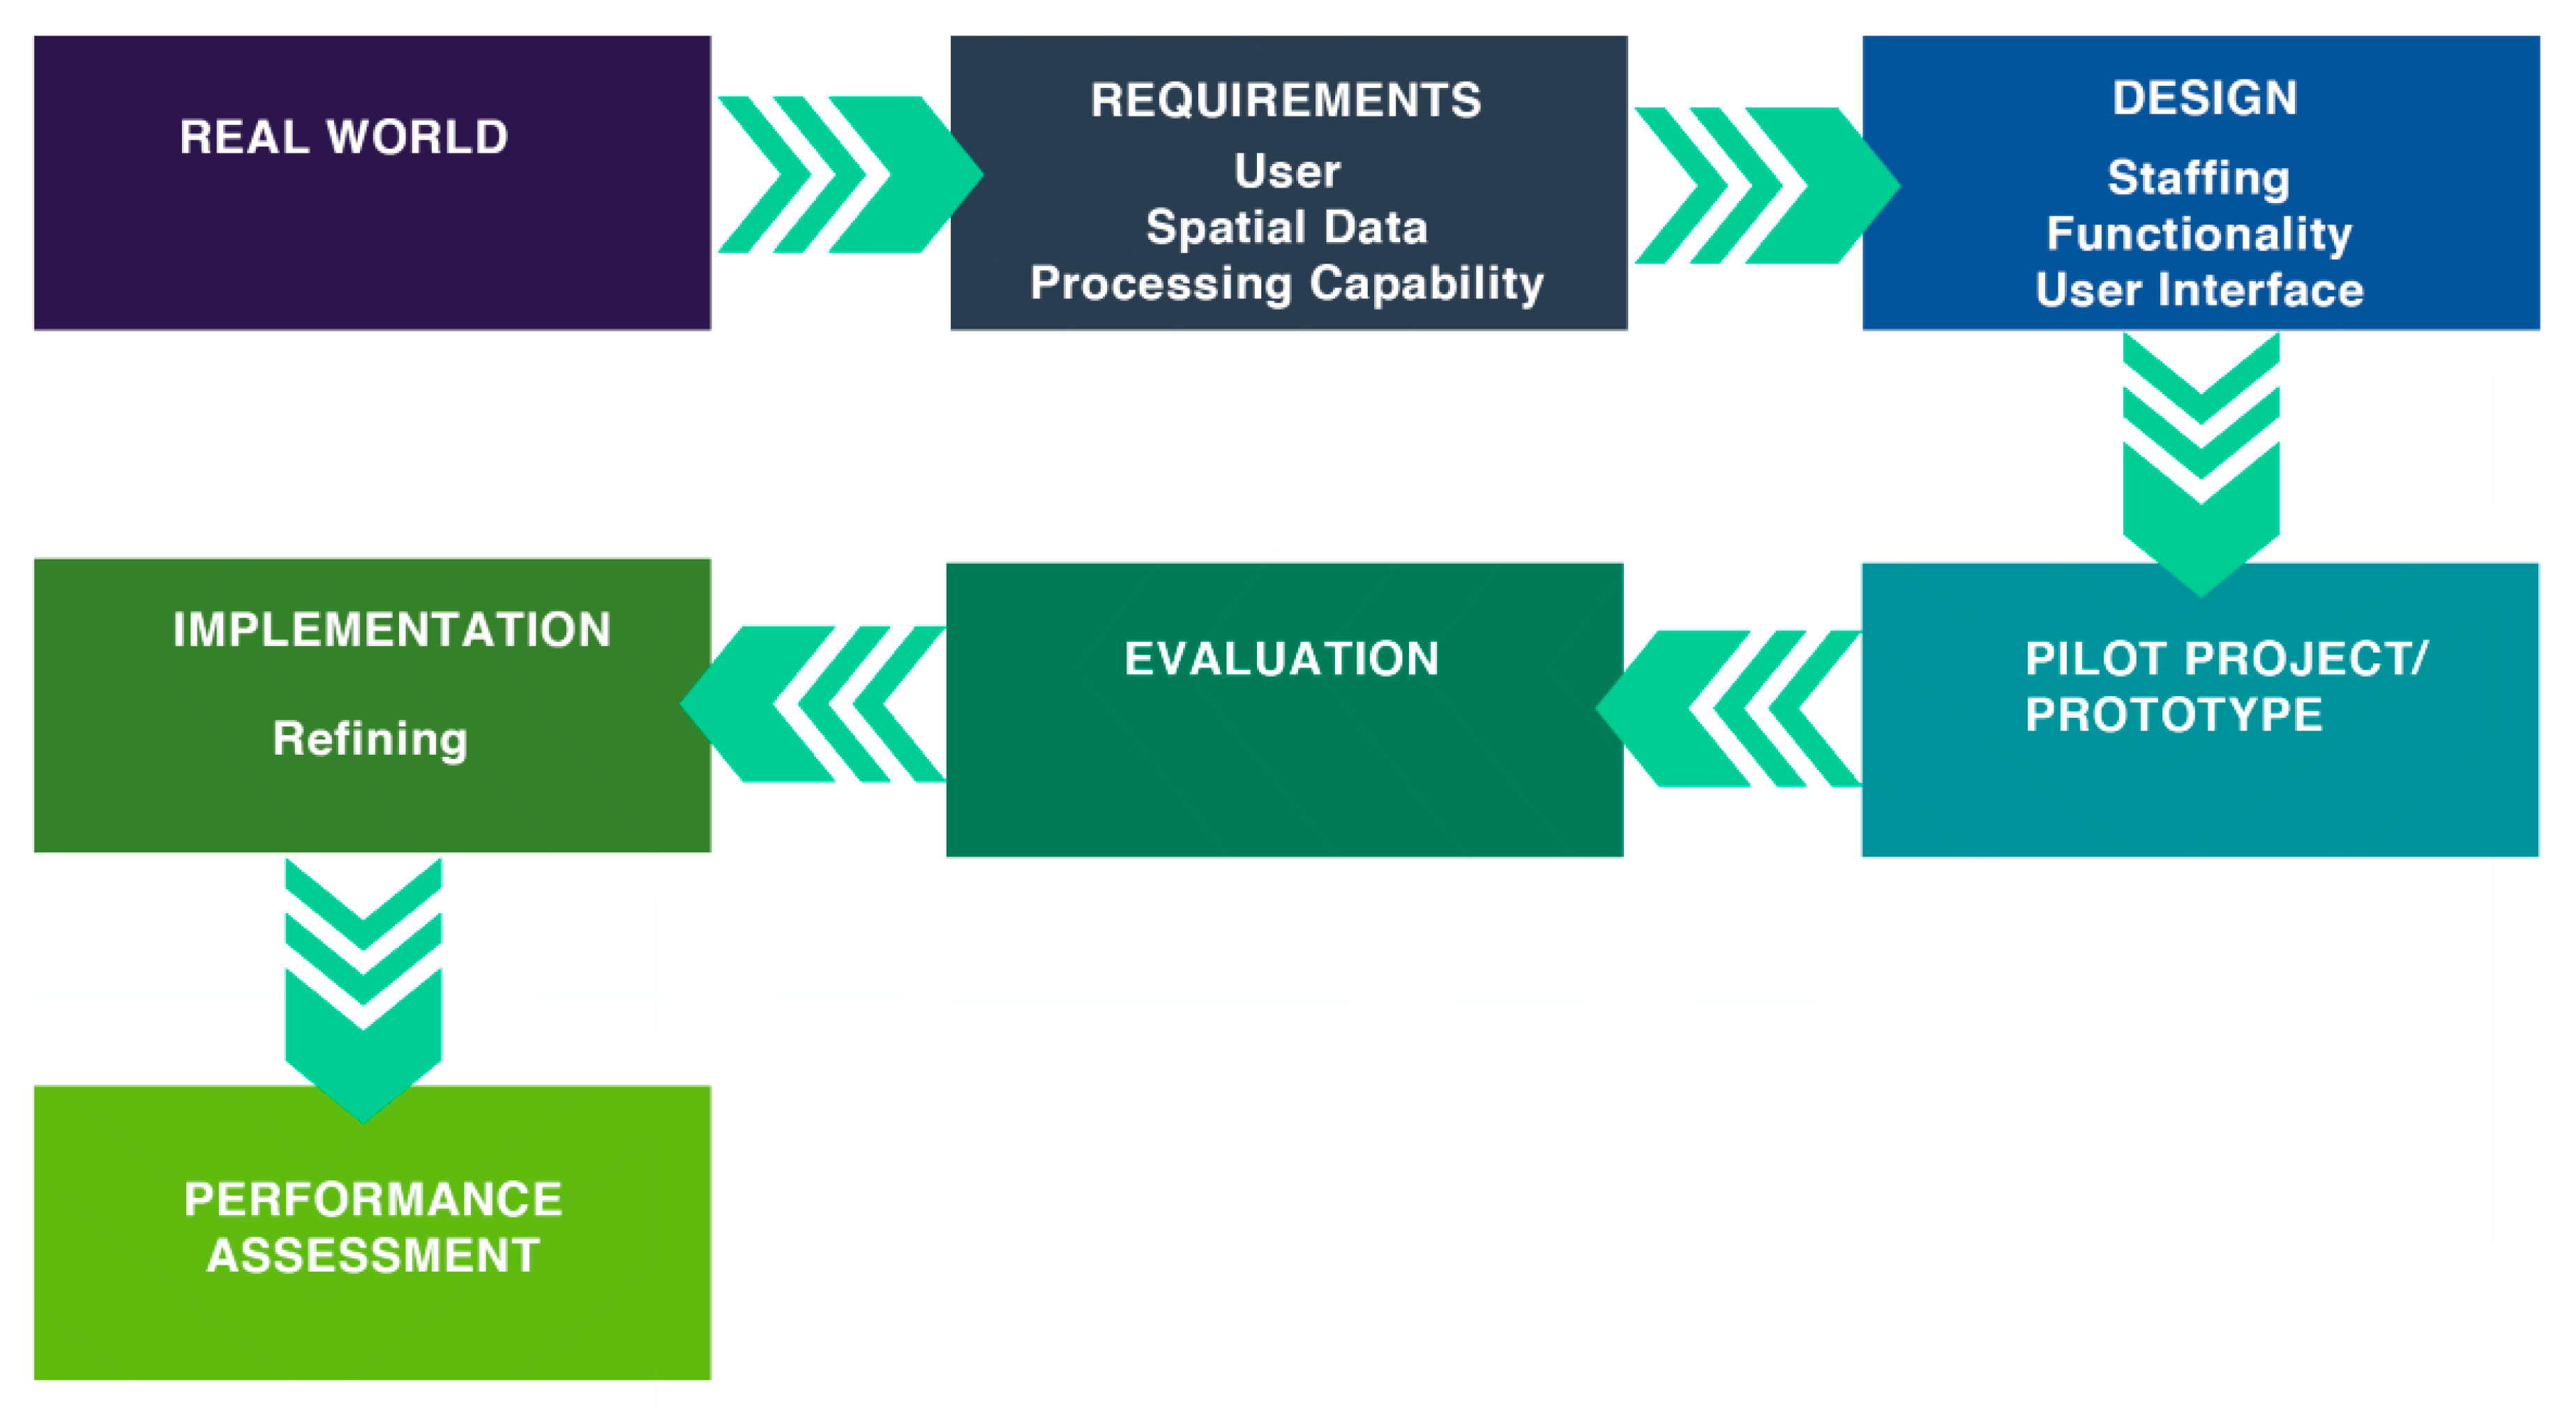
2.2.1. WebGIS Requirment Analysis

System requirements were defined considering three different aspects: (i) potential users’ identification and corresponding expectations; (ii) information to be gathered to meet users’ outlooks and sources where available; (iii) definition of system processing capabilities.
The potential users of the proposed application include Italian public administrations at national (Italian Ministry of Environment, Land and Sea), regional (Region Government) and local (Town Hall) level, as well as coastal engineers and any representatives of the scientific community involved. In fact, all of them would be interested in a unique web-based GIS system integrating all data on Italian coastal areas which are currently available on different platforms, as well as in gaining additional information on coastal erosion risk from the same system. Such information, currently absent from the available platforms, would allow them to have a complete overview of coastal areas and their conditions, which is fundamental to carry out further analysis and develop an optimal planning strategy to define adequate restoration and mitigation interventions. While the public administration needs coastal erosion risk data to prioritize the interventions at regional scale, engineers and technicians require such data to design their interventions. Conversely, the scientific community needs them to validate the outcomes of numerical models adopted to predict coastal morpho and hydro-dynamics.
Thus, data play a crucial role to meet users’ requirements. After defining the most suitable information to be integrated as base maps framing the context, coastal layers describing geo-morphology and hydro-geomorphology, as well as erosion coastal risk data, open databases and the one produced within the STIMARE project were all explored to verify their completeness. This implied handling a large amount of geospatial data provided in different formats, a factor to be considered during the design phase. More details about data sources and database construction are reported in the following section.
A preliminary analysis on system processing capabilities was also carried out to ensure the application was in line with users ‘expectations. Data visualization, query and exportation functions were recognized as essential. Additional processing tools, such as timelines, drawing geometries and their computed features (distance, areas, perimeters) were considered just as important to improve users′ interaction with the system.

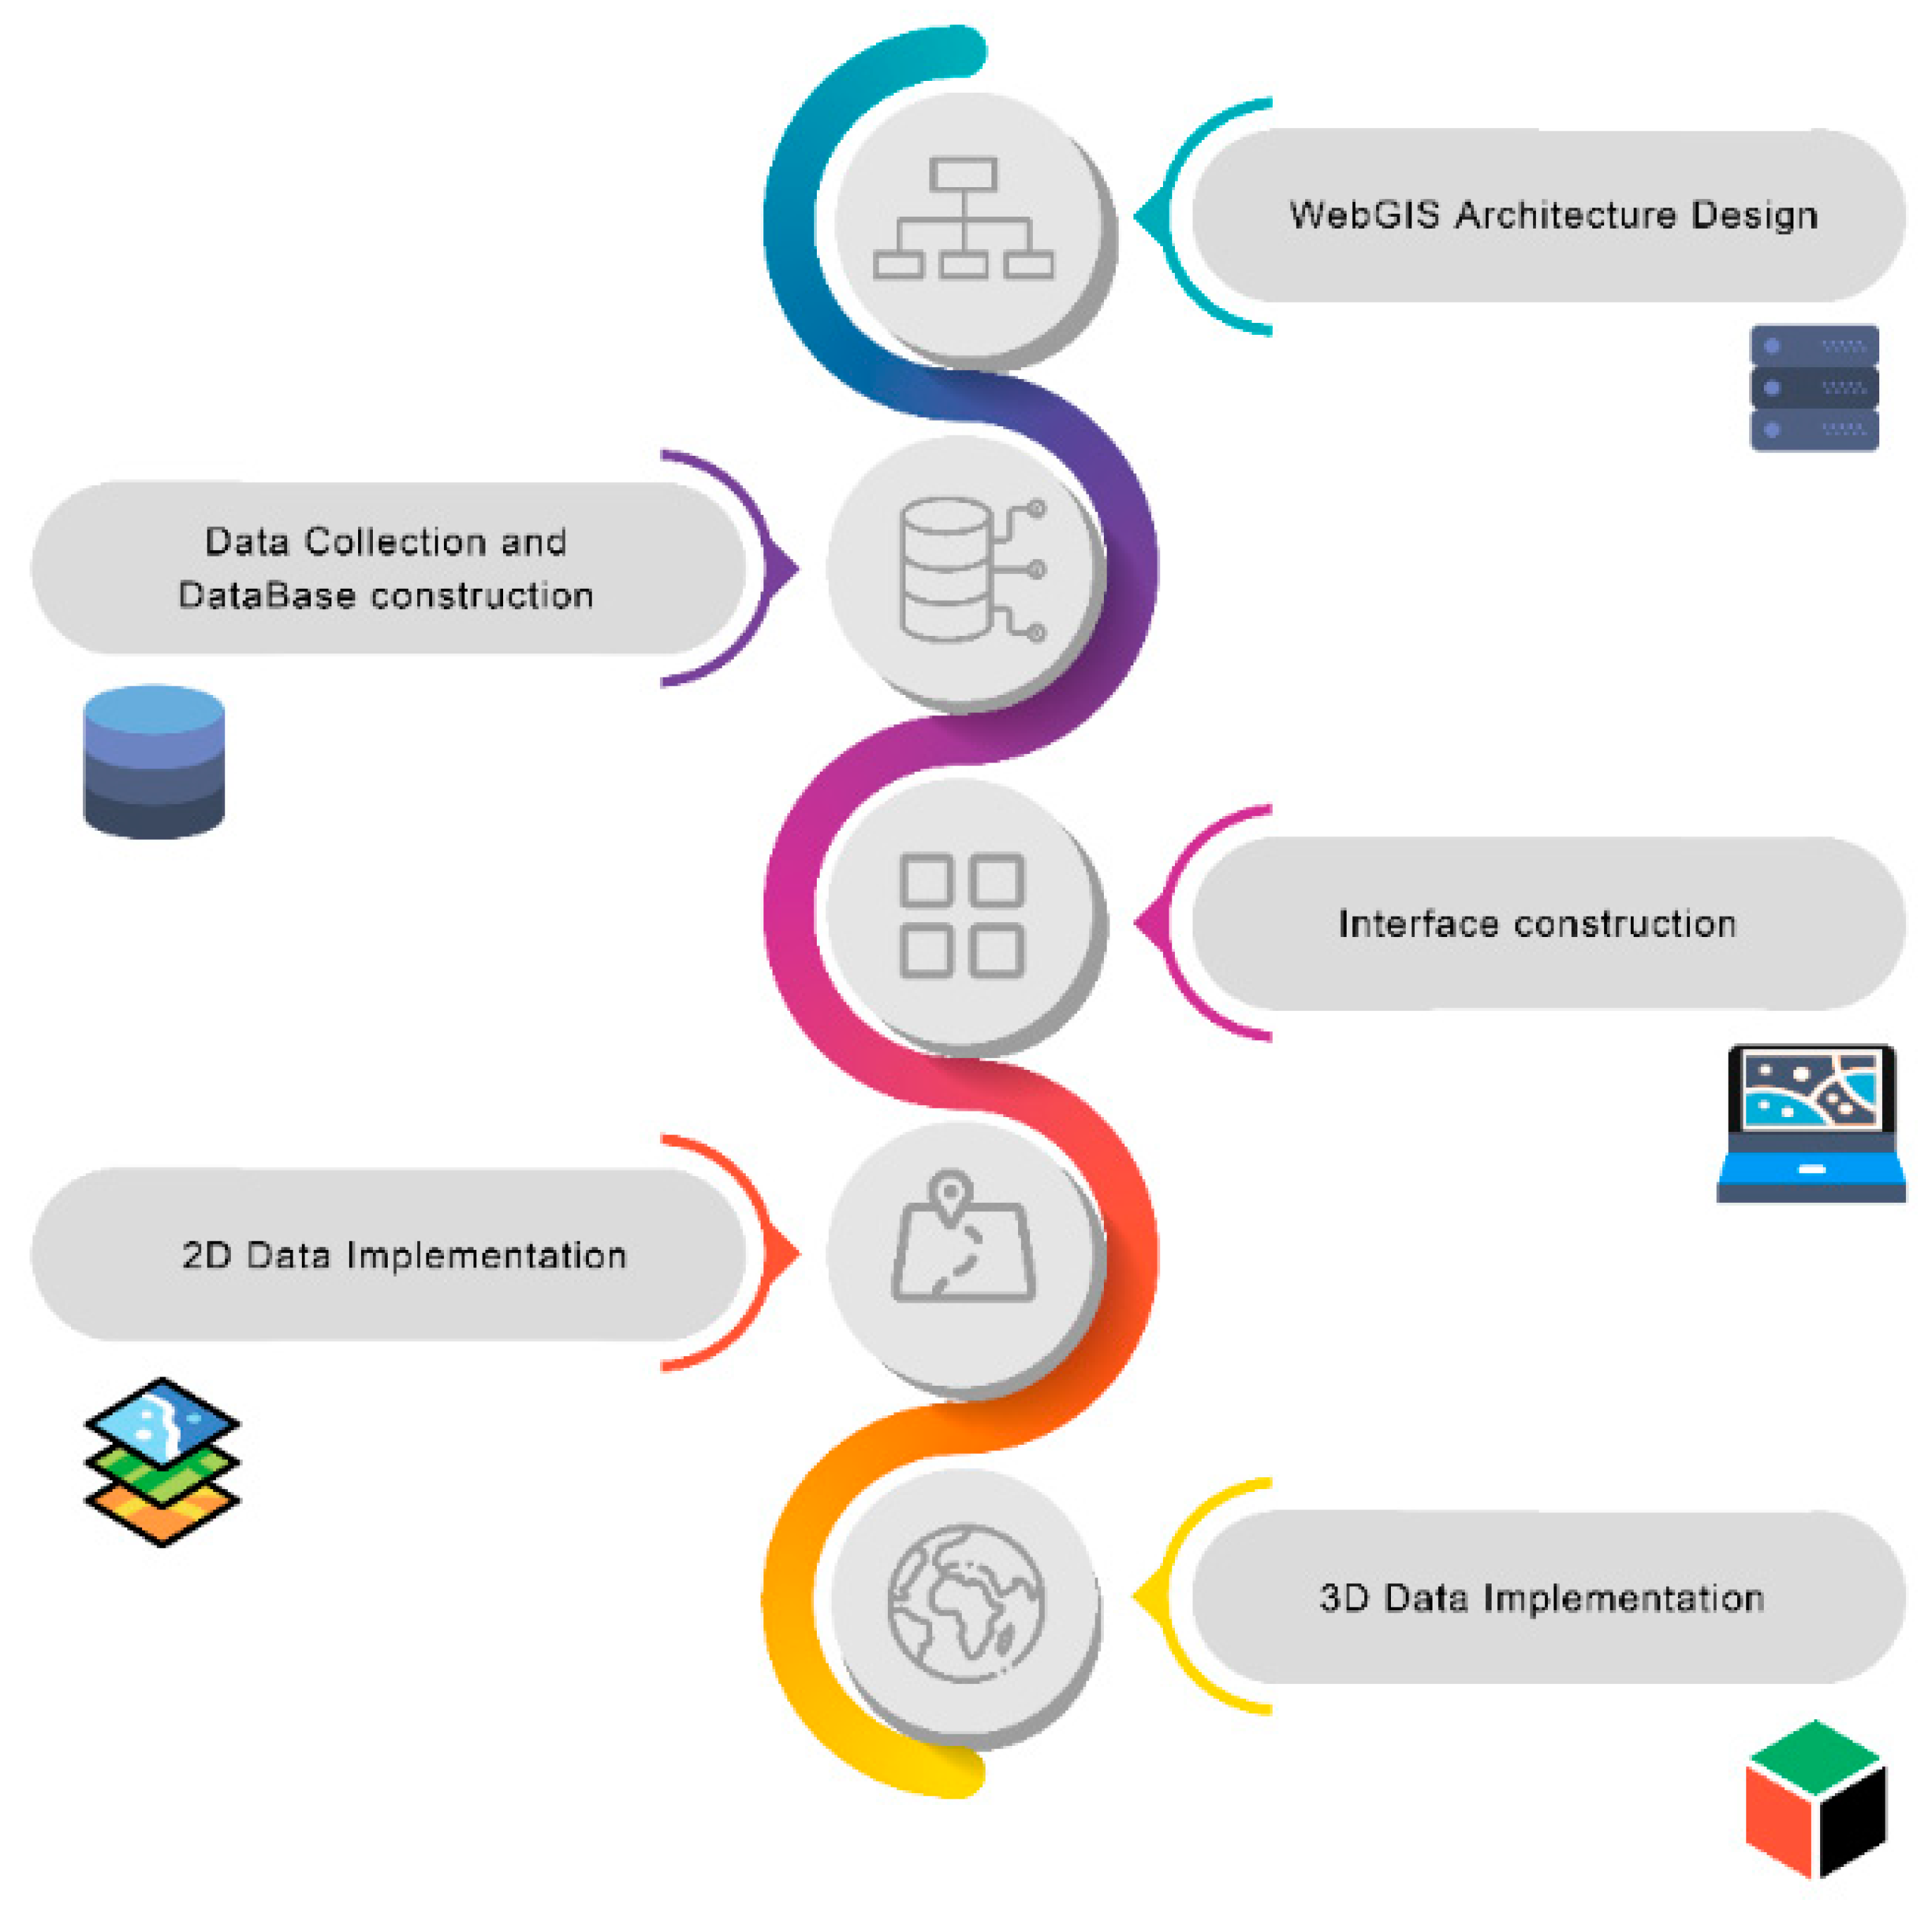
2.2.2. WebGIS Prototype Design and Implementation

Once users and system requirements were identified, the second stage related to WebGIS application design started. The proposed prototype was built on a well-structured workflow, aimed at meeting the needs emerged in the previous analysis, by applying trusted existing platforms which would assure future support of the software and further application maintenance.
As suggested by [22], five steps were implemented to generate our prototype (Figure 3), determining the optimal software for each step. The workflow is described as follows:
(1)
Architecture creation, based on the definition of the software used and the platforms required:
  • Web browser;
  • http server (HTTP Apache Tomcat Server, version 9.0.39 [49]);
  • database (PostGre Structured Query Language database system, version 12.0, ref. [50] associated with the spatial extension Post Geographic information system [51]);
  • map server (Map server Geoserver, version 2.15.1 [52]);
  • user interface (HTML language and additional libraries as Bootstrap, version 4.5.0 and 4.7.0) [53] and W3 (version 4) [54]).
(2)
Data collection: the database included raster as well as vector data, point clouds and textured meshes. The geo-database comprised of all the data produced within STIMARE project and available on open portals. The former was locally available while the latter were integrated through external web services, as following described.
(3)
User interface building characterized both by 2D and 3D viewers and aimed at being:
  • simplified and user friendly to be easily understandable by unskilled users as well;
  • clear in content and attractive.
(4)
2D viewer implementation (HTML, JS scripts, OpenLayers [55]).
(5)
3D viewer implementation (HTML, JS scripts, CESIUM Ion Web interface [56]).
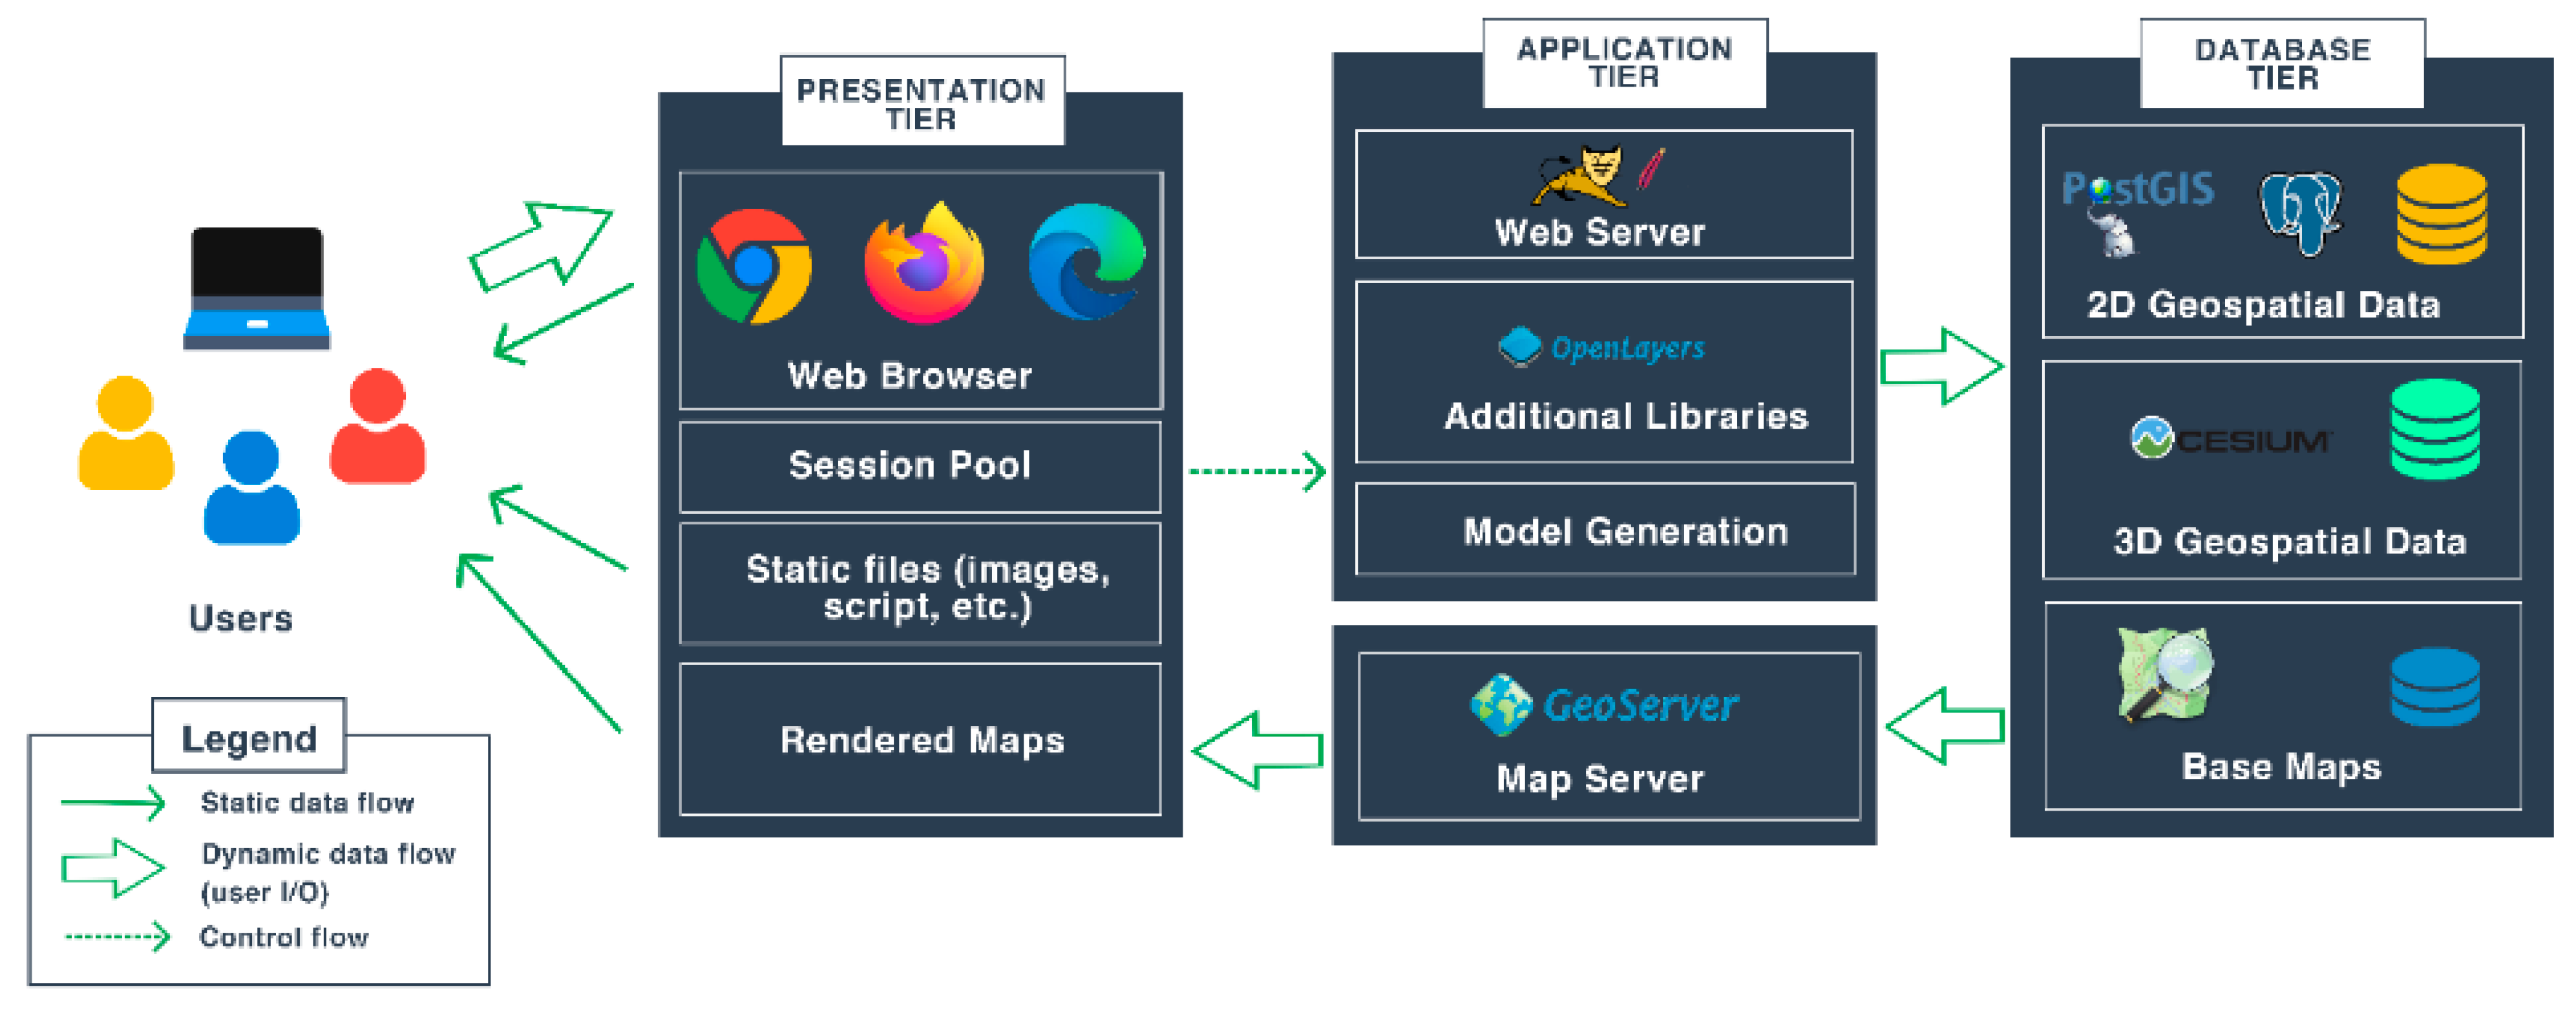
After analysing the most common architecture configuration, the three-tier option, traditionally used in client-server applications [19], was selected since it organizes all programmes into three logical and physical computing tiers:
(1)
user interface (the presentation tier), where data are visualized;
(2)
processing module (the application tier), where data are handled; and
(3)
database (the data tier), where data are stored and managed.
This implies that each tier runs on its own infrastructure, and, consequently, each of them shall be developed and updated independently without impacting on the other ones. In accordance with the standards and best practices established by the Open Geospatial Consortium (OGC) and EU directive INSPIRE, only free and Open-Source Software for Geospatial Applications (FOSS4G) was implemented in developing each tier, as highlighted in Figure 4. Specifically, the following components were combined to define the three-tier of the architecture:
  • Web browsers as, for instance, Firefox, Chrome, Edge, aimed at accessing the information on the World Wide Web (documents, web pages, etc.);
  • HTTP Apache Tomcat Server (version 9.0.39) [49], designed by Apache Software Foundation (Forest Hill, MD, USA), intended to run web applications developed in Java programming language [21,57]. The open nature of this project allows everyone to access codes and adapt them to any need. The web application is based on the Model-View-Controller design, through the framework Spring (for the model) and Apache Tapestry (for View and Controller) [58];
  • PostGre Structured Query Language (PostGreSQL) database system (version 12.0) (PostgreSQL Global Development Group [50]), an open DataBase Management System (DBMS). It is a complete system that can process both geometric and topological features, and particularly, can efficiently create, handle and query databases using all types of Structured Query Language (SQL) statements. Moreover, it is equipped with a specific spatial extension (PostGIS) for uploading vector data (points, polylines, polygons and collections of geometries) and geo-referenced rasters within the geo-database. It also supports both geometric and spatial functions, such as calculation of areas, distances and processing commands (union, difference, buffer, intersection, content, overlap, etc.) [51]. PostGreSQL provides all OGC standards specific data types;
  • Map server Geoserver (version 2.15.1) (Boundless Spatial, GeoSolutions, Refractions Research, St. Louis, MO, USA [52]), an Open-Source server in Java language responsible for processing and sharing all kinds of data. It was selected because it is fast and versatile. Designed to ensure interoperability, it can handle and publish data belonging to any spatial data source in an open standard format. Nevertheless, although it was mainly created to handle the 2D visualization of geospatial data, it also allows a 3D representation through Cesium JS [56]. Furthermore, it allows loading of external web services provided by the OGC standard protocol [58]:
  • Web Map Service (WMS), which returns raster data;
  • Web Feature Service (WFS), which allows importing geographic objects using vector data;
  • Web Coverage Service (WCS), which provides available raw data with their metadata;
  • Web Processing Service (WPS), which supplies online data processing services;
  • Web Map Tile Service (WMTS), which gives online publishing services for geo-referenced map tiles.
  • Additional libraries, such as OpenLayers (version 6.4.3, OSGEO, (Boundless Spatial, GeoSolutions, Refractions Research, St. Louis, MO, USA [55]) and Cesium JavaScript (Cesium JS, version 1.75; Analytic Graphics, Exton, PA, United States [56]), intended for 2D and 3D data visualization. More details about them can be found on their reference websites [59,60,61].
Thus, the web browser is the front-end client which allows users to query the Apache Tomcat web server, acting as a bridge between user and client. After receiving the question, the Apache Tomcat web server handles it through the Map Server application, which is responsible for sharing, processing and editing geospatial data contained in the geodatabase. Exploiting its potentialities and all available tools, it returns files as well as directories which can be consulted using the Hypertext Transfer Protocol (HTTP) [59].
Once the design phase was completed, the construction of the different components (geodatabase, user interface, 2D and 3D viewers) started and the pilot application was launched. A big effort was devoted to build a user-friendly and intuitive interface to ensure its usage by IT and non-IT users [22]. HTML language was applied to determine interface structure, defining the position of div, boxes and buttons. The interface was released more attractive thanks to the online Bootstrap (version 4.5.0 and 4.7.0) [53] and W3 (version 4) [54] libraries which allow to easily modify the style of the elements (buttons, menus, icons and characters). Further variations to the style were programmed by creating a CSS style file within the development environment.
A hybrid 2D and 3D visualization were carried out too. Data were directly implemented in appropriate menus of the 2D viewer using specific JS code suitable for exploiting the potentialities of libraries, like OpenLayers [55,62]. Menus were programmed using HTML language. HTML and JS scripts were integrated via a unique code (“title”), key identification of each layer, which acts as a link. Conversely, data implementation in the 3D viewer was based on the user-friendly CESIUM Ion Web interface [56], allowing to upload geo-referenced data, such as raster images, 3D models, 3D tiled models, point clouds on a 3D globe. Through such interface, a JS code was automatically generated to implement the data in the viewer [61,63].
Thus, skilled and unskilled users of information systems and geospatial data access WebGIS via web browsers. They can interact with the geo-database through the developed user-friendly and intuitive interface which involves four kinds of tools (Figure 5): buttons for navigation within the map (Figure 5A), auxiliary controls (Figure 5B), processing commands (Figure 5C) and menus (Figure 5D). Navigation buttons, including zoom to layer, zoom in/zoom out widgets, searching command and switch button from 2D to 3D viewers, are aimed at helping users in exploring and visualizing areas they are interested in. 2D and 3D viewers respectively integrate raster images/vector data and raster images/3D models/3D tiled models/point clouds. Conversely, auxiliary tools, involving export layer, metadata and legend buttons, allow users to interpret the collected data, listed in the menus under the appropriate thematic group (basic cartography, Italian coastal layers, Apulian coastal layers, Emilia-Romagna’s coastal layers and Risk Assessment). Lastly, processing commands allow users to handle data by drawing geometric elements (points, lines, and polygons) and select data to extract information regarding specific zones, or by measuring areas and perimeter, or assessing risk evolution over time via timelines.
WebGIS performance evaluation was carried out by comparing the proposed prototype to those previously presented in literature.

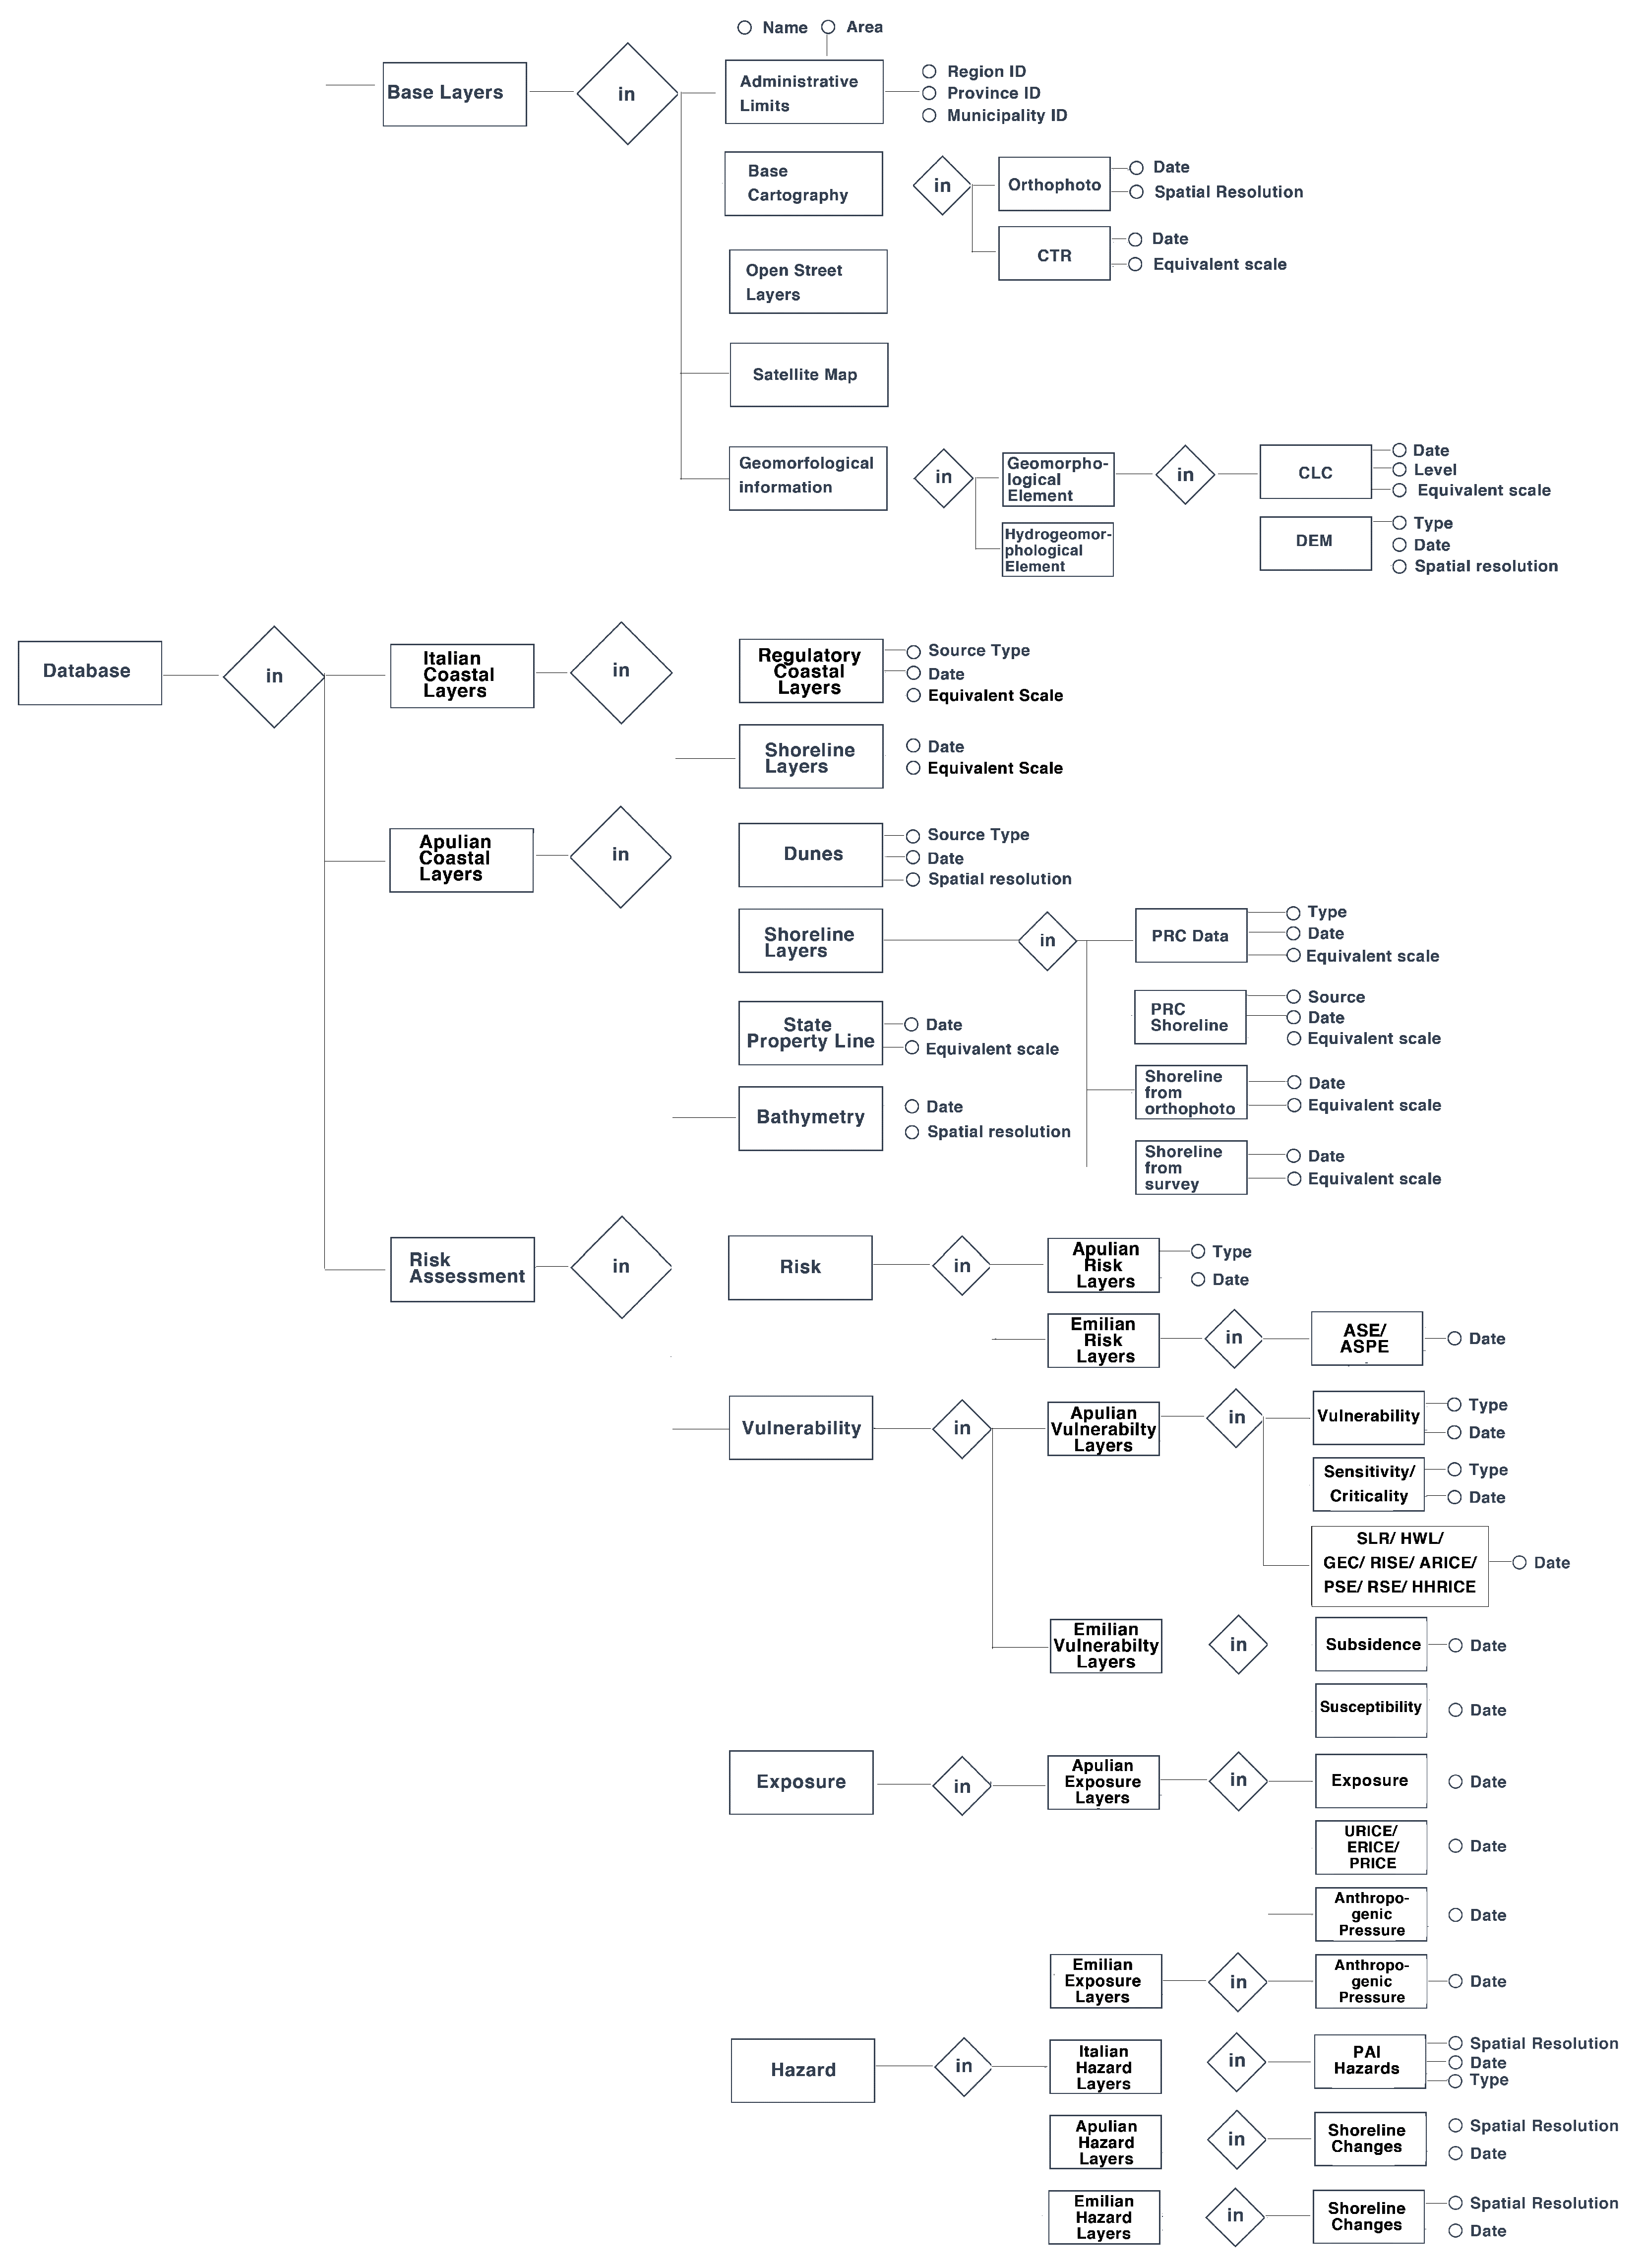
2.3. Data Collection and Geodatabase Construction

The completeness of collected data is essential to achieve WebGIS goal. After investigating the data required to describe coastal morpho and hydrodynamics, available open data were checked. Thus, all needed data were acquired from project and open portals, as the National Geoportal [64], National Institute of Statistics (ISTAT [65]), Territorial Information System of Apulian Region (SIT Puglia [66]), Arpae Emilia Romagna [67] and Geoportal of Emilia Romagna Region [68]. STIMARE project data, locally available, were uploaded in PostGreSQL, thanks to PostGIS extension, and in Cesium according to 2D and 3D visualization, respectively. Vector and raster data were imported into the prototype through the application of pdAdmin4 web, an intuitive interface of PostGIS Bundle desktop application. Conversely, data provided by open portals were integrated in the prototype using external web services.
Each dataset, together with its coordinate reference system information, WMS url and style, was stored in the new “catalogues” created by connecting Geoserver and database [62]. Nevertheless, all data were projected using the WGS84 UTM 33N (EPSG: 32633) reference system before their visualisation into the WebGIS interface. In this case, styles were defined using the QGIS desktop application.
Collected data were implemented into five macro-groups: basic cartography, Italian coastal layers, Apulian coastal layers, Emilia Romagna’s coastal layers and Risk Assessment which were subsequently split into specific sub-classes according to the topic. Specifically, as follows:
  • Basic cartography integrates all information required to describe physical and geomorphological conditions of state-owned, municipal reference layers and the STIMARE project study areas. So, they were classified according to the covering by zone (national territory, Puglia and Emilia-Romagna). Base maps, as open street map and satellite map, were included too;
  • Italian coastal layers, comprising layers covering the whole national territory produced within the Coasts Project launched in 2006 and updated in 2017 by the Italian Ministry of Environment, Land and Sea:
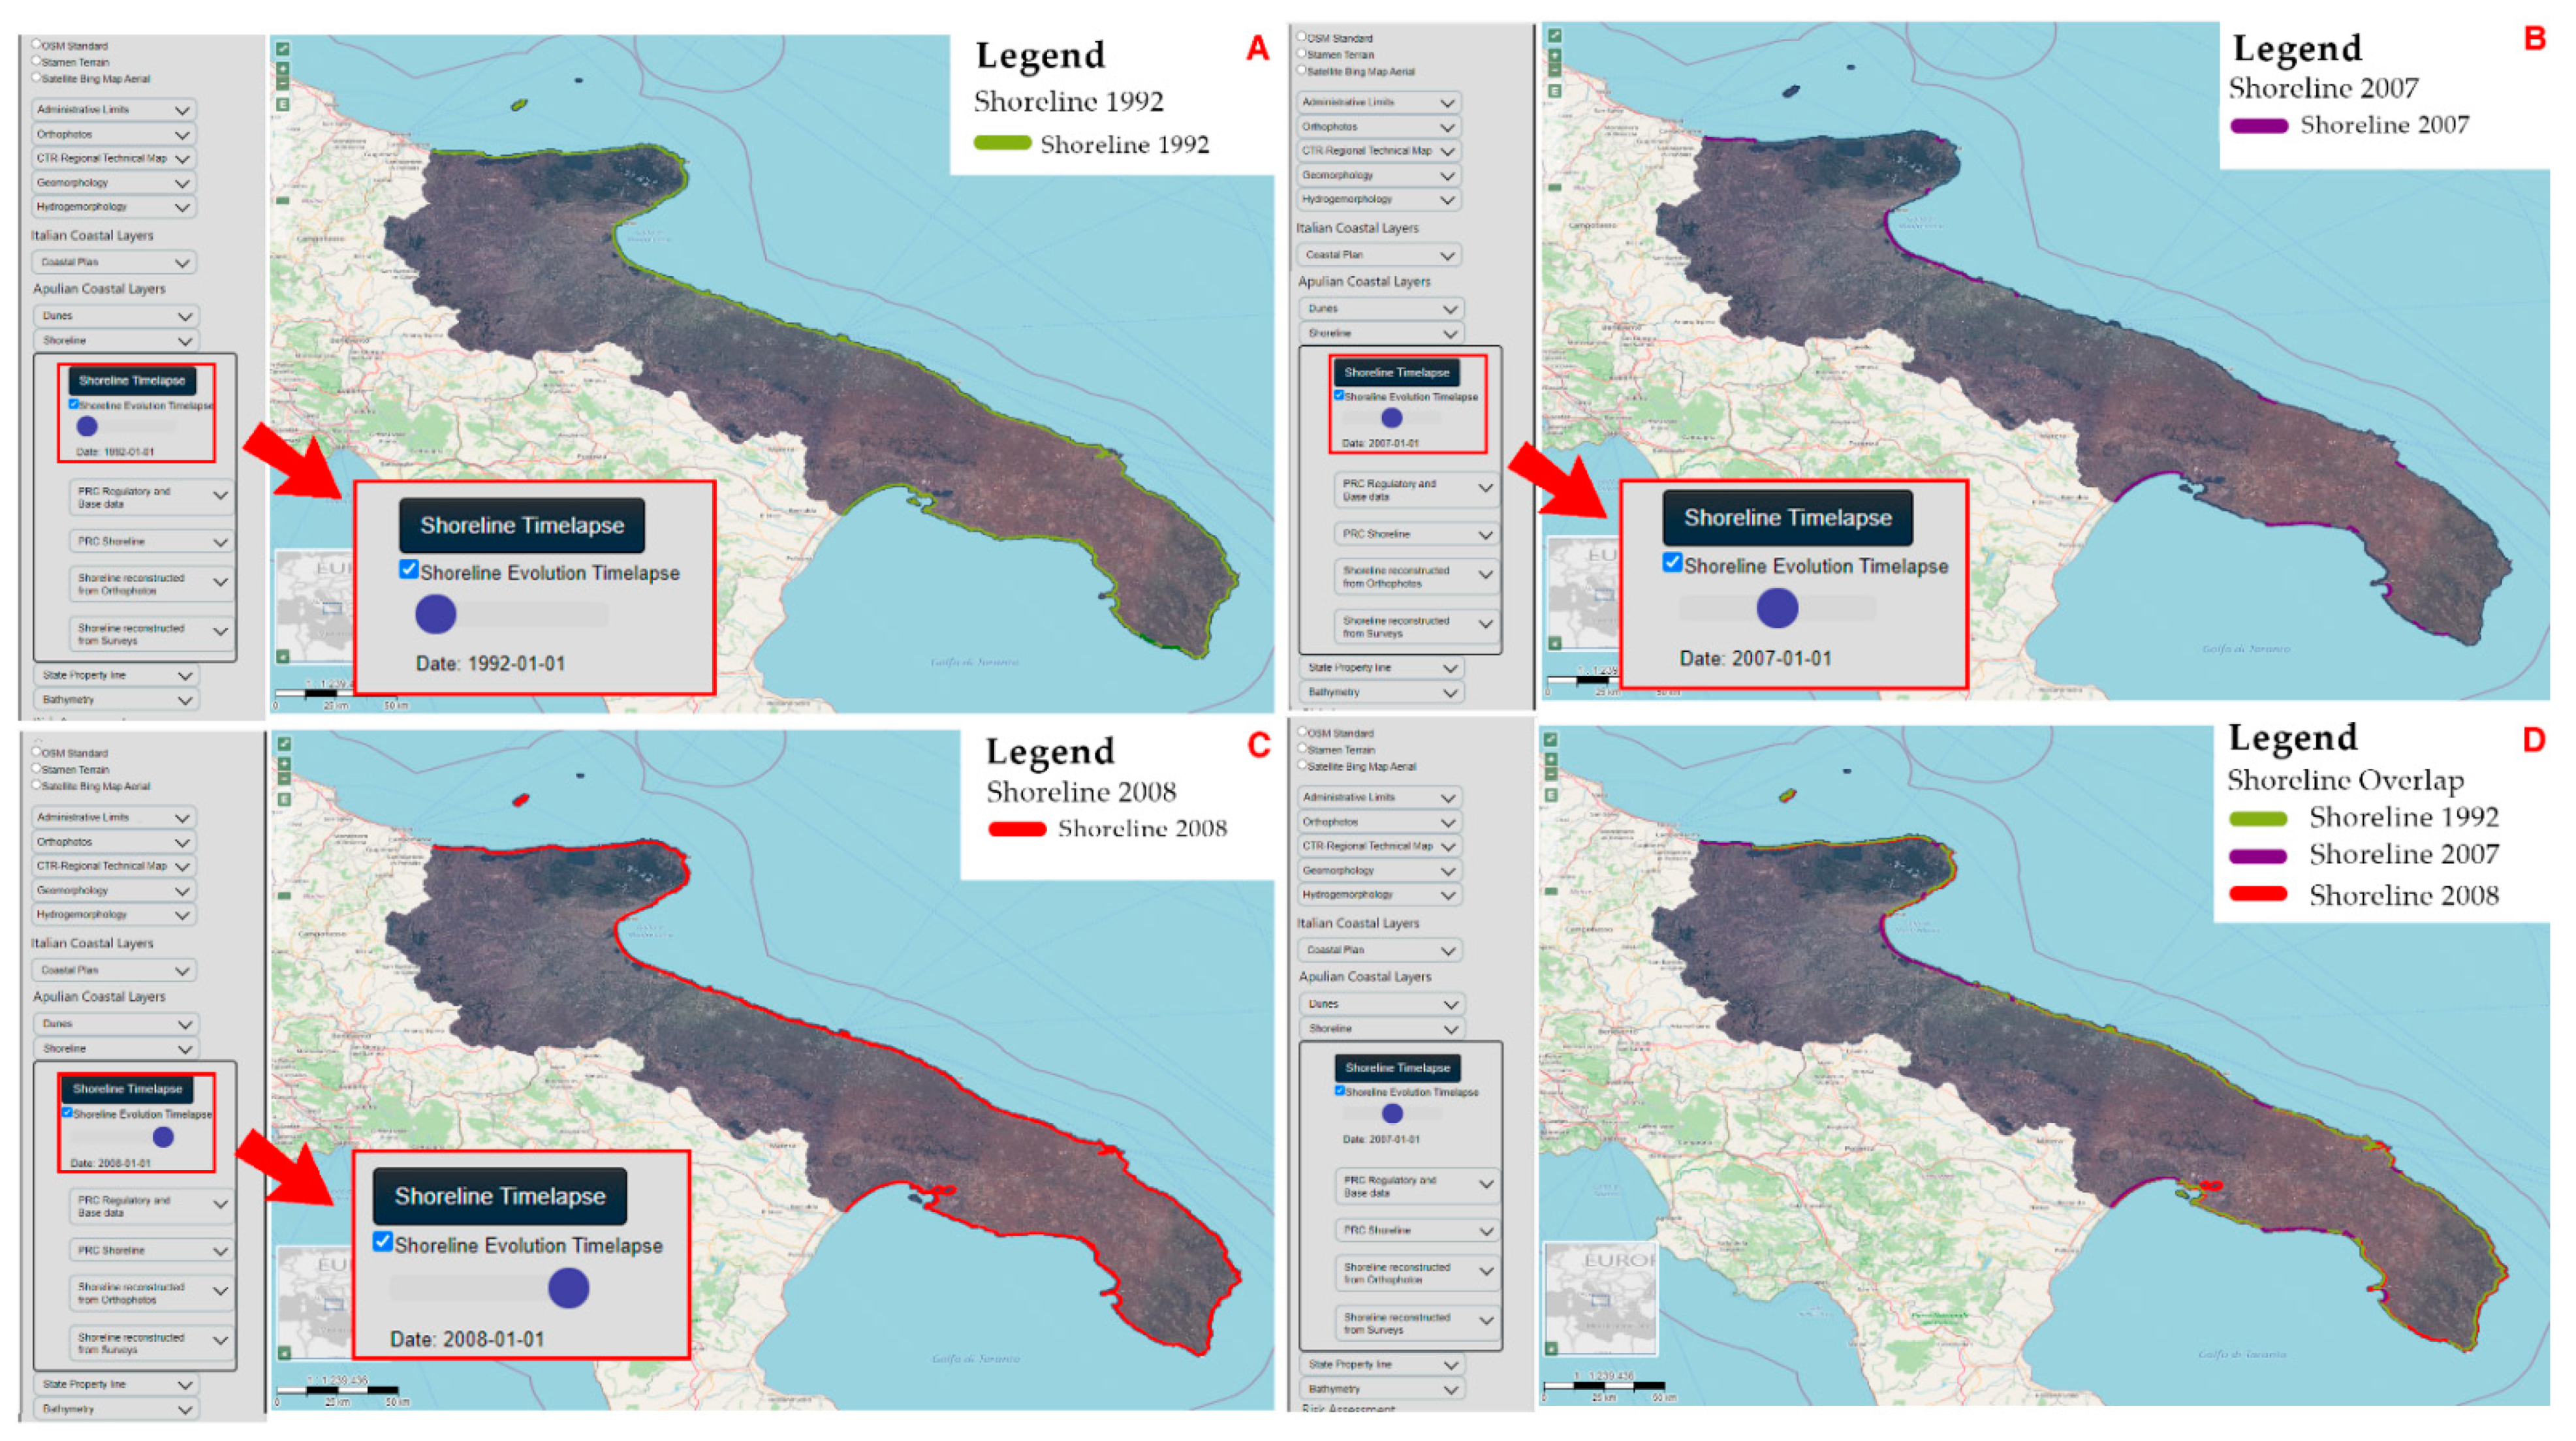
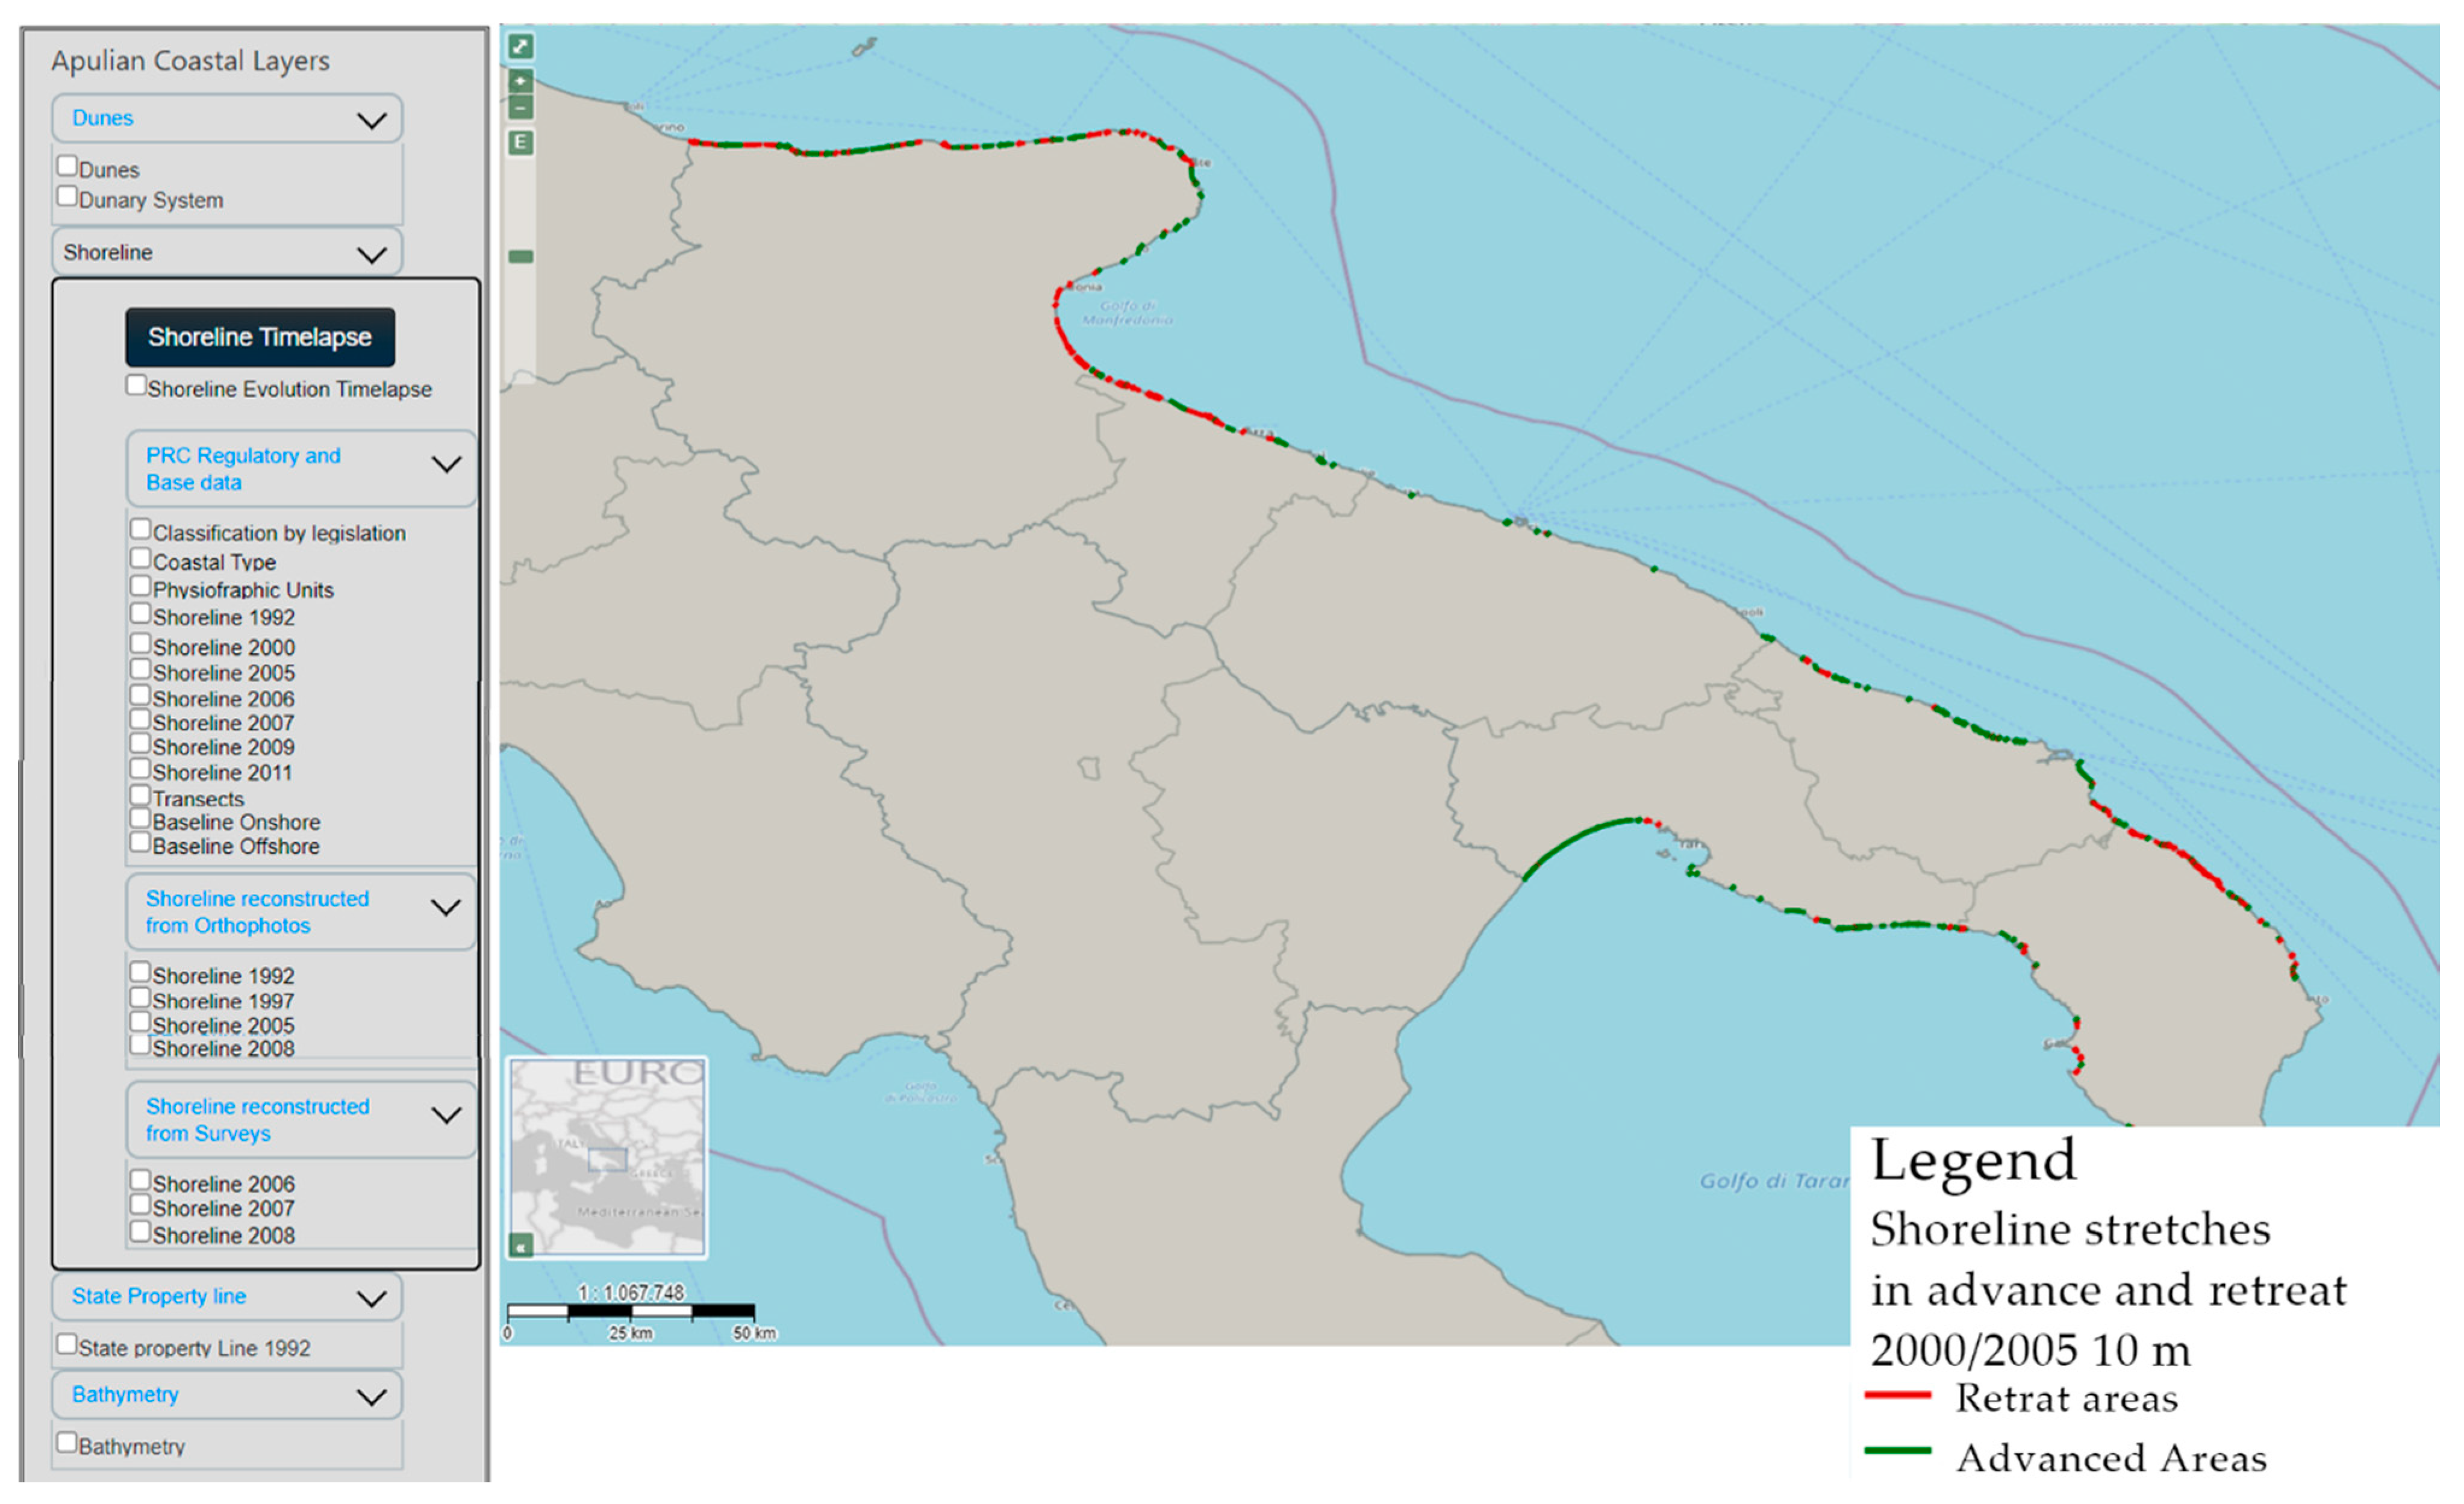
  • Apulian coastal layers, involving the Apulian database aimed at monitoring Apulian coasts for current status and changes over time, with reference to the dune belt and the variations of the shoreline. It includes data developed by several sources, such as Department of Architecture and Urban Planning (DAU) (Politecnico di Bari), Coastal Engineering Laboratory (LIC) of the Department of Civil, Environmental, Land, Construction and Chemistry (DICATECh) (Politecnico di Bari) and the Information System of the State Property (SID). Moreover, a textured mesh and a points cloud obtained by processing photogrammetric pictures acquired through the Remotely Piloted Aircraft Systems (RPAS) and one points cloud generated by analysing laser scanner images were implemented for the study area of Margherita di Savoia. Their comparison allowed the identification of coastal changes and any risks associated with them;
  • Emilia Romagna coastal layers, including coastlines within the municipality of Riccione, acquired and extracted through a low-cost smart video camera [47]; and,
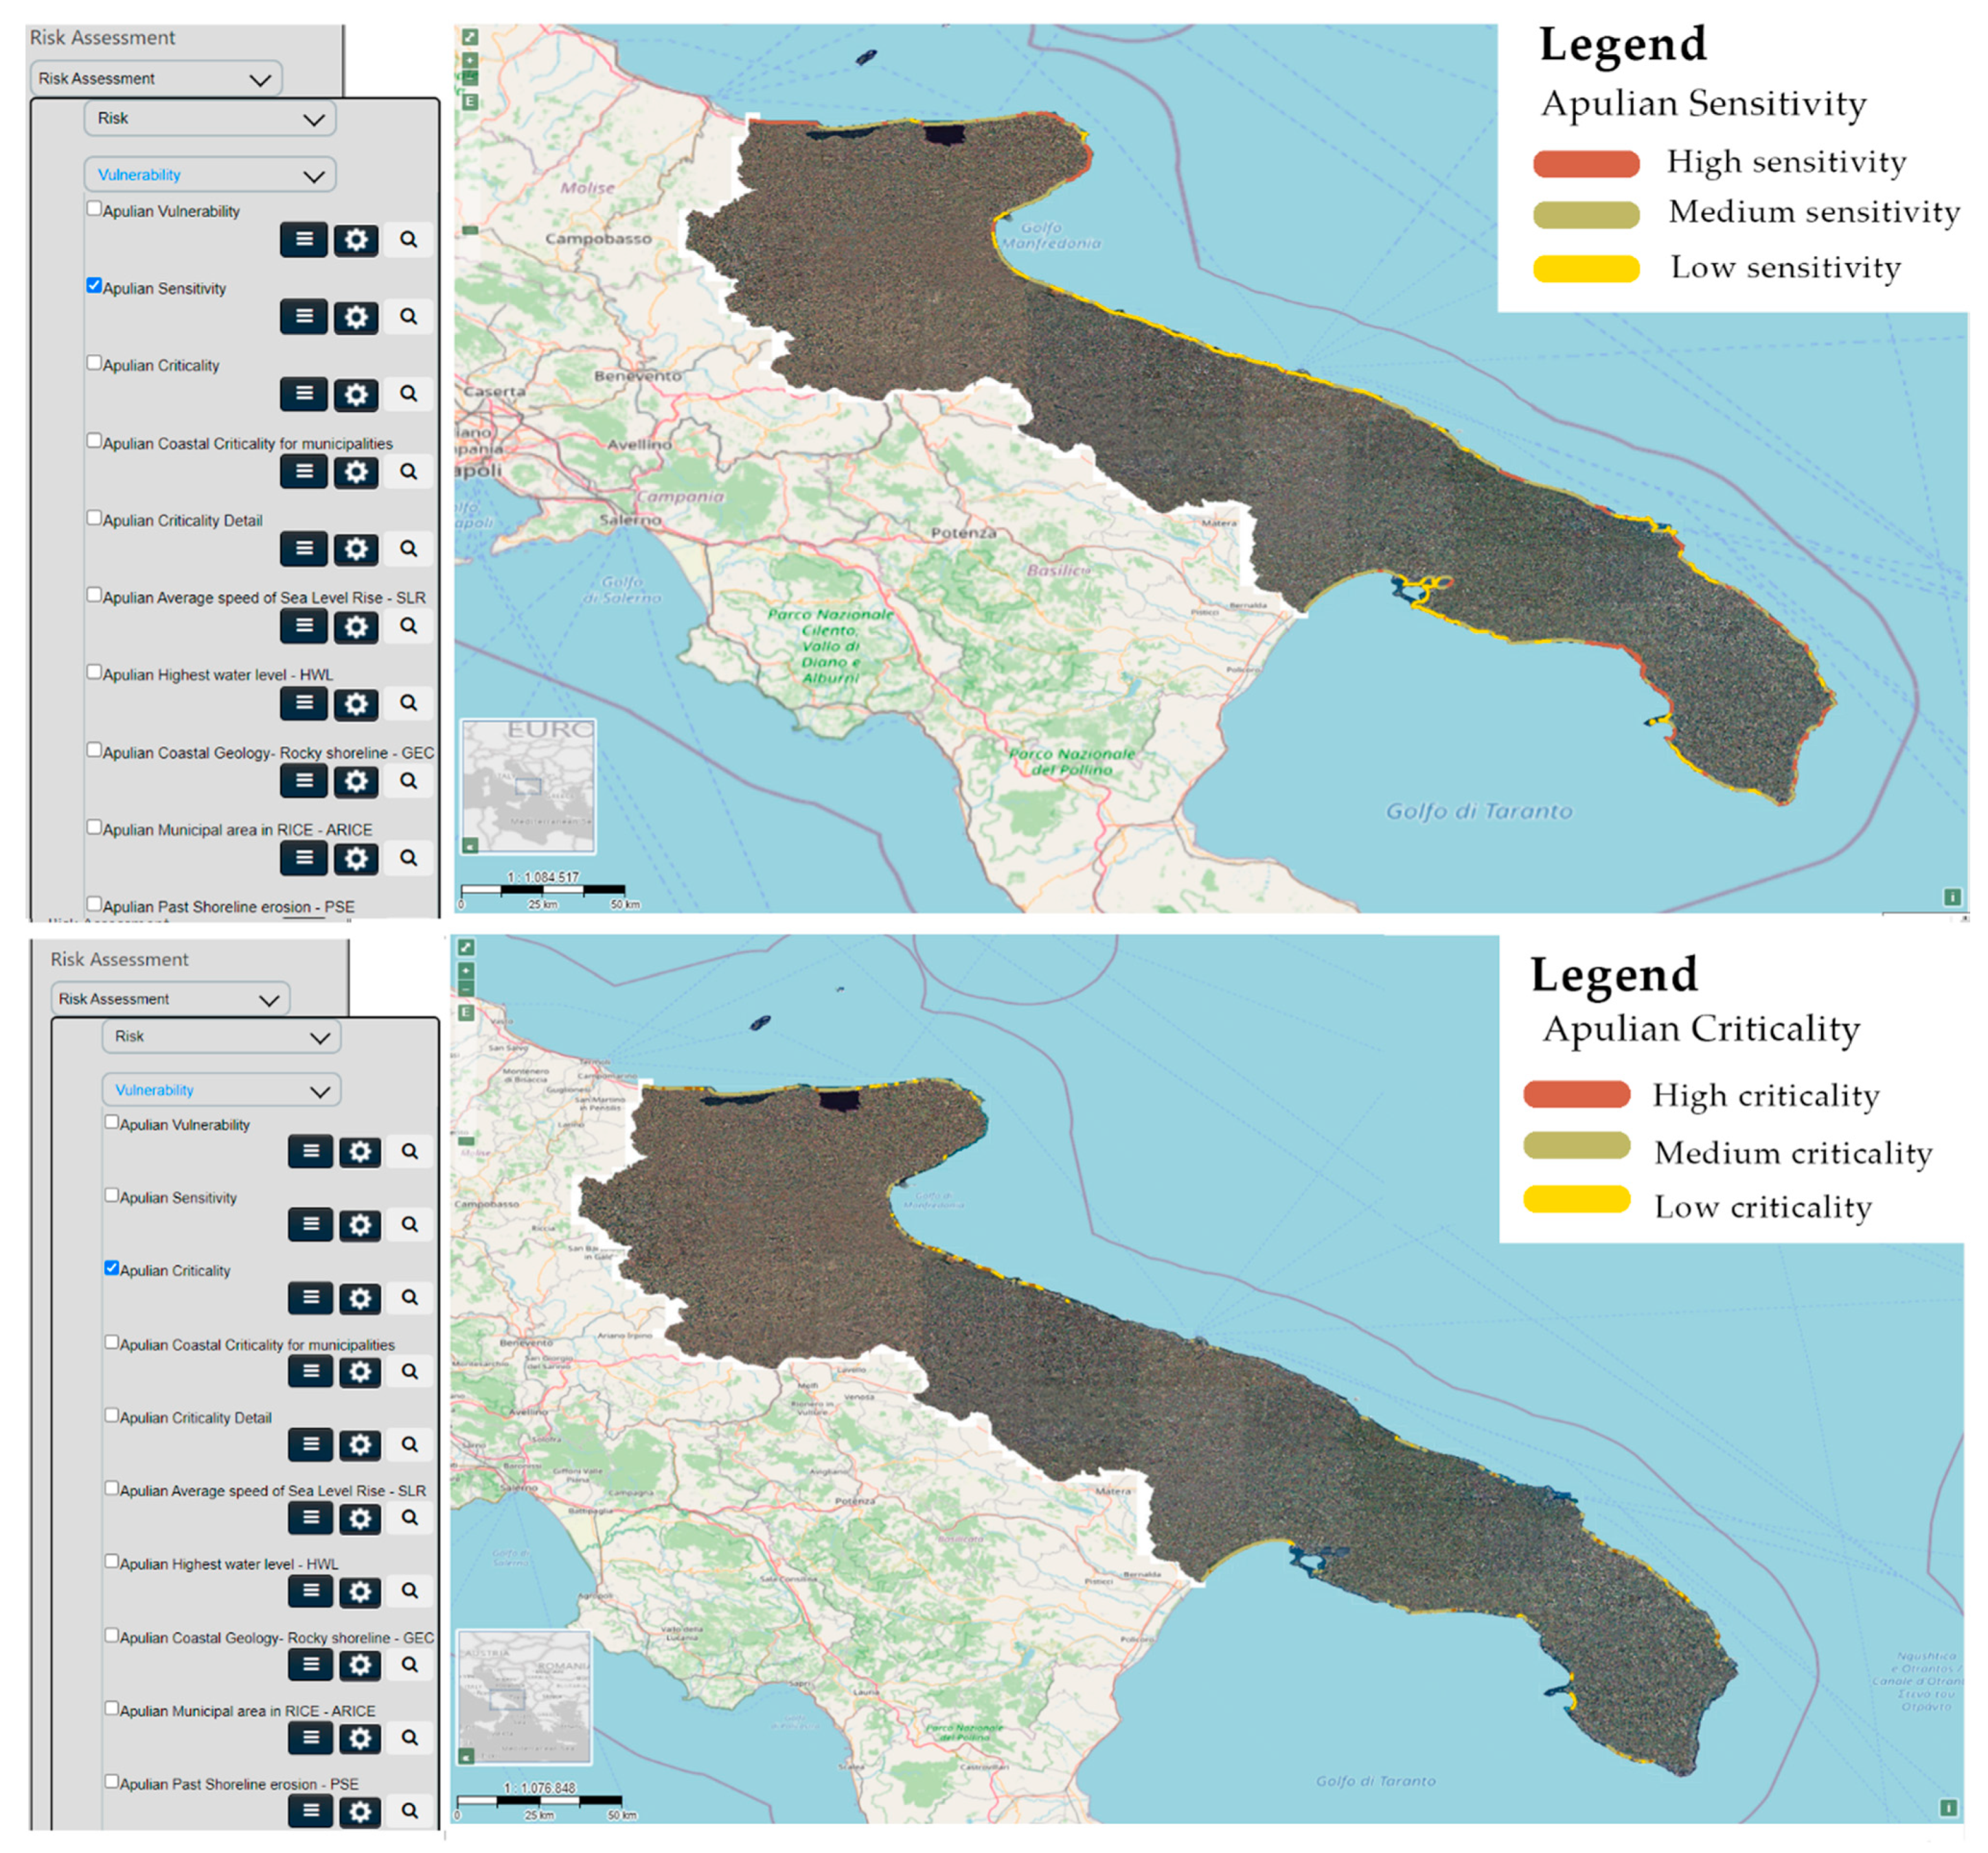
  • Risk Assessment, including hazards, vulnerability, exposure, and risk layers. Besides its corresponding thematic map (coastal vulnerability index, coastal exposure index and coastal risk map), each category also includes the indicators needed to compute them. The methodology and the variables adopted to extract such information are reported in the following section.
The database structure and implemented layers are detailed in Figure 6.

2.4. Coastal Erosion Assessment for Puglia

The Modified EUrosion Model (Mod.E.M.) introduced by [11] was here applied to estimate the coastal erosion Risk Index (RI) and to extract an erosion risk map at a municipal scale in the Apulian region. The RI, defined as the predisposition of coastline to be damaged by erosion and flood, was computed by multiplying Coastal Vulnerability Index (CVI) and Coastal Exposure Index (CEI) (Equation (1)):
R I = C V I × C E I
where CVI depends on the physical features of the area under investigation (morphology, geology and sediment) and on wave energy; CEI is due to anthropogenic pressure. Both indices were calculated by applying a weighted average of selected variables. The variables and the corresponding score rages considered in CEI and CVI computation are reported in Table 1 and Table 2, respectively.
For more details about the adopted methodology and the reference dataset of CVI and CEI indicators, the reader is referred to [11]. Vulnerability and exposure indicators were implemented in the prototype, while the risk maps presented in [11], will be integrated in the next few months.

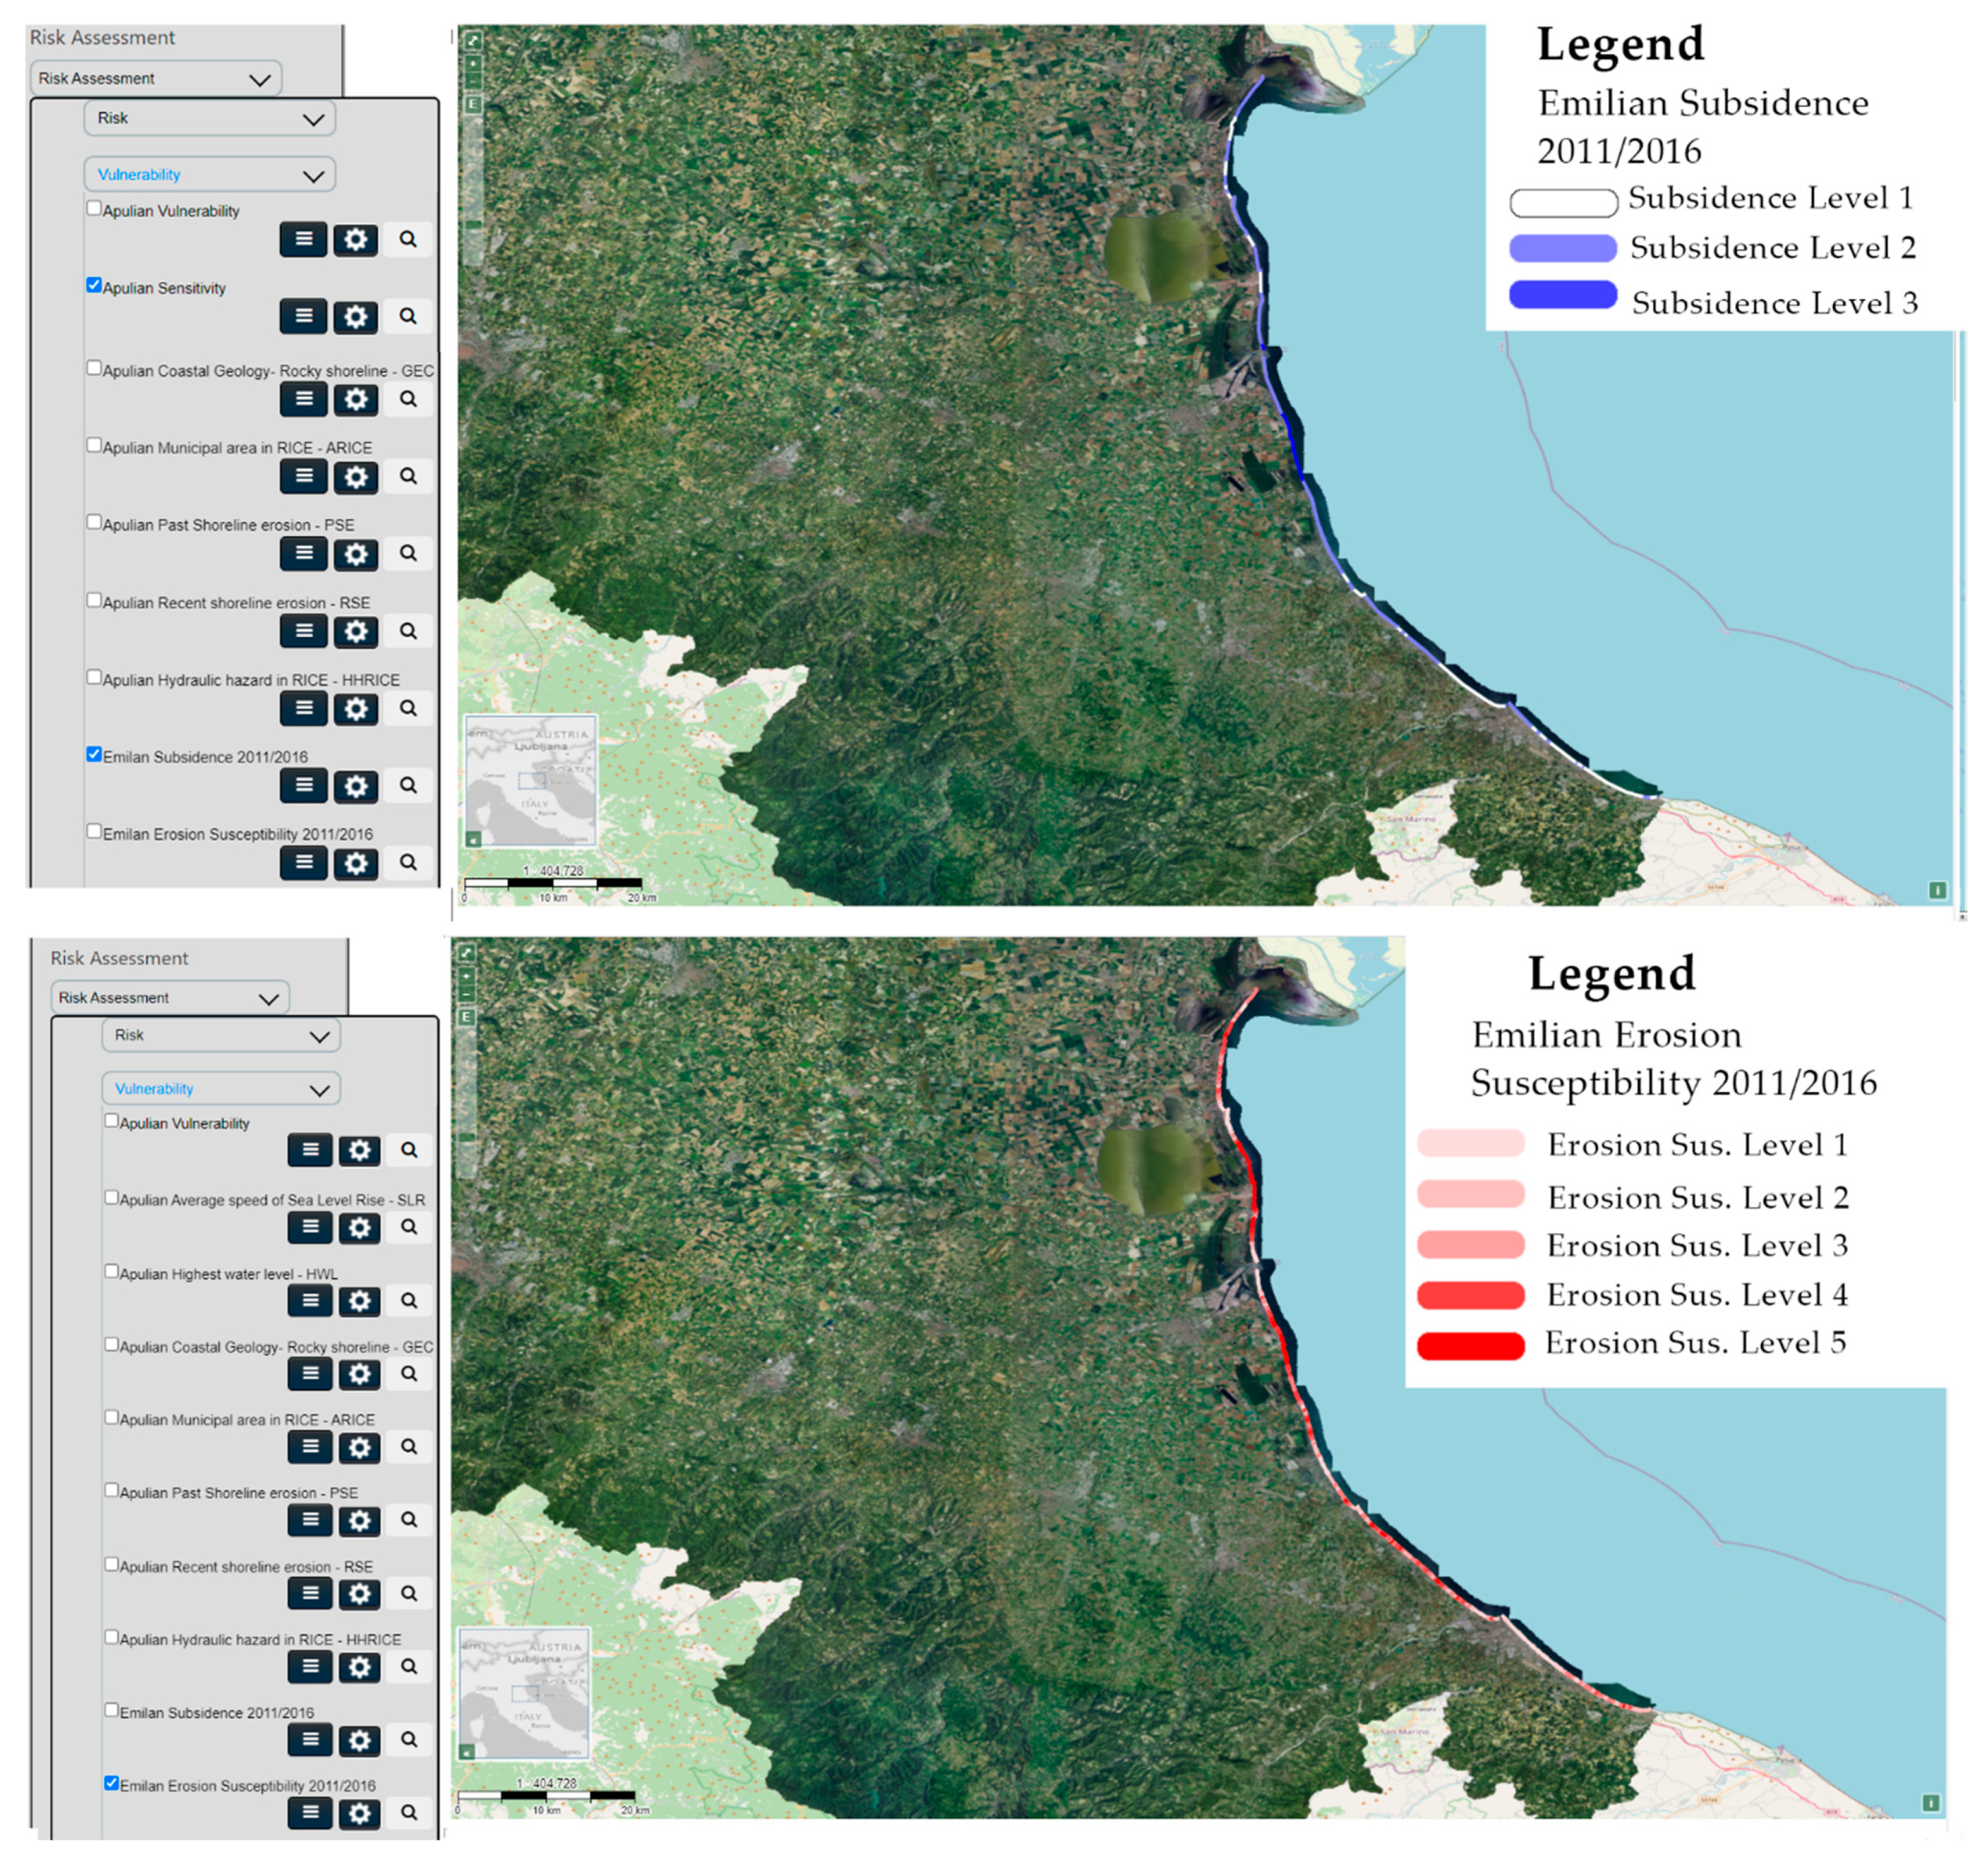
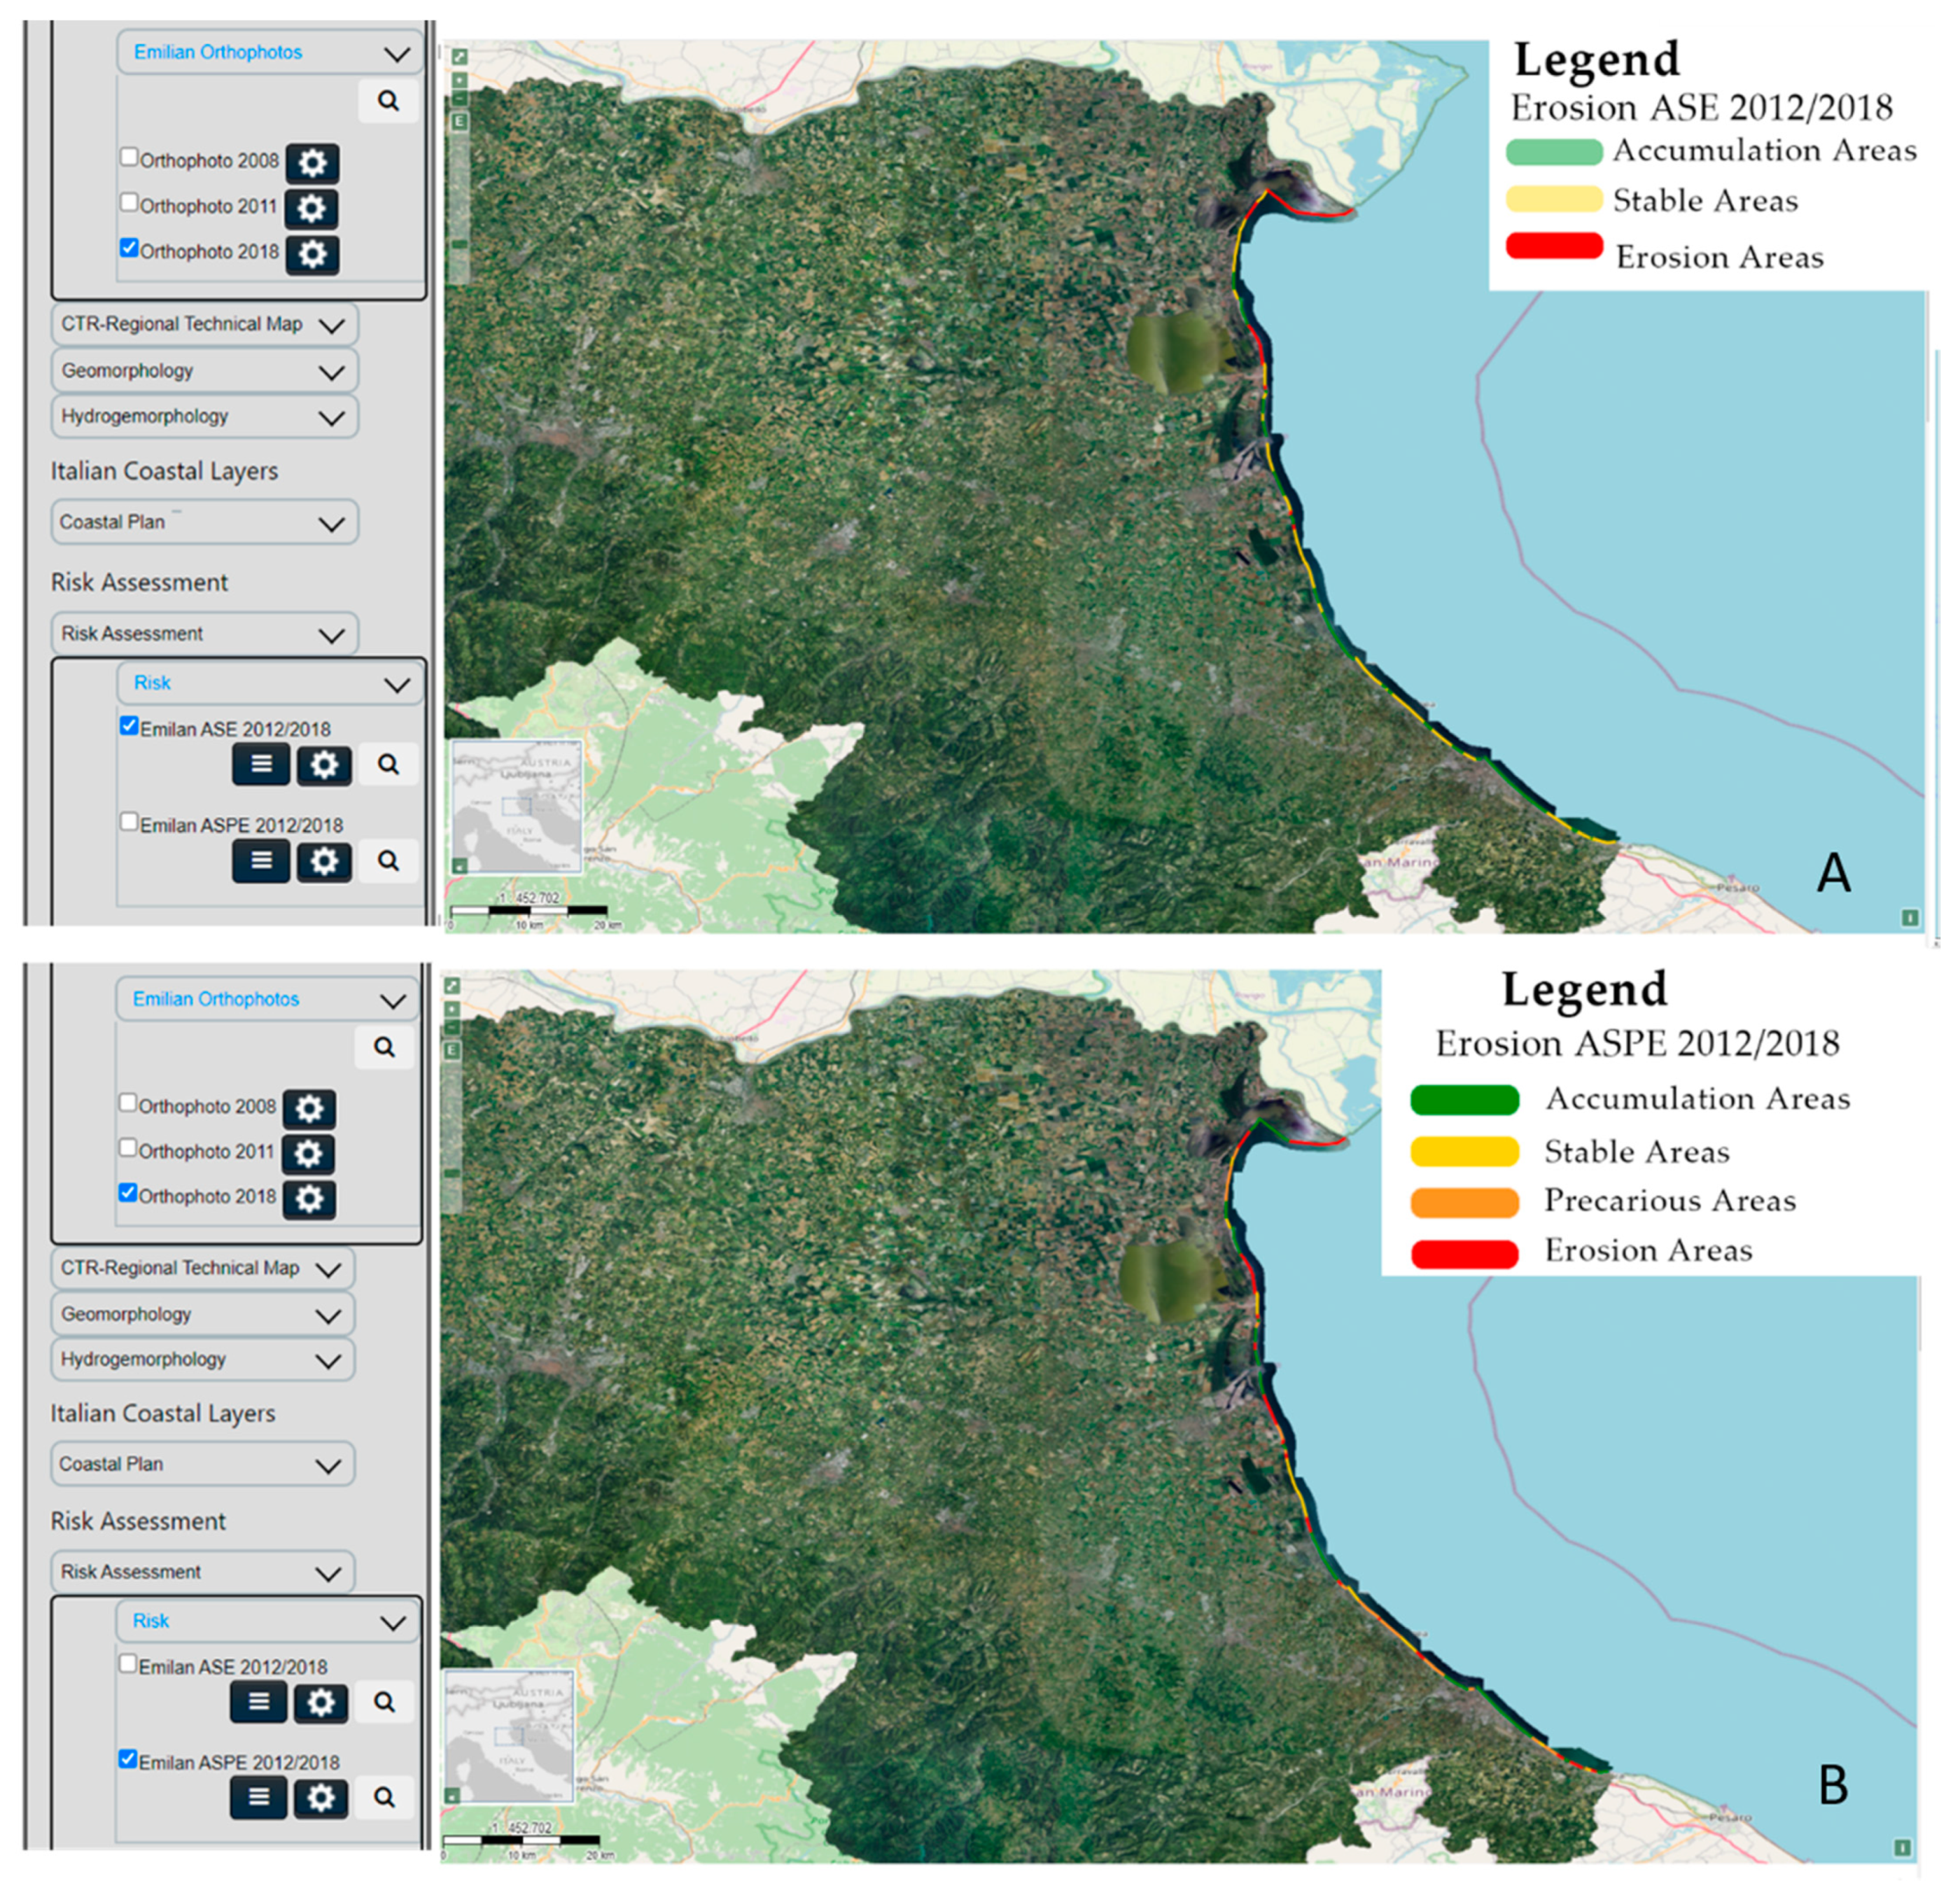
2.5. Coastal Erosion Assessment for Emilia Romagna Region

The Emilia Romagna Region (RER) uses several different indexes to classify the erosive state of the coast: Agenzia Regionale per l’Ambiente (ARPAE), the operative agency of the RER, refers to the two ASE and ASPE status indicators to assess the state of the coast in terms of its erosive or accretion trend. ASE is an acronym for Accumulation Stability Erosion and ASPE for Accumulation Stability Precarious balance Erosion [69,70,71]. They respectively represent the state of the coast in 2018 compared to 2012, and the hypothetical state in which the same coast would be in the absence of coastal defence interventions such as nourishment, construction or works maintenance. These two coastal indicators are used by the RER and updated in each report on the state of the coast. Details of the estimation are provided in [69].
RER has also developed susceptibility maps in response to coastal erosion phenomena and floods. The SI_e is the susceptibility of the coast to the phenomenon of erosion and is calculated by analysing and weighting three types of coastal indicators: morphological, evolutionary and of anthropogenic pressure (percentage of coastal antropization). Details are available in [72].

3. Results

3.1. WebGIS Architecture and Performances Assessment
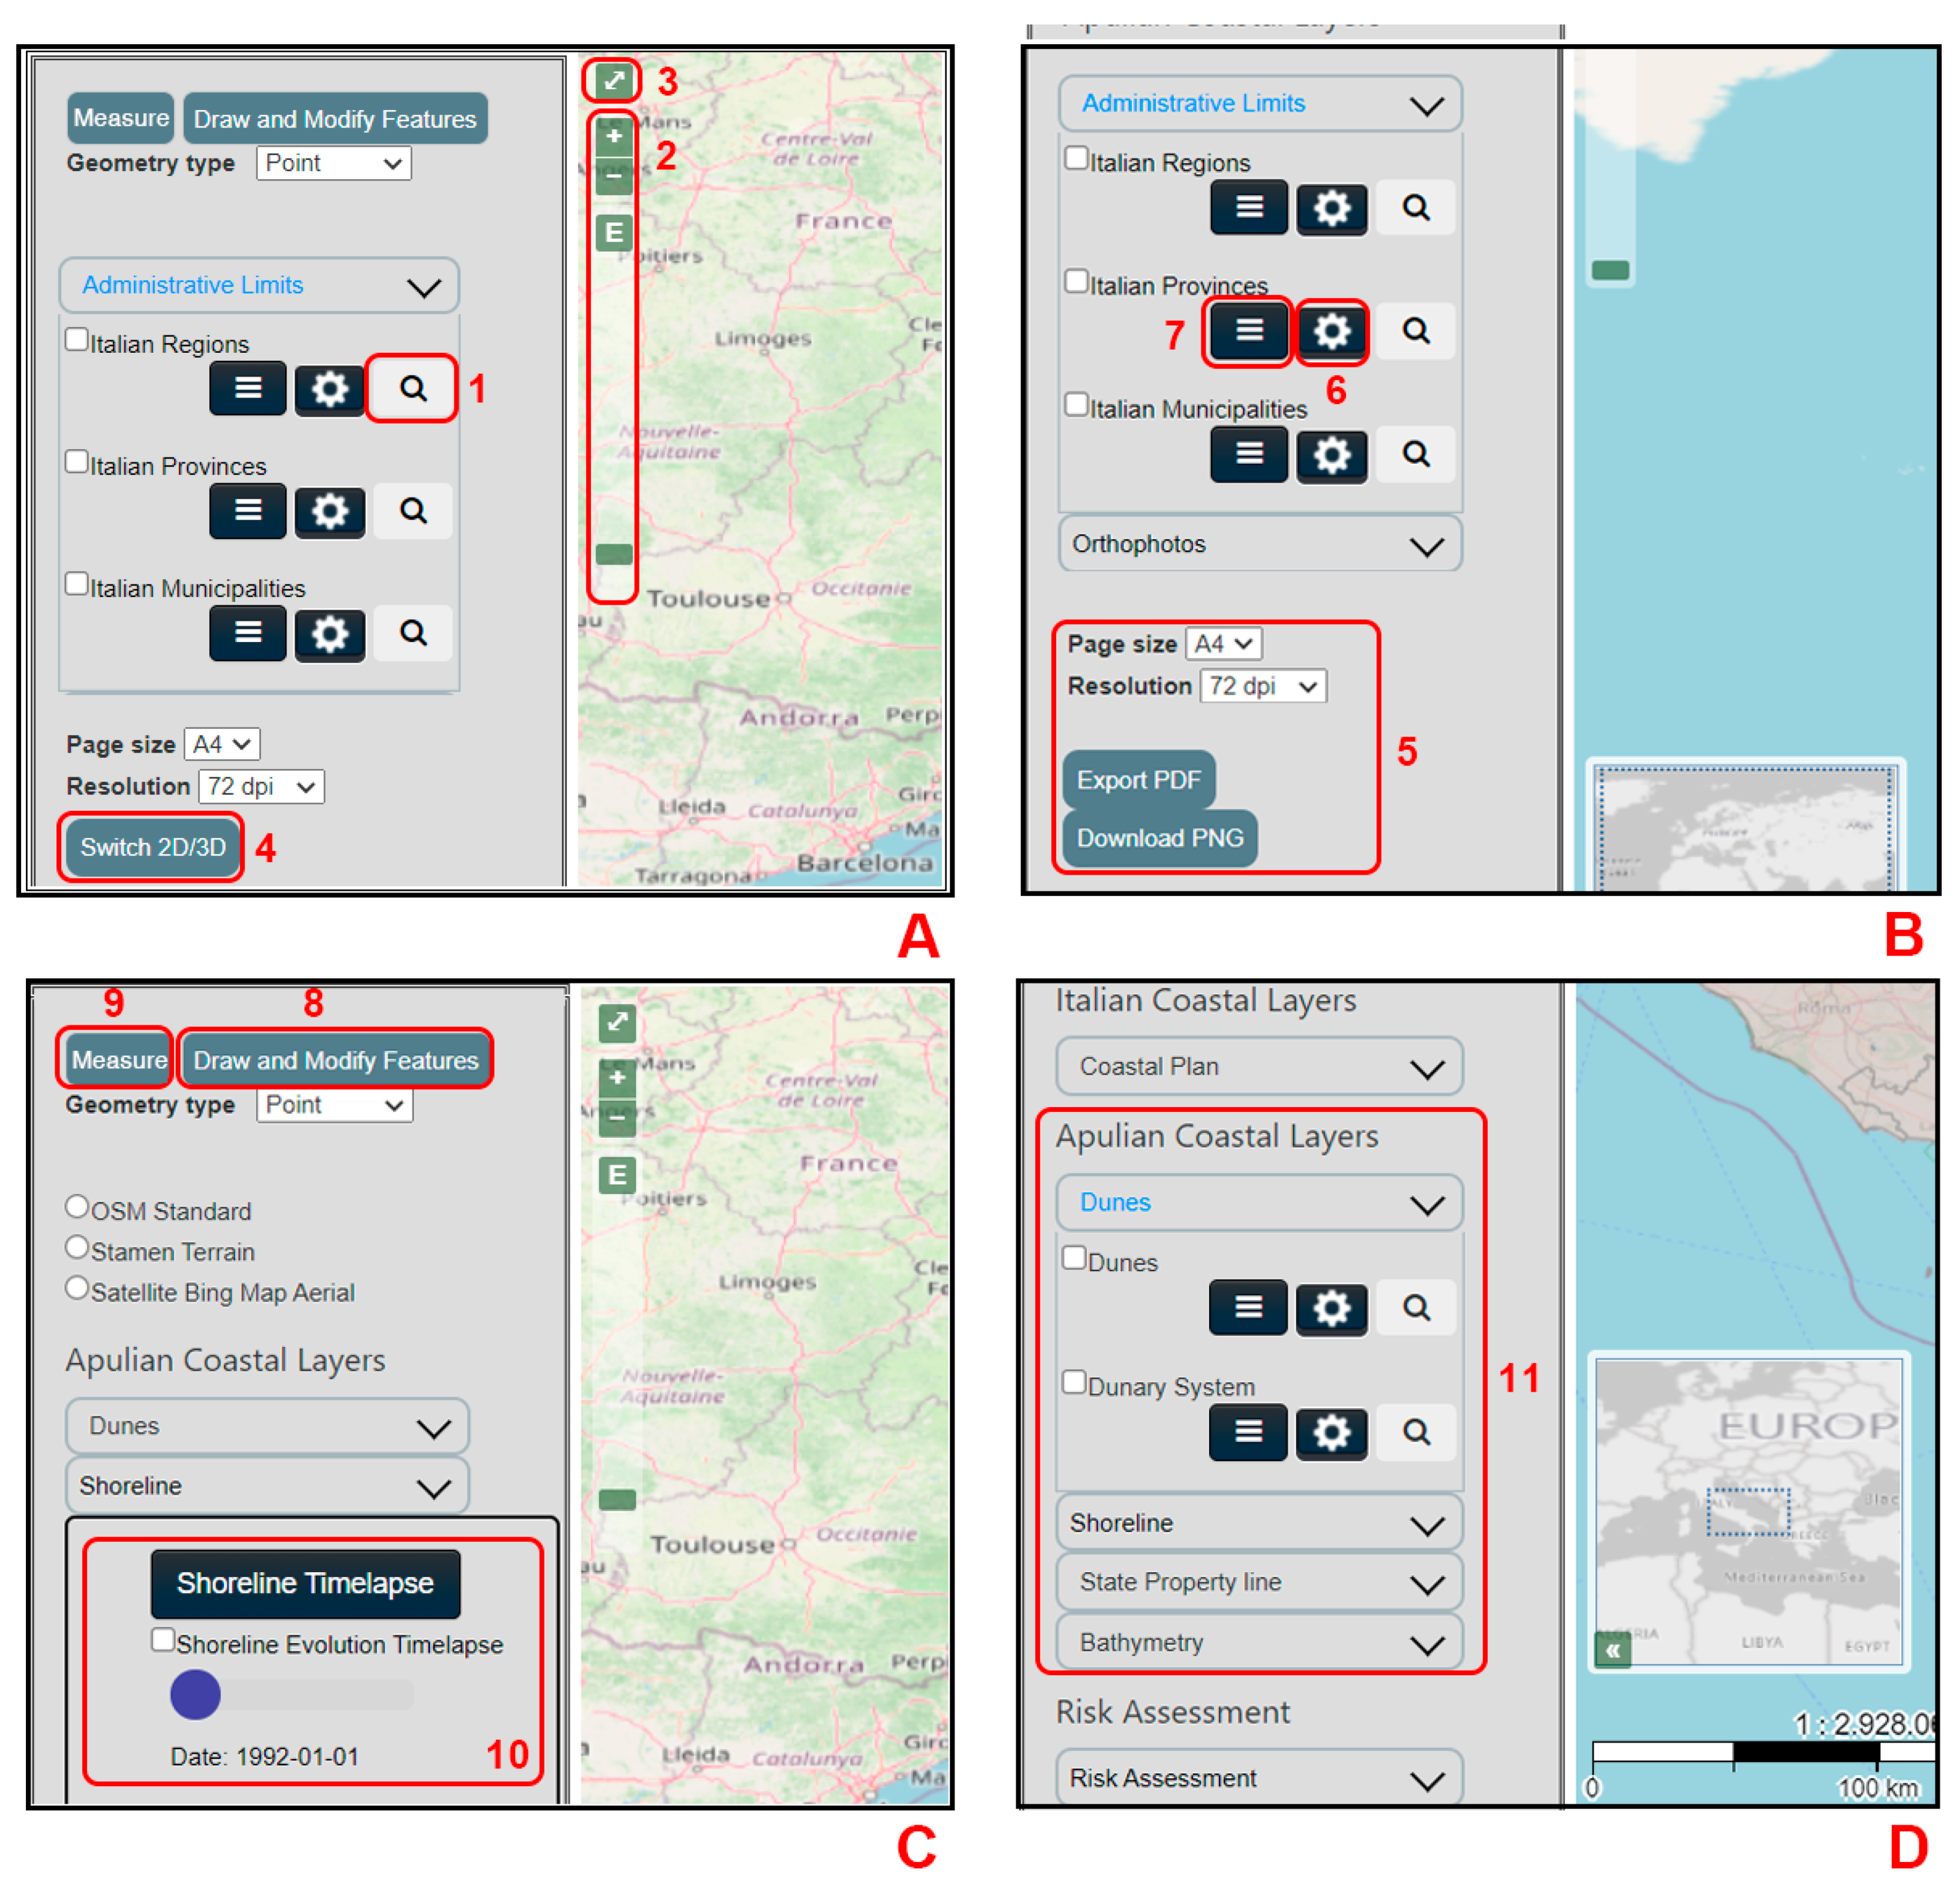
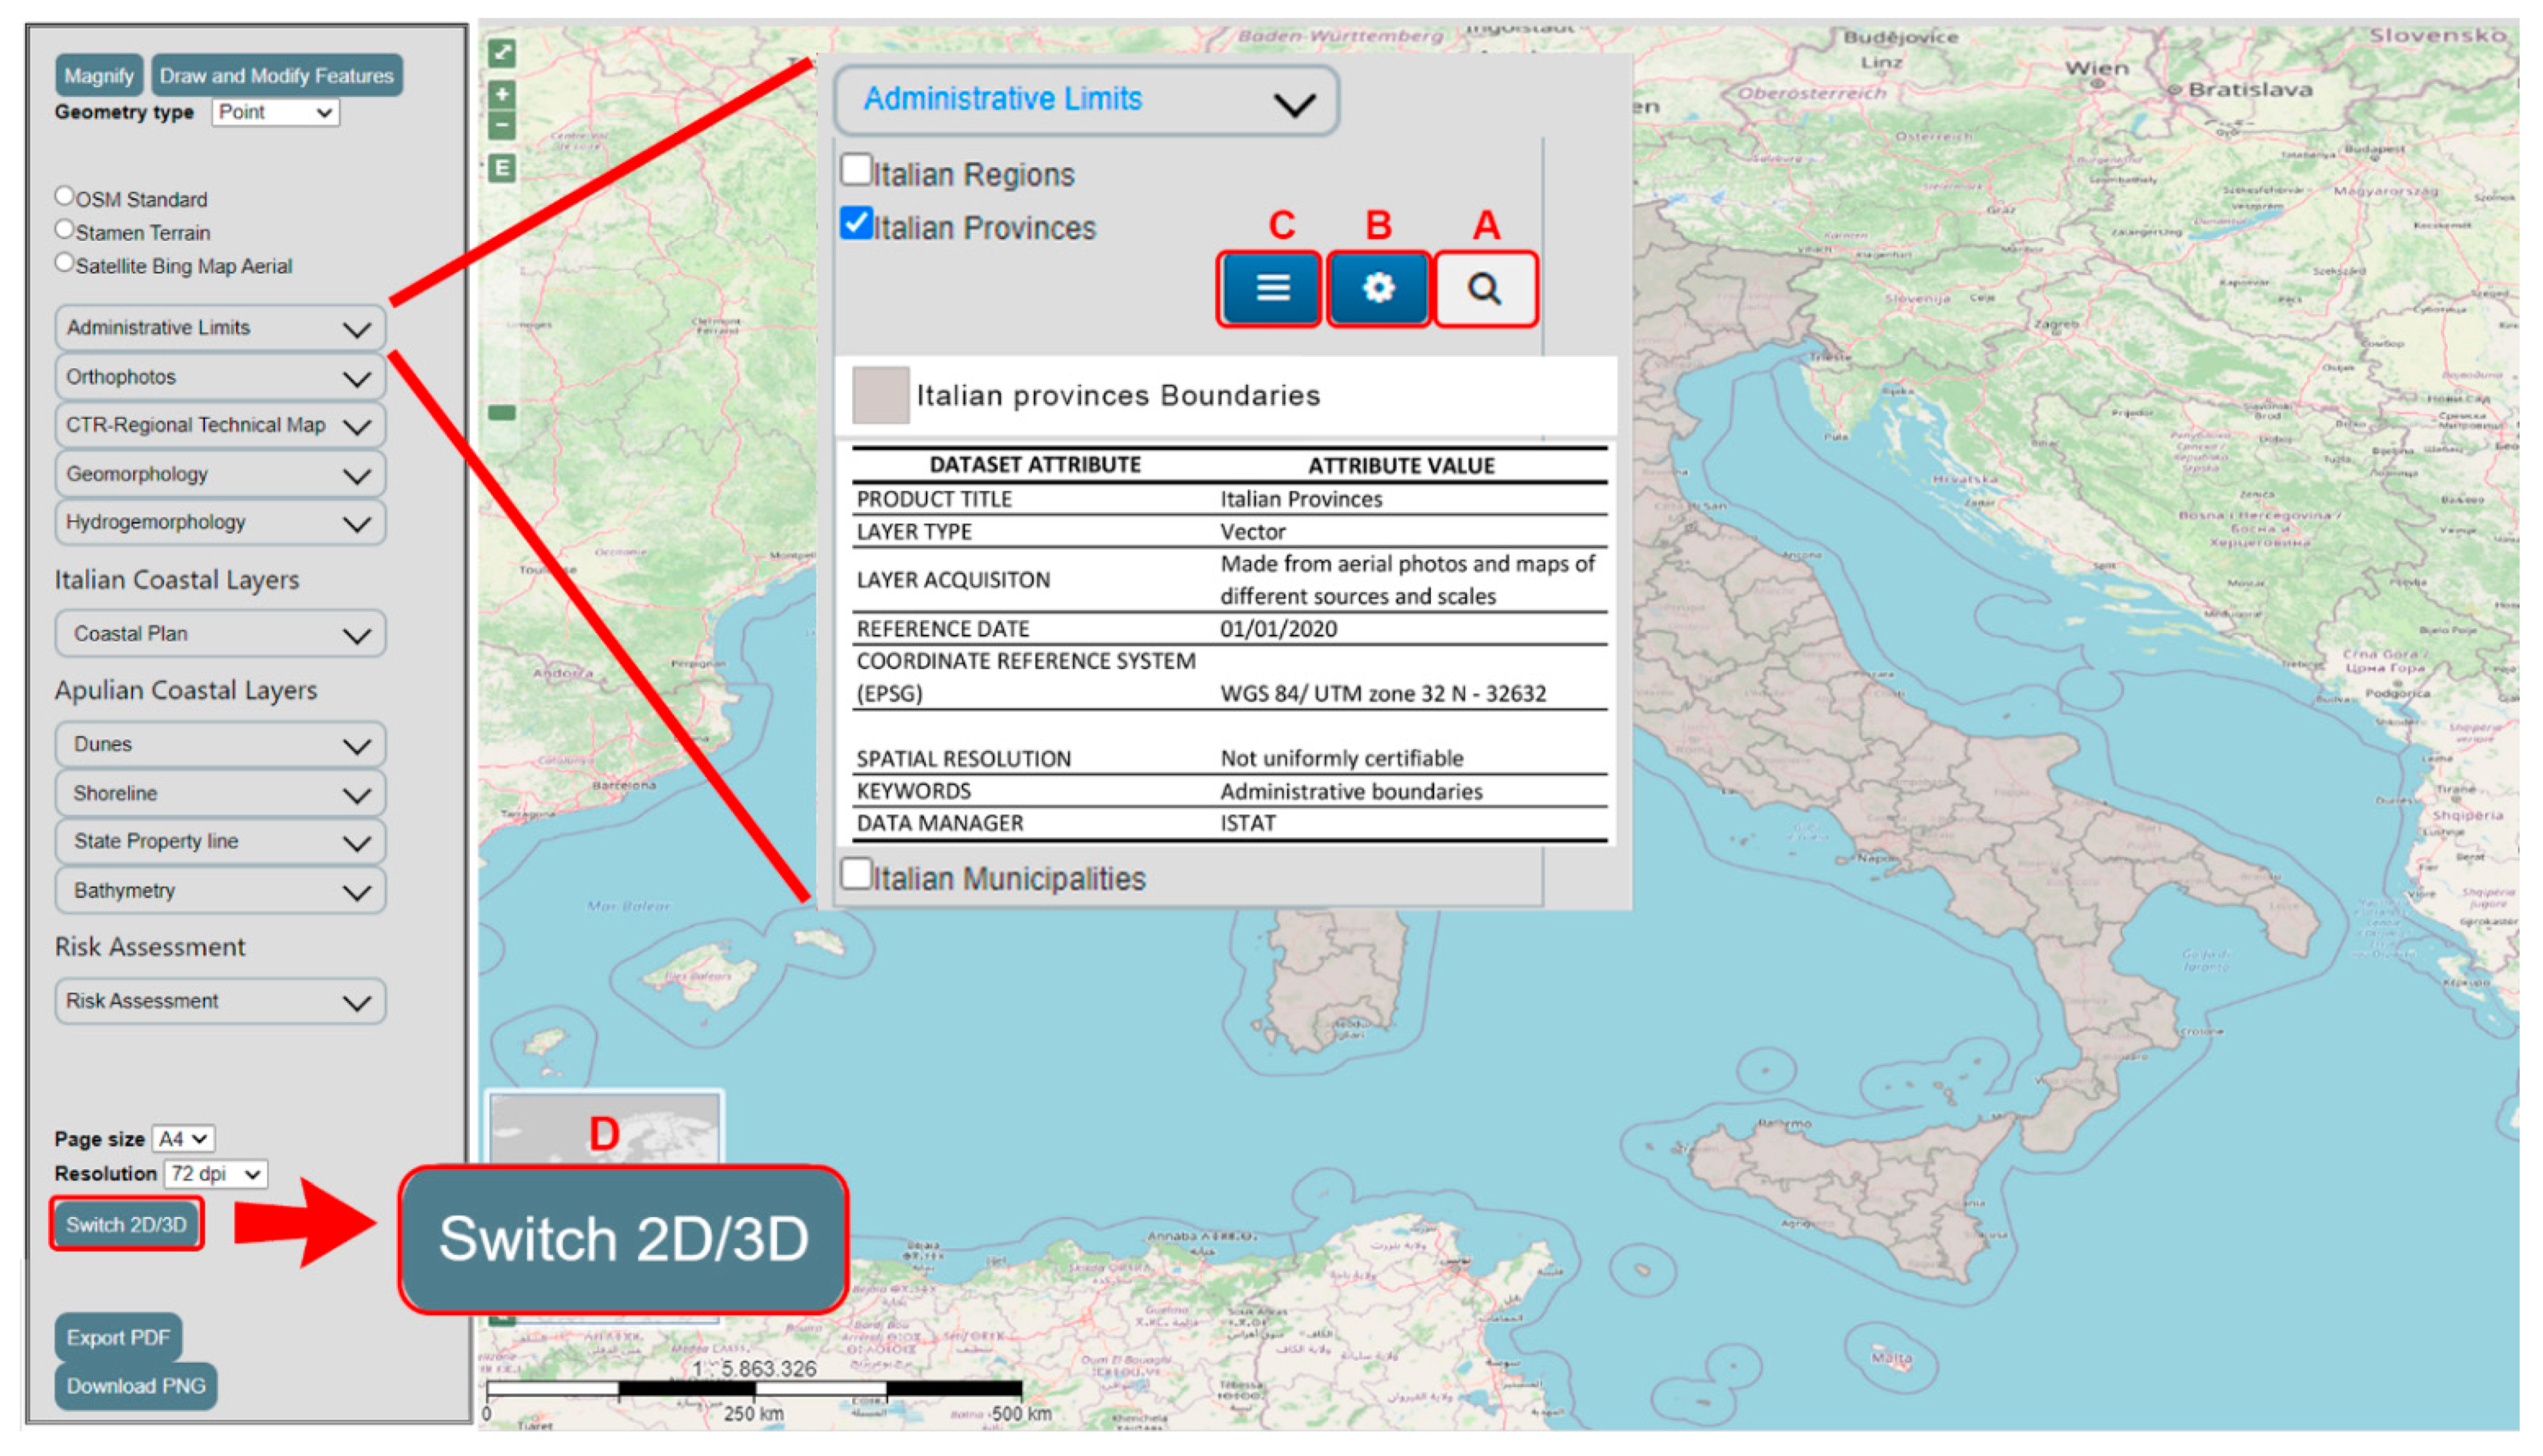
The architecture was designed to create an intuitive and quick WebGIS prototype which allows users to easily and quickly access and interact with data. Thus, its components (Web Server, database, Map server and libraries) were accurately selected to optimize its performance and to make it updateable over the years. Currently, it involves more than 90 layers, including 2D (raster and vector) as well as 3D data (point clouds, textured and non-textured meshes). It can be upgraded constantly, importing newly available data. Moreover, due to the very large size of some datasets (e.g., point clouds of about 1.5 GB), Google Draco compressor [73] suitable for compressing point clouds size by more than 7 times with an accuracy of 1 mm was applied to halve data loading times [74]. Simultaneously, the uploading of 3D textured meshes was accelerated by using Google WebP image format compressor [75] which reduces data size by 25–34% [76].
Architecture performance is in line with previous literature. PostGreSQL DBMS can run 12 million records in 5–10 s [77]; the combination of PostgreSQL/PostGIS and Geoserver allows to query data in an average response time of 2.4 s [78,79]. The web mapping client was totally built in a VS Code environment, by writing scripts in HTML, JS and CSS languages consistent with the specific needs to meet. Furthermore, the main page was split into several JS files, increasing code running speed and minimizing programming errors.

3.2. Web Interface

Figure 7 shows the developed WebGIS Graphical User Interface (GUI) consisting of the main page, divided into two panels by the <div> tags: (i) on the left, the Table of Contents (TOC), composed of tools and layers to be activated, (ii) on the right, the map area available in 2D and 3D viewing.
The following components were implemented in the 2D viewer:
  • a TOC, containing all implemented layers inserted in specific macro-categories, switch button, drawing and export tools;
  • a map viewer in the middle of the page;
  • an overview map in the lower-left corner;
  • a scale bar at the bottom-left;
  • a vertical toolbar at the top-left, containing navigation tools (zoom in, zoom out, slide zoom, zoom to layer extension and full screen);
  • the button “i” at the bottom-right which provides information related to the displayed layers;
  • coordinates of the mouse pointer at the top on the right.
Therefore, once the webpage has been opened, the Standard Open Street Map (OSM) layer is displayed in the map viewer and, if the layers and tools are activated, the implemented data are directly overlaid to it.
Classifying data in the most suitable macro-categories allows users to easily identify the layers satisfying their needs and, once found, legend and metadata information may be displayed using an appropriate button, represented in Figure 7.
The 3D viewer is composed of:
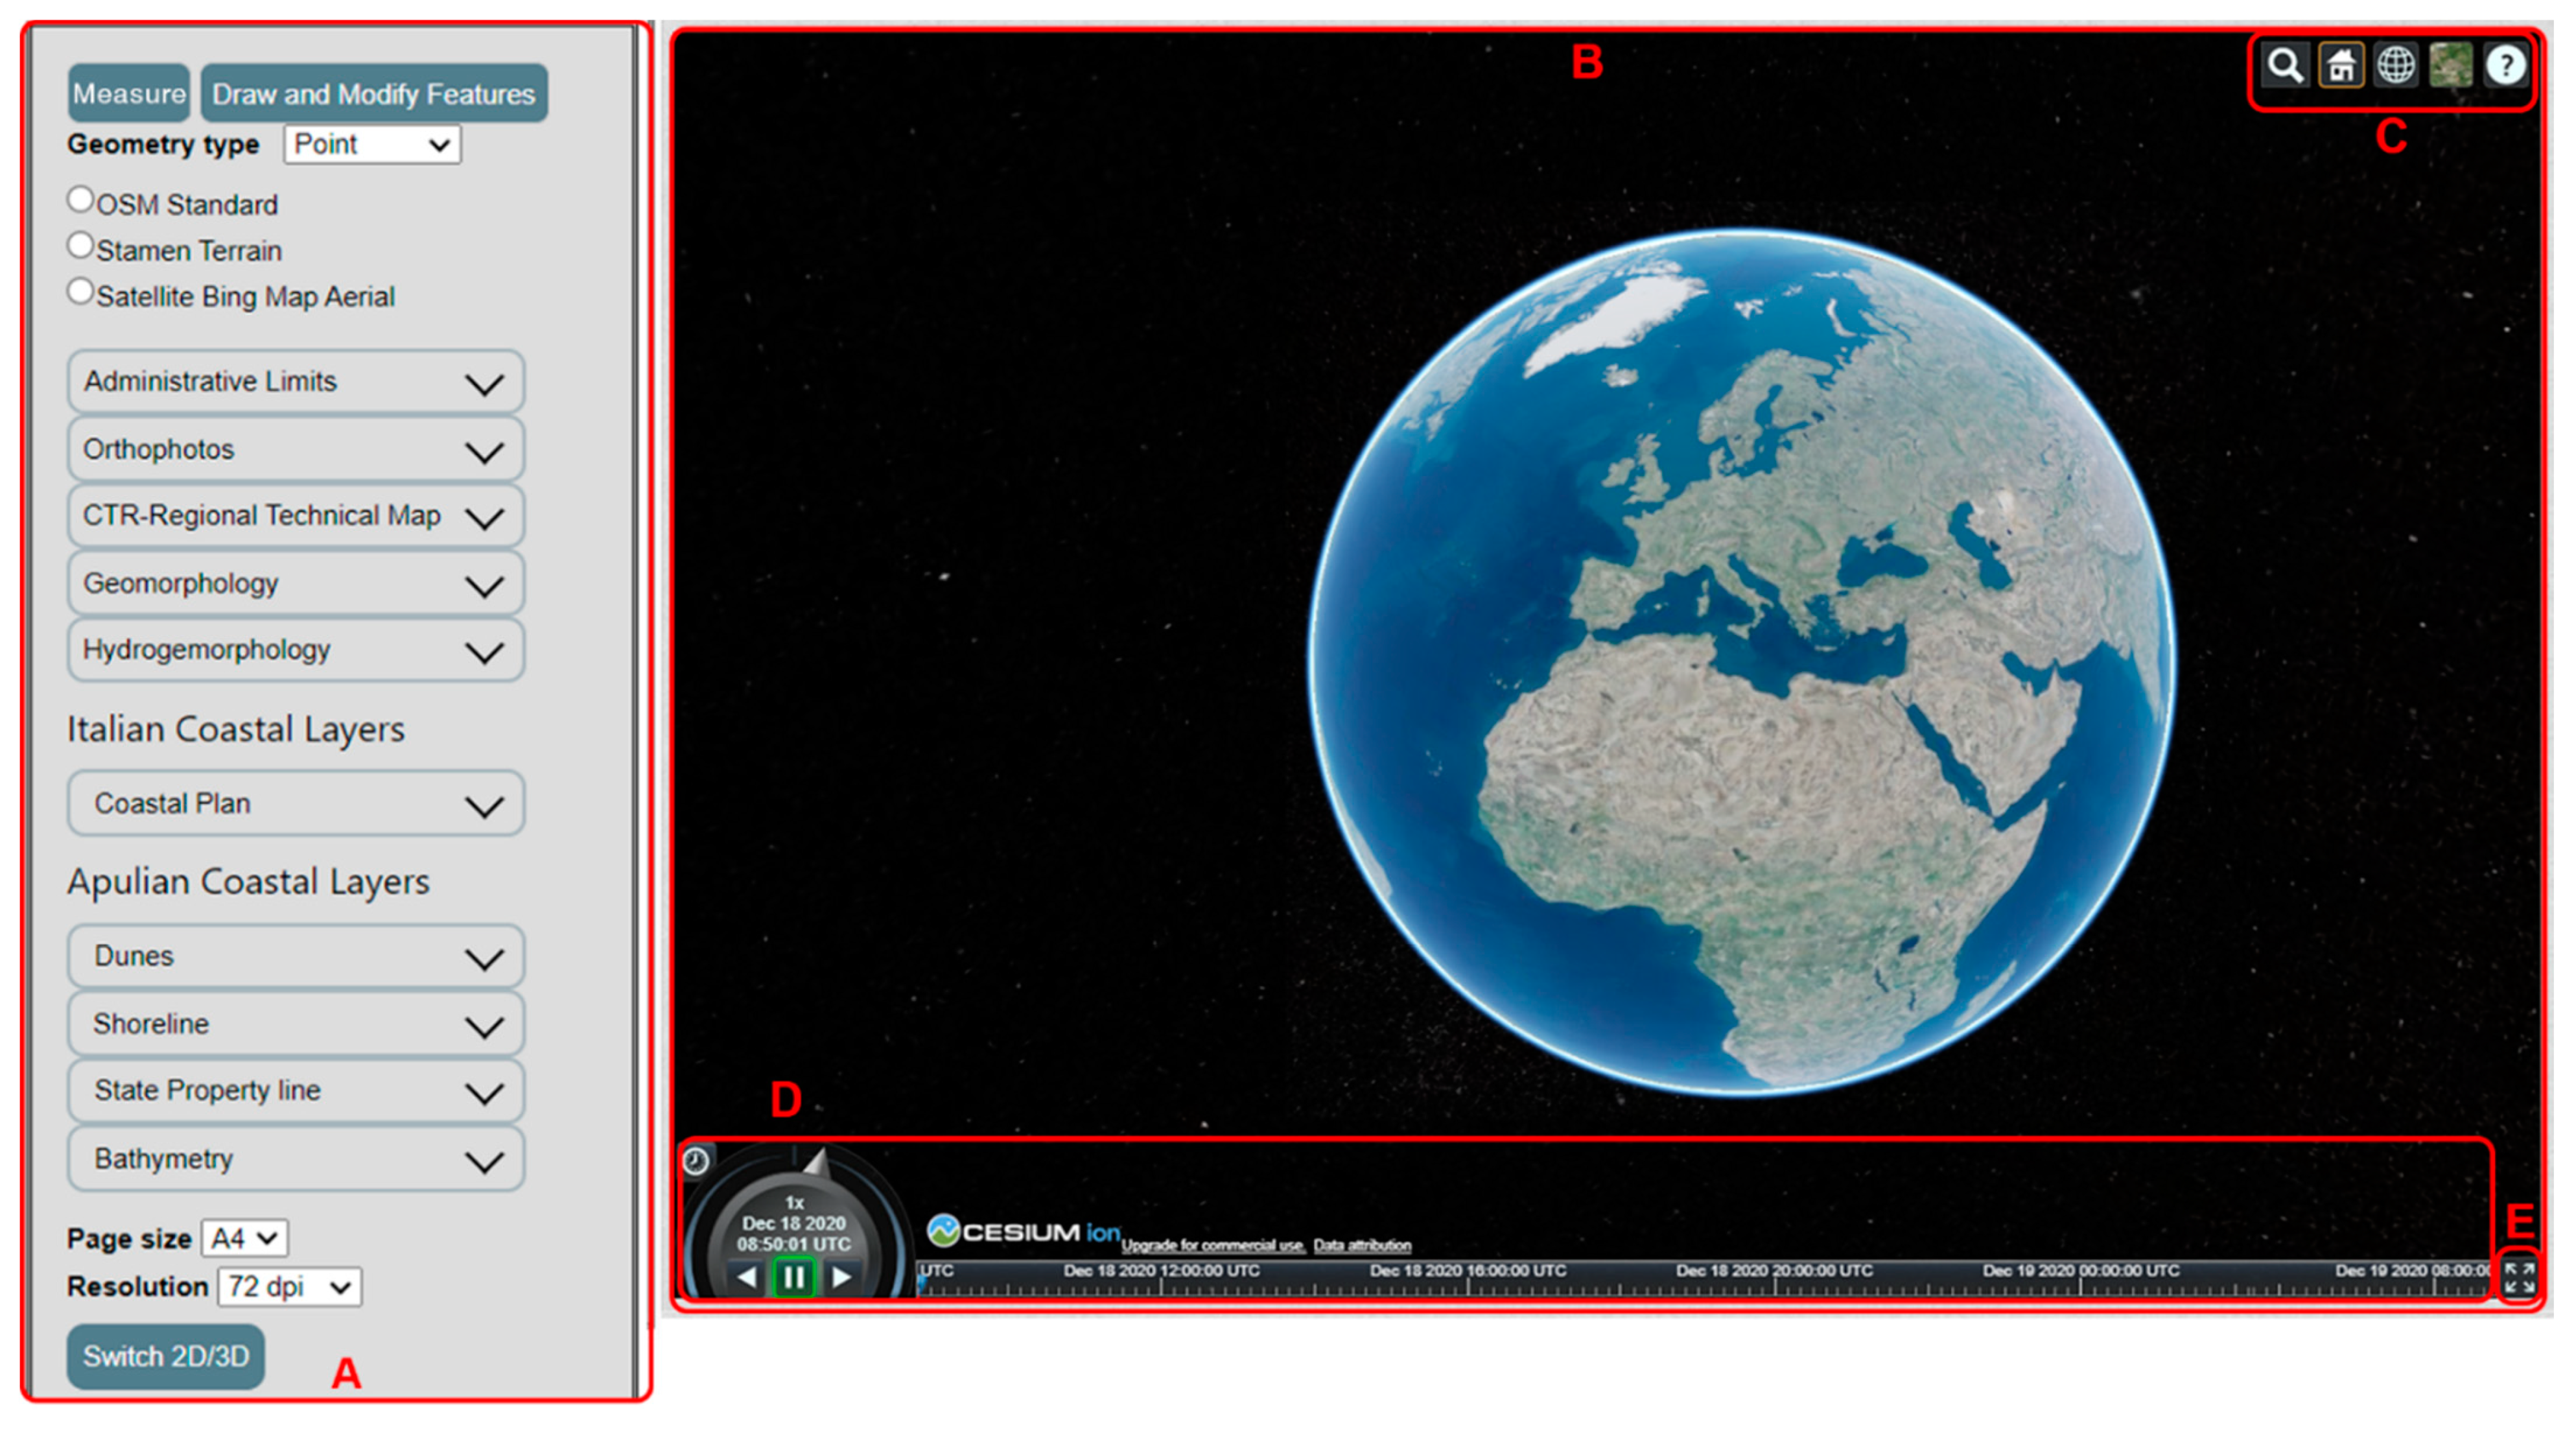
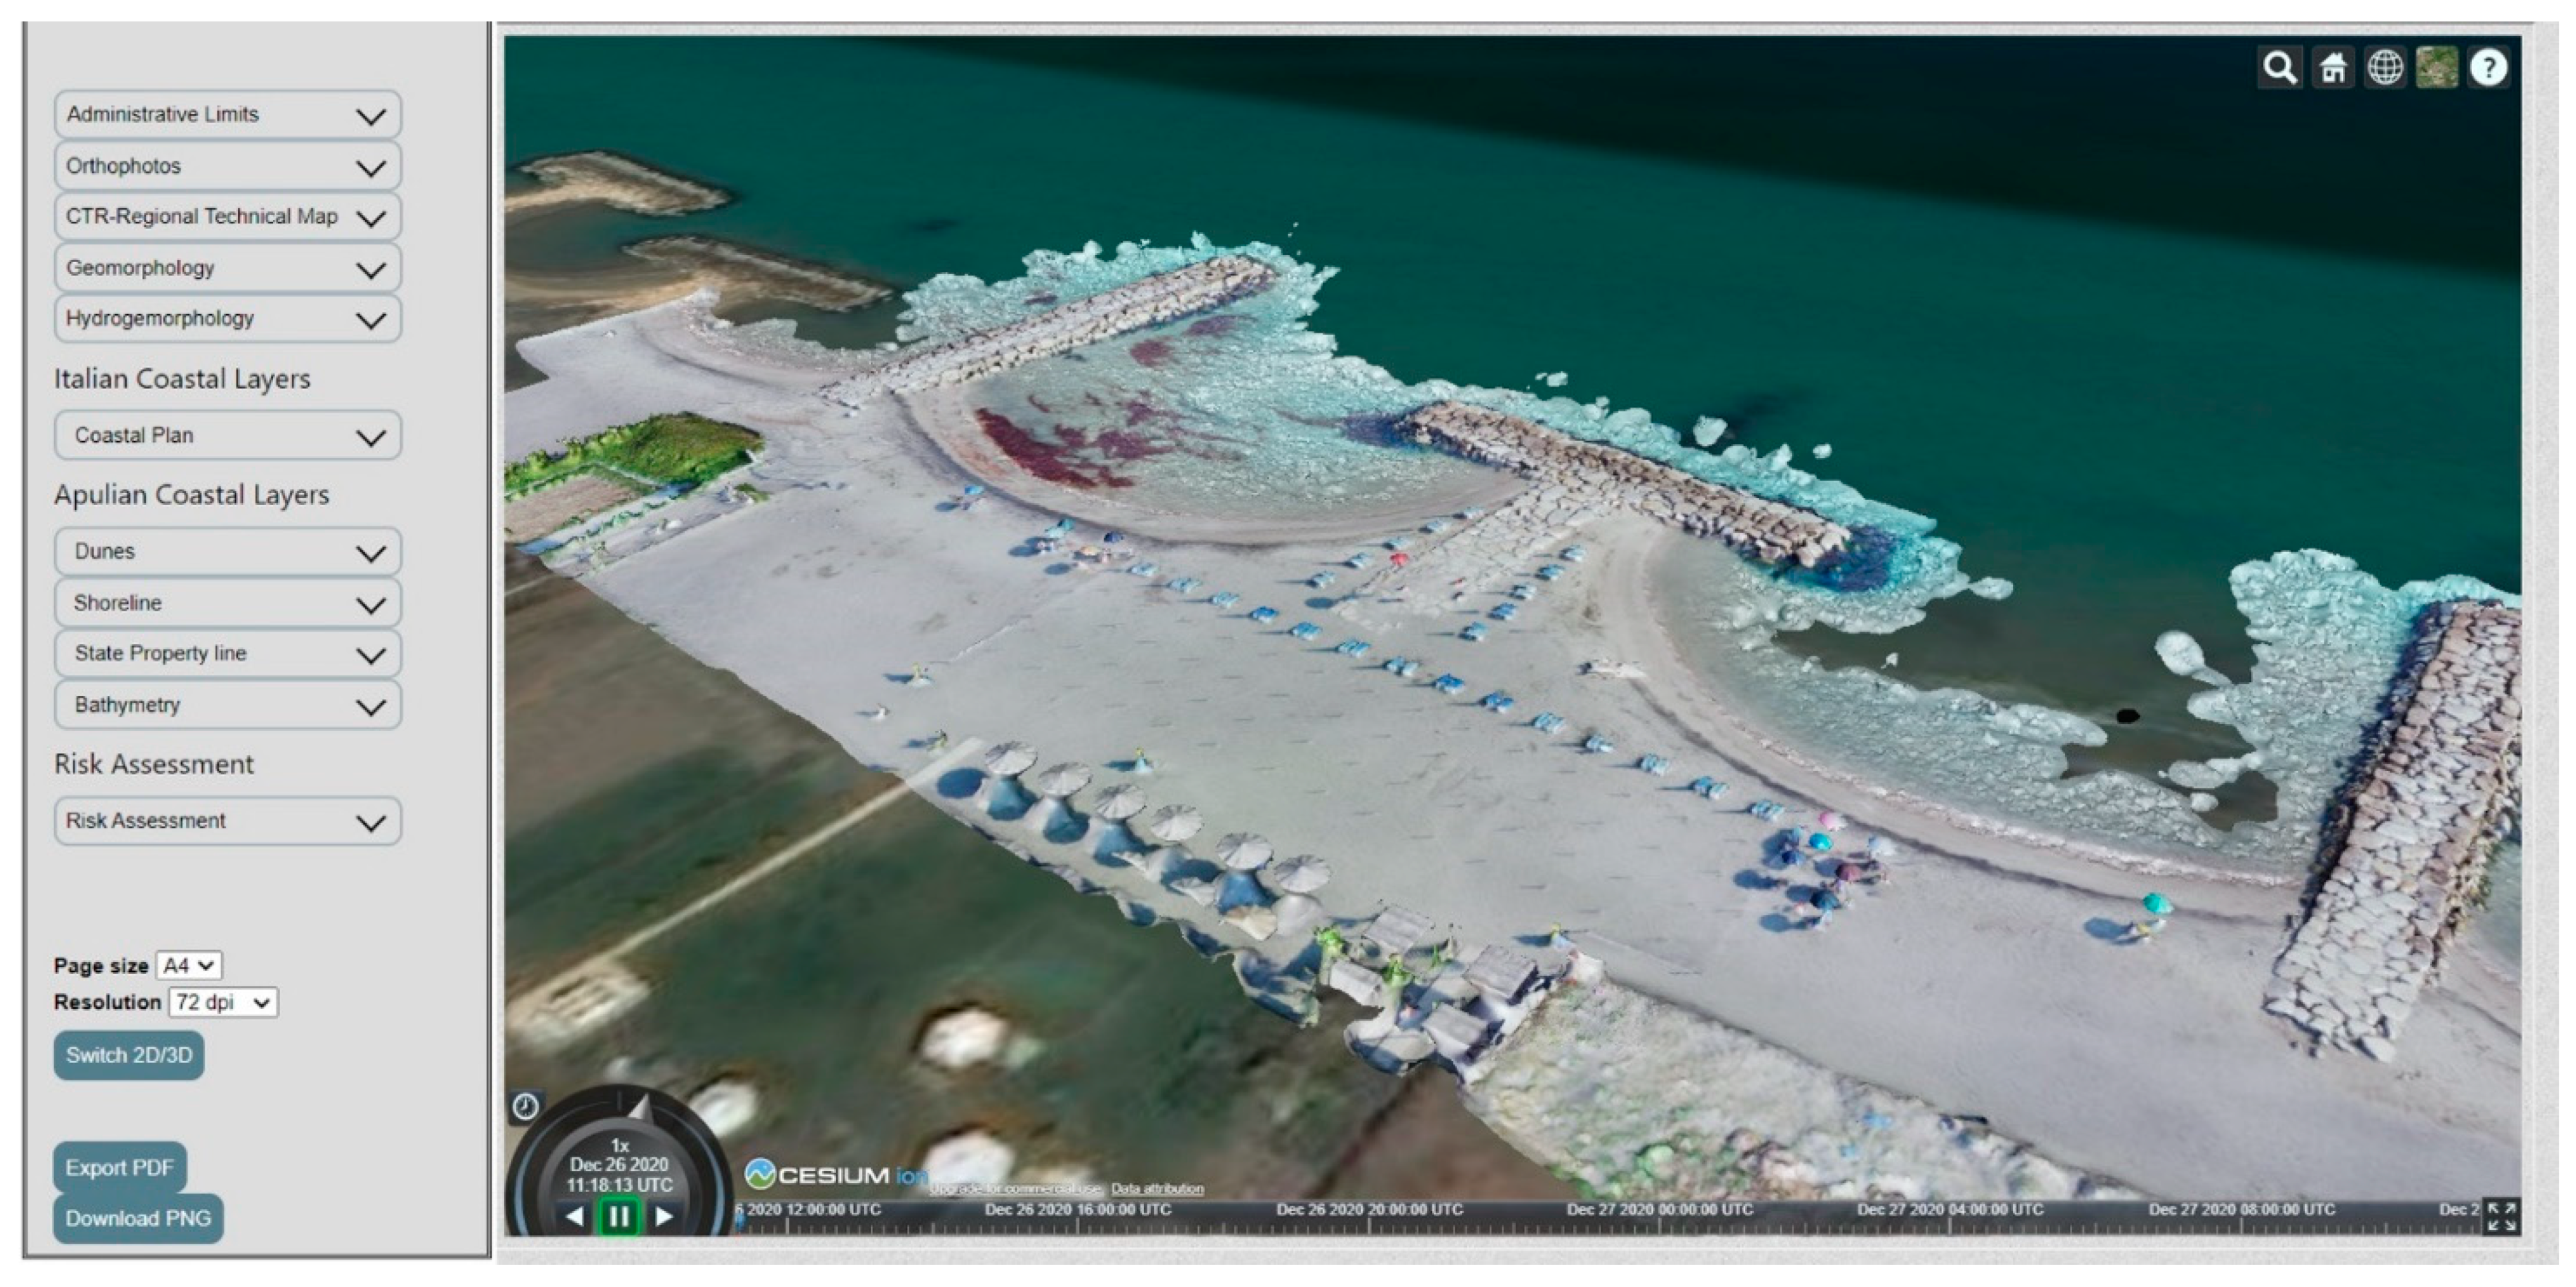
  • a TOC similar to the one implemented in the 2D viewer, containing the switch button (Figure 8A);
  • a map viewer in the form of a three-dimensional globe (Figure 8B) in the middle of the page;
  • at the top-right, a horizontal toolbar suitable (Figure 8C) for:
  • managing tools to zoom in on locations and on the whole globe;
  • selecting display options (in terms of globe or projection on a plane);
  • picking the base layer; and,
  • receiving information on map operation and movement commands through the “?” button;
  • a timeline allowing multi-temporal analysis by creating series at the bottom (Figure 8D);
  • a full screen button at the bottom-right (Figure 8E).
Base layer selection in the 3D viewer is performed through a drop-down menu contained in the toolbar. The DTM provided by Cesium is the reference where Bing Aerial Map, Bing Aerial Map with Labels, Bing Road Map, Blue Marple, Natural Earth, OSM Standard, Stamen Watercolor maps and the satellite data belonging to Sentinel-2 are overlapped.
Thus, in the 3D viewer, DEM and points clouds, textured and non-textured meshes are visualized on the globe. Their comparison allows carrying out multi-temporal analysis on coastal areas. An example of textured mesh covering the study area of Margherita di Savoia is shown in Figure 9.

3.3. Coastal Erosion Evaluation

The web-based application is focused on the Italian territory. Thus, all data required to describe the geo and hydro-morphology of its coasts, available on previously developed platforms, were implemented. Besides harmonizing and sharing the information at national level provided by several frameworks, this tool is intended to provide high resolution data related to past and current statuses of Emilia Romagna’s and Puglia’s shoreline. This allows to examine their conditions at a specific moment or to analyse their changes and understand their evolution to assess the appropriateness of planning strategies. To facilitate the comparison of a variable over time and help users analyse its evolution, a timeline was also integrated. Figure 10 reports Apulian coastline dynamics between 1992 and 2008 showing its status in 1992 (Figure 10A), 2007 (Figure 10B) and 2008 Figure 10C). A direct comparison among data, instead, can be performed by just selecting and overlaying the layers (Figure 10D).
While these commands cannot be used to carry out a quantitative analysis of changes, they can still be estimated through the implemented “processing tools”. Specifically, the “Draw and modify features” button allows to select a specific zone to be investigated, while the “Measure” command allows to evaluate its area, perimeter, and length. For instance, handling shoreline advance and retreat layer (Figure 11) using such commands, the amount of area retreated (66,844 m) or advanced (101,603 m) along the whole Apulian region or a specific site can be computed. Conversely, Margherita di Savoia, selected as pilot site within the STIMARE project, showed a retreatment of 5167 m, about 15% of its coasts, between 2000 and 2005.
The application also provides information on vulnerability and exposure, which is required to assess erosion risk. Sensitivity and criticality layers for the Apulian region are shown in Figure 12. Three levels of increasing intensity (low, medium and high) were depicted through a colour graduated map. Processing the provided indicators, an erosion risk map could be extracted.
Simultaneously, vulnerability and exposure layers were provided for Emilia-Romagna too. For instance, Figure 13 shows Subsidence (A) and Susceptibility to erosion (B): the former is comprised between 1 (low subsidence) and 3 (high subsidence); the latter ranges from 1 (Low susceptibility) to 5 (very high susceptibility). Both pilot sites, Cervia and Riccione, showed a low value of subsidence and susceptibility. As previously described, the processing tools allow to determine the percentage of the amount of area belonging to each level. The analysis showed 21% of susceptibility equal to 1 (23 km), 18% of susceptibility equal to 2, 25% of susceptibility equal to 3, 19% of susceptibility equal to 4 and 17% of susceptibility equal to 5.
The state of Emilia-Romagna’s coast in 2018, compared to 2012, following the interventions of defence carried out by the Regional and Municipal authorities in the period 2012–2018, based on the indicator ASE, showed 36% (41,735 m) of sediment accumulation, 46% (54.245 m) of stable area and 18% (21,340 m) of eroded zone (Figure 14A).
This overall good situation is due to good management of the coast, and in particular to a series of nourishment interventions carried out by the Regional and Municipal Authorities, with over 3.25 million cubic meters of sand [70] added to eroding beaches. Hadn’t these interventions been carried out, the state of the coast in 2018, compared to 2012, based on the ASPE indicator, would be 33% in accumulation (38,750 m), 20% stable (23,710 m) and 47% in critical conditions (54,855 m). Of these, 26% would be in erosion (30,045 m) and 21% in precarious balance (24,815 m) (Figure 14B).

4. Discussion

As already discussed in the Introduction section, this research aims at meeting the Italian needs for future coastal management in accordance with the EU guidelines. For, it is intended to explore WebGIS application potential in assessing coastal erosion issues in consideration of the EU recommendations to create free-accessible datasets (INSPIRE Directive). Under this study, an interactive user-friendly WebGIS prototype was developed and proposed to perform multi-scale and multi-temporal analysis in specific pilot sites selected within the Italian STIMARE project.
Although other platforms were previously developed to meet similar research quests [28,29,30,31,32,33,34,35], none of them was focused on coastal erosion despite the relevance of such issue in shoreline management. In fact, risk erosion maps are currently recognized as a prerequisite in the decision-making process for identifying where and how to intervene. Such information is even more relevant for areas that strongly experience erosion problems, like Italy. The proposed web-based application is also a powerful tool in view of its coverage and the kind of data it provides. Web based systems covering large area, such as EMODnet [27], Copernicus platform [29] and National Geoportal [64], provide low-resolution data, not suitable for a detailed description of littoral conditions; conversely, site specific applications, like the Territorial Information System of Apulian Region (SIT Puglia [66], Arpae Emilia Romagna [67] and Geoportal of Emilia Romagna Region [68]), provide high resolution data limited to restricted areas, and consequently, not enough to have a complete overview of coastline conditions. Moreover, both global and site-specific applications only provide basic data which should be further processed to gather information concerning coastal risk. In such context, proving a complete overview of Italian coastline status and dynamics both at national and local level, our prototype can be considered as a powerful tool to support decision makers involved in any phase of ICZM plans. As suggested by Huxhold and Levinsohm [48], before designing it, a careful analysis of users′ requirements was performed to develop a successful web-based system able to meet their needs. Therefore, the platform was not only implemented to store and share data but also to enable users to handle them through processing commands. These functions help users in selecting and extracting information concerning specific areas (“Magnify”, “Draw and modify features”, and “Measure” tools) (Figure 7) or assessing evolution over time thanks to a timeline (Figure 10). Although this tool allows to analyse and understand changes easily, by just comparing layers belonging to different periods, it is not implemented in the majority of already developed platforms [31,32,33,34,35,36]. Other functionalities commonly implemented in existing WebGIS platforms, such as the activation of layers, geographic navigation, pan, localization, printing and download of geographic data, were proposed too. Zoom (Figure 7A), Legend (Figure 7C) and Metadata (Figure 7B) buttons were implemented as well to visualize and provide all the information useful for the interpretation of each layer.
All 2D collected data were, thus, implemented in the proper thematic macro-groups (Basic cartography, Italian coastal layers, Apulian coastal layers, Emilia Romagna coastal layers, Risk assessment), as described in detail in Section 2.3. This subdivision was adopted to simplify and accelerate the layers search. All categories integrate data intended to describe past and current coasts status, except the “Risk assessment” class which includes layers related to the indicators adopted to compute vulnerability, exposure and risk and their corresponding maps. Investigating such data, the erosion risk status of Puglia and Emilia–Romagna could be examined, while also evaluating the quality of policy management applied in the last few years. Figure 14A reports an overall good condition of Emilia–Romagna’s shoreline with just 18% of its coasts in erosion in contrast to 26% presented in 2012 Figure 14B). This implies that the interventions adopted by Regional and Municipal authorities in the period 2012–2018 have had a positive impact. Conversely, about 14% of Apulian coasts show a “high” level erosion risk up to 2018. This outcome underlines the inappropriateness of strategies adopted, mainly in the area of Margherita di Savoia which was selected as pilot case to be investigated more in depth within the project STIMARE [16]. Therefore, high precision surveys were performed using Remotely Piloted Aircraft System (RPAS)–photogrammetry and laser scanner to reconstruct its landform in details [4]. The obtained textured models and point-clouds were imported in the 3D viewer (Figure 9).
3D viewer appears as an additional novelty that can optimize coastal evolution over the years since the existing platforms only implement a 2D viewer, except for flood assessment application [33]. Such functionality allows showing accurate high-resolution textured models and point clouds produced by processing photogrammetric and laser scanners data. To switch from the 2D to the 3D viewer, a specific button was designed and programmed (Figure 7). The 3D viewer shows data on a 3D globe at the centre of the map area and the toolbar allows zooming in on a location chosen by the user and selecting visualization and projection type (Figure 9). The time scale, located at the bottom, allows to carry out multi-temporal analysis.
Lastly, the prototype was totally built using open-source software suite in line with the INSPIRE Directive. As reported by [21,22,23], the FOSS platforms, equipped with a free license, represent an optimal choice to create a WebGIS as programmed skilled users can easily adapt codes to different research purposes. Moreover, although they require longer programming and updating times, they are more versatile and functional, allowing for reliability and scalability performances comparable to those shown by commercial software [23]. Therefore, they constitute a valid alternative to commercial tools.
The architecture was designed through the integration of several open-source tools, such as Apache Tomcat, Geoserver, PostgreSQL/PostGIS Openlayers which were selected after carefully comparing their performance with that shown by their competitors Mapserver, Pmapper, Apache. The former group appeared more up-to-date and flexible, fully programmed, and programmable in Java programming language. In addition, compared to Mapserver, Geoserver allows to even implement WFS services, providing a simple and intuitive Web Administration Interface (WAI) [79]. PostgreSQL is the only DBMS able to quickly manage a large amount of geospatial data [80,81] thanks to the user-friendly interface of the pg Admin manager and the layer implementation tool, PostGIS Bundle. It can also be directly connected with a Geoserver web interface, allowing to view, publish and assign visual styles to 2D layers. Operlayers, constantly updated (the used version is dated to August 2020) and equipped with new functions, has been selected among a range of options including the more limited GeoExt- ExtJS [79] library, equipped with a less attractive user interface and updated to 2016, as already noted by [63]. Conversely, the Cesium JS library, which is faster than its competitor NASA WorldWind [82] was adopted to implement the 3D visualization. Draco and WebP image format compression functions were applied to make point clouds and 3D meshes from 4 up to 7 times lighter. The performance evaluation was based on the data reported in the literature, since being still a prototype locally designed, it cannot be assessed in a timely and systematic manner.
Besides this constraint, the developed application also shows further criticalities, mainly due to the integrated tools. As described in details under the previous section, the platform allows users to perform basic analysis on specific data, but not to combine various layers or to upload one’s own information. This implies a twofold problem: (i) users cannot customize analyses to meet their specific needs; and (ii) they need to continuously update the archive since they can just handle layers integrated in the system. Thus, further developments have been planned for tackling such issues and optimizing users’ experiences. Specifically, two user-friendly modules useful to integrate different layers will be introduced: (i) a “geo-processing tool”, intended to manipulate vector data, performing operations as union, difference, and intersection; and (ii) a “raster calculator tool” aimed at computing an algebra expression. This last option allows users to implement their own model. Both modules will operate online. To face the second criticality, instead, a tool allowing users to upload their own layers will be integrated too. Lastly, this WebGIS cannot currently be accessed through smartphone. Thus, a mobile application will also be released.

5. Conclusions

This research was intended to design and build an interactive WebGIS prototype to support coastal management activities in Italy and, specifically, in the pilot sites of the STIMARE project. Although several web-based platforms had been previously realized to tackle coastal environmental issues, they all showed some constraints, mainly due to coverage, data resolution, interaction capabilities and viewer. The prototype produced in this research is aimed at overcoming the limitations shown by existing platforms: although it is focused on sites located within the Italian regions of Puglia and Emilia Romagna, it was designed to be applicable and scalable for the whole national territory. Moreover, to improve the description of coastline status, as site-specific systems, high resolution data were imported and a 3D viewer was also implemented to help users deeply understand shoreline morphology through textured models and point clouds extracted by RPAS-photogrammetry and laser scanner. The integration of the innovative hybrid 2D and 3D visualization allows performing multi-temporal and multi-scale analysis without any impact on the achievable performance. For, such performance is in line with what is reported in literature both in terms of the type of data to be implemented and processing time. Nevertheless, the most significant novelty is linked to the topic. Although erosion phenomenon estimation is crucial in coastal management activities, none of the existing applications developed a web tool facing this problem. Thus, harmonizing Italian data and providing additional information related to erosion risk assessment, prototype outcomes could be directly integrated in the Decision Support System (DSS) used by local authorities, marine engineers and other interested users to detect optimal planning strategies. Knowledge on erosion risk levels allows to prioritize interventions at regional scale. Additionally, providing open data has a silver implication both for engineers and technicians who can exploit them to design coastal defence and mitigation interventions. Lastly, other users in the scientific community might be interested in coastal erosion risk data too because this information could be used to validate available numerical models to predict coastal morpho-dynamics and hydro-dynamics or as input data to develop innovative methodologies. In fact, a web-based application allows sharing important information with IT-expert and not expert users as all commands are already implemented in the user-friendly interface. Such characteristic is essential since the majority of potential users only have limited GIS skills. Moreover, exploiting web potentialities, data can reach a higher number of users. Nevertheless, the platform does not allow an interactive combined use of layers, meaning that users cannot fully customize their analyses. To tackle such limitation, the development of real-time processing tools has been planned, accounting also for a dynamic update of the layers.

Author Contributions

Conceptualization, L.D. and E.T.; methodology, A.C., C.M. and E.T.; software, A.C. and C.M.; validation, L.D., E.T., A.S. and F.A.; formal analysis, C.M.; investigation, A.C.; resources, A.S. and F.A.; data curation, A.C., A.S. and F.A.; writing—original draft preparation, A.C. and C.M.; writing—review and editing, A.C., E.T., C.M., A.S., L.D., F.A., R.A.; visualization, A.S.; supervision, E.T.; project administration, A.S., L.D. and R.A.; funding acquisition, L.D. All authors have read and agreed to the published version of the manuscript.

Funding

The research was funded by the Italian Ministry of Environment, Land and Sea as part of the STIMARE project -CUP J56C18001240001.

Institutional Review Board Statement

Not applicable.

Informed Consent Statement

Not applicable.

Data Availability Statement

Not applicable.

Acknowledgments

The authors thank ARPAE for providing the shape files of ASE and ASPE coastal indexes here presented and the anonymous reviewers for their constructive and valuable suggestions on the earlier drafts of this manuscript.

Conflicts of Interest

The authors declare no conflict of interest.

References

  1. Boccia, L.; Capolupo, A.; Rigillo, M.; Russo, V. Terrace Abandonment Hazards in a Mediterranean Cultural Landscape. J. Hazard. Toxic Radioact. Waste 2020, 24, 04019034. [Google Scholar] [CrossRef]
  2. Wong, P.P.; Losada, I.J.; Gattuso, J.P.; Hinkel, J.; Khattabi, A.; McInnes, K.L.; Saito, Y.; Sallenger, A. Coastal Systems and Low-Lying Areas. In Climate Change 2014: Impacts, Adaptation, and Vulnerability. Part A: Global and Sectoral Aspects. Contribution of Working Group II to the Fifth Assessment Report of the Intergovernmental Panel on Climate Change; Cambridge University Press: Cambridge, UK, 2014; pp. 361–409. [Google Scholar]
  3. Capolupo, A.; Saponaro, M.; Fratino, U.; Tarantino, E. Detection of spatio-temporal changes of vegetation in coastal areas subjected to soil erosion issue. Aquat. Ecosyst. Health Manag. 2020, 1–8. [Google Scholar] [CrossRef]
  4. Saponaro, M.; Pratola, L.; Capolupo, A.; Saponieri, A.; Damiani, L.; Fratino, U.; Tarantino, E. Data fusion of terrestrial laser scanner and remotely piloted aircraft systems points clouds for monitoring the coastal protection systems. Aquat. Ecosyst. Health Manag. 2020, 1–7, accepted. [Google Scholar] [CrossRef]
  5. Capolupo, A.; Kooistra, L.; Boccia, L. A novel approach for detecting agricultural terraced landscapes from historical and contemporaneous photogrammetric aerial photos. Int. J. Appl. Earth Obs. Geoinf. 2018, 73, 800–810. [Google Scholar] [CrossRef]
  6. Larson, M.; Kraus, N.C. Prediction of cross-shore sediment transport at different spatial and temporal scales. Mar. Geo. 1995, 126, 111–127. [Google Scholar] [CrossRef]
  7. de Jonge, V.N. Water Management in The Netherlands: Development from a Defensive to an Integral Water System Approach. In Water Problems and Policies in The Netherlands; Folmer, H., Reinhard, S., Eds.; RFF-PRESS: Boca Raton, FL, USA, 2009; pp. 17–46, 257. [Google Scholar]
  8. MATTM-Regioni. 2018: Linee Guida per la Difesa della Costa dai Fenomeni di Erosione e Dagli Effetti dei Cambiamenti Climatici; Versione 2018—Documento elaborato dal Tavolo Nazionale sull’Erosione Costiera MATTM-Regioni con il coordinamento tecnico di ISPRA; ISPRA: Roma, Italy, 2018; p. 305. [Google Scholar]
  9. Rangel-Buitrago, N.; Neal, W.J.; de Jonge, V.V. Risk assessment as tool for coastal erosion management. Ocean Coast. Manag. 2020, 186, 105099. [Google Scholar] [CrossRef]
  10. Toure, S.; Diop, O.; Kpalma, K.; Seidou Maiga, A. Shoreline Detection using Optical Remote Sensing: A Review. ISPRS Int. J. Geo-Information 2019, 8, 75. [Google Scholar] [CrossRef] [Green Version]
  11. Bruno, M.F.; Saponieri, A.; Molfetta, M.G.; Damiani, L. The DPSIR Approach for Coastal Risk Assessment under Climate Change at Regional Scale: The Case of Apulian Coast (Italy). J. Mar. Sci. Eng. 2020, 8, 531. [Google Scholar] [CrossRef]
  12. Bonaldo, D.; Antonioli, F.; Archetti, R.; Bezzi, A.; Correggiari, A.; Davolio, S.; de Falco, G.; Fantini, M.; Fontolan, G.; Furlani, S.; et al. 2019. Integrating multidisciplinary instruments for assessing coastal vulnerability to erosion and sea level rise: Lessons and challenges from the Adriatic Sea, Italy. J. Coast. Conserv. 2019, 23, 19–37. [Google Scholar] [CrossRef]
  13. Samaras, A.G.; Gaeta, M.G.; Miquel, A.M.; Archetti, R. Natural Hazards and Earth System High-resolution wave and hydrodynamics modelling in coastal areas: Operational applications for coastal planning, decision support and assessment. Nat. Hazards Earth Syst. Sci. 2016, 16, 1499–1518. [Google Scholar] [CrossRef] [Green Version]
  14. Archetti, R.; Paci, A.; Carniel, S.; Bonaldo, D. Optimal index related to the shoreline dynamics during a storm: The case of Jesolo beach. Nat. Hazards Earth Syst. Sci. 2016, 16, 1107–1122. [Google Scholar] [CrossRef] [Green Version]
  15. Archetti, R. 2009. Quantifying the Evolution of a Beach Protected by Low Crested Structures Using Video Monitoring. J. Coast. Res. 2009, 254, 884–899. [Google Scholar] [CrossRef]
  16. Archetti, R.; Damiani, L.; Bianchini, A.; Romagnoli, C.; Abbiati, M.; Addona, F.; Airoldi, L.; Cantelli, L.; Gaeta, M.G.; Guerrero, M.; et al. Innovative Strategies, Monitoring and Analysis of the Coastal Erosion Risk: The STIMARE Project. In Proceedings of the 29th International Ocean and Polar Engineering Conference, Honolulu, HI, USA, 16–21 June 2019; pp. 3836–3841. [Google Scholar]
  17. Sykas, D.; Biliouris, D.; Bollanos, S. Web-GIS Platform for Integrated Coastal Environmental Monitoring. 2016. Available online: https://www.geospatialworld.net (accessed on 20 February 2020).
  18. Kitslou, D.; Nittis, T.; Tsaknakis, A.; Esteve-Selma, M.A.; Falcao, M.; Giordanni, G.; Loubersac, L.; Tsirtsis, G. Development of a WebGIS application for supporting the management of Southern European Coastal Lagoons. In Proceedings of the GIS for the Coastal Zone: Spatial Data, Modelling and Management Extending the Spatial Data Infrastructure, New South Wales, Australia, 12–16 July 2006. [Google Scholar]
  19. Alesheikh, A.A.; Helali, H.; Behroz, H.A. Web GIS: Technologies and Its Applications. In Symposium on Geospatial Theory, Processing and Applications; ISPRS: Ottawa, ON, Canada, 2002. [Google Scholar]
  20. Soto-Garcia, M.; Del-Amor-Saavedra, P.; Martin-Gorriz, B.; Martínez-Alvarez, V. The role of information and communication technologies in the modernisation of water user associations’ management. Comput. Electron. Agric. 2013, 98, 121–130. [Google Scholar] [CrossRef]
  21. Kuria, E.; Kimani, S.; Mindila, A. A Framework for Web GIS Development: A Review. Int. J. Comput. Appl. 2019, 178, 0975–8887. [Google Scholar] [CrossRef]
  22. Caradonna, G.; Novelli, A.; Tarantino, E.; Cefalo, R.; Fratino, U. A WebGIS framework for disseminating processed remotely sensed on land cover transformations. Rep. Geod. Geoinf. 2016, 100, 27–38. [Google Scholar] [CrossRef] [Green Version]
  23. Wheeler, D.A. Why Open Source Software/Free Software (OSS/FS). 2007. Available online: http://www.dwheeler.com/oss_fs_why.html (accessed on 18 January 2020).
  24. Caradonna, G.; Tarantino, E.; Novelli, A.; Figorito, B.; Fratino, U. Un WebGIS per la divulgazione delle analisi dei processi di desertificazione del territorio della Puglia. In Proceedings of the Atti Conferenza Nazionale Asita, Lecco, Italy, 29 September–1 October 2015; pp. 217–223. [Google Scholar]
  25. Kitsiou, D.; Patera, A.; Tsegas, G.; Nitis, T. A webGIS Application to Assess Seawater Quality: A Case Study in a Coastal Area in the Northern Aegean Sea. J. Mar. Sci. Eng. 2021, 9, 33. [Google Scholar] [CrossRef]
  26. Lathrop, R.G.; Odell, J.; MacDonald, T.; Vilacoba, K.; Bognar, J.; Trimble, J.; Bruce, C.; Crichton, G.; Seminara, D.; Herb, J.; et al. The role of mid-atlantic ocean data portal in supporting ocean planning. Front. Mar. Sci. 2017, 4, 256. [Google Scholar] [CrossRef] [Green Version]
  27. EMODnet. Available online: https://www.emodnet.eu/geoviewer/#!/ (accessed on 14 September 2020).
  28. Ippoliti, C.; Di Lorenzo, A.; Caprioli, R.; Pelini, S.; Conte, A.; D’Anselmo, F.; Alessandrini, B.; Tora, S.; Giansante, C. Seagis abruzzo: A publicly available atlas of marine uses and natural resources in the adriatic sea region. Geospat. Health 2018, 13, 365–369. [Google Scholar] [CrossRef] [Green Version]
  29. Copernicus Land Monitoring Service. Available online: https://land.copernicus.eu/local/coastal-zones (accessed on 14 September 2020).
  30. Kulawiak, M.; Prospathopoulos, A.; Perivoliotis, L.; Luba, M.; Kioroglou, S.; Stepnowski, A. Interactive visualization of marine pollution monitoring and forecasting data via a web-based GIS. Comput. Geosci. 2010, 36, 1069–1080. [Google Scholar] [CrossRef]
  31. de Castro, A.F.; Amaro, V.E.; Grigio, A.M.; Cavalcante, R.G. Modeling and development of a WebGIS for environmental monitoring of coastal areas that are influenced by the oil industry. J. Coast. Res. 2011, 64, 1643–1647. [Google Scholar]
  32. Tian, Y.; Huang, M.T. An integrated web-based system for the monitoring and forecasting of coastal harmful algae blooms: Application to Shenzhen city, China. J. Mar. Sci. Eng. 2019, 7, 314. [Google Scholar] [CrossRef] [Green Version]
  33. Mioc, D.; Nickerson, B.G.; Anton, F.; Fraser, D.; MacGillivray, E.; Morton, A.; Liang, G. Web-GIS application for flood prediction and monitoring. WIT Trans. Ecol. Environ. 2008, 118, 145–154. [Google Scholar]
  34. Van Ackere, S.; Glas, H.; Beullens, J.; Deruyter, G.; De Wulf, A.; De Maeyer, P. Development of a 3D Dynamic Flood WEB GIS Visualisation Tool. In Flood Risk Management and Response; WIT Press: Southampton, UK, 2016; p. 106. [Google Scholar]
  35. Caradonna, G.; Figorito, B.; Tarantino, E. Sharing environmental geospatial data through an open source WebGIS. In Proceedings of the Interna-tional Conference on Computational Science and Its Applications, Banff, AB, Canada, 22–25 June 2015; Springer: Cham, Switzerland, 2015; pp. 556–565. [Google Scholar]
  36. Lathrop, R.; Auermuller, L.; Trimble, J.; Bognar, J. The Application of WebGIS Tools for Visualizing Coastal Flooding Vulner-ability and Planning for Resiliency: The New Jersey Experience. ISPRS Int. J. Geo-Inf. 2014, 3, 408–429. [Google Scholar] [CrossRef]
  37. Ogryzek, M.; Tarantino, E.; Rząsa, K. Infrastructure of the Spatial Information in the European Community (INSPIRE) Based on Examples of Italy and Poland. ISPRS Int. J. Geo-Inf. 2020, 9, 755. [Google Scholar] [CrossRef]
  38. Apulian Monitoring Network. Available online: http://93.51.158.171/web/simop/home (accessed on 22 April 2018).
  39. Bruno, M.F.; Molfetta, M.G.; Petrillo, A.F. The influence of interannual variability of mean sea level in the Adriatic Sea on extreme values. J. Coast. Res. 2014, 70, 241–246. [Google Scholar] [CrossRef]
  40. Pasquali, D.; Bruno, M.F.; Celli, D.; Damiani, L.; Di Risio, M. A simplified hindcast method for the estimation of extreme storm surge events in semi-enclosed basins. Appl. Ocean Res. 2019, 85, 45–52. [Google Scholar] [CrossRef]
  41. Valentini, N.; Saponieri, A.; Danisi, A.; Pratola, L.; Damiani, L. Exploiting remote imagery in an embayed sandy beach for the validation of a runup model framework. Estuarine. Coast. Shelf Sci. 2019, 225, 106244. [Google Scholar] [CrossRef] [Green Version]
  42. D’Alessandro, F.; Tomasicchio, G.R.; Francone, A.; Leone, E.; Frega, F.; Chiaia, G.; Saponieri, A.; Damiani, L. Coastal sand dune restoration with an eco-friendly technique. Aquat. Ecosyst. Health Manag. 2020. [Google Scholar] [CrossRef]
  43. Saponieri, A.; Valentini, N.; Di Risio, M.; Pasquali, D.; Damiani, L. Laboratory Investigation on the Evolution of a Sandy Beach Nourishment Protected by a Mixed Soft–Hard System. Water 2018, 10, 1171. [Google Scholar] [CrossRef] [Green Version]
  44. Ciavola, P.; Armaroli, C.; Chiggiato, J.; Valentini, A.; Deserti, M.; Perini, L.; Luciani, P. Impact of storms along the coastline of Emilia-Romagna: The morphological signature on the Ravenna coastline (Italy). J. Coast. Res. 2007, 2007, 540–544. [Google Scholar]
  45. IDROSER. Progetto di Piano per la Difesa dal Mare e la Riqualificazione Ambientale del Litorale della Regione Emilia-Romagna; Regione Emilia-Romagna-Idroser: Bologna, Italy, 1996. [Google Scholar]
  46. Bianchini, A.; Guzzini, A.; Pellegrini, M.; Saccani, C.; Gaeta, M.G.; Archetti, R. Coastal erosion mitigation through ejector devices application. Ital. J. Eng. Geol. Environ. 2020, 1, 13–22. [Google Scholar] [CrossRef]
  47. Pellegrini, M.; Aghakhani, A.; Gaeta, M.G.; Archetti, R.; Guzzini, A.; Saccani, C. Effectiveness assessment of an innovative ejectors plant for port sediment management. J. Mar. Sci. Eng. 2021, 9, 197. [Google Scholar] [CrossRef]
  48. Huxhold, W.E.; Levinsohn, A.G. Managing geographic information system projects. Cartographica 1995, 32, 63. [Google Scholar]
  49. Apache Tomcat. Available online: http://tomcat.apache.org/ (accessed on 10 March 2020).
  50. PostgreSQL: The World’s Most Advanced Open Source Relational Database. Available online: https://www.postgresql.org/ (accessed on 22 April 2020).
  51. Ramsey, P. The state of PostGIS. In Proceedings of the FOSS4G 2011 Conference, Denver, CO, USA, 6 March 2014; Available online: http://s3.cleverelephant.ca/stateof-postgis-2011-foss4g.pdf (accessed on 12 December 2019).
  52. Geoserver. Available online: http://geoserver.org/ (accessed on 3 March 2020).
  53. Getbootstrap. Available online: https://getbootstrap.com/ (accessed on 21 October 2019).
  54. W3.CSS. Available online: https://www.w3schools.com/w3css/ (accessed on 20 October 2019).
  55. Openlayers. Available online: https://openlayers.org/ (accessed on 3 March 2020).
  56. Cesium JS. Available online: https://cesium.com (accessed on 4 March 2020).
  57. Carter, B. HTML Architecture, a Novel Development System (HANDS). An approach for web development. In Proceedings of the 2014 Annual Global Online Conference on Information and Computer Technology, Louisville, KY, USA, 3–5 December 2014. [Google Scholar]
  58. Agrawal, S.; Dev Gupta, R. Development and Comparison of Open Source Based Web Gis Frameworks on Wamp and Apache Tomcat Web Servers. In Proceedings of the International Archives of the Photogrammetry, Remote Sensing and Spatial Information Sciences, Suzhou, China, 14–16 May 2014; Volume XL-4. [Google Scholar]
  59. Fustes, D.; Cantorna, D.; Dafonte, C.; Arcay, B.; Iglesias, A.; Manteiga, M. A cloud-integrated web platform for marine monitoring using GIS and remote sensing. Application to oil spill detection through SAR images. Future Gener. Comput. Syst. 2013, 34, 155–160. [Google Scholar] [CrossRef]
  60. Huang, Z.; Xu, Z. A Method of Using GeoServer to Publish Economy Geographical Information. In Proceedings of the 2011 International Conference on Control, Automation and Systems Engineering (CASE), Singapore, 30–31 July 2011; IEEE: Piscataway, NJ, USA, 2011; pp. 1–4. [Google Scholar] [CrossRef]
  61. Brovelli, M.A.; Boccardo, P.; Bordogna, G.; Pepe, A.; Crespi, M.; Munafò, M.; Pirotti, F. Urban Geo Big Data. In Proceedings of the International Archives of the Photogrammetry, Remote Sensing and Spatial Information Sciences, Bucharest, Romania, 26–30 August 2019; Volume XLII-4/W14. [Google Scholar]
  62. Kommana, K. Implementation of a Geoserver Application for GIS Data Distribution and Manipulation. Master’s Thesis, Physical Geography and Quaternary Geology, Department of Physical Geography and Quaternary Geology, Stockholm University, Stockholm, Sweden, 2013. [Google Scholar]
  63. Caradonna, G.; Frigorito, B.; Novelli, A.; Tarantino, E.; Fratino, U. Geomatic Techniques for Disseminating Processed Remotely Sensed Open Data in an Interactive WebGIS. Plurimondi. 2017. Available online: http://193.204.49.18/index.php/Plurimondi/article/view/47 (accessed on 19 May 2021).
  64. Geoportale Nazionale. Available online: http://www.pcn.minambiente.it/mattm/ (accessed on 3 January 2020).
  65. ISTAT. Available online: https://www.istat.it/ (accessed on 2 February 2020).
  66. SIT Puglia. Available online: http://www.sit.puglia.it/ (accessed on 16 December 2019).
  67. ARPAE Emilia Romana. Available online: https://www.arpae.it/dettaglio_notizia.asp?id=11728&idlivello=1504 (accessed on 15 December 2019).
  68. Geoportale Emilia-Romagna. Available online: https://geoportale.regione.emilia-romagna.it/ (accessed on 5 December 2019).
  69. Aguzzi, M.; De Nigris, N.; Preti, M.; Mallegni, R. Nuovi indicatori per lo studio e la gestione della costa emiliano-romagnola. Studi Costieri 2012, 20, 95–109. [Google Scholar]
  70. Arpa. Stato del Litorale Emiliano-Romagnolo All’anno 2007 e Piano Decennale di Gestione; I quaderni di Arpa: Bologna, Italy, 2008; p. 272. ISBN 88-8754-21-1. [Google Scholar]
  71. Arpa. Stato del Litorale Emiliano-Romagnolo al 2018 Erosione e Interventi di Difesa; I quaderni di Arpa: Bologna, Italy, 2020; p. 222. ISBN 978-88-87854-48-0. [Google Scholar]
  72. RER. Indicatori di Suscettibilita’costiera ai Fenomeni di Erosione e Inondazione Marina. Rapporti Tecnici del Servizio Geologico sismico e dei Suoli. 2019. Available online: http://ambiente.regione.emilia-romagna.it/geologia/cosa-fa-la-regione-2 (accessed on 16 March 2018).
  73. Github. Available online: https://github.com/google/draco (accessed on 16 May 2020).
  74. Lilley, S. Compressive Massive Points Cloud with 3D Tiles and Draco. Cesium Blog. 2019. Available online: https://cesium.com/blog/2019/02/26/draco-point-clouds/ (accessed on 3 November 2019).
  75. WebP. Available online: https://developers.google.com/speed/webp (accessed on 16 May 2020).
  76. Shehata, O. Faster and Smaller 3D Tiles with WebP Image Compression. Cesium Blog. 2019. Available online: https://cesium.com/blog/2019/02/12/faster-3d-tiles-streaming-webp/ (accessed on 12 September 2019).
  77. Haynes, D.; Ray, S.; Manson, S.M.; Soni, A. High Performance Analysis of Big Spatial Data. In Proceedings of the 2015 IEEE International Conference on Big Data, Santa Clara, CA, USA, 29 October–1 November 2015). [Google Scholar]
  78. Ružicka, J. Comparing speed of Web Map Service with GeoServer on ESRI Shapefile and PostGIS. Geoinformatics 2016, 15, 3–9. [Google Scholar]
  79. Geoext3. Available online: http://geoext.github.io/geoext3/ (accessed on 16 May 2020).
  80. Caradonna, G.; Lionetti, S.; Tarantino, E.; Verdoscia, C. A comparison of low-poly algorithms for sharing 3D models on the web. In New Advanced GNSS and 3D Spatial Techniques; Springer: Cham, Switzerland, 2018; pp. 237–244. [Google Scholar]
  81. Caradonna, G.; Novelli, A.; Tarantino, E.; Figorito, B.; Fratino, U. Implementing an OGC (Open Geospatial Consortium) Web Processing Service in a WebGIS Framework to Analyze Satellite Data. 2016. Available online: https://gnss.dia.units.it/images/gnss/doc/2016_02_20_morning/05_tarantino/Presentazione_Tarantino_%20trieste2016.pdf (accessed on 13 October 2019).
  82. Worldwide. Available online: https://worldwind.arc.nasa.gov/ (accessed on 19 May 2020).
Figure 1. Study areas location: (A) Puglia Region; (B) Margherita di Savoia; (C) Emilia-Romagna Region; (D) Cervia (E), Riccione.
Jmse 09 00567 g001
Figure 2. Operative workflow of the procedure for creating the WebGIS application.
Jmse 09 00567 g002
Figure 3. WebGIS Creation and Implementation Workflow.
Jmse 09 00567 g003
Figure 4. WebGIS architecture: components implemented in the three-tier configuration and their relationships.
Jmse 09 00567 g004
Figure 5. Implemented tools: (A) Navigation buttons, involving zoom to layer (1), zoom in/zoom out widgets (2), searching command (3) and switch button from 2D to 3D viewers (4); (B) auxiliary tools, including export layer (5), metadata (6) and legend buttons (7); (C) processing commands, consisting in drawing geometric elements (8), in measuring areas and perimeter (9), and timelines (10); and, (D) zoom on a specific menus.
Jmse 09 00567 g005
Figure 6. Structure of the implemented geo-database.
Jmse 09 00567 g006
Figure 7. 2D viewer interface with attention to the switch button from 2D to 3D mode (D) and the buttons to zoom to layers (A), to layers metadata (B) and layer legend (C).
Jmse 09 00567 g007
Figure 8. 3D viewer interface. (A) Table of Contents (TOC); (B) Map Viewer; (C) Toolbar; (D) Temporal scale; (E) Full Screen button.
Jmse 09 00567 g008
Figure 9. 3D textured mesh extracted by photogrammetric pictures acquired by Remotely Piloted Aircraft Systems (RPAS) of Margherita di Savoia.
Jmse 09 00567 g009
Figure 10. Coastaline evolution between 1992 and 2008 visible throug timeline function (in the red square on the left). (A) Coastaline in 1992, (B) Coastaline in 2007, (C) Coastaline in 2008; (D) Overlay of the three presented coastalines.
Jmse 09 00567 g010
Figure 11. Shoreline advance (green) and retreat (red) (2000/2005) in Puglia.
Jmse 09 00567 g011
Figure 12. Sensitivity (on the top) and Criticality (on the bottom) for Puglia.
Jmse 09 00567 g012
Figure 13. Subsidence (2011/2016) (on the top) and Susceptibility (on the bottom) to erosion for Emilia-Romagna (2011/2016).
Jmse 09 00567 g013
Figure 14. Erosion indicators for Emilia Romagna: ASE (2012/2018) (A); ASPE (2012/2018) (B).
Jmse 09 00567 g014
Table 1. Coastal exposure variables and corresponding scores used in EUrosion (2004) and Modified EUrosion Model (2020). RICE: Radium of Influence of Coastal Erosion Data from [11, MDPI, 2020].
Coastal Exposure VariablesAcronymWeights
012
Urban and/or industrial area in RICE (%)URICE<1010–40>40
High ecological value areas in RICE (%)ERICE<55–30>30
Resident population in RICE (1000 hab.)PRICE<55–20>20
Increase in urban area in a 10 km wide coastal area (%)U10km<55–10>10
Table 2. Coastal vulnerability variables and corresponding scores used in EUrosion (2004) and Modified EUrosion Model (2020). RICE: Radium of Influence of Coastal Erosion. Data from (11, MDPI, 2020).
Coastal Vulnerability VariablesAcronymWeights
012
Average speed of Sea Level Rise (mm/yr)SLR<00–4>4
Highest water level (m)HWL<1.51.5–3>3
Coastal Geology- Rocky shoreline (%)GEC>7040–70<40
Municipal area in RICE (%)ARICE<55–10>10
Past Shoreline erosion (%)PSE<2020–60>60
Recent shoreline erosion (%)RSE<2020–60>60
Hydraulic hazard in RICE (%)HHRICE<1010–20>20
Publisher’s Note: MDPI stays neutral with regard to jurisdictional claims in published maps and institutional affiliations.

