1. Introduction
1.1. Background
Fairways are designated and notified channels that are used as passageways for marine vessels and the frequent vessel traffic in fairways pose higher risks of marine accidents. According to the yearbook of the Korea Maritime Safety Tribunal in 2020, approximately 324.2 marine accidents occurred annually in trade ports and port waterways on average between 2015 and 2019 [
1].
Thus, the characteristics of vessel traffic flow in fairways must be understood for preventing marine accidents at such locations. In general, maritime traffic surveys are conducted to understand vessel traffic flow characteristics. In South Korea, the Maritime Safety Audit Scheme has been implemented since 28 November 2009, to professionally investigate, measure and assess the impact of vessel traffic on navigation safety; the potential risk factors are addressed to reduce the accident occurrence rate of marine vessels. According to this scheme, a maritime traffic survey must be conducted to identify the maritime traffic flow before implementing projects that may affect the maritime traffic, such as setting and modifying the waters or constructing, attaching and repairing facilities in the waters. The stated maritime traffic survey generally utilizes data from the General Information Center on Marine Safety and Security (GICOMS), which are collected for more than a week, or field survey data based on the Automatic Identification System (AIS) and Radio Detection And Ranging (RADAR), which are acquired for at least 72 h.
GICOMS is a comprehensive management system for tracking the marine disaster safety of Korean vessels in global waters, including all ports and coastal areas in Korea. GICOMS was introduced to support rapid search and rescue using the location information of vessels in the event of a disaster, minimize damage in areas of maritime security, enable counter-terrorism efforts through rapid response and ensure the safe navigation of Korean vessels. In GICOMS, the location information of vessels transmitted through the AIS or radio devices installed in the vessels is stored in the marine safety integrated database, which can be used for conducting maritime traffic surveys [
2].
The AIS is a device that was adopted according to the International Convention for the Safety of Life at Sea, enacted by the International Maritime Organization for the navigation safety of vessels and prevention of terrorism. The AIS transmits and receives vessel information regarding the specifications and name of a vessel as well as navigation information, such as destination and vessel–vessel distances, by using Very High Frequency (VHF) ranges. [
3]. In practice, the AIS is more convenient rather than the RADAR for obtaining vessel identification information. For statistical analysis of the fairway in this study, using of AIS data is suitable for verifying the traffic volume by analyzing a large amount of data even if there is an error in location recognition rather than radar data excellent in accuracy.
Moreover, understanding the vessel traffic characteristics is essential to reducing the risk of marine accidents and developing a safe traffic-flow model in fairways. Therefore, previous studies have attempted to derive traffic characteristics through various methods. Most of the previous research on fairways focused on the distribution of vessel traffic flow based on a normal distribution. However, the widely used normal distribution has recently been scrutinized regarding its suitability for understanding traffic characteristics.
In this study, the Busan North Port was selected as the target study site because it had the largest number of marine accidents in the fairway over the last five years and was the sixth largest container port in the world as of 2019. As a high proportion of traffic in the Busan North Port constitutes large vessels, the AIS data utilized in GICOMS were used instead of the field survey data based on the AIS and RADAR. In addition, data for seven consecutive days were analyzed as per the guidelines stated in the Maritime Safety Audit Scheme. Furthermore, the cases in which the normal distribution is suitable were first determined in this study. For example, the distribution of the traffic may depend on the location on the fairway or the size of the ship. When the suitability of the normal distribution was confirmed, it was conveniently applied to study the probability of deviation on the fairway as well as collision with breakwaters. Subsequently, the characteristics of the route usage and lateral positioning of the vessel were derived by applying the concepts of skewness and kurtosis, which are elements of spatial statistics considering that the traffic area may vary by the location on the fairway and the size of the ship.
An understanding of the route usage and lateral position of the ship according to the position of the fairway and size of the ship contributes to predicting the movement of the ship and preventing maritime accidents that occur when ships encounter one another on the fairway. This, in turn, reduces economic losses and the marine pollution caused by maritime accidents on the fairway. Furthermore, the results of this study can serve as a basis for developing technical systems for autonomous ships.
The research outline of the current study on traffic flow is illustrated in
Figure 1.
1.2. Literature Review
The existing literature on characteristics analysis of vessel traffic flow mainly focuses on the statistical and probabilistic analysis of data. Herein, a brief overview is presented.
Chang et al. [
4] investigated the methods or tools for extracting vessel traffic patterns using AIS data and analyzed the flow direction and density distribution using a reference line along the coast of Taiwan. Meng et al. [
5] analyzed vessel traffic characteristics in the Singapore Strait using AIS data according to the vessel type such as container ships, passenger ships and tankers. In addition, Zhang et al. [
6] established a prediction model for the total vessel traffic flow and Pallotta et al. [
7] utilized the vessel information obtained from AIS to understand maritime traffic patterns in the Strait of Gibraltar. However, these studies are focused on the statistical characteristics of vessel traffic flow, such as speed and number of vessels. These are limited to only vessel types and their flow intervals rather than the overall traffic characteristics on the fairway.
Uluscu et al. [
8] analyzed the safety risks pertaining to transit vessel maritime traffic in the Strait of Istanbul using a mathematical risk model based on probabilistic arguments. Similarly, Kuroda et al. [
9] proposed a mathematical model for estimating the vessel collision probability. Thus, the above-mentioned literature proposed a probabilistic analysis to evaluate and prevent the collision risk of the ship.
The probabilistic studies for navigating vessels on fairways mainly focused on finding the fit probability distribution function or calculating the probability of collision with an obstacle, such as the breakwaters, by determining the goodness-of-fit distribution. Xu et al. [
10] analyzed historical data of vessel traffic flow in a bridge-area waterway and developed a probability model. Moreover, Yoo et al. (2015) [
11] conducted an experiment to determine a well-fitted probability distribution function in a multimodal area. In summary, majority of the existing studies, such as those by Inoue [
12], Franz (1981) [
13] and AASHTO (2014) [
14], found that the goodness-of-fit distribution of vessel traffic in fairways is most likely to follow a normal distribution.
However, certain recent studies have reported that normal distribution is inappropriate for describing the stated traffic flow. Puszcz et al. [
15] utilized a logistic and Weibull distribution for the development of a traffic flow simulation model. Itoh and Yakabe [
16] utilized a gamma distribution and Yeyes et al. [
17] utilized a logarithmic, normal and Weibull distribution. IWRAP [
18] is a modeling tool that is useful for maritime risk assessment and can estimate the frequency of collisions and grounding in a fairway based on information such as traffic volume, composition, route geometry and bathymetry. IWRAP calculates the probability of collision and grounding using a normal distribution and goodness-of-fit distribution. Thus, it is important to determine the distribution characteristics and suitable distribution of fairways.
Moreover, prior research on the Busan North Port is limited. Kim et al. [
19] analyzed the traffic patterns in the main traffic lane of the Busan North Port for dangerous goods carriers and confirmed that the traffic patterns do not fit a normal distribution. Son et al. [
20] analyzed the optimal traffic distribution near the breakwater in Busan Port and found that the best fit distributions are lognormal and gamma distributions. In particular, only one gate line, which is a section of a fairway, was used for analyzing traffic flows. One gate line analysis for a specific section of a fairway has been commonly used for traffic flow analysis because of its convenience in data processing in comparison to continuous analysis; however, significant results cannot be derived because it cannot analyze complex traffic track situations unless an appropriate point such as a bottle-neck point on a section is selected [
21]. Therefore, a semi-continuous analysis was performed in the current study using a three-gate line to reduce the error caused by setting one gate line on three congested sections such as the entrance, middle and exit.
2. Method of Semi-Continuous Spatial Statistical Analysis
The methodology of semi-continuous spatial statistical analysis is illustrated in
Figure 2.
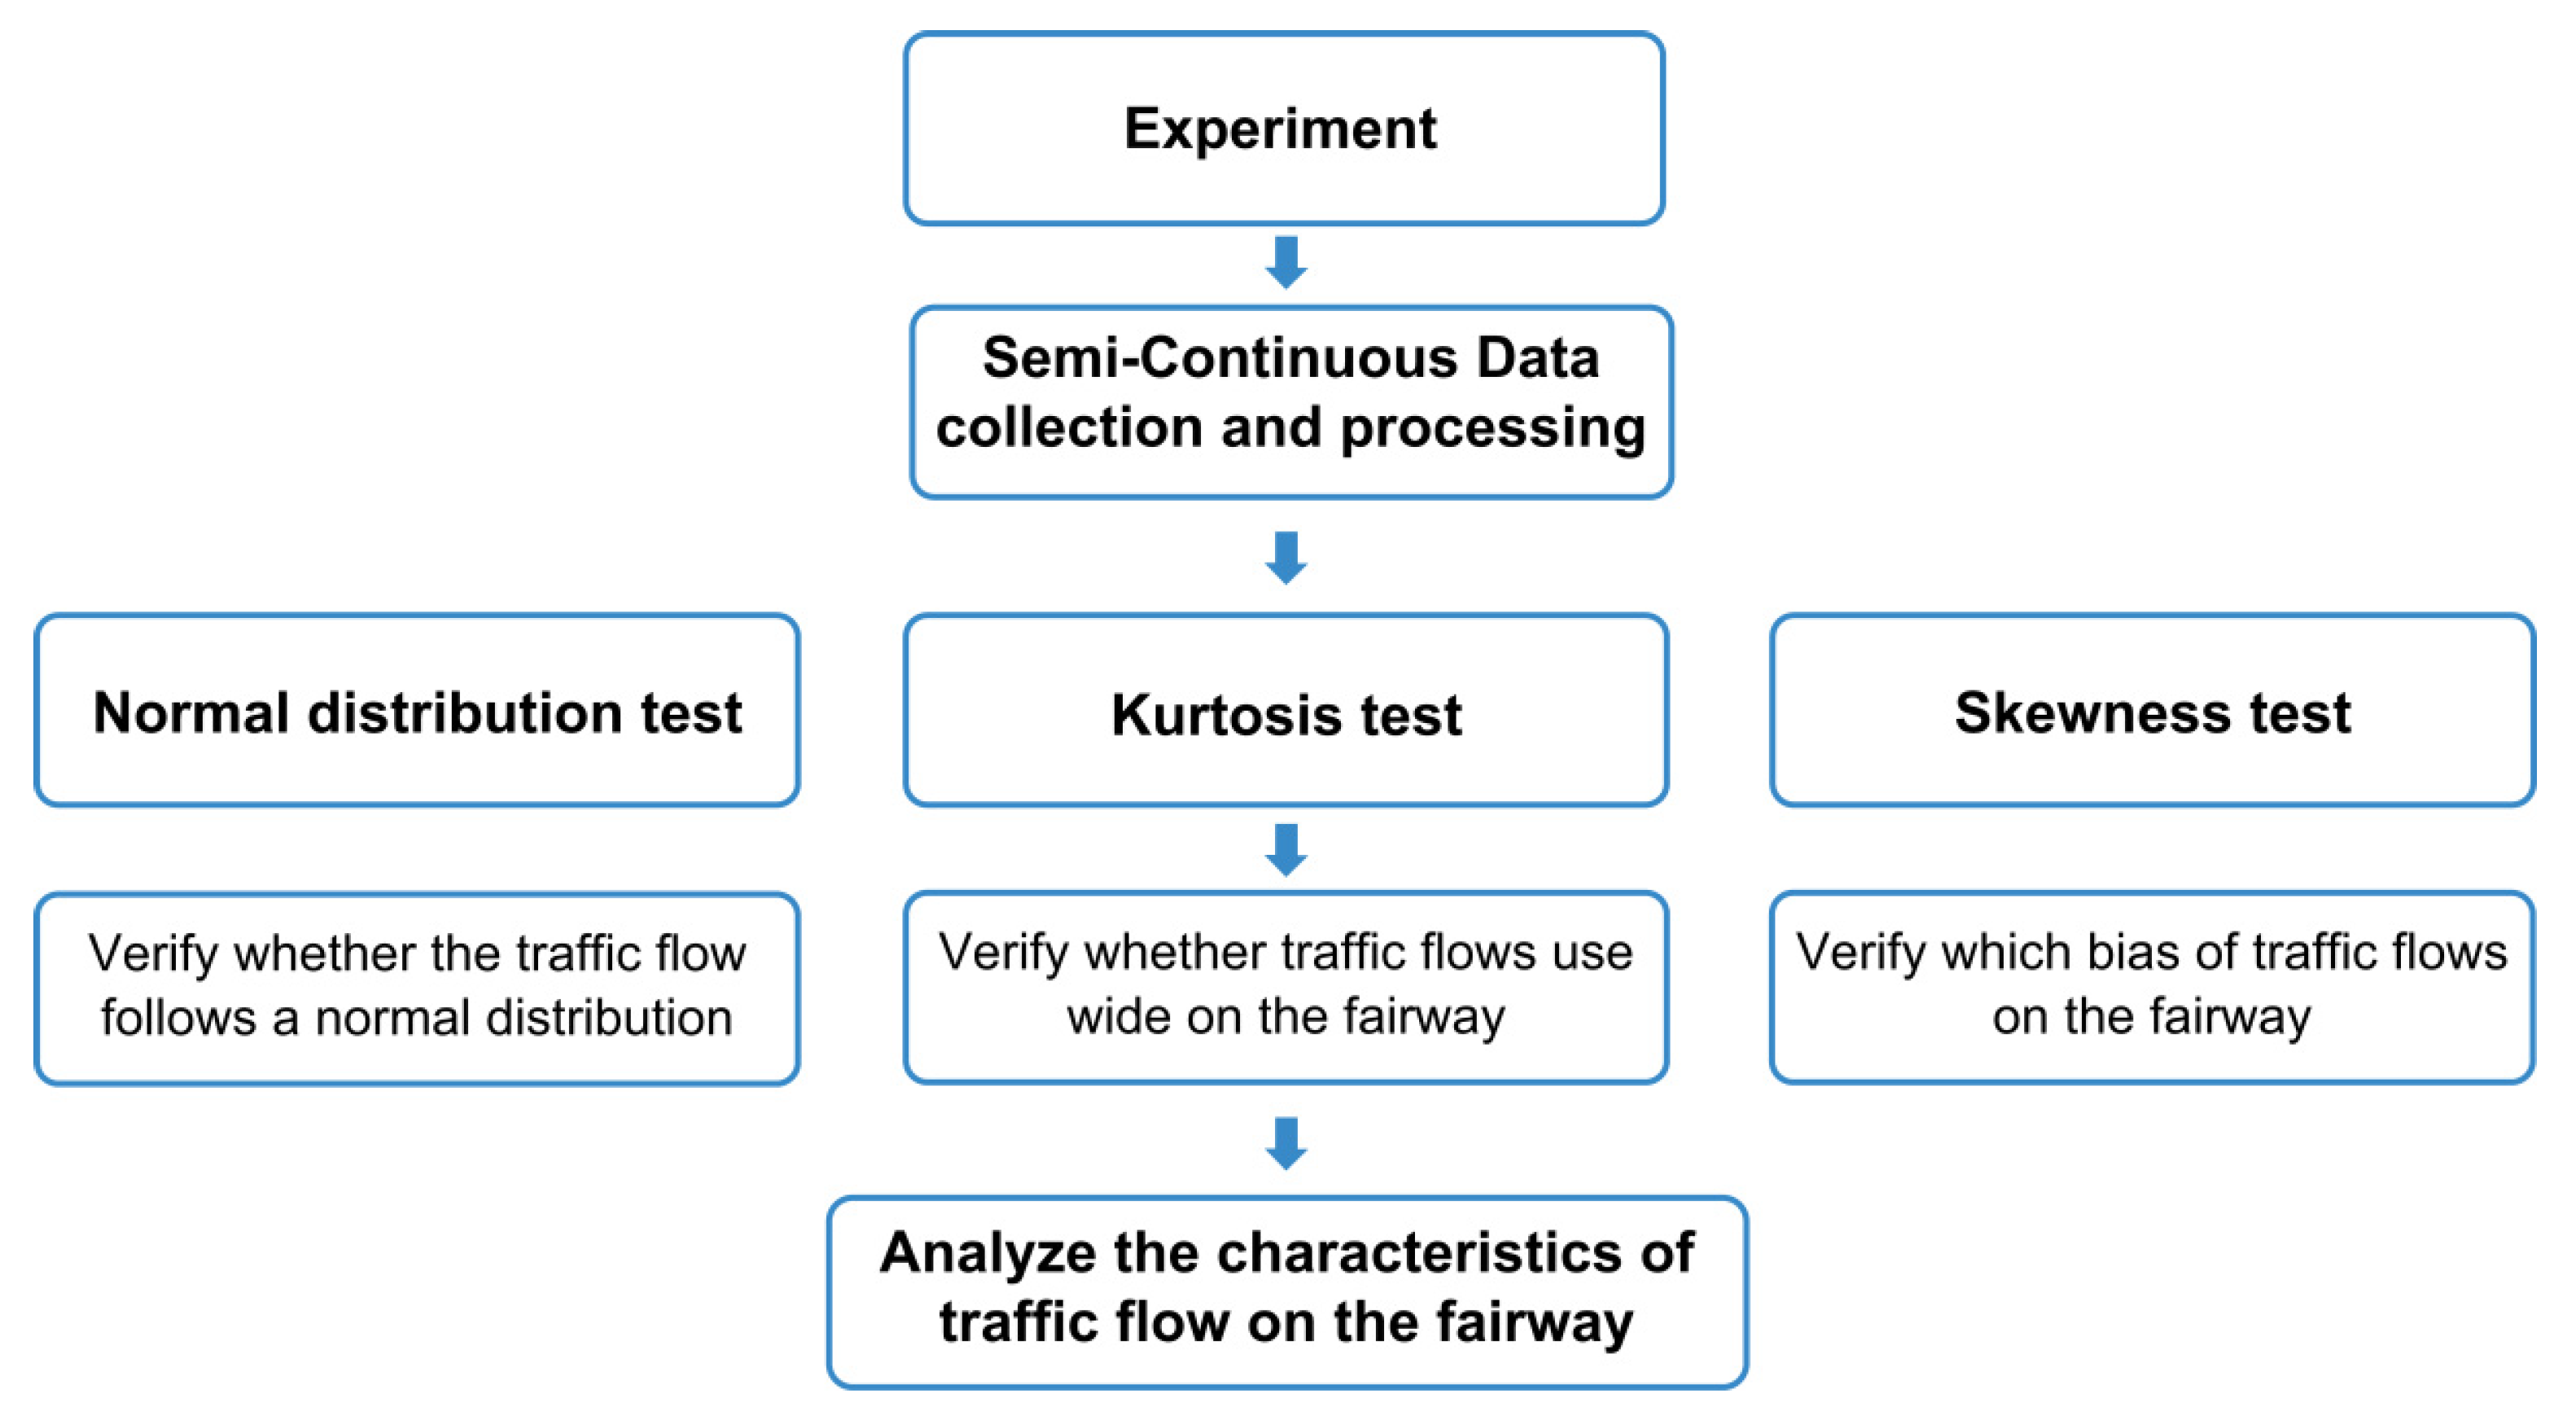
First, the experiment was conducted in a designated area for analysis and the collected traffic data were processed. Thereafter, three tests, namely, the normal distribution test, kurtosis test and skewness test were conducted to analyze the characteristics of traffic flow on the fairway. The normal distribution test verified whether the traffic flow follows a normal distribution; the kurtosis test verified whether the traffic flow was widespread on the fairway; and the skewness test verified the bias of traffic flow on the fairway.
Thus, this study analyzed whether the traffic distribution in fairways follow a normal distribution according to the vessel size, as reported by prior studies in the literature. Although the vessel traffic flow characteristics can be visually identified by charting the traffic distribution graph of each section, a more quantitative judgment technique is required.
2.1. Normal Distribution Test
As shown in
Figure 3, the distribution of the vessel navigation trajectory in a section of the fairway is generally known to follow a normal distribution because vessel operators exhibit a strong tendency to navigate along the center line of the vessel sailing path, thereby approximating a normal distribution concentrated on the center line (Franz, 1981) [
12].
In addition to the above-mentioned empirical theory, there is also a statistical aspect [
12]. For instance, the locations of a vessel navigating along a fairway and passing at two sampling sections
and
are statistically independent.
The random variable that follows this binomial distribution
(
is the probability of the occurrence of the desired event,
) is assumed to be
in Equation (1).
where
: mean of ,
: standard deviation of .
The distribution of Equation (1) approaches the standard normal distribution for as .
The above expression indicates that the distribution of the sample mean approximates to a normal distribution as the sample size increases, regardless of the actual distribution of the vessel population. More precisely, a normal distribution can be assumed if sufficient passages occur. Based on these empirical and statistical theories, the vessel traffic distribution has been assumed as a normal distribution for evaluating the probability of the departure of navigating vessels from a fairway and determining the probability of a collision with an offshore bridge pier in several domestic studies.
Nevertheless, this assumption requires verification for its suitability in fairways. Thus, a normal distribution test is required for the vessel traffic, where the observed values are considered from a population that is known to follow a normal distribution. Although there are various methods for conducting the normal distribution test, the Shapiro–Wilk (SW) test was utilized in this study, as it is stronger than the Kolmogorov–Smirnov test [
22].
The SW test, a normal distribution test method proposed by Shapiro and Wilk in 1965, examines whether the sample is extracted as a normal distribution and follows the null hypothesis. The test statistic is expressed in Equation (2).
where
: SW value,
: i-th order statistic, e.g., i-th smallest number in the sample,
: mean of the sample,
: coefficient, given by ;
Vector holds. are the expected-order statistics of the random variable extracted from the standard normal distribution; is the covariance matrix of the normal order statistics.
Significance level () is set as 0.05 and is calculated by test statistics (). In the normal distribution test, if ≥ 0.05, the null hypothesis was adopted and the distribution was determined to follow a normal distribution; otherwise (> 0.05), it was determined that the distribution did not follow a normal distribution, the null hypothesis was rejected and the alternative hypothesis was adopted.
2.2. Kurtosis Test
The degree of use of the vessel on the fairway is necessary for evaluation. Hence, the fairway width requires improvement if the vessel uses the route in a wide manner. Thus, a kurtosis test was conducted to derive these characteristics. The kurtosis represents the degree of concentration of the observed values around the arithmetic mean and can be obtained using Equation (3) [
23]. In general, a distribution approximates a normal distribution for a K-assessment value (
) of approximately 3. However, a distribution in most assessment software is defined as sharper than a normal distribution for
> 0 and as a flat distribution for
< 0 as shown in
Figure 4.
where
: K-assessment value,
: sample size.
Figure 4.
Kurtosis curve.
Figure 4.
Kurtosis curve.
Kline [
24] determined an extreme value when
exceeded an absolute value of 8 or 10. In this study,
was used to estimate the fairway utilization width of vessels in a fairway, i.e., the fairway was being used less frequently for
> 0 and more frequently for
< 0.
2.3. Skewness Test
The degree of lateral positioning of the vessel on the fairway is necessary for evaluation. The fairways can be shared by each vessel upon understanding the bias of the vessels. Thus, a skewness test was conducted to derive these characteristics.
The asymmetry of observed values was measured as the skewness and it is obtained using Equation (4) [
23].
where
: S-assessment value,
: data from the sample group.
As shown in
Figure 5, the distribution is observed to be inclined toward the left for
> 0 and toward the right for
< 0.
Kline [
24] determined an extreme value when
exceeded an absolute value of 3. In this study,
was used to estimate the fairway-utilization tendency of vessels. For inbound vessels, the port side of the fairway was used for
> 0 and the starboard side of the fairway was used for
< 0. For outbound vessels, the port side of the fairway was used for
< 0 and the starboard side of the fairway was used for
> 0.
3. Experiment
3.1. Experiment Environment
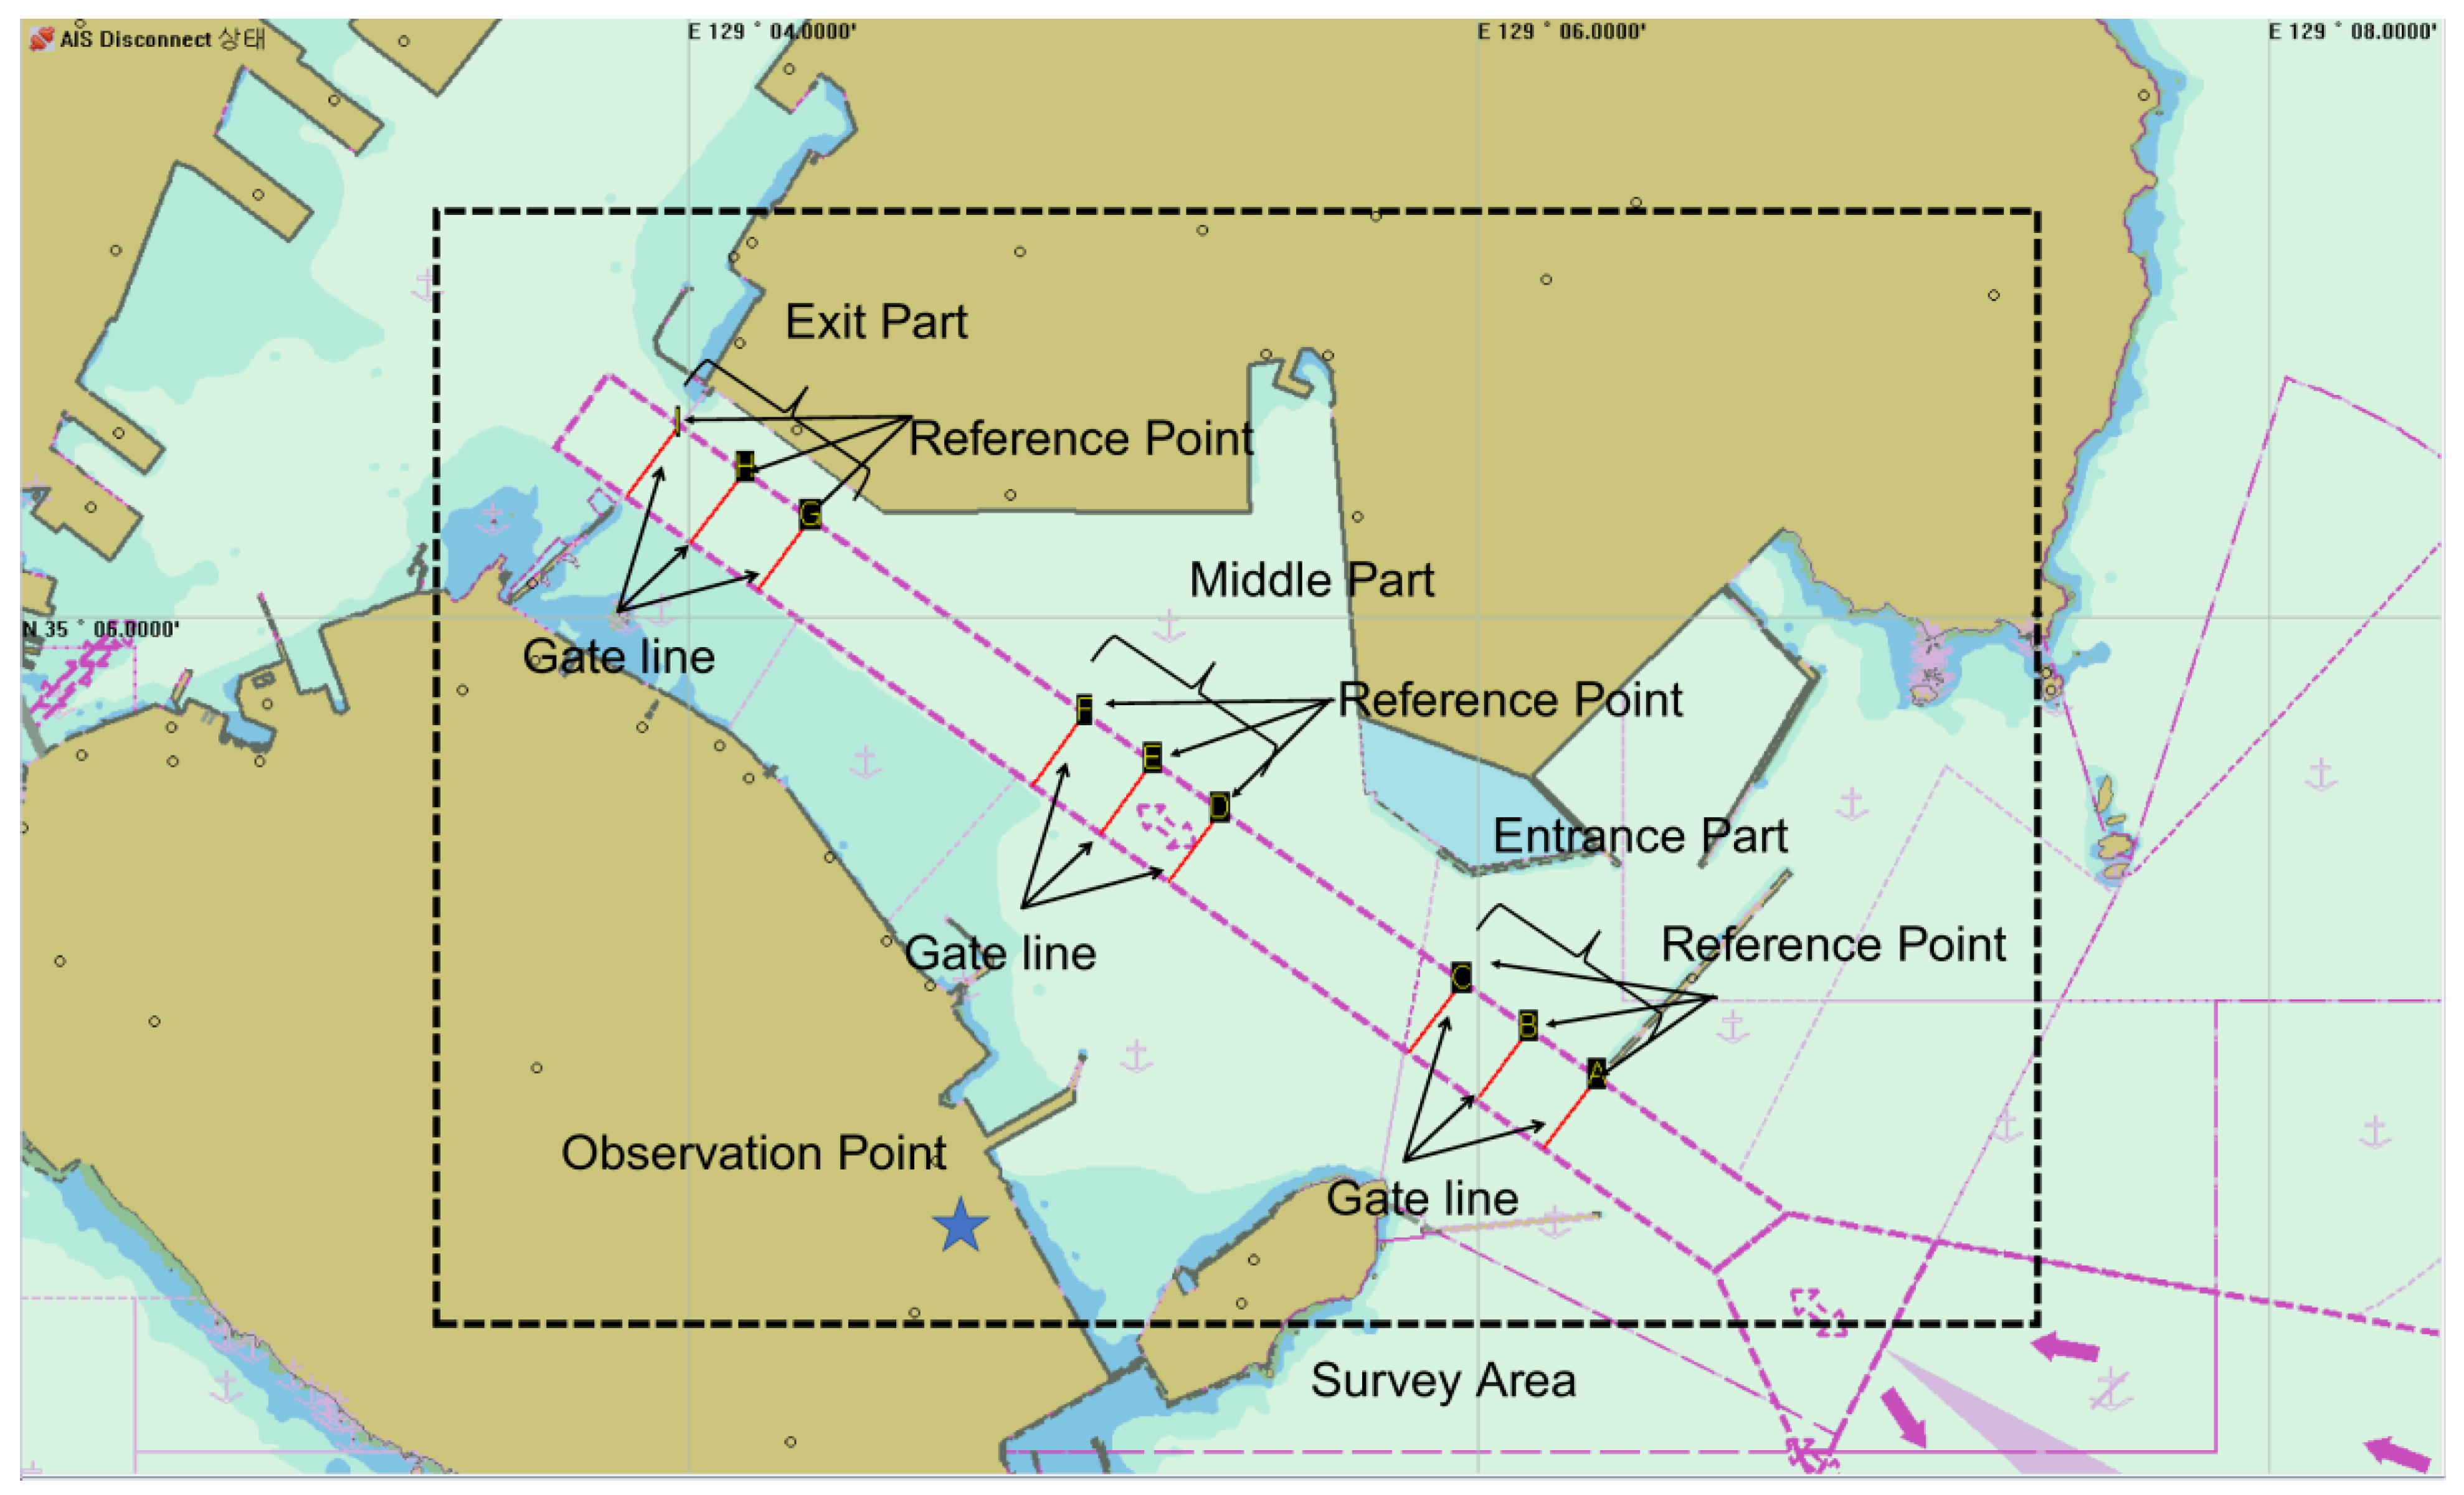
The No. 1 fairway located at the center of the Busan North Port stretches from the center of Yeongdo and Oryukdo to the vicinity of the Busan Harbor Bridge. It is a southeast–northwest fairway with a length and breadth of approximately 520 m and 340 m, respectively. In addition, an entrance fairway and a traffic separation scheme are being operated in the southeast of the fairway for the safe navigation of inbound vessels (IBVs) and outbound vessels (OBVs). At the entrance of the fairway, vessel traffic is congested because of the presence of breakwaters on both sides. At the exit of the fairway, the vessel traffic is congested because of the presence of a large bridge that crosses the fairway. At the middle of the fairway, vessel traffic is congested because of berthing and un-berthing near the wharf.
The Busan North Port is designated as the Traffic Safety Specific seas. Thus, the speed in the fairway is limited to 10 knots according to the maritime safety law. After passing the breakwaters, the fairway can be used by both IBVs and OBVs. Moreover, the vessels or sailing ships with a length of less than 20 m can enter or exit the fairway using the outer sea areas, but they should not interfere with the safe navigation of other vessels.
The setting of the gate line for semi-continuous spatial statistical analysis is presented in
Figure 6, where the fairways of Busan North Port are divided into entrance, middle and exit parts. In addition, each part was divided into three gate lines at regular intervals (one min. with a speed of 10 knots) for employing the semi-continuous analysis method. Thereafter, the value of each part was obtained by averaging the three gate lines to overcome the limitations of using the gate line for a single section.
3.2. Data Collection and Processing
The AIS data were observed and collected at the observation point for seven consecutive days using AMEC CYPHO-150. The collected data were stored and converted into a format that is suitable for research analysis using the Maritime Traffic Data Analysis System from Samwoo Immersion [
25].
The collected AIS data were divided into the entrance, middle and exit parts of the fairway and three gate lines were set at 1 min with a speed of 10 knots intervals for continuous data measurement at each location. Thus, the data were converted into the data required for analysis, as presented in
Figure 7.
In addition, the global positioning system (GPS) data of the vessel were collected from the AIS. The position of the vessel,
ω, was obtained from the latitudinal and longitudinal coordinates in the GPS. The course of the vessel,
was obtained from the course over ground in the GPS. The distance between a vessel and the reference point of a gate line,
, can be obtained using Equation (5):
where
is the meridian difference calculated in accordance with Equation (6) on which the Mercator method [
26] was applied. Moreover, the longitude and latitude differences (in min) between the vessel and the reference point (
and
, respectively) were calculated using Equation (7).
where
and
are the latitudinal and longitudinal coordinates of the reference point of the gate line, respectively (measured directly in the field using a GPS receiver).
and
are the latitudinal and longitudinal coordinates of the vessel position
, respectively.
In addition, the vessel size was classified and analyzed from the collected AIS data. Although there are various classification methods for vessel size such as gross tonnage and length, method classified by ship’s length is mainly utilized in maritime traffic engineering [
27]. For analysis, vessels with a length of 70 m or less were classified as small vessels (S), those with a length of between 70 m and 150 m were classified as mid-sized vessels (M) and those with a length of 150 m or more were categorized as large vessels (L). Furthermore, vessels with a length of less than 20 m, which do not have to navigate along the fairway, were excluded from the analysis.
4. Results of Traffic Characteristics
4.1. AIS Data Collection Results
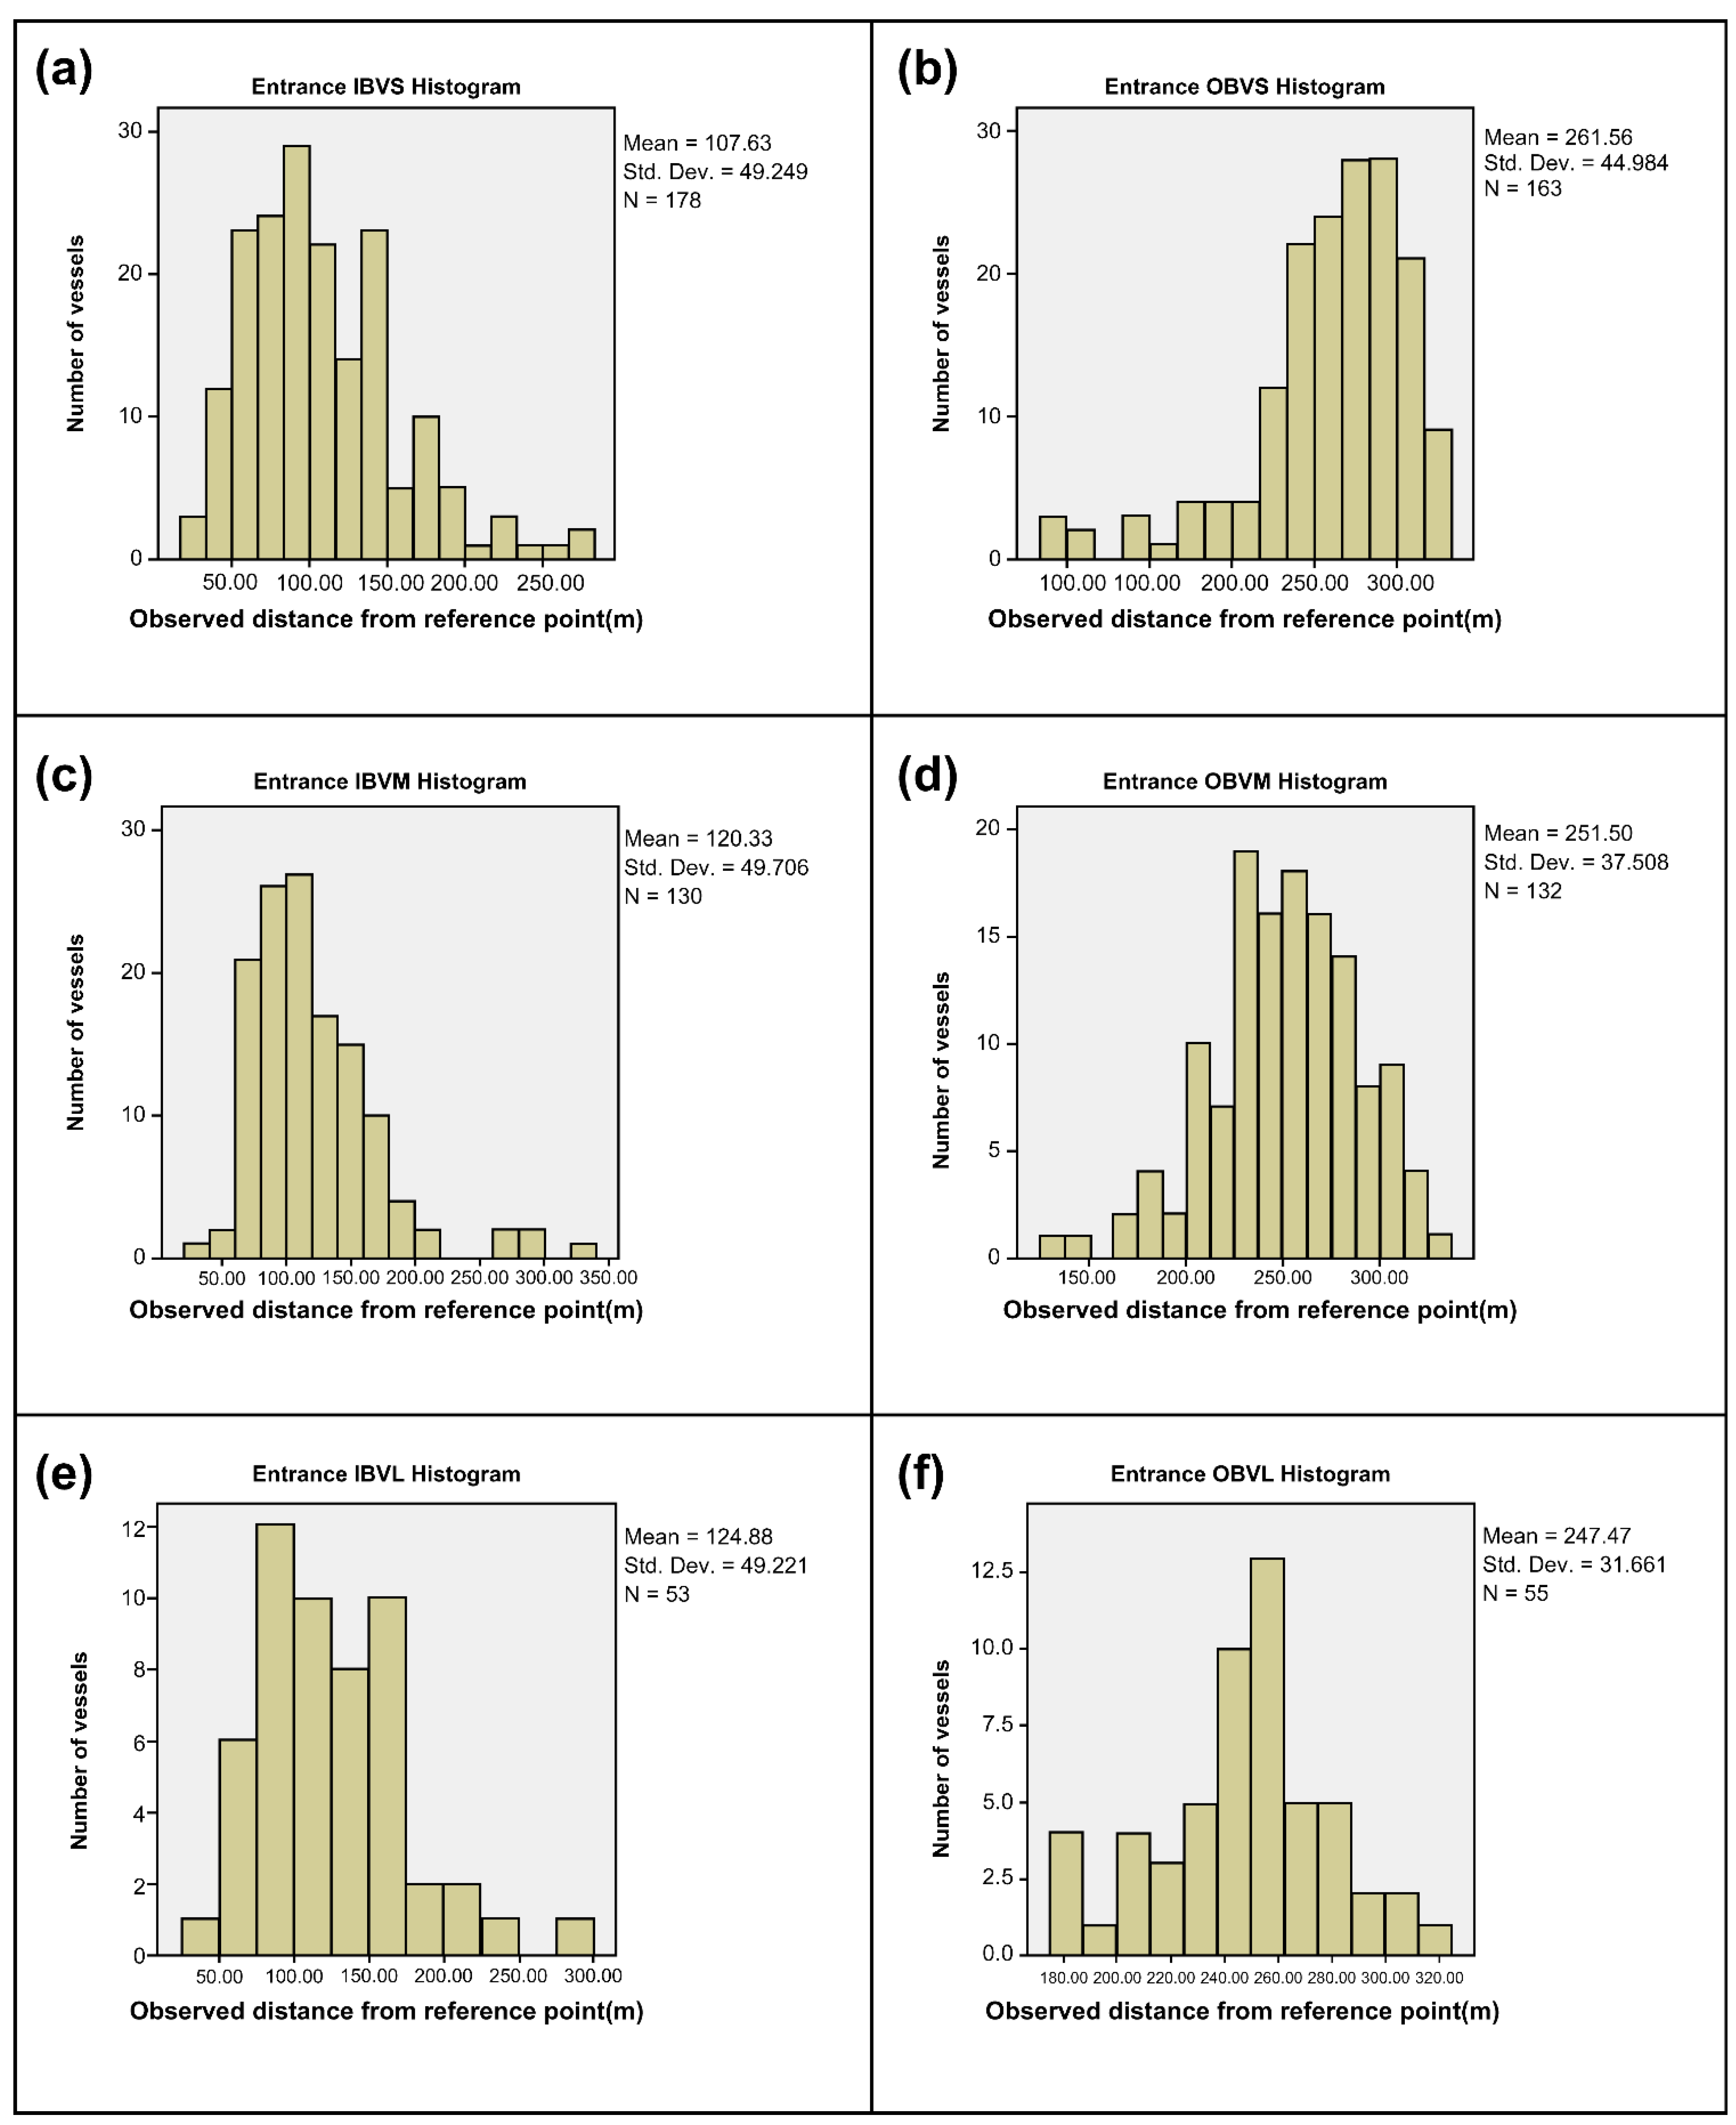
The navigation trajectories for each gate line accumulated for seven days are illustrated in
Figure 8, where the traffic flows of small, mid-sized and large vessels are represented in black, yellow and blue lines, respectively. As shown in
Figure 7, the large vessels navigate along the center of the fairway, whereas the small vessels navigate along the periphery of the fairway.
In the study period, a total of 361 IBVs and 350 OBVs passed through the entrance part, 260 IBVs and 278 OBVs passed through the middle part and 274 IBVs and 283 OBVs passed through the exit part. The detailed status is summarized in
Table 1.
The vital statistics of the vessels that passed through these three zones were obtained by semi-continuous analysis and are listed in
Table 2.
The small, mid-sized and large IBVs and OBVs tended to navigate on the starboard side of the fairway when the width of the fairway was 340 m. As the vessel size increased, the tendency to navigate along the center line of the fairway became stronger and the deviation for the use of the fairway tended to decrease.
4.2. Results of the Normal Distribution Test
The normal distribution test results for the vessels passing through each gate line are presented in
Table 3.
For a significance level ≥ 0.05, a normal distribution is followed because the null hypothesis of normal distribution holds true. For a significance level < 0.05, it is difficult to say that a normal distribution is followed because the null hypothesis of normal distribution is rejected.
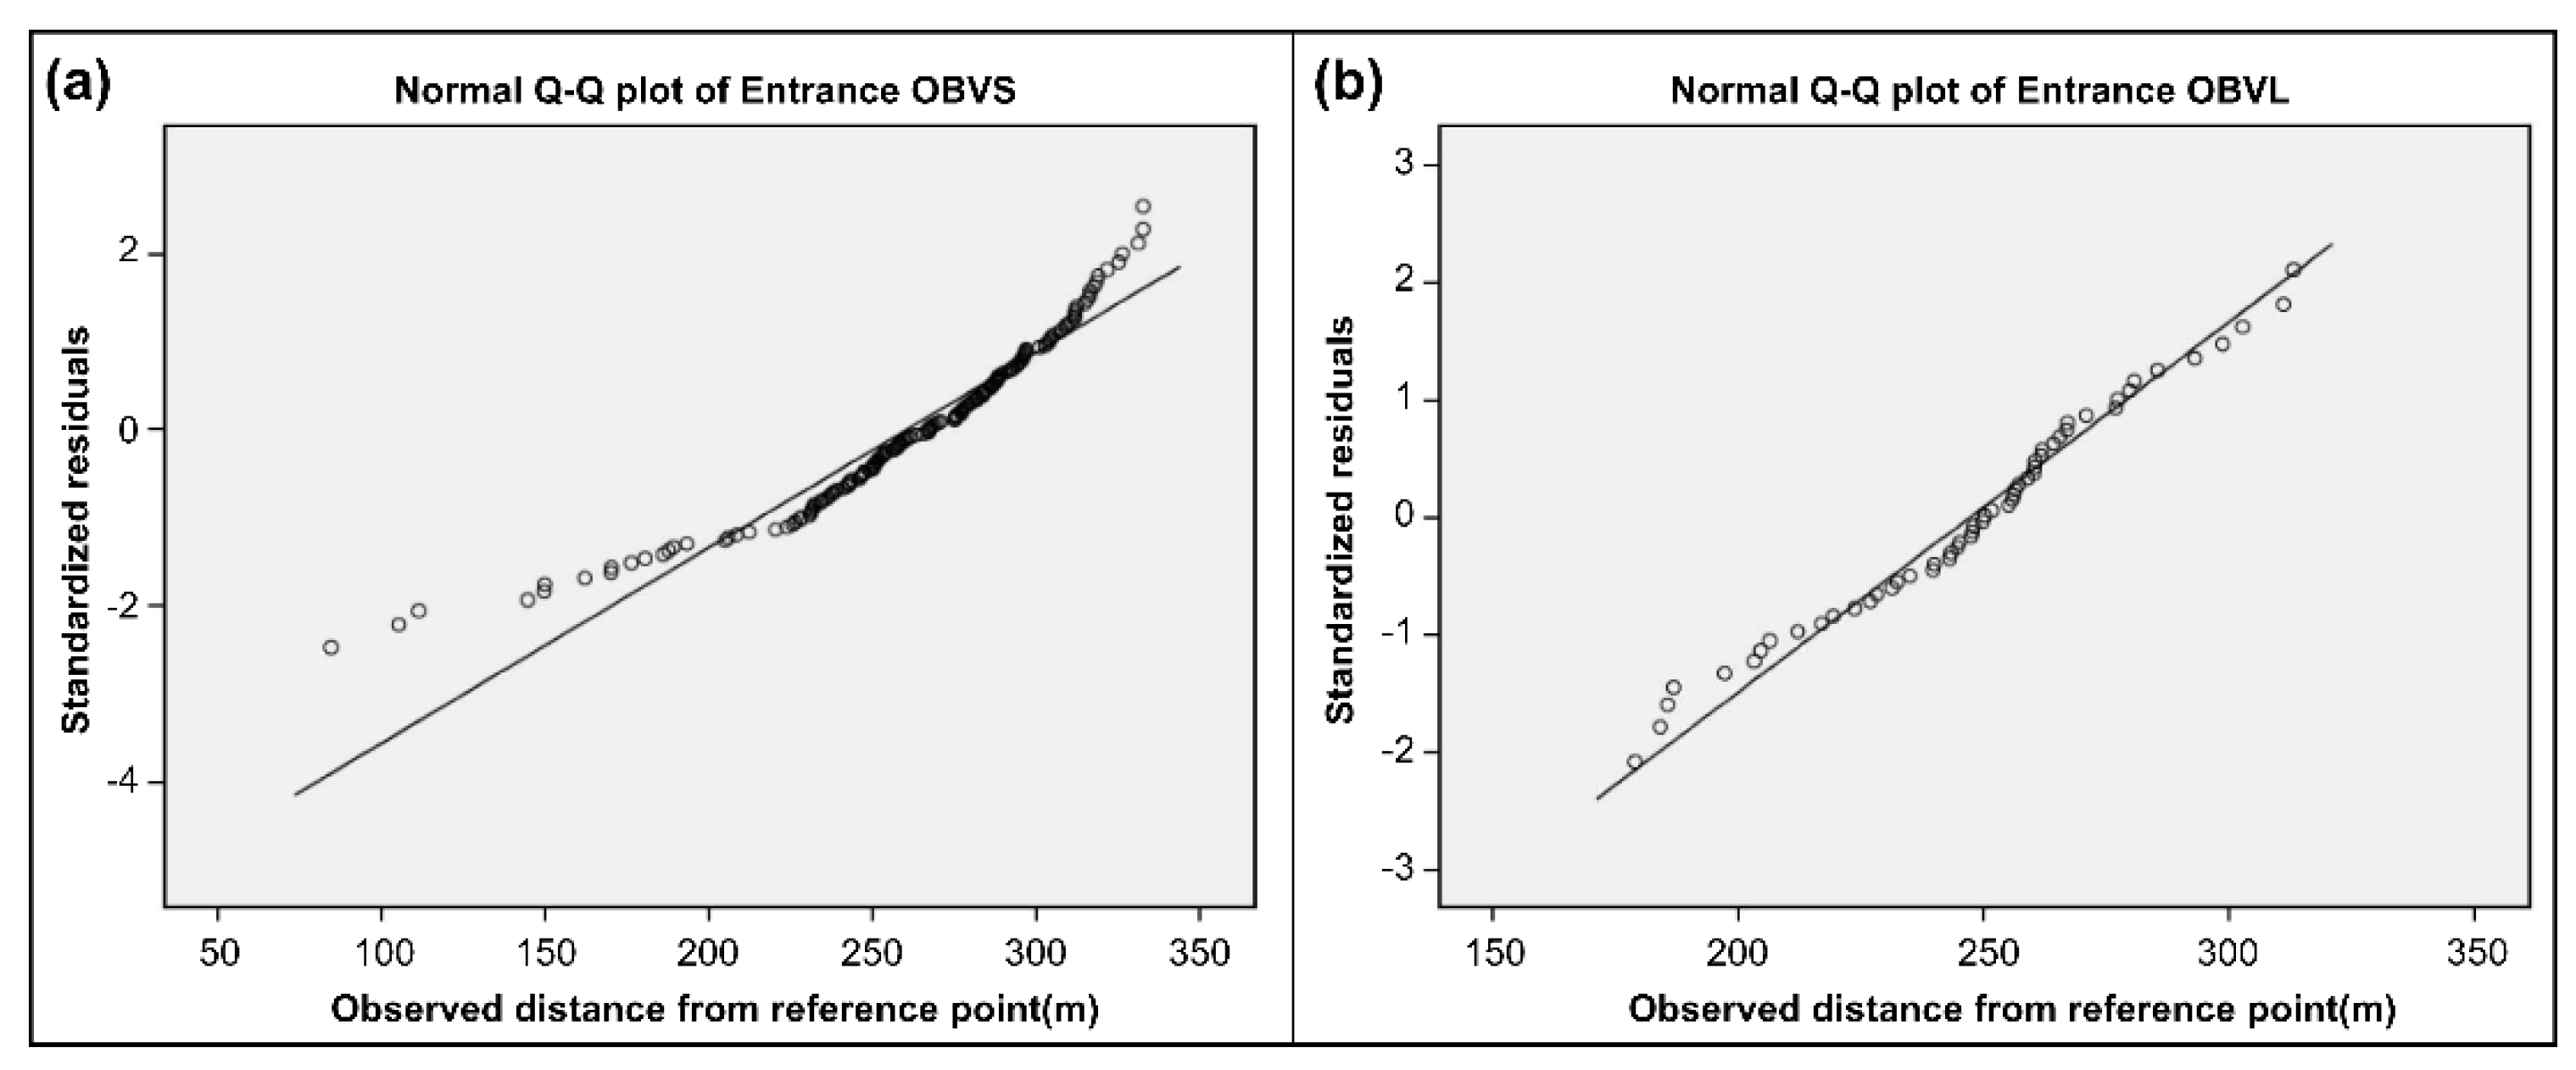
In this case, the normality is checked once again with the Q–Q plots. As shown in
Figure 9a, if the observed value and expected normal value (standardized residuals) are not linear, it is judged that they do not follow the normal distribution. If they are linear as shown in
Figure 9b, it is judged that they follow the normal distribution.
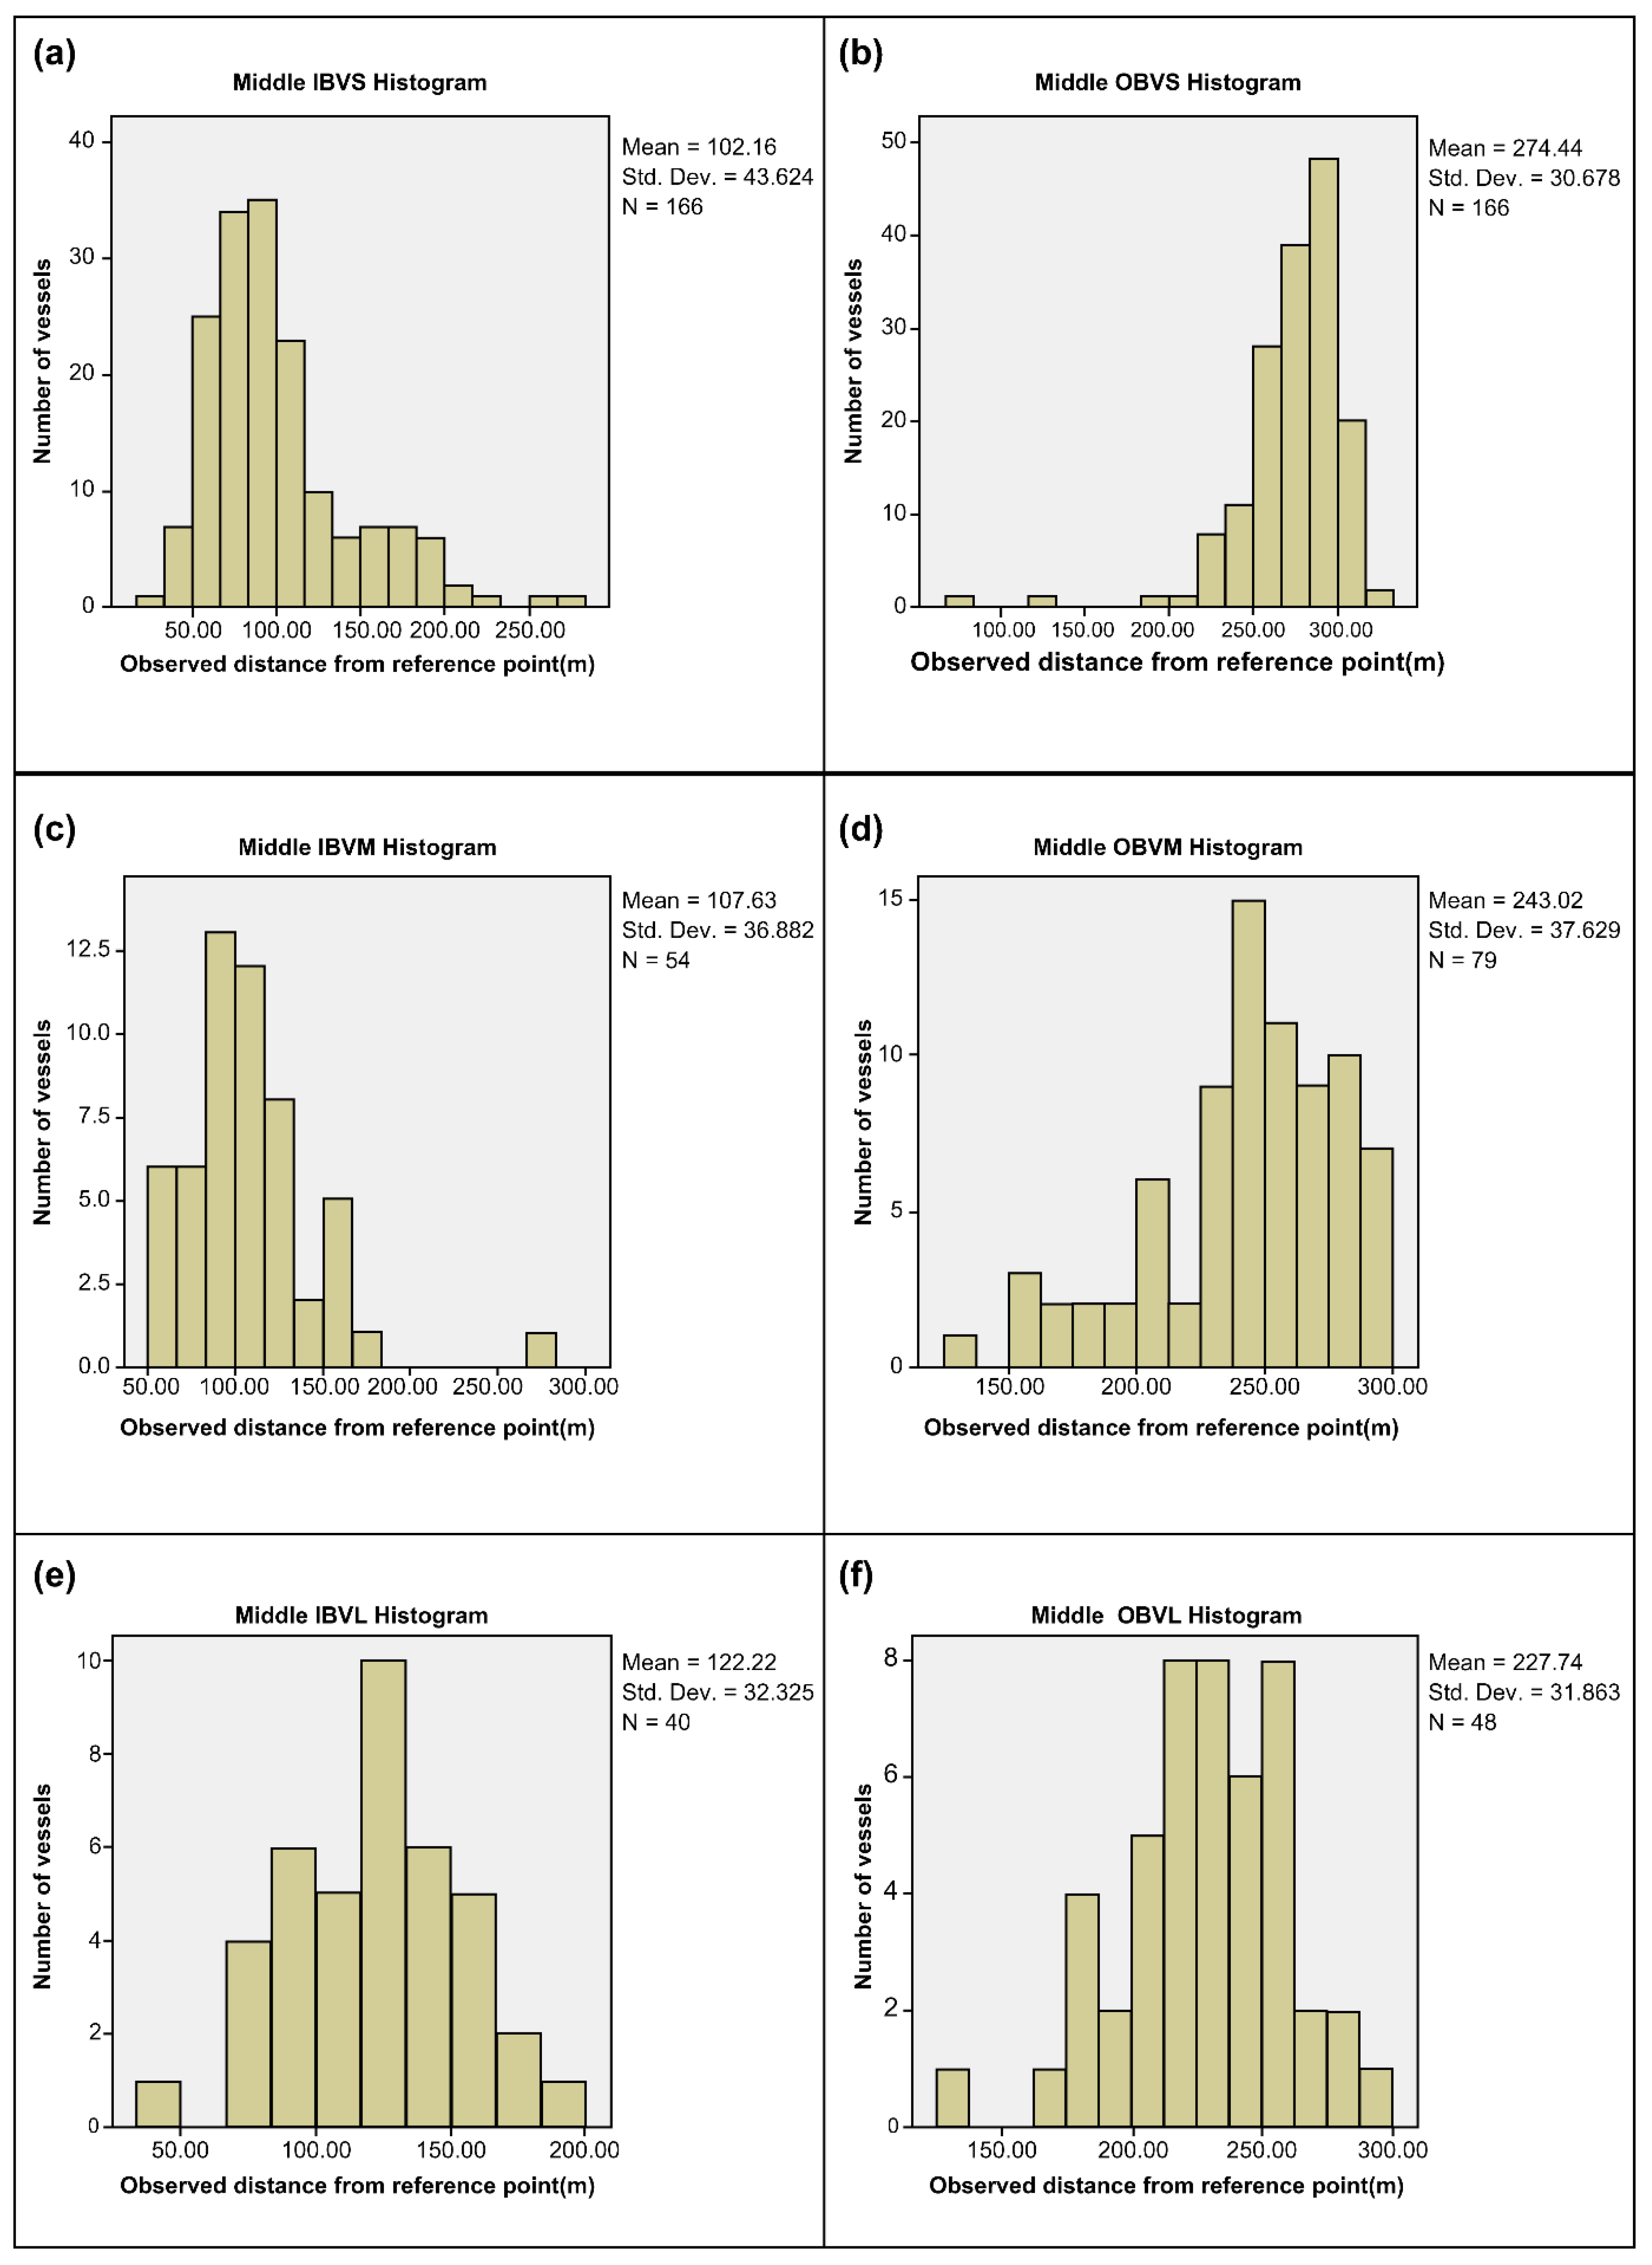
For Busan North Port, the inbound large and outbound large and mid-sized vessels followed a normal distribution at the entrance. In the middle part, only inbound and outbound large vessels followed a normal distribution, whereas inbound and outbound mid-sized and large vessels followed a normal distribution at the exit.
Previously, Kim et al. [
19] suggested that the traffic flow of dangerous goods carriers does not follow a normal distribution, but in this study, the fit of the distribution was confirmed to differ according to the size of the vessel.
4.3. Results of Kurtosis and Skewness Assessments
The kurtosis and skewness assessment results at each point are shown in
Table 4.
The values indicated that the fairway utilization width was generally narrower for smaller vessels and wider for larger vessels. Thus, larger vessels used the fairway more frequently than the smaller ones. In addition, the values were positive for most IBVs and negative for most OBVs, indicating that the vessels navigated on the starboard side of the fairway. However, smaller vessels were observed to navigate more closely to the starboard side and larger vessels tended to navigate closer to the center line of the fairway.
Therefore, the kurtosis and skewness assessment facilitated the understanding of vessel traffic flow characteristics, such as range of use and lateral positioning on the fairway, as compared with previous studies.
5. Discussion
As marine accidents on the fairways cause economic loss, human injury and marine pollution, understanding the vessel traffic flow on the route will contribute toward reducing marine accidents. Prior research has attempted to understand the characteristics of these traffic flows by assuming that they follow a normal distribution. In addition, the vessel flow characteristics were usually observed as a single gate line.
The current study verified whether the vessel traffic flow followed the normal distribution. In addition, the error was reduced through semi-continuous analysis by observing the flow in three gate lines. Moreover, the traffic characteristics in the fairway were evaluated using a spatial statistical analysis method called skewness and kurtosis and the existing analysis method using the histogram of traffic distribution was further improved.
The study was conducted on the North Port of Busan and the results are discussed herein. First, the normal distribution of the vessel traffic flow was verified. The traffic of large vessels was observed to follow a normal distribution regardless of the location. Therefore, in future studies, the traffic of vessels with a length of 150 m or more can be reasonably considered to follow the normal distribution. Similarly, mid-sized vessels followed normal distribution in sea areas with concentrated vessel traffic, such as the entrance and exit parts of the fairway; however, the middle part of the fairway, which is a mixed part maintaining a constant course or moves in and out from the route for berthing, did not follow a normal distribution. Moreover, the traffic flow of small vessels did not follow a normal distribution. Therefore, a more suitable optimal distribution is required for determining collision and fairway departure probabilities.
Second, the vessel traffic flow characteristics such as range of use and lateral positioning on the fairway were evaluated. Regardless of vessel size, all the vessels exhibited a tendency to travel on the starboard side of the fairway in Busan North Port. This is caused by the regulation that vessels should navigate to the starboard side on the fairway when avoiding other vessels that are at a risk of collision on the fairway. As this tendency was stronger for smaller vessels, the fairway utilization width was judged to be narrower for smaller vessels and wider for larger vessels.
The methods and results of this study can be highly utilized by vessel operators and vessel traffic service operators for understanding the vessel traffic flow characteristics, which will contribute toward implementing methods of maritime traffic control depending on vessel size. For instance, when two vessels meet on the entrance of the fairway, the larger vessel is guided to the center of the fairway and the smaller vessel is guided outward on the fairway (starboard side of the fairway). These traffic flow characteristics can be used as basic data to create a navigation route for autonomous vessels on the fairway.
The limitations of the current study are stated as follows. There are various types of fairways, such as traffic separation schemes, one-way fairways, two-way fairways, straight fairways and bended fairways. As this study analyzed only straight two-way fairways, it is necessary to derive the characteristics of other route types and fairways in further studies. In addition, the fairway width was constant for the Busan North Port. Therefore, further research is required to verify the traffic flow characteristics based on the fairway width. Thus, the derivation and generalization of these characteristics will improve the assessment methods and extend their application to more related fields.
6. Conclusions and Future Work
In this study, the generally known traffic distribution of marine vessels was verified for the Busan North Port fairway and a quantified assessment method was proposed to analyze the vessel traffic flow characteristics. Thus, a target sea area was selected and a traffic survey was conducted for vessels traveling in the target sea area for seven days. The traffic flow characteristics were investigated in the target sea area under a semi-continuous spatial statistical analysis based on the traffic survey, normal distribution test, skewness test and kurtosis test. The results of the experiment and the analysis conducted for Busan North Port are summarized as follows.
First, the traffic distribution of both large and mid-sized vessels followed a normal distribution, but that of the mid-sized vessels was limited to a certain extent. Second, the vessels exhibited a tendency to travel on the starboard side of the fairway and this tendency was stronger for smaller vessels. Third, the fairway utilization width was narrower for smaller vessels and wider for larger vessels.
Therefore, the traffic distribution and pattern of vessels was easily understood by conducting the normal distribution, skewness and kurtosis tests. The vessel traffic flow characteristics evaluated in this study could be helpful for captains, navigation officers, pilots and vessel traffic service operators who navigate vessels in Busan North Port to reduce marine accidents and improving the efficiency of maritime traffic control operations. Furthermore, follow-up research on various types of fairways (e.g., two-way fairway and fairway width) will aid in identifying the generalized vessel traffic flow characteristics based on the fairway type.
Moreover, as the analysis results revealed that small vessels did not follow the generally known normal distribution, further research is required to determine the probability distribution optimized for the traffic distribution of such vessels.


