1. Introduction
Nowadays, one of the most intensively developing areas of marine aquaculture is the cultivation of shell (bivalve and gastropod) mollusks. According to The Food and Agriculture Organization (FAO) data [
1], the volume of their cultivation amounted to almost 14.9 million tons, i.e., much more (except for algae) than other species of marine aquatic organisms. The issues of mollusk mariculture (conchioculture) are quite actively studied in many countries of the world, including the seas of the Russian Federation. The Azov-Black Sea basin is also of great importance. A series of studies was carried out there to develop the biological foundations of cultivating mollusks in suspended culture (thicker than water) [
2,
3,
4]. However, quite a few issues remain poorly studied (which include the study of the regularities of the dynamics of the number and biomass, production, and elimination of molluscs on artificial substrates-collectors).
Research on mariculture of mollusks is based on the principles of control and management of individual or all stages of the life cycle of a cultivated species. It is desirable to obtain the maximum number or biomass per unit of water surface per unit of time. This, in turn, necessitates the identification and analysis of natural regulatory mechanisms, on the basis of which it is possible to maximize the production potential of a particular cultivated object, with minimal costs for the biotechnological process itself.
Mussels, like many other species of mollusks, in their biology and ecology are close to opportunistic species, which have an
r-strategy of the life cycle [
5] and are significantly dependent on external conditions. Meanwhile, it can be assumed that, being colonial animals, in the course of their life cycle they must possess sufficiently well-developed ecological (population) mechanisms that regulate their density and biomass on a particular type of substrate. Based on the features of this species biology, it can also be assumed that mussels, which spend most of their life cycle in an attached state, should be sensitive to both the quality (material) and architectonics of the substrate (size, shape, ratio of its area and volume, etc.) after the end of the pelagic period of life. In other words, here we are dealing with the so-called bioinert systems, in which both the living population (fouling cenosis) and the inanimate (inert) component (artificial substrate) represent some kind of unity, closely interconnected and functioning as a whole [
6].
In the mariculture of mollusks, as in the fishery, the elementary unit of exploitation is the population [
7,
8]. Therefore, this direction should also be based on the principles of population biology, associated with the elucidation of the mechanisms that control the population structure and dynamics of the number of certain cultivated objects. Unlike intensive mariculture, where production processes are controlled by changing the flows of matter and energy, during extensive cultivation, the impact on the population parameters of mollusks is possible only by changing the size, shape, and position of the artificial substrate in time and space [
9]. In turn, this necessitates the study of the relation between biological parameters and physical (geometric) characteristics of artificial substrates on which mollusks are cultivated.
The objective of this work is to study the effect of different structures (architectonics) of artificial substrates on the biological parameters and production indicators of mussels cultivated in the water column. These biological parameters include dynamics of abundance, biomass, average size and weight. Possible regulatory mechanisms of the population structure are also defined as an object of study.
2. Materials and Methods
The material for the study consisted in mussel populations grown on hydrobiotechnical structures (HDTS carriers) on which artificial substrates (collectors) are attached. The works were carried out annually during the 1980s–2000s in 1980–1991, as well as in 1995–1999 and 2001–2003. Installation of GBTS and collectors for collecting spat of mollusks was carried out in the Kerch Strait, Tendrovsky Bay in the northwestern part of the Black Sea in spring (March–April), in the Donuzlav estuary (western coast of Crimea) in autumn (September–October).
The material for the study was the mussel populations cultivated on 4 types of hydrobiotechnical structures—artificial substrates (collectors)—during the 1980s–2000s. The collectors were installed in the Kerch Strait and Tendra Bay in the northwestern part of the Black Sea in spring (March–April), and in the Donuzlav Lake (western coast of Crimea) in autumn (September–October). Samples were collected at intervals of 1.2–1.8 months (except for the winter months).
Artificial substrates were nylon ropes with cubic or oval-shaped foam plates woven into them, differing in size, area, and volume. On the 1st type, foam plates (8 × 3 × 0.8 cm) served as structural units; on the 2nd, the substrate was rounded foam blocks (D = 7, h = 2 cm); on the 3rd there were elements of a cubic shape (7 × 7 × 4 cm); and, on the 4th one, a barrel-shaped overlap served as a module (d = 17, h = 19.5 cm). The main indicator characterizing their different types was the area (Si, m
2) per 1 m of the collector length (L), which can be designated as the relative area (ω = Si/L) it is necessary to consider (collector length unit). This area, when divided by the standard area (1 m
2), can be designated as the relative one (ω = S
i/S
0). Thus, ω was 0.09, 0.21, 0.34, and 0.55 on type 4. Moreover, in macrophyte mariculture, another indicator is often used: specific surface area (S/V), defined as the ratio of the area of the substrate (S) to its volume (V) [
6]. However, the conducted statistical analysis showed that these indicators are closely interrelated with each other by an inverse linear dependence:
Therefore, we used only the first indicator. During the sampling period, the abundance (N, thousand ind./m) and biomass (B, kg/m), the abundance of different size groups, with an interval of 5–10 mm, and their biomass were determined on each type of collector. In addition, detailed analysis was carried out and about 15–20 mollusks of each size group were selected. The length (L), height (H), bulge (D), total live weight (with valve) of each mollusk were determined. The mass of soft tissues, shell, and mantle fluid were also determined.
The methodological approach that we used to study the dynamics of the abundance and biomass of mussels in collectors is partly based on the principle of complete intrapopulation aggregation. Thus, the internal composition and structure of populations were not considered in detail, but it was assumed that all individuals have a certain average length (L) and mass (W) [
10].
The hydrometeorological conditions of the above regions were quite similar to each other and the annual course of water temperature in them is characterized by a significant amplitude with a pronounced minimum in February–March (up to −1 °C) and a maximum in July–August (up to 30 °C (the average long-term, respectively, is +3, 0 and +24.2 °C)). In the Kerch Strait and Tendrovsky Bay, water can be freshened during the period of inflow of slightly saline waters from the Sea of Azov or the inflow of fresh water from the Danube; in the Donuzlav estuary it is close to 16–18‰. The trophic conditions of these water areas can be classified as eutrophic and they are characterized by high primary productivity. Phytoplankton biomass varies from 200 to 1400 mg/L, suspended organic matter averages 3–5 mg/L, which is significantly higher than in other regions of the Black Sea.
The production of mussels on the collectors (P
t) for a period of time (t
1 and t
2) was determined by the Boysen–Jensen method according to the equation
and the mass of eliminated individuals for a given time interval, where B
t+1 and B
t, respectively, are the biomass of mollusks during the time from t to t + 1, and B
e is the biomass of eliminated individuals during the given time interval [
11]. The total production for the cultivation cycle (16–17 months) was found by summing the production for a certain period of time for the entire study period: P
∑ = ∑ P
i. In total, five cultivation cycles were carried out on each type of collector (except for the 4th type, where only one cycle was carried out).
After the installation of artificial substrates in the sea, the larvae of mussels which have completed metamorphosis began to settle on them. At the same time, it was noted that different types of artificial substrates foul unevenly and in natural conditions more or less significant fluctuations in the number and biomass are always observed on them. The literature data indicates that, without limiting environmental factors, an increase in population density can occur according to an exponential law [
10,
12]:
where
is initial density and
Nt is population density, respectively, the initial density and size of the population for the time
t, and
r is the specific (innate) rate of natural population increase (month
−1). In the literature this rate is referred to as “biotic” or “reproductive” potential [
7,
13]. The value of
r represents the potential ability of a population to increase in numbers. It is largely attributable to internal (genetic) factors, i.e., fertility, development rate, life expectancy, etc., as well as to environmental conditions.
Work on growing mussels on the 4th type of collector was carried out in 1989–1990, but in 1991 the institute faced very significant financial difficulties associated with the manufacture of this type of collectors, the lease of vessels for their installation, and the lack of technical personnel. Therefore it was necessary to confine ourselves to only one cycle. At the same time, collectors of types 1–3 were basic, were made earlier (in the 1980s), and their setting could be carried out using a small-sized fleet.
Statistical processing of field and experimental data was carried out according to generally accepted methods [
14]. The arithmetic mean (
), variance (σ
2), standard deviation (σ) and mean error (m) were determined. The significance of differences between the means was determined using Student’s (t) or Fisher’s (F) tests at a 5% significance level (P < 0.05).
The predictors were the duration of cultivation (months) and the relative area of the substrate (ω); the responses were the density of mollusks (ind./m), biomass (kg/m), average length (L) and weight (W) of 1 specimen, production (P), and elimination (E). When analyzing the experimental data, elementary statistics were used (mean values, their variance, standard deviation, mean errors, significance of the difference according to Student’s test). When modeling the dynamics of abundance, biomass, average length and weight, production, and elimination, statistical packages (“Statistica-10” (TIBCO Software Inc., Palo Alto, CA, USA), “Microcal Origin-8.5” (OriginLab Corporation, Northampton, MA, USA)) were used, with the help of which, according to a given algorithm, various graphs were constructed.
3. Results
As a starting point for general analysis, we considered changes in the abundance and biomass of mollusks on the 1st type of collectors (ω = 0.09). This type is the most widely used in the practice of mussel cultivation. The obtained results were compared with the results of cultivation on other types of artificial substrates.
Analysis of changes in the number of mollusks, during the period when collectors are arranged, showed that the highest value of the biotic potential is equal to
0.28 months
−1 on the collector with a relative area of 0.55. After reaching the maximum value, the number of mollusks began to steadily decrease. Thus, its decrease (elimination) in some cases can be described by the same exponential function, but with a negative value of the
r.
Figure 1 shows data on the dynamics of the number of mollusks on the 1st type (ω = 0.09) of an artificial substrate.
Each line (
Figure 1) characterizes one growing cycle (duration~1.5 years) to study the dynamics of the mussel population. In total, five cycles were carried out for a comparative analysis of their trajectories, which is indicated in this graph. It shows that after the installation of the collectors, the mussels’ spat settlement reached 5–6 thousand individuals/m, and then its number decreased. At the same time, in certain periods of cultivation, the density of mollusks could vary significantly. This is due to the spawning of other subpopulations, the larvae drift and the settling of spat from other regions of the Black and Azov Seas. Since mass spawning of the Black Sea mussel occurs two times a year—in spring (April to May) and in autumn (September to November)—mussel larvae are found almost throughout the year. The period of mass spawning is in April and October [
2,
3,
4]. Therefore, after spat collecting on collectors in spring, the 2nd peak of spat settling on substrates occurred in the autumn of the same year. This led to significant fluctuations in the number of mussels on collectors.
The dynamics of the number of spat during the period when collectors are arranged can be conditionally divided into two varieties, differing from each other in the intensity of juveniles’ settlement. In the first case, the density of the spat settled on the collector reaches rather significant values (3–6 thousand ind./m). Then the density of mollusks begins to decrease during the cultivation process (
Figure 1, curves 1–3). In another case, the density is characterized by a relatively small value (300–500 ind./m) and later it fluctuates slightly around this value (in
Figure 1, curves 4, 5). Apparently, this is due to the fact that the spat settlement results from different processes—the degree of openness (and closure) of the reservoir; the relief of the coast and bottom; prevailing winds; a system of constant and unstable currents leading to small-scale heterogeneity arising from turbulence, temperature gradients, salinity, light, i.e., physical and chemical boundary conditions.
Comparative characteristics of
Figure 1 allows us to speak about two types of spat settling and mussel growth on collectors, which we cannot regulate under conditions of extensive cultivation, since they depend on many oceanographic and ecological factors.
After the spat settles on the collectors, there is a linear and weight growth of mollusks. As a result of the growth, there is competition for space (substrate) and food necessary for mollusks to carry out vital processes. In the course of further increases in size and mass, it enhances intraspecific competition, which leads to the death (elimination) of less competitive individuals. This occurs until the population reaches a certain stationary (quasi-equilibrium) value (N
s), where the rate of increase in the density of individuals and their elimination are balanced with each other. The most important result here is the fact that if the initial number of mollusks (during the settling period) on type 1 differed from each other by more than 15 times, then the difference between the maximum and minimum final values (N
max/N
min) did not exceed 1.5–2 and averaged 290 ± 63 ind./m. It should be noted that it is obtained from field data as an average density of five cycles at the end of growth) [
13]. The changes in abundance are curves of the survival of mollusks during their cultivation on the collectors.
On collectors with a larger relative area (ω = 0.21 and 0.34), a similar process occurred, differing from the previous one only in quantitative values. In particular, here, at first, a high initial density (No) of settled spat was also observed, reaching 40–80 thousand ind./m. This is probably due to the larger relative area of the collector and, accordingly, the possibility of collecting a larger number of mussel larvae. As on the previous type of collector, after reaching the maximum, the density began to steadily decrease and, on average, it stabilized at the level of 870 ind./m (for the 2nd type) and 1490 ind./m (for the 3rd type). On the 4th type of collector, only one cultivation cycle was carried out.
On the 4th type of collector, only one cultivation cycle was carried out, in which the initial density of spat reached 155 thousand ind./m
2, but by the middle of the cultivation cycle it decreased to 40 thousand ind./m, and at the end of the cultivation of mollusks it was an average of 3200 specimens/m. The average values of the standard density on the indicated types of reservoirs significantly (P ≤ 0.05) differ from each other. The relation between the relative collector area (ω) and the mean stationary density (N
s) is well approximated by an exponential function (Equation (3),
Figure 2):
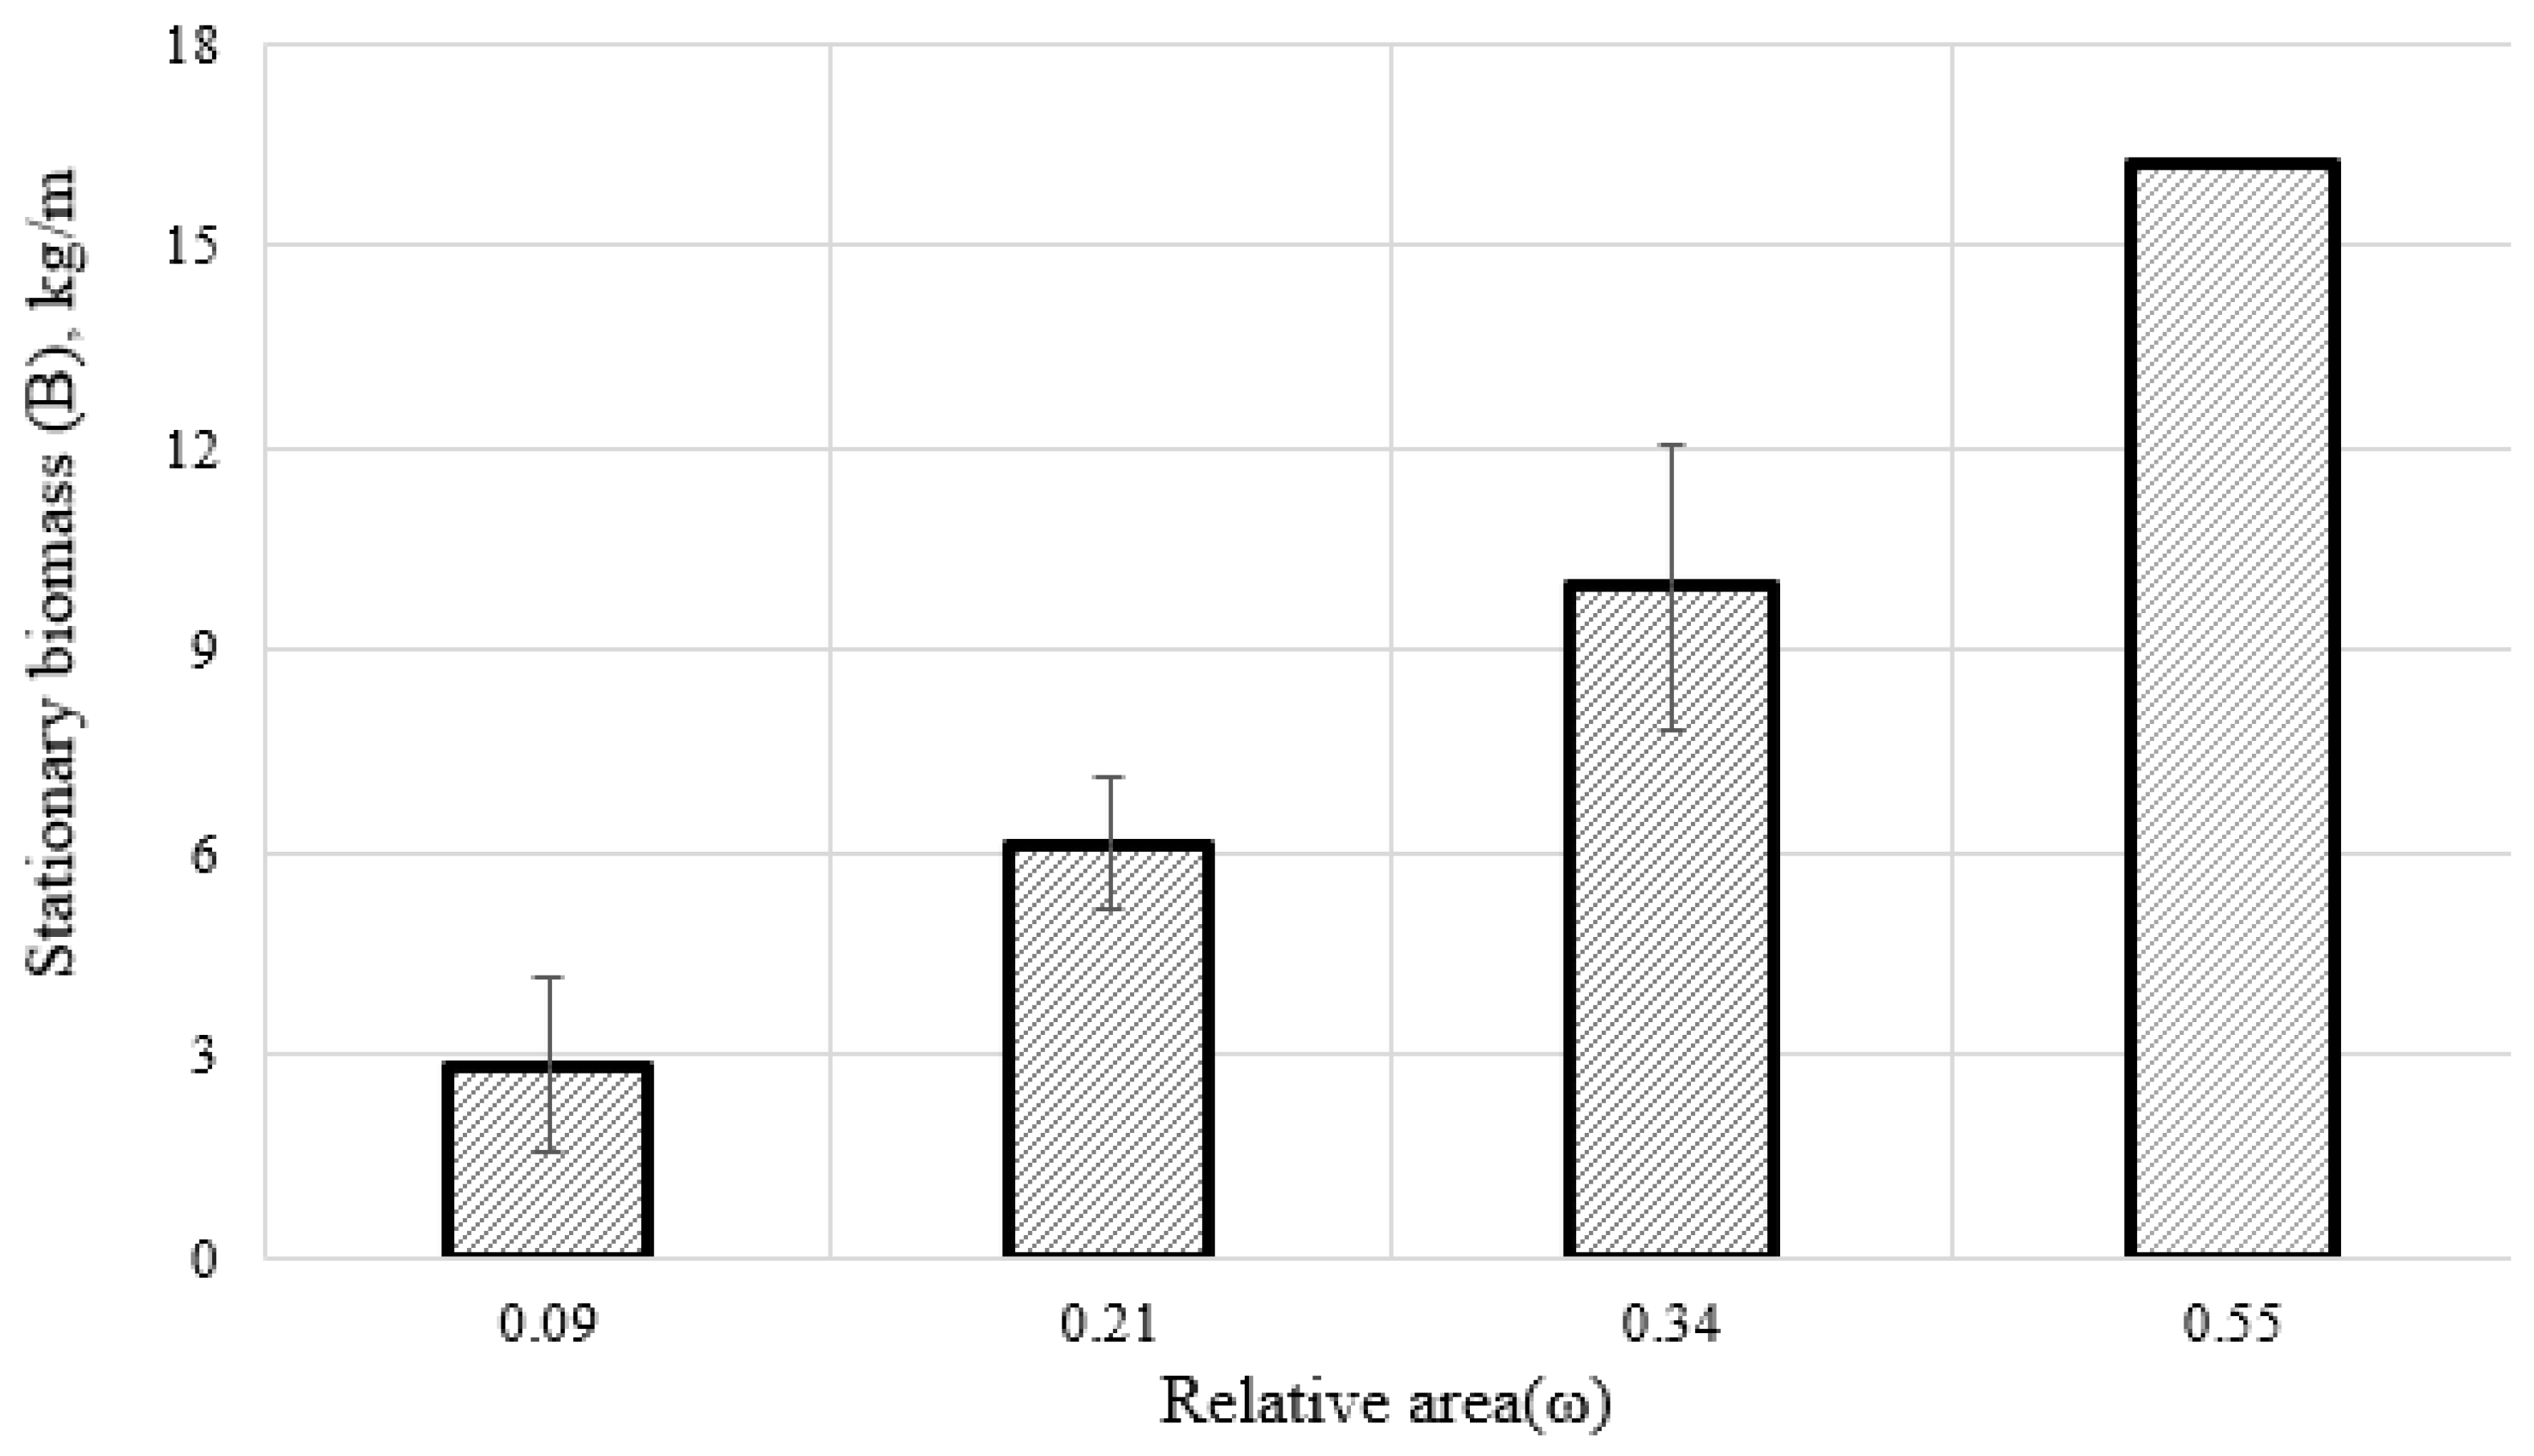
In parallel with the decrease in the number, an interconnected but oppositely directed process took place on the collectors, i.e., an increase in the biomass of mollusks (B). It was found that during the cultivation cycle there are periods of a sharp increase and decrease in the mollusks’ biomass. However, then the biomass stabilized near a certain, stationary, quasi-equilibrium level (B
s) associated with the area of the substrate. Thus, it means that this biomass came into a state of dynamic equilibrium. In particular, on the 1st type of collectors (ω = 0.09), the stationary mollusks’ biomass was 2.6 + 0.64 kg/m. A similar dynamics of biomass was observed on other types of collectors, differing mainly only in quantitative values. On the 2nd type of collectors (ω = 0.21), the final biomass stabilized at 6.2 ± 0.48 kg/m, while on the 3rd one (ω = 0.34) it was 10.0 ± 1.06 kg/m (
Figure 3 and
Figure 4). On the 4th type (ω = 0.55), the relation between the biomass and the area of the artificial substrate was 16.2 kg/m.
Analysis of changes in the stationary mussels’ biomass on different types of artificial substrates showed that, in contrast to density, this relation with a high degree of determination is described by both an ordinary linear and an exponential function. So in this case, for subsequent statistical transformations, we will write in the form:
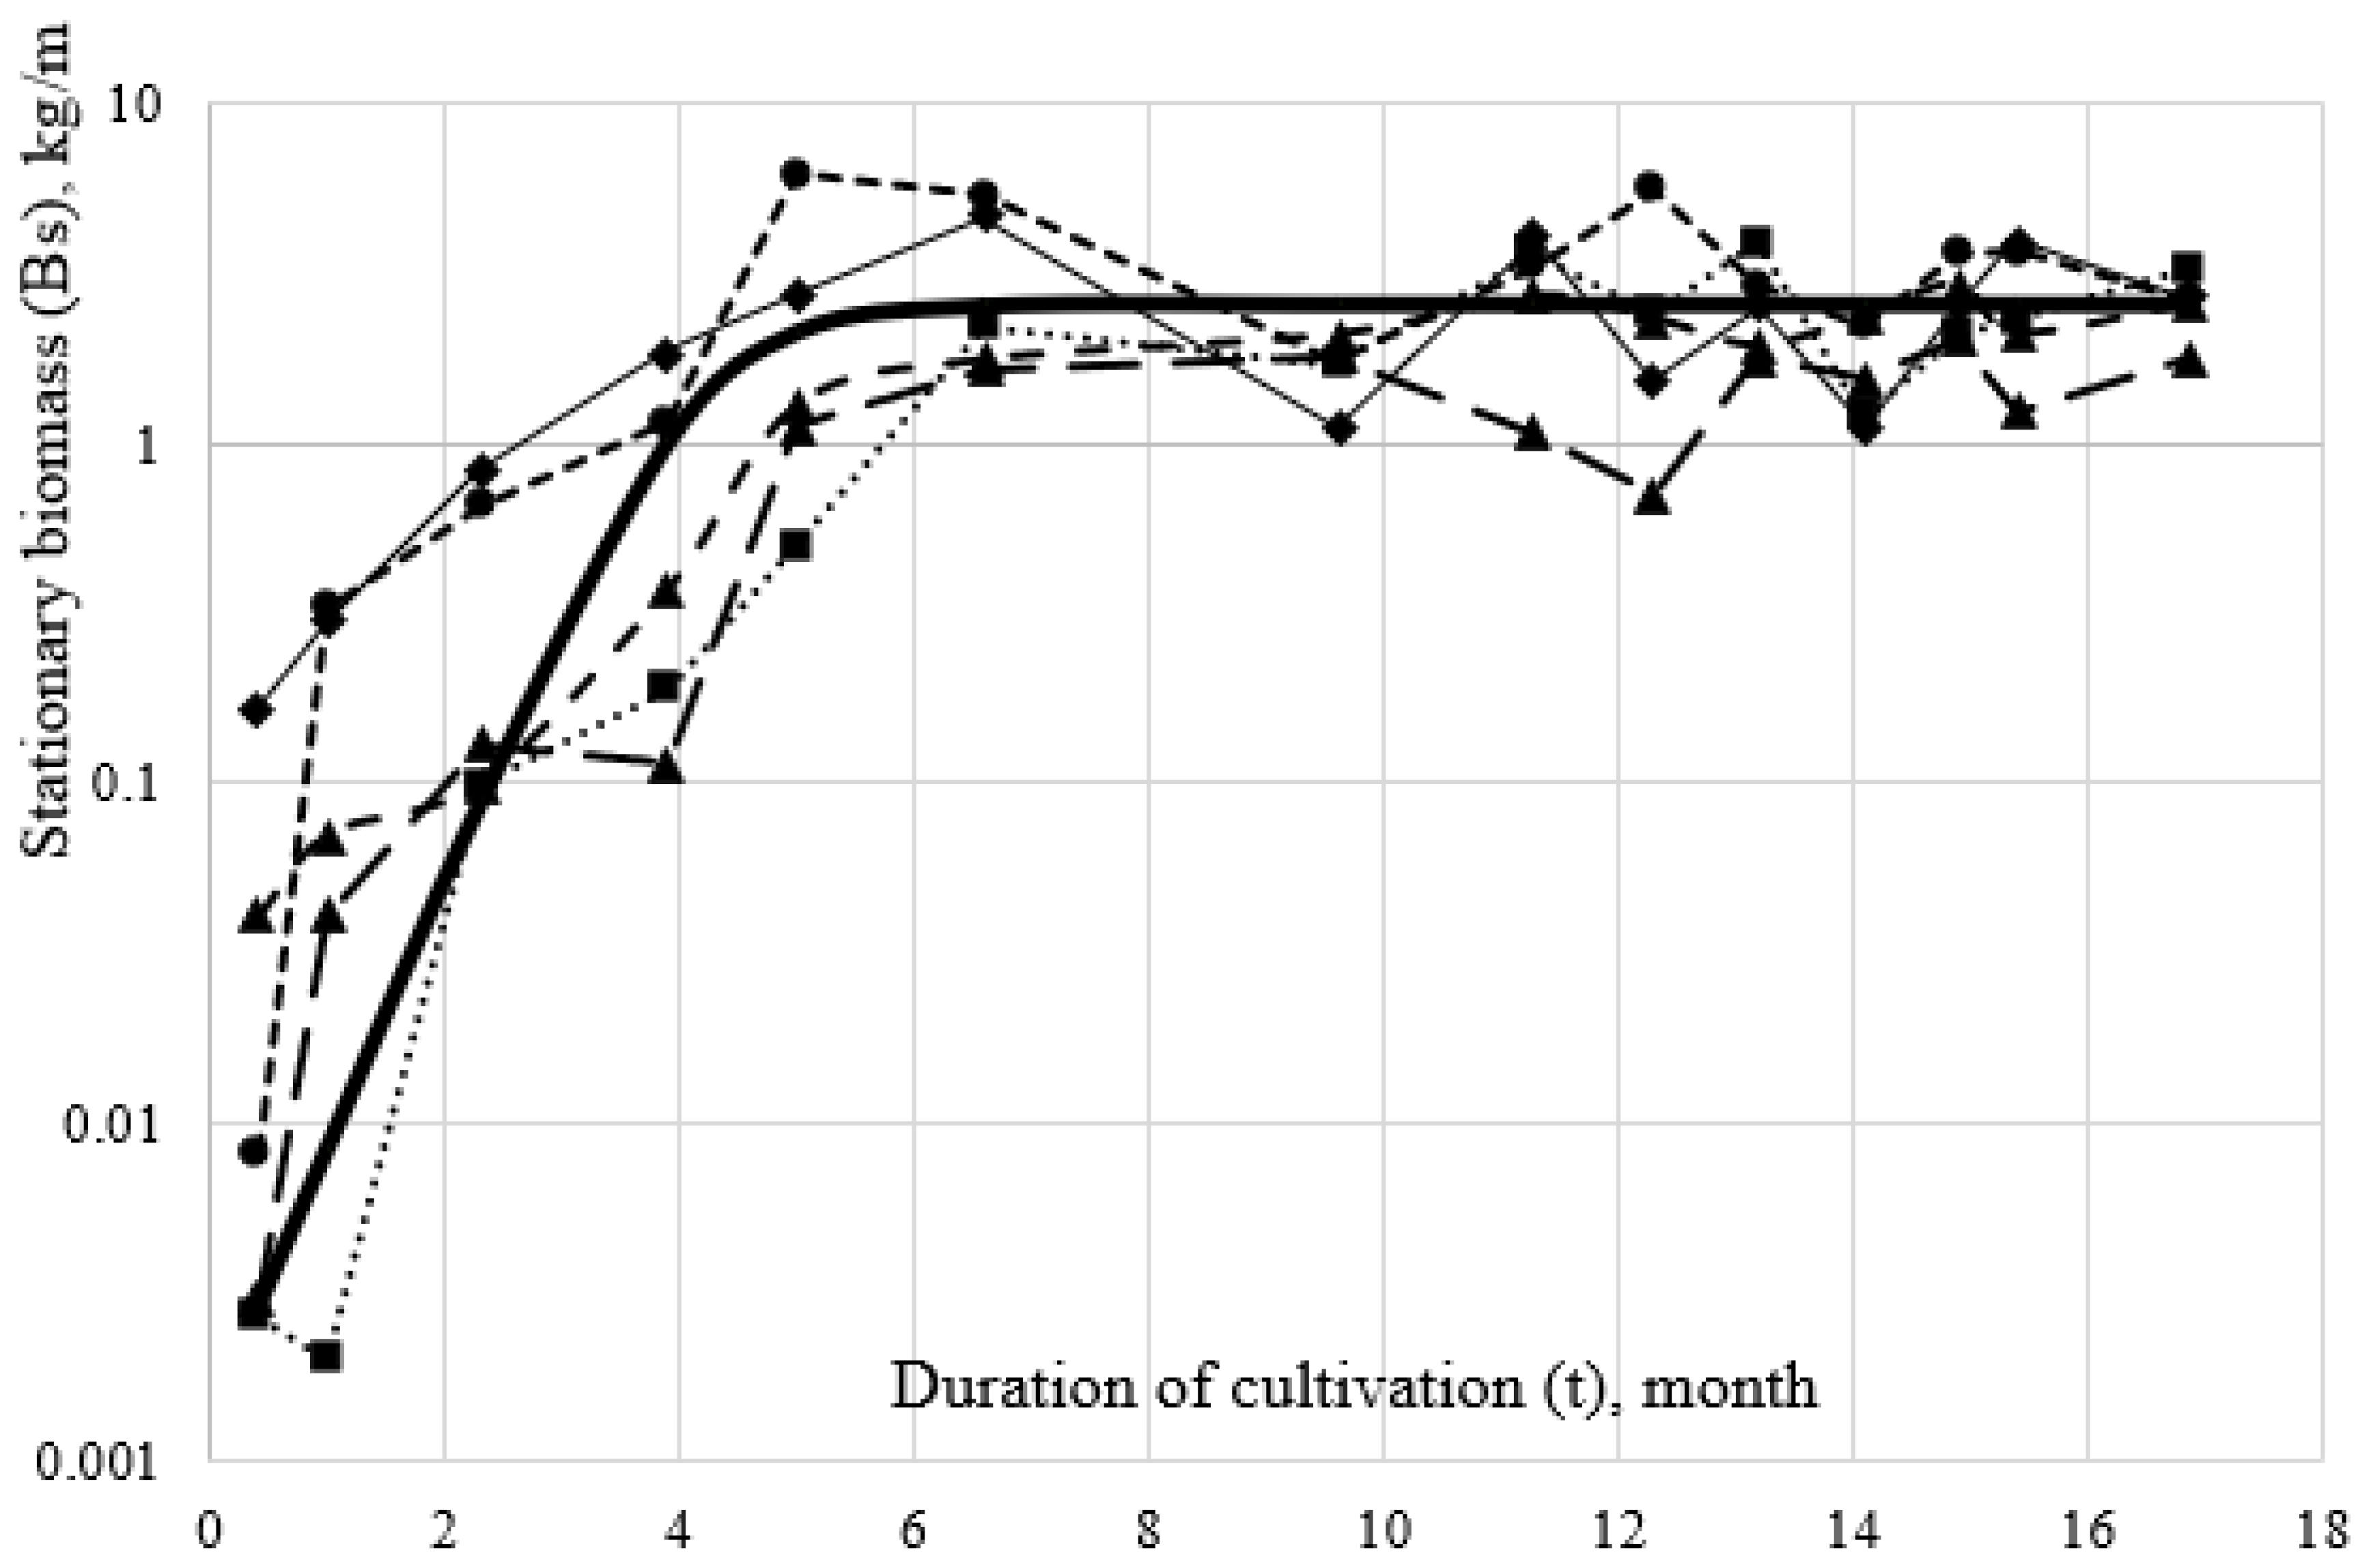
Due to the fact that the mollusks biomass is a key concern to the mollusks mariculture and the prediction of a possible production, we have investigated this issue in more detail. It was of interest to analyze more thoroughly the available field data and to characterize the relation between the stationary biomass (B
s, kg/m) and the duration of cultivation (t, month) on each type of artificial substrate. To do this, we used the Pearl–Verhulst Logistic growth model [
12]:
where B
s and B
t, respectively, represent the stationary biomass and biomass for the time
t (month),
a is the integration constant determined by the initial density value,
b is the specific growth rate,
e is the exp (10.55–1.85
t). This equation was chosen on the basis of a linear decrease in the specific growth rate of the population with an increase in its density.
Figure 4 shows as an example data on the mussels’ cultivation on the 1st type of collector, which is numerically described by the equation:
On other types of artificial substrates, a similar picture was observed, but the quantitative indicators had different numerical values. For the 2nd type of collector, the numerical values of the coefficients (Bst, b and a), respectively, were 5.6, 4.3, and 3.22 (R2 = 0.53) and for the 3rd type were 10.6, 8.61, and 1.97 (R2 = 0.50). In the 4th type, where only one cultivation cycle was carried out, Bst, b and a were equal to 20.2, 8.03, and 1.17, respectively.
Figure 5 shows the calculated (theoretical) curves based on the above-mentioned Pearl–Verhulst logistic equation. It clearly shows that the 2nd inflection point of the logistic function, which characterizes the position of the asymptote of the biomass curve on different types of substrate, is noticeably different. On the 1st type of collector, its numerical values of this point are 2.2 kg/m, the 2nd and 3rd ones are, respectively, 2.8 and 5.4 kg/m, while on the 4th it equals 10, 1 kg/m. At the same time, it can be seen in
Figure 5 that the average biomass in collectors with larger values of the ω along the abscissa axis shifts to the left, i.e., reaches the equilibrium (stationary) state faster (
Appendix A).
Thus, with an increase in the ω, the stationary density (N
s) and mussels’ biomass (B
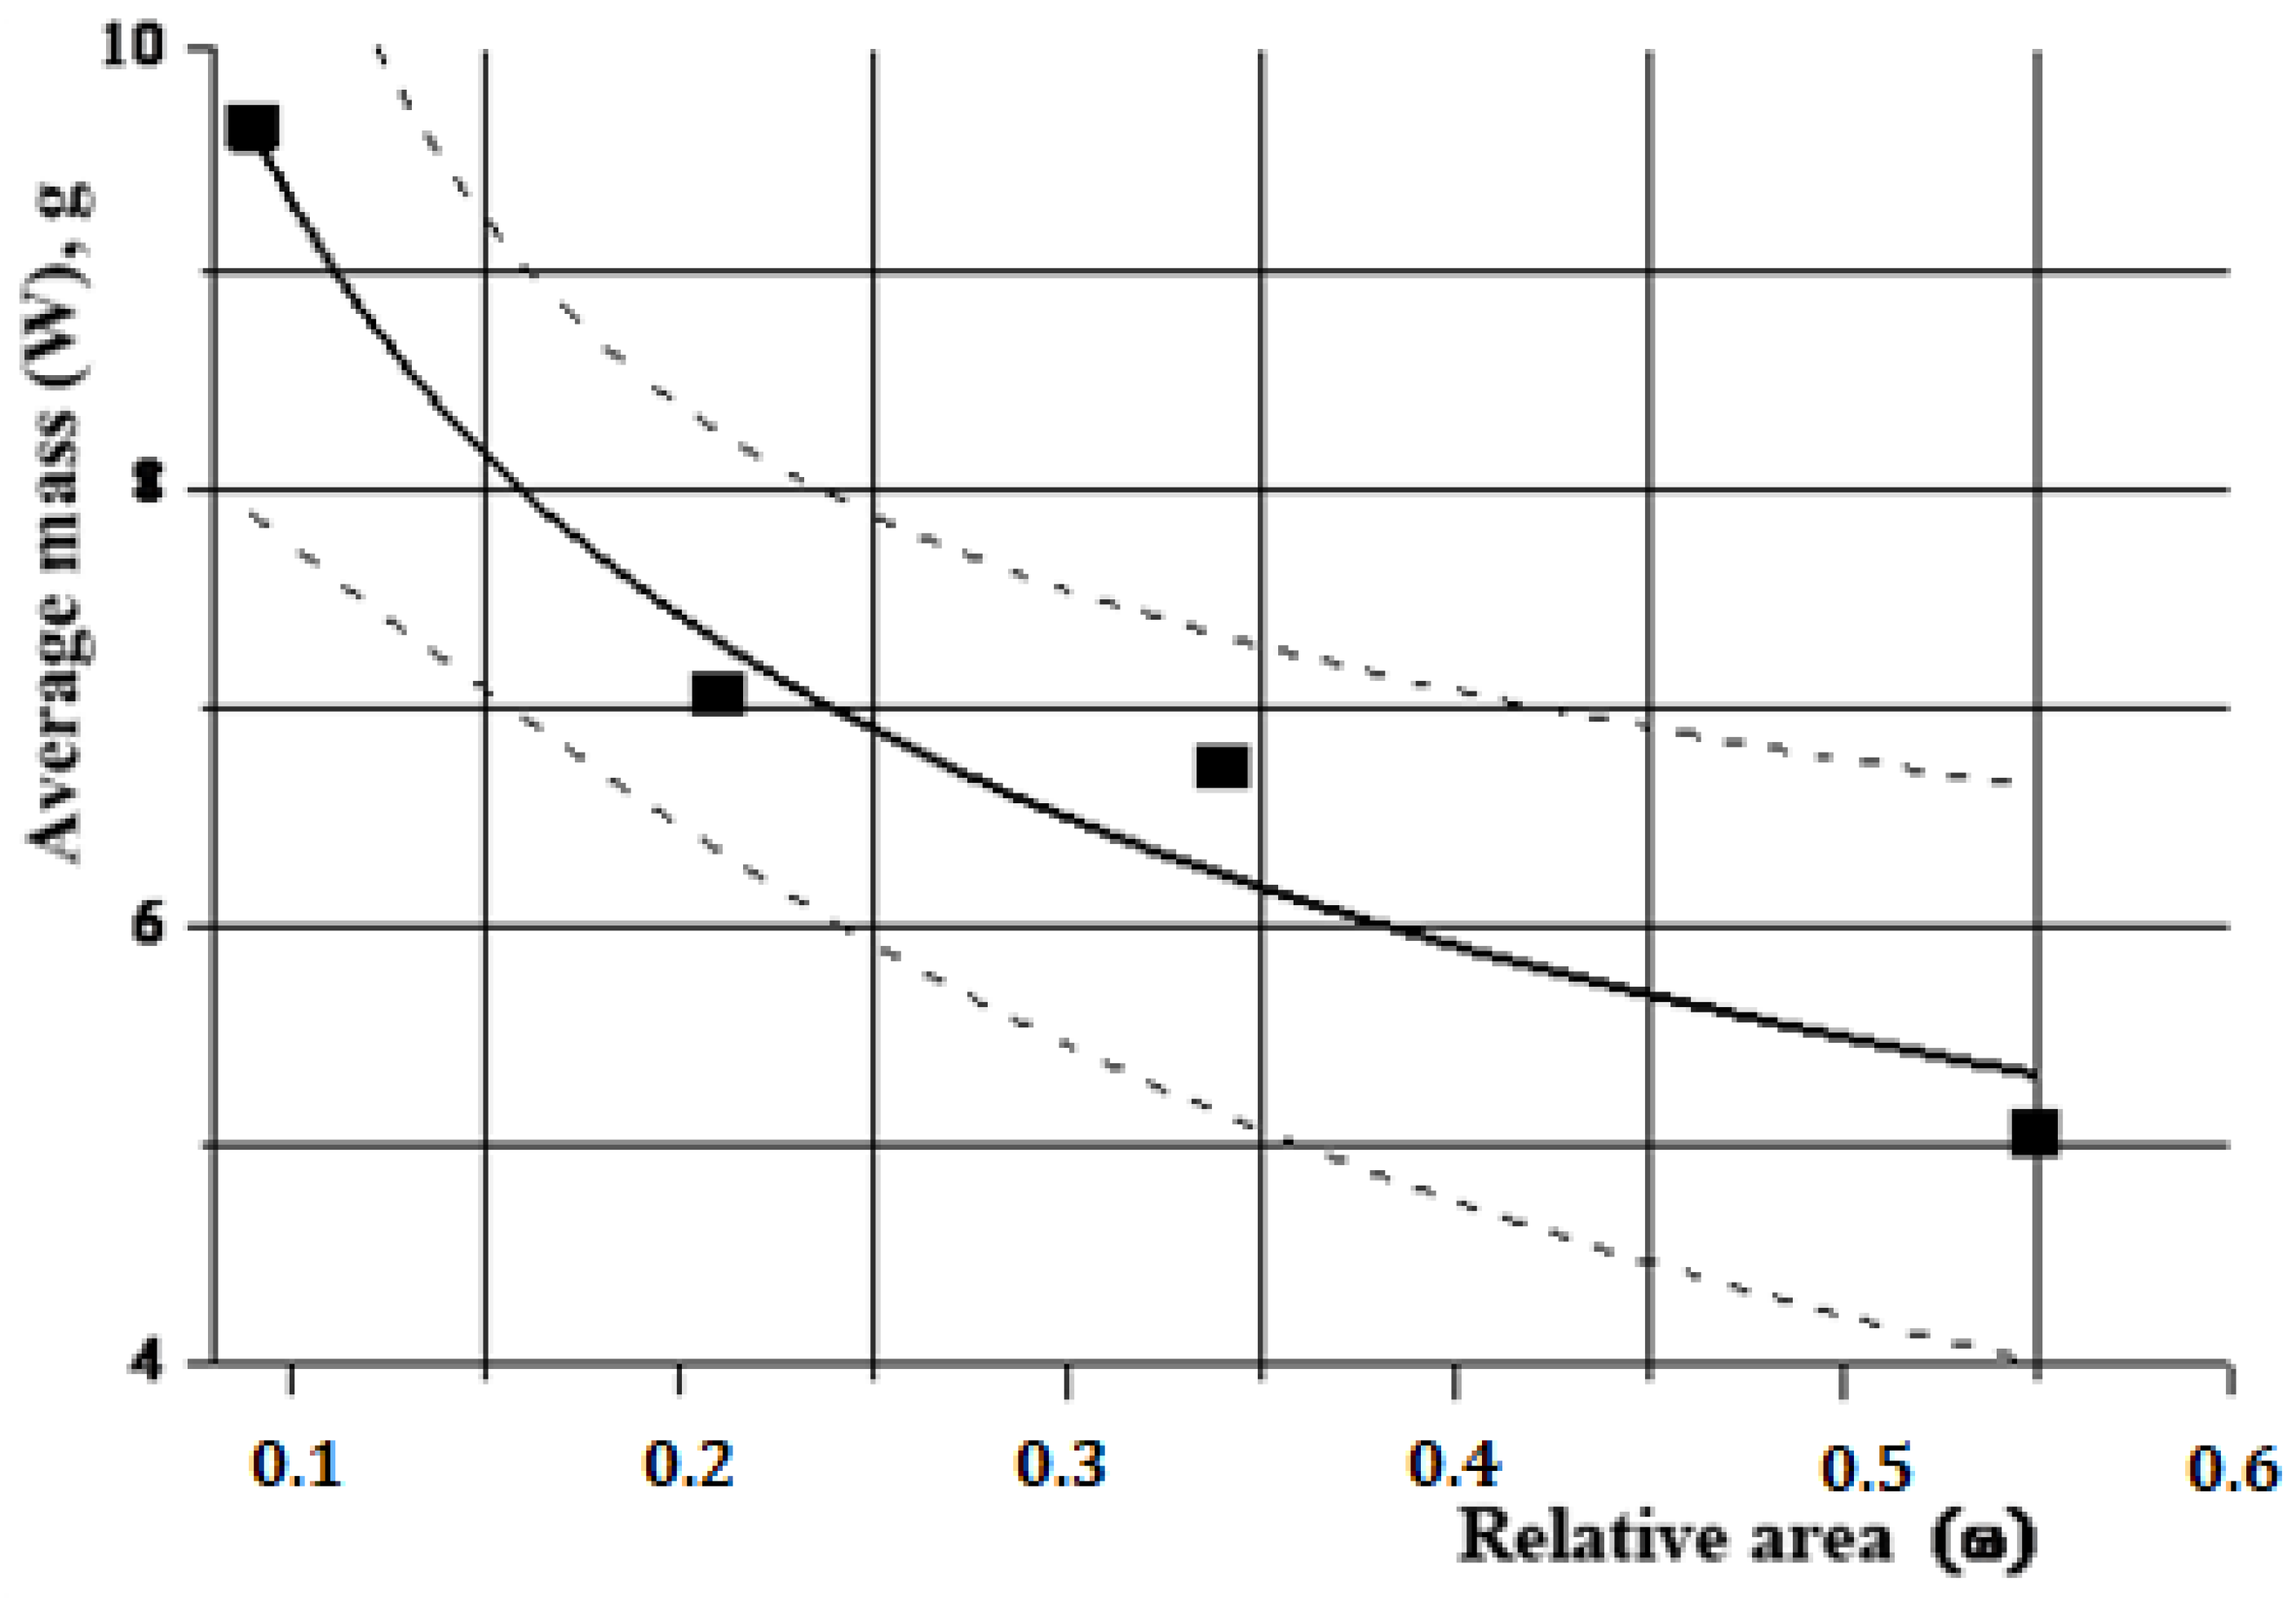
s) increase faster. On the one hand, it is due to the trophic conditions of the biotope, and, on the other, to a decrease in the length and mass of mollusks, i.e., a higher degree of their "packing". The analysis did show that the length (L, mm) and mass (W, g) of mollusks on artificial substrates depend on the relative area of the collector. At the smallest value of the ω, mollusks are characterized by significantly larger sizes (and mass) than on substrates with a higher relative area. This is indicated by Equations (3) and (4). When dividing Equation (4) by (3), we obtain that. with an increase in the ω, the average mass (W, g) will decrease in accordance with the equation:
Statistical analysis of field data showed that these differences do exist on the studied types of substrate. Thus, with an increase in the relative area and biomass, the average mass of mollusks decreases (
Figure 6). On the 1st type of collector (ω = 0.09), the average mass (W, g) was 9.7 g, while on the 2nd one (ω = 0.21) it was significantly less and amounted to 7.1 g. On artificial substrates with a larger relative area, these indicators were even lower—6.7 g (ω = 0.34) and 5.1 g (ω = 0.55). In numerical form, the relation between the relative area of the substrate and the average mass of the mollusk is well described by an exponential function (Equation (8)):
Accordingly, the relation between the average length (L, mm) and the relative area (ω) is described by the same function with different numerical values (Equation (9)):
Thus, with an increase in the relative area of the artificial substrate, the average length and mass of mussels decreases. At the same time, it should be noted that the variational series of mussels only at the early stages of development were characterized by a unimodal distribution. Then the series were stretched and quite often a two-vertex histogram of the distribution of mollusks of different size groups (from 5–10 to 50–55 mm) was observed.
The same data can be analyzed from different points of view. The area of the substrate shown in
Figure 6 shows the results of regression analysis (performed in the statistical package “Microcal Origin-8.5”) (ANOVA, Analysis of variance (New Providence, NJ, USA)) associated with changes in average weight (W) on substrates with different relative surface area (ω). Dashed lines represent 95% confidence interval.
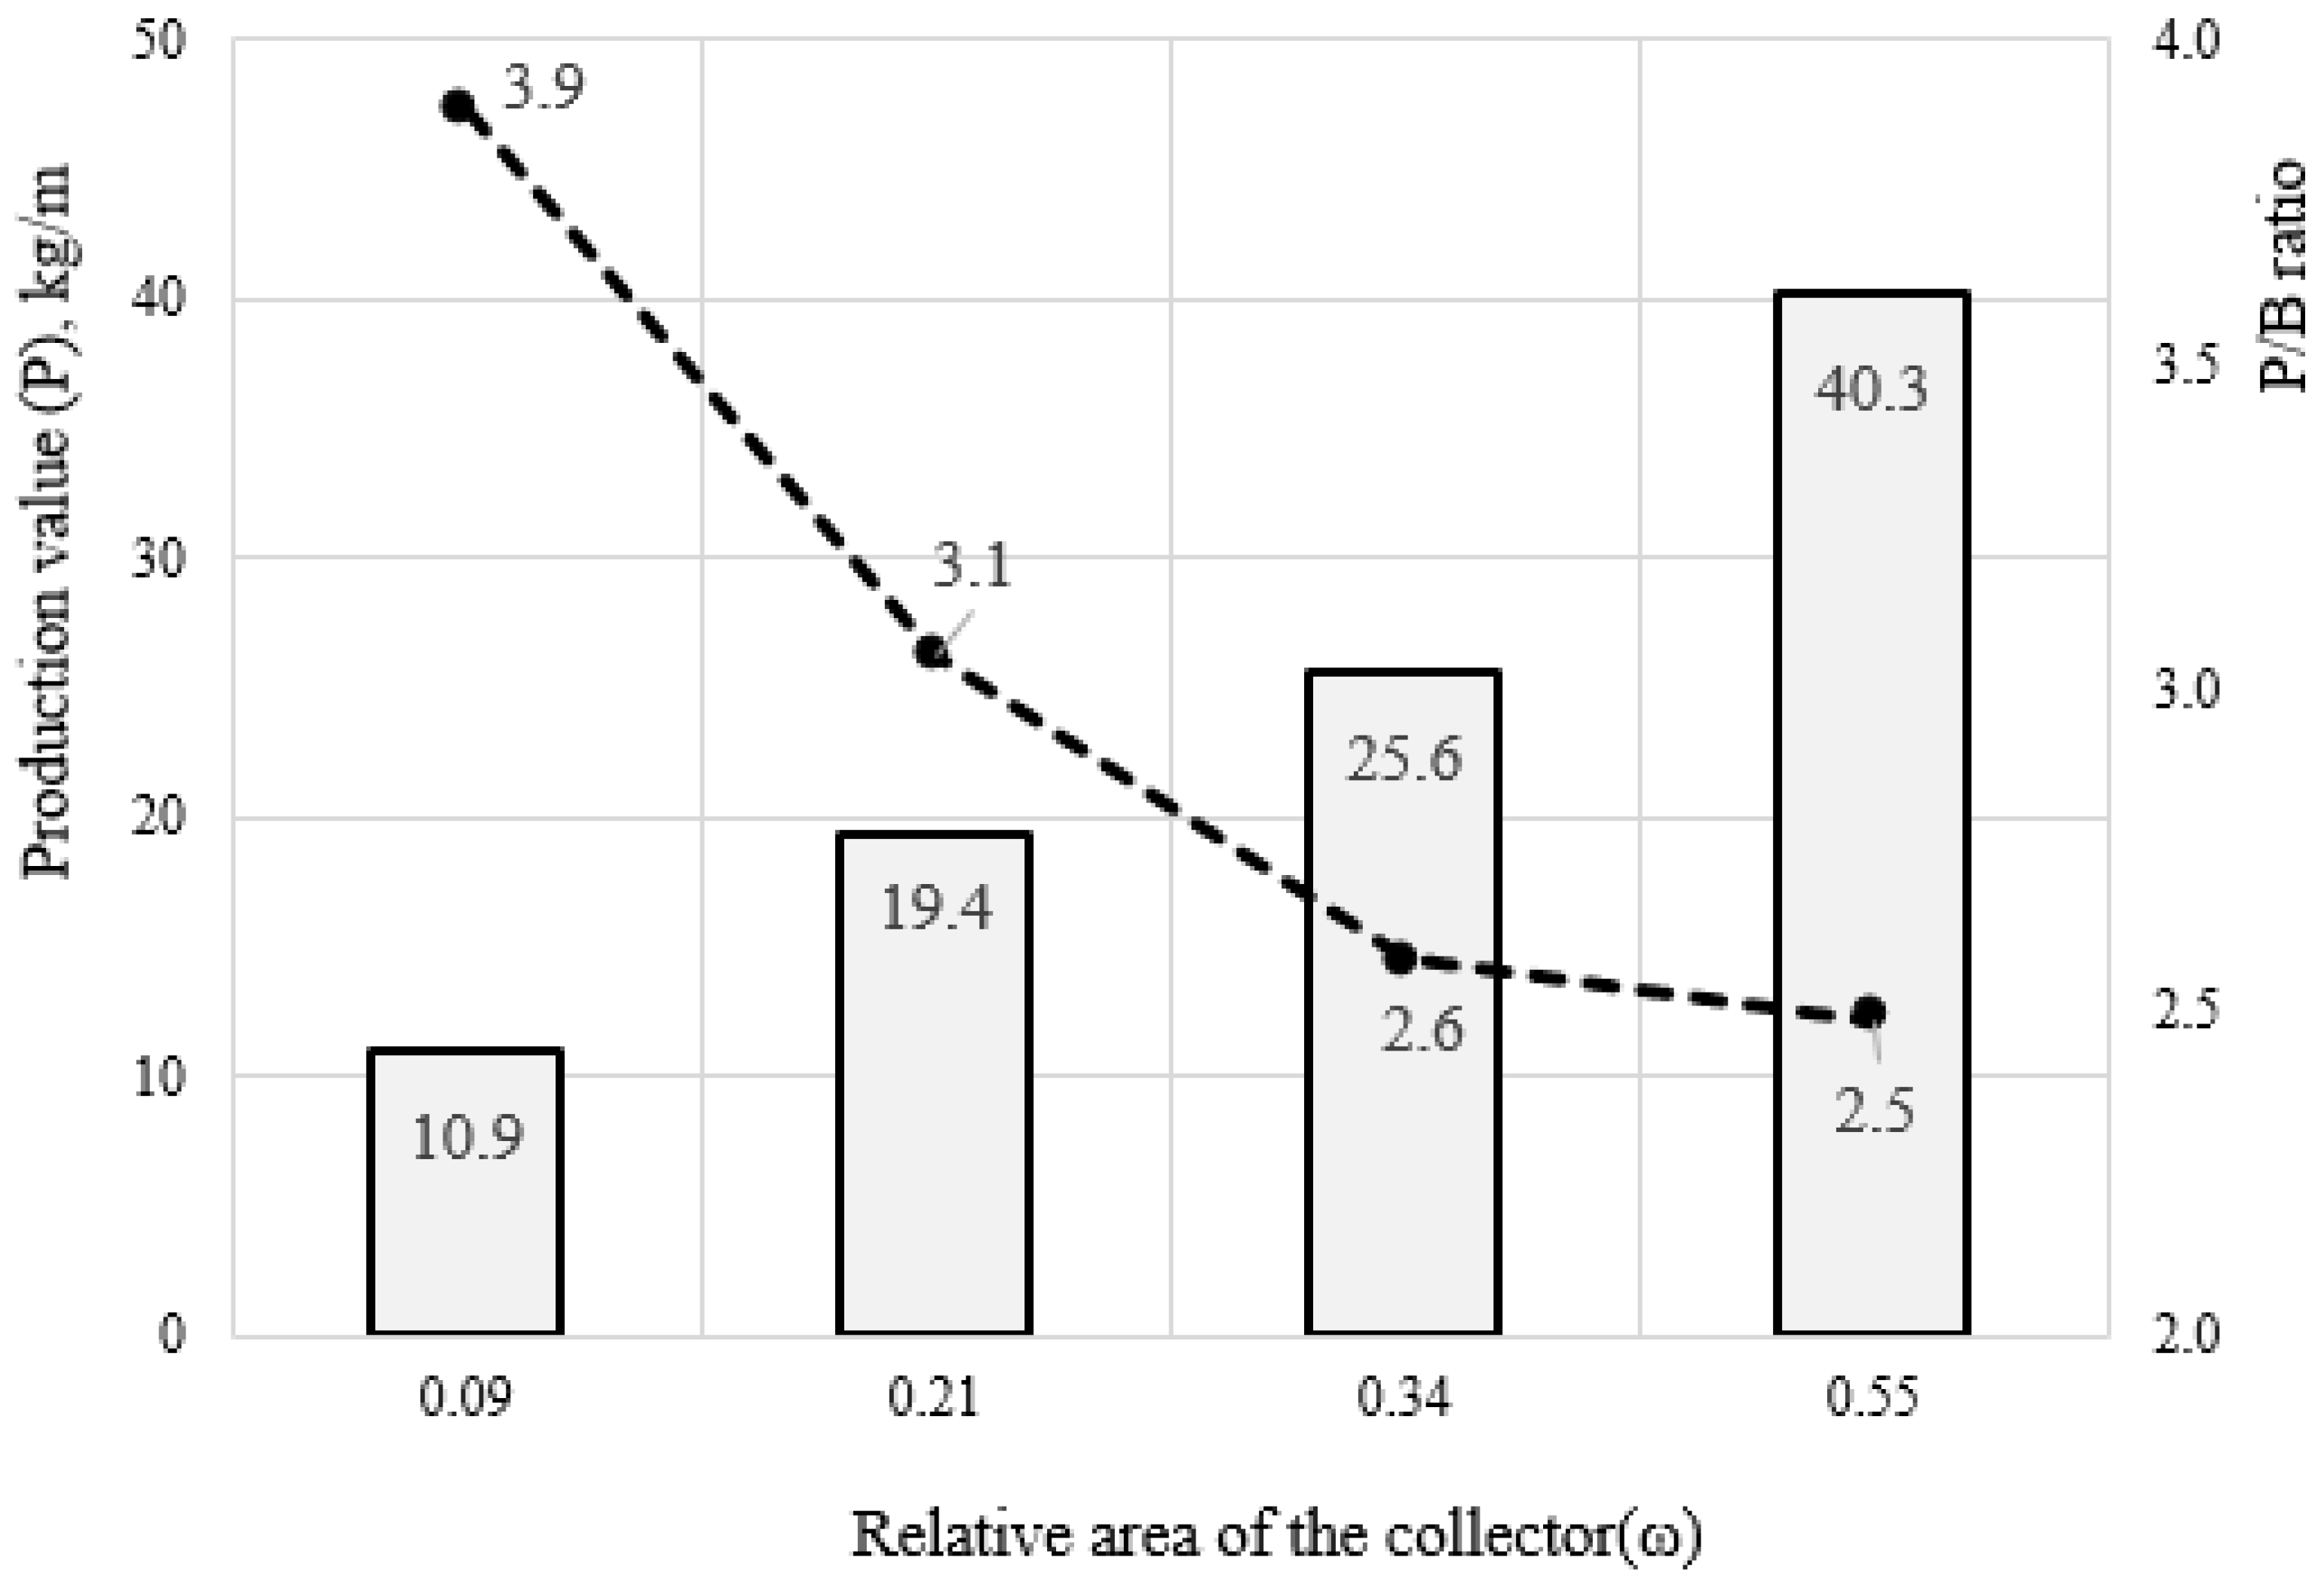
Since the change in the mass of mollusks characterizes their rate of biomass production, we studied a number of indicators of this process. The values of production (P), elimination (E), and P/B ratio were calculated for each type of artificial substrate (
Figure 7). It was found that, with an increase in the relative surface of the collector, the value of production increases from 10.9 kg/m to 40.3 kg/m. In numerical form, the relation between the value of production (P
t) and the relative area of the substrate (ω) can be expressed by the allometric equation (
Figure 7, Equation (10)):
It should be noted that most of the total production (P) was associated with its eliminated part (E), and its specific value was described by the following function:
Accordingly, the P/B ratio for different types of collectors decreased from 3.91 to 2.48 (
Figure 7, Equation (12)):
Thus, with a change in the relative area of the collector, the mussels’ production increases, but the specific production (P/B ratio) decreases.
The obtained materials also allow us to conclude that production of mollusks at the end of the cultivation cycle (≈16–17 months) in 1 m2 of the relative surface of the artificial substrate will, on average, be close to 30 kg/m. However, it will certainly depend on local conditions of ocean.
4. Discussion on the Results
Numerous studies carried out on the cultivation of mussels have shown that in most cases the spat settling density is much higher than it remains at the end of cultivation. This trend is described in various works. Different authors associate it both with the influence of environmental conditions (temperature regime, water exchange rate, freeze-up, etc.) and internal, endogenous factors (competition between individuals for food and space) [
2,
3,
4,
15,
16,
17,
18]. Studies in population ecology, conducted first on plants, and then on some animals, have shown that a decrease in density leads to an increase in the mass of some of the remaining individuals and their displacement (elimination) of less competitive organisms, i.e., self-thinning of the population occurs [
19,
20,
21,
22]. This rule is called the “−3/2 law” because the regression line connecting the average mass and population density for many organisms is close to −3/2 [
7,
23,
24,
25,
26].
In our studies on the cultivation of mussels, similar features were observed due to the structure of the substrate. Thus, each type of substrate was characterized by a certain average stationary (equilibrium) number (
Figure 1, Equation (3)), which closely correlates with their relative substrate area (ω). At the same time, the dynamics of the abundance on different types of substrate was approximated by an exponential function that significantly differed from one (1.32 ± 0.12), i.e., the number of mollusks steadily increased with the increase in the collector area. It also should be noted that, if we change the variables in Equation (3) and represent the ω as a function of the N
s, then the equation will take the following form:
This equation may be of some interest for researchers dealing with the problem of the relation between body size and density of various organisms per unit area [
23].
Simultaneously with a decrease in density during the cultivation of mollusks, their biomass increased. In each type of collector, biomass also stabilized at a certain level corresponding to the "ecological capacity" of the substrate (
Figure 3 and
Figure 4, Equations (4) and (5)). However, in this case, the relation between area and relative biomass was best described by a linear or close to it function. Field data and the obtained equation showed that, with increasing ω, the average growth rate of mussels significantly decreases (
Figure 6, Equations (6) and (9)). The largest individuals (up to 50–60 mm) and weighing 12–13 g, were on the 1st type of collector (ω = 0.09), and, with an increase in the ω, their average length and weight decreased, respectively, to 35 mm and 4.0 g.
Since any natural population is not homogeneous, it is characterized by a certain structure and the degree of filling the living space. In connection with this, here we face the ecological concept of “packing density”, i.e., the difference between the actually existing and the necessary volume of living space. It was shown that in competitive communities, where individuals compete with each other for common resources, the “packing density” always increases, reaching a maximum in a state of stable equilibrium [
7,
27,
28].
As we stated earlier, on the collectors, in spring, but especially in autumn (during the autumn mass spawning), additional spat settlement occurs. Therefore, a very heterogeneous size composition of mollusks is observed on the collectors. As a result, smaller mollusks, although partially overlapping larger individuals, nevertheless coexist successfully.
Smaller individuals use the living space (the substrate) more efficiently. Thus, in comparison with large mollusks, they faster reach a dynamically stable state—the maximum saturation density. At the same time, on collectors with the smallest value of ω, the average length and mass of mussels was the greatest (a smaller area of collector units likely favors feeding conditions, e.g., through ‘biomixing’) and these indicators decreased (
Figure 5). We believe that this may be due to the fact that a decrease in the relative area of the collector limits the high density of spat settlement. Meanwhile, on the substrates with a larger value of the ω, the “capture” of settling larvae increases.
In particular, the relative area adopted in this study is calculated as surfaces per 1 running meter (rm) of the collector length.
Figure 1 shows that for 1 m
2 it will be about 60 thousand ind./m
2, while on collectors of the 2nd and 3rd types per 1 m
2 it reached 40 and even 80 thousand ind./m
2. Thus, the density was about 200–400 thousand ind./m
2, and on the 4th type, where only one cultivation cycle was carried out, it was about 300 thousand ind./m
2.
Such a significant difference in the density of the settled spat indicates that at the early stages of ontogenesis on an artificial substrate the so-called “Group effect” (self-thinning, group mass effect) already begins to appear. It means a decrease in the average size and weight of individuals depending on the population density [
9,
12,
20,
22,
29].
That is why, on collectors with a larger relative area and biomass, this effect is more evident. Therefore, in our opinion, with an increase in the relative area of the substrate during the cultivation process, there is a decrease in the average length and mass of mollusks. Consequently, a decrease in the value of the ω increased the intensity of intraspecific competition for living space, in comparison with collectors with a higher value of the relative area. Thus, an increase in the collector area increases the overall population density and "packing density" of mollusks in a limited volume. At the same time, a number of studies have shown [
30] that the smaller this “island of life” (collector) is, the better the hydrodynamic regime of flow around the substrate together with the living population, the conditions for providing mollusks with trophic material, the efficiency of metabolism and growth. However, the effect of autometabolites on individuals of the same population is less.
It is also necessary to consider in detail the production parameters of mussels cultivated on different types of collectors. The very fact that the growth rate on them was significantly different indicates a different value of the production rate (
Figure 7). Calculations have shown that productivity is highest on the 1st type of substrate (ω = 0.09), and then it increases as the value of the ω increases (extensive type of formation due to high biomass, but reduced growth rate). At the same time, the specific production (P/W ratio), with an increase in the collector area, decreased (in English-language articles, the opposite ratio is often used—B/P, i.e., the turnover rate). However, it should be noted that the total production is calculated as the increase in biomass between two sampling periods (t
1 and t
2), including the increase in biomass of eliminated mollusks. It also turned out that the eliminated biomass is the highest in collectors with the smallest value of the ω, and with an increase in the latter, the rate of elimination decreases. This is an additional argument in favor of the assumption about the influence of the ω on the density and growth rate of the population.
The above results were based on the materials obtained in the Kerch Strait. Thus, it is of interest to determine the boundaries and the possibilities of their application for other regions of the Black Sea. The research was also carried out in the Tendra Bay of the northwestern part of the Black Sea, which is close to the Kerch Strait in its ecological parameters. The analysis showed that the values of mussels’ cultivation on the 1st and 2nd types of collectors were close to 3.1 and 6.6 kg/m, which corresponds well to the above Equations (3) and (4). The data on the cultivation of the species in areas that differ from the Kerch Strait in oceanological characteristics, and primarily in trophic conditions, is of a particular interest. For example, the water area of the Donuzlav Lake differs from the strait in its higher primary water productivity [
31].
It would also be convenient to perform computation processes with predictive values using the apparatus of neural networks or artificial intelligence technologies [
32,
33].
The results of cultivating mussels in the Donuzlav Lake, carried out on the 1st and 3rd types of collectors, were quite similar to the Kerch Strait—4.1 and 12.7 kg/m—but nevertheless were higher. Since the Donuzlav Lake is one of the most hypertrophic regions of the Black Sea, where the level of phytoplankton and suspended organic matter (SOM) development was approximately 1.5 times higher than that of the Kerch Strait, it seems very likely that biomass and productivity in the lake can be higher than in other areas of the Black Sea. However, it should be noted that only one cycle of mussel cultivation was carried out on each type of collector and it is possible that during several cycles, as on other types, the values would be somewhat different.
Thus, the data obtained indicate that during the mussels’ cultivation, processes of self-regulation of density and biomass occur. This is due to the competition between individuals for the substrate (living space), implemented by feedback mechanisms between the abundance and mass of mollusks, which, in turn, depend on the relative surface (ω) of the used artificial substrates.


