
Assessment of Remote Sensing Techniques Applicability for Beach Morphology Mapping: A Case Study of Hvar Island, Central Adriatic, Croatia


Abstract
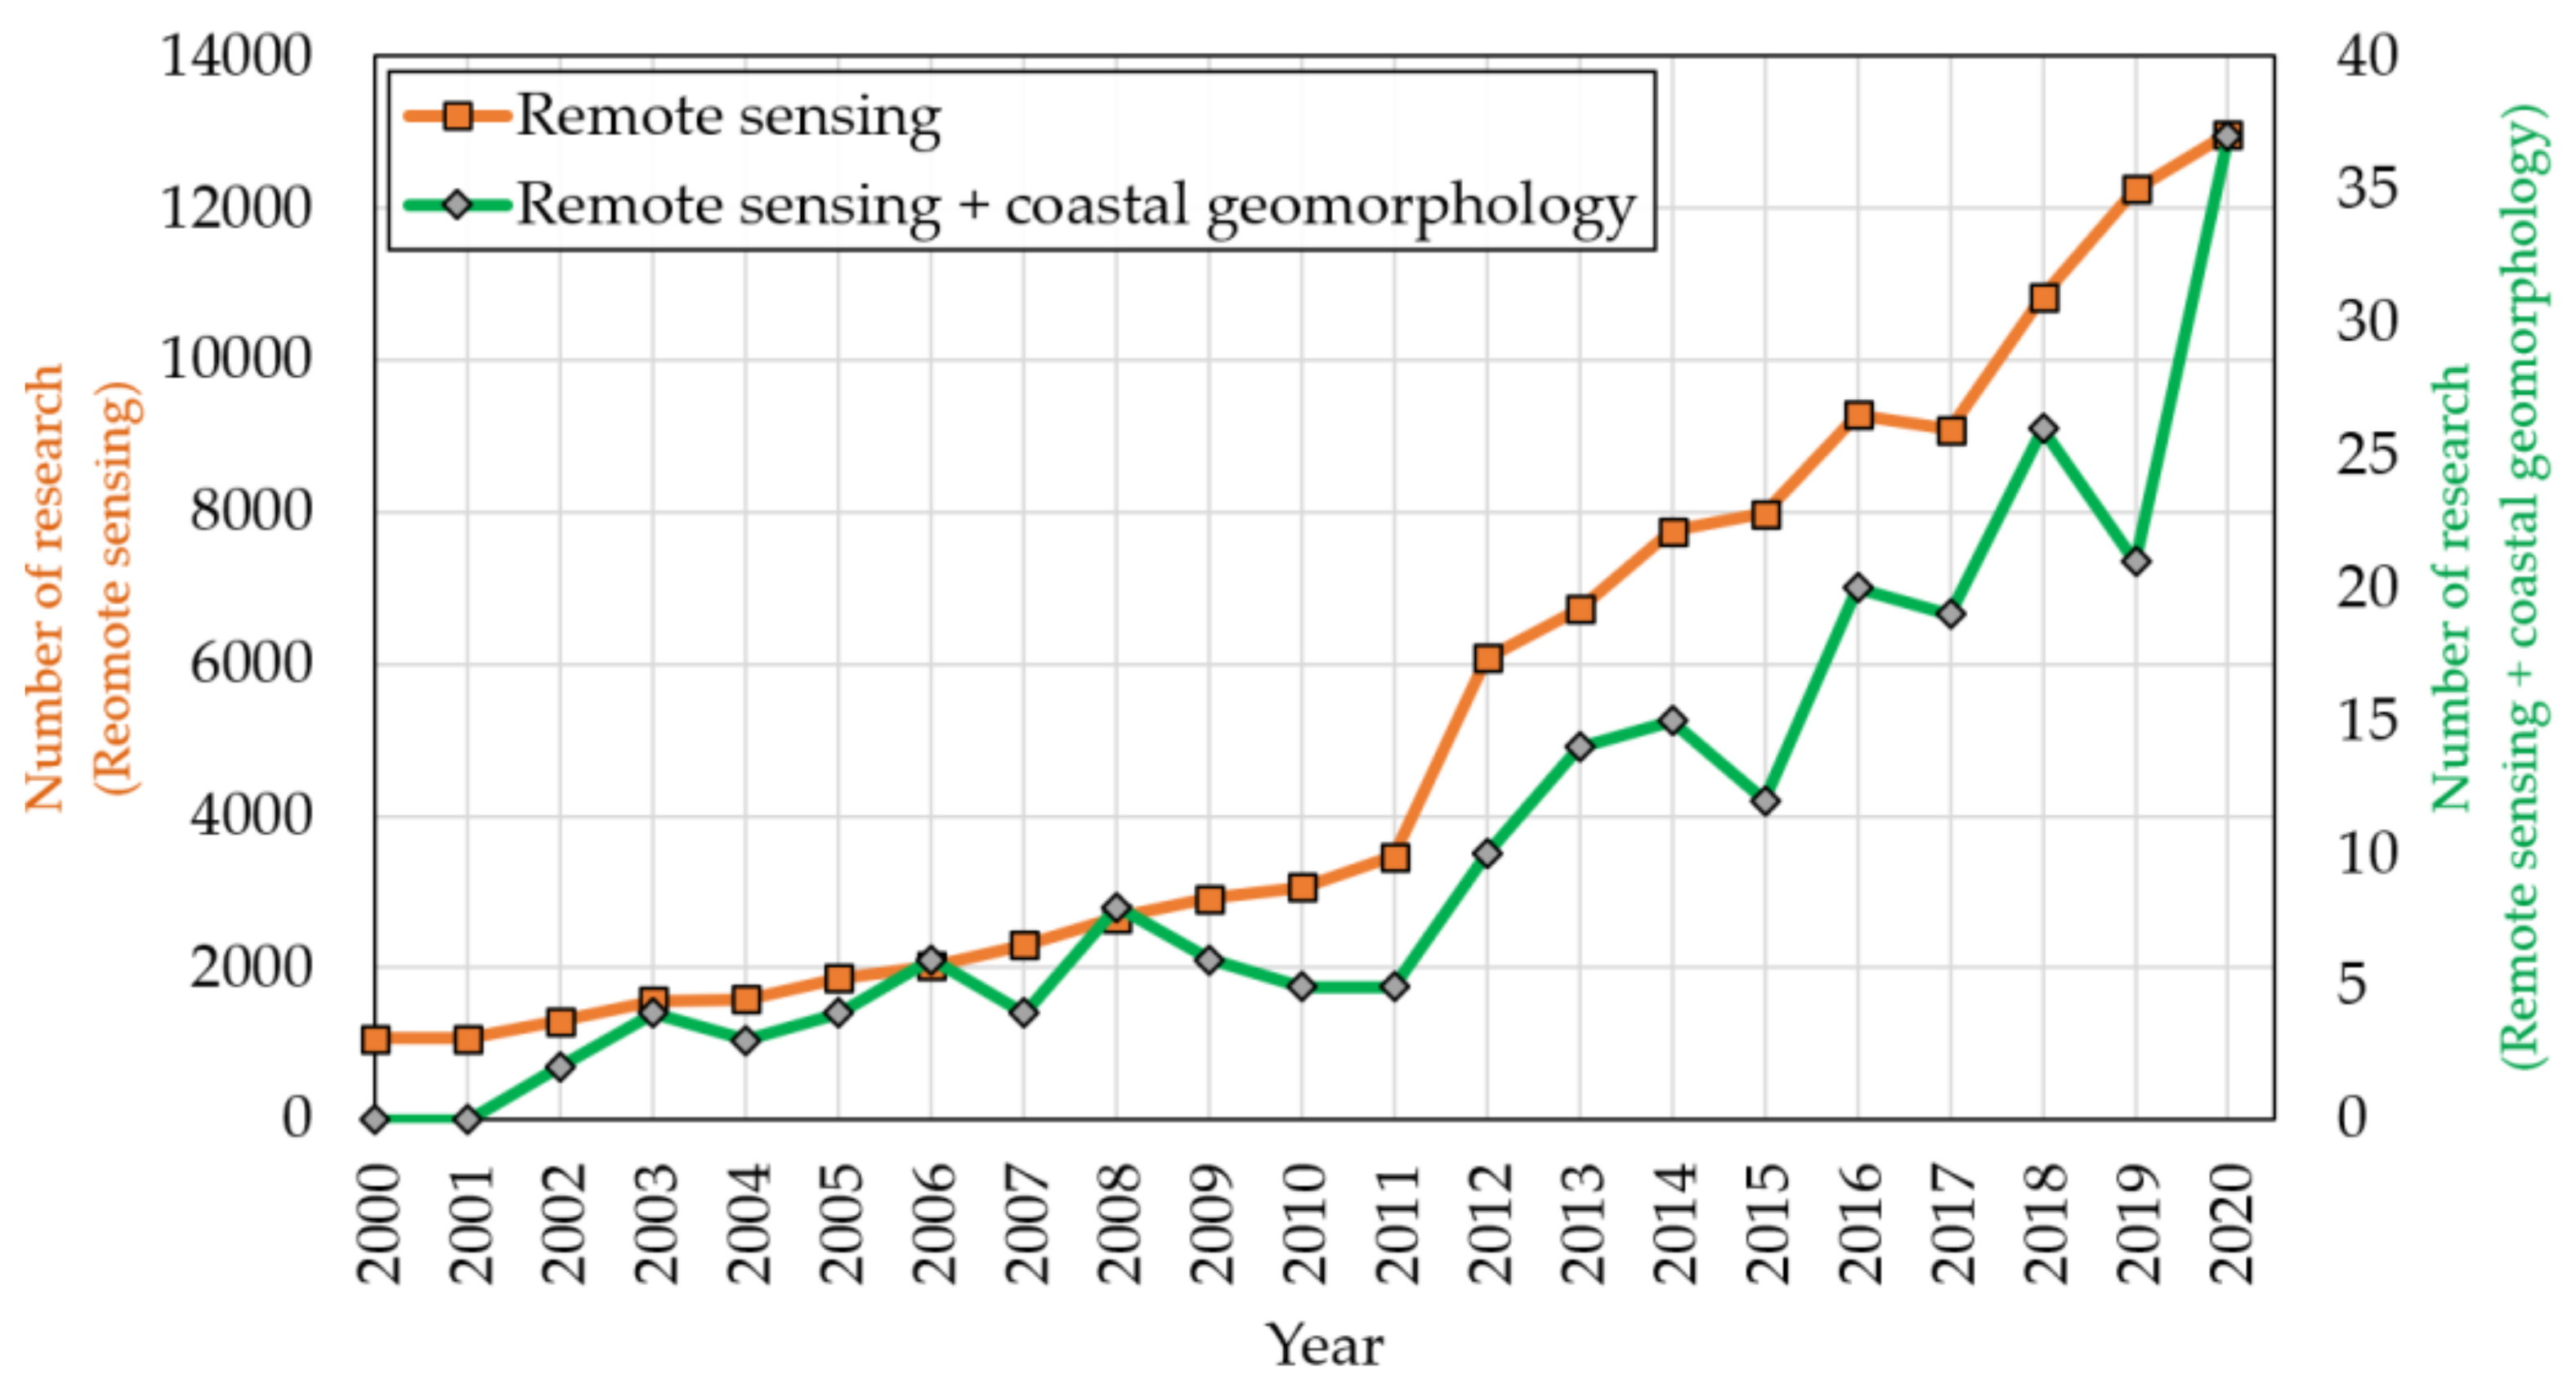
:1. Introduction
2. Remote Sensing Techniques in Geomorphological Investigations
2.1. Satellite Images
2.2. Unmanned Aerial Vehicle (UAV)
2.3. Investigations of Beach Morphology
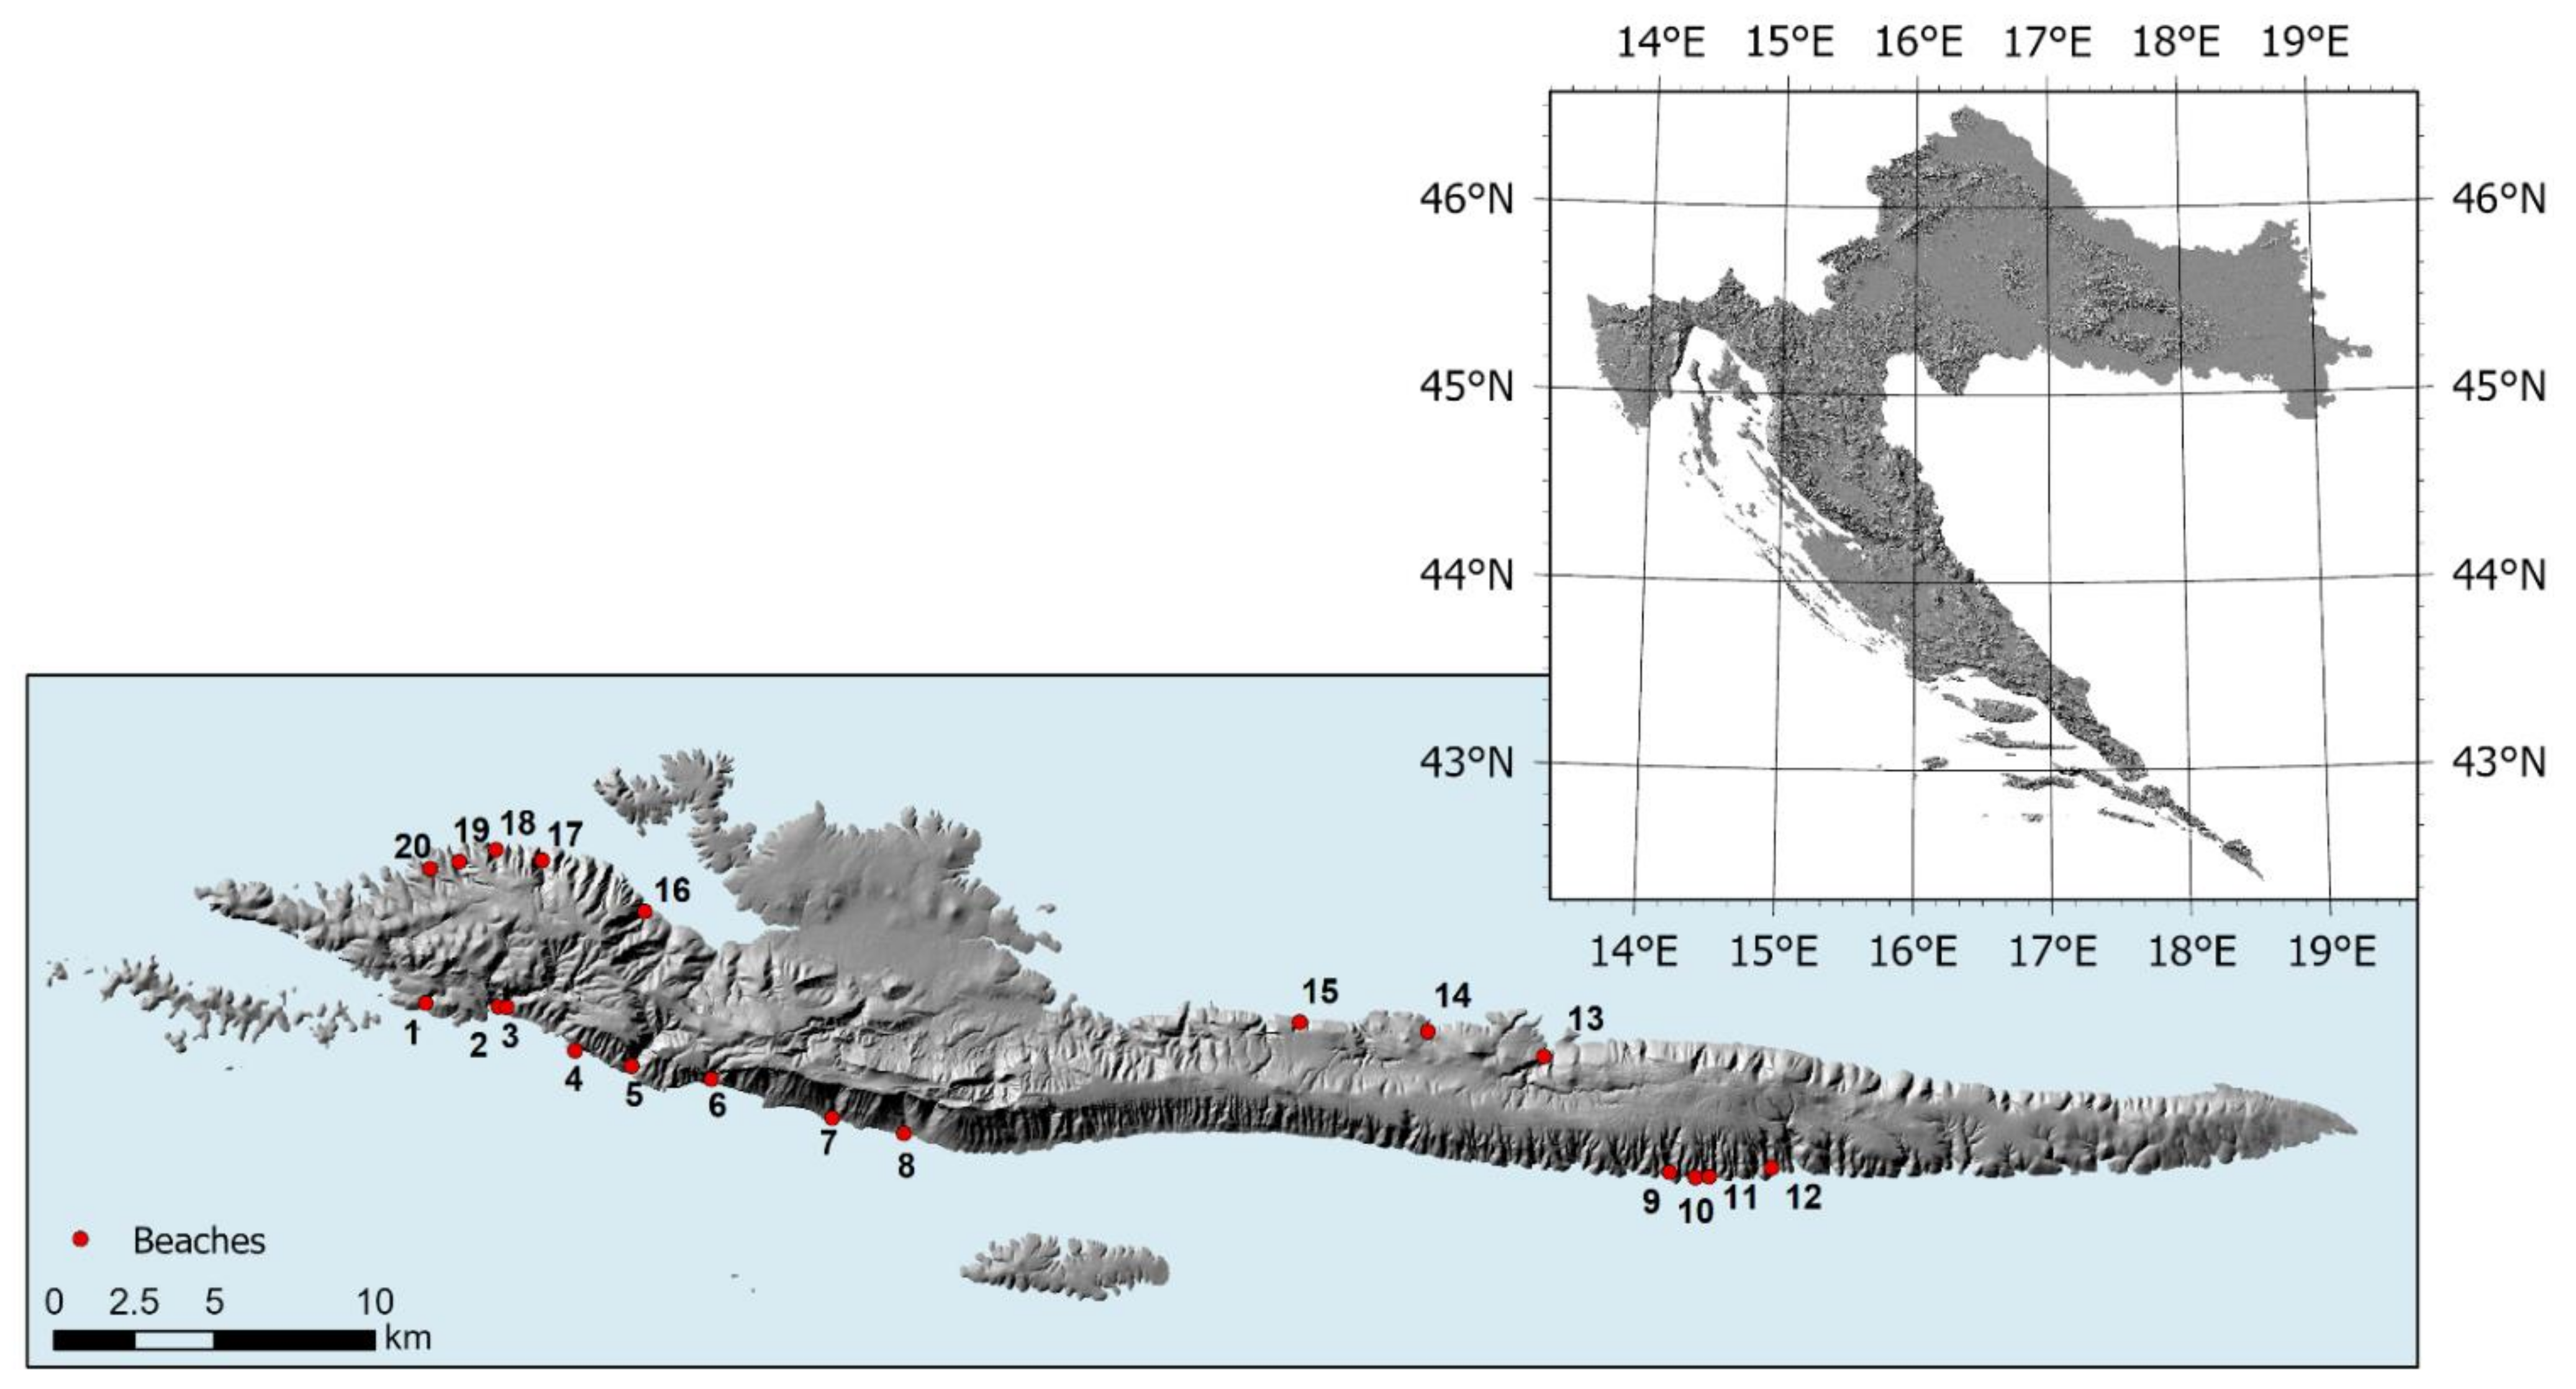
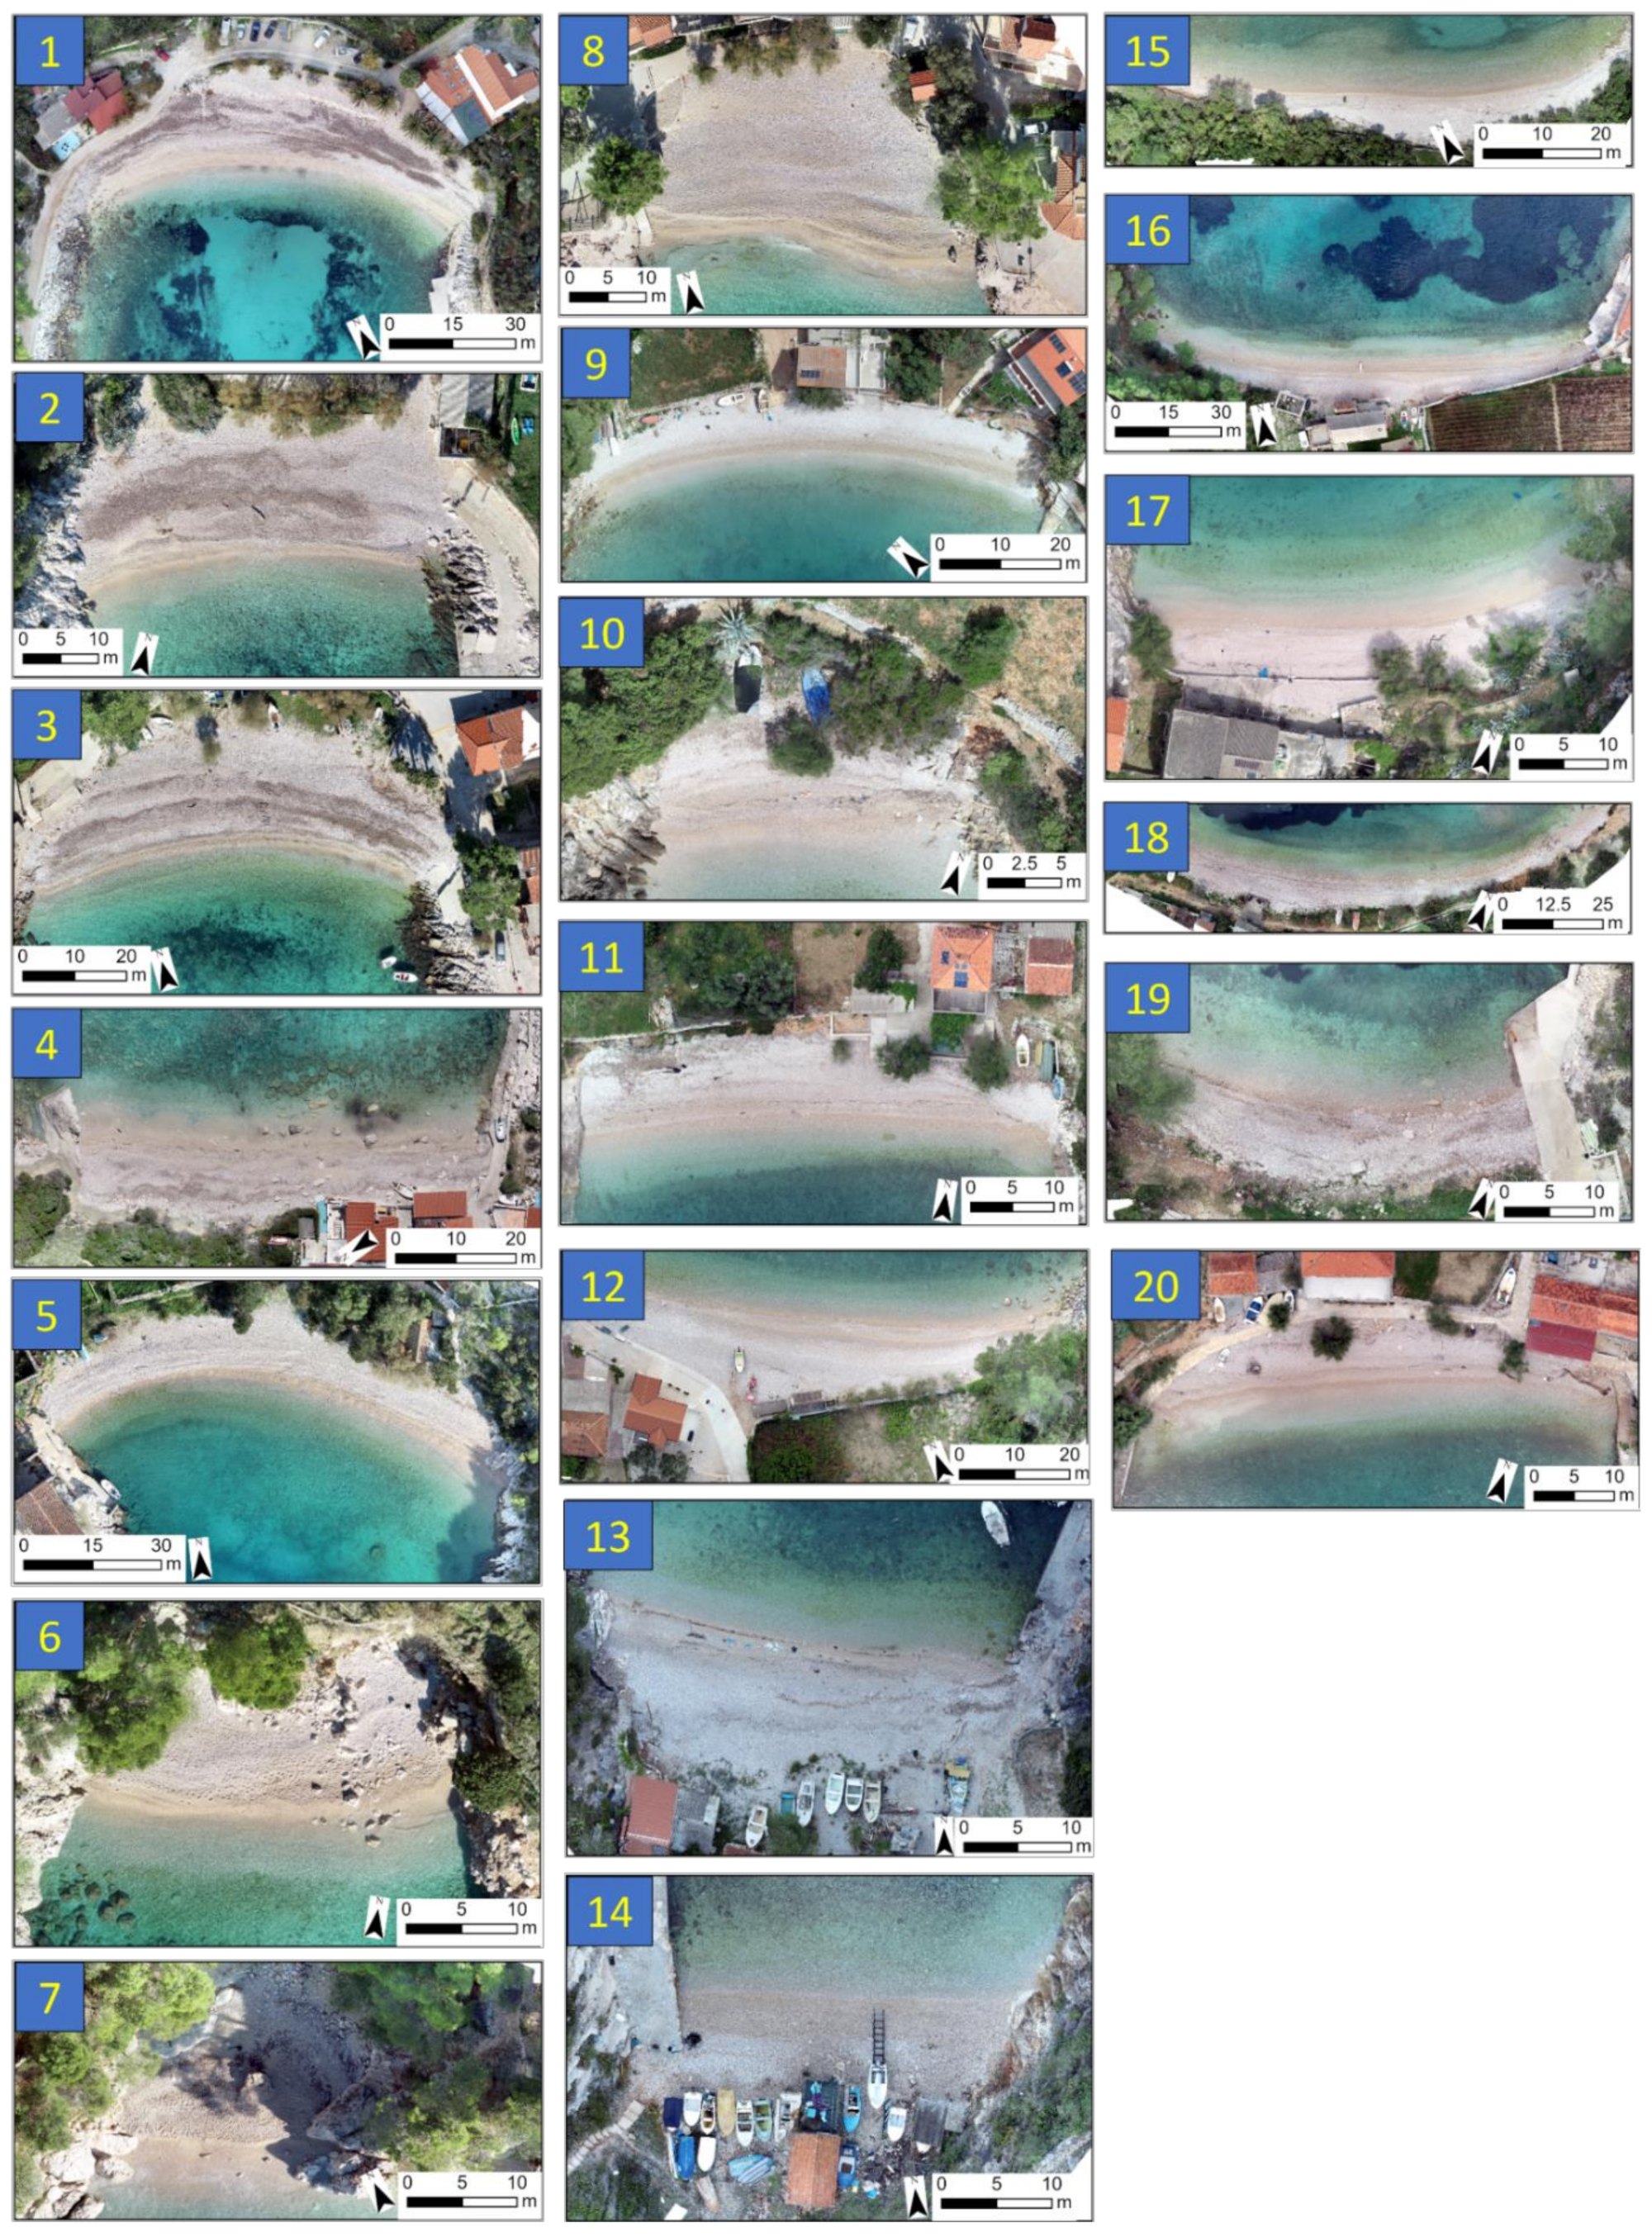
3. Study Area
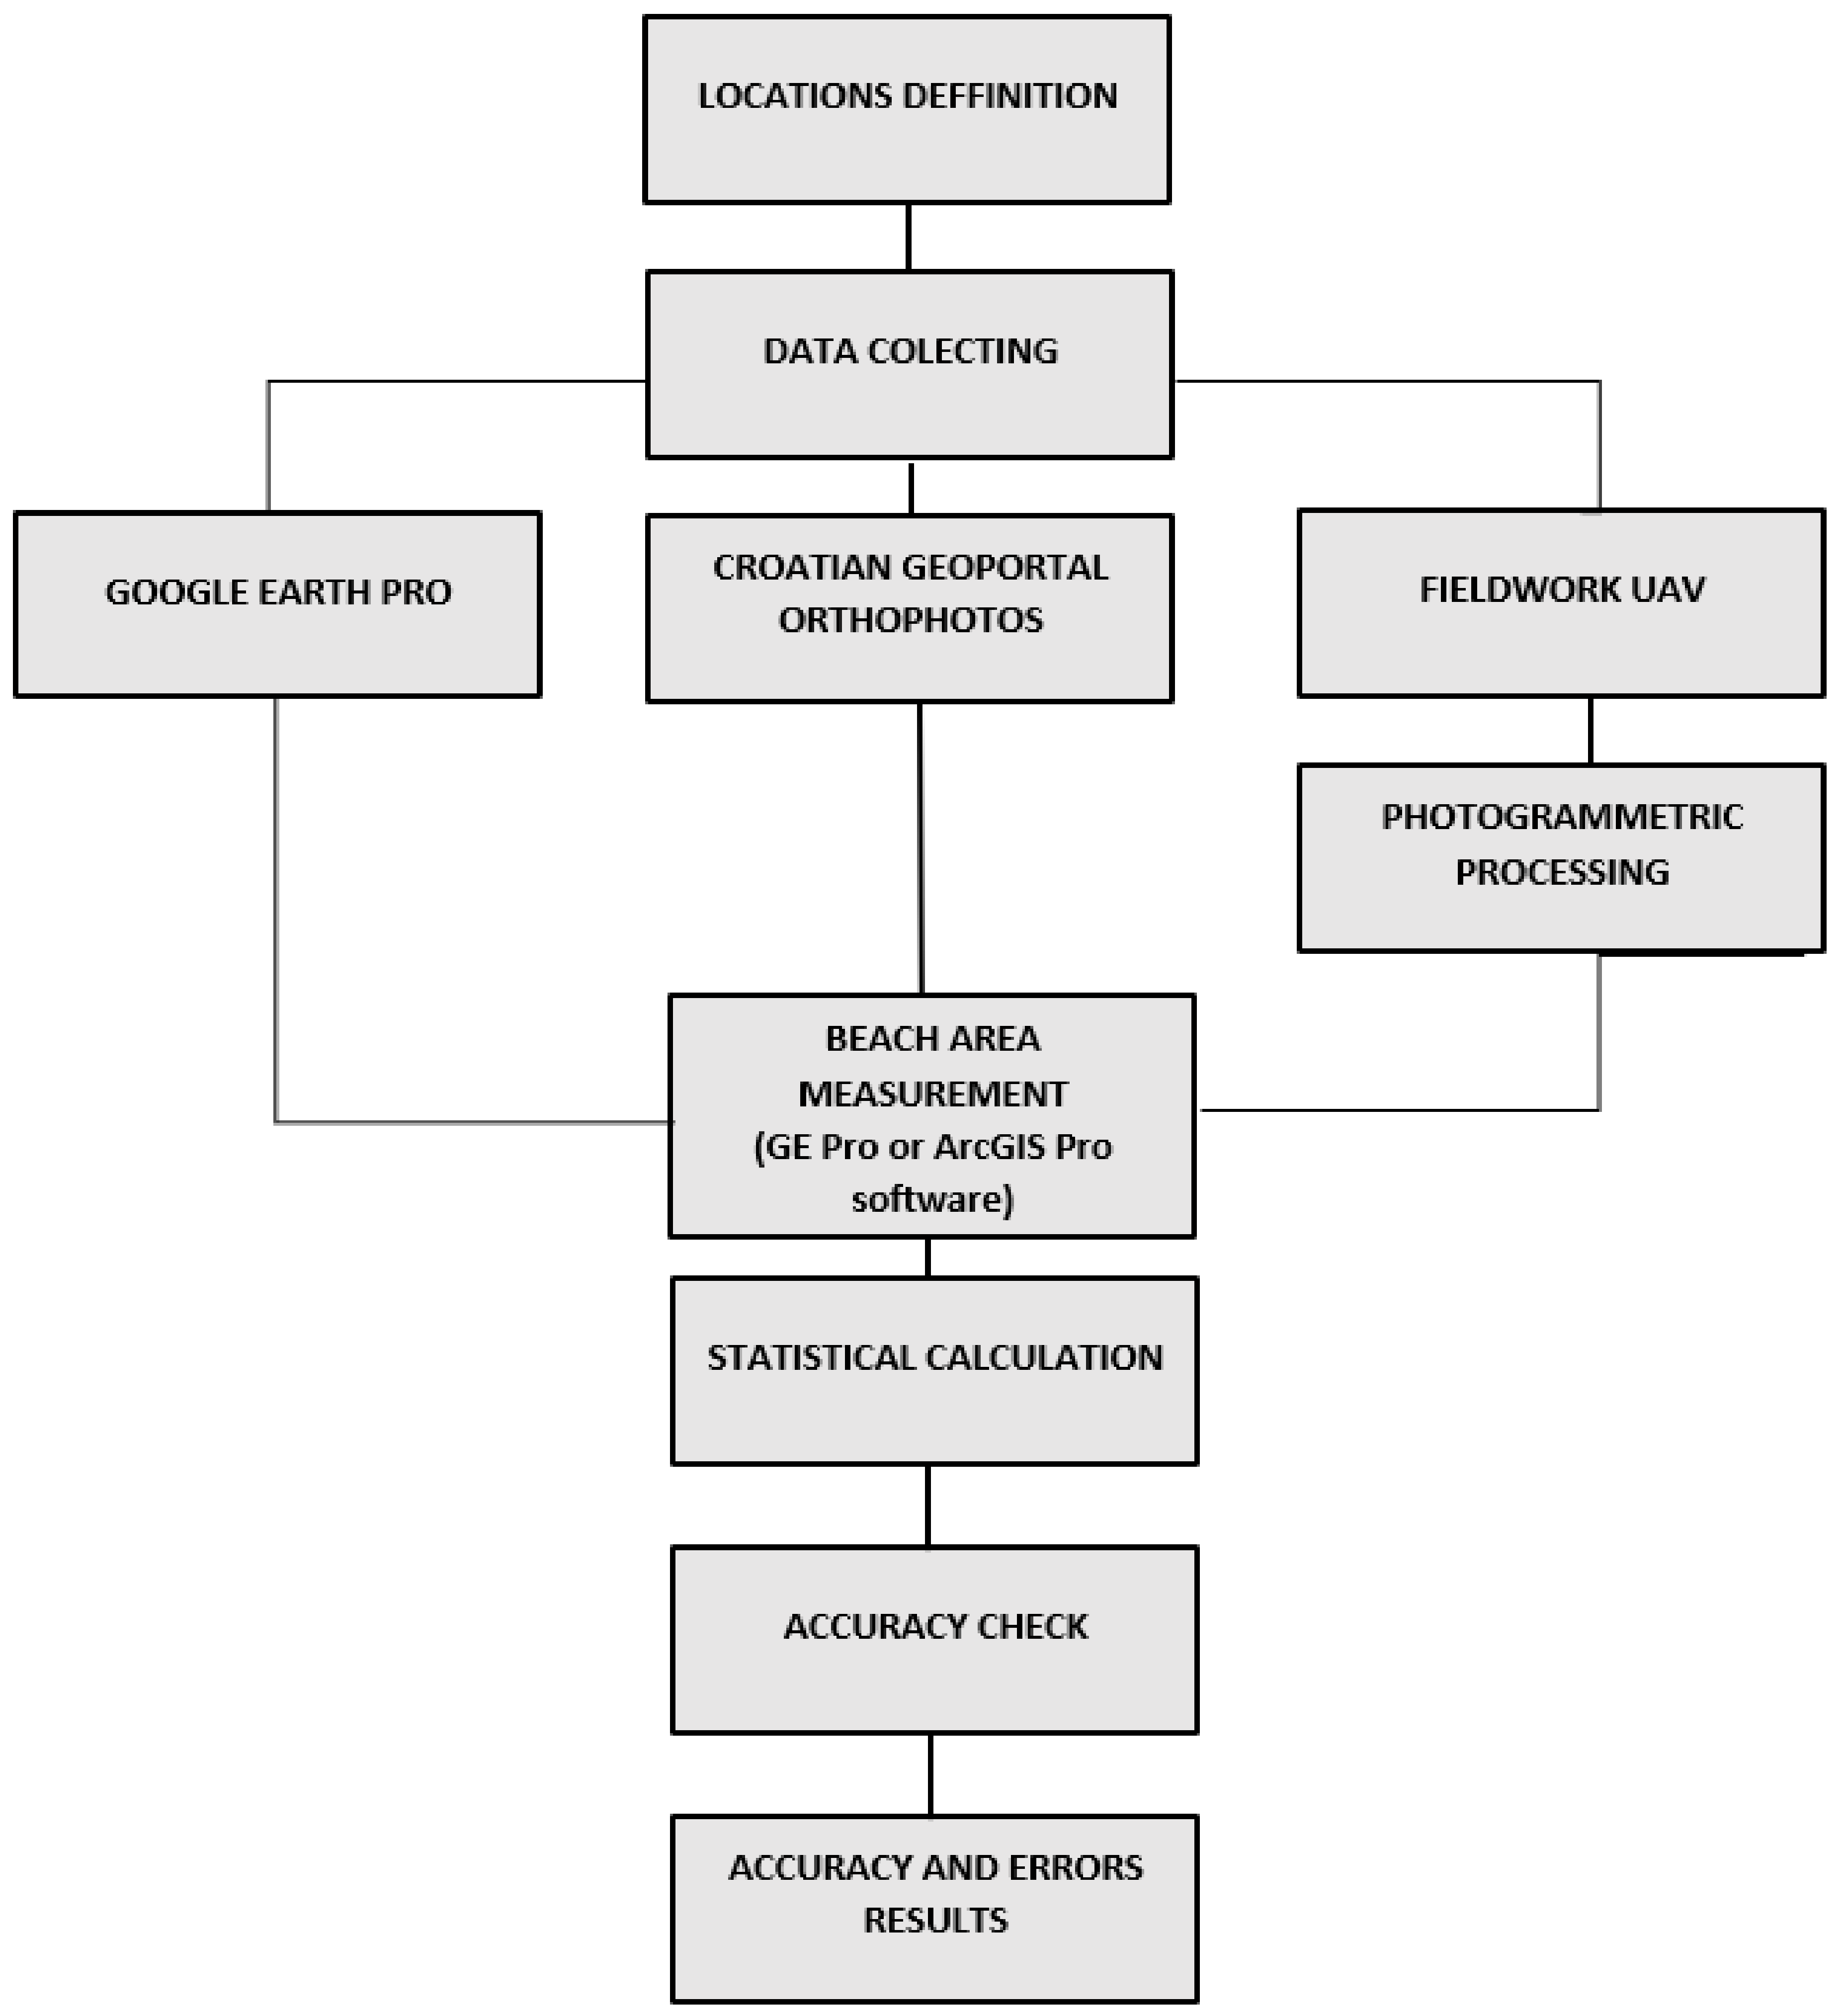
4. Methods and Materials
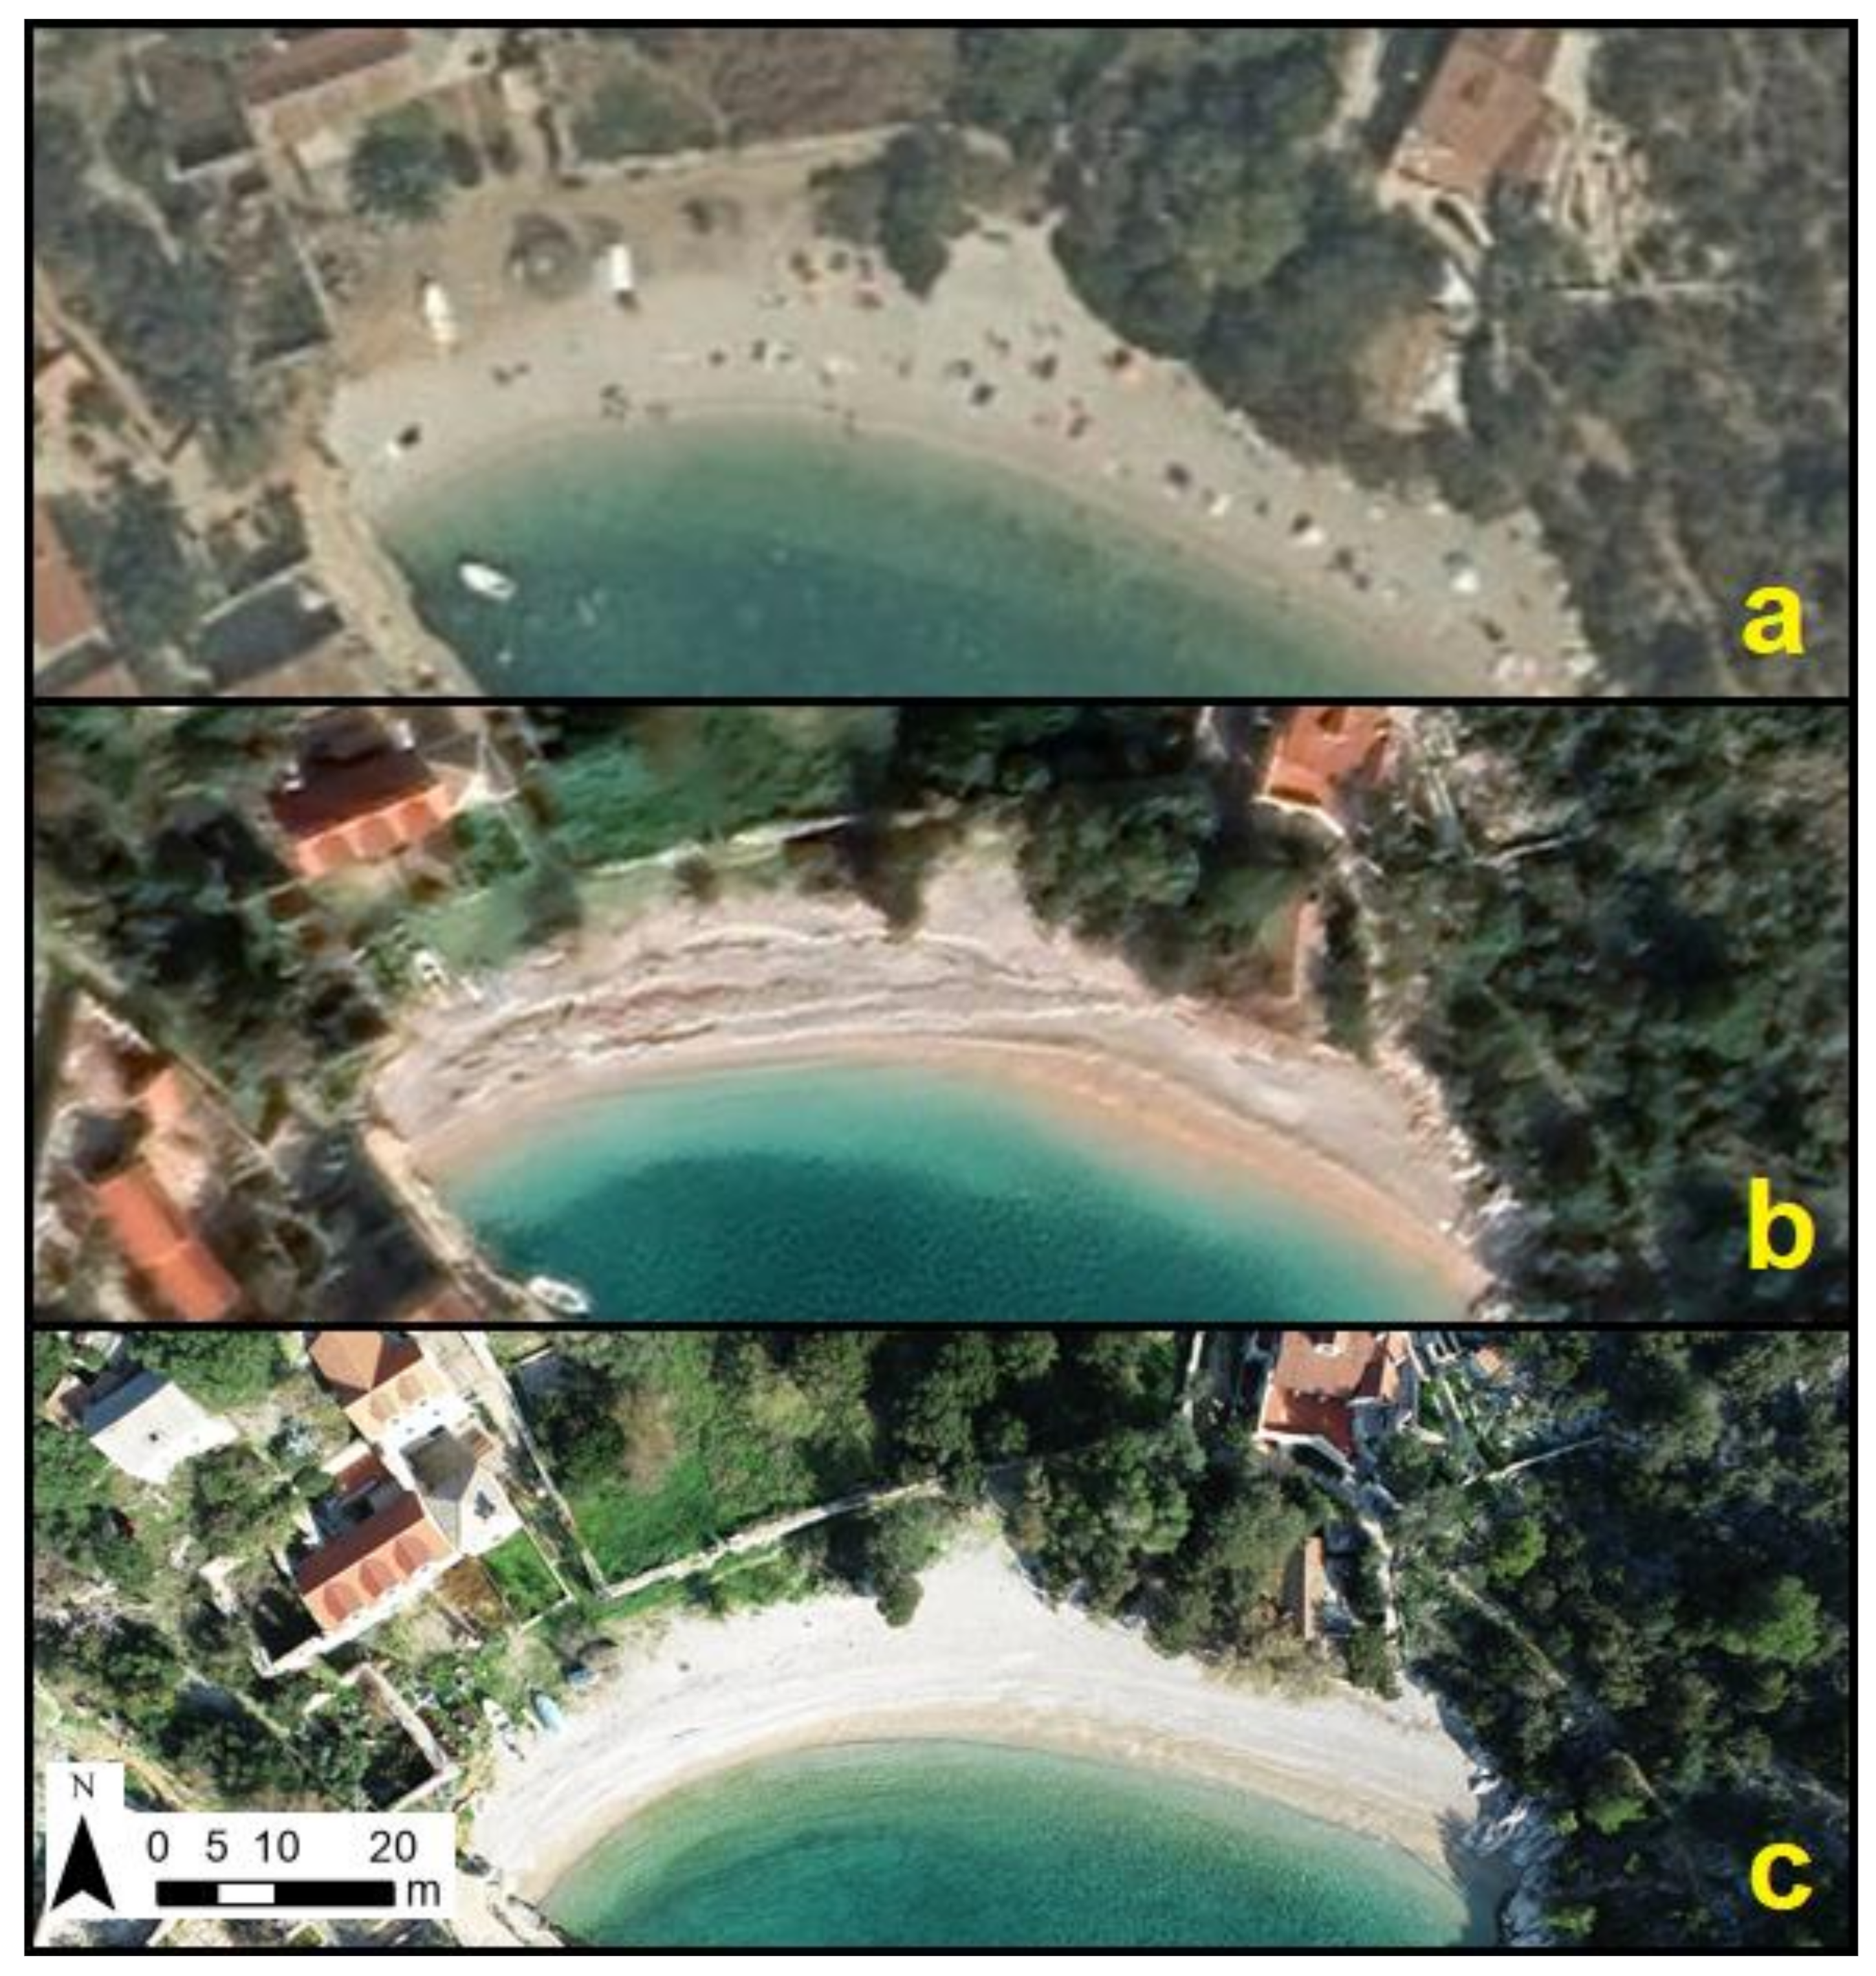
4.1. Data Acquisition
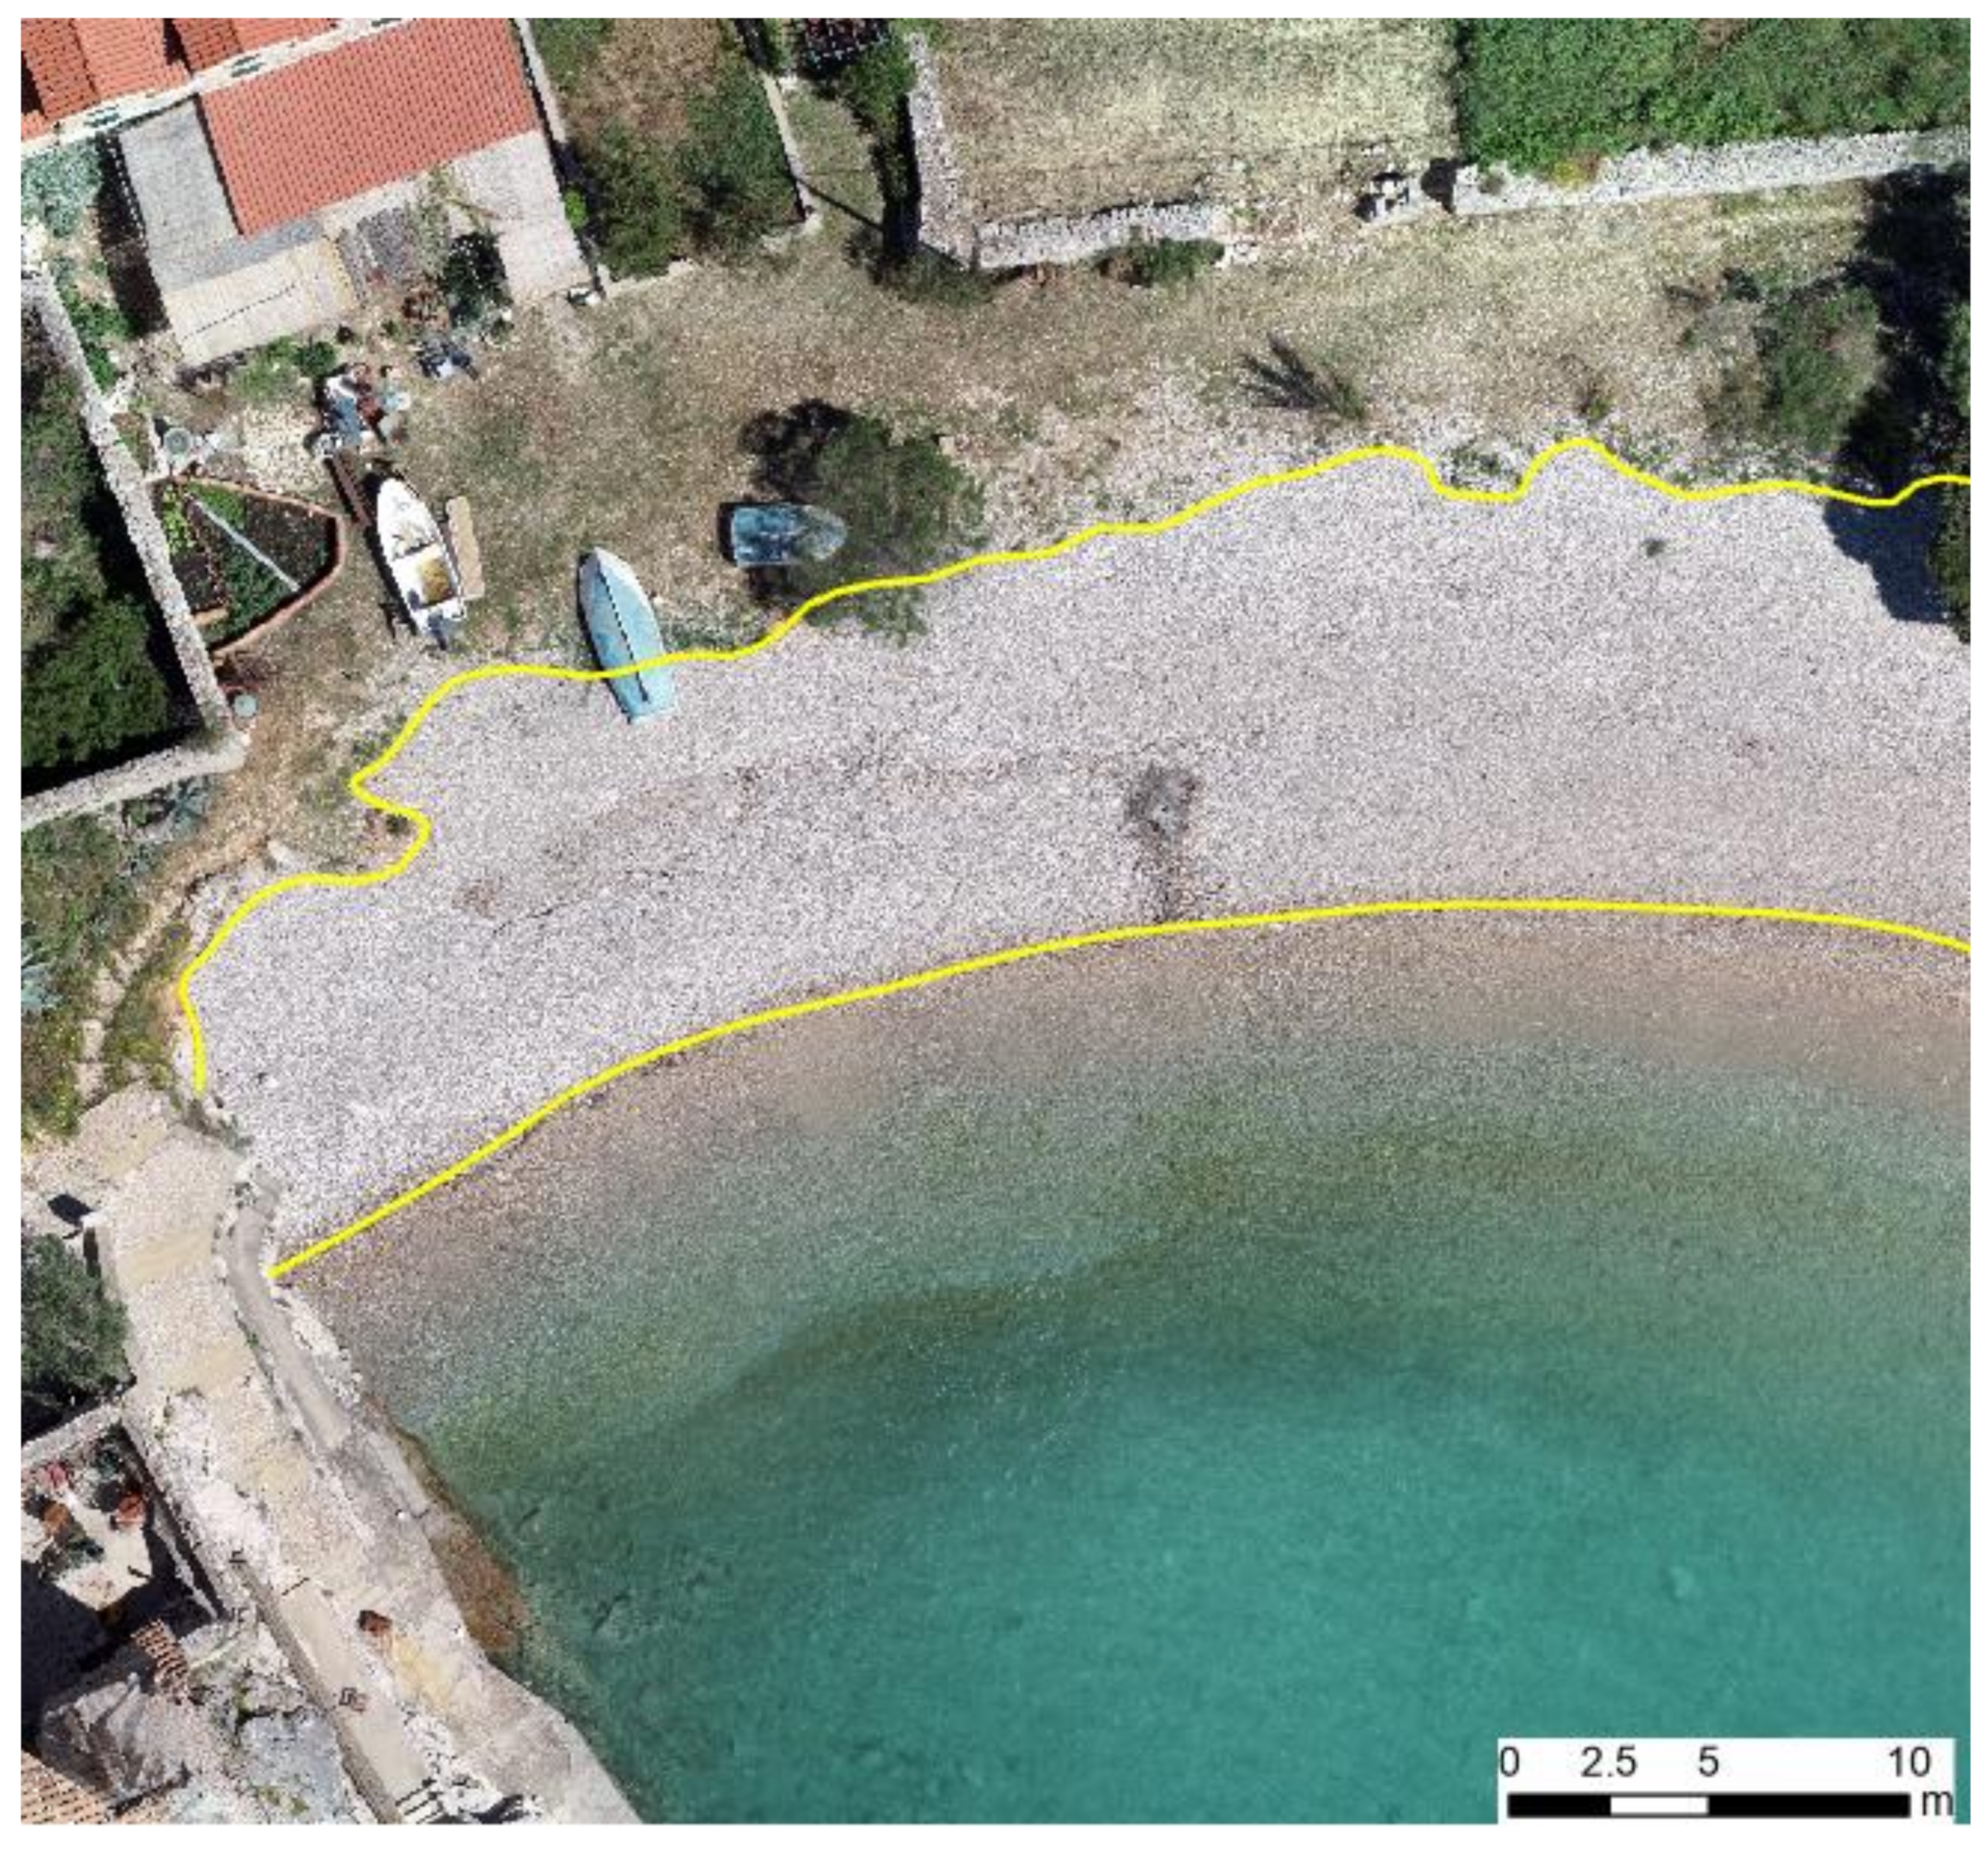
4.2. Measurements and Accuracy Assessment
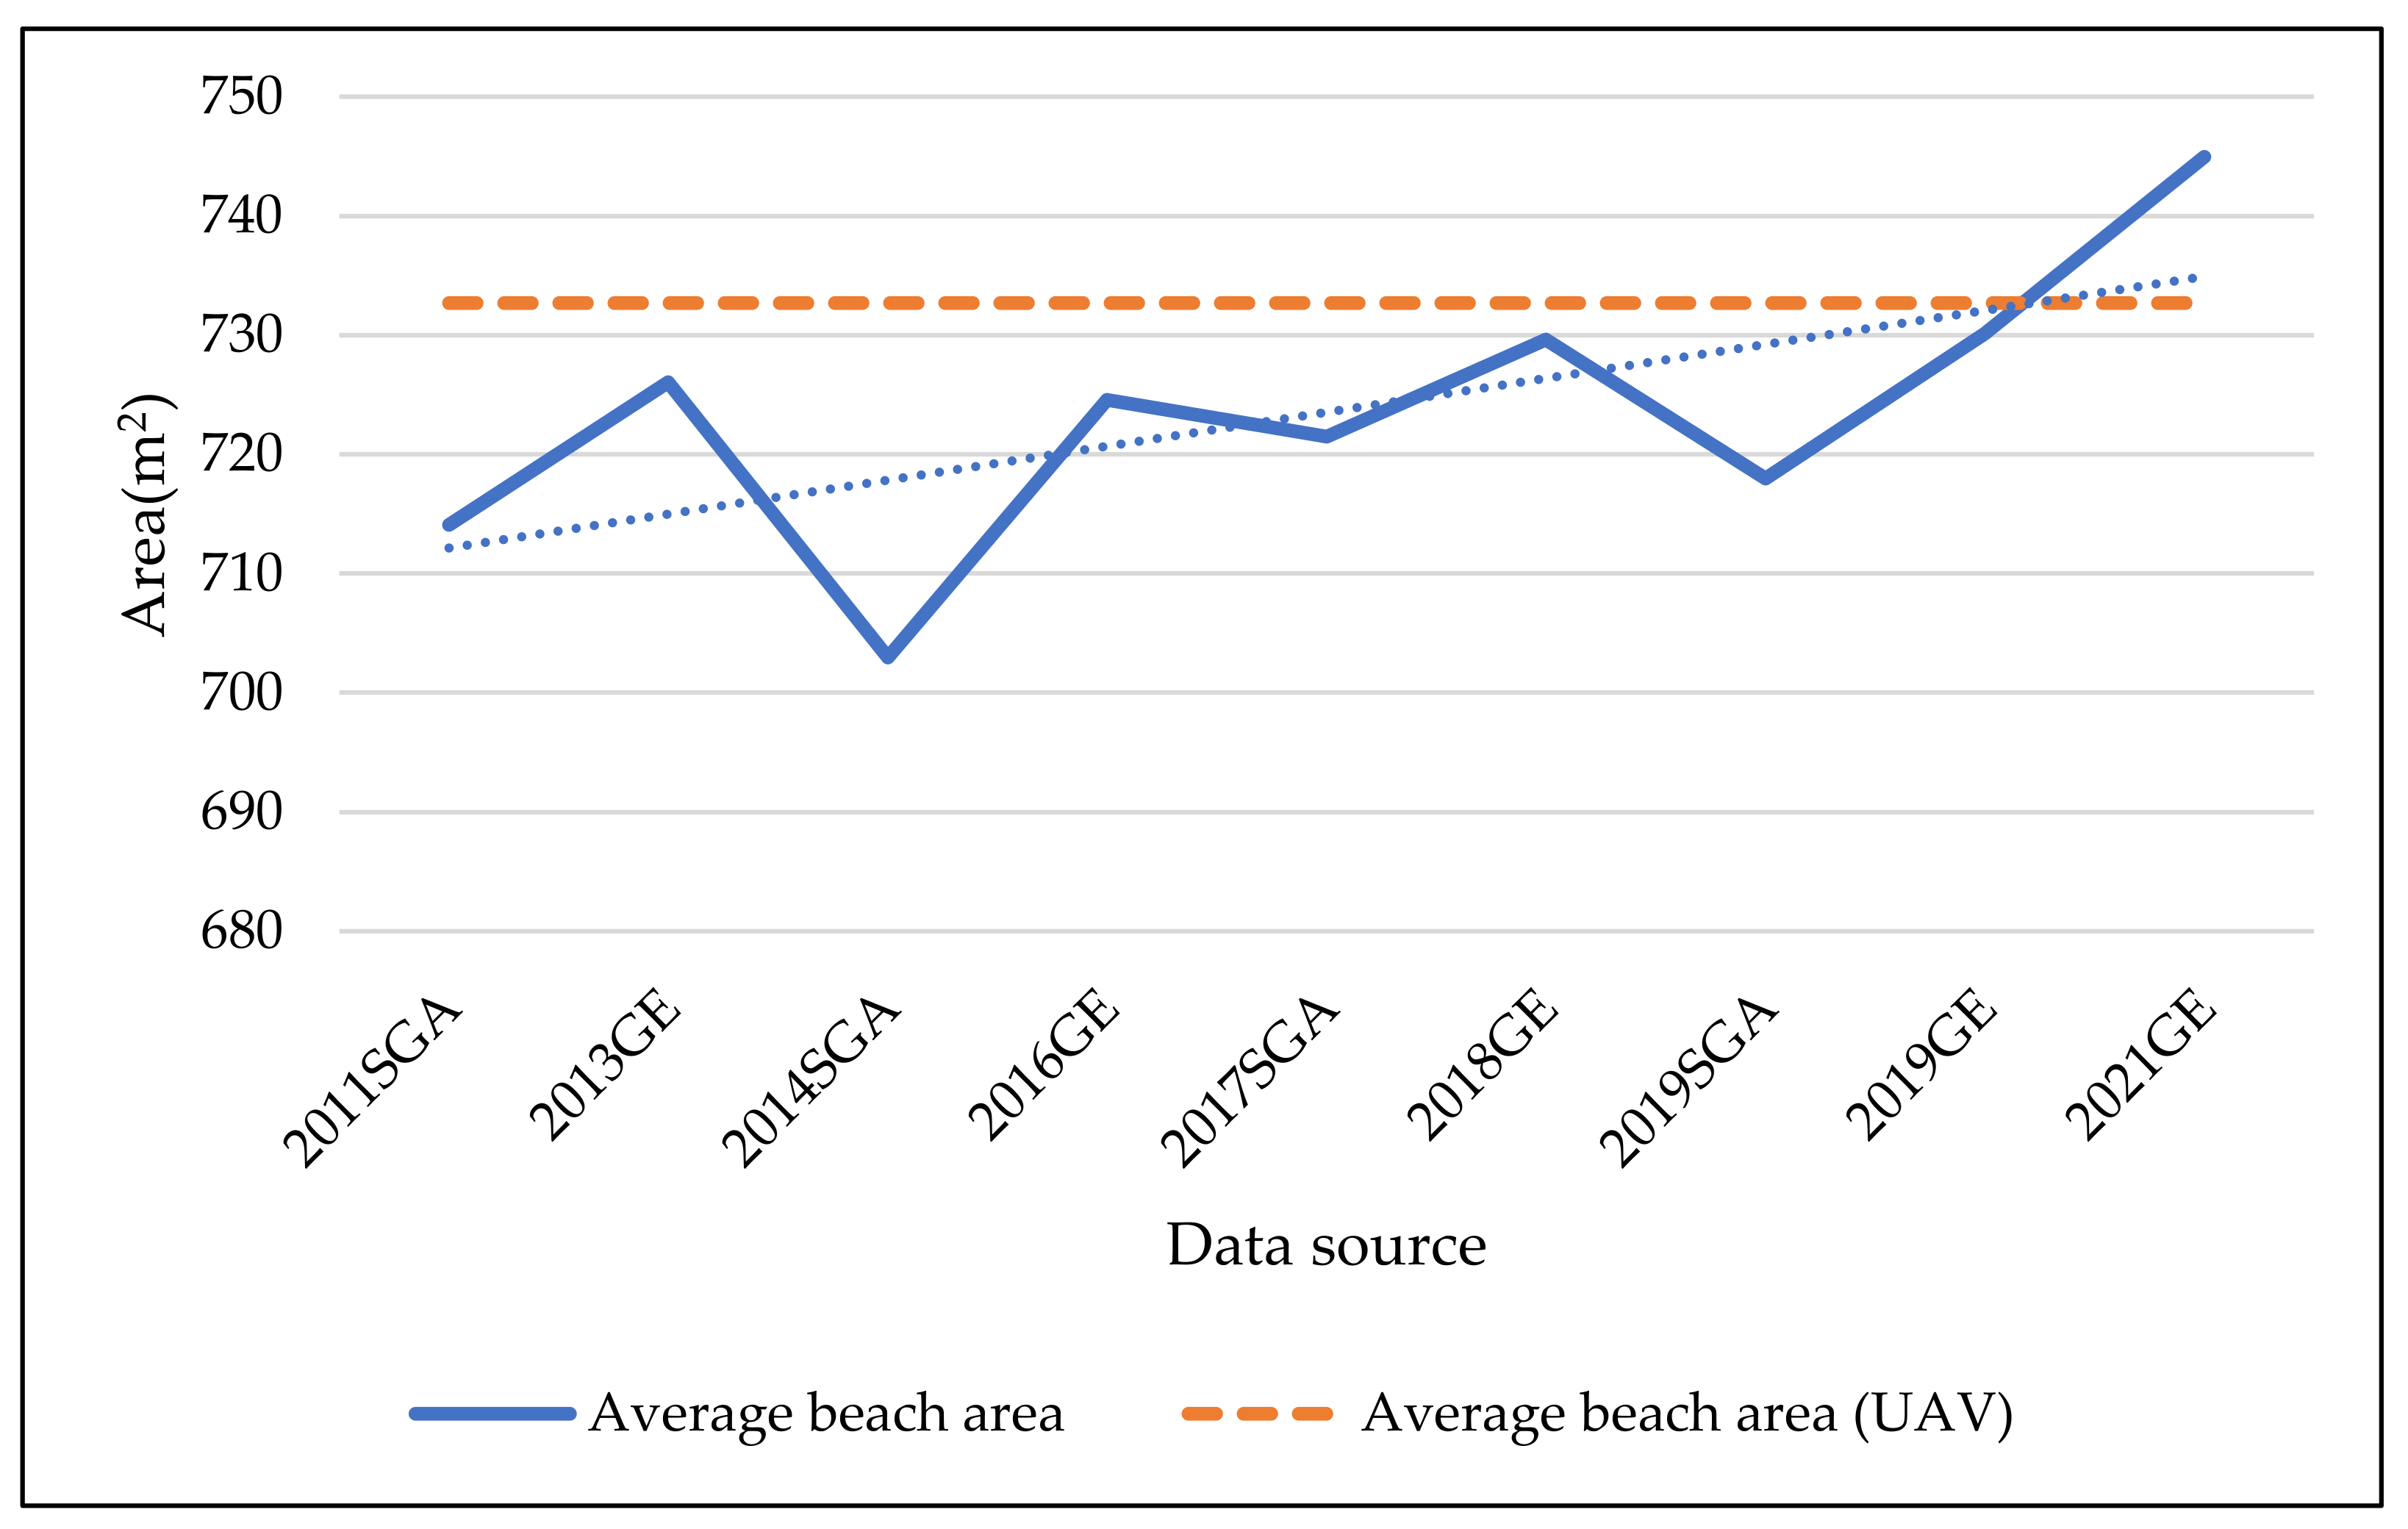
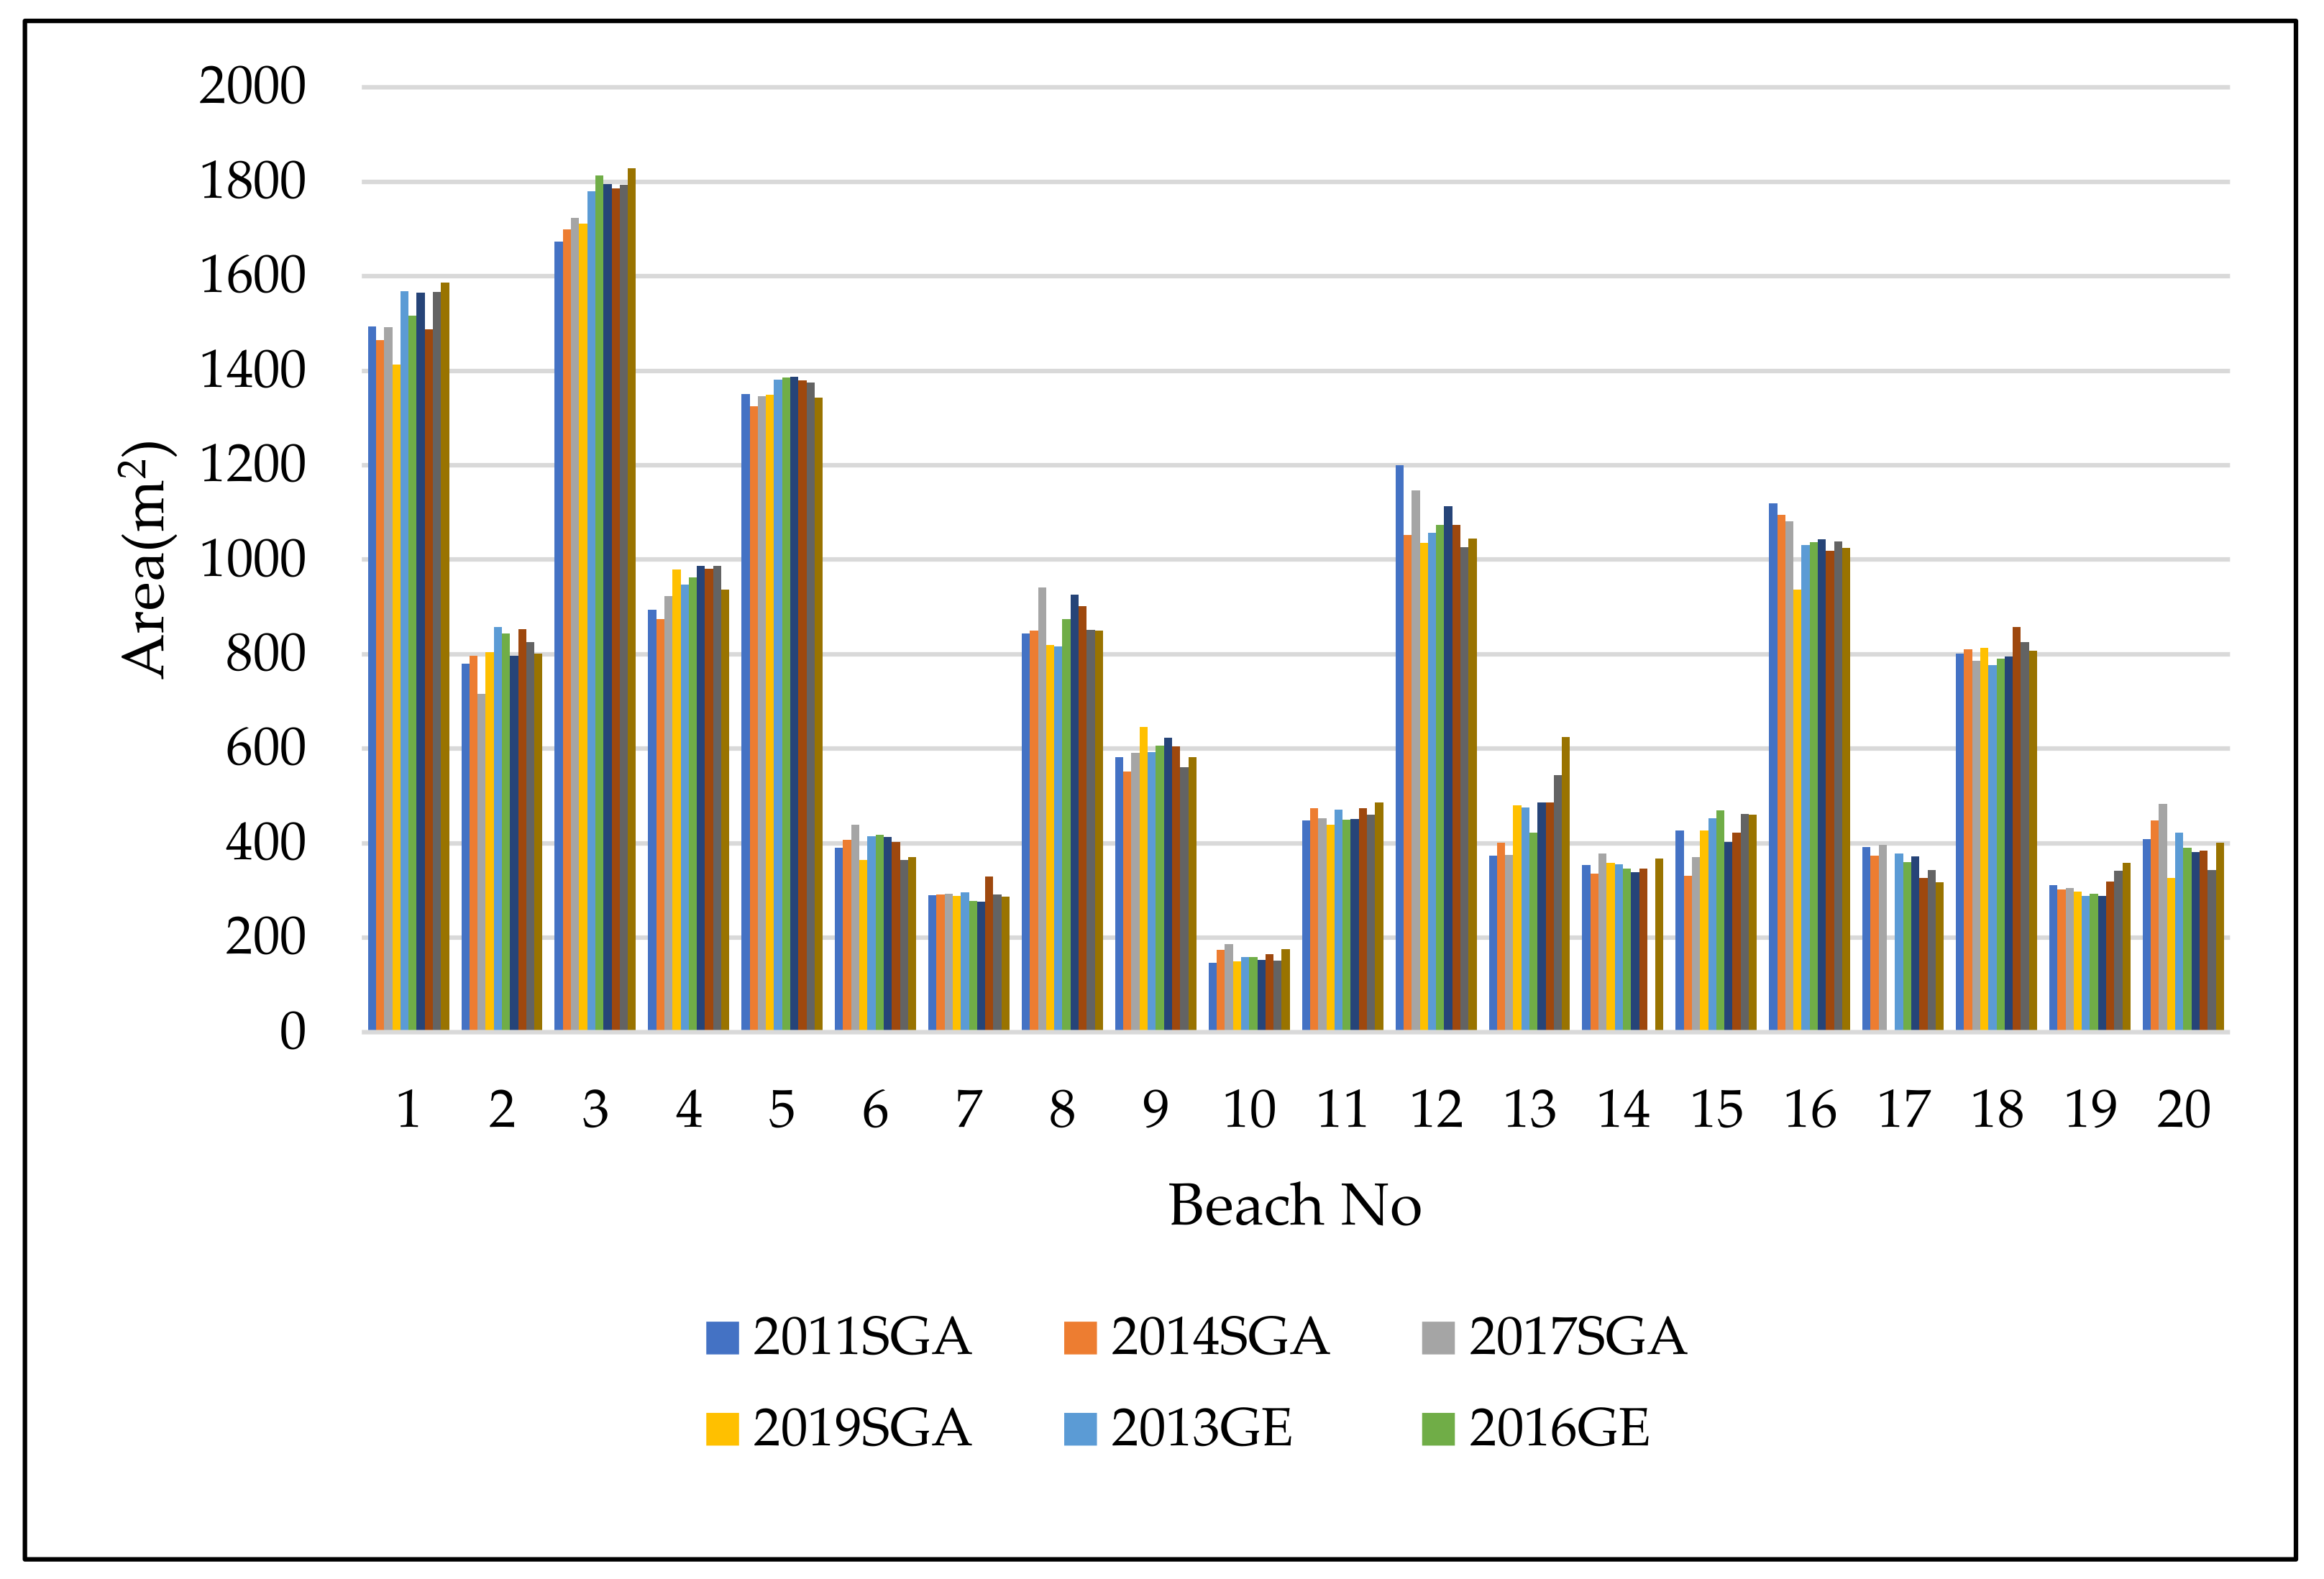
5. Results
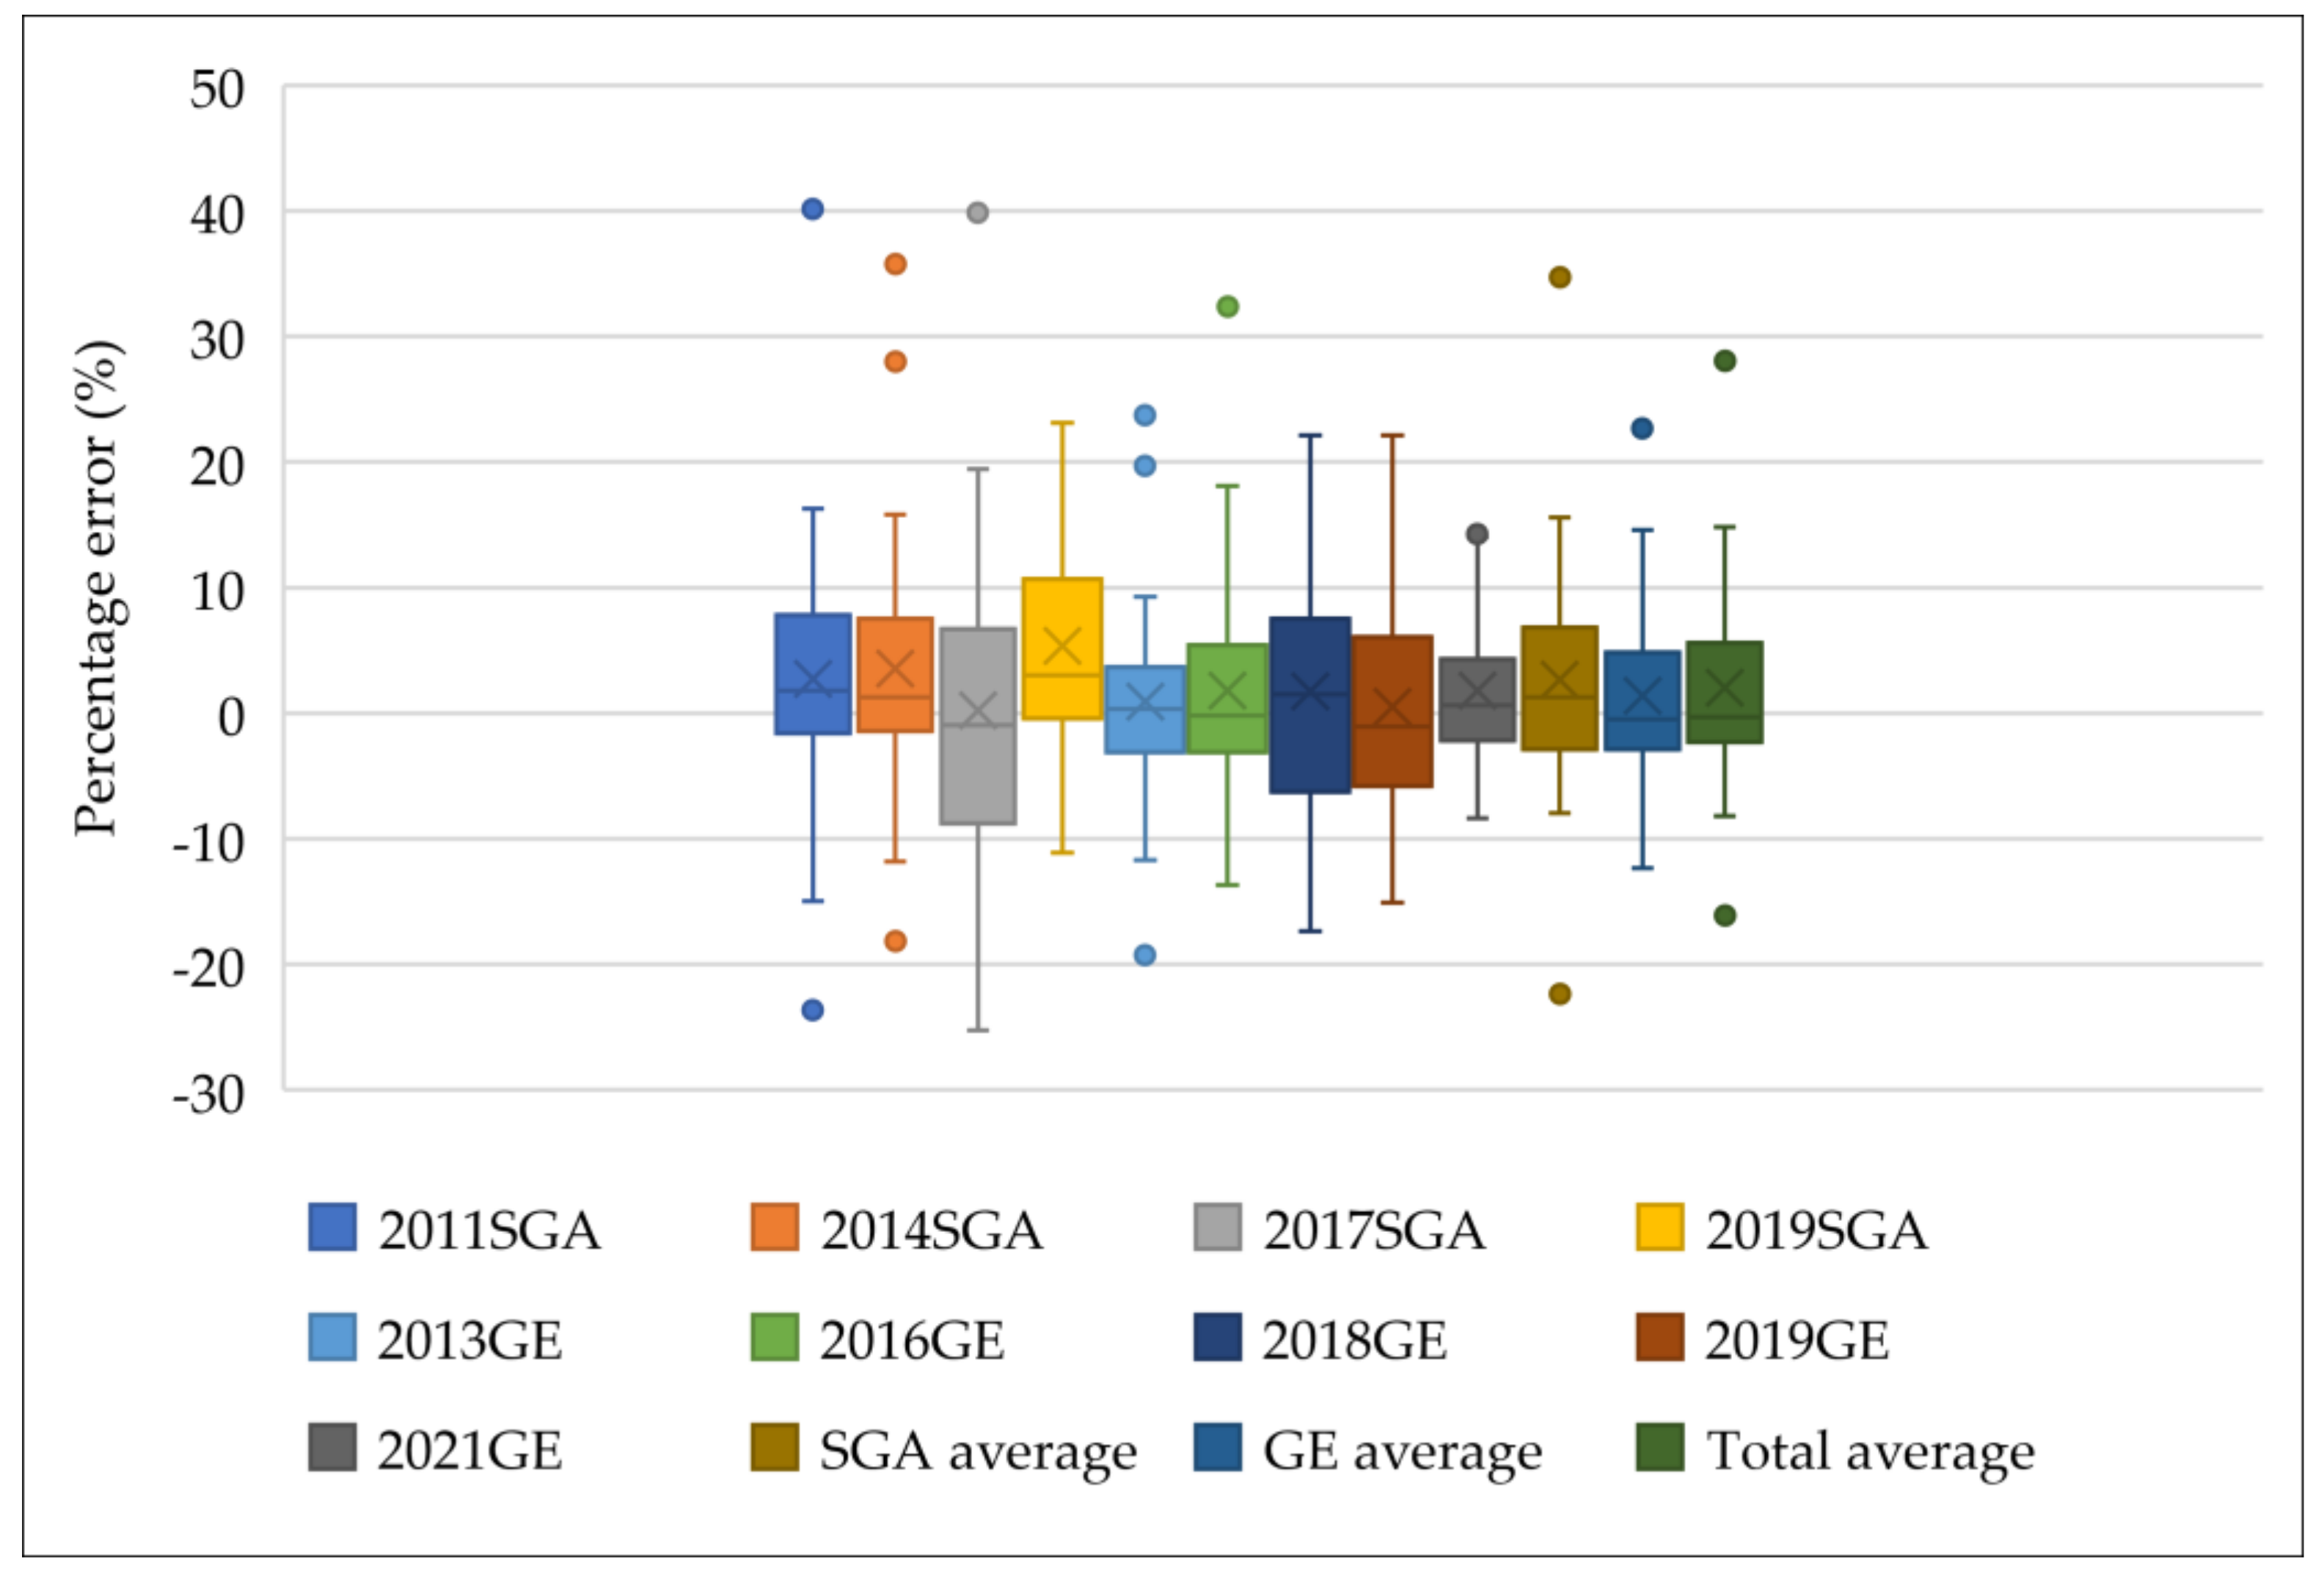
5.1. Beach Area
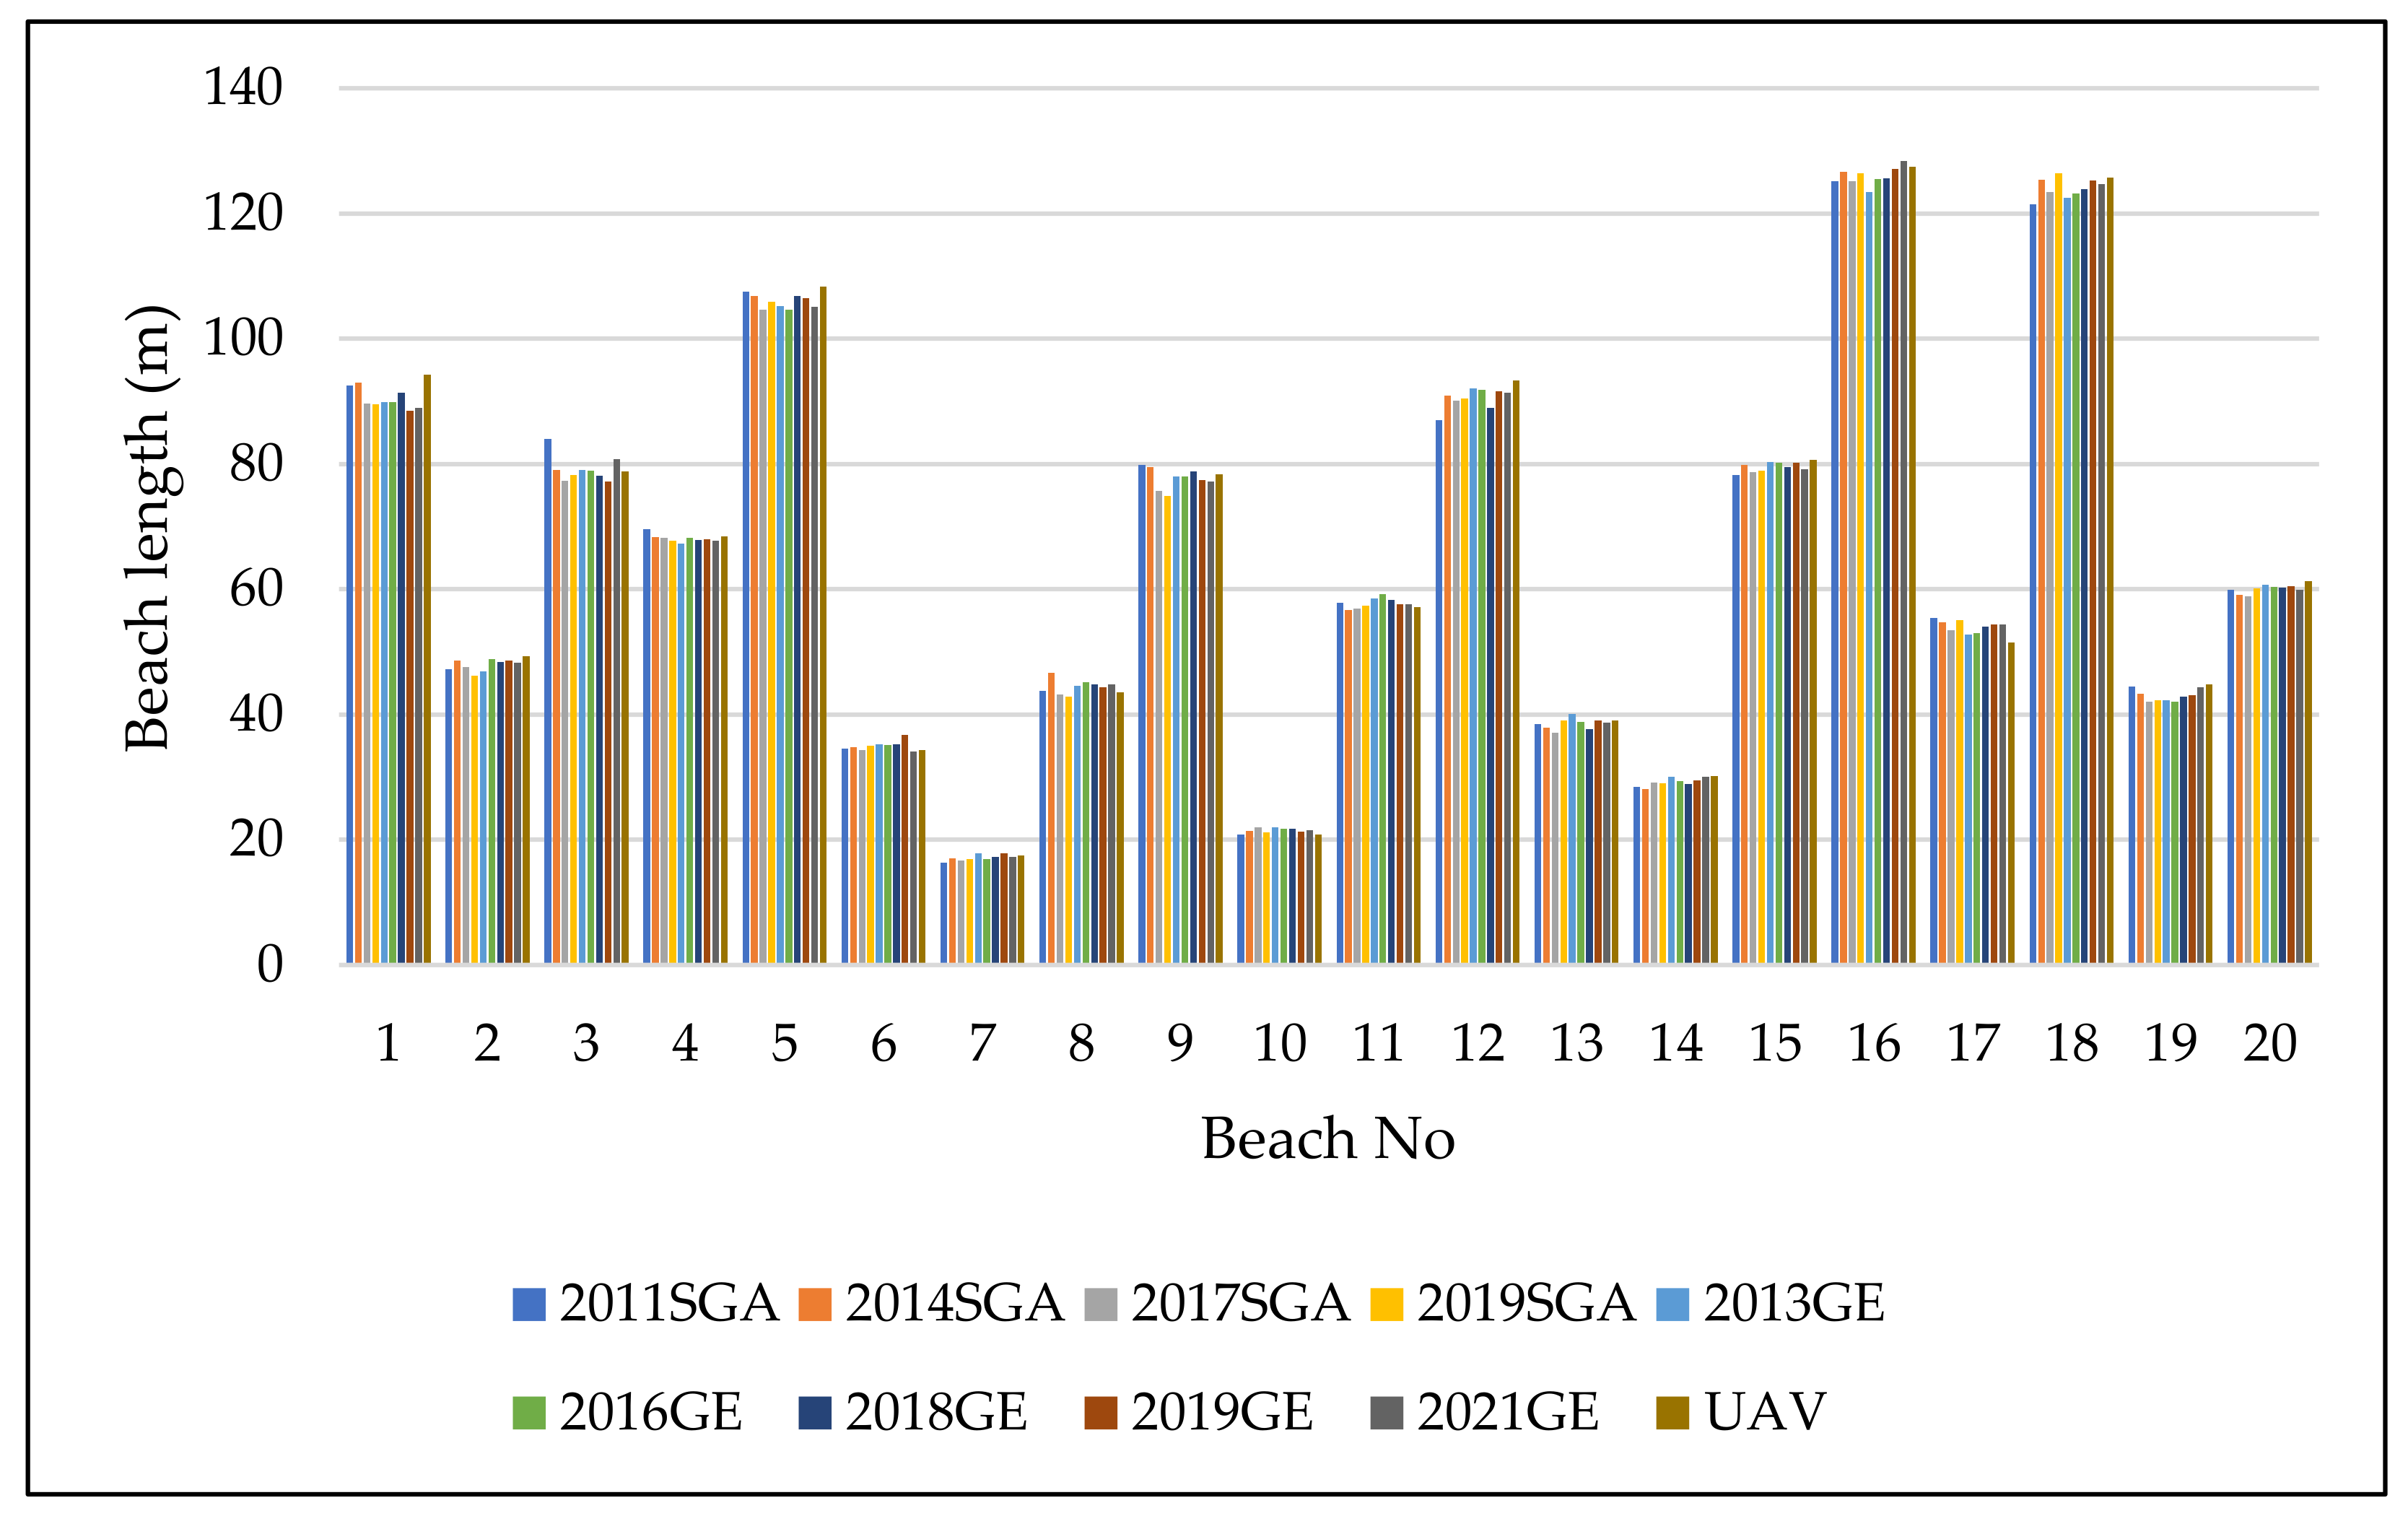
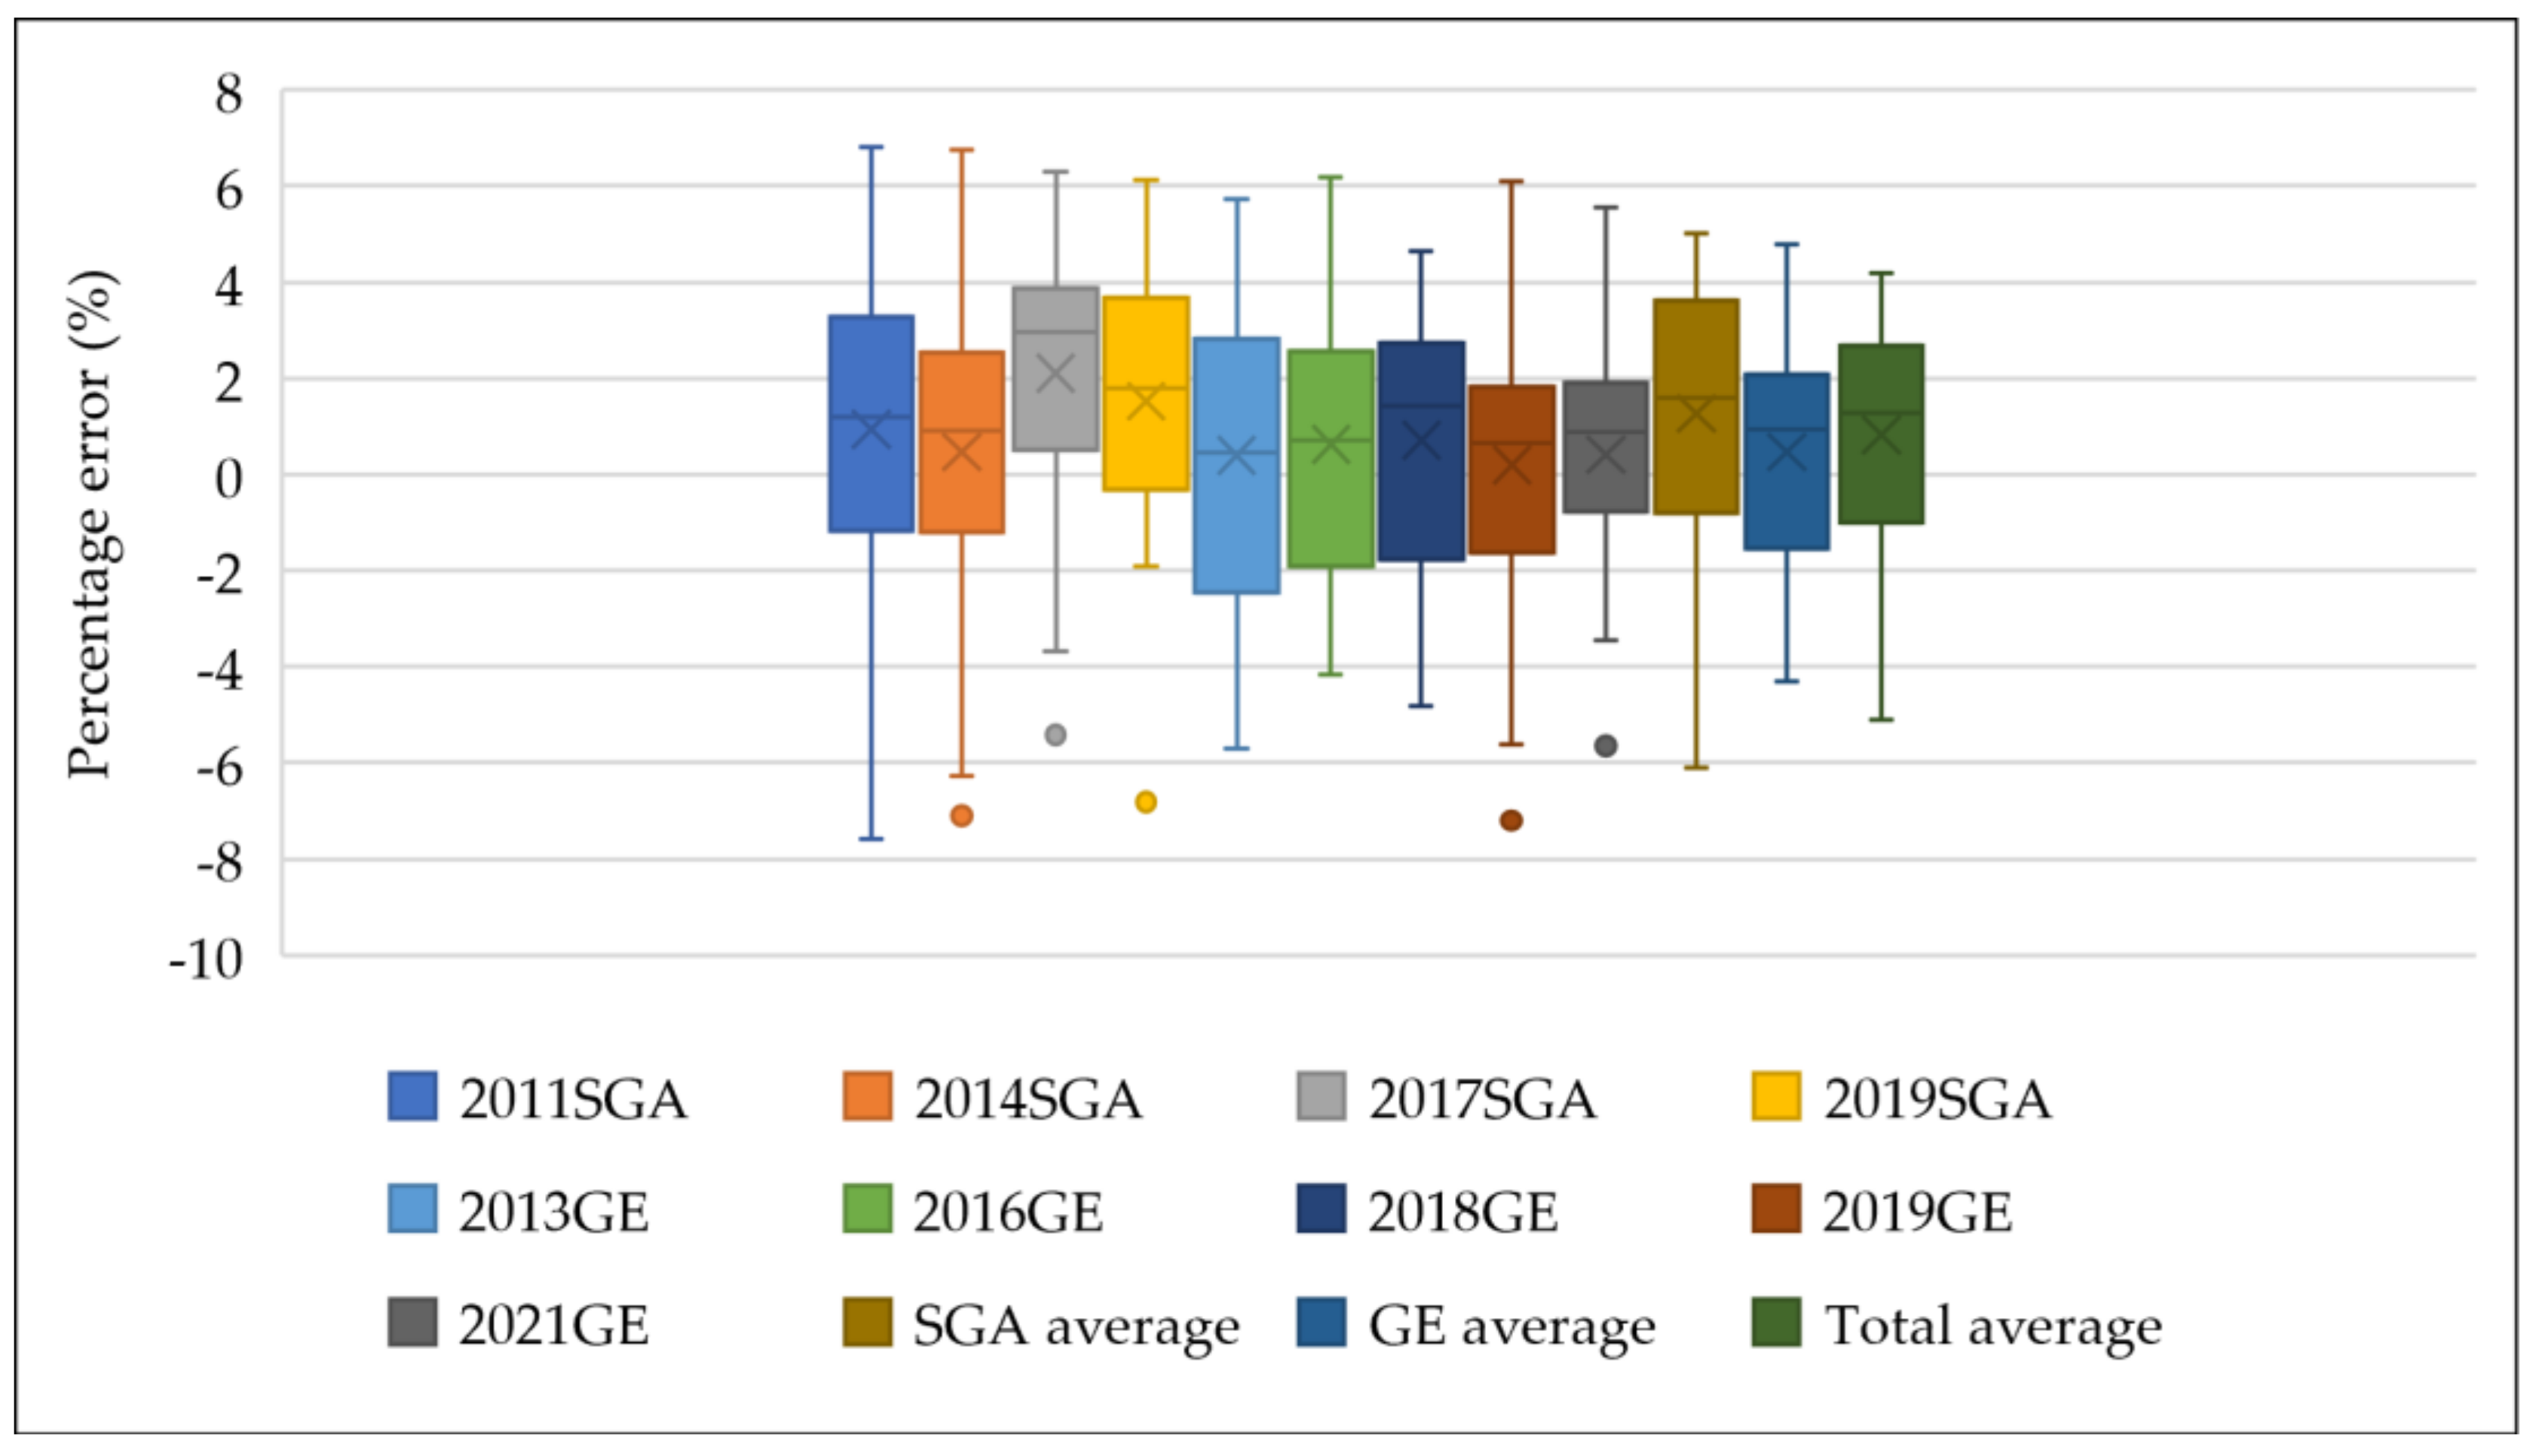
5.2. Beach Length
6. Discussion
7. Conclusions
Author Contributions
Funding
Institutional Review Board Statement
Informed Consent Statement
Data Availability Statement
Acknowledgments
Conflicts of Interest
References
- Bird, E. Coastal Geomorphology: An Introduction; John Wiley & Sons: Chichester, UK, 2008. [Google Scholar]
- Luijendijk, A.; Hagenaars, G.; Ranasinghe, R.; Baart, F.; Donchyst, G.; Arninkhof, S. The State of the World’s Beaches. Sci. Rep. 2018, 8, 6641. [Google Scholar] [CrossRef] [PubMed]
- Ranasinghe, R. Assessing climate change impacts on open sandy coasts: A review. Earth Sci. Rev. 2016, 160, 320–332. [Google Scholar] [CrossRef] [Green Version]
- Faivre, S.; Bakran-Petricioli, T.; Barešić, J.; Horvatić, D.; Macario, K. Relative sea-level change and climate change in the Northeastern Adriatic during the last 1.5 ka (Istria, Croatia). Quat. Sci. Rev. 2019, 222, 105909. [Google Scholar] [CrossRef]
- Faivre, S.; Bakran-Petricioli, T.; Barešić, J.; Horvatić, D. Lithophyllum rims as biological markers for constraining palaeoseismic events and relative sea-level variations during the last 3.3 ka on Lopud Island, southern Adriatic, Croatia. Glob. Planet. Chang. 2021, 202, 103517. [Google Scholar] [CrossRef]
- Kaniewski, D.; Marriner, N.; Cheddadi, R.; Morhange, C.; Vacchi, M.; Rovere, A.; Faivre, S.; Otto, T.; Luce, F.; Carre, M.B.; et al. Coastal submersions in the north-eastern Adriatic during the last 5200 years. Glob. Planet. Chang. 2021, 204, 103570. [Google Scholar] [CrossRef]
- Faivre, S.; Bakran-Petricioli, T.; Herak, M.; Barešić, J.; Borković, D. Late Holocene interplay between coseismic uplift events and interseismic subsidence at Koločep island and Grebeni islets in the Dubrovnik archipelago (southern Adriatic, Croatia). Quat. Sci. Rev. 2021, 274, 107284. [Google Scholar] [CrossRef]
- Tatui, F.; Pirvan, M.; Popa, M.; Aydogan, B.; Ayat, B.; Gormus, T.; Korzinin, D.; Vaidianu, N.; Vespremeanu-Stroe, A.; Zainescu, F.; et al. The Black Sea coastline erosion: Indeks-based sensitivity assessment and management-related issues. Ocean. Coast. Manag. 2019, 182, 104949. [Google Scholar] [CrossRef]
- Koroglu, A.; Ranasinghe, R.; Jimenez, J.A.; Dastgheib, A. Comparison of Coastal Vulnerability Index applications for Barcelona Province. Ocean. Coast. Manag. 2019, 178. [Google Scholar] [CrossRef]
- Ružić, I.; Dugonjić Jovančević, S.; Benac, Č.; Krvavica, N. Assessment of the Coastal Vulnerability Index in an Area of Complex Geological Conditions on the Krk Island, Northeast Adriatic Sea. Geosciences 2019, 9, 1–17. [Google Scholar] [CrossRef] [Green Version]
- Chaib, W.; Guerfi, M.; Hemdane, Y. Evaluation of coastal vulnerability and exposure to erosion and subersion risks in Bou Ismail Bay (Algeria) using the coastal risk index (CRI). Arab. J. Geosci. 2020, 13, 420. [Google Scholar] [CrossRef]
- Piegay, H.; Arnaud, F.; Belleti, B.; Bertrand, M.; Bizzi, S.; Carrbonneau, C.; Dufour, S.; Liebault, F.; Ruiz-Villanueva, V.; Slater, L. Remotely sensed rivers in the Anthropocene: State of the art and prospects. Earth Surf. Process. Landf. 2019, 45, 157–188. [Google Scholar] [CrossRef]
- Pavlek, K.; Faivre, S. Geomorphological changes of the Cetina River channels since the end of the nineteenth century, natural vs anthropogenic impacts (the Dinarides, Croatia). Environ. Earth Sci. 2020, 79, 1–6. [Google Scholar] [CrossRef]
- Siart, C.; Bubenzer, O.; Eitel, B. Combining digital elevation data (SRTM/ASTER), high resolution satellite imagery (Quickbird) and GIS for geomorphological mapping: A multi-component case study on Mediterranean karst in Central Crete. Geomorphology 2009, 112, 106–121. [Google Scholar] [CrossRef]
- Mihevc, A.; Mihevc, R. Morphological characteristics and distribution of dolines in Slovenia, a study of a lidar-based doline map of Slovenia. Acta Karstologica 2020, 50, 11–36. [Google Scholar] [CrossRef]
- Smith, M.J.; Wise, S.M. Problems of bias in mapping linear landforms from satellite imagery. Int. J. Appl. Earth Obs. Geoinf. 2007, 9, 65–78. [Google Scholar] [CrossRef]
- Casella, E.; Rovere, A.; Pedroncini, A.; Stark, C.P.; Casella, M.; Ferrari, M.; Firpo, M. Drones as tools for monitoring beach topography changes in the Ligurian Sea (NW Mediterranean). Geo Mar. Lett. 2016, 36, 151–163. [Google Scholar] [CrossRef]
- Vos, K.; Splinter, K.D.; Harley, M.D.; Simmons, J.A.; Turner, I.L. CoastSat: A Google Earth Engine-enabled Python toolkit to extract shorelines from publicly available satellite imagery. Environ. Model. Softw. 2019, 112, 104528. [Google Scholar] [CrossRef]
- Gomez-Pazo, A.; Perez-Alberti, A.; Trenhaile, A. Recording inter-annual changes on a boulder beach in Galicia, NW Spain using an unmanned aerial vehicle. Earth Surf. Process. Landf. 2019, 44, 1004–1014. [Google Scholar] [CrossRef]
- Hugenholtz, C.H.; Levin, N.; Barchyn, T.E.; Baddock, M. Remote sensing and spatial analysis of aeolian sand dunes: A review and outlook. Earth Sci. Rev. 2012, 111, 319–334. [Google Scholar] [CrossRef]
- Urbini, S.; Bianchi-Fasani, G.; Mazzanti, P.; Rocca, A.; Vittuari, L.; Zanutta, A.; Frezzotti, M. Multi-Temporal Investigation of the Boulder Clay Glacier and Northern Foothills (Victoria Land, Antarctica) by Integrated Surveying Techniques. Remote Sens. 2019, 11, 1501. [Google Scholar] [CrossRef] [Green Version]
- Anderson, K.; Gaston, K.J. Lightweight unmanned aerial vehicles will revolutionize spatial ecology. Front. Ecol. Environ. 2013, 11, 138–146. [Google Scholar] [CrossRef] [Green Version]
- Lončar, N. Geomorfološka regionalizacija srednjeg i južnog dijela otoka Paga. Geoadria 2009, 14, 5–25. [Google Scholar] [CrossRef]
- Chandler, B.M.; Lovell, H.; Boston, C.M.; Lukas, S.; Barr, I.D.; Benediktsson, Í.Ö.; Benn, D.I.; Clark, C.D.; Darvill, C.M.; Evans, D.J.; et al. Glacial geomorphological mapping: A review of approaches and frameworks for best practice. Earth Sci. Rev. 2018, 185, 806–846. [Google Scholar] [CrossRef] [Green Version]
- Cebecauer, T.; Hofierka, J. The consequences of land-cover changes on soil erosion distribution in Slovakia. Geomorphology 2008, 98, 187–198. [Google Scholar] [CrossRef]
- Jogun, T.; Pavlek, K.; Belić, T.; Buhin, S.; Malešić, N. Promjene zemljišnog pokrova u sjevernoj Hrvatskoj od 1981. do 2011. Godine. Hrvat. Geogr. Glas. 2017, 79, 33–59. [Google Scholar] [CrossRef] [Green Version]
- Gašparović, M.; Jogun, T. The effect of fusing Sentinel-2 bands on land-cover classification. Int. J. Remote. Sens. 2018, 39, 822–841. [Google Scholar] [CrossRef]
- Jogun, T.; Lukić, A.; Gašparović, M. Simulation model of land cover changes in a post-socialist peripheral rural area: Požega-Slavonia County, Croatia. Croat. Geogr. Bull. 2019, 81, 31–59. [Google Scholar] [CrossRef] [Green Version]
- Faivre, S.; Galović, L.; Sumegi, P.; Cvitanović, M.; Horvatinčić, N. 1.5 ka palaeoenviromental reconstruction of the Milna valley on the Vis island (Central Adriatic). Quat. Int. 2019, 510, 1–17. [Google Scholar] [CrossRef] [Green Version]
- Mashali, J.; Ggoneim, E. Flash Flood Hazard Using Optical, Radar, and Stereo-Pair Derived DEM: Eastern Desert, Egypt. Remote. Sens. 2018, 10, 1204. [Google Scholar] [CrossRef] [Green Version]
- Stipaničev, D.; Štula, M.; Krstinić, D.; Šerić, Lj.; Jakovčević, D.; Bugarić, M. Advanced Automatic Wildfire Surveillance and Monitoring Network. In Proceedings of the VI International Conference on Forest Fire Research, Coimbra, Portugal, 15–18 November 2010. [Google Scholar]
- Faivre, S.; Pahernik, M.; Maradin, M. The gully of Potovošća on the Island of Krk- the effects of a short-term rainfall event. Geol. Croat. 2011, 64, 67–80. [Google Scholar] [CrossRef]
- Faivre, S.; Mićunović, M. Rekostrukcija recentnih morfoloških promjena žala uz pomoć metode ponovljene fotografije—Primjer žala Zogon na otoku Hvaru (Srednji Jadran). Geoadria 2017, 22, 165–192. [Google Scholar] [CrossRef] [Green Version]
- Aguilar, M.A.; Nemmaoui, A.; Aguilar, F.J.; Qin, R. Quality assessment of digital surface models extracted from WorldView-2 and WorldView-3 stereo pairs over different land cover. GIScience Remote Sens. 2019, 56, 109–129. [Google Scholar] [CrossRef] [Green Version]
- Domazetovic, F.; Siljeg, A.; Maric, I.; Jurisic, M. Assessing the Vertical Accuracy of Worldview-3 Stereo-extracted Digital Surface Model over Olive Groves. GISTAM 2020, 246–253. Available online: https://www.scitepress.org/Link.aspx?doi=10.5220/0009471002460253 (accessed on 15 October 2021).
- Koutalakis, P.; Tzoraki, O.; Gkiatas, G.; Zaimes, G.N. Using UAV to Capture and Record Torrent Bed and Banks, Flood Debris, and Riparian Areas. Drones 2020, 4, 77. [Google Scholar] [CrossRef]
- Langhamer, J.; Vackova, T. Detection and Mapping of the Geomorphic Effects of Flooding Using UAV Photogrammetry. Pure Appl. Geophys. 2018, 175, 3223–3245. [Google Scholar] [CrossRef]
- Kasprzak, M.; Jancewicz, K.; Michniewciz, A. UAV and SfM in Detailed Geomorphological Mapping of Granite Tors: An Example of Starościńskie Skały (Sudetes, SW Poland). Pure Appl. Geophys. 2017, 175, 3193–3207. [Google Scholar] [CrossRef] [Green Version]
- Šiljeg, A.; Marić, I.; Cukrov, N.; Domazetović, F.; Roland, V. A Multiscale Framework for Sustainable Management of Tufa-Forming Watercourses: A Case Study of National Park “Krka”, Croatia. Water 2020, 12, 3096. [Google Scholar] [CrossRef]
- Gracchi, T.; Rossi, G.; Tacconi Stefanelli, C.; Tanteri, L.; Pozzani, R.; Moretti, S. Tracking the Evolution of Riverbed Morphology on the Basis of UAV Photogrammetry. Remote. Sens. 2021, 13, 829. [Google Scholar] [CrossRef]
- Casella, M.; Drechsel, J.; Winter, C.; Benninghoff, M.; Rovere, A. Accuracy of sand beach topography surveying by drones and photogrammetry. Geo. Mar. Lett. 2020, 40, 255–268. [Google Scholar] [CrossRef] [Green Version]
- Rajčić, S.T.; Faivre, S.; Buzjak, N. Promjene žala na području Medića i Mimica od kraja šezdesetih godina 20. stoljeća do danas. Hrvat. Geogr. Glas. 2010, 72, 27–48. [Google Scholar] [CrossRef] [Green Version]
- Topouzelis, K.; Papakonstantinou, A.; Doukari, M. Coastline change detection using Unmanned Aerial Vehicles and image processing technique. Fresen. Environ. Bul. 2017, 26, 5564–5571. [Google Scholar]
- Shaw, L.; Helmholz, P.; Belton, D.; Addy, N. Comparison of UAV, lidar and imagery for beach monitoring. Int. Arch. Photogramm. Remote. Sens. Spat. Inf. Sci. 2019, XLII-2/W13, 589–596. [Google Scholar] [CrossRef] [Green Version]
- Davidson-Arnott, R.; Bauer, B.; Houser, C. Introduction to Coastal Processes and Geomorphology; Cambridge University Press: Cambridge, UK, 2019. [Google Scholar]
- Domazetović, F.; Šiljeg, A.; Marić, I.; Faričić, J.; Vassilakis, E.; Panđa, L. Automated Coastline Extraction Using the Very High Resolution WorldView (WV) Satellite Imagery and Developed Coastline Extraction Tool (CET). Appl. Sci. 2021, 11, 9482. [Google Scholar] [CrossRef]
- Splinter, K.D.; Harley, M.D.; Turner, I.L. Remote Sensing Is Changing Our View of the Coast: Insights from 40 Years of Monitoring at Narrabeen-Collaroy, Australia. Remote Sens. 2018, 10, 1744. [Google Scholar] [CrossRef] [Green Version]
- Escudero, M.; Silva, R.; Hesp, P.A.; Mendoza, E. Morphological evolution of the sandspit at Tortugueros Beach, Mexico. Mar. Geol. 2019, 407, 16–31. [Google Scholar] [CrossRef]
- Specht, M.; Specht, C.; Lewicka, O.; Makar, A.; Burdziakowski, P.; Dąbrowski, P. Study on the Coastline Evolution in Sopot (2008–2018) Based on Landsat Satellite Imagery. J. Mar. Sci. Eng. 2020, 8, 464. [Google Scholar] [CrossRef]
- Lafon, V.; Apoluceno, D.D.M.; Dupuis, H.; Michel, D.; Howa, H.; Froidefond, J.M. Morphodynamics of nearshore rhythmic sandbars in a mixed-energy environment (SW France): I. Mapping beach changes using visible satellite imagery. Estuar. Coast. Shelf Sci. 2004, 61, 289–299. [Google Scholar] [CrossRef] [Green Version]
- Harris, L.; Nel, R.; Schoeman, D. Mapping beach morphodynamics remotely: A novel application tested on South African sandy shores. Estuar. Coast. Shelf Sci. 2011, 92, 78–89. [Google Scholar] [CrossRef]
- Adebisi, N.; Balogun, A.L.; Mahdianpari, M.; Min, T.H. Assessing the Impacts of Rising Sea Level on Coastal Morpho-Dynamics with Automated High-Frequency Shoreline Mapping Using Multi-Sensor Optical Satellites. Remote. Sens. 2021, 13, 3587. [Google Scholar] [CrossRef]
- Alexandrakis, G.; Poulos, S.Ε. An holistic approach to beach erosion vulnerability assessment. Sci. Rep. 2014, 4, 1–8. [Google Scholar] [CrossRef] [Green Version]
- Amaro, V.E.; Gomes, L.R.S.; de Lima, F.G.F.; Scudelari, A.C.; Neves, C.F.; Busman, D.V.; Santos, A.L.S. Multitemporal analysis of coastal erosion based on multisource satellite images, Ponta Negra Beach, Natal City, Northeastern Brazil. Mar. Geod. 2015, 38, 1–25. [Google Scholar] [CrossRef]
- Liu, Y.; Huang, H.; Qiu, Z.; Fan, J. Detecting coastline change from satellite images based on beach slope estimation in a tidal flat. Int. J. Appl. Earth Obs. Geoinf. 2013, 23, 165–176. [Google Scholar] [CrossRef]
- Warnasuriya, T.W.S.; Gunaalan, K.; Gunasekara, S.S. Google earth: A new resource for shoreline change estimation—Case study from Jaffna Peninsula, Sri Lanka. Mar. Geod. 2018, 41, 546–580. [Google Scholar] [CrossRef]
- Laporte-Fauret, Q.; Marieu, V.; Castelle, B.; Michalet, R.; Bujan, S.; Rosebery, D. Low-Cost UAV for High-Resolution and Large-Scale Coastal Dune Change Monitoring Using Photogrammetry. J. Mar. Sci. Eng. 2019, 7, 63. [Google Scholar] [CrossRef] [Green Version]
- Taveneau, A.; Almar, R.; Bergsma, E.W.J.; Sy, B.A.; Ndour, A.; Sadio, M.; Garlan, T. Observing and Predicting Coastal Erosion at the Langue de Barbarie Sand Spit around Saint Louis (Senegal, West Africa) through Satellite-Derived Digital Elevation Model and Shoreline. Remote. Sens. 2021, 13, 2454. [Google Scholar] [CrossRef]
- Zanutta, A.; Lambertini, A.; Vittuari, L. UAV photogrammetry and ground surveys as a mapping tool for quickly monitoring shoreline and beach changes. J. Mar. Sci. Eng. 2020, 8, 52. [Google Scholar] [CrossRef] [Green Version]
- Yoo, C.I.; Oh, T.S. Beach volume change using UAV photogrammetry Songjung beach, Korea. The International Archives of Photogrammetry. Remote. Sens. Spat. Inf. Sci. 2016, 41, 1201. [Google Scholar]
- Mićunović, M.; Faivre, S. Analysis of Morphological Changes of the Island of Hvar Beaches Using Archive Maps, Old Photographs and UAV (Eastern Adriatic Coast, Croatia). In Proceedings of the EGU General Assembly Conference Abstracts, Wiena, Austria, 19–30 April 2021; p. EGU21–10021. [Google Scholar]
- Pikelj, K.; Ilić, S.; James, M.R.; Kordić, B. Application of SfM Photogrammetry for Morphological Changes on Gravel Beaches: Dugi Rat Case Study (Croatia). In Proceedings of the 3rd Coastal and Maritime Mediterranean Conference, Ferrara, Italia, 25–27 November 2015; pp. 67–71. [Google Scholar]
- Ružić, I.; Marović, I.; Benac, Č.; Ilić, S. Coastal cliff geometry derived from structure-from-motion photogrammetry at Stara Baška, Krk Island, Croatia. Geo Mar. Lett. 2014, 34, 555–565. [Google Scholar] [CrossRef]
- Pikelj, K.; Ružić, I.; Ilić, S.; James, M.R.; Kordić, B. Implementing an efficient beach erosion monitoring system for coastal management in Croatia. Ocean. Coast. Manag. 2018, 156, 223–238. [Google Scholar] [CrossRef] [Green Version]
- Ružić, I.; Benac, Č.; Jovančević, S.D.; Radišić, M. The Application of UAV for the Analysis of Geological Hazard in Krk Island, Croatia, Mediterranean Sea. Remote. Sens. 2021, 13, 1790. [Google Scholar] [CrossRef]
- Mićunović, M.; Faivre, S. Morfološke promjene žala Zogon (otok Hvar) od sredine 20. stoljeća do danas. Geogr. Horiz. 2020, 66, 92–93. [Google Scholar]
- Gajić-Čapka, M.; Cindrić, K. Pojava oborinskih ekstrema s osvrtom na poplave. Hrvat. Vodoprivr. 2014, 22, 26–29. [Google Scholar]
- Tsimplis, M.N.; Proctor, R.; Flather, R.A. A two-dimensional tidal model for the Mediterranean Sea. J. Geophys.Res. Ocean. 1995, 100, 16223–16239. [Google Scholar] [CrossRef]
- Faivre, S.; Bakran-Petricioli, T.; Horvatinčić, N. Relative Sea-Level Change During the Late Holocene on the Island of Vis (Croatia)—Issa Harbour Archaeological Site. Geodin. Acta 2010, 23, 209–223. [Google Scholar] [CrossRef] [Green Version]
- Faivre, S.; Bakran-Petricioli, T.; Horvatinčić, N.; Sironić, A. Distinct phases of relative sea level changes in the central Adriatic during the last 1500 years—Influence of climatic variations? Palaeogeogr. Palaeoclimatol. Palaeoecol. 2013, 369, 163–174. [Google Scholar] [CrossRef]
- Faivre, S.; Butorac, V. Recently submerged tidal notches in the wider Makarska area (Central Adriatic, Croatia). Quat. Int. 2018, 494, 225–235. [Google Scholar] [CrossRef]
- Ullman, S. The interpretation of structure from motion, Proceedings of the Royal Society of London. Ser. B Biol. Sci. 1979, 203, 405–426. [Google Scholar]
- Westoby, M.J.; Brasington, J.; Glasser, N.F.; Hambrey, M.J.; Reynolds, J.M. ‘Structure-from-Motion’ photogrammetry: A low-cost, effective tool for geoscience applications. Geomorphology 2012, 179, 300–314. [Google Scholar] [CrossRef] [Green Version]
- Lopes, E.E.; Nogeira, R.E. Proposta Metodológica para Validação de Imagens de Alta Resolução do Google Earth para a Produção de Mapas. In Proceedings of the Anais XV Simpósio Brasileiro de Sensoriamento Remoto—SBSR, Curitiba, Brazil, 30 April–5 May 2011; p. 2308. [Google Scholar]
- Solazzo, D.; Sankey, J.B.; Sankey, T.T.; Munson, S.M. Mapping and measuring aeolian sand dunes with photogrammetry and LiDAR from unmanned aerial vehicles (UAV) and multispectral satellite imagery on the Paria Plateau, AZ, USA. Geomorphology 2018, 319, 174–185. [Google Scholar] [CrossRef]
- Swanson, B.J.; Meyer, G.A.; Coonrod, J.E. Historical channel narrowing along the Rio Grande near Albuquerque, New Mexico in response to peak discharge reductions and engineering: Magnitude and uncertainty of change from air photo measurements. Earth Surf. Process. Landf. 2011, 36, 885–900. [Google Scholar] [CrossRef]


| Reference | Location | Focus of the Study | Remote Sensing | Accuracy (m) |
|---|---|---|---|---|
| Adebisi et al., 2021 | Malysia | Shoreline | Satellite imagery | 10–30 |
| Alexandrakis and Poulos, 2014 | Greece, 18 beaches | Beach slope and width | Aerial photographs and satellite imagery | 0.5 |
| Amaro et al., 2014 | Brasil, Ponta Negra | Beach dune system and shoreline | Satellite imagery | 0.6–80 |
| Casella et al., 2016 | Italy, Liguria region | Shoreline and volume | UAV Mikrokopter Okto XL—extra camera | 0.095 |
| Casella et al., 2020 | Germany, Wadden sea, Sylt island | Shoreline and volume | UAV DJI Phantom 2—different cameras | 0.01–0.04 |
| Domazetović et al., 2021 | Croatia, Iž-Rava island group | Shoreline | Satellite imagery and UAV DJI Matrice 600 Pro | 0.01-0.5 |
| Escudero et al., 2019 | Mexico, Isla del Carmen | Shoreline (spit) | Aerial photographs and satellite imagery | 0.5–2 |
| Lafon et al., 2004 | France, Arcachon bay | Beach dune system and shoreline | Satellite imagery | 20 |
| Laporte-Fauret et al., 2019 | France, Truc Vert | Beach dune system | UAV DJI Phantom 2 and 4 + GoPro4 | 0.1 |
| Liu et al., 2012 | China, Yellow river delta | Shoreline | Satellite imagery | 30–80 |
| Ružić et al., 2019 | Croatia, Island of Krk | Shoreline, beach and cliff | Digital ortho-photo (Croatian State Geodetic Administration) | 0.5 |
| Ružić et al., 2021 | Croatia, Island of Krk | Shoreline, beach, and cliff | UAV DJI Phantom 4 Pro | 0.0326 |
| Shaw et al., 2019 | Australia, Safety bay (Perth) | Beach area and shoreline | UAV DJI Pahntom 4, Matrice 200, Matrice 600, Riegl Mini VUX LiDAR | 0.001–0.1 |
| Specht et al., 2020 | Poland, Sopot | Shoreline | Satellite imagery | <1 |
| Splinter et al., 2018 | Australia, Sydney | Beach dune system and shoreline | LiDAR, UAV, Satellite imagery, and fixed camera | 0.01–2 |
| Tatui et al., 2019 | Black sea | Shoreline | Satellite imagery | 0.6 |
| Topouzelis et al., 2017 | Greece, Lesvos | Beach dune system | UAV Iris + Canon camera | 0.0234 |
| Warnasuria et al., 2018 | Sri Lanka, Jaffna Peninsula | Shoreline | Satellite imagery | 0.3–2 |
| Yoo et al., 2016 | South Korea, Songjung | Shoreline | UAV DJI | 0.004 |
| Zanutta et al., 2020 | Italy, Ravenna | Shoreline | UAV DJI Matrice 600 and Spark | 0.027–0.043 |
| No. | Date | Source | Remote Sensing | Resolution |
|---|---|---|---|---|
| 1 | 21.6.2011 | Croatian State Administration | Orthophoto | 0.5 |
| 2 | 10.6.2014 | Croatian State Administration | Orthophoto | 0.5 |
| 3 | 26.8.2017 | Croatian State Administration | Orthophoto | 0.5 |
| 4 | 17.9.2019 | Croatian State Administration | Orthophoto | 0.5 |
| 5 | 10.7.2013 | CNES/Airbus | Satellite | 0.5 |
| 6 | 11.7.2013 | CNES/Airbus | Satellite | 0.5 |
| 7 | 19.4.2016 | CNES/Airbus | Satellite | 0.5 |
| 8 | 20.4.2016 | CNES/Airbus | Satellite | 0.5 |
| 9 | 18.9.2018 | Maxar Technologies | Satellite | 0.5 |
| 10 | 3.10.2018 | Maxar Technologies | Satellite | 0.5 |
| 11 | 18.10.2018 | Maxar Technologies | Satellite | 0.5 |
| 12 | 22.3.2019 | Maxar Technologies | Satellite | 0.5 |
| 13 | 31.7.2019 | Maxar Technologies | Satellite | 0.5 |
| 14 | 29.8.2019 | Maxar Technologies | Satellite | 0.5 |
| 15 | 22.6.2021 | Maxar Technologies | Satellite | 0.5 |
| 16 | 27.4.2021 | Maxar Technologies | Satellite | 0.5 |
| 17 | 5–11.11.2020 | Fieldwork—UAV | Orthophoto | 0.02–0.05 |
| 18 | 16–22.5.2021 | Fieldwork—UAV | Orthophoto | 0.02–0.05 |
| No | Beach Name | State Geodetic Administration (m2) | Google Earth (m2) | UAV (m2) | Average (m2) | SGA | Average (m2) | GE | Average (m2) | Total | |||||||
|---|---|---|---|---|---|---|---|---|---|---|---|---|---|---|---|---|---|
| 2011SGA | 2014SGA | 2017SGA | 2019SGA | 2013GE | 2016GE | 2018GE | 2019GE | 2021GE | |||||||||
| 1 | Pokonji dol | 1494.46 | 1464.82 | 1492.82 | 1412.47 | 1567.58 | 1516.24 | 1564.62 | 1487.77 | 1566.4 | 1587.06 | 1466.14 | 1540.52 | 1515.42 | |||
| 2 | Mola Milna | 779.33 | 796 | 716.11 | 803.92 | 857.35 | 843.27 | 797.01 | 853.66 | 825.29 | 802 | 773.84 | 835.32 | 807.39 | |||
| 3 | Vela Milna | 1674.04 | 1699.92 | 1724.05 | 1710.87 | 1779.94 | 1813.58 | 1794.62 | 1786.19 | 1794.35 | 1828 | 1702.22 | 1793.74 | 1760.56 | |||
| 4 | Zoraće Velo | 894.45 | 874.79 | 923.74 | 979.78 | 946.96 | 962.91 | 986.93 | 981.25 | 987.23 | 936.9 | 918.19 | 973.06 | 947.49 | |||
| 5 | Dubovica | 1351.23 | 1325.45 | 1345.41 | 1349.12 | 1381.44 | 1385.9 | 1387.41 | 1380.05 | 1375.51 | 1343 | 1342.8 | 1382.06 | 1362.45 | |||
| 6 | Lučišće | 390.94 | 407.56 | 439.37 | 365.1 | 414.81 | 418.05 | 412.93 | 402.26 | 364.82 | 371.3 | 400.74 | 402.57 | 398.71 | |||
| 7 | Jagodna | 290.08 | 291.3 | 293.61 | 289.03 | 295.71 | 278.39 | 276.62 | 329.85 | 291.77 | 286.63 | 291.01 | 294.47 | 292.3 | |||
| 8 | Ivan dolac | 843.84 | 849.57 | 941.43 | 819.21 | 817.08 | 874.68 | 925.48 | 902.39 | 851.49 | 849.93 | 863.51 | 874.22 | 867.51 | |||
| 9 | Skozanje | 581.53 | 551.22 | 591.15 | 646.04 | 592.04 | 606.86 | 623.6 | 604.29 | 560.37 | 581.35 | 592.49 | 597.43 | 593.85 | |||
| 10 | Soca | 147.26 | 173.65 | 185.73 | 149.63 | 159.55 | 158.71 | 152.64 | 164.38 | 151.28 | 175.9 | 164.07 | 157.31 | 161.87 | |||
| 11 | Kožja | 447.68 | 474.71 | 452.4 | 439.39 | 471.52 | 449.85 | 451.41 | 473.72 | 460.61 | 486.04 | 453.55 | 461.42 | 460.73 | |||
| 12 | Torac | 408.12 | 448.44 | 482.53 | 326.96 | 421.85 | 390.54 | 380.69 | 384.68 | 343.84 | 401.12 | 416.51 | 384.32 | 398.88 | |||
| 13 | Pokrivenik | 1200.57 | 1051.75 | 1147.11 | 1036.2 | 1056.54 | 1074.18 | 1112.89 | 1074.14 | 1025.89 | 1044.47 | 1108.91 | 1068.73 | 1082.37 | |||
| 14 | Dubac | 373.77 | 401.02 | 375.69 | 479.95 | 476.09 | 422.1 | 486.23 | 486.12 | 543.49 | 624.31 | 407.61 | 482.81 | 466.88 | |||
| 15 | Zečja | 354.03 | 336.29 | 377.59 | 357.94 | 354.76 | 345.9 | 338.71 | 346.81 | * | 366.93 | 356.46 | 346.55 | 353.22 | |||
| 16 | Radočin dol | 426.11 | 331.69 | 370.99 | 427.21 | 453.4 | 469.22 | 402.87 | 423 | 462.09 | 460.63 | 389 | 442.12 | 422.72 | |||
| 17 | Lučišće (Brusje) | 1119.36 | 1094.5 | 1080.7 | 937.18 | 1031.15 | 1037.64 | 1042.82 | 1018.25 | 1038.12 | 1025.2 | 1057.94 | 1033.6 | 1042.49 | |||
| 18 | Grabovac | 391.69 | 374.16 | 396.78 | * | 377.74 | 360.13 | 371.78 | 325.98 | 343.28 | 316.75 | 387.54 | 355.78 | 362.03 | |||
| 19 | Stiniva | 801.8 | 810.69 | 786.78 | 813.7 | 777.42 | 789.94 | 794.7 | 857.96 | 826.16 | 807.83 | 803.24 | 809.24 | 806.7 | |||
| 20 | Sviračina | 311.13 | 301.64 | 305.72 | 298.02 | 287.71 | 293.51 | 288.15 | 319.01 | 342.01 | 358.37 | 304.13 | 306.08 | 310.53 | |||
| Average | 714.07 | 702.96 | 721.49 | 717.99 | 726.03 | 724.58 | 729.61 | 730.09 | 744.95 | 732.69 | 709.99 | 727.07 | 724.44 | ||||
| Source | All Beaches (m) | Small Beaches (m) | Large Beaches (m) |
|---|---|---|---|
| 2011SGA | 84.46 | 82.41 | 86.90 |
| 2014SGA | 77.13 | 84.51 | 67.01 |
| 2017SGA | 84.10 | 91.34 | 74.29 |
| 2019SGA | 70.02 | 61.87 | 78.08 |
| 2013GE | 46.58 | 55.50 | 32.52 |
| 2016GE | 56.36 | 68.83 | 35.61 |
| 2018GE | 51.92 | 57.94 | 43.45 |
| 2019GE | 50.13 | 49.04 | 51.43 |
| 2021GE | 31.70 | 35.42 | 26.96 |
| SGA average | 70.57 | 75.44 | 64.13 |
| GE average | 42.49 | 50.07 | 30.79 |
| Total average | 52.61 | 60.48 | 40.99 |
| No. | Beach Name | Croatian Geoportal Orthophoto (m) | Google Earth (m) | UAV (m) | SGA Average (m) | GE Average (m) | Total Average (m) | |||||||
|---|---|---|---|---|---|---|---|---|---|---|---|---|---|---|
| 2011SGA | 2014SGA | 2017SGA | 2019SGA | 2013GE | 2016GE | 2018GE | 2019GE | 2021GE | ||||||
| 1 | Pokonji dol | 92.49 | 93.03 | 89.63 | 89.48 | 89.87 | 89.89 | 91.4 | 88.51 | 89.01 | 94.25 | 91.16 | 89.74 | 90.76 |
| 2 | Mola Milna | 47.28 | 48.59 | 47.56 | 46.23 | 46.86 | 48.87 | 48.43 | 48.63 | 48.3 | 49.25 | 47.42 | 48.22 | 48 |
| 3 | Vela Milna | 84.02 | 79.02 | 77.28 | 78.27 | 79.08 | 78.9 | 78.14 | 77.23 | 80.81 | 78.83 | 79.65 | 78.83 | 79.16 |
| 4 | Zoraće Velo | 69.62 | 68.29 | 68.26 | 67.73 | 67.29 | 68.26 | 67.86 | 67.96 | 67.73 | 68.4 | 68.48 | 67.82 | 68.14 |
| 5 | Dubovica | 107.52 | 106.84 | 104.65 | 105.92 | 105.21 | 104.6 | 106.81 | 106.48 | 105.09 | 108.36 | 106.23 | 105.64 | 106.15 |
| 6 | Lučišće | 34.57 | 34.83 | 34.34 | 34.96 | 35.29 | 35.17 | 35.21 | 36.77 | 34.04 | 34.3 | 34.68 | 35.3 | 34.95 |
| 7 | Jagodna | 16.28 | 17.07 | 16.71 | 16.89 | 17.88 | 16.87 | 17.31 | 17.89 | 17.21 | 17.47 | 16.74 | 17.43 | 17.16 |
| 8 | Ivan dolac | 43.76 | 46.65 | 43.21 | 42.89 | 44.59 | 45.16 | 44.78 | 44.38 | 44.81 | 43.56 | 44.13 | 44.74 | 44.38 |
| 9 | Skozanje | 79.81 | 79.56 | 75.65 | 74.95 | 77.99 | 78.06 | 78.82 | 77.38 | 77.25 | 78.36 | 77.49 | 77.9 | 77.78 |
| 10 | Soca | 20.82 | 21.37 | 21.98 | 21.2 | 22.04 | 21.72 | 21.7 | 21.25 | 21.57 | 20.85 | 21.34 | 21.66 | 21.45 |
| 11 | Kožja | 57.85 | 56.68 | 56.87 | 57.37 | 58.56 | 59.27 | 58.35 | 57.63 | 57.56 | 57.11 | 57.19 | 58.27 | 57.73 |
| 12 | Torac | 59.9 | 59.13 | 58.91 | 60.09 | 60.73 | 60.32 | 60.21 | 60.53 | 59.95 | 61.34 | 59.51 | 60.35 | 60.11 |
| 13 | Pokrivenik | 87.02 | 90.91 | 90.12 | 90.49 | 92.04 | 91.86 | 89.01 | 91.63 | 91.38 | 93.36 | 89.64 | 91.18 | 90.78 |
| 14 | Dubac | 38.49 | 37.89 | 37.08 | 39.02 | 40.03 | 38.79 | 37.71 | 39.08 | 38.75 | 39.04 | 38.12 | 38.87 | 38.59 |
| 15 | Zečja | 28.4 | 28.14 | 29.1 | 29.04 | 30.08 | 29.35 | 28.95 | 29.42 | 30.1 | 30.18 | 28.67 | 29.58 | 29.28 |
| 16 | Radočin dol | 78.19 | 79.81 | 78.65 | 78.91 | 80.35 | 80.2 | 79.48 | 80.17 | 79.16 | 80.69 | 78.89 | 79.87 | 79.56 |
| 17 | Lučišće (Brusje) | 125.18 | 126.65 | 125.13 | 126.43 | 123.38 | 125.5 | 125.59 | 127.13 | 128.39 | 127.41 | 125.85 | 126 | 126.08 |
| 18 | Grabovac | 55.43 | 54.76 | 53.42 | 55.03 | 52.8 | 53.05 | 54.01 | 54.42 | 54.43 | 51.52 | 54.66 | 53.74 | 53.89 |
| 19 | Stiniva | 121.47 | 125.41 | 123.48 | 126.43 | 122.5 | 123.2 | 123.93 | 125.26 | 124.71 | 125.68 | 124.2 | 123.92 | 124.21 |
| 20 | Sviračina | 44.41 | 43.31 | 42.02 | 42.31 | 42.28 | 42.08 | 42.88 | 43.03 | 44.38 | 44.85 | 43.01 | 42.93 | 43.16 |
| Average | 64.63 | 64.9 | 63.7 | 64.18 | 64.44 | 64.56 | 64.53 | 64.74 | 64.73 | 65.24 | 64.35 | 64.6 | 64.56 | |
| Source | All Beaches (m) | Small Beaches (m) | Large Beaches (m) |
|---|---|---|---|
| 2011SGA | 2.55 | 1.69 | 3.32 |
| 2014SGA | 1.53 | 1.55 | 1.51 |
| 2017SGA | 2.20 | 1.81 | 2.60 |
| 2019SGA | 2.08 | 1.84 | 2.33 |
| 2013GE | 2.00 | 1.15 | 2.69 |
| 2016GE | 1.82 | 1.30 | 2.31 |
| 2018GE | 1.71 | 1.33 | 2.08 |
| 2019GE | 1.79 | 1.38 | 2.20 |
| 2021GE | 1.82 | 1.17 | 2.38 |
| SGA average | 1.76 | 1.50 | 2.03 |
| GE average | 1.65 | 1.12 | 2.12 |
| Total Average | 1.65 | 1.25 | 2.03 |
Publisher’s Note: MDPI stays neutral with regard to jurisdictional claims in published maps and institutional affiliations. |
© 2021 by the authors. Licensee MDPI, Basel, Switzerland. This article is an open access article distributed under the terms and conditions of the Creative Commons Attribution (CC BY) license (https://creativecommons.org/licenses/by/4.0/).
Share and Cite
Mićunović, M.; Faivre, S.; Gašparović, M. Assessment of Remote Sensing Techniques Applicability for Beach Morphology Mapping: A Case Study of Hvar Island, Central Adriatic, Croatia. J. Mar. Sci. Eng. 2021, 9, 1407. https://doi.org/10.3390/jmse9121407
Mićunović M, Faivre S, Gašparović M. Assessment of Remote Sensing Techniques Applicability for Beach Morphology Mapping: A Case Study of Hvar Island, Central Adriatic, Croatia. Journal of Marine Science and Engineering. 2021; 9(12):1407. https://doi.org/10.3390/jmse9121407
Chicago/Turabian StyleMićunović, Marin, Sanja Faivre, and Mateo Gašparović. 2021. "Assessment of Remote Sensing Techniques Applicability for Beach Morphology Mapping: A Case Study of Hvar Island, Central Adriatic, Croatia" Journal of Marine Science and Engineering 9, no. 12: 1407. https://doi.org/10.3390/jmse9121407