Article

The Benefits of 3D and 4D Synthesis of Marine Geophysical Datasets for Analysis and Visualisation of Shipwrecks, and for Interpretation of Physical Processes over Shipwreck Sites: A Case Study off Methoni, Greece

Department of Geology, University of Patras, 26504 Patras, Greece
*
Author to whom correspondence should be addressed.
J. Mar. Sci. Eng. 2021, 9(11), 1255; https://doi.org/10.3390/jmse9111255
Submission received: 26 October 2021 / Accepted: 4 November 2021 / Published: 12 November 2021
(This article belongs to the Special Issue Advanced Technologies for Maritime and Underwater Archaeology)

Abstract

:
Through the study of three wreck sites over the Methoni Bay (Greece), this article presents the benefits of spatio-temporal integration and correlation of marine geophysical data in a common three-dimensional (3D) geographical platform for analysis, and visualisation of shipwreck ruins and for interpretation of physical processes over wreck sites. The integration of 3D datasets has been proven to support identification of archaeological features over and under the seafloor, evaluation of the wreck structure state, and assessment on the wrecking event and the wreck site arrangement at that time, due to interactive cross-examination of datasets acquired in separate planes. Data synthesis is fundamental for 3D digital reconstruction of scattered and partially buried shipwreck ruins in complex geology as every dataset acts as interpretive and complimentary to each other. It is also shown that data synthesis highlights the signatures of physical processes over the wreck sites, and the interaction between the processes and the shipwrecks. The analysis of spatio-temporal, four-dimensional (4D) integrated datasets has proved to provide knowledge on the wreck site evolution through time, and highlights the disturbance of underwater archaeological resources due to human activities. The study has also shown that the creation of a shoalest depth true position bathymetric surface supports the realistic 3D wreck representation over the seafloor.

1. Introduction

Over recent years, a wide variety of advanced methodologies, applications, and technological solutions have supported the documentation, preservation, accessibility, and monitoring of underwater cultural heritage (UCH) resources. These are mostly based on the scientific community’s need for reduction of risks and costs incurred for underwater investigations, as well as on the need for better data, by means of quality, quantity and usability.
In the field of marine geophysics, wreck site assessments based on integrated geophysical survey techniques have been extensively reported through the literature in the past years [1,2,3,4]. These techniques provide the researchers with big volumes of geophysical data, usually in a fraction of the time, utilising geophysical instruments synchronously over the survey area. The use of 3D modelling and rendering of wreck site geophysical data has also been broadly presented in literary works [5,6,7,8], while tools for capturing high resolution data for 3D modelling, such as underwater laser scanners, have been introduced in the field of marine geophysics [9,10]. These practices were developed along with the computer science advancements and contribute to an advantageous interpretation of geophysical data related with UCH resources. Through the literature, however, there are only a few case studies where wreck site geophysical datasets have been rendered and analysed integrated in 3D or 4D (3D and time) [11,12].
Through the results of a geophysical survey over three wreck sites across the Methoni Bay, Greece (Figure 1), this article presents the benefits of 3D and 4D synthesis of marine geophysical data for analysis and visualisation of shipwreck ruins, and for the interpretation of the physical processes affecting the wreck sites. Furthermore, this article highlights good practices of bathymetric data rendering for realistic visualisation of underwater antiquities. The wreck sites were surveyed in 2015 as part of the ‘Evolved GE.N.ESIS project’ [13], a research project aiming for the promotion of the underwater cultural heritage resources that have the potential of being drivers for sustainable local growth.

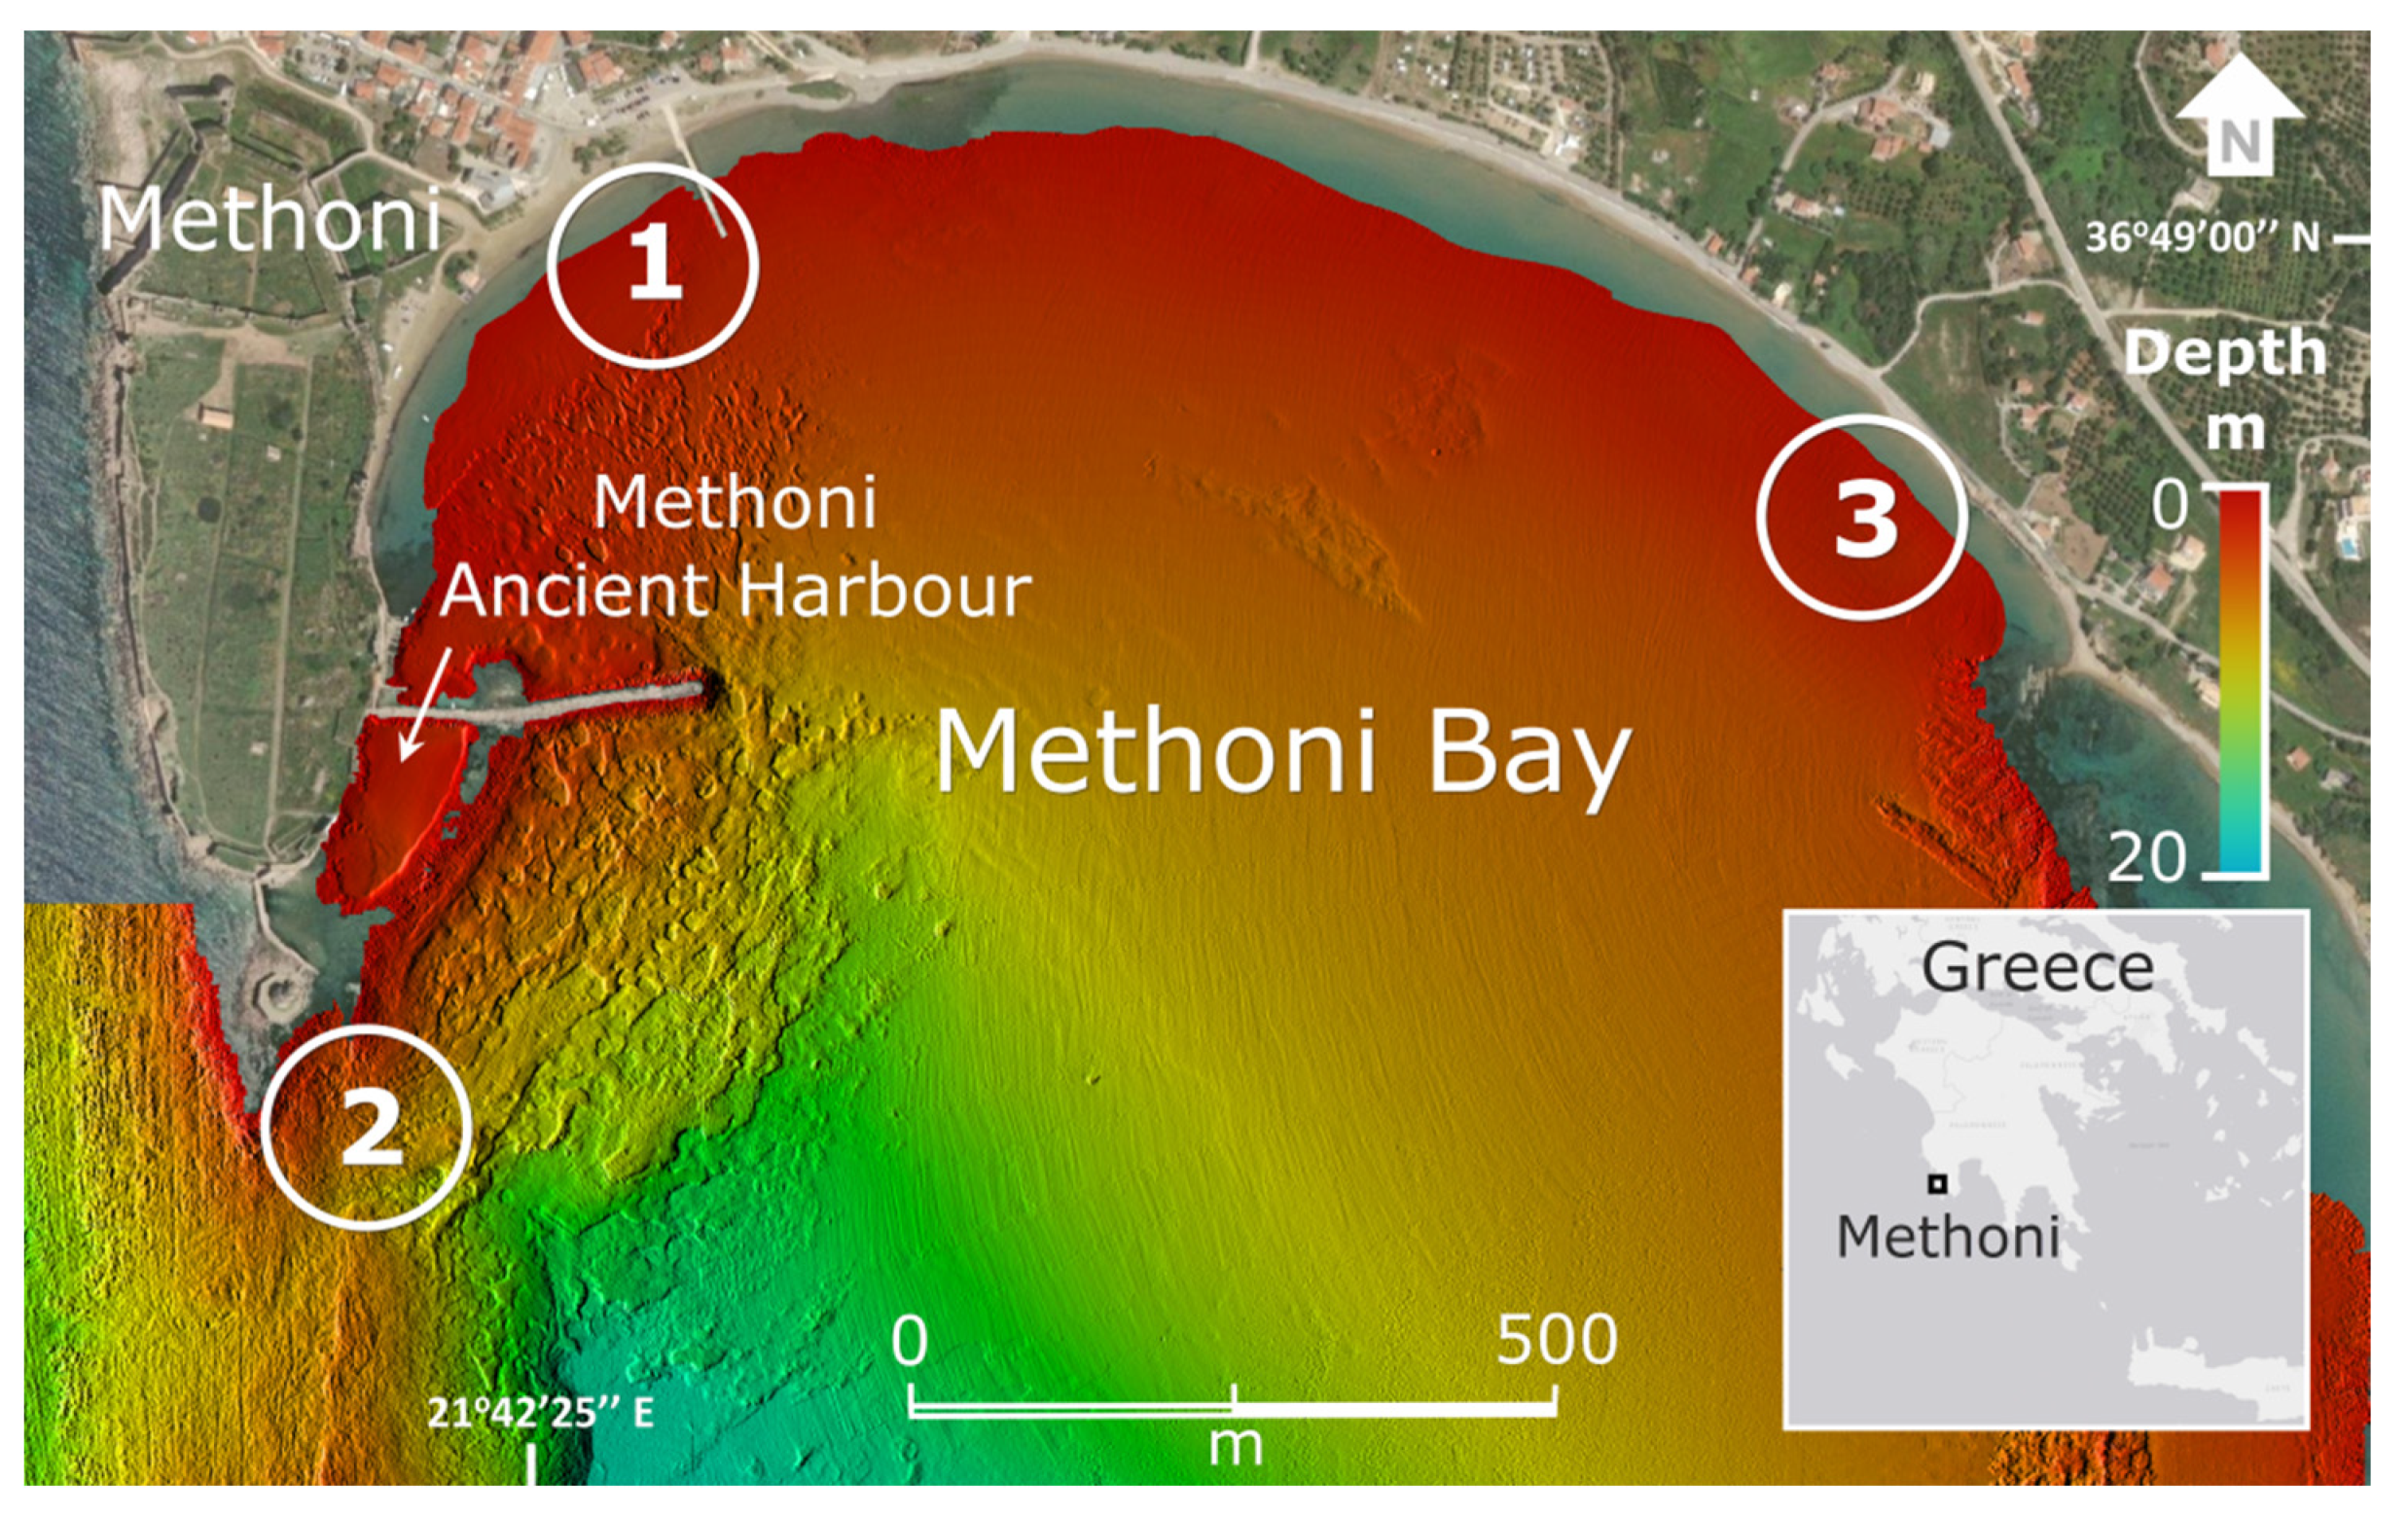
1.1. Natural Environment of the Survey Area

Although the wreck sites are lying along the surf zone of the Methoni Bay (Figure 1), the marine geophysical survey was conducted over the whole extent of the bay, for acquisition of data suitable for interpretation of the physical processes affecting the wreck sites. The bay seafloor is covered with sand and locally coarser sediments, and deepens gradually at water depths up to 15 m. The underlying coast is subject to wave action from south directions and there is evidence indicating long-term erosion along the eastern section of the coastline, longshore sediment transport, and long-term sand deposition over the northwest section of the bay [14]. Medium density seagrass communities occupy the seafloor, over the west section of the bay.

1.2. Archaeological and Historical Background of the Survey Area

Since 1993, a dense spatial distribution of underwater cultural heritage resources has been documented over the Methoni Bay, following marine archaeological [14,15] and geoarchaeological surveys [13,16]. Among these resources, the existence of historic shipwrecks is related with the strategic geographic location of Methoni, its port and waterfront installations and with the fact that the town was a major maritime trade node over the centuries. The ancient and medieval port of Methoni played a significant role in the maritime trade and the transportation of pilgrims between Venice and the eastern Mediterranean as a supply centre, especially between the 11th and the 15th century CE [17]. The port, which, at its earliest configuration, as well as the waterfront fortifications, dated to the 4th century BCE, also supported the maritime surveillance and control over the marine region between central and eastern Mediterranean. The strategic role of Methoni drove a series of geopolitical developments, naval battles, and ship losses in the area as a result of the predatory expeditions of Romans, Venetians, Turks and the French in the area from the 12th to the 19th century CE.

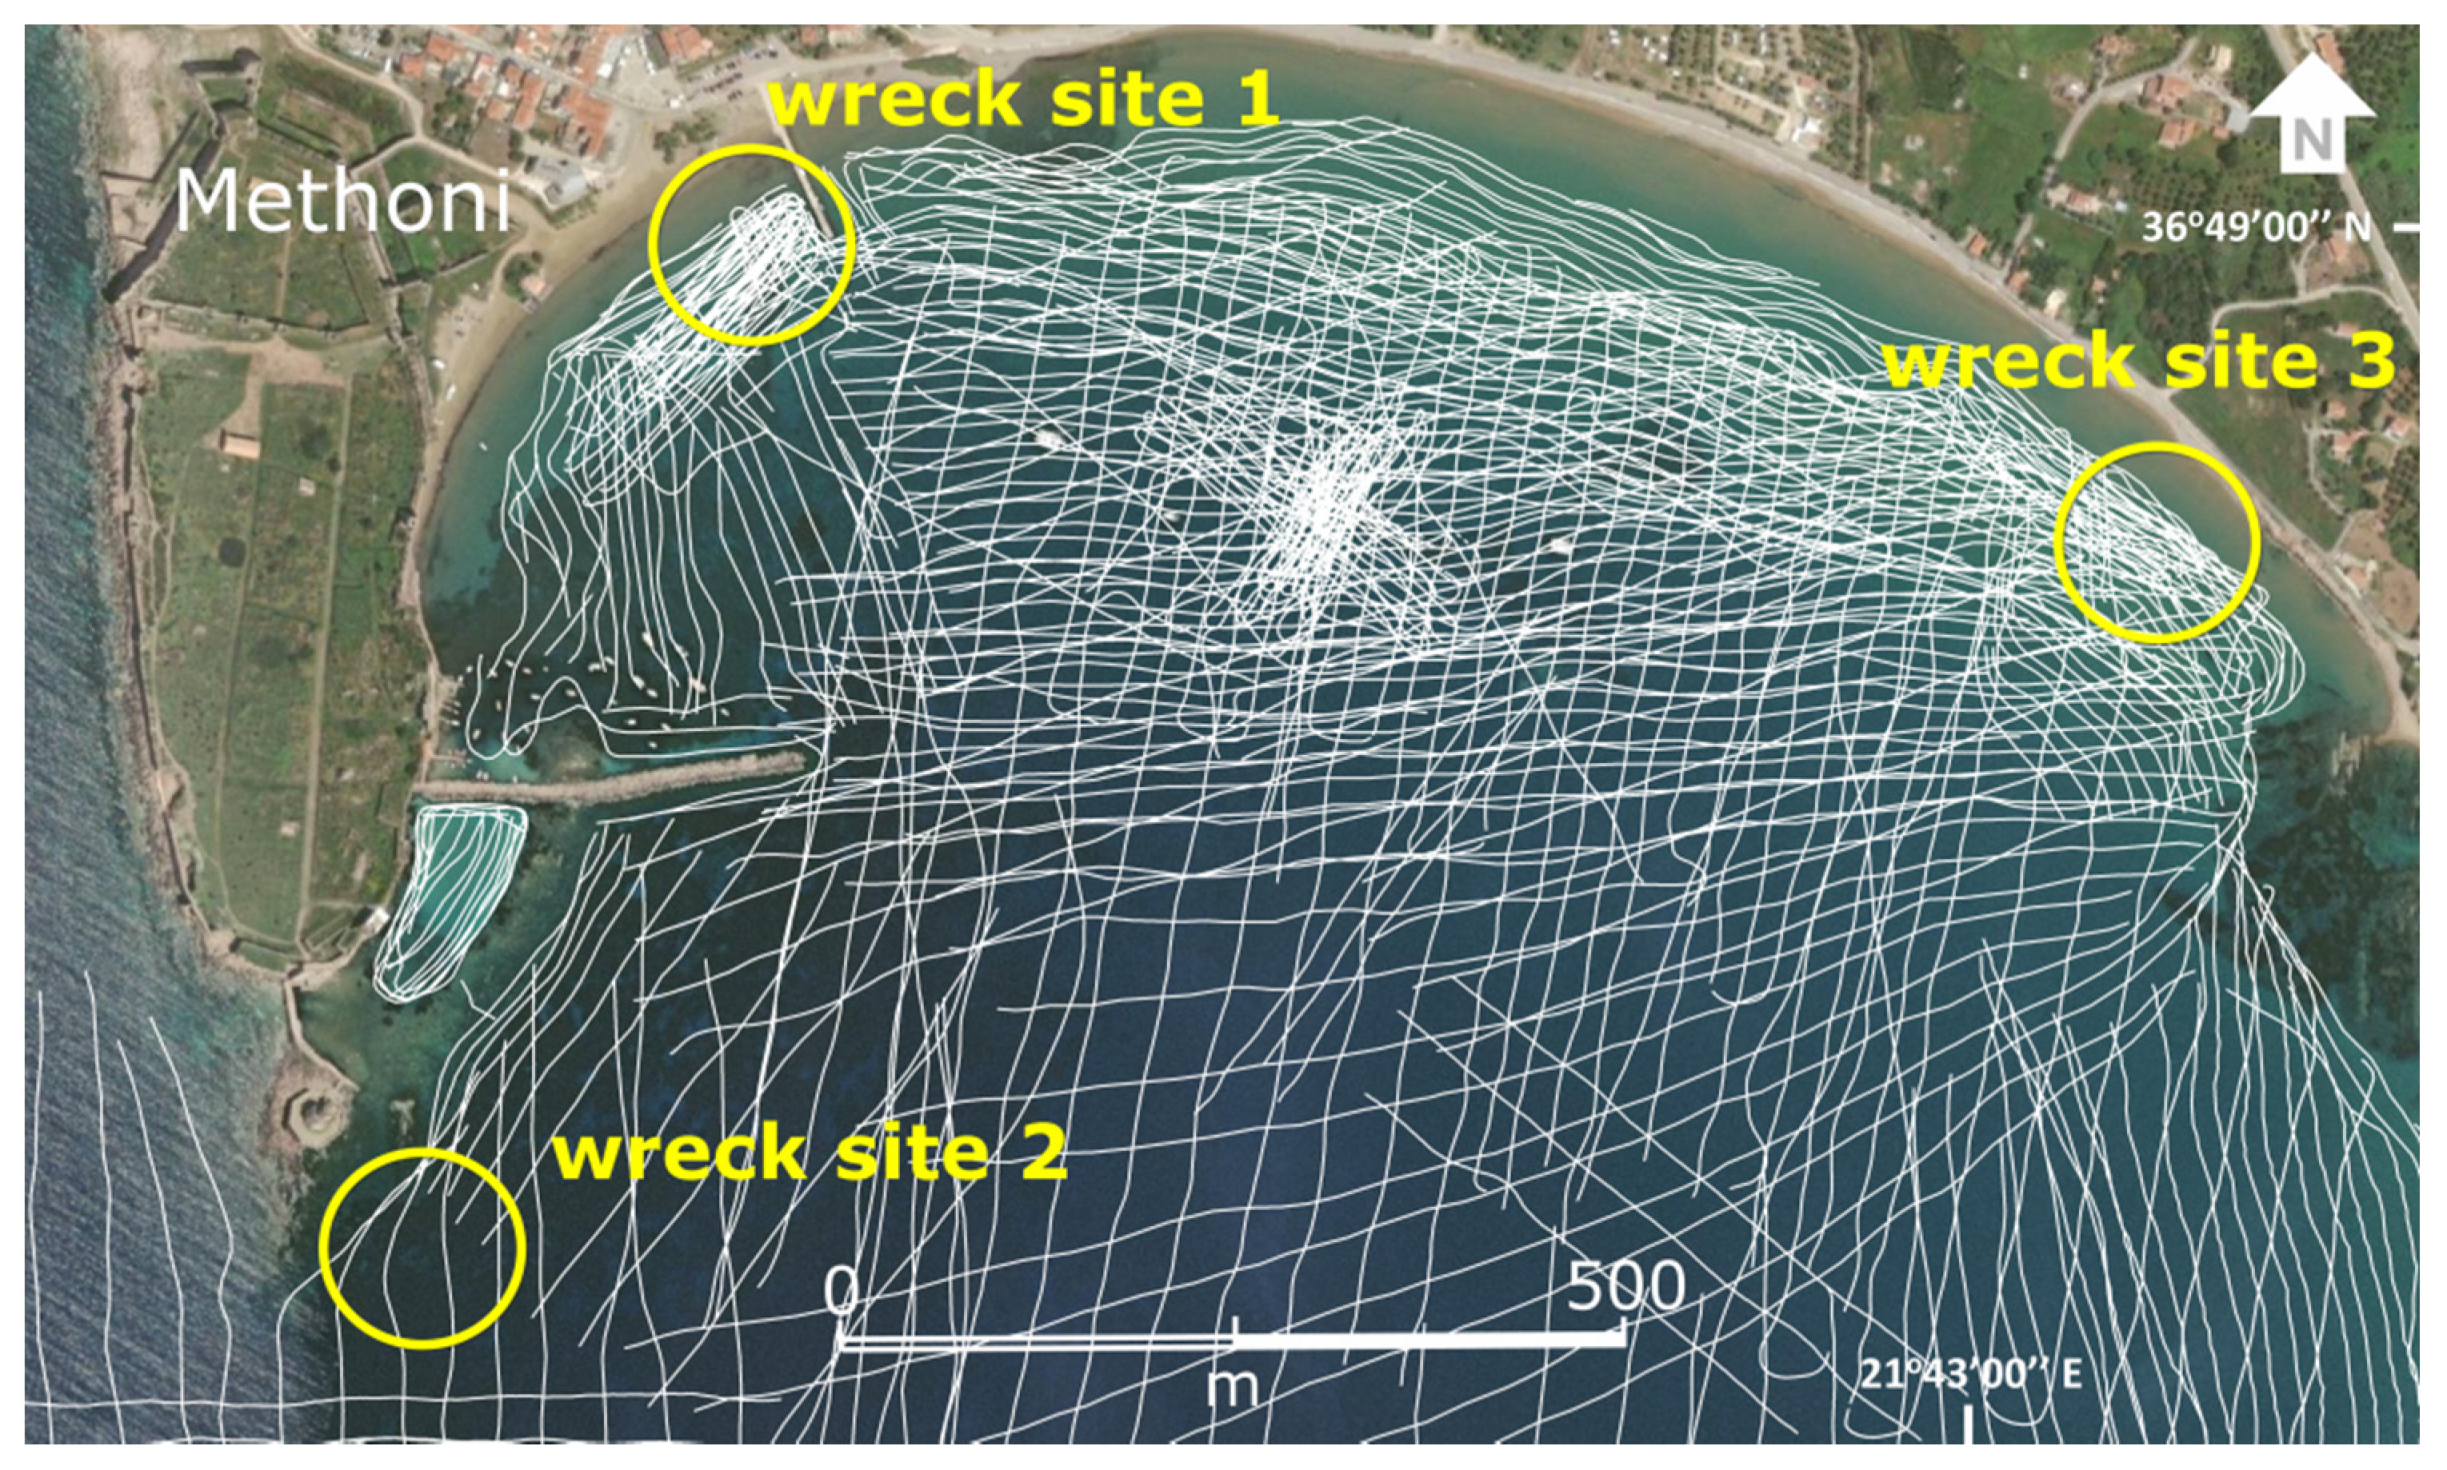
2. Survey Design and Instrumentation

The survey was organised in two phases. In the first phase, a marine geophysical survey was conducted in two stages with the use of a rigid hull inflatable boat. In the first stage a wide-scale survey was carried out, while in the second stage of the first fieldwork phase and in a downscaling approach to it, extra grids of track lines were run over the wreck sites for improved density of the acquired data. Figure 2 shows the survey track lines. For the integrated marine geophysical survey, data was acquired with the use of a side-scan sonar, a sub-bottom profiler, a magnetometer, and a phase measuring bathymetric sonar. The side-scan sonar was deployed over the side of the boat instead of towed behind it, due to water-space limitations. The acquired seafloor backscatter intensity data defines the geo-acoustical properties of the seafloor and of any manmade feature on it on a spatial context, given that a rough interface scatters more acoustical energy than a smooth one, or a hard material underwater sends back higher echoes than a soft one [18]. Hence, the side-scan sonar provided geomorphological maps of the shipwrecks, the artefacts, and the seafloor. The 3D reconstruction of the shipwrecks’ sub-bottom section was based on the interpretation of acoustic types and high-amplitude anomalies in the seismic data from the chirp sub-bottom profiler, against acoustic types related to documented archaeological material. The magnetometer was deployed at an astern tow, with a theoretical layback of 20 m, attached on a floating aid due to water depth limitations. Its role was to aid in the detection of ferrous artefacts on or under the seafloor, recording the disturbance to the earth’s ambient magnetic field caused by their ferromagnetic material. The bathymetric sonar was operated to hydrographic standards for full seafloor coverage. Following the bathymetric data process, a quantitative 3D image of the wrecks, the artefacts and the surrounding seafloor at a regional and local scale was generated at a resolution that addresses many of the key questions posed in an archaeological study [8], including the big picture of the state of wreck preservation, and the impact of the wrecks on the physical processes and the surrounding seafloor, and vice versa. The bathymetric sonar produced simultaneous bathymetry and backscatter intensity data that is co-registered, calibrated, and does not significantly suffer from sensor motion induced artefacts.
In the second fieldwork phase, coastline mapping was conducted, and features of archaeological interest were precisely positioned by a diver using a pole mounted GNSS and mobile mapping techniques. Underwater images and videos of the archaeological features, for ground-truthing, were also taken in pre-planned positions.
All acquired datasets were processed to give finalised products and then were integrated in a geographical platform together with ancillary data and data from past archaeological or geophysical surveys for analysis in four dimensions. For the integrated marine geophysical survey, data was acquired with the use of: (i) a Kongsberg GeoAcoustics GeoPulse Plus chirp sub bottom profiler, (ii) an EG&G/Edgetech 4100P side-scan sonar and (iii) a Marine Magnetics SeaSpy overhauser magnetometer. Bathymetric and co-registered side-scan data was acquired with the use of a GeoSwath Plus Compact phase measuring bathymetric sonar (PMBS). Precise point positioning was conducted with the use of a Leica GS14 dual frequency GNSS receiver, applying network Real-Time Kinematic (RTK) positioning solutions. Positioning, navigation, and timing data onboard the survey boat were acquired with a Hemisphere VS101 GPS Compass, and a Hemisphere Vector V103 GNSS. Positional accuracy was enhanced with the reception of European Geostationary Navigation Overlay Service (EGNOS) [19] corrections. Auxiliary sensors were also deployed onboard and ashore for improved data accuracy. Bathymetric and backscatter data was acquired with the Kongsberg GS4 software and processed with the CARIS HIPS and SIPS and the GS4 software. Magnetic data was acquired with the Marine Magnetics SeaLink software and side-scan data was acquired with the EdgeTech Discover software. Seismic data was acquired through the Kongsberg Geoacoustics GeoUTS software, while side-scan, seismic and magnetic datasets were processed through the iXBlue Delph software. All datasets were fused for analysis in the iXBlue Delph Roadmap 3D geographical platform.

3. Results and Discussion

In the following sections, the study of wreck site 1 showcases how 3D synthesis of data supports the interpretation of underwater cultural resources and wreck site formation processes, as well as the assessment of a site’s archaeological potential. The study of wreck site 2 presents good practices of bathymetric data rendering for realistic shipwreck representation, while the study of wreck site 3 highlights the significance of temporal data fusion and analysis for interpretation of wreck site geomorphological evolution.

3.1. Shipwreck Site 1

3.1.1. Environmental and Archaeological Context

The wreck site 1 is situated a few meters off the Methoni coast (Figure 3) and is extending at water depths between 0.5 and 2.5 m, on a low slope seafloor covered with sand and locally coarser sediments. There is a lack of previous archaeological knowledge regarding the wreck site, which can be explained by the fact that the cultural material lies over the wave dominated nearshore zone and over a depositional area, between the modern breakwater and the Methoni mole. The long-term sand deposition has been attributed [20] to a process initiated by beach erosion and sediment suspension along the north/east coast of Methoni Bay, as well as by the fluvial input from the river that flows into the head of the embayment, and continues with the longshore sediment transport to the north and west, driven by westerly winds. Tidal effects on hydrodynamics are assumed negligible compared to the predominant littoral process in this microtidal beach [21]. The exposure of cultural material in the current epoch can be explained by a seaward sediment transport as a result of recent severe storm events and waves [22,23] from southeast directions. Prominent seabed features over wreck site 1 are the wreck mound and sediment heaps west and south of it.

3.1.2. Methods

The site was surveyed with all available geophysical sensors at 5 m line spacing. Major features of archaeological interest were precisely positioned using RTK GPS methods. Bathymetric and backscatter data was acquired at 250 kHz after calibration procedures. A short swath width of 15 m was used for the PMBS data acquisition, since under its operating principles, the along track data density and the across track data coverage are affected from the ping rate [18] and therefore from the swath width. The side-scan sonar was operated at 25 m range, and 500 kHz frequency. A sampling rate of 1 Hz was used for the magnetometer, and chirp sweep or pinger waveforms for the sub-bottom profiler according to local sediment distribution. The PMBS data processing followed workflow and parameters to suit the particular task of archaeological feature discrimination and precise 3D rendering. First, the data was statistically filtered so that some noise was removed from the dataset and valid soundings were thinned. Then, auxiliary data was applied to the dataset for tide reduction and sound velocity corrections. Examination and editing of navigation, gyro, and heave sensor data followed before the manual editing of data, outlier removal and hydrographic quality control [24]. Bathymetric surfaces were created from data gridded under various methods at 0.25 m. For the side-scan data, environmental, temporal, spatial, and geographic processing was conducted. However, the side-scan imagery data suffered from low positional accuracy, poor co-registration with bathymetry, and feature masking due to extreme environmental conditions and the sensor’s low altitude [25], so PMBS backscatter data were principally spatially synthesised with all other data after analogous processing. Magnetic data was corrected for diurnal variations, gridded at 1 m, and raw, processed, as well as gridded datasets, were fused with all other datasets. Chirp seismic reflection profiles were created from seismic data and then profiles were corrected for tides and georeferenced in the 3D geographic platform together with all other datasets. Following data synthesis and cross-examination, high amplitude reflectors interpreted to be wreck ruins, and features of archaeological or geological interest were picked and digitised manually on the vertical sections. All picks from the two-dimensional (2D) acoustic data and profiles belonging to the same acoustic interface were arranged in common triangulated irregular networks (TINs) which were then gridded on regular grids to provide digital elevation models (DEMs) for 3D digital reconstruction of the wreck structure and ruins.

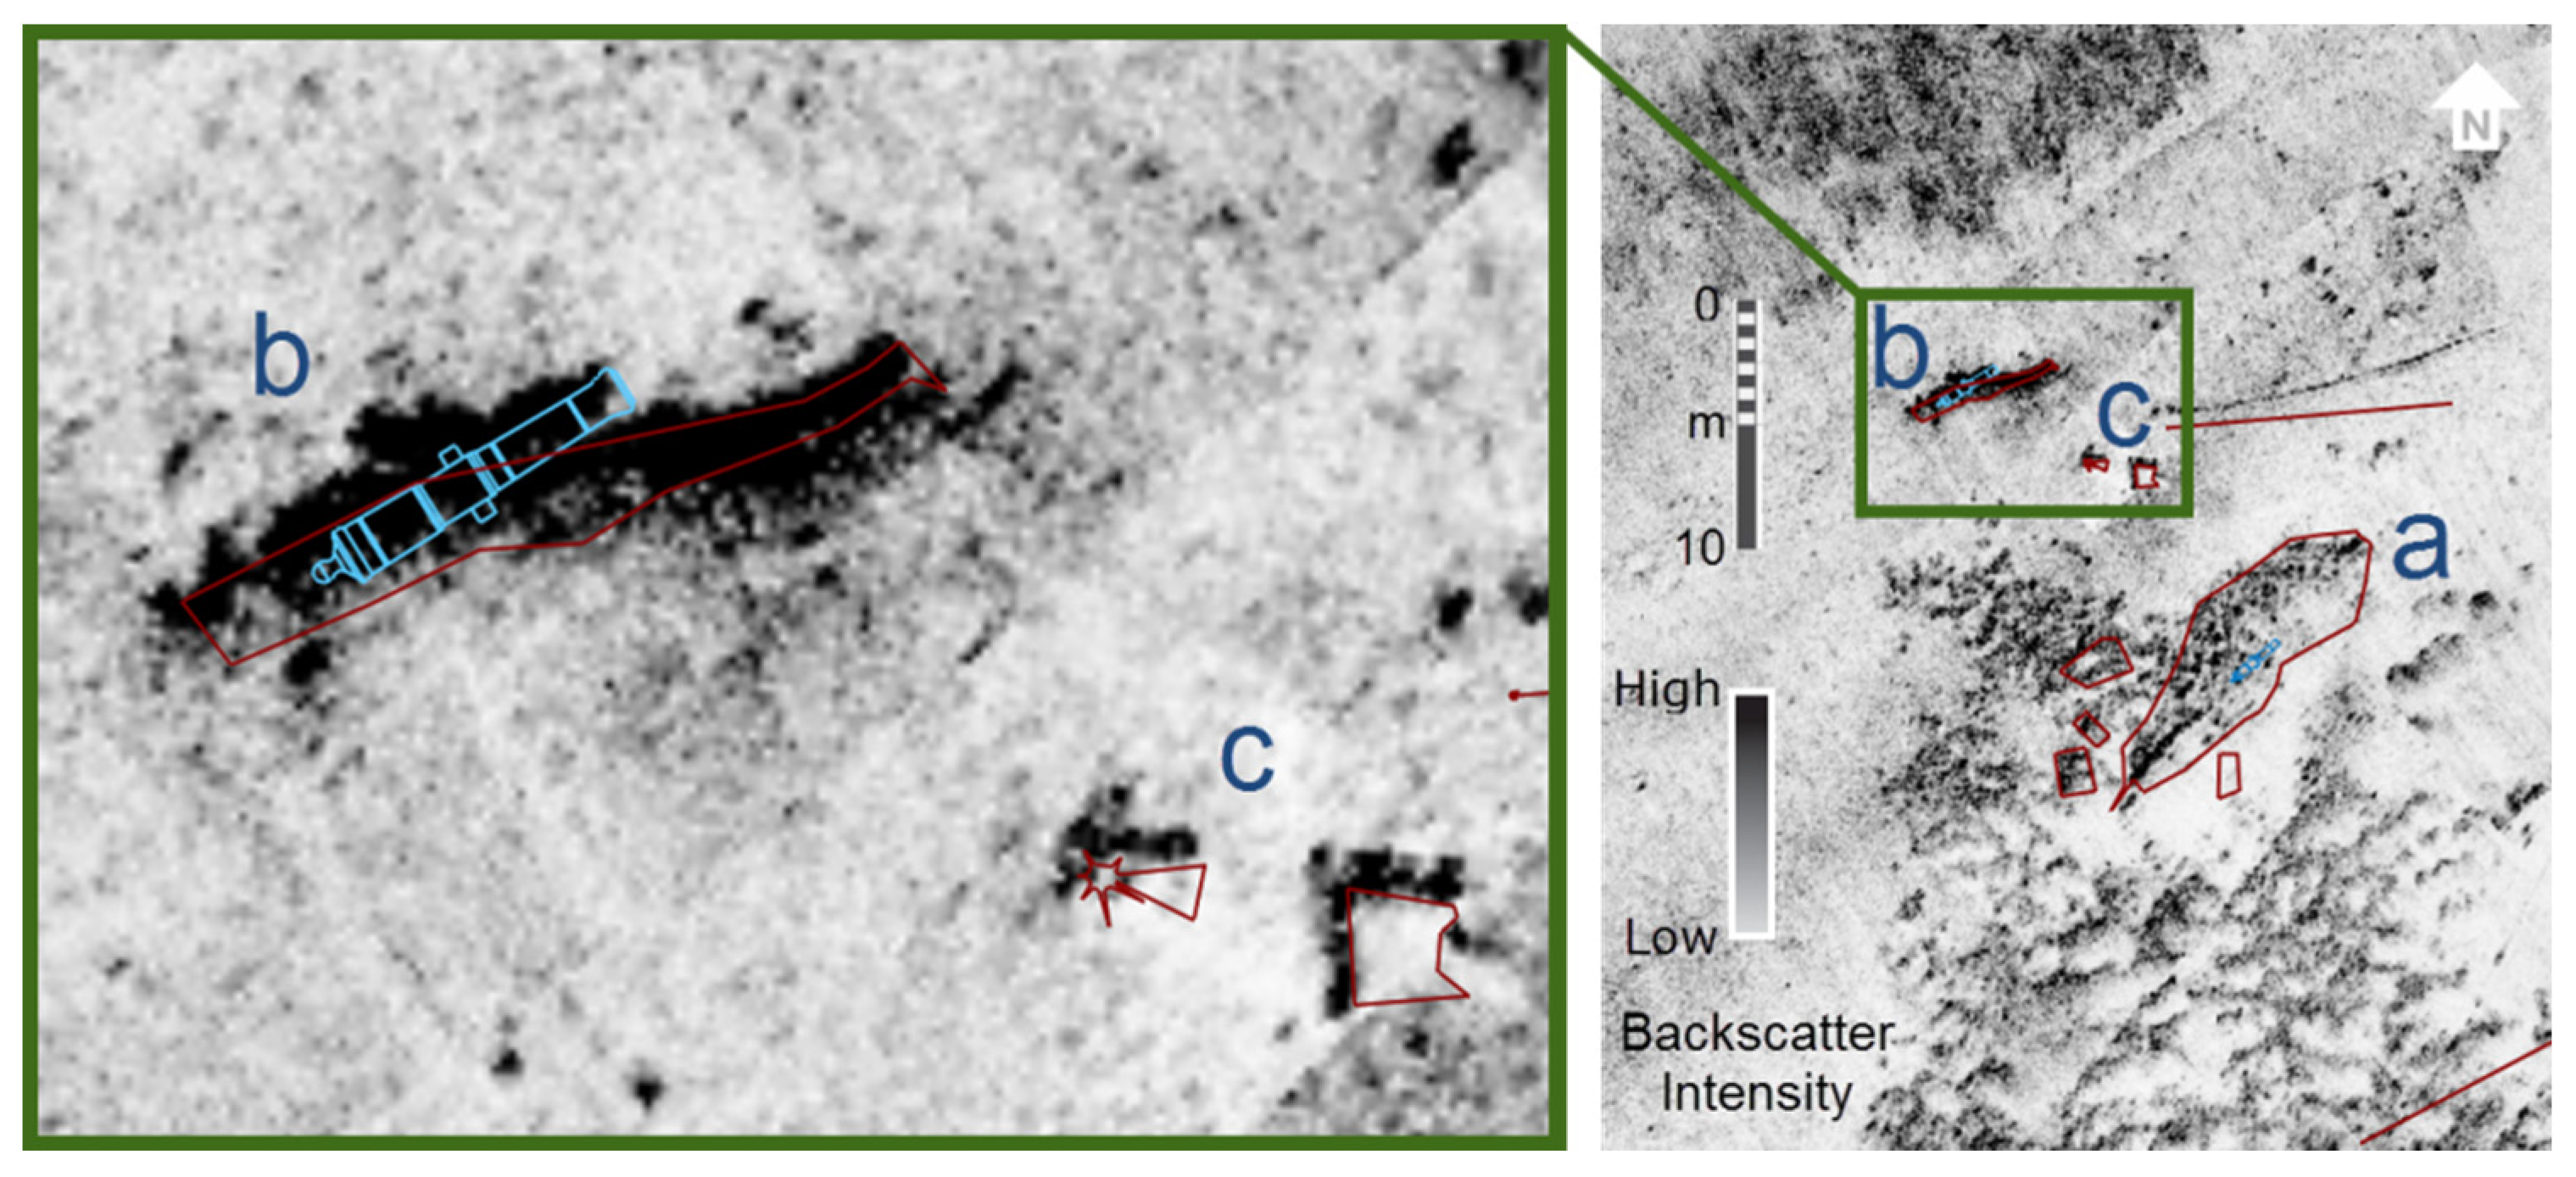
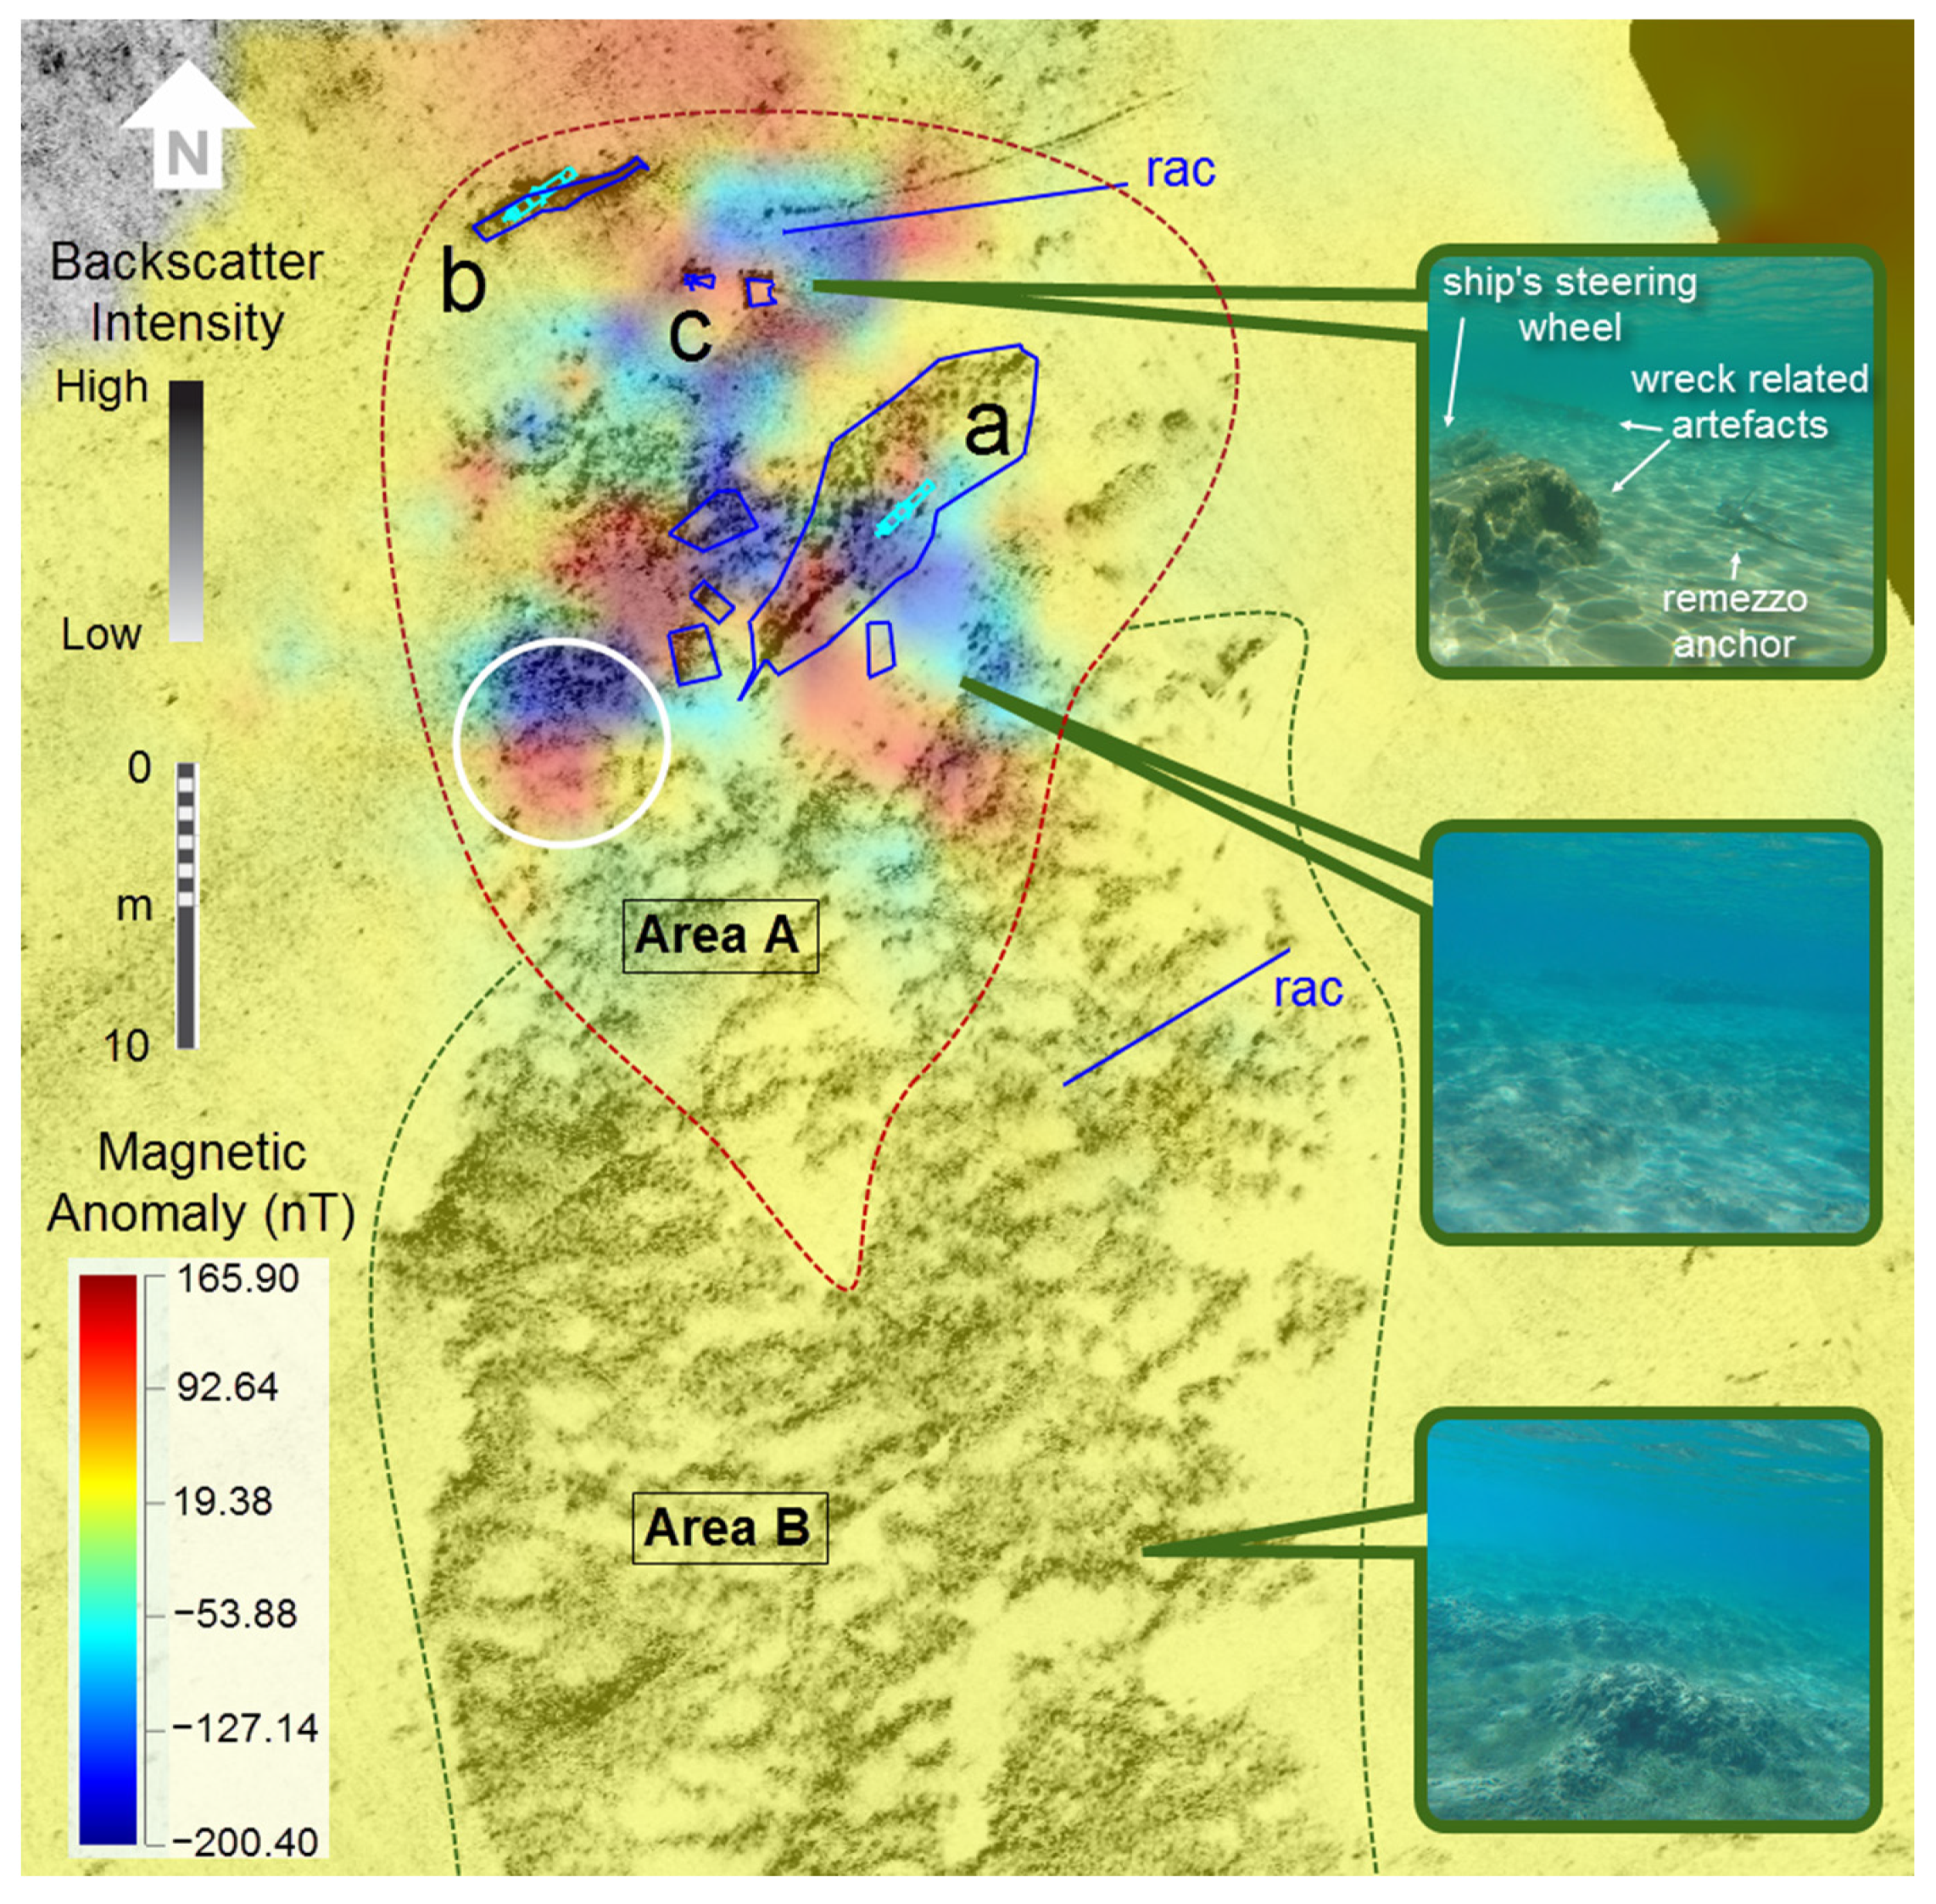
3.1.3. Results and Discussion

The synthesis of compensated backscatter imagery, bathymetry, magnetic and precise positioning data over the wreck site 1 (Figure 4, Figure 5, Figure 6 and Figure 7) shows that the northern and shallower section of the wreck site (area A—Figure 4 and Figure 6) can be considered as its main part. Area A is characterised by high-to-medium backscatter returns (Figure 4 and Figure 6, outlined in red). High backscatter returns correspond to an elongate NE-SW trending wreck mound (Figure 4a and Figure 5a), having a length of 13 m, and a width of 3.5 m, which accommodates a 2 m in length cannon on top of it. It also corresponds to an elongated gunwale-like feature (Figure 4b and Figure 5b), a steering wheel (Figure 4c and Figure 5c), and surficial archaeological material scattered at a range of about 15 m from the mound, in the wave (N-NW) direction, on a seafloor of homogeneous texture, according to ground-truthing records. The findings indicated are outlined by Computer-aided design (CAD) drawings in Figure 5 and Figure 6. Linear drawings and corresponding linear high backscatter signatures (Figure 6) represent remezzo anchor chains (rac) laid in close proximity to a ship’s steering wheel, highlighting the threats to the underwater antiquities from maritime activities.
Medium backscatter returns in area A, south and west of the mound (Figure 4 and Figure 6), correspond to sediment heaps without seagrass presence. This medium acoustic backscatter response at 250 kHz can be attributed to the penetration of the acoustic waves under a thin veneer of sand into the subsurface and its reflection off the ultra-shallow buried features [26], as well as to the variability of the angle of incidence of the acoustic signal [27] on the heap slopes. Cross-examination of integrated bathymetric, seismic, magnetic, and precise positioning data (Figure 6 and Figure 7) shows that ferromagnetic material, probably wreck-related scattered artefacts or structural elements, are covered under the sediment and into the heaps. Figure 7 illustrates in 3D the wreck mound and the heaps’ bathymetry, which are colour-coded, as well as drawings outlining the wreck mound periphery and scattered wreck-related material. The magnetic anomaly over a sediment heap (Figure 7d) along a boat transect (in purple colour) and the high amplitude acoustic reflectors in the form of chaotic acoustic facies under the heap along a seismic geosection of the same transect, indicate the existence of wreck-related material buried into the heap. The magnetic anomaly over the heap is readily shown in Figure 6 (within Area A and the white circle) and the sub-seabed acoustic reflectors under the sediment into the heap are shown in Figure 8. However, the integration of data in a common 3D framework (in a way Figure 7 instantaneously represents) makes interpretation fast, more accurate and interactive, yet hard to be presented through paper.
Further south, up to 50 m off the wreck mound (area B, outlined in blue—Figure 4 and Figure 6), high backscatter returns corresponding to accumulated sediments in seagrass meadows are noticeable according to ground-truthing records and through the bathymetric data (Figure 3 and Figure 6). This high backscatter response can be attributed to the distribution of the seagrass Cymodocea nodosa [28] and specifically to the acoustic properties of its rhizome and root structure [29,30]. The seagrass meadows are believed to have contributed to the wreck’s hull planking and framing preservation in this wave dominated area, by trapping and binding sediment particles hence raising the seafloor [31] south of the wreck ruins and towards the open sea, attenuating incident waves and currents [32]. It is well known that seagrass meadows act as security vaults for underwater cultural heritage and particularly for shipwrecks. The seagrass leaves trap sediment particles in the water column as water passes through them. Due to viscous drag, the water velocity is slowed, causing the sediment particles to fall out of the water column and resulting in sediment mounds [33]. However, the formation of oversized heaps off the wreck mound and towards the open sea must be further examined due to the absence of significant magnetic anomalies over that section of the wreck site and the low density of seagrass over the heaps.
The interpretation of seismic profiles over wreck site 1 shows that under the wreck mound, high amplitude reflectors in the form of chaotic acoustic facies extend up to c. 0.5 m below the seafloor and can be attributed to the lowest part of its hull, which is sat on a subparallel to the seafloor geological horizon (Figure 8). This horizon possibly represents the seafloor at the time of the wrecking event and its depth is in near full agreement with the charted depths shown at a British Hydrographic Office chart depicting the Methoni Bay, dated 1865 [34].
The interpretations of the shipwreck ruins from all acoustic profiles (Figure 9a) were commonly arranged to create a georeferenced 3D model of the shipwreck (Figure 9b), while a 3D representation of the wreck site potential extent was created from analysis of the fused geophysical data, to be used for future geoarchaeological investigations. Although the shipwreck representation has low resolution (0.5 m), it provides a well-defined model in space in relation to the other artefacts and the environment, and answers basic archaeological questions such as spatial delimitation of the wreck structure and the wreck site for future excavations. The dimensions of the digitally reconstructed wreck mound, which probably represents the shipwreck hull, wreck-related structural material, and ballast, are c. 23 m in length, c. 5.5 m in width, and c. 0.7 m in height.
The distribution of magnetic anomalies around the mound, mainly in the direction of the wave flow (Figure 6), together with underwater photographic captions, suggests a high concentration and wide distribution of ferromagnetic materials over the surf zone, as well as wreck-site arrangement controlled by storm events from south directions.
Although the identity of the shipwreck is still unknown, some hypotheses can be suggested for further investigation, based on the findings and the environmental parameters of the shipwreck site. As the main shipwreck mound (Figure 3 and Figure 4a) is lying 60 m off the shoreline and almost parallel to it, at the time of the wreckage the ship should either have been at anchor, or not under command and in that case the wrecking event should not have been short in time. Given the existence of two cannons across the wreck site, one over the wreck mound and another one over a gunwale-like feature (Figure 5 and Figure 6), the wrecked ship (if only one) should have been a fighting merchant ship or a warship. Further archaeological study can reveal the possible existence of buried wreck-related materials or another shipwreck over the site. Further archaeological study can also provide evidence to possibly connect the shipwreck with the losses following the local naval engagement between the Greek and the Turko-Egyptian fleet in April 1825.

3.2. Shipwreck Site 2

3.2.1. Environmental and Archaeological Context

The shipwreck site 2 lies 100 m southeast of the Methoni cape (Figure 1), which is the prominent natural feature in the area and a natural breakwater of the ancient and medieval port against the prevailing westerly winds and waves [35]. The headland is an Eocene limestone plateau [20], which extends 1 nm underwater to the south, forming a linear ridge that has a least depth of 5 m. Away from the rocky headland and the top of the ridge, the seafloor deepens abruptly down to 15–20 m water depth where it comprises of soft sediments. The cape and its geomorphology have posed a threat to the coastal navigation over previous centuries, when wind was the main type of ship propulsion. Adverse sea conditions and physical changes close to the shore or over the underwater ridge with breaking waves, or increased wave height and steepness [36], are believed to have driven the wrecking process. The ship was wrecked a few meters east of the Methoni cape, between 6 m and 8 m of water depth, on a sloping bottom of high rugosity. The wreck site actually consists of an aggregation of marble blocks and columns with no evidence of structural ship remnants. The type of remnants at the wreck site 2 resemble those of two other shipwrecks located in the adjacent Sapientza Island, the ‘shipwreck of columns’ [37], 1 nm off Methoni cape, and the ‘shipwreck of marbles’ [38], 3 nm off Methoni cape, which is dated in the early Roman period. The shipwreck has never been documented publicly to the authors’ knowledge.

3.2.2. Methods

The shipwreck was detected at the bathymetric data process stage. Hence, over the wreck site only bathymetric and backscatter intensity data was collected using the PMBS, following standard calibration procedures at 250 kHz. A 45 m swath width was used for each PMBS channel and lines were run at a 25 m interval for 150% seafloor coverage, and for the insonification of seafloor features from all sides.
As for the shipwreck site 1, the data processing followed workflows and parameters to suit the particular task of archaeological feature discrimination and precise 3D rendering. Data was gridded under various methods at 0.25 m and bathymetric surfaces were created. For mosaicing backscatter imagery, the raw acoustic data was acquired applying source level corrections, and in the post-process stage the data was corrected for static and time-varying gains, gain normalisation, receive beam pattern, slant range and sound velocity. Further post-gridding enhancements of the output imagery, such as despeckling and signal level, were made. By co-registering and draping acoustic imagery of compensated backscatter intensity over the bathymetric surface, both qualitative and quantitative analysis of the wreck site has been achieved. Backscatter intensity can, up to some point, be considered as a first-order indicator or proxy for the seafloor interface nature, composition, and small-scale structure, and hence provide a direct link with a site’s geology, biology, and ecology [18].

3.2.3. Results and Discussion

According to measurements from the post-processed bathymetric data, the wrecked cargo consists of: (i) a marble block 8.5 m, 2 m and 1.5 m in length, width and height, (ii) a marble block 7 m, 2.4 m and 1.1 m in length, width and height, (iii) a marble column 9 m and 1.5 m in length and diameter, (iv) a marble column 7 m and 1 m in length and diameter, and (v) a marble fragment 3 m, 3.5 m and 1 m in length, width and height (Figure 10). Another fragment questionably exists under the small column. No evidence of the ship’s hull or other structural parts exists in the data.
The precise 2D and 3D rendering of a feature consisting of orthogonal planar sections is challenging, since any attempt to create a surface from a regular grid of depth soundings displaying depth values based on data points neighbouring the grid node, leads to features rendered falsely compressed and rounded (Figure 11a). This is particularly evident in the vertical planar sections of the marble blocks, as a result of summing and weighting data points with a large standard deviation within single grid cubes to assign a single depth value per node for surface creation. In order to maintain the edges, the uppermost shape of the orthogonal planar sections and the overall wreck profile and periphery, a bathymetric surface displaying the shoalest soundings contributing to a node at their true position was created (shoalest depth true position: SDTP surface) (Figure 11b). The differences between the regularly weighted, gridded bathymetric surface and the SDTP surface are quantified in Figure 12, where Figure 12a,b show the two bathymetric models, respectively. Figure 12c is a graph showing the differences between profiles of a surface created from data weighted and gridded, and the SDTP surface, from a common section across a marble block of the wreck’s cargo. Figure 12d quantifies the differences between the two surfaces all over the wreck site and specifically over the wreck cargo.
As seen in Figure 12b,c, gridding and rendering data at an SDTP surface introduces acoustic artefacts over its whole extent that may undermine local trends in seafloor morphology, such as bedforms. This is more intense when data are acquired with the use of phase measuring sonars that exhibit a large standard deviation of depth soundings away from nadir. Hence, SDTP surfaces should be created for precise rendering and analysis of archaeological material, but at the same time bathymetric surfaces from weighted and gridded data should be created for reliable presentation of seafloor morphology and precise analysis of seafloor processes. Although gridded formats facilitate the management and fusion of large datasets, processed bathymetric point clouds are ultimately realistic and should be examined at the stage of feature analysis [8], as the shape of features overhanging in the water-column tend to be generalised when data are gridded, even at an SDTP surface in high resolution.
Figure 13 illustrates the compensated backscatter intensity surface over the wreck site 2, overlaid atop a bathymetric surface, providing information about the distribution of seafloor properties around the shipwreck, easier identification of archaeological material over the seafloor, and better interpretation of acoustic shadows, since they do not eventually become a no-data 2D section of the backscatter image. Through the 3D backscatter intensity mosaic, the wrecked cargo is imaged as a group of very high backscatter anomalies with certain geometrical shapes.
The infralittoral biotope of wreck site 2 is characterised by discrete high and low in turn backscatter returns around the wrecked cargo (Figure 13). Ground-truthing using a drop-down camera and direct diver observations underlined a biomodal distribution of cobbles and pebbles among Posidonia Oceanica seagrass communities. Medium-to-high density plants occupy the mixed ground, while low density seagrass communities are found in close proximity to the wrecked cargo in the landward-north direction. Suppression of local bathymetry around the wreck, extending up to 10 m away from it, principally in the north direction (Figure 12a,b), can be explained by the locally limited presence of Posidonia reefs, possibly due to seagrass reproduction strain.
As there are no available archaeological or historical records for the wreck site; only assumptions can be made for the wrecking event. The ship possibly sunk drifting on 280 degrees course from increased wave height and steepness as waves from south directions came to shallow water [36]. Further archaeological studies are needed to provide wreck dating and detailed records of other artefacts and material probably covered by the loose sediments.

3.3. Shipwreck Site 3

3.3.1. Environmental and Archaeological Context

The shipwreck site 3 lies over the north-eastern part of Methoni Bay (Figure 1), at a water depth of 2–2.5 m on a low slope seafloor covered with sand. It is situated over the surf zone, 70 m off the current coastline. The site and the underlying coast are subject to increased wave attacks from the southeast and southwest directions, and there is evidence [14] that indicates long-term coastline erosion and recession along the eastern shoreline of Methoni Bay. Longshore sediment transport processes are driven mainly by waves from southwest, and longshore currents flow from south to north [20].
The site became known in August 2012 when personnel of the Greek Ephorate of Underwater Antiquities detected a cannon lying on the seabed. It was geophysically surveyed a few days later in the context of the ‘GE.N.ESIS Project’ [16], when a second cannon 8 m away from the first one, a prism of stone cannonballs, and a group of non-defined semi-buried metal artefacts, were brought to light; without, however, signs of a ship’s structure. During the marine geophysical survey in September 2015, the wreck site 3 and the archaeological artefacts were found to be completely covered by sand, suggesting a high-energy coastal environment. Archaeological excavation is needed to provide detailed records and dating of the ship’s remaining material and artefacts.

3.3.2. Methods

The fieldwork strategy and data acquisition parameters were the same as for the shipwreck site 1. Precise positioning was not carried out due to complete burial of archaeological features over the site. The PBMS, side-scan and magnetic data processing also followed the same workflows as for the shipwreck site 1, while the seismic data processing followed parameters to suit the particular task of archaeological feature detection, discrimination and delimitation in the very shallow water environment. Chirp seismic reflection profiles were corrected for tides, georeferenced, and were interpreted in conjunction with all other datasets, as well as with seismic profiles created following the 2012 survey, in a 3D geographic platform. High amplitude subsurface reflectors interpreted to be wreck ruins and features of archaeological interest were picked and digitised manually on the vertical sections at a high and a low confidence level. All picks from common acoustic interfaces were arranged in common DEMs for 3D wreck reconstruction and wreck site delimitation. Since no hydrographic survey was conducted in 2012, the seafloor seismic reflector at that time was digitised on sub-bottom profiles and was arranged in a gridded surface in order to provide the bathymetry of the 2012 seafloor, which was also fused with all other datasets in the 3D geographic platform.

3.3.3. Results and Discussion

Following the process of 2015 datasets, the bathymetric and backscatter intensity surfaces over shipwreck site 3 show no traces of the wreck’s ruins or artefacts on the seafloor. However, archaeological assets over the site have been precisely positioned and documented in 2012, when they were lying exposed on the seafloor. Figure 14 shows the precise position of archaeological assets over the site, as they were recorded in 2012, temporally fused with the low backscatter intensity seafloor surface as created in 2015 and which contained fine sand covering the antiquities.
A 4D integration of seismic geo-sections in a common spatial framework reveals and quantifies locally the sand deposition over the wreck site between 2012 and 2015. Figure 14 shows in 3D, crossline sections from 2012 and 2015 of seismic profiles over the site, as well as the interpretation of wreck-related features. The spatio-temporal fusion of seismic data highlights a net deposition of 0.7 m of fine sediments over the antiquities in the time span 2012–2015. Analysis of historical satellite imagery over the site and coastlining data also show seaward advance of the shoreline in the time span between 2013 and 2015 (Figure 15b). This fact, together with the exposure of wreck ruins over wreck site 1, and the accretion of the sedimentary coast close to the site, indicates either inversion of the predominant longshore transport coastal processes, which has already been described by Kraft and Aschenbrenner [20], or more complex coastal processes involving longshore and cross-shore sediment transport, and human interferences [39], such as the extension of a modern mole at the centre of the north coast that intercepts the westward longshore drift.
A more detailed investigation of the nearshore and surf zone bathymetry across the northeast section of the Methoni Bay (Figure 16) reveals distinct seafloor process signatures characterized by consecutive alongshore depositional and erosional bedforms, which imply processes of sediment redistribution at a local scale. According to the Wright’s [40] classification scheme, in 2015 the surf zone along the northeast section of the bay was at an intermediate morpho-dynamic state. Wright [41], Short and Hesp [42] observed that the erosion of intermediate beaches including the surf zone is dominated by the presence of rip currents, which can move water and sediment offshore [43]. Rip current flow is driven by alongshore variations in breaking wave height and the imbalance between the breaking wave force and the spatial pressure gradients [44], while the alongshore variability in time-averaged breaking wave energy dissipation can arise from alongshore variability of the surf-zone bathymetry and the presence of rigid boundaries, such as rocky outcrops [45]. Field studies [46] have shown that the rip current flow can be confined primarily within the surf zone in semi-enclosed vortices, is ruled by bathymetric controls, and may also in turn alter the nearshore morphology [45].
Although limited research has been undertaken globally into bathymetric controls on surf zone current variability, and no field studies exist on Methoni beach rotation and current circulation, it is assumed that following the wrecking event, which probably found the ship at anchor or in an attempt of grounding due to severe hit, destructive storm events sustained damage to the ship’s structure. During the accretionary states of the beach, sediment would have accumulated among the ruins and artefacts, forming a heap of accumulated sand deposits on it, hence introducing variability of the surf-zone bathymetry. The alongshore bathymetric nonuniformity is believed to have driven and exerted controls on surf-zone rotational currents, including strong control over mean velocity and directional variability [47]. The cuspate seafloor features on both sides of the shipwreck ruins (Figure 16) imply cellular circulation under low circulation velocities as they do not include distinct neck channels [48], and rip current flow confined primarily within the surf zone in semi-enclosed vortices [45], in line with the results from field studies [49]. Rip currents are considered to represent an important mechanism for water and sediment transport offshore [50], particularly during storm events [51], hence the Methoni beach rotation should be characterized by sediment exchange not only in the along-shore direction [20] but also in the cross-shore direction at various time-scales, which is apparent when analysing its erosional state in 2012 in contrast with its accretional state in 2015 (Figure 15). Current circulation regime and structure, cross-shore sediment transport, and beach rotation patterns need to be examined rigorously in the field, since current awareness provides hazard assessment to stakeholders for establishing an underwater museum and implementing an integrated coastal management plan in the area [13]. Besides, care should be taken in all sedimentological and morphological interpretations, as they are controlled by the temporal variability of data records and may over-acknowledge, or may not acknowledge, storm-dominated processes across the wreck site.
Spatio-temporal analysis of magnetic anomaly maps over wreck sites from datasets acquired at different instants can highlight cultural site formation processes, in the form of human interaction with the wreck site and its associated components [52]. Disturbance of underwater cultural heritage resources can be caused by degradation, scattering or intentional movement of cultural material due to the wave or current action or due to human intervention in acts of looting or anchorage and would be noticeable by weakened, shifted or absent peaks of magnetic anomalies in the magnetic field anomaly maps. A comparative analysis of contour line anomaly maps over wreck site 3 from datasets acquired in 2012 and 2015 is shown in Figure 17, where it is apparent that the iso-contour patterns are consistent (Figure 17a) except for the prominent high-amplitude, short-wavelength positive anomaly over the westerly cannon, which is found to have shifted by 10 m southeast and paired with a definite negative anomaly (Figure 17b). Such a shift possibly implies a cannon movement and cannot be attributed to the wave action, which always has a northwest-northeast direction. A repetitive magnetic survey under the lowest possible line spacing and high sample rate can verify the findings and contribute to the monitoring and management of the cultural site.

4. Conclusions

The correlation of bathymetric, marine geophysical, and positioning data fused in a common 3D geographical platform, has proved to provide the reliable and fast detection of features of archaeological interest over and under the seafloor. This is due to feature interpretation that is based on interactive analysis of datasets acquired in separate planes and fused in three dimensions, instead of examination of datasets by contrast. Co-registering a compensated backscatter intensity surface over bathymetry also supports easier identification of archaeological material over the seafloor.
Although the 2D or 3D digital reconstruction of a shipwreck in an intact state lying on the sand is a straight-forward process with the use of sonars, the digital representation in three dimensions of scattered and partially buried shipwreck ruins in complex geology is challenging. However, it is possible through data integration and cross-examination in a common 3D geographical platform, combined with ground-truthing outcomes, as every dataset acts as interpretive and complimentary to each other, and their synthesis provides a comprehensive digital picture of the shipwreck. By this method, the digital representation of shipwreck ruins is answering basic archaeological questions, such as wreck structure spatial delimitation, and assessment on a wreck’s state. As the shipwreck representation provides a well-defined model of space in relation to the underwater environment, assessments have been also made on the wrecking events and the wreck sites’ arrangement at the time of the events. The creation of an SDTP bathymetric surface and the point cloud data rendering, support the realistic wreck representation over the seafloor, while surfaces from weighted and gridded data should also be created for pragmatic representation of geomorphology. Moreover, the 3D wreck site data synthesis reveals distinct signatures of seafloor processes and physical controls affecting the seafloor, which are important for understanding the interaction between shipwrecks and the underwater environment, the ruins’ preservation potential and for ensuring the safety of diving operations when an underwater museum is suggested for establishment.
The 4D synthesis of bathymetric, marine geophysical, and positioning data from shipwrecks off Methoni, has proved to provide knowledge on the wreck sites’ morphological evolution through time. Analysis of data acquired in time intervals on a common geographic framework points at sediment transport and current circulation processes, which are important for understanding the wrecks’ preservation potential, and their suitability as diving sites. Spatio-temporal data can highlight the degradation of underwater archaeological resources by scattering due to the wave or current action and their disturbance by intentional movement or decomposition due to other human activities. Further repeated field measurements are needed across the Methoni Bay, for defining a model of wreck site morphological evolution and circulation, given that interpretations are controlled by the temporal variability of data records and storm-dominated processes.

Author Contributions

Conceptualization, P.G.; data curation, P.G.; investigation, P.G.; methodology, P.G.; project administration, P.G.; resources, P.G. and G.P.; software, P.G. and G.P.; supervision, G.P.; visualization, P.G.; writing—original draft, P.G.; writing—review and editing, G.P. and M.G. All authors have read and agreed to the published version of the manuscript.

Funding

This research received no external funding. Authors received University of Patras funds to cover publication costs.

Institutional Review Board Statement

Not applicable.

Informed Consent Statement

Not applicable.

Data Availability Statement

Data sharing is not applicable due to privacy and ethical restrictions.

Acknowledgments

The authors extend special thanks to Aggeliki Simosi who, as Head of the Greek Ephorate of Underwater Antiquities at the time of fieldwork, supported the research, Ilias Spondylis, underwater archaeologist who contributed to the research with his deep archaeological knowledge and providing archaeological data ingest into the geodatabase, Despoina Koutsoumpa, underwater archaeologist who showed us the way through the governmental clearances and Aristides Michael, the boat skipper for the fieldwork. Many thanks go to Peter Schwarzberg for providing hydrographic data processing solutions and training, Martin Gutowski for supporting the hydrographic tasks by means of sonar instrumentation, Philippe Alain for providing geophysical data processing and fusion solutions, as well as the Metrica SA team for providing RTK positioning services at a fraction of the regular cost. Accordingly, we wish to acknowledge the support of Kongsberg Maritime, Teledyne Caris, iXBlue and Metrica SA towards the research results.

Conflicts of Interest

The authors declare no conflict of interest.

References

  1. Papatheodorou, G.; Christodoulou, D.; Baika, K.; Geraga, M.; Iatrou, M.; Heath, S.J.; Fakiris, E. A Marine Geoarchaeological Survey, Cape Sounion, Greece: Preliminary Results. Mediterr. Archaeol. Archaeom. 2014, 14, 357–371. [Google Scholar]
  2. Papatheodorou, G.; Geraga, M.; Ferentinos, G. The Navarino Naval Battle Site, Greece-an Integrated Remote-Sensing Survey and a Rational Management Approach. Int. J. Naut. Archaeol. 2005, 34, 95–109. [Google Scholar] [CrossRef]
  3. Quinn, R.; Breena, C.; Forsythea, W.; Bartonb, K.; Rooneyb, S.; Harab, D.O. Integrated Geophysical Surveys of the French Frigate La Surveillante (1797), Bantry Bay, Co. Cork, Ireland. J. Archaeol. Sci. 2002, 29, 413–422. [Google Scholar] [CrossRef]
  4. Geraga, M.; Papatheodorou, G.; Ferentinos, G.; Fakiris, E.; Christodoulou, D.; Georgiou, N.; Dimas, X.; Iatrou, M.; Kordella, S.; Sotiropoulos, G.; et al. The study of an ancient shipwreck using marine remote sensing techniques, in Kefalonia Island (Ionian Sea), Greece. Archaeol. Marit. Mediterr. 2015, 12, 183–198. [Google Scholar]
  5. Plets, R.M.; Dix, J.K.; Adams, J.R.; Bull, J.M.; Henstock, T.J.; Gutowski, M.; Best, A.I. The use of a high-resolution 3D Chirp sub-bottom profiler for the reconstruction of the shallow water archaeological site of the Grace Dieu (1439), River Hamble, UK. J. Archaeol. Sci. 2009, 36, 408–418. [Google Scholar] [CrossRef]
  6. Plets, R.; Quinn, R.; Forsythe, W.; Westley, K.; Bell, T.; Benetti, S.; McGrath, F.; Robinson, R. Using Multibeam Echo-Sounder Data to Identify Shipwreck Sites: Archaeological assessment of the Joint Irish Bathymetric Survey data. Int. J. Naut. Archaeol. 2011, 40, 87–98. [Google Scholar] [CrossRef]
  7. NCPTT (2007). The Use of Multibeam Swath Bathmetry for the Identification and Assessment of Underwater Archaeological Sites, Stony Brook University. 19 February 2007. Available online: https://www.ncptt.nps.gov/blog/the-use-of-multibeam-swath-bathymetry-for-the-identification-and-assessment-of-underwater-archaeological-sites2007-15/ (accessed on 6 November 2021).
  8. Mayer, L.A.; Calder, B.; Schmidt, J.S.; Malzone, C. Providing the Third Dimension: High-Resolution Multibeam Sonar as a tool for Archaeological Investigations—An Example from the D-Day Beaches of Normandy. 2003. Available online: http://ccom.unh.edu/publications/providing-third-dimension-high-resolution-multibeam-sonar-tool-archaeological (accessed on 26 October 2021).
  9. Petriaggi, B.D.; de Ayala, G.G. Laser scanner reliefs of selected archeological structures in the submerged baiae (Naples). ISPRS Int. Arch. Photogramm. Remote. Sens. Spat. Inf. Sci. 2015, XL-5/W5, 79–83. [Google Scholar] [CrossRef] [Green Version]
  10. Castillón, M.; Palomer, A.; Forest, J.; Ridao, P. State of the Art of Underwater Active Optical 3D Scanners. Sensors 2019, 19, 5161. [Google Scholar] [CrossRef] [PubMed] [Green Version]
  11. Quinn, R.; Boland, D. The role of time-lapse bathymetric surveys in assessing morphological change at shipwreck sites. J. Archaeol. Sci. 2010, 37, 2938–2946. [Google Scholar] [CrossRef]
  12. Quinn, R. The role of scour in shipwreck site formation processes and the preservation of wreck-associated scour signatures in the sedimentary record—evidence from seabed and sub-surface data. J. Archaeol. Sci. 2006, 33, 1419–1432. [Google Scholar] [CrossRef]
  13. Gkionis, P.; Papatheodorou, G.; Geraga, M.; Fakiris, E.; Christodoulou, D.; Tranaka, K. A marine geoarchaeological investigation for the cultural anthesis and the sustainable growth of Methoni, Greece. J. Cult. Herit. 2019, 42, 158–170. [Google Scholar] [CrossRef]
  14. Spondylis, I. Contribution in the study of coastal formation in relation to the location of new archaeological sites. ENALIA IV 1996, 3/4, 30–37. [Google Scholar]
  15. Lianos, N. A Study of the Ancient Harbour Works of Methoni; ARF: Athens, Greece, 1987. [Google Scholar]
  16. Gkionis, P. The GE.N.ESIS project—Georeferenced Depiction and Synthesis of Marine Archaeological Survey Data off Methoni and the potential of project evolution. In Proceedings of the Symposium of the Greek Ephorate of Underwater Antiquities (EUA), EUA—A Dive Into the Past—Underwater Archaeological Surveys 1976–2014, Athens, Greece, 6 March 2015. [Google Scholar]
  17. Ministry of Culture and Sports. Methoni Castle—History. 2014. Available online: http://odysseus.culture.gr/h/3/gh351.jsp?obj_id=7499 (accessed on 10 January 2020).
  18. Lurton, X.; Lamarche, G. Backscatter Measurements by Seafloor-Mapping Sonars. In Guidelines and Recommendations; Geohub: Eastwood, LA, USA, 2015; Available online: http://geohab.org/wp-content/uploads/2018/09/BWSG-REPORT-MAY2015.pdf (accessed on 10 January 2020).
  19. Lopez, M.; Antón, V. SBAS/EGNOS Enabled Devices in Maritime. Trans. Nav. Int. J. Mar. Navig. Saf. Sea Transp. 2018, 12, 23–27. [Google Scholar] [CrossRef] [Green Version]
  20. Kraft, J.C.; Aschenbrenner, S.E. Paleogeographic Reconstructions in the Methoni Embayment in Greece. J. Field Archaeol. 1977, 4, 19–44. [Google Scholar] [CrossRef]
  21. HNHS. Sea Level Statistics of the Greek Seas; HNHS: Athens, Greece, 2013. [Google Scholar]
  22. National Research Council. Managing Coastal Erosion; The National Academies Press: Washington, DC, USA, 1990; Available online: https://doi.org/10.17226/1446 (accessed on 29 February 2020).
  23. HNMS. Significant Weather and Climatic Events in Greece. 2014. Available online: http://www.hnms.gr/emy/el/pdf/2014_GRsignificantEVENT_gr.pdf (accessed on 29 February 2020).
  24. IHO. IHO Standards for Hydrographic Surveys. 2020. Available online: https://iho.int/uploads/user/pubs/standards/s-44/S-44_Edition_6.0.0_EN.pdf (accessed on 27 December 2020).
  25. Quinn, R.; Dean, M.; Lawrence, M.; Liscoe, S.; Boland, D. Backscatter Responses and Resolution Considerations in Archaeological Side-Scan Sonar Surveys: A Control Experiment. J. Archaeol. Sci. 2005, 32, 1252–1264. [Google Scholar] [CrossRef]
  26. Shang, X.; Zhao, J.; Zhang, H. Obtaining High-Resolution Seabed Topography and Surface Details by Co-Registration of Side-Scan Sonar and Multibeam Echo Sounder Images. Remote Sens. 2019, 11, 1496. [Google Scholar] [CrossRef] [Green Version]
  27. Lurton, X. An Introduction to Underwater Acoustics. In Principles and Applications; Praxis/Springer: Chichester, UK, 2010. [Google Scholar]
  28. ANMESAE. Coastal Erosion Protection Plan for Methoni; ANMESAE: Messinia, Greece, 2010. [Google Scholar]
  29. Siljeström, P.; Moreno, A.; Carbó, R.; Rey, J.; Cara, J. Selectivity in the acoustic response of Cymodocea nodosa (Ucria) Ascherson. Int. J. Remote. Sens. 2002, 23, 2869–2876. [Google Scholar] [CrossRef]
  30. Kiparissis, S.; Fakiris, E.; Papatheodorou, G.; Geraga, M.; Kornaros, M.; Kapareliotis, A.; Ferentinos, G. Illegal trawling and induced invasive algal spread as collaborative factors in a Posidonia oceanica meadow degradation. Biol. Invasions 2011, 13, 669–678. [Google Scholar] [CrossRef]
  31. Duarte, C.M.; Losada, I.; Hendriks, I.E.; Mazarrasa, I.; Marbà, N. The role of coastal plant communities for climate change mitigation and adaptation. Nat. Clim. Chang. 2013, 3, 961–968. [Google Scholar] [CrossRef] [Green Version]
  32. Edward, A. Developments in Marine Geology. In Shore Processes and Their Palaeoenvironmental Applications, 1st ed.; Elsevier Science: Amsterdam, The Netherlands, 2018; Volume 4. [Google Scholar]
  33. Hamdani, Z.A.; Bjordal, C.; de Bruyn, V.; Davidde, B.; Dencker, J.; Geraga, M.; Gregory, D.; de Hoop, R.; Jensen, P.; Jensen, J.B.; et al. SASMAP Guideline Manual 2: Best Practices for Locating, Surveying, Assessing, Monitoring and Preserving Underwater Archaeological Sites; SASMAP: Amersfoort, The Netherlands, 2015; p. 105. [Google Scholar]
  34. British Hydrographic Office. Plan of Mothoni, Greece; British Hydrographic Office: Downton, UK, 30 November 1865. [Google Scholar]
  35. Tenekentzis, K. Assessment of Ecological Status and Management Proposals in the Context of an Environmental Survey. 2006. Available online: http://hdl.handle.net/11610/11645 (accessed on 20 February 2020).
  36. Trujillo, P.; Thurman, V. Essentials of Oceanography, 12nd ed.; Prentice Hall: Hoboken, NJ, USA, 2011. [Google Scholar]
  37. Ministry of Culture and Sports. Odysseus Portal. Archaeological Sites. Shipwreck of Columns. 2020. Available online: http://odysseus.culture.gr/h/3/eh351.jsp?obj_id=19846 (accessed on 29 February 2020).
  38. Spondylis, I. An Archaeological Survey of the Submerged Settlement off Methoni; Archaeological Review 55/2000; ARF: Athens, Greece, 2000. [Google Scholar]
  39. Bird, E.; Lewis, N. Beach Renourishment; Springer International Publishing: New York, NY, USA, 2015. [Google Scholar] [CrossRef]
  40. Wright, L.; Short, A. Morphodynamic variability of surf zones and beaches: A synthesis. Mar. Geol. 1984, 56, 93–118. [Google Scholar] [CrossRef]
  41. Wright, L.D. Beach cut in relation to surf zone morphodynamics. Coast. Eng. Proc. 1980, 1, 60. [Google Scholar] [CrossRef]
  42. Short, A.; Hesp, P. Wave, beach and dune interactions in southeastern Australia. Mar. Geol. 1982, 48, 259–284. [Google Scholar] [CrossRef]
  43. Short, A. Rip-current type, spacing and persistence, Narrabeen Beach, Australia. Mar. Geol. 1985, 65, 47–71. [Google Scholar] [CrossRef]
  44. Haller, M.; Dalrymple, R.; Svendsen, I.A. Experimental study of nearshore dynamics on a barred beach with rip channels. J. Geophys. Res. Space Phys. 2002, 107. [Google Scholar] [CrossRef] [Green Version]
  45. Castelle, B.; Scott, T.; Brander, R.; McCarroll, R. Rip current types, circulation and hazard. Earth-Sci. Rev. 2016, 163, 1–21. [Google Scholar] [CrossRef]
  46. Austin, M.; Scott, T.; Brown, J.; Brown, J.; MacMahan, J.; Masselink, G.; Russell, P. Temporal observations of rip current circulation on a macro-tidal beach. Cont. Shelf Res. 2010, 30, 1149–1165. [Google Scholar] [CrossRef]
  47. McCarroll, R.J.; Brander, R.W.; Scott, T.; Castelle, B. Bathymetric Controls on Rotational Surfzone Currents. J. Geophys. Res. Earth Surf. 2018, 123, 1295–1316. [Google Scholar] [CrossRef]
  48. Sonu, C.J. Field observation of nearshore circulation and meandering currents. J. Geophys. Res. Space Phys. 1972, 77, 3232–3247. [Google Scholar] [CrossRef]
  49. MacMahan, J.; Brown, J.; Brown, J.; Thornton, E.; Reniers, A.; Stanton, T.; Henriquez, M.; Gallagher, E.; Morrison, J.; Austin, M.J.; et al. Mean Lagrangian flow behavior on an open coast rip-channeled beach: A new perspective. Mar. Geol. 2010, 268, 1–15. [Google Scholar] [CrossRef]
  50. Aagaard, T.; Greenwood, B.; Nielsen, J. Mean currents and sediment transport in a rip channel. Mar. Geol. 1997, 140, 25–45. [Google Scholar] [CrossRef]
  51. Castelle, B.; Marieu, V.; Bujan, S.; Splinter, K.D.; Robinet, A.; Sénéchal, N.; Ferreira, S. Impact of the winter 2013–2014 series of severe Western Europe storms on a double-barred sandy coast: Beach and dune erosion and megacusp embayments. Geomorphology 2015, 238, 135–148. [Google Scholar] [CrossRef]
  52. Duncan, B.; Gibbs, M. Cultural Site Formation Processes Affecting Shipwrecks and Shipping Mishap Sites. In Site Formation Processes of Submerged Shipwrecks, 1st ed.; University Press of Florida and Society for Historical Archaeology: Florida, FL, USA, 2016; pp. 179–210. [Google Scholar] [CrossRef]
Figure 1. Distribution of shipwreck sites (numbered from 1 to 3) over the Methoni Bay. Colour-coded bathymetry is shown superimposed on the background map. Background map data source: Esri, DigitalGlobe, GeoEye, Earthstar Geographics, CNES/Airbus DS, USDA, USGS, AeroGRID, IGN and the GIS User Community.
Jmse 09 01255 g001
Figure 2. The marine geophysical survey track lines. Background map data source: Esri, DigitalGlobe, GeoEye, Earthstar Geographics, CNES/Airbus DS, USDA, USGS, AeroGRID, IGN and the GIS User Community.
Jmse 09 01255 g002
Figure 3. Bathymetric map of the wreck site 1 (within the yellow ellipsis) and approaches. The 3D bathymetric surface is being rendered vertically exaggerated. The length scale and the north arrow direction refer to the centre of the image.
Jmse 09 01255 g003
Figure 4. A 3D view of backscatter intensity over ‘wreck site 1’ draped over bathymetry. High backscatter returns (Area A—outlined in red) correspond to the wreck mound (a) and archaeological material (b) elongated gunwale-like feature; (c) steering wheel. Medium and high backscatter returns (Area A—outlined in red), south and west of the mound, correspond to accumulated sediments. High backscatter returns further south (Area B—outlined in blue) correspond to accumulated sediments in seagrass meadows. Length scale and north arrow refer to the image centre.
Jmse 09 01255 g004
Figure 5. Wreck site 1 side-scan mosaic and detailed side-scan images of wreck-related material (see also Figure 4) (a) shipwreck mound; (b) elongated gunwale-like feature and cannon; (c) steering wheel (left) and wreck-related material (right). The findings indicated are outlined by CAD drawings as a result of an RTK positioning survey (cannon artistic details are conceptual).
Jmse 09 01255 g005
Figure 6. Magnetic anomaly map overlaid on backscatter imagery of ‘wreck site 1’. Polygon drawings (in blue colour) display the wreck mound periphery and scattered wreck-related ruins, while linear drawings refer to remezzo anchor chains (rac). Light blue drawings correspond to cannons found over the wreck mound (a) and a gunwale-like feature (b). (Area A) includes the wreck mound, scattered archaeological material (c) and buried ferromagnetic material under sediment heaps (e.g., in a white circle). (Area B) is characterised by accumulated sediments in seagrass meadows without detection of magnetic anomalies.
Jmse 09 01255 g006
Figure 7. A 3D synthesis of marine geophysical data for ‘wreck site 1’ visualisation and analysis. Site bathymetry is shown semi-transparent and demonstrates the wreck mound and the sediment heaps west and south of the wreck. Drawings (in black) display the wreck mound periphery, a cannon (a) over the mound, another cannon (b) over a gunwale-like section, a ship’s wheel (c), and scattered wreck-related ruins over the seafloor. The purple line illustrates a 30 nT magnetic anomaly over a sediment heap (d), along a boat transect. The seismic section along the transect is annotated (in blue) for reflectors interpreted as wreck-related buried material. Grid cell size (in white): 5 m × 5 m.
Jmse 09 01255 g007
Figure 8. Interpretation of a sub-bottom seismic section along the main wreck mound. (a) The shipwreck remnants are outlined by yellow colour and are laying on a geological horizon (marked in green) c. 0.5 m below the seafloor. High amplitude acoustic reflectors extend 6 m southwest of the wreck mound. These reflectors and a correlated magnetic anomaly (Figure 6), indicate distribution of buried wreck-related material under the annotated sediment heap. (b) Seafloor bathymetry at current epoch, as well as geographic view of the corresponding boat transect (shown in brown) over the wreck mound (outlined in black).
Jmse 09 01255 g008
Figure 9. A 3D model of the wreck ruins across the ‘shipwreck site 1’. (a) Interpretations of shipwreck ruins (manual picks in black) from acoustic profiles; (b) A 3D representation of the shipwreck (in brown) and interpretation of wreck ruins from two seismic sections. Grid cell size (in white): 10 m × 10 m.
Jmse 09 01255 g009
Figure 10. Aggregation of marble blocks and columns over wreck site 2.
Jmse 09 01255 g010
Figure 11. A 3D bathymetric data rendering across wreck site 1. Data are gridded at 0.25 m. (a) Surface creation is based on data regularly gridded and weighted; (b) Surface creation is based on the shoalest soundings contributing to a node at their true position. The length scale refers to a planar distance at the centre of the image.
Jmse 09 01255 g011
Figure 12. Comparison between wreck bathymetric models, created under different data gridding methods. (a) Bathymetric surface created from data weighted and gridded at 0.25 m. (b) Bathymetric surface displaying the shoalest soundings contributing to a node at their true position. (c) Comparison of profiles from a common section (white lines at (a,b)) across the wreck. The profile of the surface created from data weighted and gridded is shown in green, while the profile of the SDTP surface is shown in orange. (d) A 3D surface quantifying the difference between the two surfaces.
Jmse 09 01255 g012
Figure 13. Backscatter intensity surface draped over bathymetry across wreck site 2. Relatively high backscatter is represented by relatively dark tones. The wrecked cargo is shown at the centre of the image as a group of very high backscatter orthogonal anomalies. Acoustic shadows are represented by white colour. A bathymetric pit can be observed principally north of the wrecked cargo up to 10 m away from it. The length scale refers to planar distance at the centre of the image.
Jmse 09 01255 g013
Figure 14. Backscatter intensity surface over wreck site 3. The seafloor is comprised of fine sand which covers archaeological assets that were exposed and precisely positioned on the seafloor in 2012 and are shown draped on the acoustic backscatter surface ((a,b) cannons, (c) cannonballs, (d) unknown ferrous artefact).
Jmse 09 01255 g014
Figure 15. Spatio-temporal analysis of seismic and geospatial data over shipwreck site 3, showing net deposition of fine sediments in the time span 2012–2015 (a) A 3D fusion and interpretation of seismic data acquired in 2012 and 2015, documenting net deposition of 0.7 m of sand over the site, and outlining wreck-related structural features; (b) A 2D view of the seismic lines, the interpretation of wreck-related features, and coastlining data showing sand deposition on shore and seaward advance of the shoreline between 2013 and 2015. Background historical imagery: Google.
Jmse 09 01255 g015
Figure 16. Nearshore and surf zone bathymetry across the northeast section of the Methoni Bay. Alongshore bathymetric nonuniformity is expressed with distinct, consecutive alongshore depositional and erosional bedforms, conceptually associated with cellular current circulation and the accumulation of sediments over shipwreck site 3. The georeferenced 3D model of the shipwreck ruins is shown uplifted over the bathymetric surface in the green circle. Background map data source: Esri, DigitalGlobe, GeoEye, Earthstar Geographics, CNES/Airbus DS, USDA, USGS, AeroGRID, IGN and the GIS User Community.
Jmse 09 01255 g016
Figure 17. Contour line anomaly maps over wreck site 3 produced from datasets acquired in 2012 and 2015. The 2012 iso-contours are shown in semi-transparent white and the 2015 iso-contours are shown in dark grey. While the overall iso-contour patterns over the site are consistent (a) a high-gradient positive anomaly over the westerly cannon is found shifted by 10 m southeast, (b) implying possible cannon movement. Contour line interval: 20 nT.
Jmse 09 01255 g017
Publisher’s Note: MDPI stays neutral with regard to jurisdictional claims in published maps and institutional affiliations.

