Article

Environmental Influence on the Spatiotemporal Variability of Spawning Grounds in the Western Guangdong Waters, South China Sea

1
South China Sea Fisheries Research Institute, Chinese Academy of Fishery Sciences, Guangdong Provincial Key Laboratory of Fishery Ecology and Environment, China Scientific Observing and Experimental Station of South China Sea Fishery Resources & Environment, Ministry of Agriculture and Rural Affairs, Guangzhou 510300, China
2
South China Institute of Environmental Sciences, Ministry of Ecology and Environment, Guangzhou 510535, China
*
Author to whom correspondence should be addressed.
J. Mar. Sci. Eng. 2020, 8(8), 607; https://doi.org/10.3390/jmse8080607
Submission received: 22 July 2020 / Revised: 12 August 2020 / Accepted: 13 August 2020 / Published: 15 August 2020
(This article belongs to the Special Issue Coastal Fish Research)

Abstract

:
Spawning grounds occupy an important position in the supplementary population of fishery resources, especially in Western Guangdong waters (WGWs) in the northern South China Sea (SCS), where fishery resources are being depleted. This study investigated the environmental effects on the spatiotemporal variability of spawning grounds in WGWs, on the basis of generalized additive models (GAMs) and central spawning-ground gravity (CoSGG) by using satellite and in situ observations. Results showed that 57.2% of the total variation in fish-egg density in WGWs was explained. On the basis of stepwise GAMs, the most important factor was sea surface salinity (SSS), with a contribution of 32.1%, followed by sea surface temperature (SST), water depth, month, and chlorophyll a concentration (Chl-a), with contributions of 10.7%, 8.8%, 2.6%, and 2.6%, respectively. Offshore distance had slight influence on the model, explaining approximately 0.4% of the variation in fish-egg density. In summary, fish eggs in WGWs were mainly distributed in the area with SSS of 32.0–34.0 Practical Salinity Unit (PSU), SST of 24–27 °C, and depth of 0–18 m. CoSGG shifted eastwards by 0.38° N and northwards by 0.26° E from April to June. The distribution of spawning grounds in the WGW was affected by the Western Guangdong coastal current (WGCC), cyclonic circulation, the SCS warm current (SCSWC), and changes in the habitat environment (such as SST). Fish in WGWs tend to spawn in areas with a high seabed slope and steep terrain (near the Qiongzhou Strait).

1. Introduction

Western Guangdong waters (WGWs) are located in the northern South China Sea (SCS). This is an important place for fish spawning, feeding, breeding, and migration [1]. Spawning grounds are water areas for the mating, spawning, hatching, and breeding of fish, shrimp, and shellfish. It is an important place for the survival and reproduction of aquatic organisms, and it plays an important role in the supplementation of fishery resources [2]. The early life history of fish has three stages: fish egg, larval, and juvenile. The amount of early supplementation and survival rate affects stock density [3]. As an important stage in early-life history, fish eggs are the most vulnerable and sensitive stage in their lives, and small-scale environmental changes may also have a dramatic impact on their resource–replenishment process [4,5]. Previous studies showed that the habitat environment affects the distribution [6] and density [7,8] of fish eggs, the stock density of fish spawning [7,8], and fish structure [9]. However, the influence of seabed topography and marine environment on the spatiotemporal distribution of spawning grounds is still unclear. Spawning grounds are the basis for the replenishment of fishery resources [10]. Exploring the quantitative relationship between the density and distribution of fish eggs and marine environment factors not only helps to understand the formation mechanism of spawning grounds but, also, reflects variations in local fishery resources.
The relationship between fishery resources and marine environment are complex, nonlinear, and nonadditive [11]. In a quantitative analysis of the relationship between fish-egg density and marine environment, the method choice is important. General additive models (GAMs) can better demonstrate the nonlinear relationship between dependent and multiple independent variables [12], and they are widely used in quantitative analyses of the relationship between fishery resources and environmental factors [1,13,14,15]. On GAMs, the development status of Clupea harengus eggs distributed in western Scottish waters was observed to be related to its vertical spatial distribution, and the development of fish eggs near the bottom was relatively slow [16]. In the Baltic Sea, temperature had no significant effect on the abundance of Platichthys flesus eggs [17]. The distribution of Engraulis encrasicolus and Sardinella aurita in the Mediterranean Sea was related to the interaction between seabed depth and sea surface chlorophyll a (Chl-a) concentration. The near-shore continental shelf area with a high sea surface chlorophyll concentration was more suitable for spawning [18]. In China, on the basis of GAMs, the spatial distribution of dominant fish eggs (Stolephorus commersonnii and Cynoglossus joyneri) in the Haizhou Bay of the Yellow Sea was related to the underlying temperature [19], and the distribution of Gadus macrocephalus eggs in the Yellow Sea was closely related to environmental factors such as bottom-water temperature, quality, and salinity [20]. Satellite remote-sensing technology provides all-weather, large-scale, and high-resolution marine-surface information, and it was successfully applied to marine-fishery research [1,13,14,21]. In this study, satellite remote-sensing data were applied in the analysis of the environmental effects of the spatiotemporal distribution of spawning grounds in WGWs. The early supplementary mechanism of fishery resources in WGWs was explored, providing a reference for the protection of fish habitats in the SCS.

2. Materials and Methods
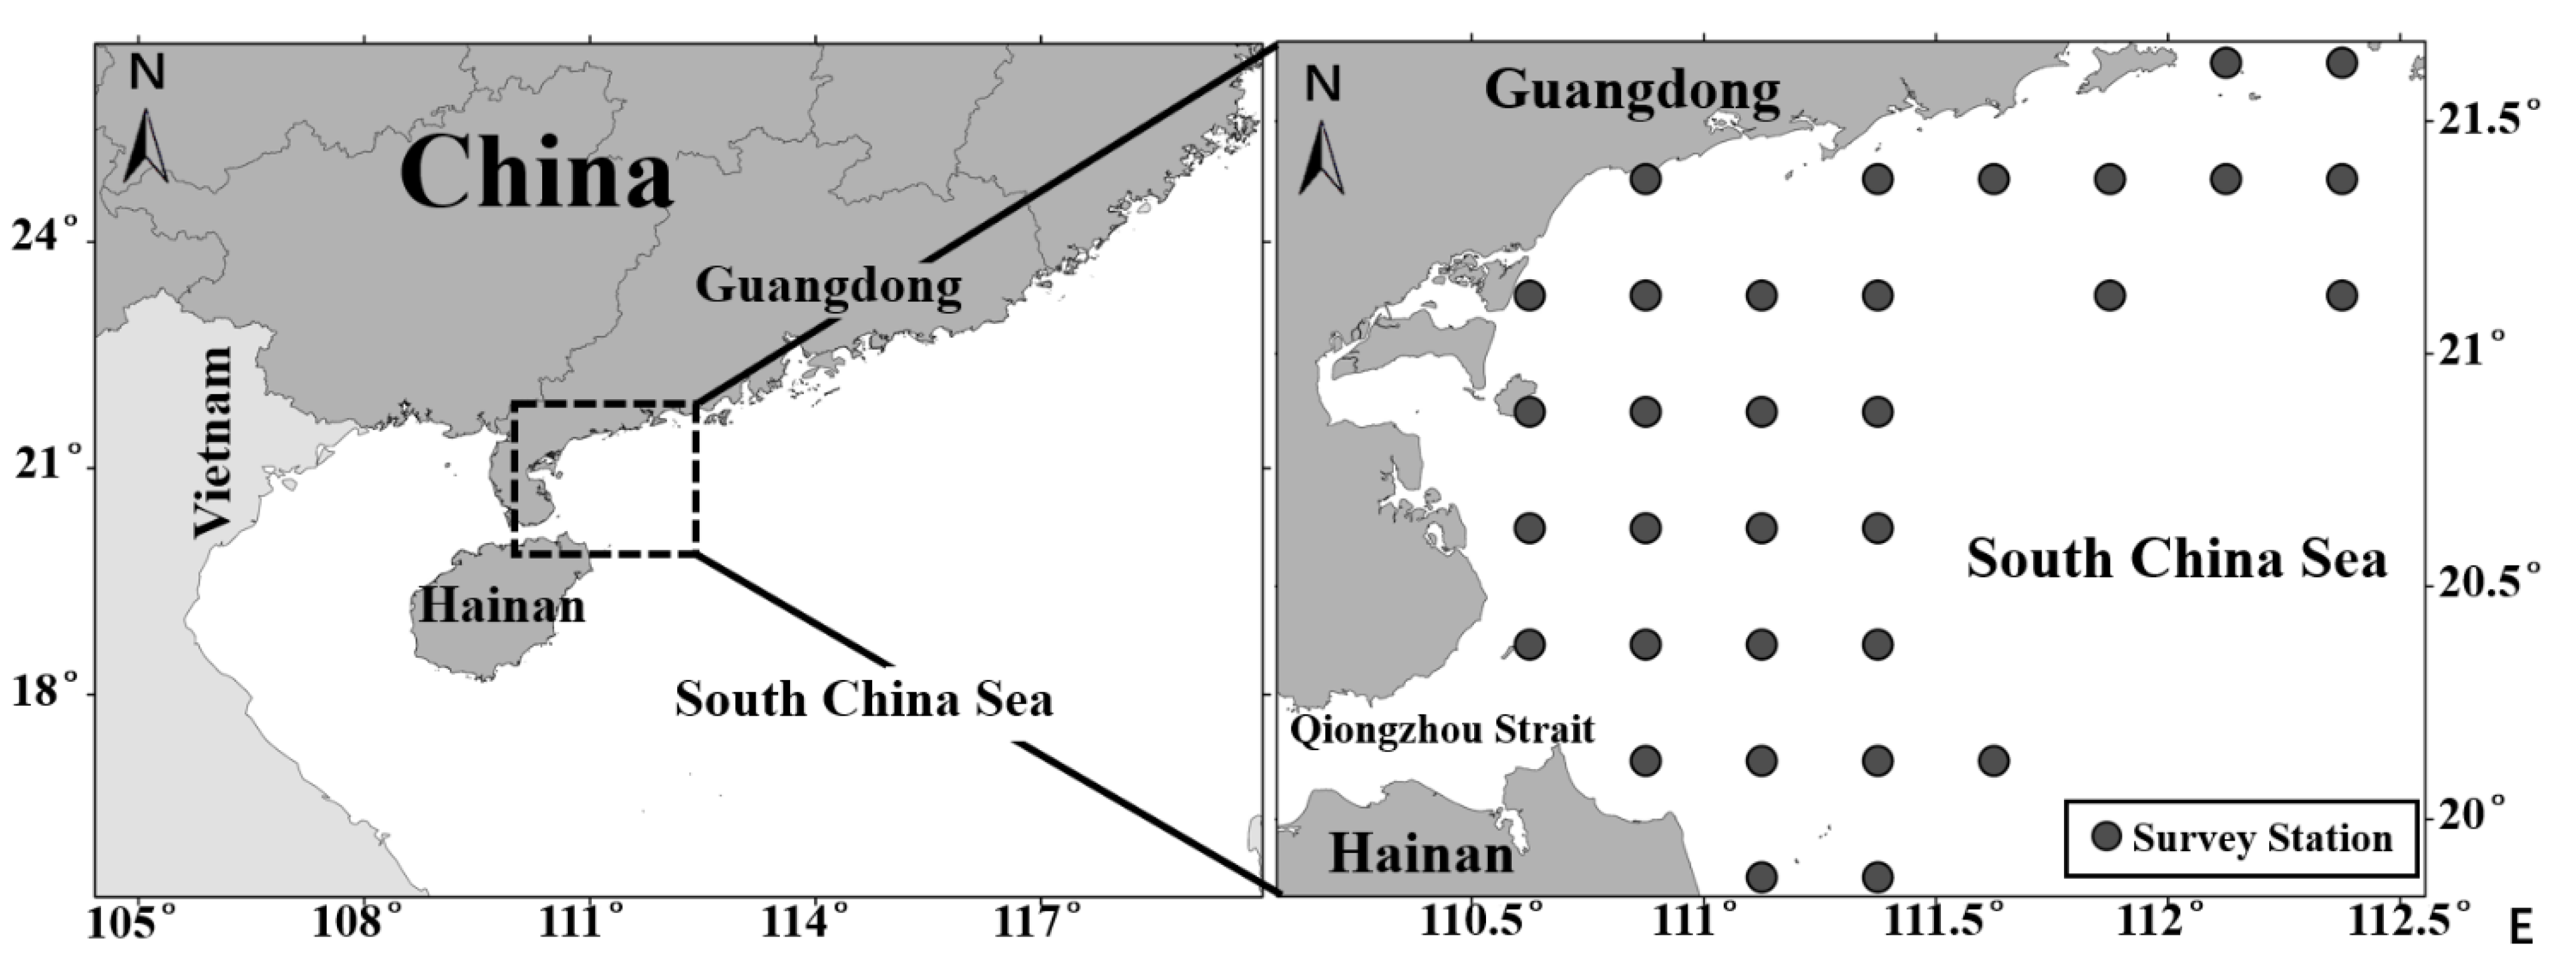
2.1. Fishery Data

Fish egg data were obtained from spawning-ground surveys from 2014 to 2015 (April–June). Major species of fish eggs identified in this study were Trichiurus haumela, Carangidae, Nemipteras virgatus, Sardinella aurita, and Anchoviella commersonii. The research area was at 110–113° E, 19.5–22° N (Figure 1). Fish eggs were sampled by macroplankton nets with a hauling speed of 1.5 n mile/h and then preserved in 5% formaldehyde solution. The fish eggs were identified by morphological characteristics, including shape, size, chorion, yolk, oil globule, and pigmentation [9,10]. In this study, fish-egg data were grouped by 0.25° × 0.25° grid cells. The unit of fish-egg density was ind (10 m)−3.

2.2. Environmental Data

Satellite data were sea surface temperature (SST), sea surface chlorophyll a concentration (Chl-a), and sea surface salinity (SSS). SST and Chl-a data were derived from MODIS Aqua products of NASA (http://oceancolor.gsfc.nasa.gov), for which temporal resolution was 8 days, and spatial resolution was 4 km. SSS data were obtained from the Global Ocean Physical Reanalysis Product of the Copernicus Marine Environment Management Service (CMEMS, http://marine.copernicus.eu/), for which temporal resolution was one month, and spatial resolution was 1/12°. The digital elevation model (DEM) of WGWs was derived from elevation data of Google Earth, with an elevation level of 18 and a spatial resolution of 8.85 m.
Satellite remote-sensing SST, Chl-a, and SSS data were derived by removing invalid values and performing monthly averaging and data-fusing by using MATLAB (MathWorks, Natick, MA, USA) software. Satellite remote-sensing SST, Chl-a, and SSS data were processed to monthly images through ArcGIS 10.5 (Esri, Redlands, CA, USA)software (ordinary kriging) [22,23,24]. The distribution of seabed depth (elevation) and seabed-terrain slope was plotted through ArcGIS 10.5 software by DEM data.

2.3. GAMs Fitting Procedures

The GAMs is an additive model that was proposed by Hastie [12]. It is a nonparametric method of generalized linear regression [19]. The primary formulation of this model is
Y = α + j = 1 n f i ( x j ) + ε
where Y, fish-egg density (ind (10 m)−3); xj, explanatory variable (environmental factors for each survey station); α, formulation intercept; ε, residual; and fi(xj), any univariate function of the respective variable with spline smoothing. The formulation of the GAM is
l o g ( Y + 1 ) = s ( M o n t h ) + s ( L o n ) + s ( L a t ) + s ( S S T ) + s ( C h l a ) + s ( S l o p e ) + s ( S S S ) + s ( D i s t a n c e ) + s ( D e p t h ) +   ε
where Y is the fish-egg density. In order to prevent the response variable from appearing as zero, we made a logarithmic transformation after Y + 1; s(x), spline-smoothing function of covariate x; Month, month; Lat, latitude; Lon, longitude; SST, sea surface temperature; Chl-a, sea surface chlorophyll a concentration; Slope, seabed terrain slope; SSS, sea surface salinity; Distance, closest distance from the shore; Depth, water depth; and Ɛ, model error that obeyed the Gaussian distribution. The mgcv package in R v.3.4.4 software (R Core Team, https://www.r-project.org/) was used to build and test the GAMs [25,26], and a forward-stepwise method was employed to select variables with a significant influence on the model.
The Akaike information criterion (AIC) was applied to check the fitness of the model after adding variables to the model [27]. The smaller the AIC value is, the better the model fit. Generalized cross-validation (GCV) was used to assess predictor variables. The smaller GCV is, the greater the generalization ability of the model [28,29]. The significance and nonlinear contribution of the factor to the nonparametric effect were evaluated by F and chi-squared tests, respectively [30,31,32].
The formula for calculating the AIC value is
A I C = θ + 2 d f φ
where θ , deviation; df, effective degree of freedom; and φ , variance.

2.4. Center of Gravity of Spawning Grounds

The center of the spawning-ground gravity (CoSGG) of fish-egg density in each month was calculated with reference to the gravity-center analysis method [1], indicating the spatiotemporal variations of spawning grounds in WGWs. The formula for calculating the CoSGG of spawning grounds is [33]
X = i = 1 K ( C i × X i ) / i = 1 K C i
Y = i = 1 K ( C i × Y i ) / i = 1 K C i
where X and Y, CoSGG longitude and latitude; Ci, fish-egg density of fishing area i; Xi and Yi, central latitude and longitude positions of fishing area i; and K, total number of fishing areas.

3. Results

3.1. GAMs Analysis

The spatiotemporal and environmental factors selected on the basis of AIC and GCV values were month (Month), sea surface temperature (SST), chlorophyll a concentration (Chl-a), sea surface salinity (SSS), distance from shore (Distance), and waters depth (Depth). In this study, the GAM formulation was
l o g ( Y + 1 ) = s ( M o n t h ) + s ( S S S ) + s ( D e p t h ) + s ( S S T ) + s ( C h l a ) + s ( D i s t a n c e )
The deviance explained by this model was 57.2%, with R2 of 0.531 (Table 1).
In GAMs, the influence of the spatiotemporal and environmental factors on fish-egg density is indicated by the contributions in Table 2. The most important influencing factor from the selected factors was the SSS with a contribution of 32.1%, followed by SST, depth, month, and Chl-a, with contributions of 10.7%, 8.8%, 2.6%, and 2.6%, respectively. The distance had slight influence on the fish-egg density, explaining 0.4%. As indicated by the ANOVA F-ratio test, all selected factors in the model and fish-egg density showed significant correlations (Pr(F) < 0.05). The chi-squared test evaluates the nonlinear contribution of nonparametric effects, and the lowest value (Pr(chi)) was the best. In the GAMs, the factors of the SSS, SST, and Depth were the best.
AIC, Akaike information criterion; GCV, generalized cross-validation; SSS, sea surface salinity; SST, sea surface temperature; and Chl-a, chlorophyll a concentration.
In GAMs, the influence of spatiotemporal and environmental factors on the fish-egg density were indicated by the contributions in Table 2. The most important influencing factor from the selected factors was the SSS, with a contribution of 32.1%, followed by SST, depth, month, and Chl-a, with contributions of 10.7%, 8.8%, 2.6%, and 2.6%, respectively. Distance had a slight influence on the fish-egg density, explaining 0.4%. As indicated by the ANOVA F-ratio test, all the selected factors in the model and fish-egg density showed significant correlations (Pr(F) < 0.05). The chi-squared test is a type of test to evaluate the nonlinear contribution of nonparametric effects, and the lowest value (Pr(chi)) was the best. In GAMs, the factors of the SSS, SST, and Depth were the best.
The relationships between the fish-egg density and the chosen factors are presented in Table 2. The environmental factors (SSS, SST, and Chl-a) had the most significant influences on the model, with a total contribution of 45.4% (Table 2). Among those factors, SSS had the greatest influence on the fish-egg density, with a contribution of 32.1% (Table 2). Within the range of 24–30.5 Practical Salinity Unit (PSU), an increase in the SSS had a positive effect on the fish-egg density. As the SSS increased, the confidence interval decreased and reliability increased. Within the range of 30.5–32 PSU, the increase in the SSS had a negative effect on the fish-egg density, with its confidence interval decreasing and credibility increasing. Within the range of 32–34.5 PSU, the SSS increased with the increase in the fish-egg density, reaching its maximum of 34.5 PSU. At the same time, the confidence interval decreased and reliability increased (Figure 2b). The SST contribution to the model was 10.7% (Table 2). Within the ranges of 24–25 and 27–29 °C, the fish-egg density increased with the increasing SST, and it reached its maximum at 29 °C. Within the ranges of 25–27 and 29–32.5 °C, the fish-egg density decreased with the increasing SST, reaching its minimum at 32 °C. Within the range of 29–32.5 °C, the confidence interval increased with the increasing SST, and the reliability was reduced (Figure 2d). Chl-a had a slight influence on the fish-egg density, with a contribution of 2.6% (Table 2). Within the ranges of 0–4 and 10–21 mg m–3, the fish-egg density showed an upward trend, which increased with an increase in the Chl-a, and the fish-egg density reached its maximum at 21 mg m–3. Within the range of 10–21 mg m–3, the confidence interval increased, and the reliability was reduced. Within the ranges of 4–10 mg m–3 and 21–35 mg m–3, the fish-egg density showed a downward trend. The fish-egg density decreased as the Chl-a increased. The fish-egg density had its minimum at 33 mg m–3; near the minimal value, the confidence interval was large, and the reliability was low (Figure 2e).
Spatial factors (depth and distance) contributed 9.2% to the model (Table 2). Depth contributed 8.8% to the model (Table 2). In the range of 0–18 m, the fish-egg density increased with the increase in depth and reached its maximum at 18 m. Within the range of 18–45 m, the fish-egg density decreased with the increase in depth, reaching its minimum at around 50 m. Within the range of 45–80 m, the fish-egg density increased with the increase in depth, and the confidence interval increased and the reliability decreased (Figure 2c). The contribution rate of distance to the model was 0.4% (Table 2). There was a negative linear correlation between the fish-egg density and distance, and the fish-egg density decreased with the increase in distance. After the distance reached 40 km, the confidence interval increased, and the reliability decreased (Figure 2f).
The contribution of the time factor (month) to the model was 2.6%. The fish-egg density gradually decreased with the increasing month value, reaching its maximum in April, and it remained at a high level in April and May. In June, it dropped significantly, reaching its minimum (Table 2 and Figure 2a).

3.2. Relationship between Fish-egg Distribution and Environmental Factors

The spatiotemporal distribution of the fish-egg density and SST in WGWs is shown in Figure 3. The SST of the study area was 22–24 °C in April, 24–26 °C in May, and 26–30 °C in June. Areas with a high value of the fish-egg density in April were concentrated in a sea area with the SST of 22–24 °C, in May with the SST of 24–25 °C, and in June with the SST of 28–30 °C (Figure 3a–c). In June, the fish-egg density was generally lower than that in April and May and mainly distributed in high latitudes (20.5–21.5° N) and high-SST (> 28 °C) waters (Figure 3c).
The SSS gradually increased from April to June in WGWs. The high-SSS area tended to move toward the northwestern area (Figure 3d–f). The area with high fish-egg density was concentrated in waters with an SSS of 33.2–33.5 PSU in April, 33.7–33.8 PSU in May, and greater than 33.9 PSU in June.

3.3. Relationship between Fish-egg Distribution and Spatial Factors

The spatial-factor analysis (distance, depth, and slope) and fish-egg density in WGWs showed that the fish-egg density in near-shore areas was generally higher than that in offshore areas (Figure 4a). The fish-egg density was higher in shallow waters (10–20 m) and lower in relatively deep waters (40–70 m) (Figure 4a). In this study, the fish-egg density reached its maximum near the Qiongzhou Strait (32070.05 ind (10 m)−3), where the seabed slope was higher (seabed slopes > 1°) than that in other areas (density > 10,000 ind (10 m)−3) (Figure 4). The fish-egg density in this area was higher than that in other areas (Figure 4b).

3.4. CoSGG Variations of Spawning Grounds in WGWs

The CoSGG of the spawning ground in WGW moved from the southwest of the study area to the northeast from April to June (Figure 5a). It was located in the area near Leizhou Peninsula (110.87° E, 20.68° N, green dot in Figure 5a) in April, moved to the eastern waters (111.20° E, 20.72° N, red dot in Figure 5a) in May, and shifted to the northern waters (111.25° E, 20.94° N, yellow dot in Figure 5a) in June. The CoSGG of the spawning grounds varied by 0.03° N and 0.33° E from April to May and 0.22° N and 0.04° E from May to June.

4. Discussion

4.1. Effects of Environmental Factors on Fish-Egg Density

The results of this study highlighted the importance of examining multiple environmental drivers when assessing fish-egg responses to environmental conditions [34,35]. In particular, interactions between geographical and ecological environmental factors obtained from the satellite remote sensing and fish-egg density were found on the basis of GAMs. Among the selected factors, the SSS had the greatest influence on the fish-egg density, with a contribution of 32.1% (Table 2). Fish egg is an early stage of fish-life history. Therefore, the water environment, especially salinity, was one of the major factors affecting the metabolism of fish eggs [36]. Salinity affects embryos developed through changing the osmotic pressure of fish eggs. The research indicated that the hatching rate and increasing salinity showed an approximately normal distribution trend [37]. A higher or lower salinity hinders the material exchange between fertilized eggs and the surrounding medium, resulting in the reduction of the hatching rate and embryo malformation [38]. This study showed that fish eggs in WGWs were mainly distributed in waters with an SSS of 31.5–34.5 PSU, and the most suitable SSS for fish eggs was 33–34.5 PSU (Figure 2b). There were relatively concentrated spawning grounds for Trichiurus haumela and Nemipteras virgatus in WGWs, where the suitable salinity ranges were 33.0–34.5 [39] and 33.94–34.92 PSU [40], respectively, consistent with the results of this study. In addition, the salinity affected the vertical distribution of fish eggs in the water. In low-salinity waters, fish eggs tended to accumulate, making them unable to get enough oxygen, which was not conducive to the development of the fish eggs. In high-salinity waters, on the other hand, fish eggs could be suspended or floated in water. This could facilitate oxygen absorption from the surrounding water, improving the hatchability of the fish eggs [38,41].
The SSS in the northeastern part of the study area was significantly lower than that in other waters, and the fish-egg density in this area was generally lower than that in other waters (Figure 3d–f) because of the dilution of the Pearl River estuary. From the GAM analysis, the fish-egg density fluctuated with the increase in salinity in the salinity range of 30–34.5 PSU, partly connected with different salinity-suitability levels for various fish-species eggs. The northern SCS is an area with multispecies fishery resources and a complex composition [42]. Suitable salinity (about 34 PSU) provides spawning grounds for fish of different reproductive habits [43]. In addition, the sea-salinity gradient had a certain effect on the spawning grounds. The salinity gradient in Leizhou Bay in China is small, and the salinity has little effect on fish eggs [44]. The salinity gradient in WGWs was larger, and the salinity had a greater impact on the density and spatial distribution of fish eggs.
The contribution rate of the SST to the fish-egg density was 10.7% (Table 2). Fish eggs in WGWs were mainly distributed in waters with SST of 22–32 °C, and the most suitable SST for fish egg survival was 24–30 °C (Figure 2d). Studies showed that the suitable temperature for the fish eggs of Trichiurus haumela in the SCS was 25–28 °C [39], consistent with the results of this study. The effects of temperatures at 25 and 29 °C on the fish-egg density had two distinct peak areas (Figure 2d), related to the characteristics of multi-fish-species fishery resources in WGWs [43]. The water temperature is one of the key factors affecting fish metabolism [36,45]. The water temperature affected the number, distribution, and population structure of fish eggs by affecting the adult gonadal development and reproductive migration [46]. The water temperature also had a significant impact on the metamorphosis [6] and hatching speed of fish eggs [47]. The fish-egg density sharply decreased in June, which might have been related to changes in the water temperature. The average water temperature in June was higher (greater than 28 °C; Figure 3c), which reduced the survival rate of some eggs that did not tolerate high temperatures, leading to a decrease in the fish-egg density [48]. On the other hand, an increase in the water temperature promotes the development of some fish eggs, shortens their hatching time, and accelerates the speed of fish-egg hatching, which also leads to a decrease in the fish-egg density [38]. In the East China Sea, the fish-egg density in the summer (June) was higher than that in the spring [49], which was different from the results of this study. This may be related to the difference in the water temperatures in this month. In June, the SST (28–32 °C) in WGWs was higher than the SST (20.03–27.13 °C) in the East China Sea [49]. Different water-temperature levels affected the density and distribution of the fish eggs. The GAM analysis showed that the contribution rate of Chl-a to the fish-egg density was only 2.6% (Table 2). Chlorophyll had little effect on the fish-egg density, because the eggs were in the endotrophic stage and could not prey [6,50].

4.2. Effects of Spatial Factors on Fish-Egg Density

The GAM analysis showed that depth ranked the third in the impact on the fish-egg density, with a contribution of 8.8% (Table 2). The research area was located in the sea with a water depth of 8–55 m. The effect of water depth on the fish-egg density showed a fluctuation trend that first increased, decreased, and then increased (Figure 2c). Water depth was one of the major reasons affecting the spatial distribution of spawning grounds [50]. Trichiurus haumela in WGWs mainly spawned in waters with a depth of 40–70 m [39]. Carangidae fish spawned in waters with depths lower than 60 m in the spring and summer [33]. Nemipteras virgatus mainly inhabited the bottom sediment, with a depth of 60–80 m [40]. The eggs of Anchoviella commersonii were mainly distributed in areas with depths of less than 20 m [51]. The eggs of Sardinella aurita were mainly distributed in areas with a depth of 10 m [52]. Anchoviella commersonii and Sardinella aurita of pelagic fish and Nemipteras virgatus and Carangidae of demersal fish inhabited areas with different water depths. Therefore, the effect of water depth on the fish-egg density in the study area showed a fluctuation trend. In WGWs, the fish-egg density in the deep-water areas was significantly lower than that in shallow–water areas (Figure 4a). The relatively harsh lived-in environments of fish living in deeper waters (less food in shallow waters) and other factors might increase the breeding interval of these fish (annual to perennial). Therefore, the fish-egg density in deep waters was lower than that in other areas [53]. The relevant research found that, in the coastal waters of the North Sea, fish eggs tended to gather in shallow waters (<40 m) and form spawning grounds [50,54]. This was similar to the distribution characteristics of spawning grounds in WGWs. This might be due to the abundance of bait organisms in shallow offshore waters, which can provide an ideal spawning ground for fish [53,55]. Fish eggs cannot swim or move independently [49,56]. Therefore, fish eggs floating in the water are susceptible to the effects of ocean currents. The complex seabed terrain reduced the flow velocity and helped fish eggs to gather in this area. This study showed that there was a significant positive correlation between the fish-egg density and seabed slope (p < 0.05; Figure 4b). The Qiongzhou Strait (Figure 1 and Figure 4b) had a high seabed-slope value, and the fish-egg density in this area was also higher than that of other areas (Figure 4). This was because the complex seabed topography provides an ideal environment for fish-spawning communities [19,57]. Previous studies showed that the spawning grounds of the Baltic herring (Clupea harengus membras) were also distributed in steep areas with steep slopes on the seabed [58]. Therefore, the seabed slope was one of the conditions for the formation of spawning grounds, and the area with a high seabed-slope value tended to attract fish to spawn.
The distance from shore had the least effect on the fish-egg density, with a contribution of 0.4% (Table 2). The distance of the survey stations in this study was 0-60 km, and the effect on the fish-egg density gradually decreased with the increase in distance (Figure 2f). In this study, the fish-egg density in farther areas was significantly lower than that in offshore areas. This might be connected with the reproductive migration of fish to offshore areas in the spring and the formation of a central spawning ground in offshore areas [49].

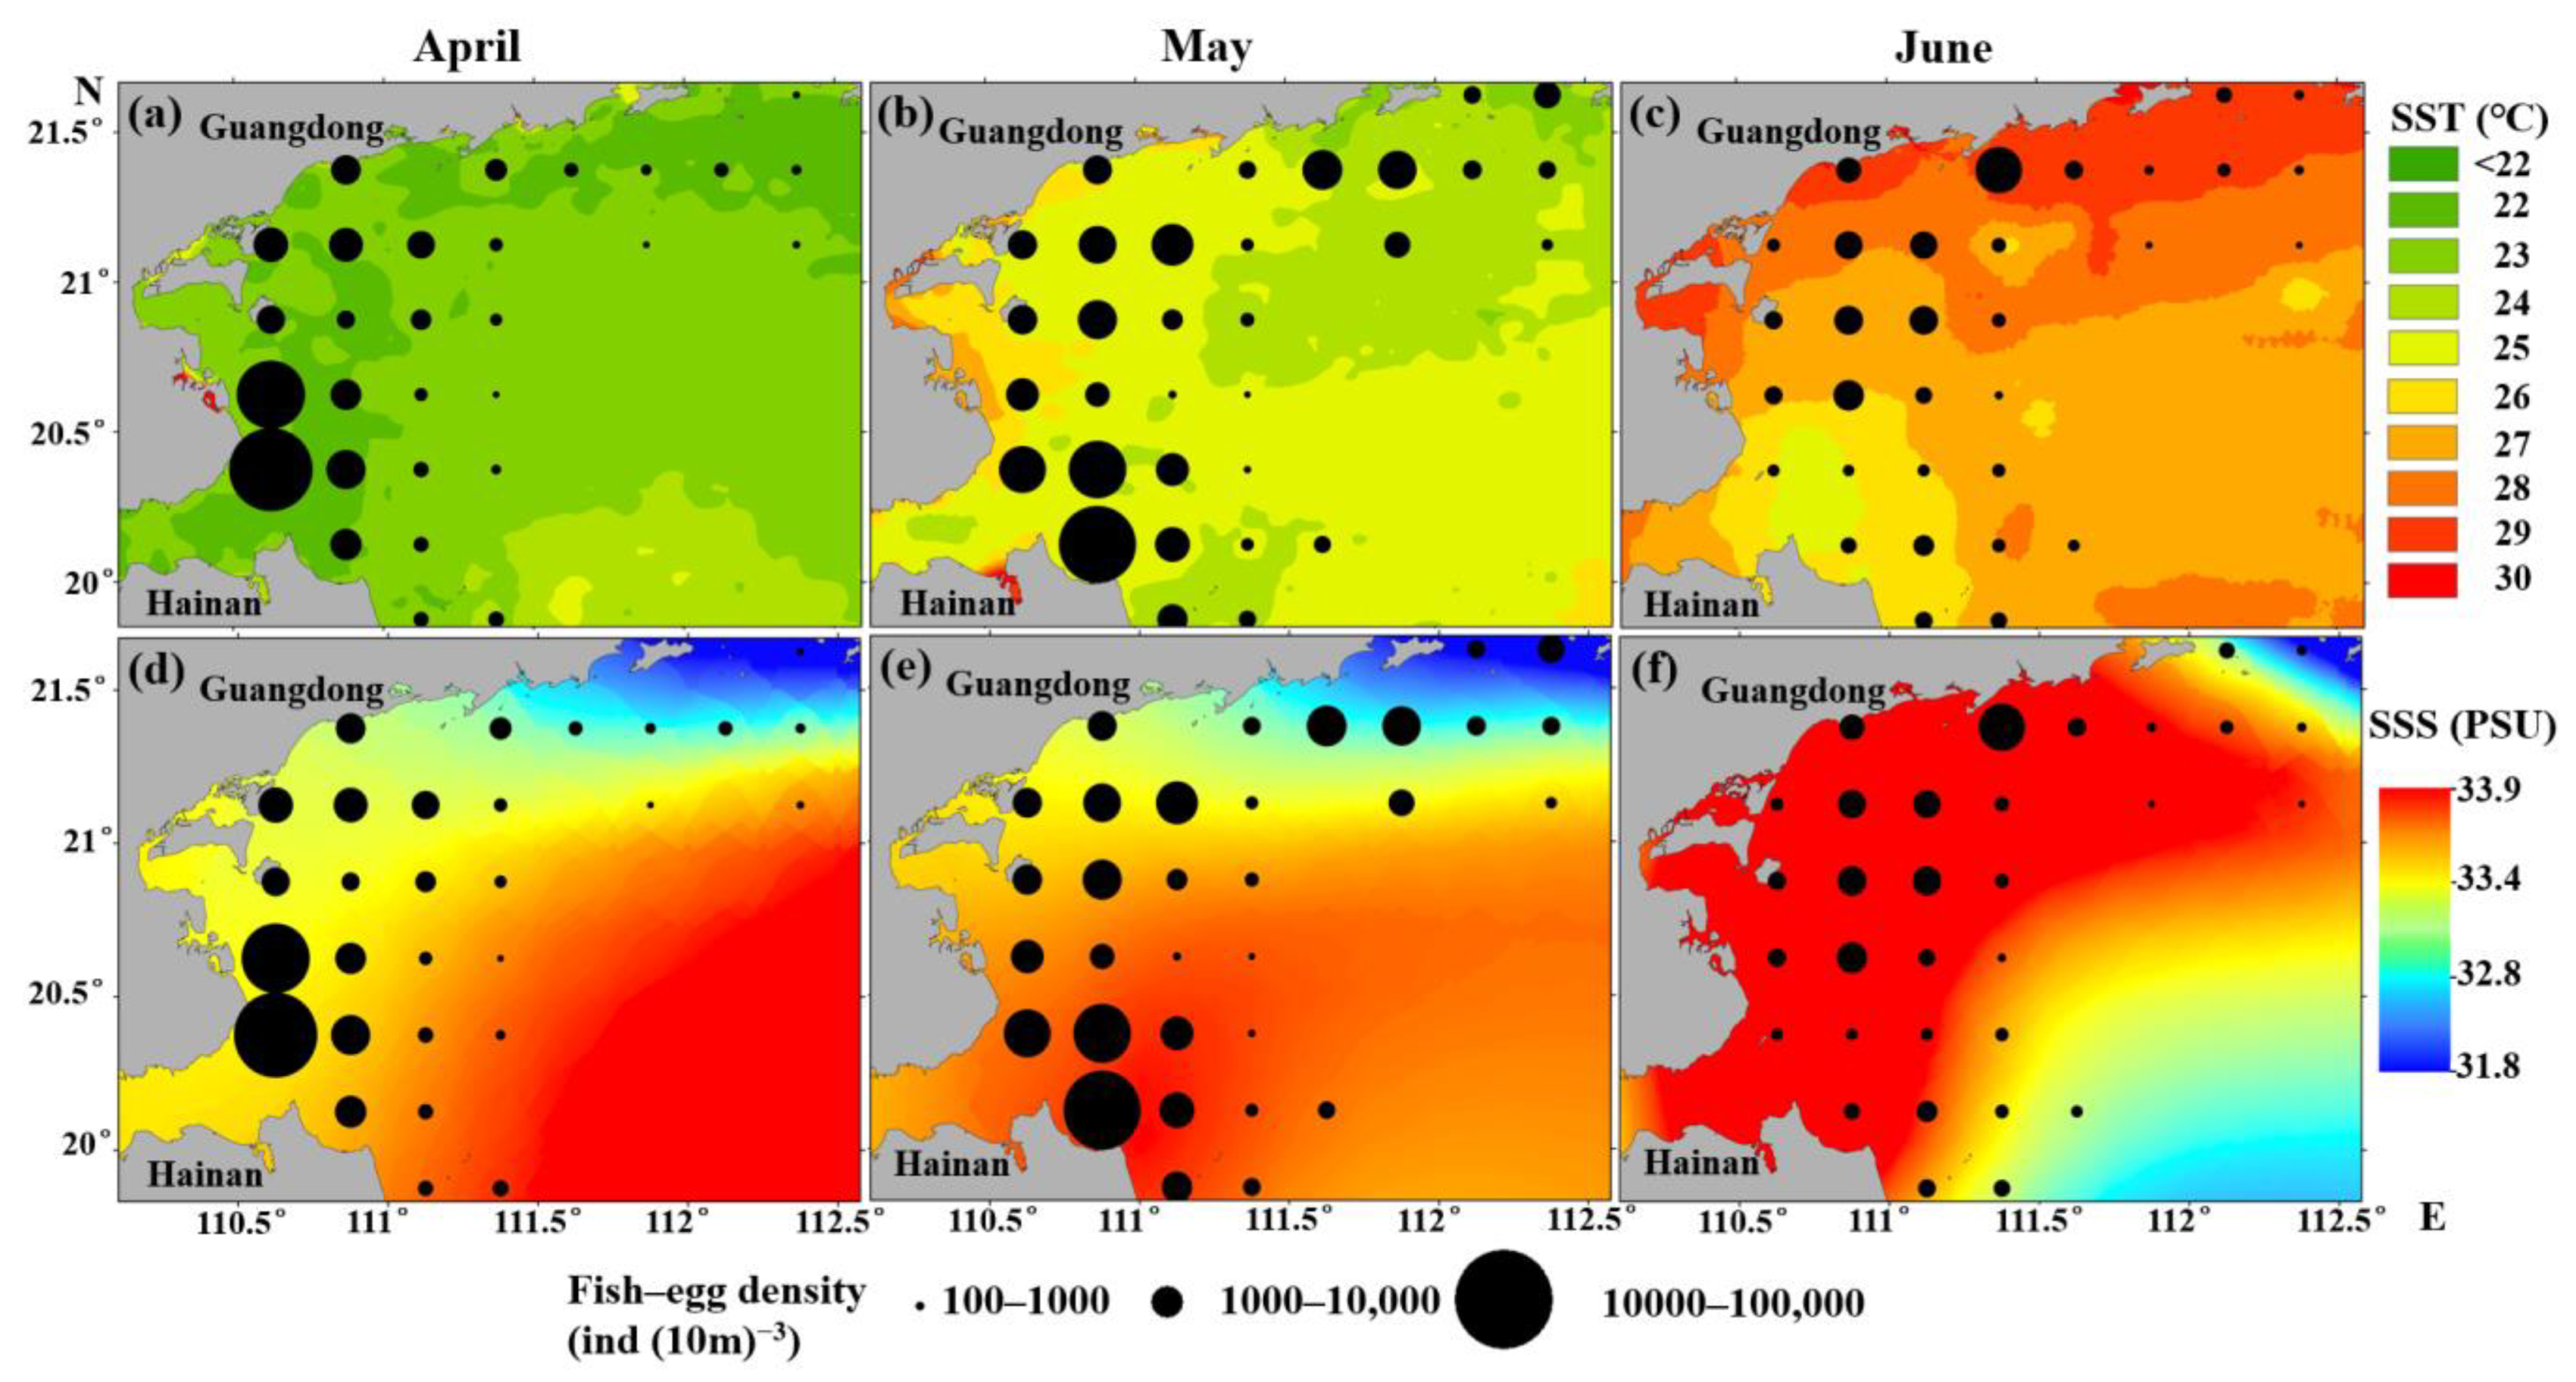
4.3. Spatiotemporal Distribution of Fish-Egg Density in WGWs

The center of gravity of the spawning ground in WGWs moved 0.38° E to the east and 0.26° N to the north from the spring to summer (Figure 5). Fish eggs cannot swim [56], and their distribution was related to physical oceanographic factors such as currents and tides [49]. The position of the spawning ground was affected by changes in the ocean currents. Ocean currents such as the Western Guangdong coastal current (WGCC) and the South China Sea warm current (SCSWC) existed in the WGWs (Figure 6) [59]. There was a coastal flow from the Pearl River estuary along the coast of Western Guangdong to the southwest, lastly crossing the Qiongzhou Strait into the Beibu Gulf (Figure 6) [60]. From May to August, a cyclonic circulation was formed in the area centered at 20–20.5° N and 110.75–110° E in WGWs (Figure 6b, c). A cold center was formed in this area, with lower temperatures than those of the surroundings (Figure 3c) [61]. In the outer WGCC area, there is a warm current in the South China Sea (SCSWC) that flows fast northeastward all year round (Figure 6) [2,62]. Therefore, fish eggs were affected by the cyclonic circulation (survey time was in late-May) and drifted eastward to gather northeast of Hainan Island (Figure 6) in April and May. In June, the fish eggs drifted northeastward due to the SCSWC with a fast flow. In WGWs, the fish-egg density in each month showed higher in the west and lower in the east, reaching its maximum in the eastern waters of the Leizhou Peninsula (Figure 6). This was related to the WGCC that flew westward all year round. Fish eggs drifting along the WGCC gathered in the northeastern waters of Hainan Island (Figure 6).

5. Conclusions

This study analyzed for the first time the environmental effects of the spatiotemporal distribution of the spawning grounds in WGWs on the basis of satellite remote-sensing and survey data. The most important environmental factor affecting the fish-egg density was the SSS, followed by the SST, depth, month, Chl-a, and distance. The spawning grounds in WGWs were mainly distributed in waters with an SSS of 33.0–34.5 PSU, SST of 24–29 °C, and depth of 5–25 m. The complex seabed terrain was conducive to the accumulation of fish eggs. The results of this study were helpful in understanding the spatiotemporal distribution of early supplementary populations of fishery populations and their response mechanisms to environmental changes in WGWs.

Author Contributions

J.Y. and Y.L. designed the study. Z.L. collected the spawning ground data. Y.L. analyzed the data. P.C. helped the data collection and analysis. J.Y. and Y.L. wrote the article. All authors have read and agreed to the published version of the manuscript.

Funding

This study was supported by the following funds: (1) National Key R&D Program of China (2018YFD0900901), (2) Natural Science Foundation of Guangdong Province, China (2018A030313120), (3) Central Public-interest Scientific Institution Basal Research Fund, CAFS, China (2018HY-ZD0104), (4) R & D Projects in Key Areas of Guangdong Province, China (2020B1111030002), and (5) Special Fund for Basic Scientific Research Business of Central Public Research Institutes (PM-zx703-201904-128).

Conflicts of Interest

The authors declare no conflict of interest.

References

  1. Yu, J.; Hu, Q.W.; Tang, D.L.; Chen, P.M. Environmental effects on the spatiotemporal variability of purpleback flying squid in Xisha-Zhongsha waters, South China Sea. Mar. Ecol. Prog. Ser. 2019, 623, 25–37. [Google Scholar] [CrossRef]
  2. Wang, D.X.; Hong, B.; Gan, J.P.; Xu, H.Z. Numerical investigation on propulsion of the counter-wind current in the northern South China Sea in winter. Deep Sea Res. Part I Oceanogr. Res. Pap. 2010, 57, 1206–1221. [Google Scholar] [CrossRef]
  3. Hovenkamp, F. Growth-dependent mortality of larval plaice Pleuronectes platessa in the North Sea. Mar. Ecol. Prog. Ser. 1992, 82, 95–101. [Google Scholar] [CrossRef]
  4. Houde, E.D.; Hoyt, R.D. Fish early life dynamics and recruitment variability. In Proceedings of the 10 Annual Larval Fish Conference, Miami, FL, USA, 18–23 May 1986. [Google Scholar]
  5. Peck, M.A.; Huebert, K.B.; Llopiz, J.K. Intrinsic and extrinsic factors driving match–mismatch dynamics during the early life history of marine fishes. In Advances in Ecological Research; Elsevier: Amsterdam, The Netherlands, 2012; Volume 47, pp. 177–302. [Google Scholar]
  6. Xiao, Y.Z.; Wang, R.; Qiang, O.; Fang, H.D. Relationship between abundance distribution of fish eggs, larvae and juveniles and environmental factors in the Pearl River Estuary waters in spring. J. Appl. Oceanogr. 2010, 29, 488–495. [Google Scholar]
  7. Blood, D.M. Low-temperature incubation of walleye pollock (Theragra chalcogramma) eggs from the southeast Bering Sea shelf and Shelikof Strait, Gulf of Alaska. Deep Sea Res. Part II Top. Stud. Oceanogr. 2002, 49, 6095–6108. [Google Scholar] [CrossRef]
  8. Bernal, M.; Somarakis, S.; Witthames, P.R.; Van Damme, C.J.; Uriarte, A.; Lo, N.C.; Dickey-Collas, M. Egg production methods in marine fisheries: An introduction. Fish Res. 2012, 117, 1–5. [Google Scholar] [CrossRef]
  9. Lin, Z.J.; Wang, X.H.; Jiang, Y.E. Distribution and species composition of fish eggs in Daya Bay. J. Fish. Sci. China 2010, 17, 543–550. [Google Scholar]
  10. Wan, R.; Zhou, F.; Shan, X.; Sun, S. Impacts of variability of habitat factors on species composition of ichthyoplankton and distribution of fish spawning ground in the Changjiang River estuary and its adjacent waters. Acta Ecol. Sin. 2010, 30, 155–165. [Google Scholar] [CrossRef]
  11. Stenseth, N.C.; Mysterud, A.; Ottersen, G.; Hurrell, J.W.; Chan, K.; Lima, M. Ecological effects of climate fluctuations. Science 2002, 297, 1292–1296. [Google Scholar] [CrossRef] [Green Version]
  12. Hastie, T.; Tibshirani, R. Generalized Additive Models; Chapman and Hall: London, UK, 1990; pp. 587–602. [Google Scholar]
  13. Yu, J.; Hu, Q.W.; Tang, D.L.; Zhao, H.; Chen, P.M. Response of Sthenoteuthis oualaniensis to marine environmental changes in the north-central South China Sea based on satellite and in situ observations. PLoS ONE 2019, 14, e211474. [Google Scholar] [CrossRef] [Green Version]
  14. Yu, J.; Liu, Z.N.; Chen, P.M.; Yao, L.J. Environmental factors affecting the spatiotemporal distribution of Decapterus maruadsi in the western Guangdong waters, China. Appl. Ecol. Environ. Res. 2019, 17. [Google Scholar] [CrossRef]
  15. Wang, Y.F.; Hu, Q.W.; Yu, J.; Chen, P.M.; Shu, L.M. Effect assessment of fishery resources proliferation in Zhelin Bay marine ranching in eastern Guangdong. South China Fish. Sci. 2019, 15, 12–19. [Google Scholar]
  16. Stratoudakis, Y.; Gallego, A.; Morrison, J.A. Spatial distribution of developmental egg ages within a herring Clupea harengus spawning ground. Mar. Ecol. Prog. Ser. 1998, 174, 27–32. [Google Scholar] [CrossRef] [Green Version]
  17. Ustups, D.; Müller-Karulis, B.; Bergstrom, U.; Makarchouk, A.; Sics, I. The influence of environmental conditions on early life stages of flounder (Platichthys flesus) in the central Baltic Sea. J. Sea Res. 2013, 75, 77–84. [Google Scholar] [CrossRef]
  18. Schismenou, E.; Giannoulaki, M.; Valavanis, V.D.; Somarakis, S. Modeling and predicting potential spawning habitat of anchovy (Engraulis encrasicolus) and round sardinella (Sardinella aurita) based on satellite environmental information. Hydrobiologia 2008, 612, 201. [Google Scholar] [CrossRef]
  19. Li, Z.G. Distribution of Main Species of Stow Net in the South Yellow Sea based on GAM and Preliminary Study of Characteristics of Ichthyoplankton Assemblages in Haizhou Bay; Ocean University of China: Qingdao, China, 2013. [Google Scholar]
  20. Zhang, R.Y.; Bian, X.D.; Shan, X.J.; Jin, X.S.; Guan, L.S. Distribution of the age 0 group Pacific cod (Gadus macrocephalus) in the Yellow Sea and its relationship with environmental factors. J. Fish. China 2018, 42, 870–880. [Google Scholar] [CrossRef]
  21. Yu, J.; Chen, P.M.; Tang, D.L.; Qin, C.X. Ecological effects of artificial reefs in Daya Bay of China observed from satellite and in situ measurements. Adv. Space Res. 2015, 55, 2315–2324. [Google Scholar] [CrossRef]
  22. Müller, D. Estimation of algae concentration in cloud covered scenes using geostatistical methods. In Proceedings of the ENVISAT Symposium, Montreux, Switzerland, 23–27 April 2007. [Google Scholar]
  23. Yu, J.; Hu, Q.W.; Yuan, H.R.; Chen, P.M. Effect assessment of summer fishing moratorium in Daya Bay based on remote sensing data. South China Fish. Sci. 2018, 14, 1–9. [Google Scholar]
  24. Wang, Y.F.; Yu, J.; Chen, P.M.; Yu, J.; Liu, Z.N. Relationship between spatial-temporal distribution of light falling-net fishing ground and marine environments. J. Trop. Oceanogr. 2019, 38, 68–76. [Google Scholar]
  25. Wood, S.N. Stable and efficient multiple smoothing parameter estimation for generalized additive models. J. Am. Stat. Assoc. 2004, 99, 673–686. [Google Scholar] [CrossRef] [Green Version]
  26. Wood, S.N. Fast stable restricted maximum likelihood and marginal likelihood estimation of semiparametric generalized linear models. J. R. Stat. Soc. Ser. B (Stat. Methodol.) 2011, 73, 3–36. [Google Scholar] [CrossRef] [Green Version]
  27. Venables, W.N.; Dichmont, C.M. GLMs, GAMs and GLMMs: An overview of theory for applications in fisheries research. Fish. Res. 2004, 69, 319–337. [Google Scholar] [CrossRef]
  28. Hilborn, R.; Mangel, M. The Ecological Detective: Confronting Models with Data; Princeton University Press: Princeton, NJ, USA, 1997. [Google Scholar]
  29. Quinn, T.J.; Deriso, R.B. Quantitative Fish Dynamics; Oxford University Press: Oxford, UK, 1999. [Google Scholar]
  30. Stone, C.J. Additive regression and other nonparametric models. Ann. Stat. 1985, 13, 689–705. [Google Scholar] [CrossRef]
  31. Akaike, H. Information theory and an extension of the maximum likelihood principle. In Breakthroughs in Statistics; Springer: New York, NY, USA, 1992; pp. 610–624. [Google Scholar]
  32. Burnham, K.P.; Anderson, D.R. Model. Selection and Multimodel Inference: A Practical Information-Theoretic Approach; Springer Science & Business Media: Berlin/Heidelberg, Germany, 2003. [Google Scholar]
  33. Chen, G.B.; Li, Y.Z. Distribution of the Carangidae fishes in the continental shelf waters of northern South China Sea. J. Shanghai Ocean Univ. 2003, 12, 146–151. [Google Scholar] [CrossRef]
  34. La Mesa, M.; La Mesa, G.; Catalano, B.; Jones, C.D. Spatial distribution pattern and physical–biological interactions in the larval notothenioid fish assemblages from the Bransfield Strait and adjacent waters. Fish. Oceanogr. 2016, 25, 624–636. [Google Scholar] [CrossRef]
  35. Bacha, M.; Jeyid, M.A.; Vantrepotte, V.; Dessailly, D.; Amara, R. Environmental effects on the spatio-temporal patterns of abundance and distribution of Sardina pilchardus and sardinella off the Mauritanian coast (North-West Africa). Fish. Oceanogr. 2017, 26, 282–298. [Google Scholar] [CrossRef]
  36. Singh, A.K.; Hasnain, S.I.; Banerjee, D.K. Grain size and geochemical partitioning of heavy metals in sediments of the Damodar River—A tributary of the lower Ganga, India. Environ. Geol. 1999, 39, 90–98. [Google Scholar] [CrossRef]
  37. Zhang, J.; Zhang, P.; Chen, Z.Z.; Chen, G.B.; Zhang, K.; Xue, Y.W.; Sun, M.S. Biomass and distribution of carangoid fish resources in the offshore South China Sea. South China Fish. Sci. 2016, 12, 38–48. [Google Scholar]
  38. Giffard-Mena, I.; Hernández-Montiel, Á.H.; Pérez-Robles, J.; David-True, C. Effects of salinity on survival and plasma osmolarity of Totoaba macdonaldi eggs, larvae, and juveniles. J. Exp. Mar. Biol. Ecol. 2020, 526, 151339. [Google Scholar] [CrossRef]
  39. Lin, J.Q. Studies on the natural regulaive adaptibility of the Hairtail (Trichiurus haumela) in the oceanic environment. Trans. Oceanol. Limnol. 1981, 3, 60–65. [Google Scholar]
  40. Zhang, R.Z.; Lu, S.F. On the eggs and larvae of the golden-thread Nemipterus Virgatus (Houttuyn). Curr. Zool. 1980, 26, 39–42. [Google Scholar]
  41. Nissling, A.; Nyberg, S.; Petereit, C. Egg buoyancy of flounder, Platichthys flesus, in the Baltic Sea—Adaptation to salinity and implications for egg survival. Fish. Res. 2017, 191, 179–189. [Google Scholar] [CrossRef]
  42. Zeng, B.G.; Zhang, S.J.; Chen, G.X. Investigation and Division of Fishery Resources in the South China Sea; In Chinese with English Abstract; Guangdong Science and Technology Press: Guangdong, China, 1989. [Google Scholar]
  43. Loots, C.; Vaz, S.; Koubbi, P.; Planque, B.; Coppin, F.; Verin, Y. Inter-annual variability of North Sea plaice spawning habitat. J. Sea Res. 2010, 64, 427–435. [Google Scholar] [CrossRef] [Green Version]
  44. Yang, Y.Y.; Gao, Y.J.; Wang, J.P.; Xu, B.Q.; Sun, C.X. Community structure of ichthyoplankton and its relationship with environmental factors in Laizhou Bay. Chin. J. Ecol. 2018, 37, 2976–2984. [Google Scholar]
  45. Edwards, M.; Richardson, A.J. Impact of climate change on marine pelagic phenology and trophic mismatch. Nature 2004, 430, 881. [Google Scholar] [CrossRef] [PubMed]
  46. Chen, X.Q.; Ruan, C.X.; Yuan, C.G. Effects of different temperature and food on growth and survival rates of the larvae of Trichogaster trichopterus. J. Fuji. Fish. 2008, 30, 9–12. [Google Scholar]
  47. Wan, R.J.; Meng, Z.N. The artificial insemination and hatching of Trichiurus lepturus. J. Fish. China 2003, 27, 188–192. [Google Scholar]
  48. Targońska, K.; Żarski, D.; Kupren, K.; Palińska-żarska, K.; Mamcarz, A.; Kujawa, R.; Skrzypczak, A.; Furgała-Selezniow, G.; Czarkowski, T.K.; Hakuć-Błażowska, A.; et al. Influence of temperature during four following spawning seasons on the spawning effectiveness of common bream, Abramis brama (L.) under natural and controlled conditions. J. Therm. Biol. 2014, 39, 17–23. [Google Scholar] [CrossRef]
  49. Wan, R.J.; Zeng, D.Y.; Bian, X.D.; Ni, X.B. Species composition and abundance distribution pattern of ichthyoplankton and their relationship with environmental factors in the East China Sea ecosystem. J. Fish. China 2014, 38, 1375–1398. [Google Scholar]
  50. Lelièvre, S.; Vaz, S.; Martin, C.S.; Loots, C. Delineating recurrent fish spawning habitats in the North Sea. J. Sea Res. 2014, 91, 1–14. [Google Scholar] [CrossRef] [Green Version]
  51. Wu, G.Z. The ecological characteristics of distribution of eggs, larvae and juveniles of the Engr-aulis japonicus (Temminck & Schlegel) and Anchoviella commersonii in the changjiang river estuary. Oceanol. Limnol. Sin. 1989, 20, 217–229. [Google Scholar]
  52. Zhang, J.B.; Huang, Z.Y. An investigation on fish eggs and larvae in sea area around planning Yangjiang nuclear plant. J. Trop. Oceanogr. 2003, 22, 78–84. [Google Scholar]
  53. Fernandez-Arcaya, U.; Drazen, J.C.; Murua, H.; Ramirez-Llodra, E.; Bahamon, N.; Recasens, L.; Rotllant, G.; Company, J.B. Bathymetric gradients of fecundity and egg size in fishes: A Mediterranean case study. Deep Sea Res. Part I Oceanogr. Res. Pap. 2016, 116, 106–117. [Google Scholar] [CrossRef]
  54. Gibson, R.N.; Nash, R.D.; Geffen, A.J.; Van der Veer, H.W. Flatfishes: Biology and Exploitation; John Wiley & Sons: Hoboken, NJ, USA, 2014. [Google Scholar]
  55. Aneer, G. Herring (Clupea harengus L.) spawning and spawning ground characteristics in the Baltic Sea. Fish. Res. 1989, 8, 169–195. [Google Scholar] [CrossRef]
  56. Yin, M.C.; Blaxter, J.H.S. Cruising speeds during early development and starvation of marine fish larvae. Oceanol. Limnol. Sin. 1989, 20, 1–9. [Google Scholar]
  57. Yi, Y.J.; Zhang, S.H.; Wang, Z.Y. The bedform morphology of Chinese sturgeon spawning sites in the Yangtze River. Int. J. Sediment. Res. 2013, 28, 421–429. [Google Scholar] [CrossRef]
  58. Šaškov, A.; Šiaulys, A.; Bučas, M.; Daunys, D. Baltic herring (Clupea harengus membras) spawning grounds on the Lithuanian coast: Current status and shaping factors. Oceanologia 2014, 56, 789–804. [Google Scholar] [CrossRef] [Green Version]
  59. Xie, L.L.; Cao, R.X.; Shang, Q.T. Progress of Study on Coastal Circulation near the Shore of Western Guangdong. J. Guangdong Ocean Univ. 2012, 32, 94–98. [Google Scholar]
  60. Wu, B.Y. A study on the circulation in shelf waters west to zhujiang estuary. J. Appl. Oceanogr. 1990, 9, 14–21. [Google Scholar]
  61. Yang, S.Y.; Bao, X.W.; Chen, C.S.; Chen, F. Analysis on characteristics and mechanism of current system in west coast of Guangdong Province in the summer. Acta Oceanol. Sin. 2003, 25, 1–8. [Google Scholar]
  62. Guan, B.X. Evidence for a counter-wind current in winter off the southeast coast of China. Chin. J. Oceanol. Limn. 1986, 4, 319–332. [Google Scholar] [CrossRef]
Figure 1. Research area and survey stations of spawning grounds in Western Guangdong waters (WGWs; dotted box, area of satellite data).
Jmse 08 00607 g001
Figure 2. A generalized additive models (GAMs) analysis of the effects of the spatiotemporal and environmental factors on the fish-egg density in WGWs: (a) month, (b) seas surface salinity (SSS), (c) depth, (d) sea surface temperature (SST), (e) chlorophyll concentration of a (Chl-a), and (f) distance. Shadow areas, 95% confidence intervals. Rug plots on the x-axis indicate data density.
Jmse 08 00607 g002
Figure 3. Relationship between the spatiotemporal distributions of the fish-egg density, water temperature, and salinity in WGWs: (a) SST in April, (b) SST in May, (c) SST in June, (d) SSS in April, (e) SSS in May, and (f) SSS in June.
Jmse 08 00607 g003
Figure 4. Relationship between the fish-egg density and spatial factors in WGWs: (a) distribution of water depth and (b) distribution of seabed slope; r, a score of Pearson correlation coefficient; and P, p-value from Pearson correlation coefficient.
Jmse 08 00607 g004
Figure 5. Changes in the central spawning-ground gravity (CoSGG) of the spawning grounds in WGWs: (a) moving track and (b) longitude and latitude of the CoSGG.
Jmse 08 00607 g005
Figure 6. Spatial distribution of the ocean currents and fish eggs in WGWs: (a) April, (b) May, and (c) June (arrow direction represents the current direction). Black arrow, western Guangdong coastal current (WGCC); blue arrow, cyclonic circulation; and red arrow, South China Sea warm current (SCSWC).
Jmse 08 00607 g006
Table 1. Deviance analysis for the general additive models (GAMs) fitted to the fish-egg density.
Model FactorsAIC ValueGCV ValueAdjusted R2 ValueDeviance Explained(%)Residual Deviance
Log(Y + 1) = NULL1354.166.3000.001808.76
Log(Y + 1) = s(Month)1349.696.210.022.61761.76
Log(Y + 1) = s(Month) + s(SSS)1251.744.430.3234.71181.80
Log(Y + 1) = s(Month) + s(SSS) + s(Depth)1214.403.890.4143.51022.39
Log(Y + 1) = s(Month) + s(SSS) + s(Depth) + s(SST)1169.283.340.5154.2829.06
Log(Y + 1) = s(Month) + s(SSS) + s(Depth) + s(SST) + s(Chl-a)1161.023.260.5256.8781.28
Log(Y + 1) = s(Month) + s(SSS) + s(Depth) + s(SST) + s(Chl-a) + s(Distance)1159.033.240.5357.2774.32
Table 2. Contributions of the selected variables in GAMs.
VariablesContribution
(%)
d.f.Pr(F)Pr(chi)
SSS32.110.572.2 × 10−16 ***2.2 × 10⁻¹⁶ ***
SST10.79.025.7 × 10−9 ***4.6 × 10⁻¹⁰ ***
Depth8.82.828.3 × 10−9 ***1.9 × 10⁻⁹ ***
Month2.61.810.019 *0.018 *
Chl-a2.64.280.004 **0.004 **
Distance0.40.450.047 *0.046 *
***, p < 0.001; **, p < 0.01; and *, p < 0.05. SSS, sea surface salinity; SST, sea surface temperature; Chl-a, chlorophyll a.; d.f., degrees of freedom; Pr(F), p-value from an ANOVA F-ration test; and Pr(chi), a type of score test to evaluate the nonlinear contributions of the nonparametric effects.

