Article

Model Test and Numerical Simulation of Grouted Connections for Offshore Wind Turbine Under Static Axial Load

School of Urban Planning and Municipal Engineering, Xi’an Polytechnic University, Xi’an 710048, China
*
Author to whom correspondence should be addressed.
J. Mar. Sci. Eng. 2020, 8(7), 543; https://doi.org/10.3390/jmse8070543
Submission received: 27 June 2020 / Revised: 13 July 2020 / Accepted: 15 July 2020 / Published: 21 July 2020
(This article belongs to the Special Issue Analysis and Design of Offshore Wind Turbine Support Structures)

Abstract

:
The bearing capacity of the grouted connections is investigated through the model test and numerical simulation with two rates (low and high) and four kinds of specimens: shorter without shear keys, shorter with shear keys, longer with shear keys, and conical with shear keys. It reveals that the bearing characteristics of the specimen of longer with shear keys is worse than the specimen of conical with shear keys, but better than the specimen of shorter with shear keys. Moreover, the bearing characteristics of the specimen of shorter without shear keys is the worst one.

1. Introduction

The world’s offshore wind energy resources can be prepared in a huge amount [1,2,3,4,5]. While onshore wind power has rapidly improved, the development of offshore wind power has also begun. The transitional form of marine structures and basic connections have achieved rapid development, and has been applied internationally [6,7,8].The structure of the grouting connection has the advantages of reasonable force and economy, so it is commonly used in the offshore wind turbine foundation. The force behavior of this type of connection has been studied internationally, and its results have mainly focused on grouting [9,10,11,12,13,14] with low-stress performance, and has formed a clear design specification guide design [15,16,17,18,19]. However, there are few studies on the connection form using high-performance grout, and there are fewer studies on experimental performance [20,21,22,23,24,25,26]. Based on the actual need of some offshore wind farm development projects in China, this study conducted axial static load tests and numerical simulation on the offshore joints of high-performance grouting, which can provide a reference for the design of similar projects.

2. Axial Static Load Test

2.1. Test Piece Design

The model scale is taken at 1:10; the similarity of the section bending stiffness is considered and the DNV specification [26] is required for the detailed dimension design of the grouting joints. The test grouting connection section is a two-tube phase sleeve, grouting between the two tubes, the height difference between the inner tube and the outer tube, the end, is set to 100 mm.
The grouting parameters are given in Table 1.
The steel is selected as Q345, rolled into a steel pipe that complies with the requirements and welded. The steel parameters are shown in Table 2.
The shear button is cut to a rectangular section of the steel strip according to the design size. The welding rod is selected, based from the J422-3.2 ordinary welding rod and welded by hand.
According to the length of the grouting connection section and whether the shearing force key is set, the test piece is divided into four types: a short non-shearing key, a short shearing key, a long shearing key, and a tapered shearing key, respectively A, B, C, D, are indicated. The design parameters of the test piece are presented in Table 3 and Figure 1.

2.2. Load Line

This test uses a 1000T pressure tester (Figure 2) to apply axial loads in stages. Force control and displacement control are combined to control the loading process. The loading rate for the force control phase is 1200 kN/min. The loading rate of the displacement control stage is about 1/5–1/3 of the force control rate according to the displacement of the specimen during loading and the variation of the load in the interval of 0.01~0.06 mm/min, setting a lower force termination value. Maximize the response of the specimen to the deformation process.
The loading history is shown in Figure 3.

2.3. Measurement Content and Test Process

In this experiment, the IMC dynamic data acquisition system is used to collect data, each collected data value, and overall change curve, are displayed in real-time.
Measurement content:
(1)
load F(kN): the load value is collected by using a 200T load sensor;
(2)
displacement u (103 μm): arrange the sliding resistance displacement meter (at the top and bottom two shearing keys) along the height direction of the test piece, and collect the displacement curve of the test piece during loading.

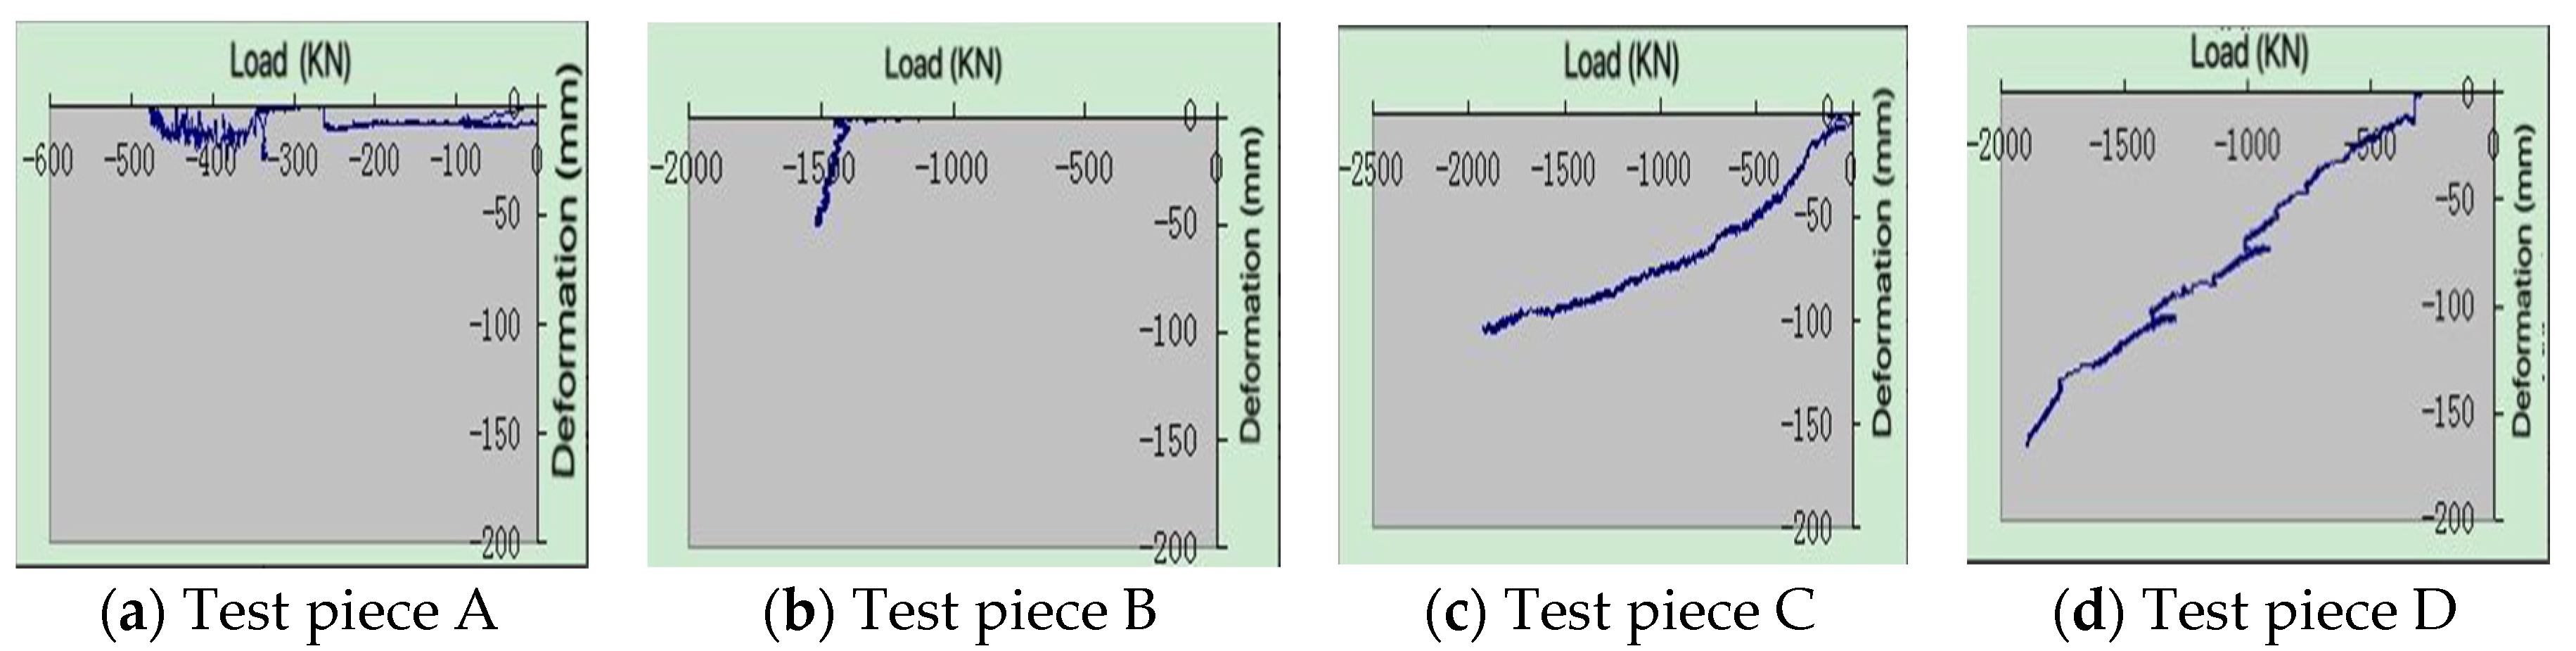
3. Test Results and Analysis

The load-displacement curve is shown in Figure 4. According to the displacement meter calibration, the actual displacement of the test piece is the value in the figure divided by 50.
The analysis of the force performance of a single test piece is analyzed from the load-displacement curve and the load-deformation diagram of a single test piece (Figure 5). The deformation of the test piece in the deformation of a single test piece is the top displacement of the test piece minus the bottom displacement; thus, the relative deformation of a single test piece under load is obtained.
The performance difference was obtained by comparing the load-displacement curves (top) between different test pieces (Figure 6).
Test piece A.
It can be seen from Figure 4(a1,a2) that the specimen is maintained at about zero with almost no change in the displacement of the upper and lower parts when the load is about 350 kN. It can be considered that the test piece has no damage and no relative slip.
When the load exceeds 350 kN, the displacement of the upper and lower ends of the test piece increases rapidly and the load-displacement curve is almost straight. It can be seen from Figure 5a that the deformation of the test piece is almost zero, and it can be considered that the test piece grout and the steel pipe bond performance. Completely damaged, the steel pipe produces a rigid displacement.
At a load of approximately 350 kN, the load suddenly decreases and then continues to increase. It can be considered that the test piece is supported by friction until a large displacement stops.
Test piece B.
It can be seen from Figure 4(b1,b2) that the displacement of the upper part of the test piece changes uniformly with the loading history, while the lower part of the displacement changes according to a certain rate of change. When the loading mode is changed, the rate of change is unchanged, and the rate of change in the front segment is less than that in the upper segment.
It can be seen from Figure 5b that before the load reaches about 1400 kN, the displacement difference between the upper and lower ends can be considered small and maintained at zero. It can be considered that the test piece is evenly stressed at this stage. When the load exceeds 1400 kN, the deformation increases sharply, and the force is very uneven along the pipe height direction;
When the load reaches 890 kN, the load is suddenly reduced. When other curves are combined, it can be considered that the inside of the test piece is damaged at this time.
Test piece C.
It can be seen from Figure 4(c1,c2) that the displacement of the upper part of the test piece changes linearly with the load, while the lower part of the displacement is unchanged before the load reaches about 600 kN. After the flow exceeds 600 kN, the displacement of the lower part is the same as the load. Linear change, the slope of the lower load-displacement curve is small and the rate of displacement growth is slow.
It can be seen from Figure 5c that the difference between the upper and lower displacements decreases with the increase rate of the load, and the force is not uniform along the height direction of the tube.
When the load reaches about 1300 kN, the load suddenly decreases. When other curves are combined, it can be considered that there is damage inside the test piece at this time.
Test piece D.
It can be seen from Figure 4(d1,d2) that the displacement of the upper end is a linear change and the rate of change of the lower displacement is about the same as the upper end, at about 100 kN, the displacement of the rear displacement is slow.
It can be seen from Figure 5d that before 100 kN, the deformation can be considered to be zero, that is, the upper and lower ends are synchronously changed. When the load exceeds 100 kN, the deformation changes linearly and extends to the maximum load. Uniform force, after the load exceeds 1400 kN, the force performance is still good.
When the load reaches about 1000 kN, the load is suddenly reduced, and other curves are combined. It can be considered that there is damage inside the test piece at this time.
It can be seen from Figure 6a that when the load is less than about 350 kN, the deformation of test piece A and test piece B are the same, when the load exceeds this value, the displacement of test piece A increases rapidly and the test piece fails. The displacement of the piece B follows a linear change and the rate of change is the same as the previous stage. It can be considered that the latter has better performance than the former.
It can be seen from Figure 6b that when the load is less than 1400 kN, the deformation of the test piece C and the test piece B changes substantially linearly and the rate of change is consistent. When the load exceeds 1400 kN, the displacement growth rate of the latter is the former 3–5 times, it can be considered that the former is superior for larger loads.
It can be seen from Figure 6c that when the load is less than 1400 kN, the deformation of the test piece B and the test piece D changes substantially linearly. The change rate of the former is about 1/2~2/3 when the load exceeds 1400 kN; the rate of change of the former is about twice that of the latter. It can be considered that the former is better than the latter and the latter is better than the former. For larger loads, after better.

4. Cut the Specimens

After the test, the test piece was cut as shown in Figure 7.
(1)
The damage to test piece A begins with the bond failure between the outer casing and the grouted stone body and, finally, the overall outer casing slides down, once the damage begins, the ultimate bearing capacity is reached;
(2)
The short shear key test piece B is severely damaged around the shear key and both ends are more serious than the middle part;
(3)
Test piece C and the key test piece D are broken by the chipping of the grouted stone body between the shearing keys, the longer specimen deviated from the middle position to the two ends and the taper connection diameter transition was seriously damaged.

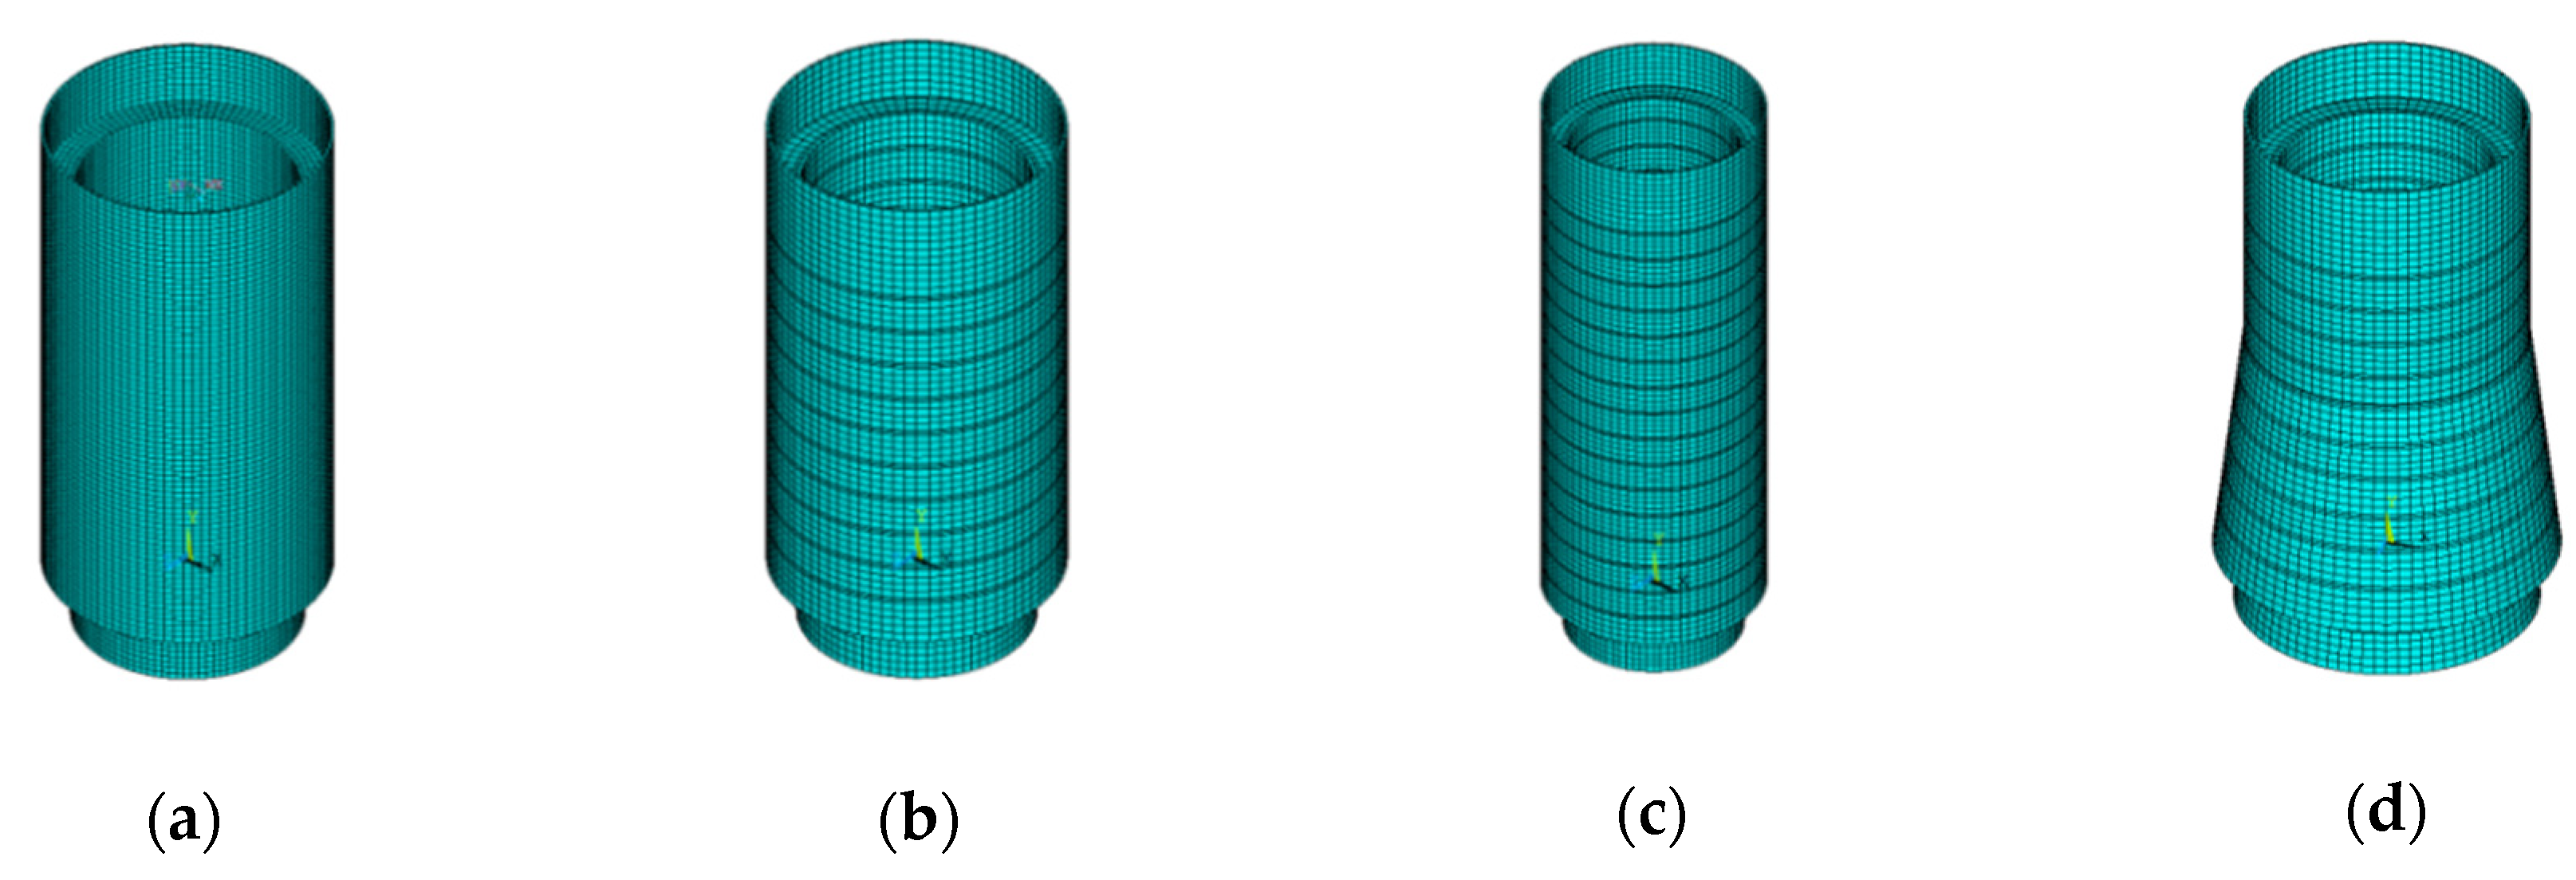
5. Numerical Simulation

Numerical Model and Loading Settings

Using ANSYS modeling, the inner and outer steel tubes are all selected Solid186 units, and the grouting material is an 8-node hexahedral unit-Solid65 unit. The calculation uses William-Warnke five-parameter failure criterion. The surface contact unit (Contact174 and Target170) is used between the grouting material and the outer wall of the steel pipe pile and the inner wall of the jacket to simulate the contact slip between the two, and the hexahedral mesh is divided. The meshing of the four groups of models (corresponding to Figure 8) is as follows:
Due to space limitations, test pieces B and D are taken as examples to show the numerical simulation results. The first and third principal stresses are shown in Figure 9.
The bearing capacity-displacement curve is shown in Figure 10.
The axial bearing capacity of the four sets of test pieces is shown in Table 4.
Comparing A and B, it can be seen that the axial load capacity of the set shear key is 2.6 times higher than that without the shear key. The comparison of B and C shows that the axial load capacity of the long joint is 46% higher than that of the short joint; B and D show that the axial load capacity of the tapered design is 12.3% higher than that without the tapered design.
The above analysis shows that the axial bearing capacity of the grouting connection section can be significantly improved when the shear key is set. The bearing capacity can also be increased when the connection section is lengthened or the cone design is adopted. Moreover, the axial bearing capacity can be increased when the connection section is lengthened rather than the cone design.

6. Conclusions

Through this study, the conclusions are as follows:
(1)
under the axial load, the axial bearing capacity of the specimen A is the lowest and the beginning of the failure means the termination of the failure, which is an obvious brittle failure. The axial load capacity of the specimen B is stronger and the deformation performance is stronger. The axial load capacity of the test piece C is relatively high and the internal damage is severe during the loading process; the axial load capacity of the test piece D is strong and the local damage is serious;
(2)
the axial bearing capacity of the test piece B is higher than that of the test piece A. When the load is small, the test piece C and the test piece B are equivalent in force performance, but when the load exceeds a certain value, the rate of increase of the displacement of the test piece B is greater than that of the test piece C. Test piece D is deformed more uniformly than the test piece B;
(3)
the bearing capacity of the test piece A mainly depends on the bonding strength between the casing and the grouted stone body. It is recommended to attempt to sandblast the outer surface of the pile sleeve and the inner surface of the outer sleeve to improve the bonding strength;
(4)
how to make the test piece B uniform in the height direction is the main measure to improve force performance. At the same time, it is recommended to explore other shear key cross-section forms so that the section stiffness can be smoothly changed to reduce the stress concentration;
(5)
for the test piece C, it is recommended to set the shear key parameters and the length of the connecting section so that the force is uniform along the length of the connecting section. For specimen D, it is suggested to reduce the diameter of tapered bottom broadening, and sectional bottom broadening can be tried to achieve a smooth transition;
(6)
compared with the model test, the numerical simulation results have a higher safety factor and the trend of load-deformation results is the same, which is consistent with the theoretical results. The experimental results are in good agreement with the numerical simulation, so the numerical simulation is used to reflect the actual connection of the grouting connection section. The load situation is reasonable.

Author Contributions

Conceptualization, W.Z.; methodology, D.L.; software, W.Z.; validation, W.Z., W.L. and T.Y.; formal analysis, W.L.; investigation, D.L. and W.L.; data curation, W.L. and T.Y.; writing—original draft preparation, W.Z.; follow up investigation, L.L.; writing—review and editing, W.Z.; supervision, T.Y.; project administration, W.Z. All authors have read and agreed to the published version of the manuscript.

Funding

Support for this research was provided by the Research Initiation Project of Xian Polytechnic University (Grant No. 310-107020368) and the National College students’ Innovative Entrepreneurial Training Plan Program (Grant No. 201910709052).

Conflicts of Interest

The authors declare there is no conflict of interest regarding the publication of this paper.

References

  1. Xian, C.L. Current situation and Prospect of wind power generation in the world. China Foreign Energy 2012, 3, 24–31. (In Chinese) [Google Scholar]
  2. Yun, F.W.; Hui, W. Research on the status quo and infrastructure of offshore wind farms at home and abroad. In Proceedings of the 13th Sub Venue of the 13th Annual Meeting of the Chinese Association for Science and Technology—Offshore Engineering Equipment Development Forum, 21–23 September 2011. (In Chinese). [Google Scholar]
  3. Lin, J.H.; Jie, C.Y.; Peng, X.S. Review and Prospect of offshore wind power generation. China Shipbuild. 2011, 52, 595–599. (In Chinese) [Google Scholar]
  4. Ying, H. Review and Prospect of China’s wind power industry in 2010. Shipp. Mater. Mark. 2011, 1, 11–14. (In Chinese) [Google Scholar]
  5. Wei, C.Z.; Liang, Q.H.; Qin, S. Research progress of offshore wind energy resources at home and abroad. Ocean Dev. Manag. 2014, 6, 25–32. (In Chinese) [Google Scholar]
  6. Kuo, Y.-S.; Achmus, M.; Kao, C.-S. Practical Design Considerations of Monopile Foundations with Respect to Scour; Global Wind Power: Beijing, China, 2008; p. 104. [Google Scholar]
  7. Lamport, W.B. Ultimate Strength of Grouted Pile-to-Sleeve Connections. Ph.D. Thesis, Texas University, Austin, TX, USA, 1988. [Google Scholar]
  8. Mark, L.B. Development of an Analytical Model for the Ultimate Capacity of Axially Loaded Grouted Pile to Jacket Connections. Ph.D. Thesis, Rice University, Houston, TX, USA, 1980. [Google Scholar]
  9. Nat, W.K.; Demir, I.K. Axial strength of grouted pile-to-sleeve connections. J. Struct. Eng. 1985, 111, 19678. [Google Scholar]
  10. Dowling, P.J.; EInashai, A.S.; Carroll, B.C. A new pressurized grouted connection for steel tubular. J. Constr. Steel Res. 2003, 39, 33–38. [Google Scholar]
  11. Anders, S. Betontechnologische Einflüsse auf das Tragverhalten von Grouted Joints. Ph.D. Thesis, Hannover University, Welfengarten, German, 2008. (In German). [Google Scholar]
  12. Zhao, X.L.; Grundy, P.; Lee, Y.T. Grout sleeve connections under large deformation cyclic loading. In Proceedings of the Fifth International Society of Offshore and Polar Engineering Conference, Kitakyushu, Japan, 26–31 May 2002. [Google Scholar]
  13. Zhao, X.L.; Ghojelb, J.; Grundy, P.; Han, L.H. Behavior of grouted sleeve connections at elevated temperatures. Thin Walled Struct. 2006, 44, 751–758. [Google Scholar] [CrossRef]
  14. William, B.L.; James, O.J.; Joseph, A.Y. Strength an behaviour of grouted pile-to-sleeve connections. J. Struct. Eng. 1991, 117, 26099. [Google Scholar]
  15. American Petroleum Institute. Recommended Practice for Planning, Designing and Constructing Fixed Offshore Platforms—Working Stress Design, 21st ed.; American Petroleum Institute: Washington, DC, USA, 2000. [Google Scholar]
  16. United Kingdom Department of Energy. Report of the Working Party on the Strength of Grouted Pile Sleeve Connections for Offshore Structures; No. ST41/80C; Wimpey Laboratories, Ltd.: Mussafah, Abu Dhabi, 1980.
  17. Det Norske Veritas. DNV-OS-J101-Design of Offshore Wind Turbine Structures; Det Norske Veritas: Oslo, Norway, 2001. [Google Scholar]
  18. Det Norske Veritas. DNV-OS-J101-Design of Offshore Wind Turbine Structures; Det Norske Veritas: Oslo, Norway, 2007. [Google Scholar]
  19. Det Norske Veritas. DNV-OS-J101 Design of Offshore Wind Turbine Structures; Det Norske Veritas: Oslo, Norway, 2011. [Google Scholar]
  20. Han, R.L.; Shi, W.X.; Zhou, Y. Grout sleeve connection and relevant applications. Struct. Eng. 2011, 27, 149–153. (In Chinese) [Google Scholar]
  21. Zhao, Y.Y.; Jiang, S.C. A general view of research on grouted tubular connections. Ind. Constr. 2009, 39, 514–517. (In Chinese) [Google Scholar]
  22. Guan, X.M.; Hu, S.G.; Ding, Q.J. Experimental study on component optimization of ultrafine high performance grouting cement. Acta Build. Mater. 2002, 02, 176–180. (In Chinese) [Google Scholar]
  23. Huang, L.W.; Yang, F.; Zhang, J.J. Grouting connection between pile foundation and jacket for offshore wind turbine. Water Resour. Hydropower Eng. 2009, 40, 39–45. (In Chinese) [Google Scholar]
  24. Guo, L.; Lu, T.W.; Gu, Q. Study on properties and engineering application of grouting materials prepared with high performance grouting agent. Ind. Archit. 2007, 9, 93–96. (In Chinese) [Google Scholar]
  25. Song, C. Connection of offshore wind turbine tower and base. SHANXI Energy Conserv. 2010, 2, 46–49. (In Chinese) [Google Scholar]
  26. Det Norske Veritas. DNV-OS-J101 Design of Offshore Wind Turbine Structures; Det Norske Veritas: Oslo, Norway, 2010. [Google Scholar]
Figure 1. Specimens.
Jmse 08 00543 g001
Figure 2. Specimens.
Jmse 08 00543 g002
Figure 3. Loading process.
Jmse 08 00543 g003
Figure 4. Load-settlement curves.
Jmse 08 00543 g004
Figure 5. Load-deformation curves.
Jmse 08 00543 g005
Figure 6. Comparison of load-deformation curves.
Jmse 08 00543 g006
Figure 7. Cleavage of the specimens.
Jmse 08 00543 g007
Figure 8. Finite element (FEM).
Jmse 08 00543 g008
Figure 9. Principal stress.
Jmse 08 00543 g009
Figure 10. Axial bearing capacity-displacement curve.
Jmse 08 00543 g010
Table 1. Parameters of the grouting material.
ParametersGrouting Material
Tensile Strength
(MPa)
7
Compressive Strength
(MPa)
130
Elastic Modulus
(Gpa)
55
Poison’s Ratio0.19
Constitutive ModelKINH
Table 2. Parameters of the steel.
MaterialQ345
Modulus of Elasticity (Gpa)206
Poisson’s Ratio0.3
Volumetric Weight (N/m3)76,930
Yield Stress (Mpa)345
325
295
275
Wall Thickness (mm)≤16
>16–35
>35–50
>50–100
Tensile and Compressive Resistance and Flexural Resistance (Mpa)310
295
265
250
Shear (Mpa)180
170
155
145
Table 3. Parameters of the specimens.
Group ClassificationABCD
Number of test pieces1111
Outer tube diameter
(mm)
450450450The upper end of 450
The lower end of 548
Inner tube diameter
(mm)
360360360The upper end 360
The lower end 482.5
Grouting length
(mm)
7007001050The upper end 312.5
The lower end 387.5
Grouting space thickness
(mm)
39.539.539.5The upper end 39.5
The lower end 27.25
Shear key spacing
(mm)
-125125125
Shear key height
(mm)
-555
Shear key width
(mm)
-101010
Number of shear keys-5 roads8 roads5 roads
Table 4. Axial bearing capacity.
ProjectABCD
Axial bearing capacity (kN)657.142378.83137.32672

