Article

Soil Interaction and Grout Behavior for the NREL Reference Monopile Offshore Wind Turbine

1
Instituto Superior Técnico, Av. Rovisco Pais nº1, 1049-001 Lisbon, Portugal
2
IDMEC, Instituto Superior Técnico, Av. Rovisco Pais nº1, 1049-001 Lisbon, Portugal
*
Author to whom correspondence should be addressed.
J. Mar. Sci. Eng. 2020, 8(4), 298; https://doi.org/10.3390/jmse8040298
Submission received: 18 March 2020 / Revised: 9 April 2020 / Accepted: 13 April 2020 / Published: 24 April 2020
(This article belongs to the Special Issue Analysis and Design of Offshore Wind Turbine Support Structures)

Abstract

:
Monopiles for offshore wind are the most used foundations by farm operators due to their low production costs, when compared to other bottom-fixed or floating foundations. In this research, a monopile foundation for offshore wind power was evaluated for its soil interaction and grout behavior, and an appropriate numerical model for the structural analysis of the foundation and tower was developed. FAST 8, an aero-hydro-servo-elastic numerical code developed by NREL, was used to obtain the loads applied on the supporting structures. These loads were pre-processed before they were inputted on the finite element model, developed using the finite element software ANSYS. The considered conical grout connection, which connects the monopile to the transition piece through friction, was modeled under a changing-status nonlinearity condition. To model the soil–pile interaction, a p-y model was applied using the ANSYS APDL commands. Static, modal, and transient structural analyses were produced to study the structure suitability for its use on offshore environments. Different soil interactions were modeled, and their results were then compared within the transient and modal analysis, indicating that the angle of the grout connection strongly affects the loading conditions on the grout. Moreover, scouring affects the dynamic behavior of the overall supporting structures, thus protection against this phenomenon is suggested.

1. Introduction

The European Union (EU) has defined a 20% global quota for renewable energy sources by 2020 and 32.5% by 2030 amongst the accumulated energy mixes of its members [1,2]. However, the current European renewable capacity will not guarantee the achievement of these goals, meaning that further capacity needs to be installed. For this installed capacity, Europe has strongly focused on wind expansion over the last years, with already 178.8 GW installed by the end of 2018, more than the current nuclear capacity [3,4]. Onshore wind is now, in fact, commercially competitive against fossil fuel solutions [5]. Furthermore, if environmental, health, and other factors are considered, it can actually be considered cheaper [6]. Offshore exploration is the next natural step of this wind power development, since Europe has at its disposal a large marine space with strong wind potential. The installed capacity at the end of 2019 was rated at 22 GW [7], with 132 GW anticipated by 2030 and 460 GW by 2050 [8]. In 2019 alone, 2.5 GW were installed and €6 billion worth of financing was granted for new Offshore Wind (OSW) farms [7]. Capital costs for new offshore wind farms in Europe are now decreasing, after a continuous rise up to 2015 [9]. However, almost all the offshore capacity is confined to the northern European seas, as the winds are strong and sea levels are shallow. This is mostly explained by the technical challenges imposed by the Atlantic Ocean, especially due to greater depths, longer distances to shore, and harsh sea conditions [8]. For low depths, the monopile solution is the most affordable, accounting for 81% of the total turbines installed in Europe [10]. However, for greater depths, the monopile application becomes impractical as its cost surpasses the cost of other solutions, namely jacket or floating structures [11,12]. However, these solutions for bigger depths cannot compete yet within the energetic market—even considering tariff support—due to their low Technology Readiness Levels [8].
The monopile foundation used in offshore wind was adapted from the O&G industry, which has been using similar piles for decades [13]. A monopile is a simple hollow cylinder which is penetrated into a sandy soil using a pneumatic hammer. This pile is then connected with a transition piece through a grouting connection. This type of connection is used because it allows for small corrections on the turbine leveling, since the monopile may not be completely vertical once the penetration process is done. Then, the turbine is attached to the top of the transition piece, usually using a bolted flange connection. Although the monopile represents the most common solution found nowadays on the OSW industry, it has nonetheless revealed some limitations and reliability issues, which are often related to the grouting connection and the scouring effect due to the turbulence generated by the sea currents passing on the pile. These currents eventually remove some soil around the pile, which can result in catastrophic consequences for the turbine [14]. Failures in the grout connection are related to the dynamic bending loadings resulting from the wind turbine operation, which promote axial tension loadings that the grout material is sometimes unable to sustain [15]. A consortium led by DNV evaluated, back in 2011, the drawbacks of the grouting connections; ultimately, this joint industry consortium updated the existing standards for offshore wind foundations [16] and generated the Recommended Practice Document for the analysis of grout connections [17]. The current offshore wind standard now suggests the use of conical surfaces on the grout connection.
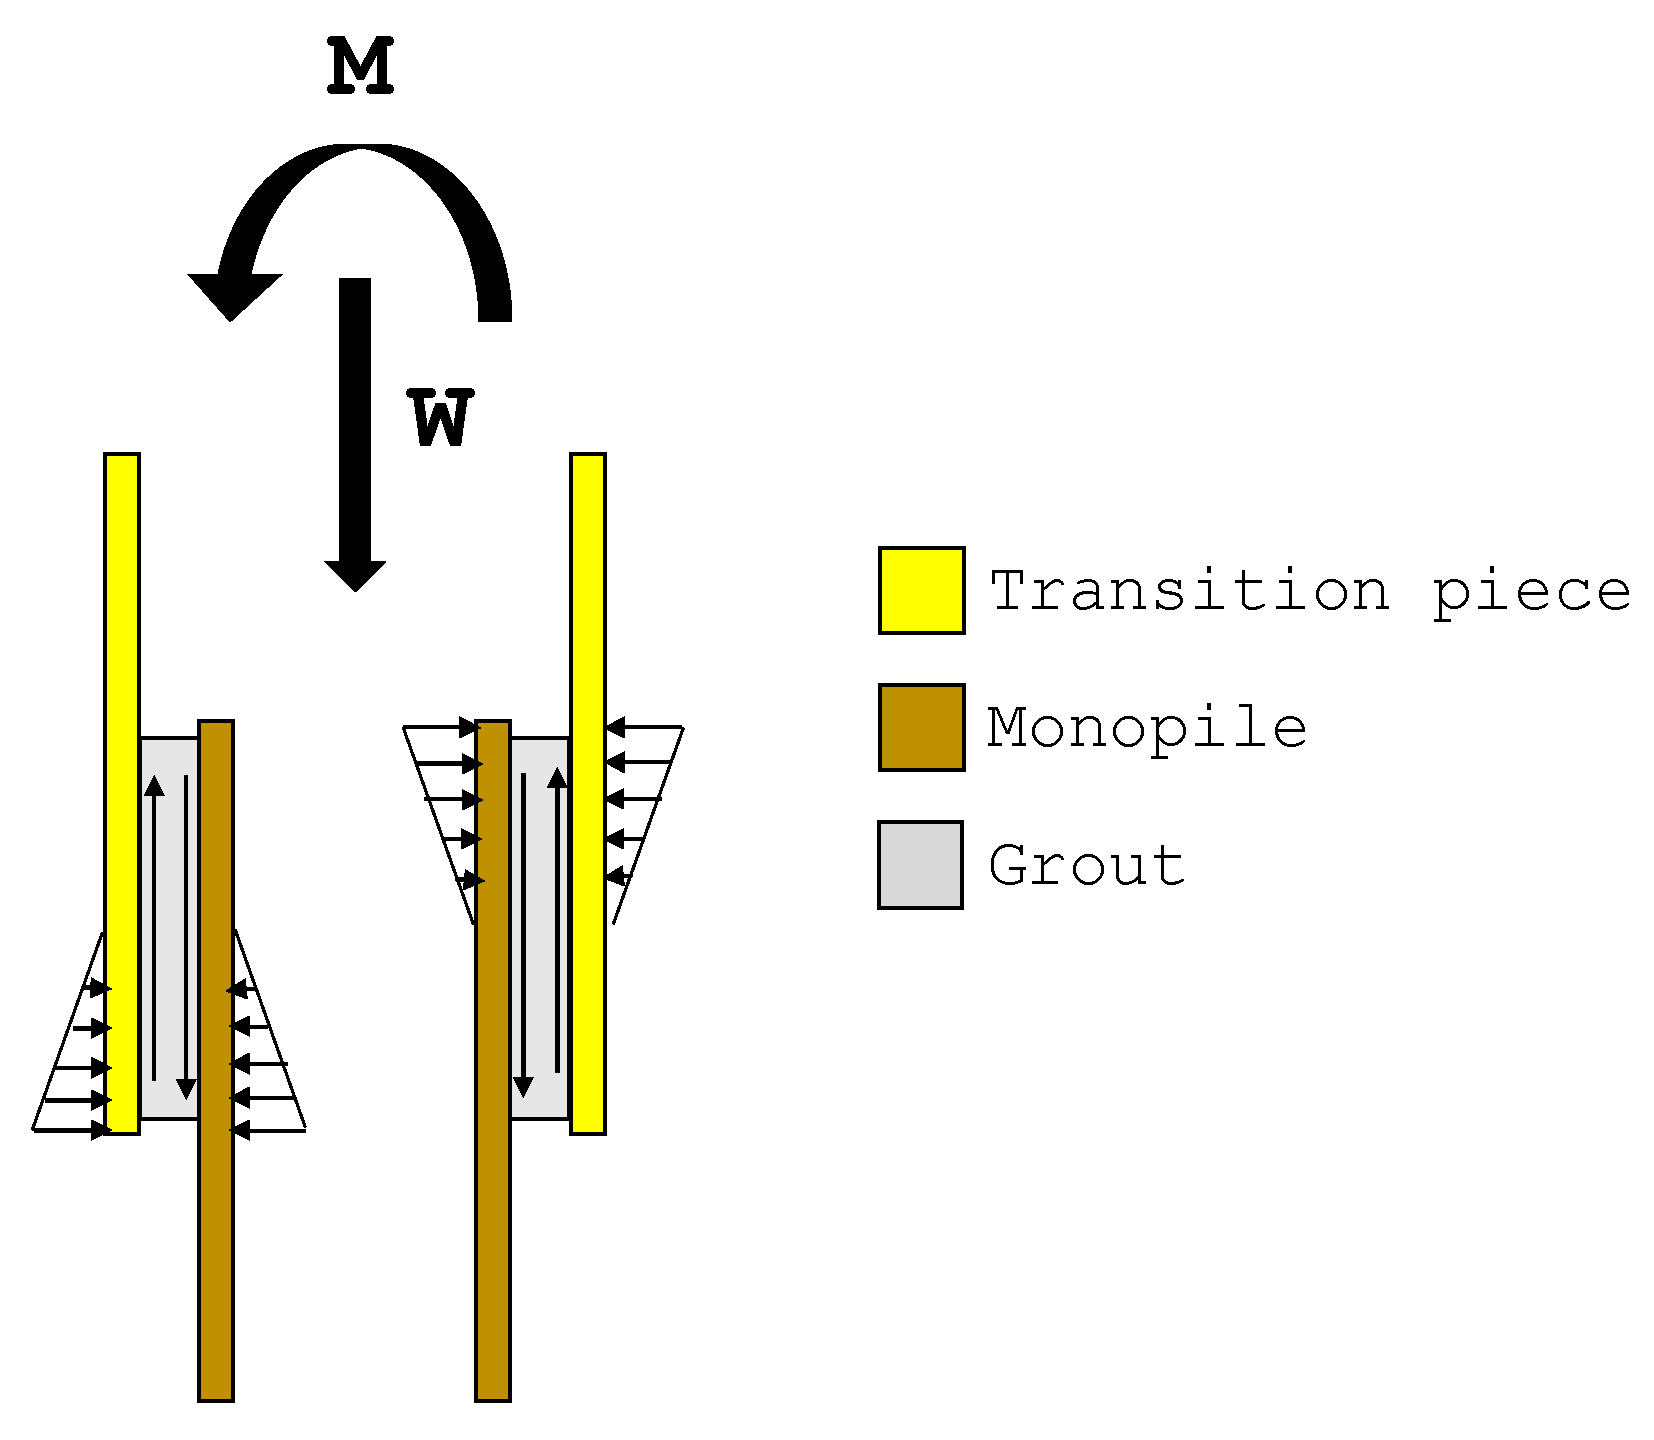
Figure 1 presents the qualitative distribution of loadings on the grout connection during operation. The normal stresses applied on the grout connection due to bending loadings are usually much higher than those resulting from the own weight of the supporting structures. The impact of these moments, resulting from the aerodynamic loadings applied on the rotor and tower, may exceed the axial capacity of the cementitious material.
Other authors have produced extensive research to evaluate the structural behavior of the offshore wind monopile foundation. Rong et al. [18] developed an analytical solution for natural frequency of monopile supported wind turbine towers. Yu-Hung Lin and Hsin-Haou Huang [19] developed an improved geometry for the grout connection using computational methods. Arany et al. [20] described the procedures for the design of a monopile foundation. K. A. Abhinav and N. Saha [14], E. Kementzetzidis et al. [21], and Shadlou and Bhattacharya [22] computationally and numerically evaluated the geotechnical aspects of monopile dynamics. W. Weijtjens et al. [23] and D. Lombardi et al. [24] evaluated these aspects experimentally. Furthermore, corrosion plays a decisive role on these offshore wind foundations, due to the corrosive behavior of the ocean. F. P. Brennan and [25] O. Adedipe et al. [26] evaluated the impact of corrosion on these structures and their welds. Welding is particularly critical on these structures; the resulting residual stresses were evaluated by A. Jacob et al. [27]. Finally, structures offshore are subjected with dynamic loadings which results in damage due to fatigue. Alati et al. [28] evaluated the fatigue behavior of two offshore wind foundations in the time domain and estimated the respective lifetime damage equivalent load.
Within this research, a computational model of a monopile foundation developed by NREL was evaluated for its structural integrity: the grout connection and the effects of scouring on the dynamic behavior of the turbine were evaluated. Outputs from the FAST code were used as inputs on the finite element model, and sub-modeling techniques were used to evaluate the grout connection. The soil–pile interaction was analyzed using the p-y model from the American Petroleum Institute (API) [29].

2. Methodology

This section presents the methods used throughout the structural analysis of the monopile foundation: the aero-hydro-servo-elastic code FAST, from NREL, was used to obtain the loadings registered on the turbine rotor, tower, and the foundation due to the interactions with hydro- and aerodynamic loads. Then, these resulting loads were used as input for the finite element analyses, which were produced using the ANSYS Workbench tools. Within the structural evaluation, a modal analysis was produced on the complete model, where the influences of scouring on the modal properties of the structure were evaluated. In addition, transient analyses were produced to complete model and, then, a sub model technique was used to analyze in more detail the stress concentration on the grout connection. Furthermore, the interaction between the soil and the monopile structure was evaluated using specific soil–pile elements provided by ANSYS. These methods were used to understand the capacity of the monopile to support the loads which would eventually be applied upon it on real ocean conditions.

2.1. The Model

The offshore wind turbine used during this research was developed by NREL, characterized by its nominal power of 5 MW [30]. The tower, transition piece, and pile were made of structural steel. The grout was assumed to be formed by a brittle cementitious material, but this specific connection was not detailed by NREL. Special attention was given to the positive normal stresses registered in it since cementitious materials cannot cope with such types of loadings. In addition, the design of the grout connection was produced, specifically considering different connection angles, as suggested by the current standard [31].
The CAD models were modeled using the commercial software Solidworks. The monopile consists of a hollow cylinder with an outer diameter of D = 6   , thickness t M P = 0.06   m and is to be installed at a sea depth of 20 m. The monopile section that was penetrated into the soil ( L M P S ) was not modeled as a CAD model, being instead considered using pipe finite elements on the ANSYS environment. Table 1 presents the main properties of the used turbine and supporting structures.

2.2. FAST Code

FAST is an aero-hydro-servo-elastic code which is used to computationally simulate the response of wind turbines of horizontal axis in onshore and offshore environments. The results obtained from this tool are consistent and align with the results from other existent codes [33]. This code aggregates aerodynamic, hydrodynamic, servo, and structural modules, allowing for a coupled simulation of the various modules to simulate the operating conditions of the tested turbine. Input data for FAST are provided through text files, which are associated with the respective modules. The environmental conditions considered throughout this research were based on the Design Loading Case (DLC) 1.1 retrieved from the GL standard [34], as presented on Table 2.
Both the AeroDyn and HydroDyn FAST modules retrieve loading data as force per unit of member length. These loadings were then input in ANSYS using the remote displacement feature. FAST v8 does not have integrated features able to simulate soil–pile interactions. This interaction was later done using ANSYS. Figure 2 presents the interaction flowchart between FAST and ANSYS. As stated above, Solidworks was used to produce the CAD models.

2.3. CAD Models

The CAD models used in this research were modeled using Solidworks and based on the structural dimensions provided by NREL. Conic connections without shear keys are recommended at the grouting region, as to allow for the cement to hold the resulting shear stresses. The standard also details tubular grout connections, which should always include shear keys. According to standard DNV-OS-J101 [35], the angle of a conic connection should be defined between 1° and 3°. Therefore, for this research, a set of computational static tests were produced to evaluate the impact of this angle α on the structural behavior of the grout connection. α is the angle that the conic surface makes with the vertical axis of the turbine, and the tested angles were, respectively, 1.25°, 2.5°, and 3.75°.
The grout thickness and the friction coefficient considered were t g = 125   m m and µ = 0 , 7 , respectively, according to the respective standard DNV-ST-0126 [16]. The effective grout length ( L g ) was defined at 9 m for the conical connection with α = 1.25°, considering 8.5 m of conic connection and 0.5 m cylindrical connection at the top, as recommended by the respective standard [16]. However, as the grout connection becomes more conical, the effective length of the connection reduces itself proportionally according to ( L g 1 sin ( α ) ) , considering that the monopile and the transition piece diameters are constant for different connection angles. Figure 3 presents the variation of the connection length with the conic angle, considering an extension of 0.5 m cylindrical grout at the top for each angle tested.
From the analysis of Equations (1) and (2), which were retrieved from the standard [31] and define the maximum nominal contact pressure ( p n o m ) and the maximum friction torque ( M t ), respectively, it is possible to verify that L g strongly affects the resulting values.
p n o m = 3 π · M R p · L g 2 ( π + 3 µ ) + 3 π · µ · R p 2 · L g
where M = bending moment applied on the connection, R p = external radius of the interior pile of the connection, and µ = friction coefficient between steel and the grout cement.
M t = 2 π γ m p P · µ · L g ( R p t 2 + R p t · L g sin ( α ) + L g 2 3 sin 2 ( α ) )
where γ m = material factor (1,0), R p t = exterior radius of the interior pile of the connection, and p P = nominal contact pressure due to the weight of the supporting structures.
During the analysis of the previous equations, one must consider that, although a greater angle generates a superior limit on admissible axial loads, the consequent reduction on the effective length of the connection may affect its capacity to support bending loadings, which are more prominent than the first. Thus, the first static analyses were produced to understand which angles were able to sustain both the axial and bending loads the connection is subjected to. Then, the transient analysis was produced with the angle that provided the best compliance between axial and bending loadings.
Because of the numerical complexity related with the finite element simulations based on contact regions and the consequent raise on the associated computational times, the grout connection analyses were produced using the submodeling technique. For these analyses, the supporting structures’ model is simplified and only the grout connection region is modeled and analyzed, as shown in Figure 4.
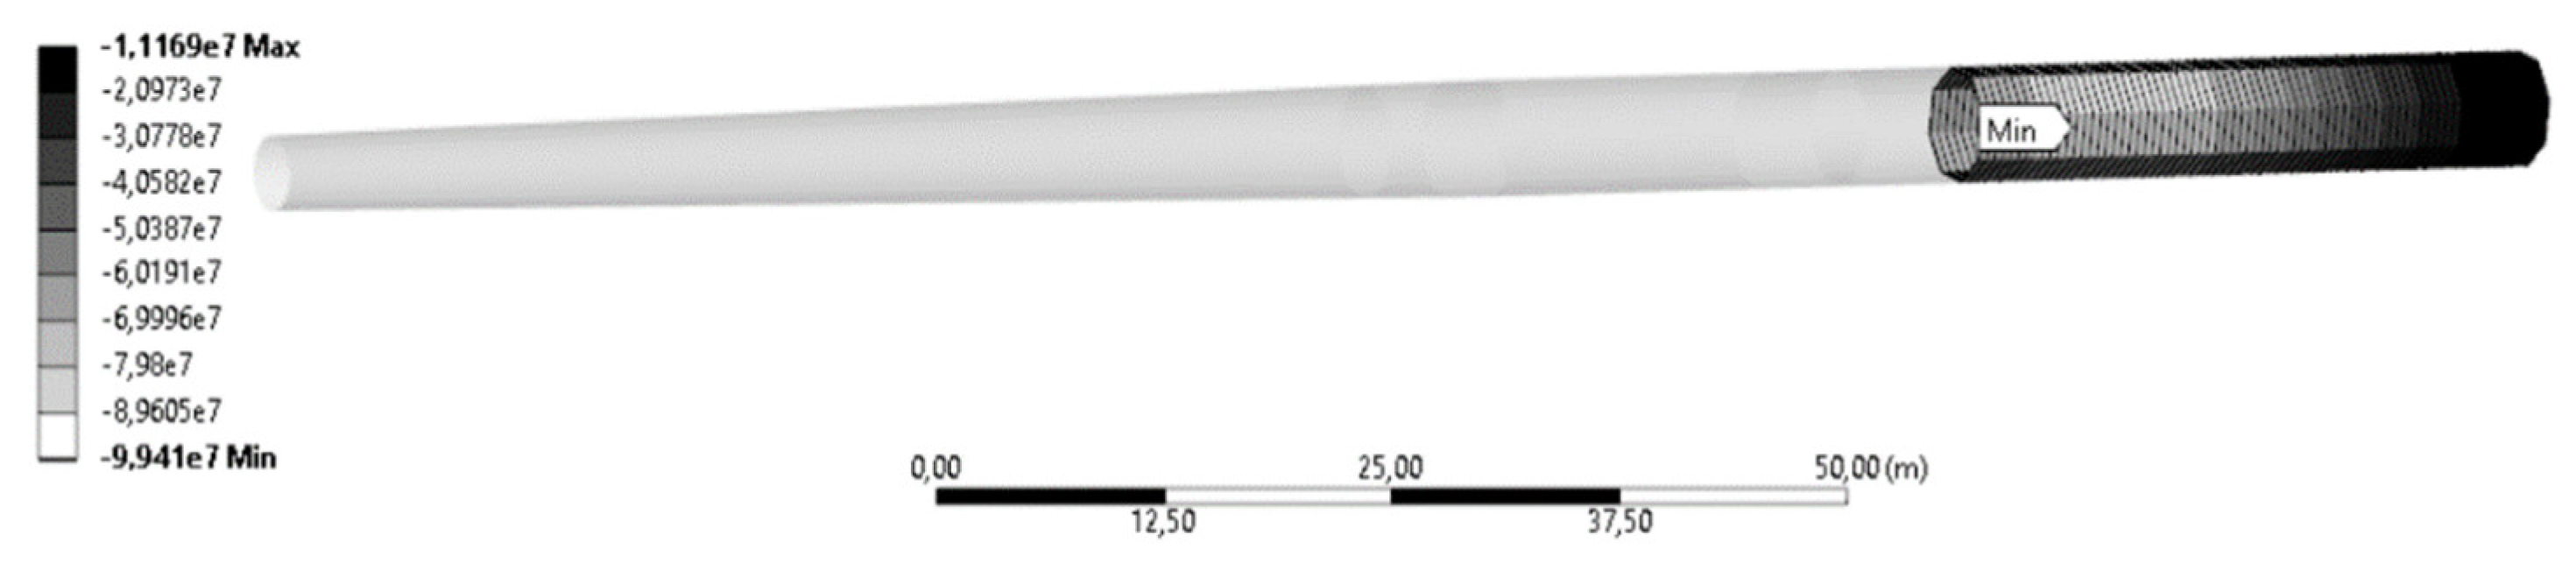
As stated above, the section of the monopile that was penetrated into the soil was not modeled in Solidworks, but was numerically considered in ANSYS. The length of the monopile that was penetrated into the soil is referred to in this document as L M P S . This length was estimated by producing a static analysis that subjects the structure with wind and ocean loadings, since the monopile possesses a behavior that is similar to a cantilever beam, where high values of shear and bending moments are found near the seabed region. The soil was then responsible for counteracting those loadings and guaranteeing the stability of the structure. By considering that the prominent loadings act in only one direction, a two-dimensional study may be done during this design step. Because of the physics involved within the soil–pile interaction, a null shear stress at the monopile can be registered, as shown in Figure 5, where displacement is null and the bending moment is maximum. The length of the monopile was achieved through an iterative process, considering that the static equilibrium had to be achieved and that the maximum stress on the monopile could not surpass the one defined in the respective standard DNV-GL-ST-0437 [36].

2.4. Soil–Pile Interaction

The interaction between the monopile and the soil needs to be analyzed with special care, since soil properties affect the dynamic response of the structure due to the associated nonlinearities in its behavior. In fact, a fixed boundary condition is not adequate to fully understand the dynamic behavior of the supporting structures. Soils can be classified by different properties, such as their formation process, grain size, age, mineralogical structure, etc. Besides that, it is known that the stress–strain relationship that soils present is highly non-linear, with its stiffness strongly depending on the loading history, for example.
The API (American Petroleum Institute) developed a series of studies related to the interaction between piles and the respective soil within offshore conditions for the O&G industry. The p-y model is, today, the most widely accepted on the scientific community. This model provides a soil–pile interaction that is directly independent of the loadings submitted to it. This interaction is described by the p-y curves, where p is the resulting force per unit of length, y is the horizontal deflection, and x is the depth [29].
Equation (3) presents the expression for the p-y model, for a certain x depth [29]:
p = A   p u tanh ( k   x A   p u y )
where p = soil reaction, A = factor to account for cyclic or static loading condition, p u = ultimate bearing capacity, at depth x, k = initial modulus of subgrade reaction, and y = lateral deflection.
The k parameter is related to the relative density of the soil and the respective angle of internal friction ϕ, which describes the stiffness of the response curve. The ultimate bearing capacity is obtained from the system of Equation (4):
{ p u s = ( C 1   x + C 2   D )   γ   x p u d = C 3   D   γ   x                                   p u = min   { p u s , p u d }        
where γ = effective soil weight, D = external diameter of the monopile, and C 1 , C 2 , C 3 = coefficients determined as functions of ϕ.
The model developed by API derives from empirical studies made to piles with diameters equal to or less than 2 m, where the length to diameter ratio is greater than 30; meanwhile, offshore wind monopiles usually have ratios lower than 10. Therefore, care should be taken when using this model for these monopile dimensions, due to result extrapolation [37]. In addition, DNV-GL states that caution should be taken when using this model for dynamic analyses [38].
The p-y curves are specific for each depth, which means the piles are usually modeled as beams supported by a series of non-linear decoupled elasto-plastic springs, which simulate soil reactions, as shown in Figure 6. Figure 6 also presents the two different soils evaluated during this research, with the respective soil parameters. The first soil simulated a traditional Portuguese soil, as indicated by LNEC (the Portuguese Civil Engineering Laboratory), while the second considered the soil distribution detailed by the OC3 consortium [33]. This soil was divided into three different layers, with their interfaces at 5 and 14 m below the seabed floor. Figure 7 presents the p-y curves for the two evaluated soils, at different depths. The analysis clearly showed that the OC3 soil is stiffer than the Portuguese one.
The finite element commercial software ANSYS possesses a one-dimensional finite element that can implement spring loadings with non-linear deflections, notably the COMBIN39 element. Furthermore, the element can behave linearly during the unload phase, which means that the loading history will produce irreversible strains, thus considering accumulated plasticity on the soil. These COMBIN39 elements were coupled with pipe elements (PIPE288) that simulate the length of the monopile which is penetrated into the seabed soil. The connection between the CAD models above the seabed and the PIPE288 elements below seabed was guaranteed using a fixed joint connection, with no relative displacements or rotations allowed. In addition, the springs obtained from the p-y model were distributed on the penetrated pile with a distance of 1 m between each other. The use of PIPE288 is adequate for slender structures and is based on the Timoshenko beam theory; it is an element with six degrees of freedom at each node, with great applicability in bending, torsion, and axial loadings, for both linear and big deformation settings [39]. The three-dimensional components of the model were modeled using a SOLID187 finite element.
The scouring effect is referred, on standard DNVGL-ST-0126 [16], as a phenomenon which must be considered when analyzing the interaction between soil and pile. The standard refers that the ratio between the scouring length and the pile diameter may reach a value of 1.3, which means that, for a diameter of 6 m, a scouring length of around 7.8 m can be expected. The effect of scouring on the dynamic behavior of the monopile was then computationally evaluated for scouring lengths of 0, 3, 5, and 7 m for models PTx and OCx. The p-y model springs from the eroded soil were shifted down correspondingly to the shift registered due the scour effect. In addition, a model with a fixed boundary condition on the seabed floor was produced, for results comparison. Figure 8 presents the final mesh of finite elements used throughout this research, with 2612 elements, 18,084 nodes and guaranteed convergence of 1%.

3. Results

The structural analysis of the monopile was divided into four stages, where the first stage consisted on the analysis of the dynamic modal behavior of the structure. The second stage included the results from the dynamic analyses, while the third and fourth stages focused on the grout connection and on the soil–pile interaction, respectively.

3.1. Monopile Length

Considering the environmental loading conditions presented in Table 2, the final length for the monopile was achieved by guaranteeing the static equilibrium and by avoiding excessive stresses on the pile. The static equilibrium was easily achieved, even for values of penetrated length of 10 m. In addition, the maximum stresses registered on the pile, presented on Figure 9 for static analyses, comply with the standard even for depths of only 10 m. Nonetheless, the maximum deflections registered on the tower top for the lower depths are not acceptable for wind turbine operation (at more than 5 at 10 m depth, as shown in Figure 9). Then, the length considered throughout the research was 36 m below the seabed, to match the depth defined by NREL.

3.2. Modal Analysis

Modal analyses evaluate the modal shapes and natural frequencies of a certain structure. This is particularly relevant for offshore wind structures since they are loaded with dynamic solicitations resulting from its interaction with the winds and the ocean. Figure 10 presents the four most relevant mode shapes from the evaluated monopile structure, with three bending and one torsional modes represented.
Table 3 presents results for the three soil conditions: fixed, the OC3 soil, and the Portuguese soil. As expected, the natural frequencies of the set rose with the stiffness of the soil. The model Fix0, characterized for having infinite soil stiffness, registered the greatest modal frequencies, followed by model OC0 and, finally, model Pt0. Only the side-to-side frequencies are presented, since the corresponding fore–aft ones possess very similar values. The first natural frequencies of the three models ( f 0 F i x 0 = 0 , 2697   H z ,   f 0 O C 0 = 0 , 2411   H z ,   f 0 P t 0 = 0 , 2354   H z ) were found between the frequencies 1P and 3P (1P is the frequency of rotor rotation at nominal power and 3P is the frequency of passage of blades at nominal power) with a margin of 10% (between 0.222 and 0.311 Hz), which means it is a soft–stiff structure, with improved operational life under fatigue. However, waves may excite a range from 0.05 to 0.25 Hz (waves with a period of 20 and 4 s, respectively), which is close to the frequencies detailed for the first side-to-side modes of the three models. Nonetheless, waves with bigger frequencies are usually less energetic, which may attenuate resonance effects.
Figure 11 presents the behavior of the first natural frequency of the supporting structures as the scouring depth varies, for two different soil conditions, namely the fixed boundary condition and the Portuguese soil, which is the less stiff of the tested soils. It can be perceived that the bigger is the scour depth effect, the lower is the first frequency registered. The effect is more notorious for the Portuguese soil (a decrease of almost 7%). These results provide insights on the necessity to protect the monopile against scouring, as well as to correctly model soil–structure interactions. Moreover, the value of f 0 P t 7 is close to the 1P frequency, which means the structure may enter in resonance during operation, which may also cause accelerated fatigue damage.

3.3. Dynamic Analysis

Dynamic analyses were produced using the model presented in Figure 8, for different pile–soil interaction conditions and assuming structural displacements obtained from DLC 1.1 tested using FAST. These are time-based transient analyses that consider inertia effects. These analyses essentially provide an overview of the stress distribution along the monopile, the transition piece, and the tower. The connection between the transition piece and the tower was simplified; thus, the bolted flange connection was not evaluated in this research.
Figure 12 presents the values for the maximum von Mises stresses registered throughout the dynamic analyses of Pt0 and Fix0, which have been registered mostly on the tower. These values are related to DLC 1.1 described in Table 2. Assuming that the supporting structures are manufactured using a S355 structural steel, the registered safety factors are about 3 and 3.2, respectively. It must be considered, however, that these are the results for just one DLC, and that other DLCs should be tested to ensure that the structure can sustain the conditions that it will be subjected into, such as storms and abnormal wave conditions.

3.4. Grout Analysis

The grout connection was first evaluated by static analyses, specifically to select the most appropriate α angle for the grout connection. Figure 13 presents the maximum resulting stresses on the grout cementitious material, in tangential, axial, and radial directions. The load applied during these static analyses consisted of a horizontal loading applied at the rotor, of 900 kN, and a bending moment at the rotor, of 3400 kN.m. These maximum values were retrieved from FAST and are based on a non-turbulent analysis for the conditions described in Table 2.
Figure 13 reveals that a small change on the connection angle results in a considerable increase in the maximum registered stresses. This phenomenon is associated with the reduction of the effective connection length. Because of the considered yield stress of the grout material ( σ t = 25.0   MPa in tension), the considered angle for the following analyses was selected at 1.25°. Figure 14 shows how the difference in the effective length affects the geometry and the stress state (von Mises) on the grout connection.
Both solutions presented on Figure 14 possess the same diameters on the top and base, whereas their effective lengths differ by 67% (from the longer to the shorter). Figure 15 presents the pressure distribution on the grout for the 1.25° solution, when the static loads are applied.
The stress results from the dynamic analysis of the 1.25° grout connection are presented in Figure 16, which presents the maximum stress values of σ ax = 22.47   MPa , σ tan = 7.55   MPa and σ rad = 0.62   MPa . All of these stresses are below the 25 MPa limit, although the axial stress is close to it. This result highlights the problems that these types of connections have been demonstrating in real offshore wind conditions.

3.5. Soil–Pile Interaction Analysis

As detailed above, stresses on the penetrated part of the monopile were evaluated using specific finite elements—PIPE288 from ANSYS. Figure 17 and Figure 18 present the reaction forces and the horizontal deflections registered on models Pt0 and OC0, under the same static loading, respectively.
One must note that, because of the lower stiffness of the Portuguese soil, horizontal deflections are bigger than those registered on the OC3 soil. In addition, the inflection point of the reaction forces is lower for the Portuguese soil, also indicating lower soil stiffness.
The axial stress values achieved on the penetrated monopile are of the same order of magnitude as those found on the other supporting structures (transition piece and tower), as shown in Figure 19 for the Pt0 soil model.
These maximum axial stresses occur at zero deflection points, where the bending moment is maximum. However, ANSYS does not directly provide von Mises stresses for Beam elements; nonetheless, it provides the registered transverse shear forces at each beam nodes. In addition, it is known that, according to the von Mises criterion:
σ e q = 2 2 ( σ 1 σ 2 ) 2 + ( σ 1 σ 3 ) 2 + ( σ 2 σ 3 ) 2
Since one can assume to have plane stress conditions on the monopile due to its slenderness, we obtain:
σ e q = σ x 2 σ x . σ y + σ y 2 + 3 . τ x y 2
Then, because there is no relevant internal pressure on the monopile, one can also assume that σy = 0, and the equivalent stress equation becomes:
σ e q = σ x 2 + 3 · τ x y 2
According to Budynas and Nisbett [40], we know that the relationship between the shear stress and the transverse shear for a hollow thin-walled round beam is:
τ m a x = 2 V A
where V is the shear force and A is the cross-section area. The maximum axial stress registered by ANSYS for the penetrated section of the monopile is obtained at 9 m below seabed. At this depth, the registered transverse shear is at its minimum, reaching 380 kN, and the transverse cross section area of the monopile is 1.12 m2, which gives a resulting shear stress of 0.68 MPa. This means that, for this depth, and according to Equation (7), shear stress is not relevant for the respective equivalent stress calculation. However, the maximum registered shear force is registered at 23 m below the seabed, reaching 7600 kN, with the respective axial stress being 60.7 MPa. This gives a shear stress of 13.6 MPa, and results in an equivalent stress of 65.1 MPa. It can be concluded that shear effect is not particularly damaging to the monopile, and that axial and bending loadings due to self-weight and aero- and hydrodynamic effects are the most prominent for structural damage.
Figure 20 presents the maximum axial stresses on the penetrated monopile for models Pt0 and Pt7. It becomes clear that the effect of scouring raises the registered stresses on the monopile.

4. Conclusions

In this research, a monopile foundation for offshore wind was evaluated for its structural integrity using computational tools. The produced models were based on the 5-MW reference turbine developed by NREL. The environmental loadings with which the supporting structures were loaded were evaluated using the FAST code, and the soil–pile interaction was considered using a p-y model, which is one of the most used worldwide and recommended by DNV-GL offshore wind standards. The use of soil–structure interaction models proved to be fundamental to correctly simulate the real operation of the support structures.
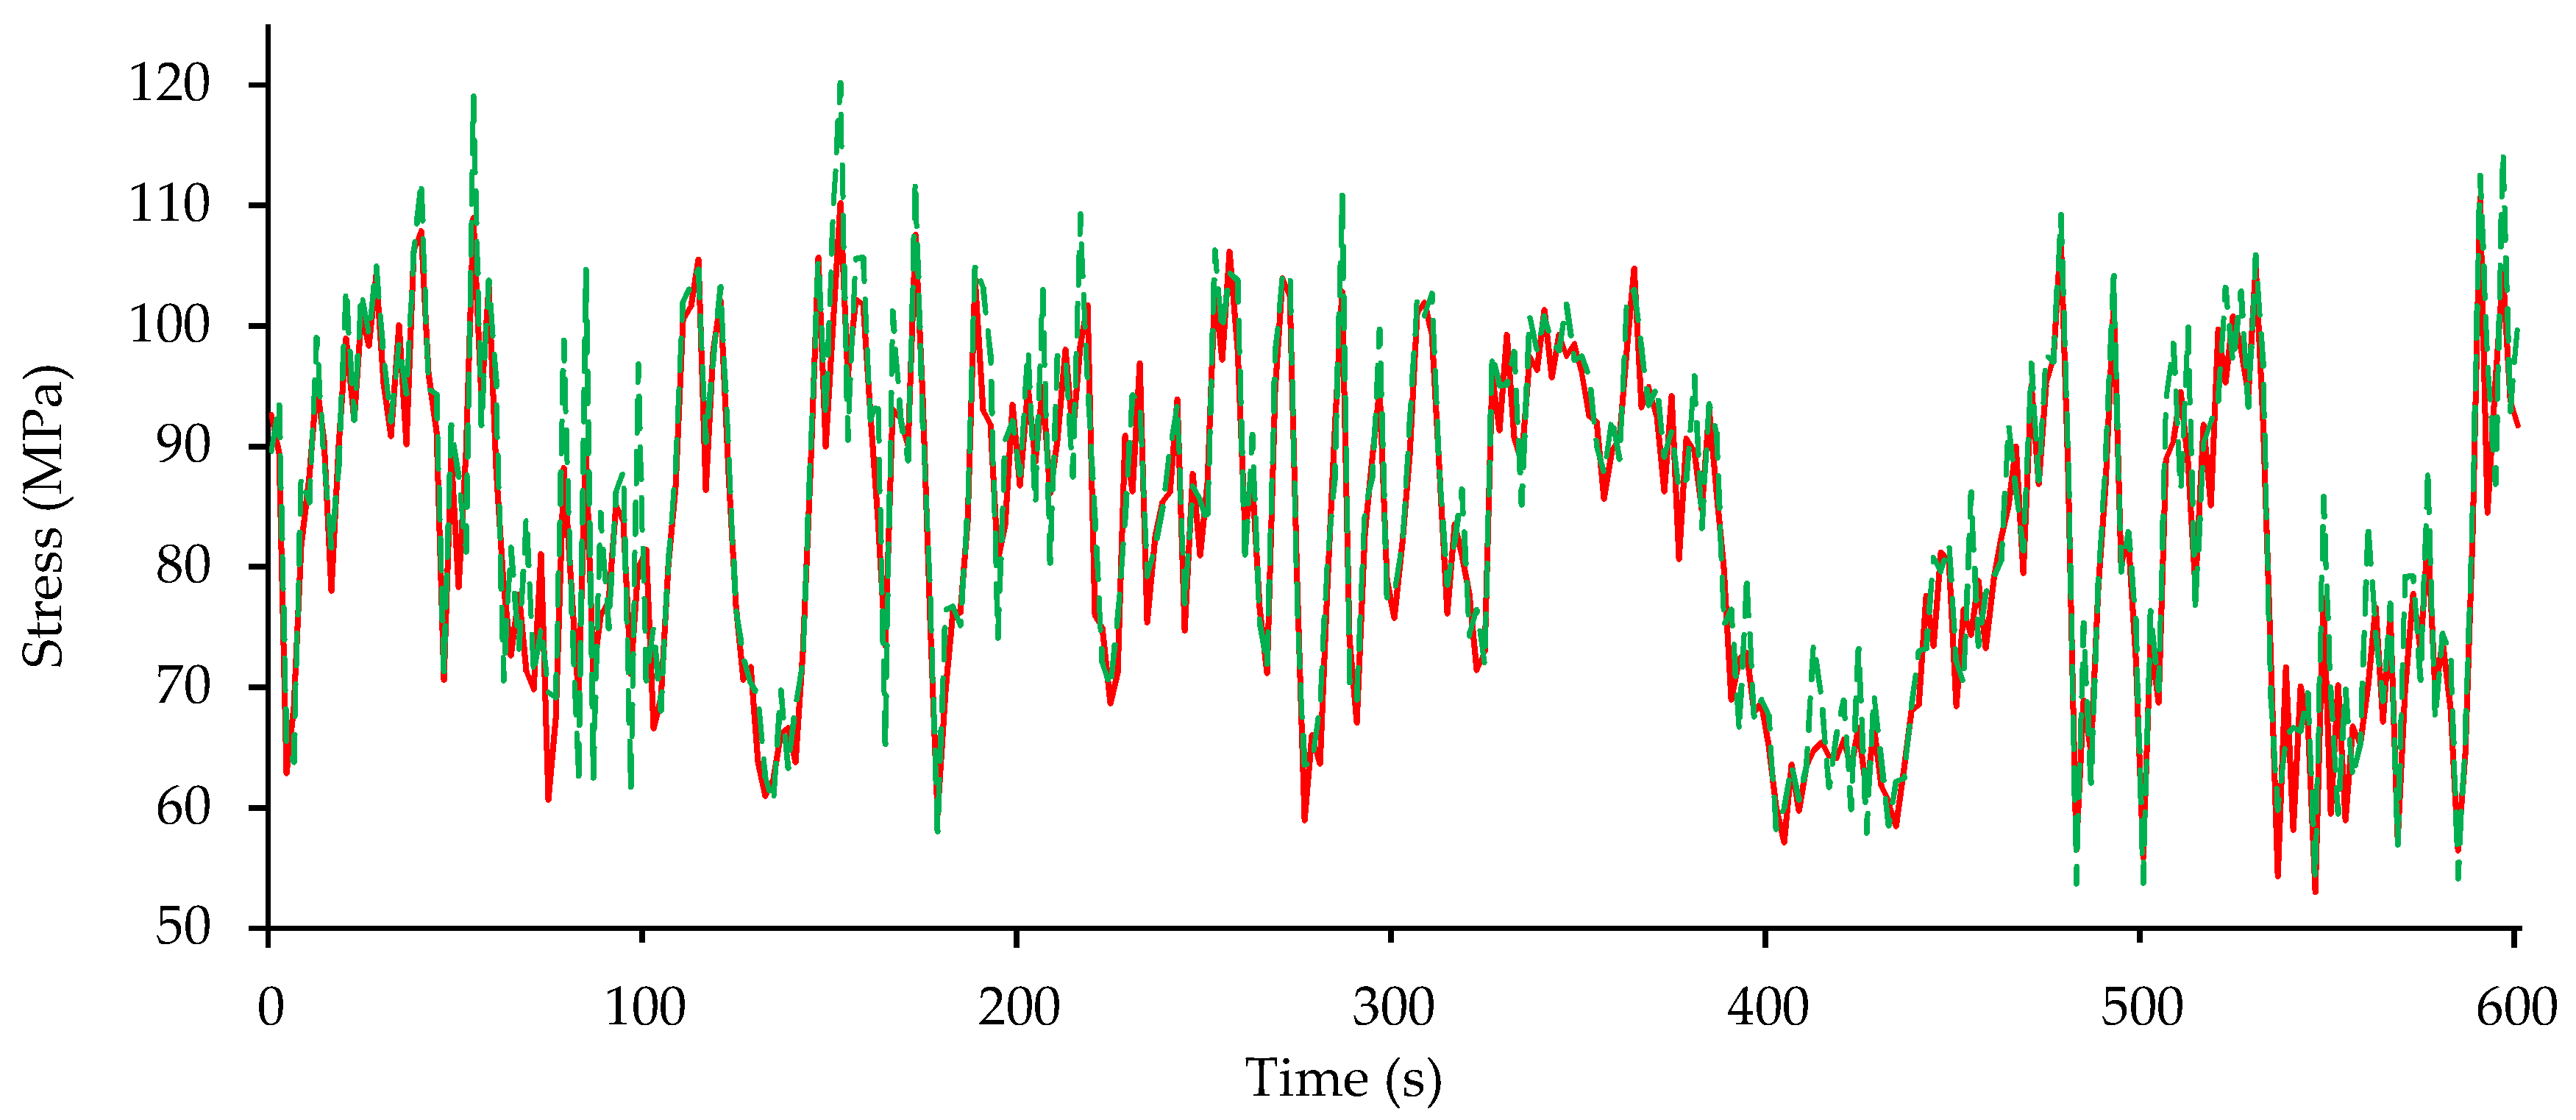
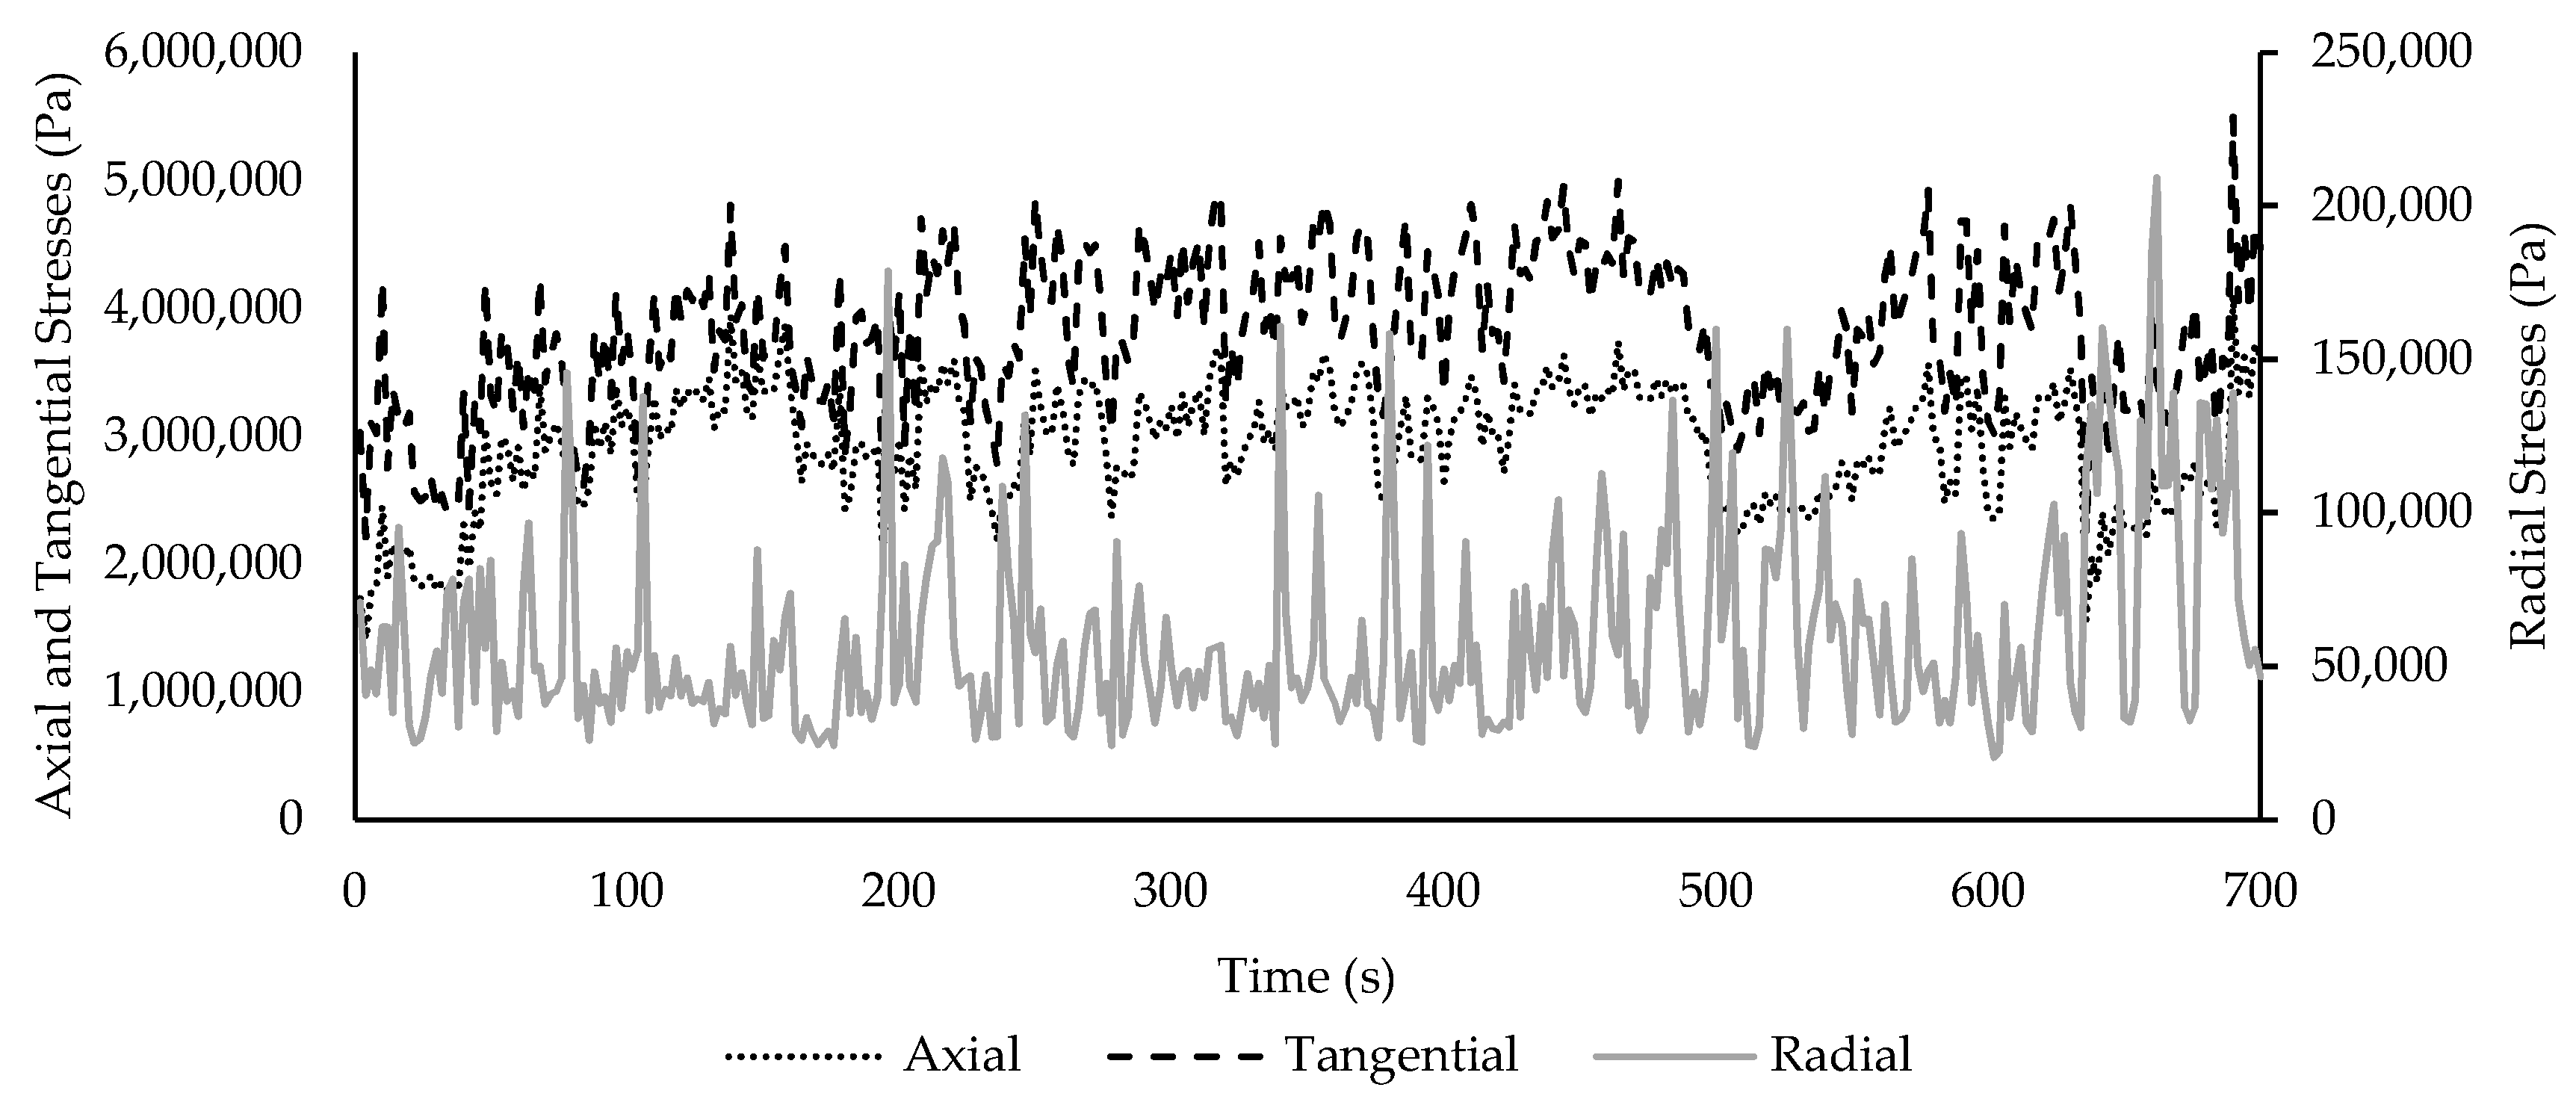
For the transient analyses, the loadings applied on the finite element models were retrieved from FAST, where an average wind speed of 11.4 m/s was used, since this is the wind speed that generates the biggest axial forces on the turbine rotor. The maximum registered deformations were obtained for the models with the lowest soil stiffness and all models registered the maximum stress on the tower of the turbine. Results indicate that the generic stresses registered throughout the support structures are well within the defined limits by the respective standards.
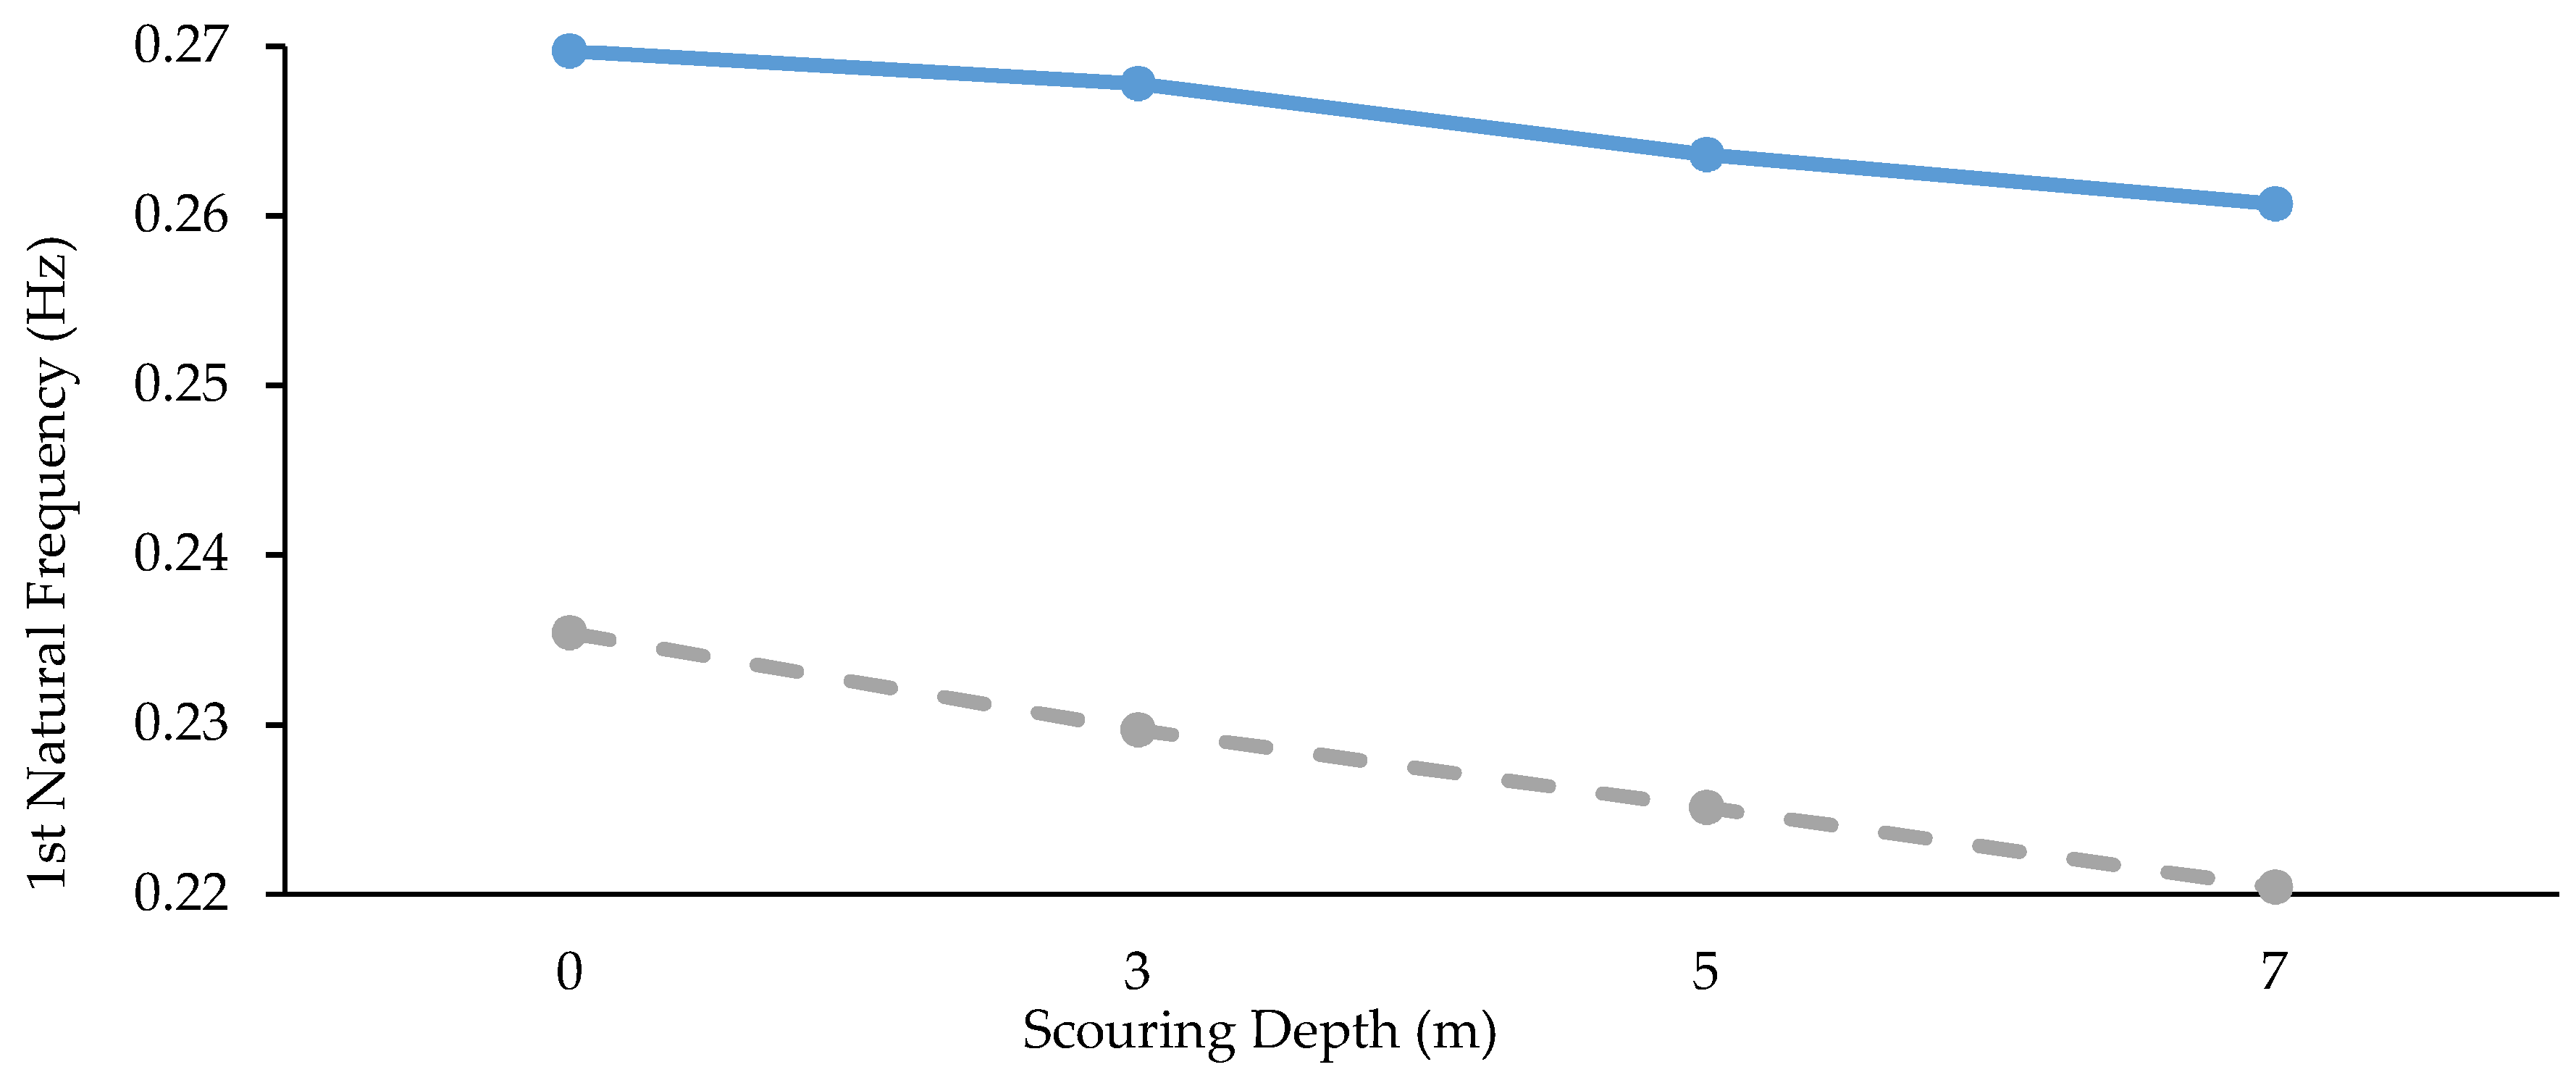
The influence of scouring on the structural behavior of the monopile was evaluated, as bigger scouring depths resulted in a reduction of the natural frequencies to values near the operating frequencies of the rotor. Thus, scouring protection should be considered for these structures to avoid vibrations that could reduce its expected life-time. The grout connection was evaluated using a sub-model, with the results indicating that the registered stresses are within the considered safety ranges. Nonetheless, the closeness of these values to the yield stress value of the grout material indicate that care should be taken and further analyses should be produced to understand the strength of grout materials when under storm or fatigue conditions.
The present research highlights how scouring and grouting issues may affect the reliability of the support structures of offshore wind turbines. Thus, special care should be taken regarding these regions of the monopile. Close inspections should be produced regularly and, preferably, monitoring systems should be installed in these locations.

Author Contributions

Conceptualization, M.V. (Mário Vieira), E.H., and L.R.; Data curation, M.V. (Miguel Viana) and L.R.; Formal analysis, M.V. (Mário Vieira), M.V. (Miguel Viana), and E.H.; Funding acquisition, L.R.; Investigation, M.V. (Mário Vieira), M.V. (Miguel Viana), and E.H.; Methodology, M.V. (Mário Vieira), M.V. (Miguel Viana), E.H., and L.R.; Software, M.V. (Mário Vieira) and M.V. (Miguel Viana); Supervision, M.V., E.H., and L.R.; Validation, L.R.; Visualization, M.V. (Miguel Viana) and L.R.; and Writing—original draft, M.V. (Mário Vieira), E.H. and L.R. All authors have read and agreed to the published version of the manuscript.

Funding

The authors acknowledge support for this research from the MIT Portugal Program Scholarship PD/BD/114146/2016. This work was also supported by FCT, through IDMEC, under LAETA, project UIDB/50022/2020.

Conflicts of Interest

The authors declare no conflict of interest

References

  1. European Parliament. Directive 2009/28/EC of the European Parliament and of the Council of 23 April 2009. Off. J. Eur. Union 2009, 140, 16–62. [Google Scholar] [CrossRef]
  2. European Commission. European Commission—Energising Europe: A Real Market with Secure Supply, IP 07/1361. Available online: http://europa.eu/rapid/press-release_IP-07-1361_en.htm?locale=en (accessed on 25 May 2018).
  3. Komusanac, I.; Fraile, D.; Brindley, G. Wind Energy in Europe in 2018—Trends and Statistics; WindEurope: Brussels, Belgium, 2019. [Google Scholar]
  4. World Nuclear Association. Nuclear Power in the European Union. Available online: http://www.world-nuclear.org/information-library/country-profiles/others/european-union.aspx (accessed on 21 August 2017).
  5. IRENA. Renewable Power Generation Costs in 2017; IRENA: Abu Dhabi, UAE, 2018. [Google Scholar]
  6. Weiss, P.S. Aiming High; WindEurope: Brussels, Belgium, 2015. [Google Scholar] [CrossRef]
  7. Henderson, A.R. Offshore Wind in Europe—Key Trends and Statistics 2019; WindEurope: Brussels, Belgium, 2020; Volume 3. [Google Scholar] [CrossRef]
  8. EWEA (European Wind Energy Association). Deep Water—The next Step for Offshore Wind Energy; EWEA: Brussels, Belgium, 2013. [Google Scholar]
  9. Vieira, M.; Snyder, B.; Henriques, E.; Reis, L. European Offshore Wind Capital Cost Trends up to 2020. Energy Policy 2019, 129, 1364–1371. [Google Scholar] [CrossRef]
  10. EWEA (European Wind Energy Association). The European Offshore Wind Industry—Key Trends and Statistics 2016; EWEA: Brussels, Belgium, 2017. [Google Scholar]
  11. Musial, W.; Butterfield, S.; Ram, B. Energy from Offshore Wind: Preprint; NREL: Houston, TX, USA, 2006. [Google Scholar]
  12. Rosenauer, E. Investment Costs of Offshore Wind Turbines; University of Michigan: Ann Harbor, MI, USA, 2014. [Google Scholar]
  13. Schneider, J.A.; Senders, M. Foundation Design: A Comparison of Oil and Gas Platforms with Offshore Wind Turbines. Mar. Technol. Soc. J. 2010, 44, 32–51. [Google Scholar] [CrossRef]
  14. Abhinav, K.A.; Saha, N. Effect of Scouring in Sand on Monopile-Supported Offshore Wind Turbines. Mar. Georesources Geotechnol. 2017, 35, 817–828. [Google Scholar] [CrossRef] [Green Version]
  15. Chen, T.; Wang, X.; Yuan, G.; Liu, J. Fatigue Bending Test on Grouted Connections for Monopile Offshore Wind Turbines. Mar. Struct. 2018, 60, 52–71. [Google Scholar] [CrossRef]
  16. DNV GL. DNVGL-ST-0126: Support Structures for Wind Turbines; DNV GL: Oslo, Norway, 2016. [Google Scholar]
  17. DNV GL. Recommended Practice DNV GL AS Analysis of Grouted Connections Using the Finite Element Method; DNV GL: Oslo, Norway, 2016. [Google Scholar]
  18. Rong, X.N.; Xu, R.Q.; Wang, H.Y.; Feng, S.Y. Analytical Solution for Natural Frequency of Monopile Supported Wind Turbine Towers. Wind Struct. An Int. J. 2017, 25, 459–474. [Google Scholar] [CrossRef]
  19. Lin, Y.H.; Tsai, C.H.; Lian, C.J.; Lin, H.J.; Huang, H.H. Design and Analysis for Improved Grout Joint of Offshore Monopile Foundation. In Proceedings of the Oceans—2014 Taipei, Taipei, Taiwan, 7–10 April 2014. [Google Scholar] [CrossRef]
  20. Arany, L.; Bhattacharya, S.; Macdonald, J.; Hogan, S.J. Design of Monopiles for Offshore Wind Turbines in 10 Steps. Soil Dyn. Earthq. Eng. 2017, 92, 126–152. [Google Scholar] [CrossRef] [Green Version]
  21. Kementzetzidis, E.; Corciulo, S.; Versteijlen, W.G.; Pisanò, F. Geotechnical Aspects of Offshore Wind Turbine Dynamics from 3D Non-Linear Soil-Structure Simulations. Soil Dyn. Earthq. Eng. 2019, 120, 181–199. [Google Scholar] [CrossRef]
  22. Shadlou, M.; Bhattacharya, S. Dynamic Stiffness of Monopiles Supporting Offshore Wind Turbine Generators. Soil Dyn. Earthq. Eng. 2016, 88, 15–32. [Google Scholar] [CrossRef]
  23. Weitjens, W.; Noppe, N.; Verbelen, T.; Helsen, J.; De Sitter, G.; Devriendt, C. Monitoring of Offshore Turbines for Design and O & M: An Overview of the Activities of OWI-Lab; EWEA: Malmö, Sweden, 2014. [Google Scholar]
  24. Lombardi, D.; Bhattacharya, S.; Wood, D.M. Dynamic Soil-Structure Interaction of Monopile Supported Wind Turbines in Cohesive Soil. Soil Dyn. Earthq. Eng. 2013, 49, 165–180. [Google Scholar] [CrossRef]
  25. Brennan, F.P. A Framework for Variable Amplitude Corrosion Fatigue Materials Tests for Offshore Wind Steel Support Structures. Fatigue Fract. Eng. Mater. Struct. 2014, 37, 717–721. [Google Scholar] [CrossRef]
  26. Adedipe, O.; Brennan, F.; Mehmanparast, A.; Kolios, A.; Tavares, I. Corrosion Fatigue Crack Growth Mechanisms in Offshore Monopile Steel Weldments. Fatigue Fract. Eng. Mater. Struct. 2017, 40, 1868–1881. [Google Scholar] [CrossRef] [Green Version]
  27. Jacob, A.; Oliveira, J.; Mehmanparast, A.; Hosseinzadeh, F.; Kelleher, J.; Berto, F. Residual Stress Measurements in Offshore Wind Monopile Weldments Using Neutron Diffraction Technique and Contour Method. Theor. Appl. Fract. Mech. 2018, 96, 418–427. [Google Scholar] [CrossRef]
  28. Alati, N.; Nava, V.; Failla, G.; Arena, F.; Santini, A. On the Fatigue Behavior of Support Structures for Offshore Wind Turbines. Wind Struct. An Int. J. 2014, 18, 117–134. [Google Scholar] [CrossRef]
  29. API. Recommended Practice for Planning, Designing and Constructing Fixed Offshore Platforms—Working Stress Design; American Petroleum Institute: Washington, DC, USA, 2007. [Google Scholar]
  30. Jonkman, J.; Butterfield, S.; Musial, W.; Scott, G. Definition of a 5-MW Reference Wind Turbine for Offshore System Development; NREL: Golden, CO, USA, 2009. [Google Scholar] [CrossRef] [Green Version]
  31. DNV GL. DET NORSKE VERITAS AS Design of Offshore Wind Turbine Structures; DNV GL: Oslo, Norway, 2014. [Google Scholar]
  32. PAREX. Technical Data—100 Newton Grout AW; PAREX: Atherstone, UK, 2019. [Google Scholar]
  33. Butterfield, S.; Musial, W.; Jonkman, J. Engineering Challenges for Floating Offshore Wind Turbines; NREL: Golden, CO, USA, 2007. [Google Scholar]
  34. Lloyd, G. Guideline for the Certification of Offshore Wind Turbines. Ger. Lloyd Ind. Serv. GmbH 2012, 1–480. [Google Scholar]
  35. DNV GL. DNV-OS-J101 Design of Offshore Wind Turbine Structures; DNV GL: Oslo, Norway, 2014. [Google Scholar]
  36. DNV GL. STANDARD DNV GL ST 0437: Loads and Site Conditions for Wind Turbines; DNV GL: Oslo, Norway, 2016. [Google Scholar]
  37. Velarde, J. Design of Monopile Foundations to Support the DTU 10MW Wind Turbine. Master’s Thesis, Delft University of Science and Technology, Delft, The Netherlands, 2016. [Google Scholar]
  38. DNV GL. STANDARD DNVGL-ST-0126 AS Support Structures for Wind Turbines; DNV GL: Oslo, Norway, 2016. [Google Scholar]
  39. ANSYS. ANSYS Help Viewer 16.2; ANSYS: Canonsburg, PA, USA, 2015. [Google Scholar]
  40. Budynas, R.G.; Nisbett, J.K. Shigley’s Mechanical Engineering Design, 11th ed.; McGraw-Hill: New York, NY, USA, 2011. [Google Scholar]
Figure 1. Pressure and force distribution on the grout connection.
Jmse 08 00298 g001
Figure 2. Flowchart of the interaction between FAST and ANSYS used during the present research.
Jmse 08 00298 g002
Figure 3. Variation of Lg with the conical angle of the connection (dashed line) and the percent difference between Lg (α = i) and Lg (α = 0) (solid line).
Jmse 08 00298 g003
Figure 4. Submodel of the grout connection.
Jmse 08 00298 g004
Figure 5. (a) Deflection of a rigid monopile when subjected to a horizontal loading; (b) representation of generic soil reactions to a rigid monopile; and (c) representation of the resulting bending moment on the rigid monopile.
Jmse 08 00298 g005
Figure 6. Representation of the p-y model, where each depth is described by a unique p-y curve (left); and properties of both the soils analyzed (right).
Jmse 08 00298 g006
Figure 7. Different p-y curves at different depths for the two studied soils—bigger depths (Y) are related with bigger soil reactions (P).
Jmse 08 00298 g007
Figure 8. Final finite element mesh.
Jmse 08 00298 g008
Figure 9. Evolution of the maximum equivalent stress (von Mises-open circles) and of the maximum deflection on the tower top (full circles), considering consecutive increases on the monopile length   L M P S .
Jmse 08 00298 g009
Figure 10. Generic mode shapes for the monopile: (a) first bending mode; (b) second bending mode; (c) third bending mode; and (d) first torsional mode.
Jmse 08 00298 g010
Figure 11. Evolution of the first natural bending frequency with the scouring depth for models Fixx (full line) and Ptx (dashed line).
Jmse 08 00298 g011
Figure 12. Stress series of models Fix0 (full line) and Pt0 (dashed line) for the maximum registered von Mises stress.
Jmse 08 00298 g012
Figure 13. Maximum stresses on the grout material at the three directions: tangential (point line), axial (solid line), and radial (dashed line).
Jmse 08 00298 g013
Figure 14. Stress state (von Mises, Pa) for both connection angles: (a) 1.25°; and (b) 3.75°.
Jmse 08 00298 g014
Figure 15. Pressure distribution (Pa) on the grout surface obtained from the static analysis.
Jmse 08 00298 g015
Figure 16. Stress series registered during the dynamic analysis for the grout connection, with the axial stress (point line), tangential stress (dashed line), and radial stress (solid line).
Jmse 08 00298 g016
Figure 17. Reaction forces registered for: Pt0 model (left); and OC0 model (right).
Jmse 08 00298 g017
Figure 18. Horizontal deflection of the monopile for Pt0 (solid line) and Fix0 (dashed line) models.
Jmse 08 00298 g018
Figure 19. Axial stress distribution on the PILE288 elements of the penetrated monopile for the Pt0 soil model.
Jmse 08 00298 g019
Figure 20. Registered stress series on the dynamic analysis for the monopile, with the axial stresses for Pt0 (solid line) and the axial stresses for Pt7 (dashed line).
Jmse 08 00298 g020
Table 1. Properties of the turbine equipment and supporting structures.
Nominal Power 5   M W
Orientation; Configuration of the rotorUpwind; 3 blades
Diameter of the rotor126 (m)
Cut-in; rated; cut-out speed3.0; 11.4; 25.0 (m/s)
Cut-in; rated rotor speed6.9; 12.1 (rpm)
Rotor mass; nacelle1.10∙105; 2.40∙105 (kg)
I x x ;   I y y ;   I z z of the set rotor-nacelle4.37; 2.35; 2.54 (107 kg∙m2)
CM ( X ; Y ; Z ) of the set rotor-nacelle(−0.414; 0.000; 89.570) (m)
Tower length77.6 (m)
Tower diameter and thickness at the top3.870; 0.019 (m)
Tower diameter and thickness at the base6.000; 0.027 (m)
Tower mass2.37 × 105 (kg)
Tower I x x ;   I y y ;   I z z 161.37; 161.37; 1.53 (106 kg∙m2)
Tower Center of Mass ( X ; Y ; Z )(0.00; 0.00; 43.81) (m)
Grout Cement [32]Structural Steel
Specific Mass, ρ2250 kg∙m−38500 kg∙m−3
Young Modulus E32 GPa210 GPa
Poisson Coefficient ν0.250.33
Shear Modulus G12.8 GPa78.8 GPa
Tension Yield Stress, σt9 MPa355 MPa
Compression Yield Stress, σc100 MPa355 MPa
Table 2. Wind, wave and tide conditions considered for the monopile evaluation.
WINDWAVESTIDES
D L C u ¯   ( m s ) P r o p e r t i e s H s   ( m ) T p   ( s ) P r o p e r t i e s v r e f   ( m s ) T y p e
1.1 11.4 K a i m a l ,   N T M ,   B 10.2 11.0 P M , A i r y 0.12 S u p e r f i c i a l
Table 3. First and second natural bending frequencies for the three developed models.
Soil TypeMode Modal   Frequency   ( H z )
F i x 0 Bending S i d e S i d e 1 st 0.2697
2 nd 1.5415
O C 0 1 st 0.2411
2 nd 1.3070
P t 0 1 st 0.2354
2 nd 1.2539

