Article

STORMTOOLS, Coastal Environmental Risk Index (CERI) Risk and Damage Assessment App

1
Ocean Engineering, University of Rhode Island (RI), Narragansett, RI 02882, USA
2
Environmental Data Center (EDC), University of Rhode Island (RI), Kingston, RI 02881, USA
3
RPS Group, South Kingstown, RI 02880, USA
4
Coastal Institute (CI), University of Rhode Island (RI), Narragansett, RI 02882, USA
5
Rhode Island (RI), Coastal Resources Management Council (CRMC), South Kingstown, RI 02879, USA
*
Author to whom correspondence should be addressed.
J. Mar. Sci. Eng. 2020, 8(2), 129; https://doi.org/10.3390/jmse8020129
Submission received: 17 January 2020 / Revised: 7 February 2020 / Accepted: 13 February 2020 / Published: 17 February 2020
(This article belongs to the Section Coastal Engineering)

Abstract

:
STORMTOOLS Coastal Environmental Risk Index (CERI) predicts the coastal flooding damage to individual structures using coastal flooding levels, including the effects of sea level rise (SLR), provided in terms of the base flood elevation (BFE), specifications of the structure of interest (type and first floor elevation) and the associated damage functions from the U.S. Army Corp of Engineers (USACE), North Atlantic Coast Comprehensive Study (NACCS). CERI has been applied to selected coastal communities in Rhode Island, including those in Narragansett Bay and along the southern Rhode Island shoreline. Users can access the results of CERI via ArcGIS online at the CERI website. The objective of this effort was to develop, test, distribute, and evaluate a mobile phone application (App) that allows the user to assess the risk from coastal flooding and the associated damage at the individual structure level using the CERI methodology. The App is publicly available and has been developed for both iOS and Android operating systems. Environmental data to support the App, in terms of 100 y flood BFE maps, including the effects of SLR and the selected site grade elevation, are provided in the application by the URI Environmental Data Center (EDC). The user enters the location and type of the structure of interest (residential number of stories, with or without basement, pile supported or commercial building and the first-floor elevation (FFE)) and the desired SLR. The App then calculates the percent structural damage based on the specified environmental conditions and structure specifications. The App can be applied to any structure at any coastal location within the state. The CERI App development project has been guided by an Advisory Board made up of key constituents involved in coastal management and development in the state. The effort included extensive testing of the App by various user groups. The App structure makes it simple and straightforward to transfer to coastal and inland flooded areas in other locations, requiring only the specification of BFEs and grade elevations.

Graphical Abstract

1. Background

The vision for STORMTOOLS is to provide web service access to a suite of coastal planning tools (numerical models, etc.) that allows wide-spread accessibly and applicability at a high resolution for user-selected coastal areas of interest [1]. The first tool developed under this framework was a simplified flood inundation model, with and without sea level rise, for varying storm return periods. The methodology was based on using the water level vs. return periods at a primary National Oceanic and Atmospheric Administration, National Ocean Survey (NOAA NOS) water level gauging station and then spatially scaling these values to generate a flooding map. The spatial scaling was performed based on predictions by the U.S. Army Corp of Engineers (USACE) numerical hydrodynamic/wave model (ADCIRC/WAM/STWAVE) predictions, performed as part of the North Atlantic Coast Comprehensive Study (NACCS) [2,3] at selected save points for 1050 synthetic tropical and 100 historical extratropical storms, to estimate inundation levels for varying return periods for coastal waters.
The mapping methodology follows the NOAA sea level rise protocol (https://coast.noaa.gov/digitalcoast/tools/slr.html, accessed on 11 December 2019) and is applicable to any coastal region. Predictions are provided once in 25, 50, and 100 y return periods at the upper 95% confidence level, with SLR values of 1, 2, 3, 5, 7, 10, and 12 ft [1]. Simulations were also performed for historical hurricane events, including: 1938, Carol (1954), Bob (1991), and Sandy (2012), and nuisance flooding events with return periods of 1, 3, 5, and 10 y. The simulations for historical events were validated with available data throughout the state. To help reach the widest possible audience and keep access and use as simple as possible, the maps are web accessible via ArcGIS (http://www.beachsamp.org/resources/stormtools/, accessed on 9 December 2019). 
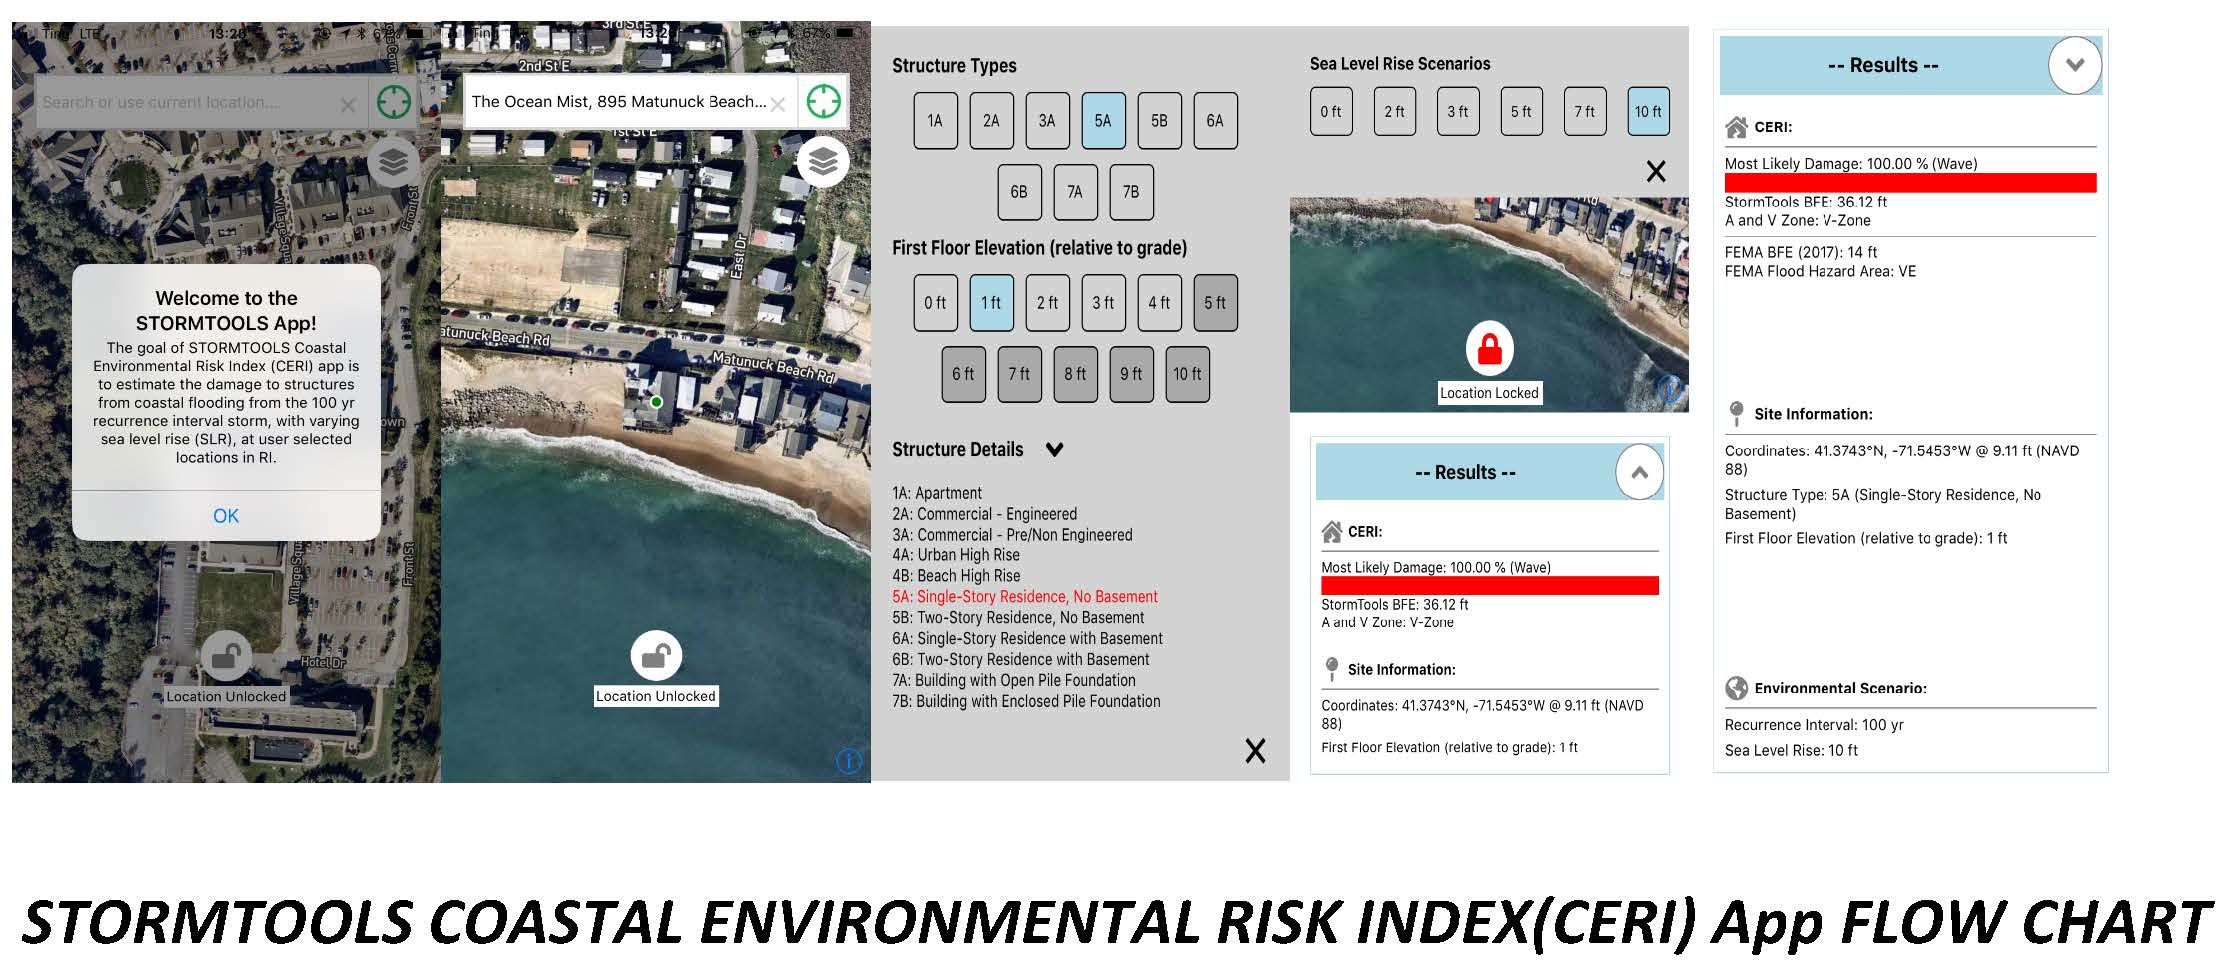
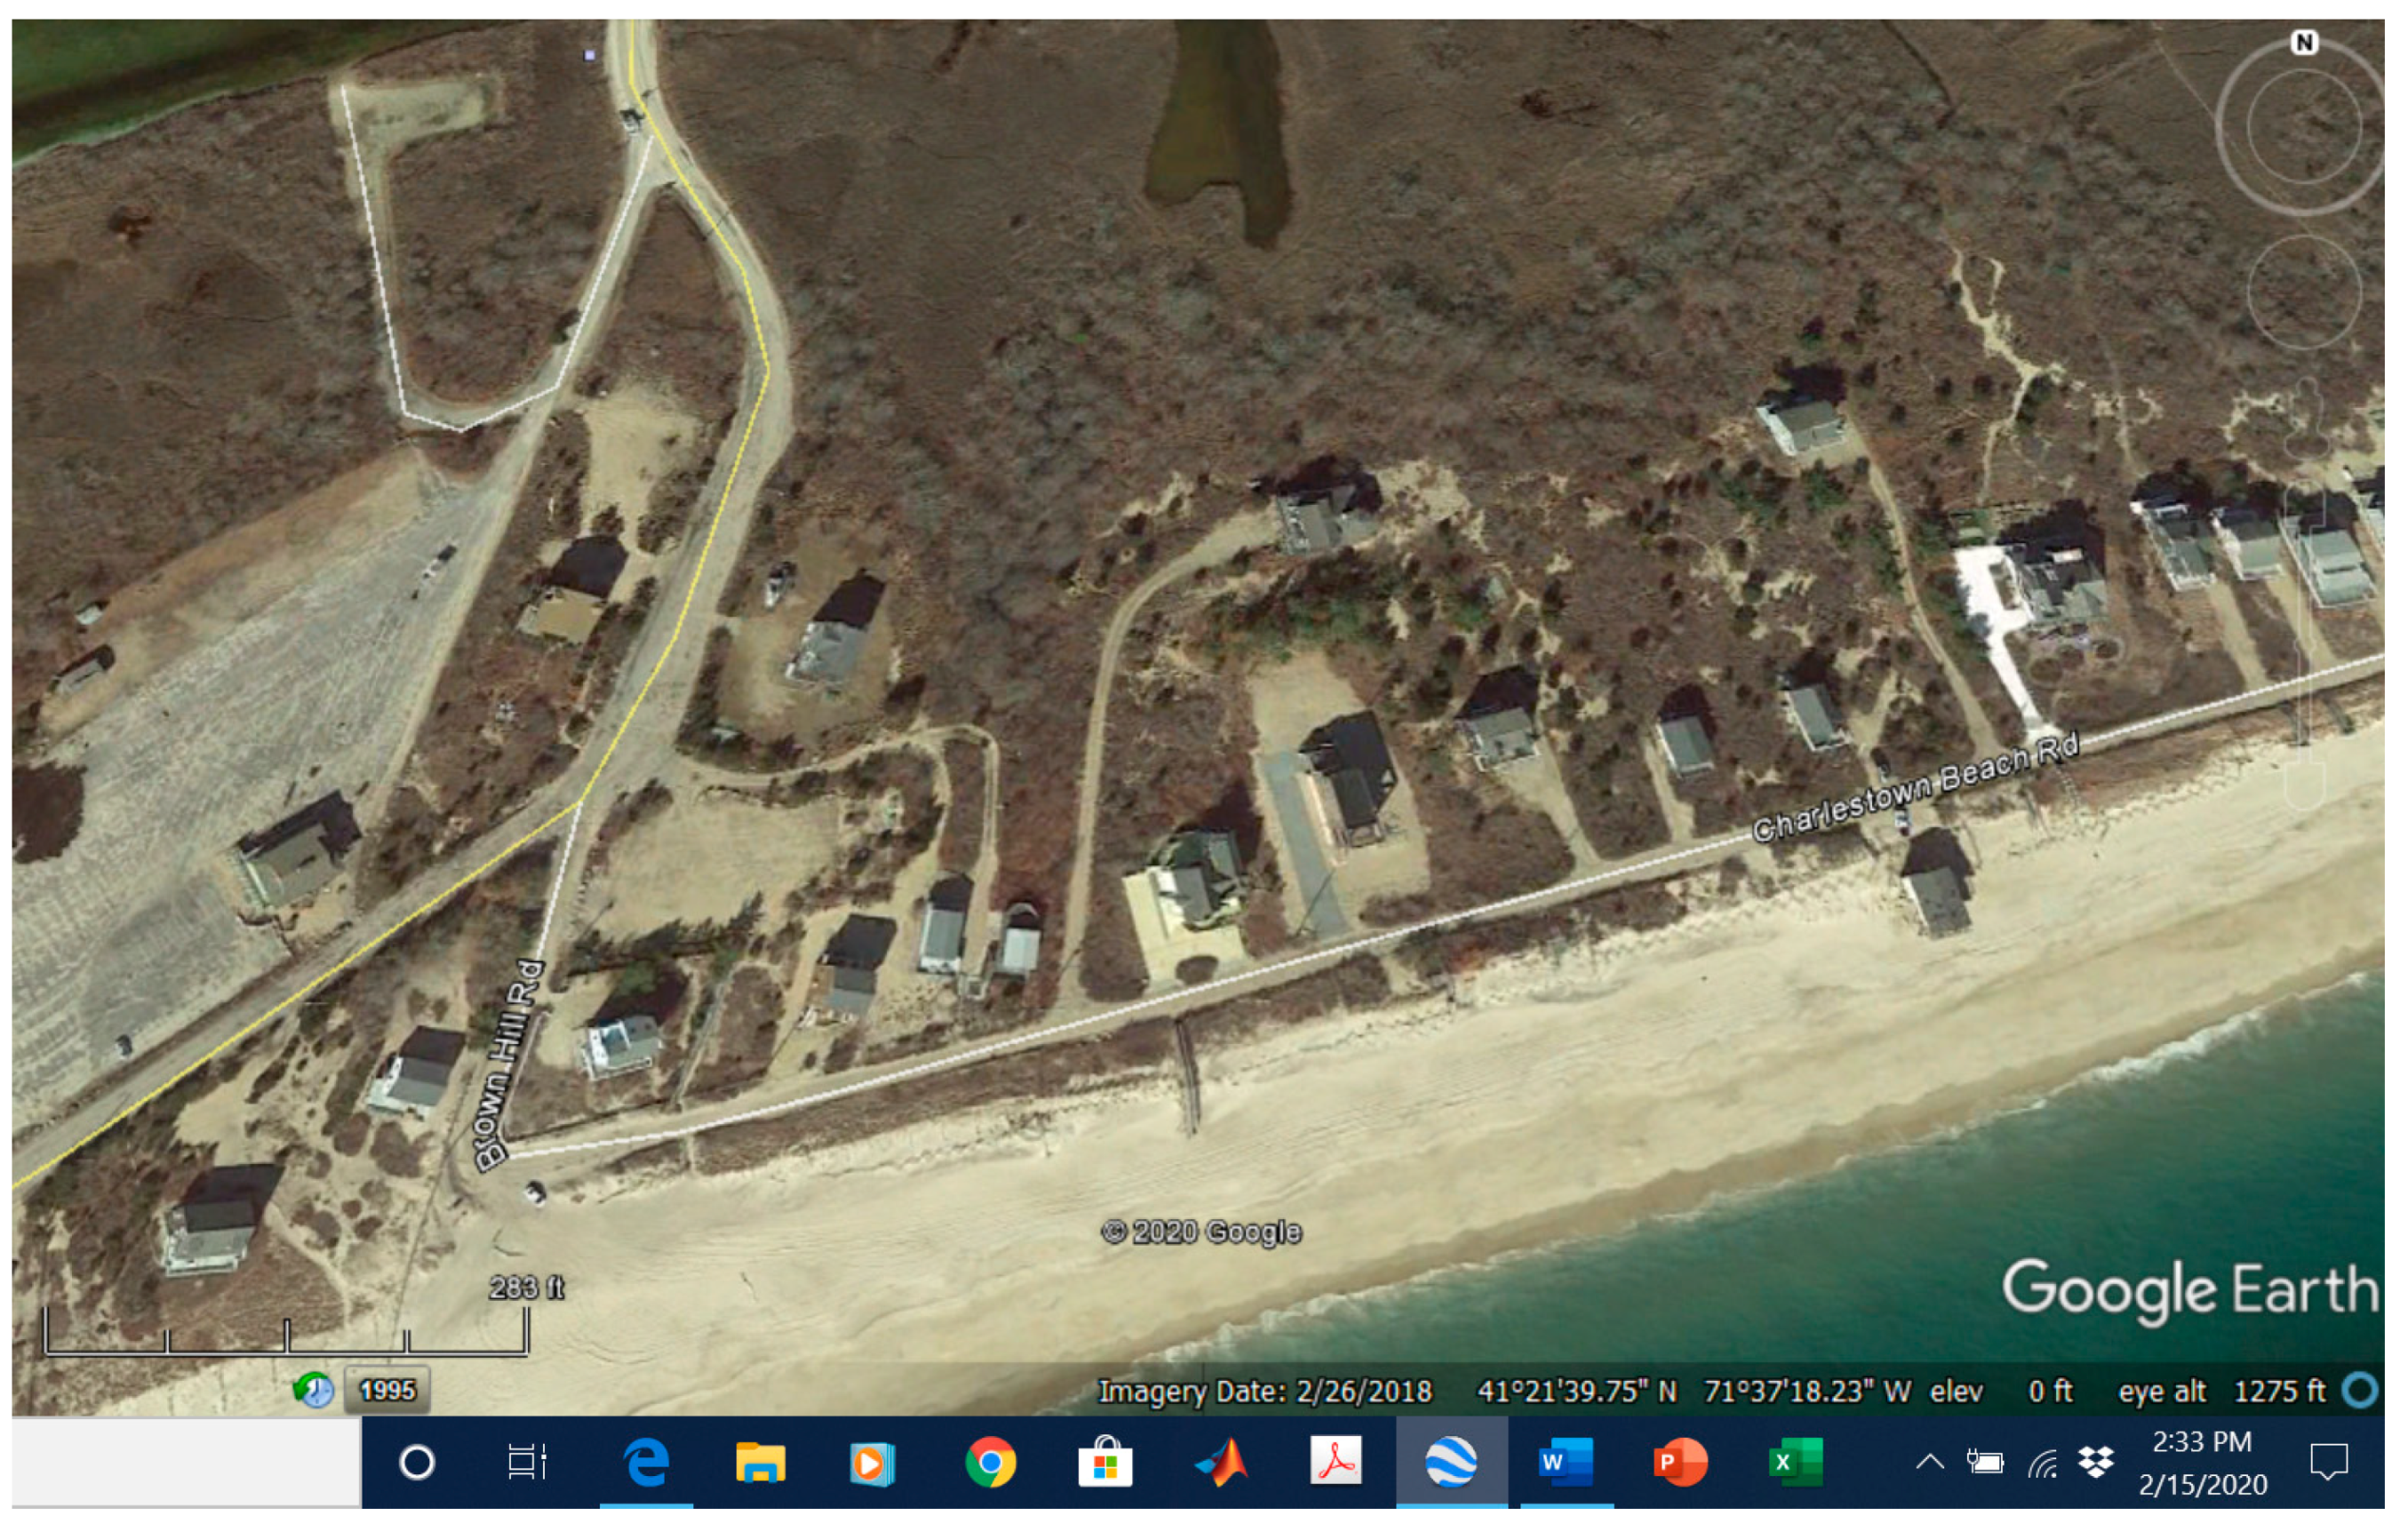
Figure 1 shows an example map for 100 y flooding, no sea level rise (SLR) for Charlestown, RI. The site is located along the wave-exposed, southern RI coastline to highlight the wave conditions. The depths of inundation can also be accessed at user-selected points. The maps cover the entire state at 1 m horizontal resolution (15 cm vertical, root mean square error (RMSE)), and hence provide very high spatial resolution maps of coastal flooding. The digital elevation model (DEM) used in the mapping is based on 2011 Laser Imaging, Detection, and Ranging (LIDAR) data and available from Rhode Island Geographic Information System (RI GIS) (http://www.rigis.org/pages/2011-statewide-lidar, accessed on 11 December 2019).
The STORMTOOLS maps have been available for approximately three years and numerous public outreach programs and activities (e.g., training sessions, workshops, presentations at local libraries, and webinars as part of NOAA Office of Coastal Management (OCM) program) have been undertaken to introduce the maps to municipal and state planners, engineers, architects, and the general public. Online tutorials have been prepared for the general public (STORMTOOLS for Beginners) and for municipal planners (STORMTOOLS for Municipalities/Advanced). Map Journals have also been prepared. All maps are available on the RI Shoreline Change Special Area Management Plan (Beach SAMP) web site (http://www.crmc.ri.gov/samp_beach.html, accessed on 20 December 2019). In addition, base flood elevation (BFE) maps including both surge and waves (called STORMTOOLS Design Elevation (SDE) maps) for various sea level rise (SLR) values (0 to 10 ft) have been developed to support the design of coastal structures [4] (http://www.beachsamp.org/stormtools-design-elevation-sde-maps/, accessed on 11 December 2019). In 2016, the RI Coastal Resources Management Council (CRMC) formally adopted STORMTOOLS as part of their coastal program and recommended the use of the tool to aid in designing coastal projects or assessing the vulnerability of existing public and private assets. These maps are an integral building block in the CRMC risk-based permitting system that resulted from adoption of the Beach SAMP in July 2018 (http://www.crmc.ri.gov/samp_beach/SAMP_Beach.pdf, accessed 3 December 2019). The CRMC has recently integrated the STORMTOOLS Design Elevation Maps into their online Coastal Hazard Application process, which is a coastal hazard, risk-based permitting tool (http://www.crmc.ri.gov/coastalhazardapp.html, accessed 3 December 2019). Given its maturity and widespread use in the state STORMTOOLS is currently being migrated to the ESRI Hub format (https://www.esri.com/en-us/arcgis/products/arcgis-hub/overview, accessed on 6 February 2020).
One of the other challenges facing municipal and state planning and state management agencies is the development of an objective, quantitative assessment of the risk to both structures and public infrastructure that coastal communities face from storm surges in the presence of changing climatic conditions, particularly sea level rise. Ideally, the assessment tool or index would also allow planners and managers to evaluate a variety of regulatory and nature- and engineered-based options to mitigate the risk. A Coastal Environmental Risk Index (CERI), under the STORMTOOLS umbrella, Ref. [5] was constructed using surge and wave maps and shoreline projections as building blocks and integrating recent advances in assessing damage from storm events by the USACE, NACCS study based on data from superstorm Sandy [2,3]. 
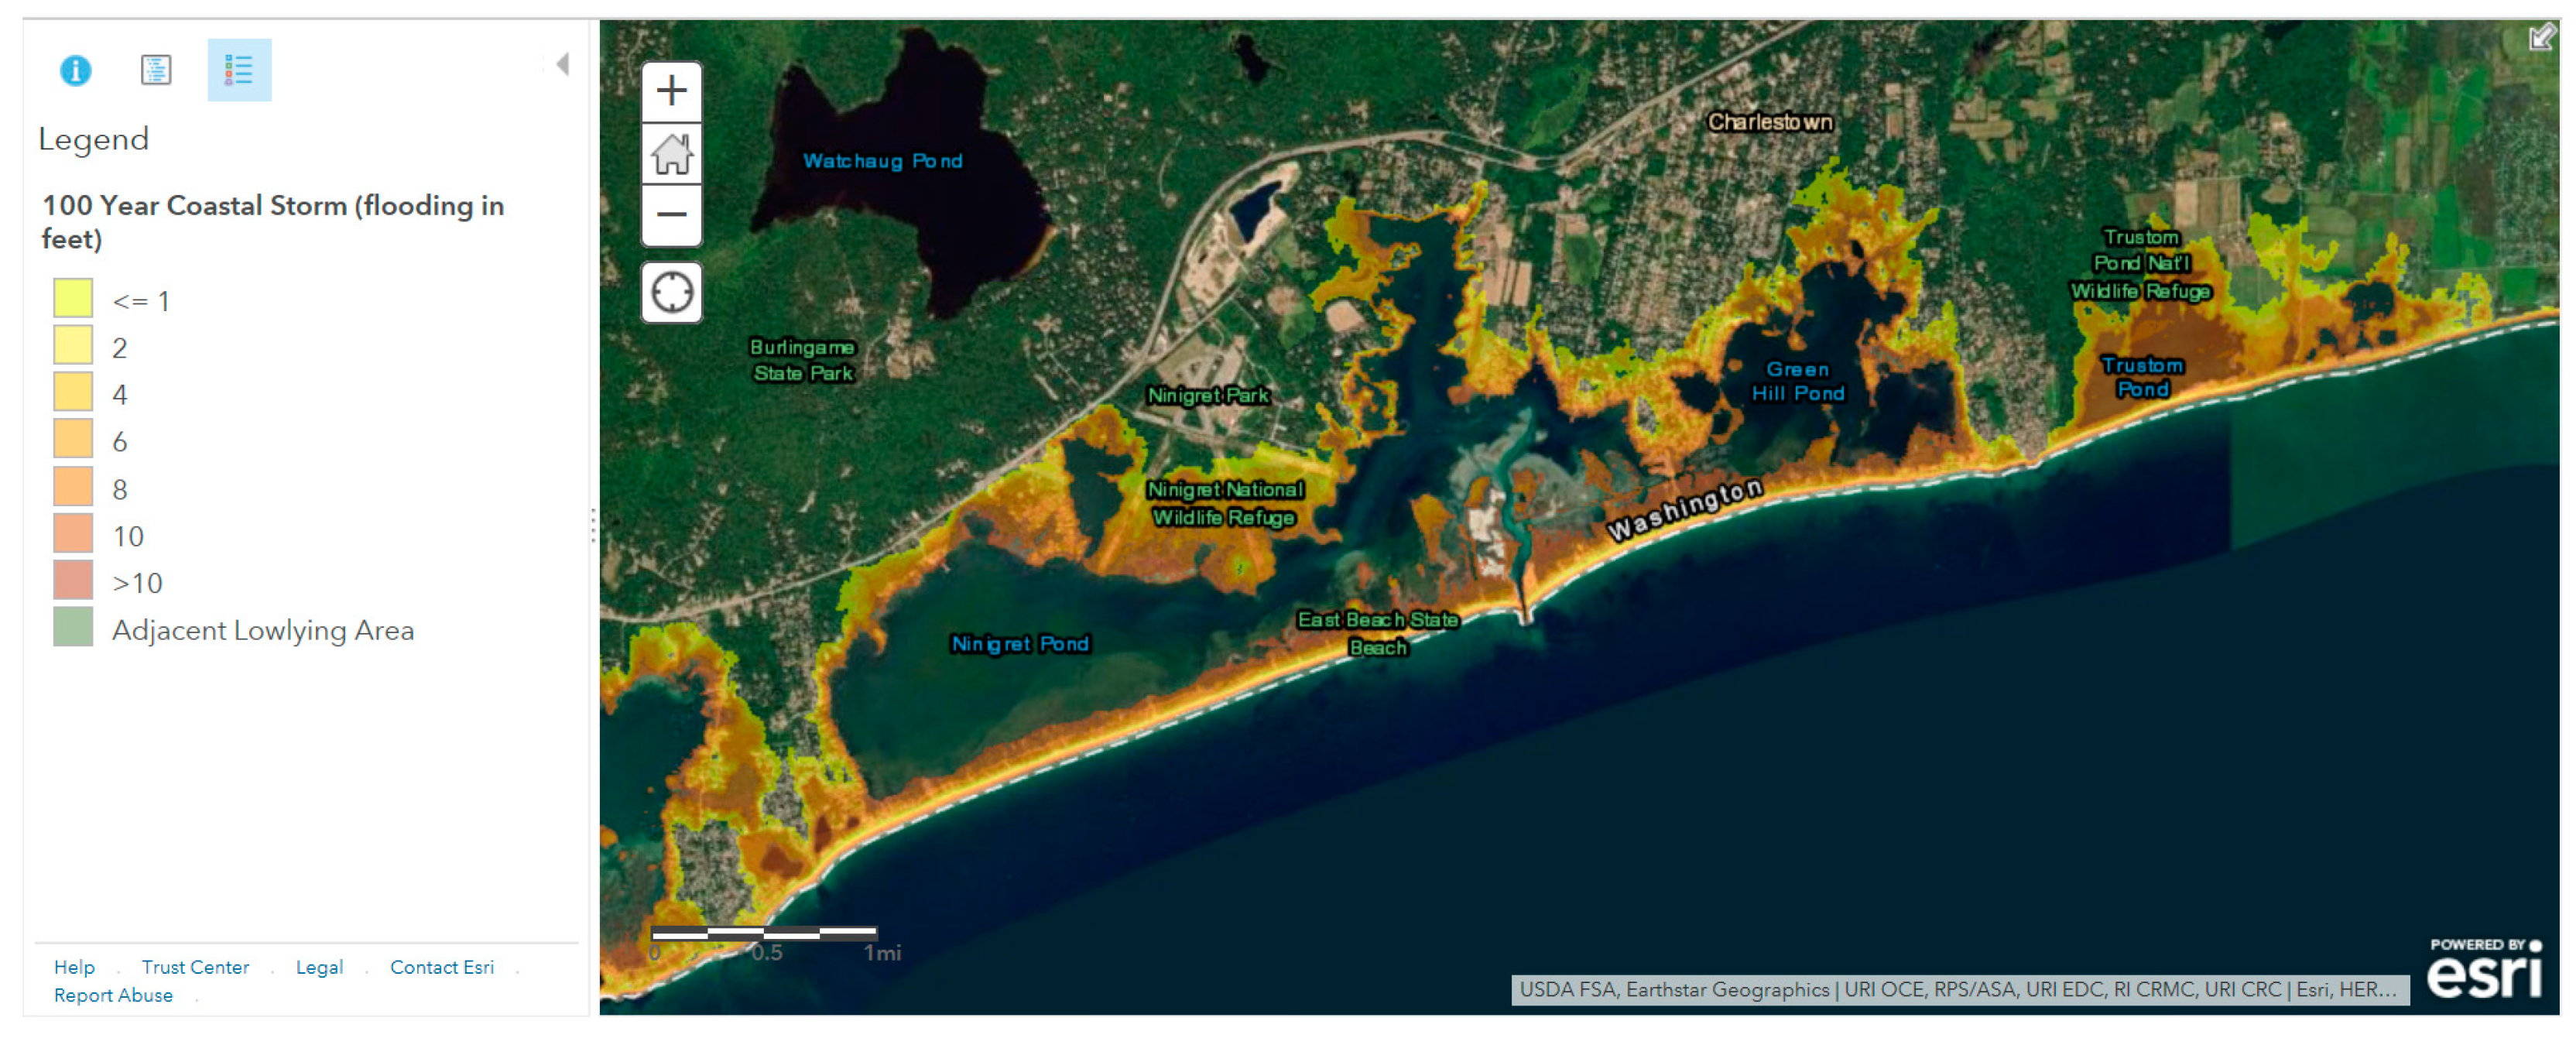
Figure 2 shows the flow chart for CERI. Model output can be displayed via GIS, two/three dimensional visualizations, or in the form of probability and cumulative probability distributions.
The goal of the CERI effort is to develop and apply the index to assess the risk that structures and infrastructure face from storm surges, including flooding and the associated wave environment, in the presence of sea level rise, and shoreline erosion/accretion. To allow quantification of the risk, CERI uses percent damage for structures and infrastructure associated with storm flooding. It estimates damages from inundation, waves, and erosion, and then all damages combined. Access to the electronic state emergency database (E-911) and property databases from the municipalities allows the analysis to be performed for individual structures. As an alternative, the user can provide specifications of the structures based on personal knowledge or data from a municipality’s building records or parcel data. CERI has been designed as an on-line ArcGIS-based tool, and hence is fully compatible with STORMTOOL’s flooding and SDE maps. FEMA’s Flood Insurance Rate Maps (FIRMs) can also be used as an alternative to STORMTOOL maps to specify the surge and wave conditions necessary as an input to CERI. These maps are normally provided in the form of BFE maps. However, the FEMA FIRMs have some well documented problems [6,7] for coastal and protected waters in RI [8,9], and in addition do not include the effects of SLR. Damages can be calculated by CERI for low, most likely, and maximum levels for both structure and content, based on the NACCS damage assessment curves [10]. Estimates of the cost of the damage can readily be determined given information on the assessed value of each structure. The basic framework and associated GIS methods used in developing CERI can readily be applied to any coastal (or even inland) flood-impacted area.
CERI has been applied to Charlestown and Warwick, RI, with federal funding provided through the Community Development Block Grant (CDBG) Program–Disaster Recovery Hurricane Sandy (HUD) and administered by Rhode Island Office of Housing and Community Development [5]. Charlestown represents a coastal community along the exposed southern RI shoreline [8], while Warwick is inside the more protected Narragansett Bay [9]. Application of CERI to Barrington, Bristol, and Warren, RI, inside Narragansett Bay (a low-lying area, with very high housing density), was recently completed and again funded by HUD-CDBG [11]. Funding for CERIs’ application to other communities along the southern RI coastline was received from the NOAA Office of Coastal Management (OCM), Program of Special Merit (PSM) (NOAA-OCM-PSM) and completed earlier this year [12]. Flooding and wave maps, including the effects of SLR, have been completed and were available to specify the BFEs (SDE maps). A significant advancement in the development of these new maps for southern RI coast has been the implementation of the XBeach geomorphological model to predict the evolution of the shoreline for varying sea level rise values. Schambach et al. (2017) [13] provide details on the model application and validation for Charlestown Beach, located along the southern RI shoreline.
Senior students in the Ocean Engineering program at University of RI (URI) have applied CERI to Matunuck Beach, RI in 2015–2016 [14], to Misquamicut Beach, RI in 2016–2017 [15] to Providence and the Fox Point Hurricane barrier in 2017–2018 [16] and to the Narragansett Bay Commission (NBC) Wastewater Treatment Facility (WWTF), and adjacent above-ground storage tanks (AST) located on Fields Point in 2018–2019 [17]. The development of CERI and its application to coastal communities have been published in the peer-reviewed literature [4,5,8,9,11,18,19] and presented at a number of national conferences (e.g., ASCE Solutions to Coastal Disasters, Estuarine and Coastal Modeling, Coastal Geotools, Northeast Arc User Group Conference). One of the side benefits of CERI is that the data necessary to input to the method and generated as part of its application can be used to provide state-of-the-art flooding maps, equivalent to those developed by FEMA Flood Insurance Rate Maps (FIRMS), but explicitly including the effects of sea level rise (SLR).
To illustrate CERI’s application, Charlestown, RI is presented below as a case example. 
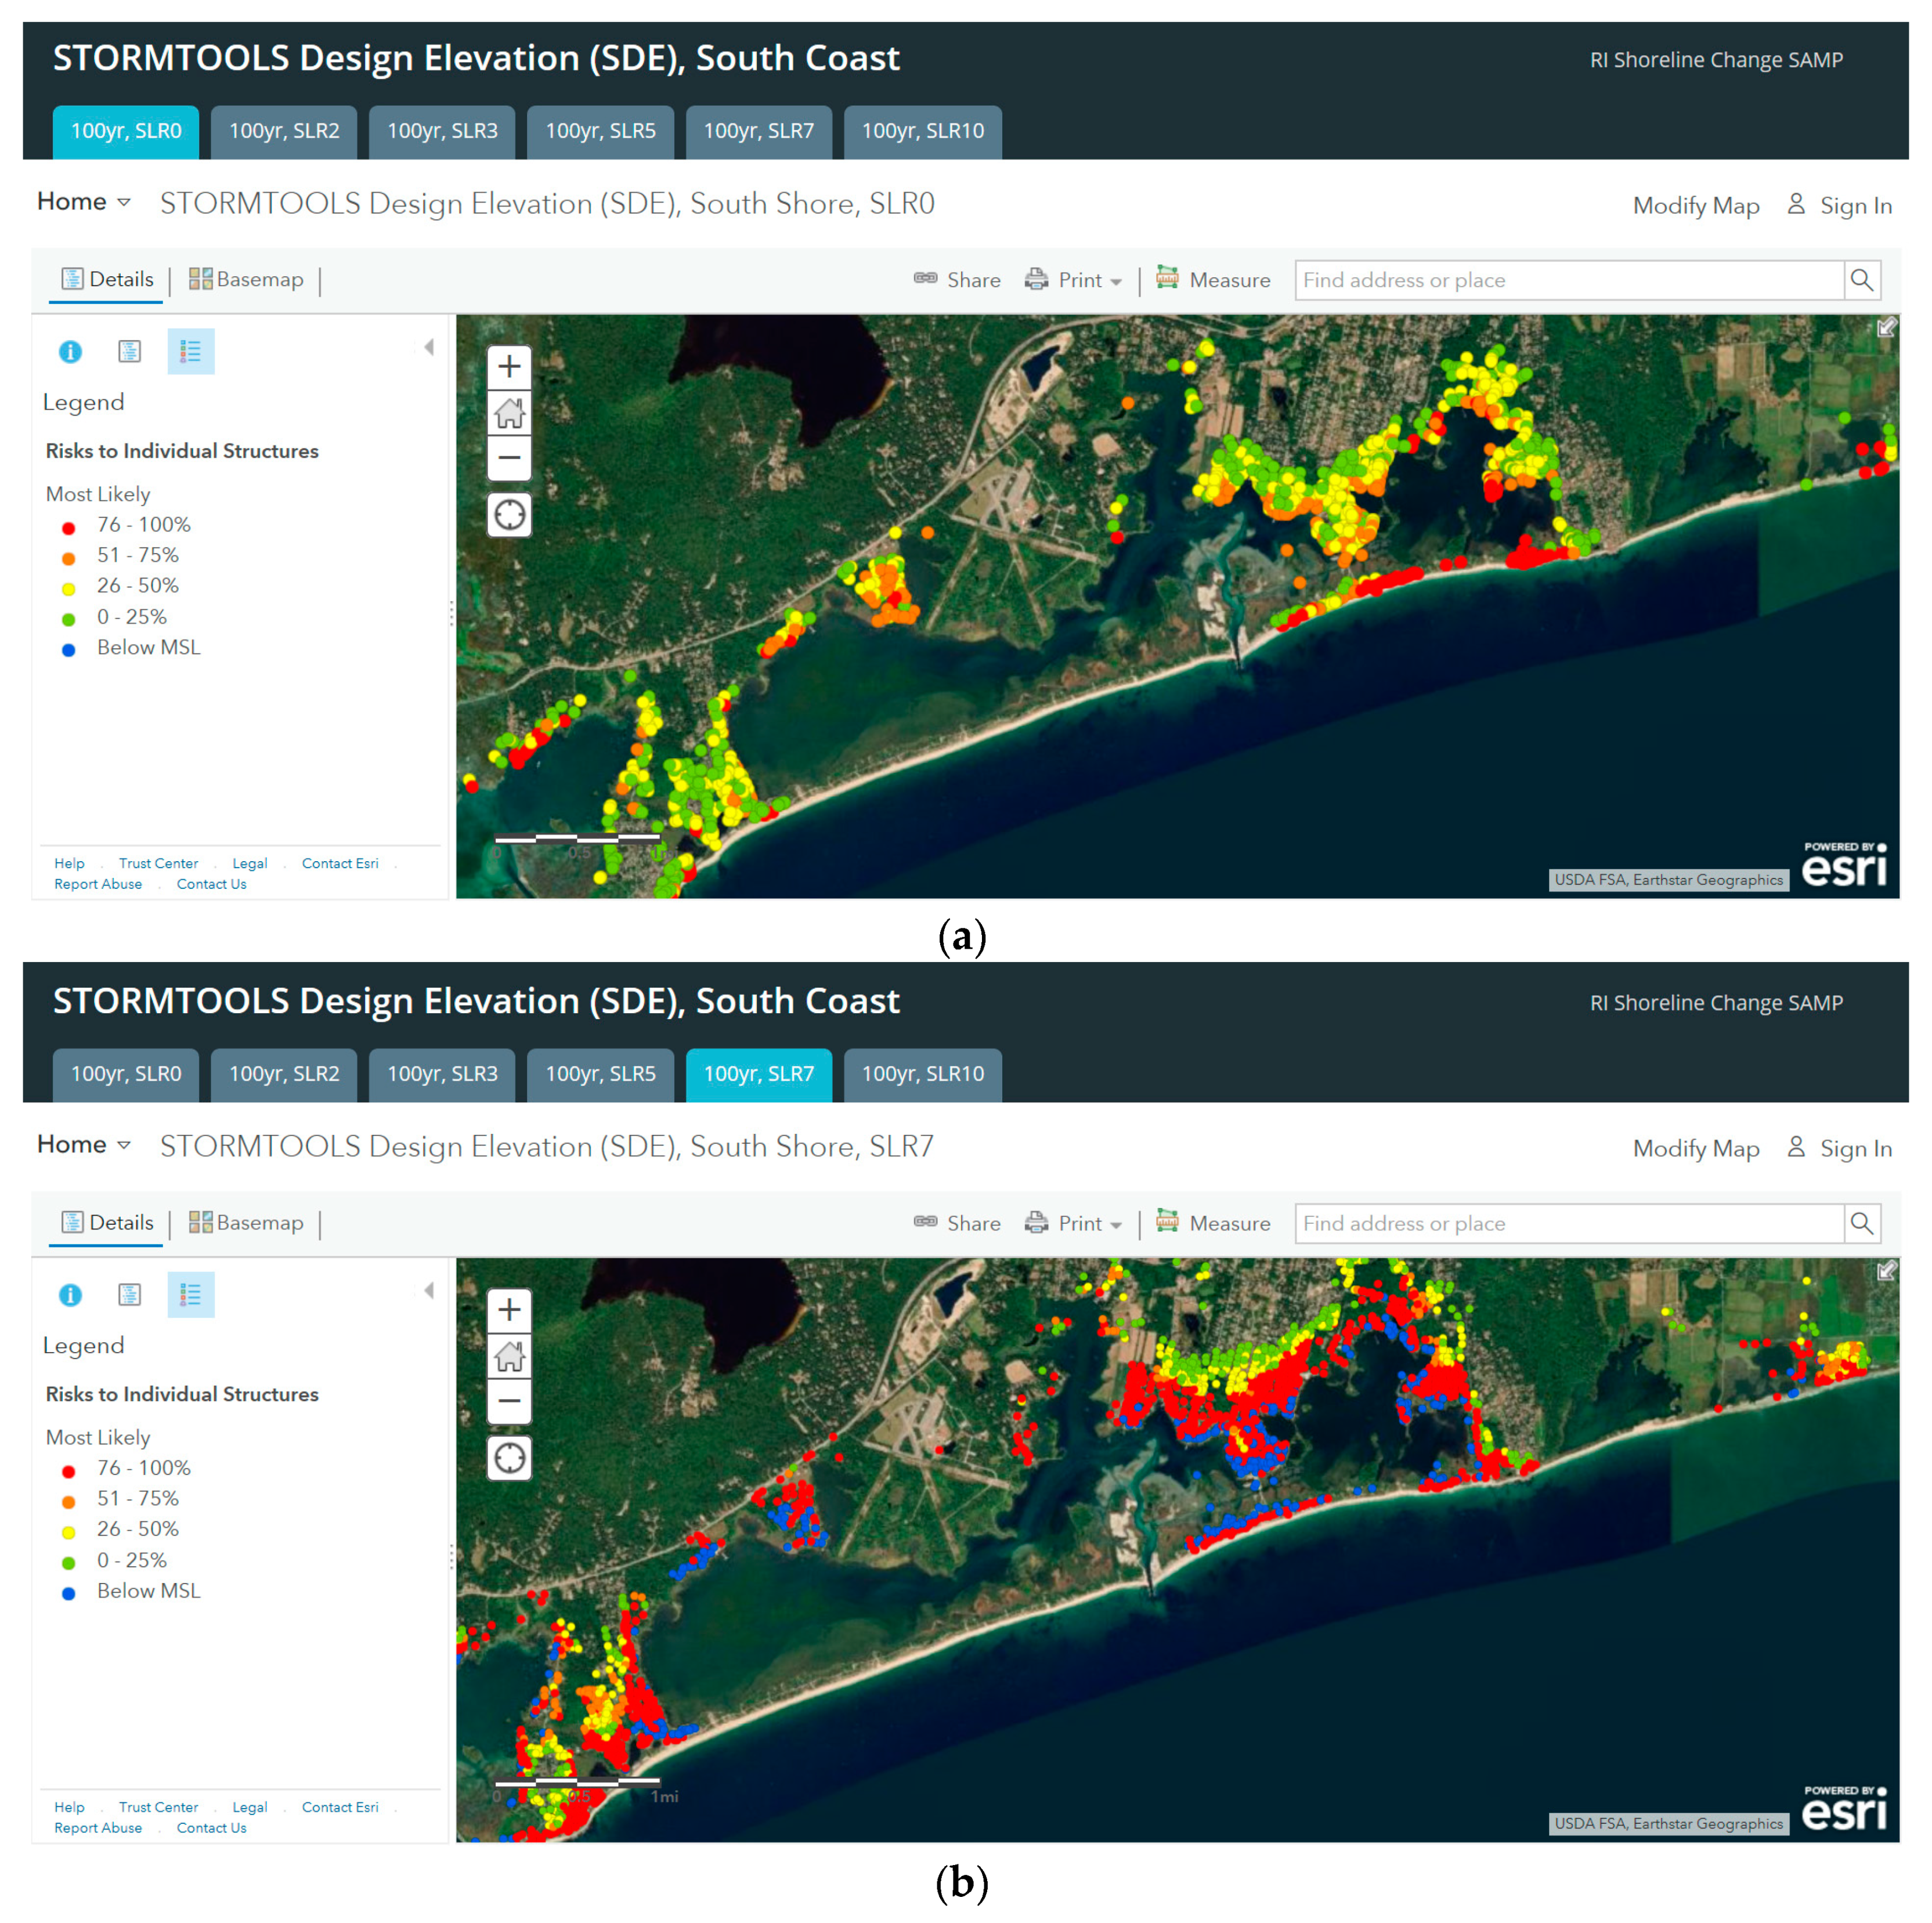
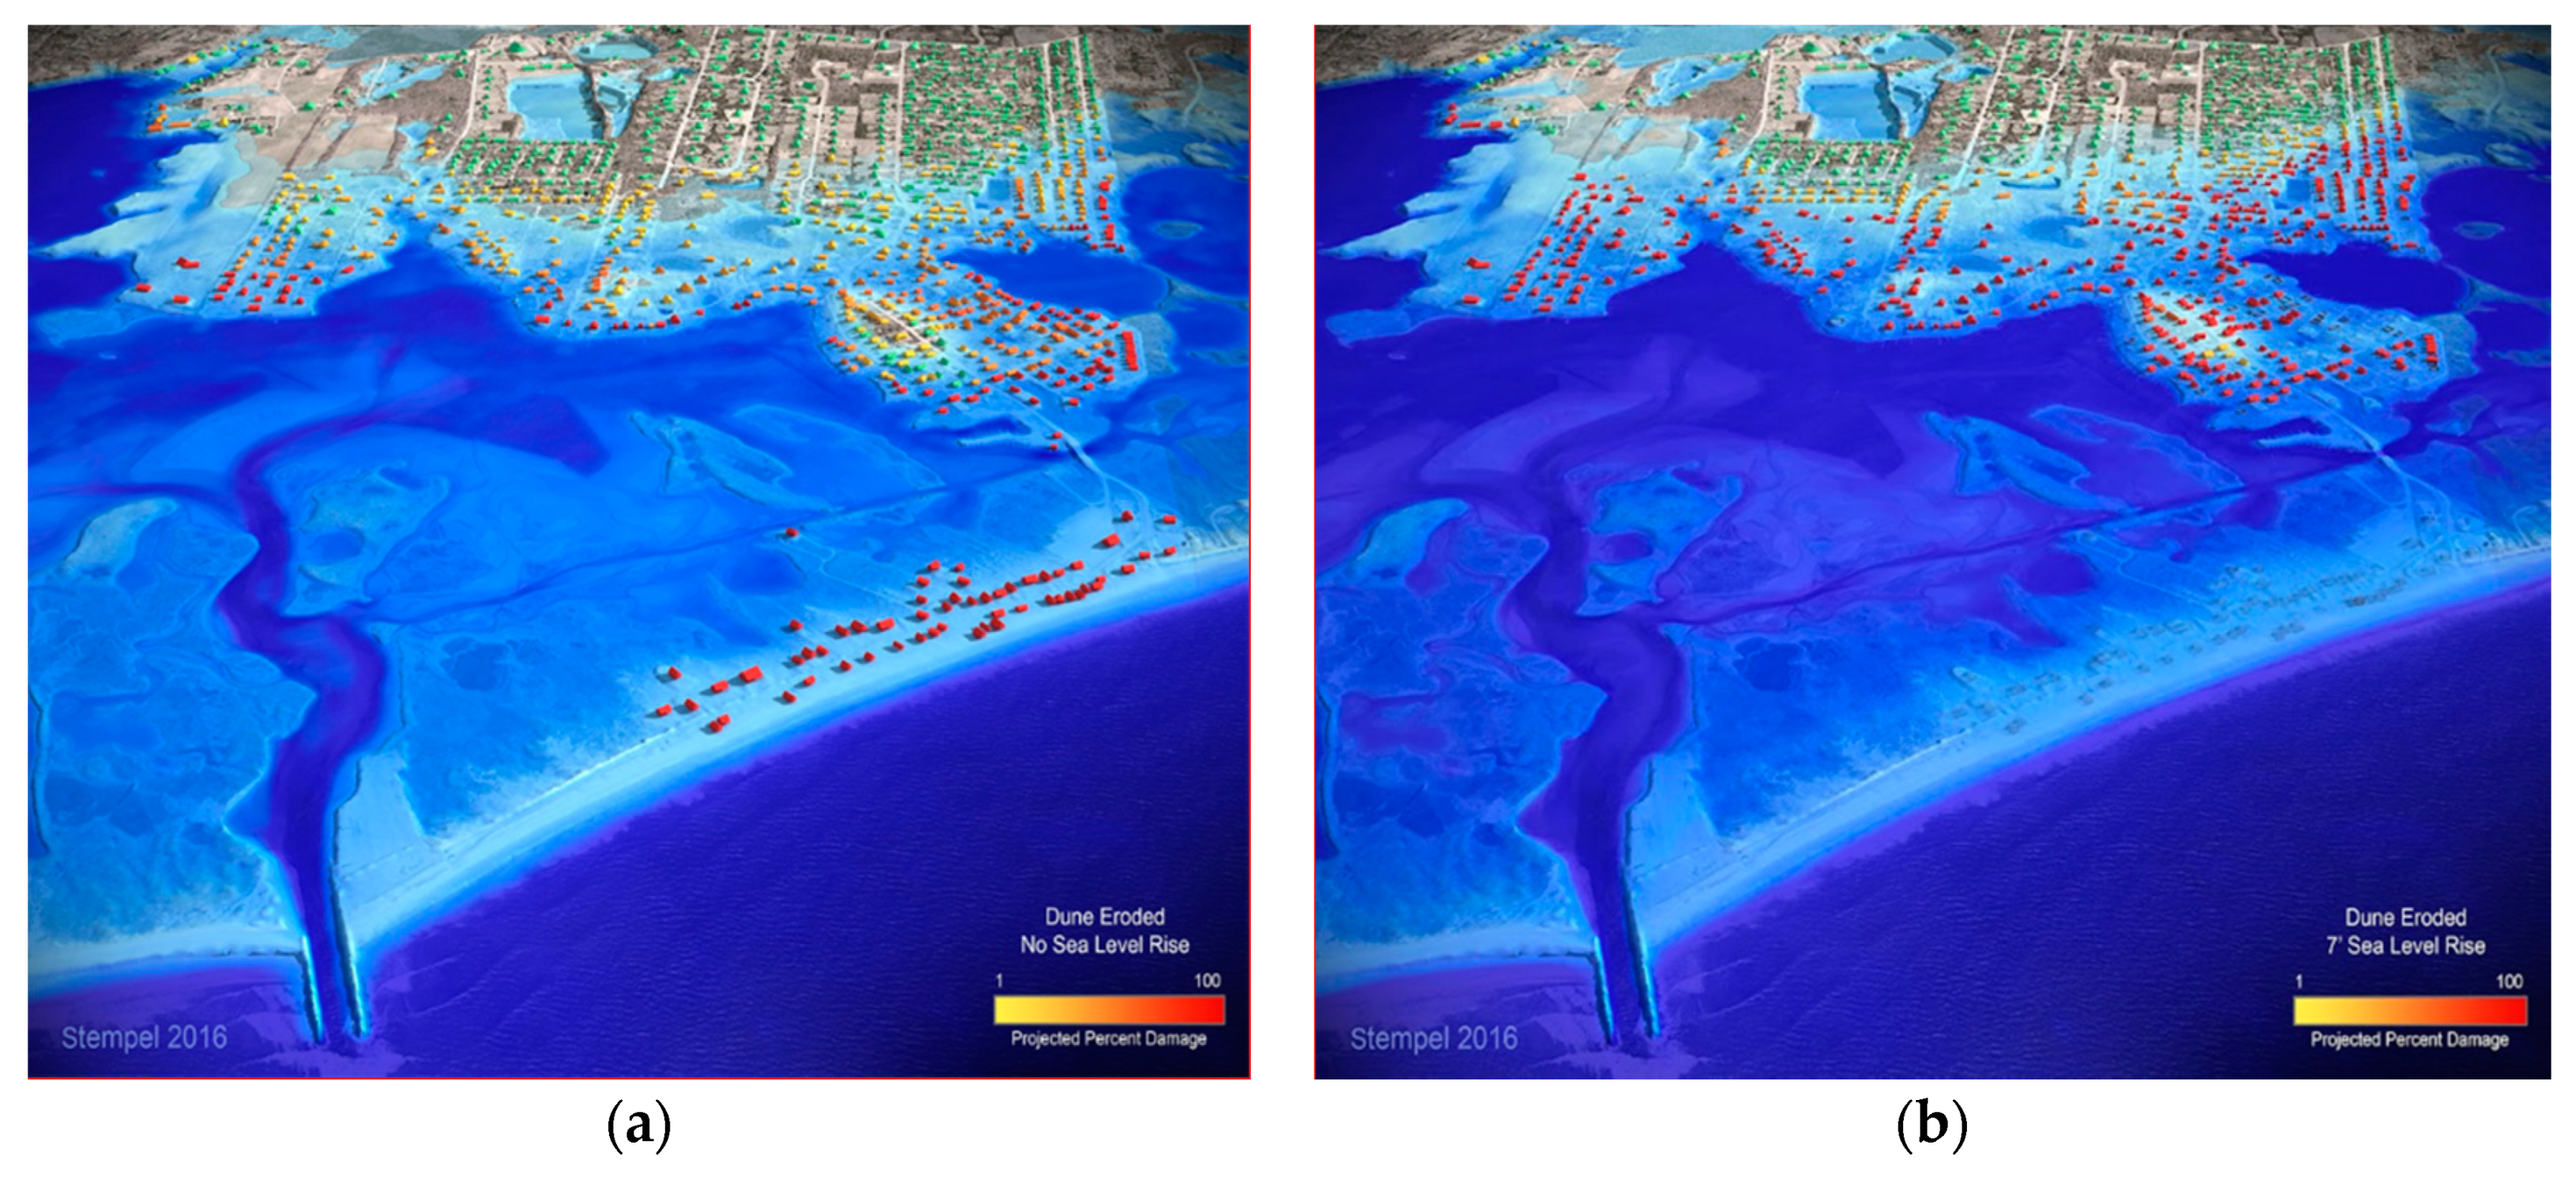
Figure 3 shows the predicted damage (percent) for each structure in the study area for the 100 y no SLR scenario (left panel) and 100 y plus 7 ft of SLR scenario (the 2018 NOAA High SLR adopted by RI CRMC for planning at the time of the study, right panel). The figure clearly shows the impact of storm damage in the near coastal margin. The impact of SLR is to substantially increase damage, place some structures below Mean Sea Level (MSL) and result in others being lost due to coastal erosion (all shown in the figure). Three-dimensional visualizations of the same two conditions, focusing on the coastal inlet to Ninigret Pond and nearby area, are shown in Figure 4. In all cases, the dunes are assumed to be eroded, consistent with historical data and projected dune adjustments to SLR [5].
CERI has the inherent ability to address structure by structure differences as impacted by coastal flooding. To illustrate this point, Figure 5 shows the damage for two houses that are side by side in a flooded area, adjacent to Matunuck Beach, South Kingstown, RI. They are in an area with significant waves. The red line represents the water level from the 100 y storm. The elevated house (on pile foundation, left side of the photo on the right panel) receives no damage while the house with a basement (right side of photo) experiences a damage of 86%.
CERI’s capability has recently been extended to include storm wind damage. The method follows the FEMA HAZUS (2018) [20] protocol. Once the structure of interest is selected, the following steps are performed: determine structure type (roof shape, number of stories, etc.), determine the roughness from land cover in the surrounding area, select the 100 y wind gust speed, estimate the damage state, and calculate the damage. All data necessary as inputs are readily available. The wind damage estimator is still under development and testing, and not yet available to the public [15].
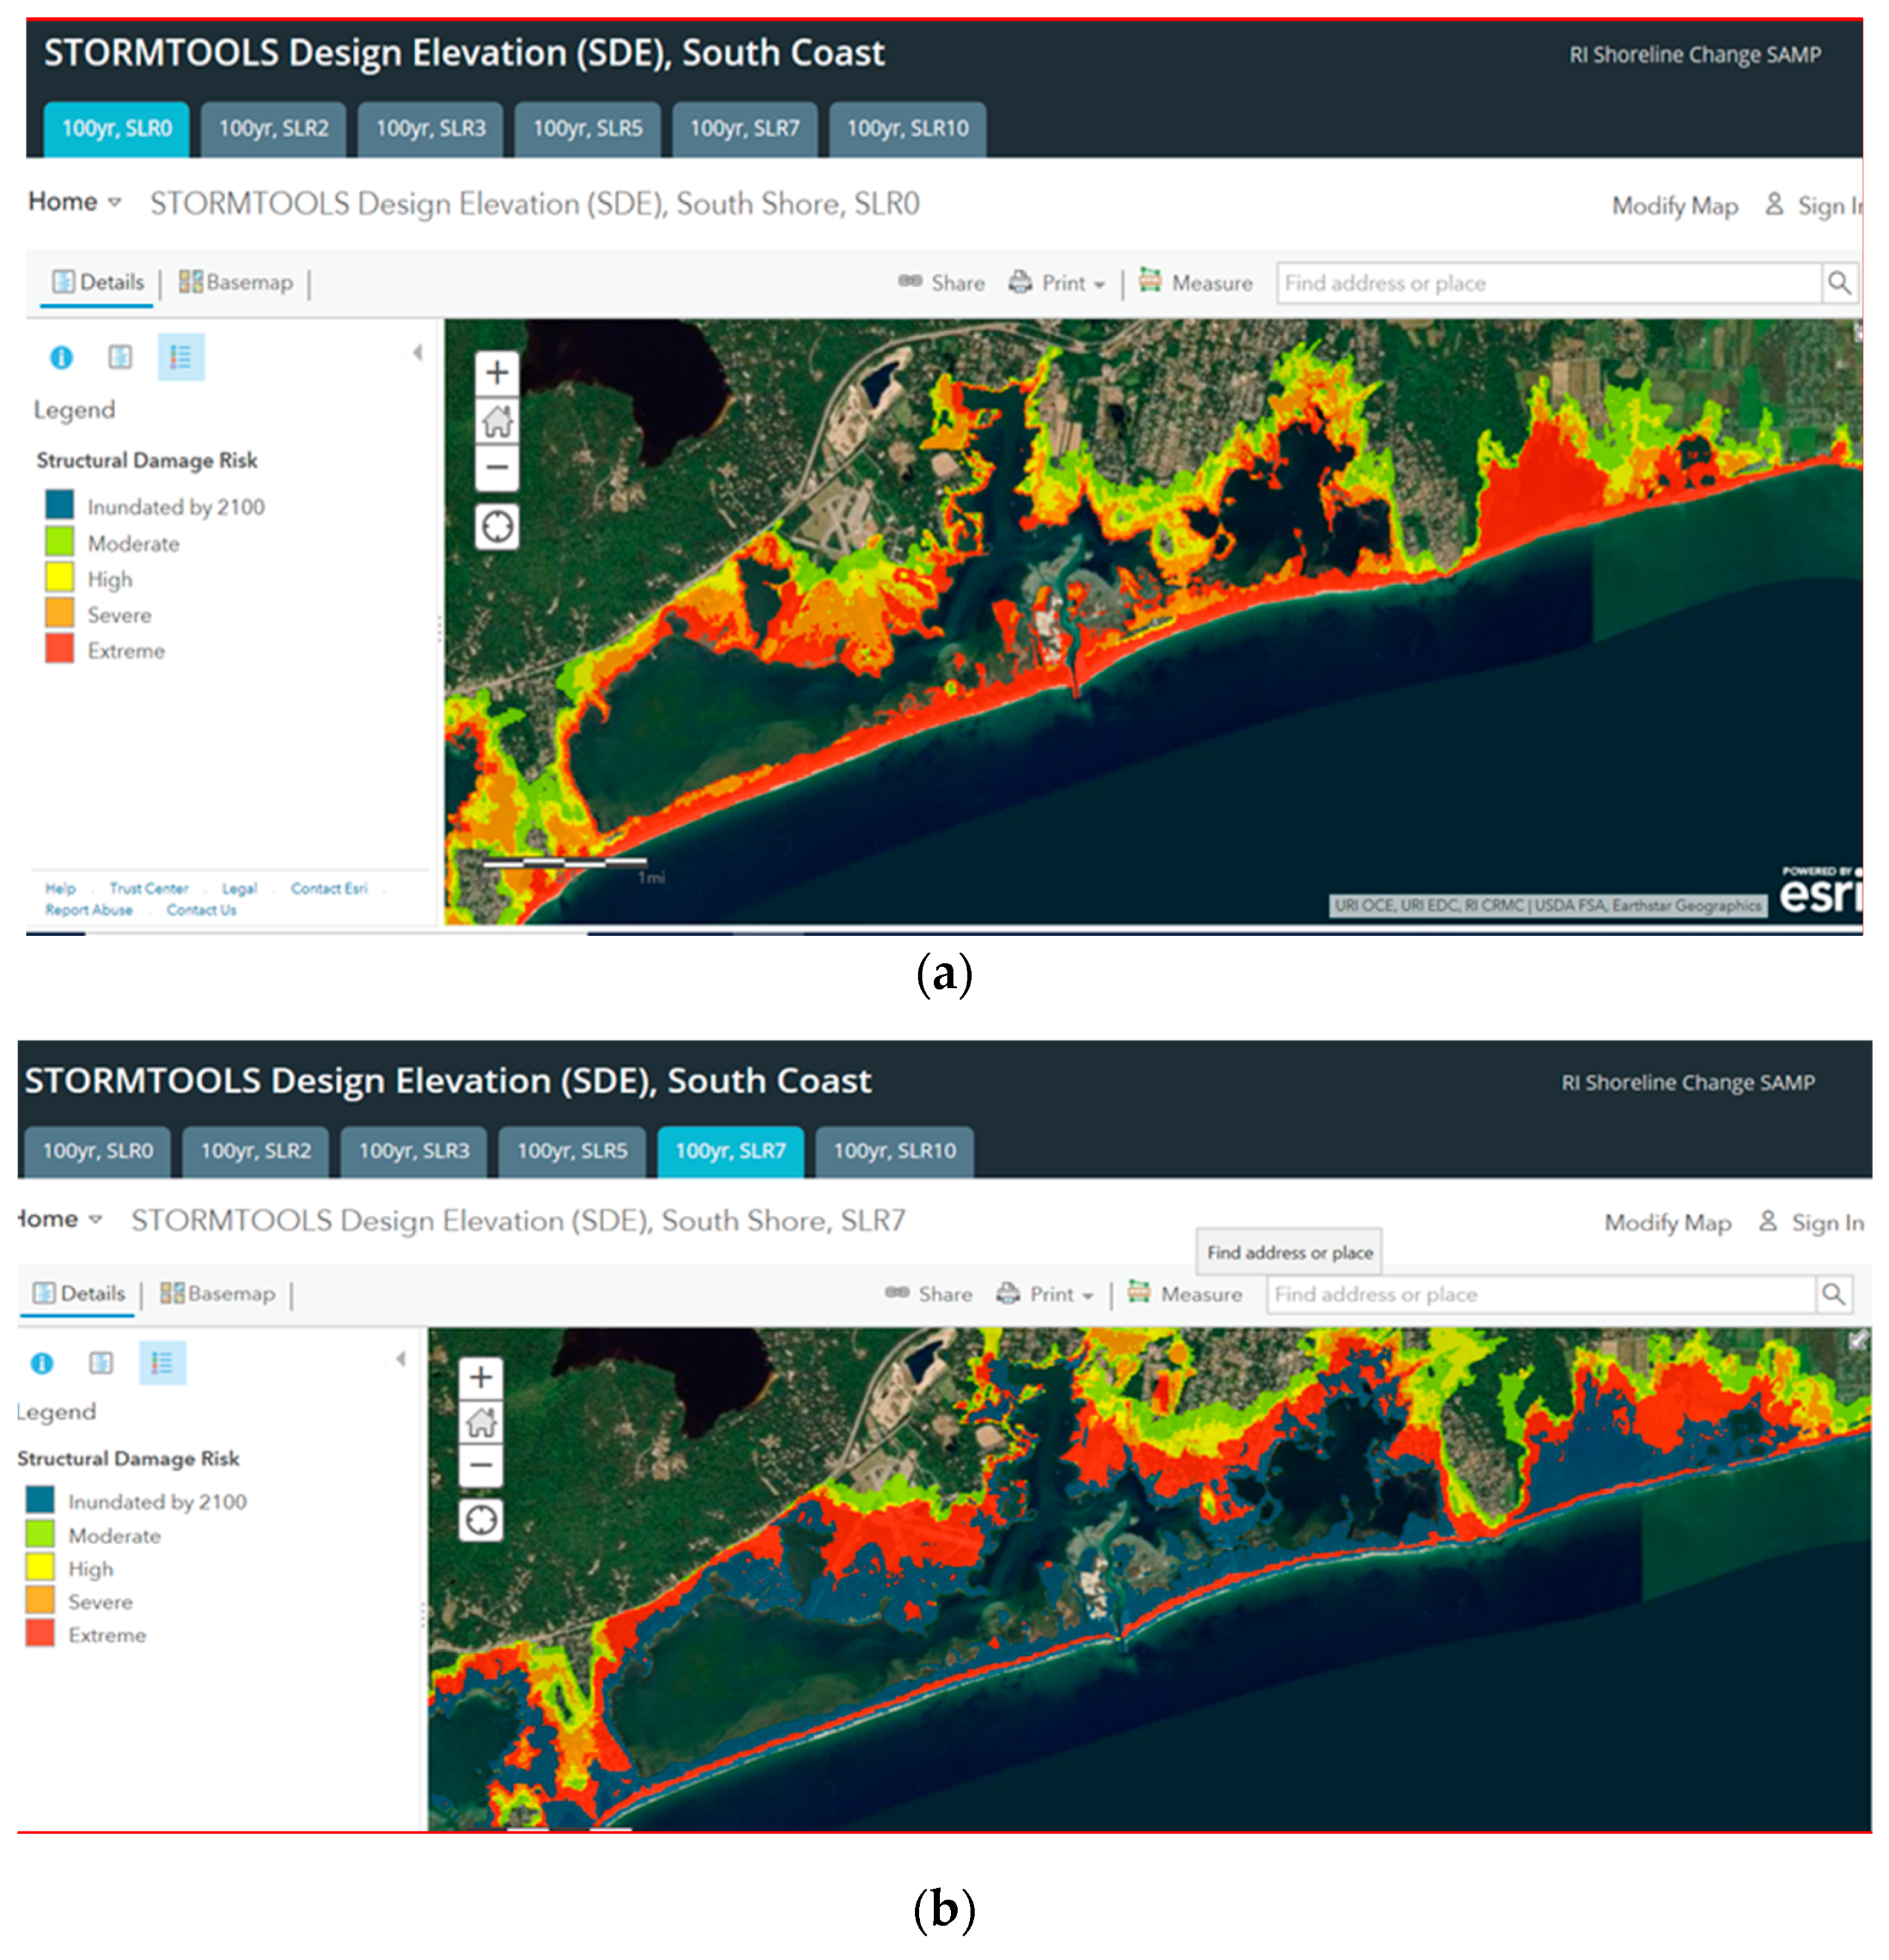
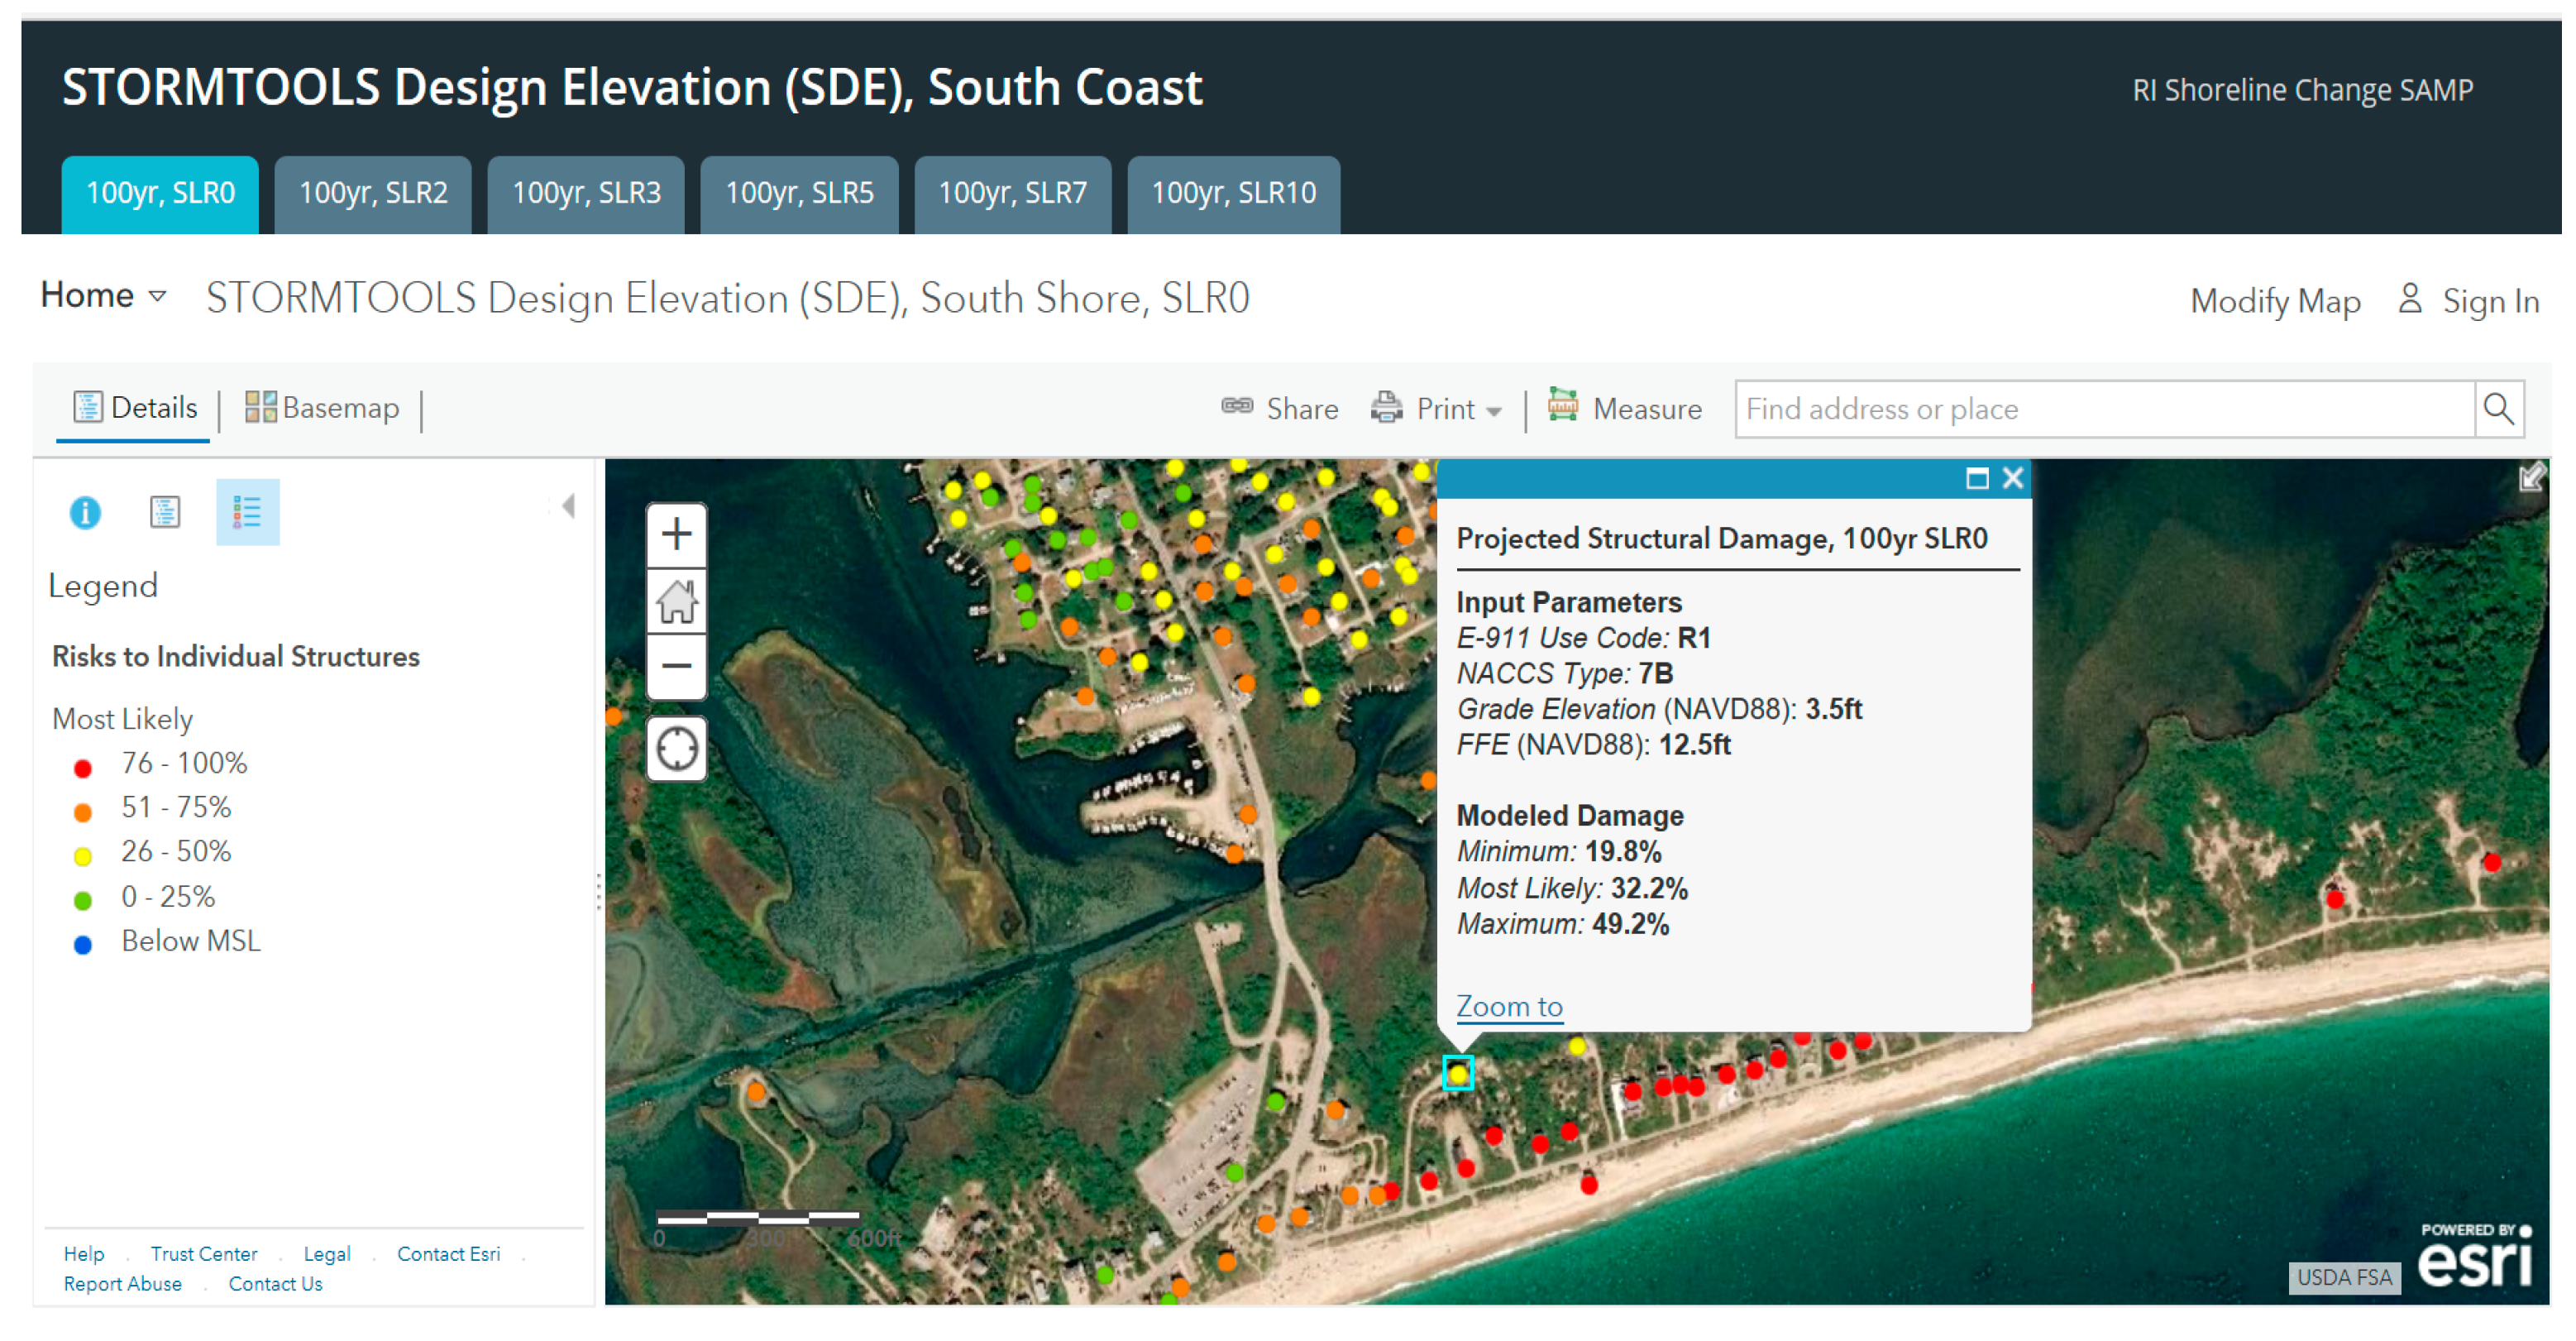
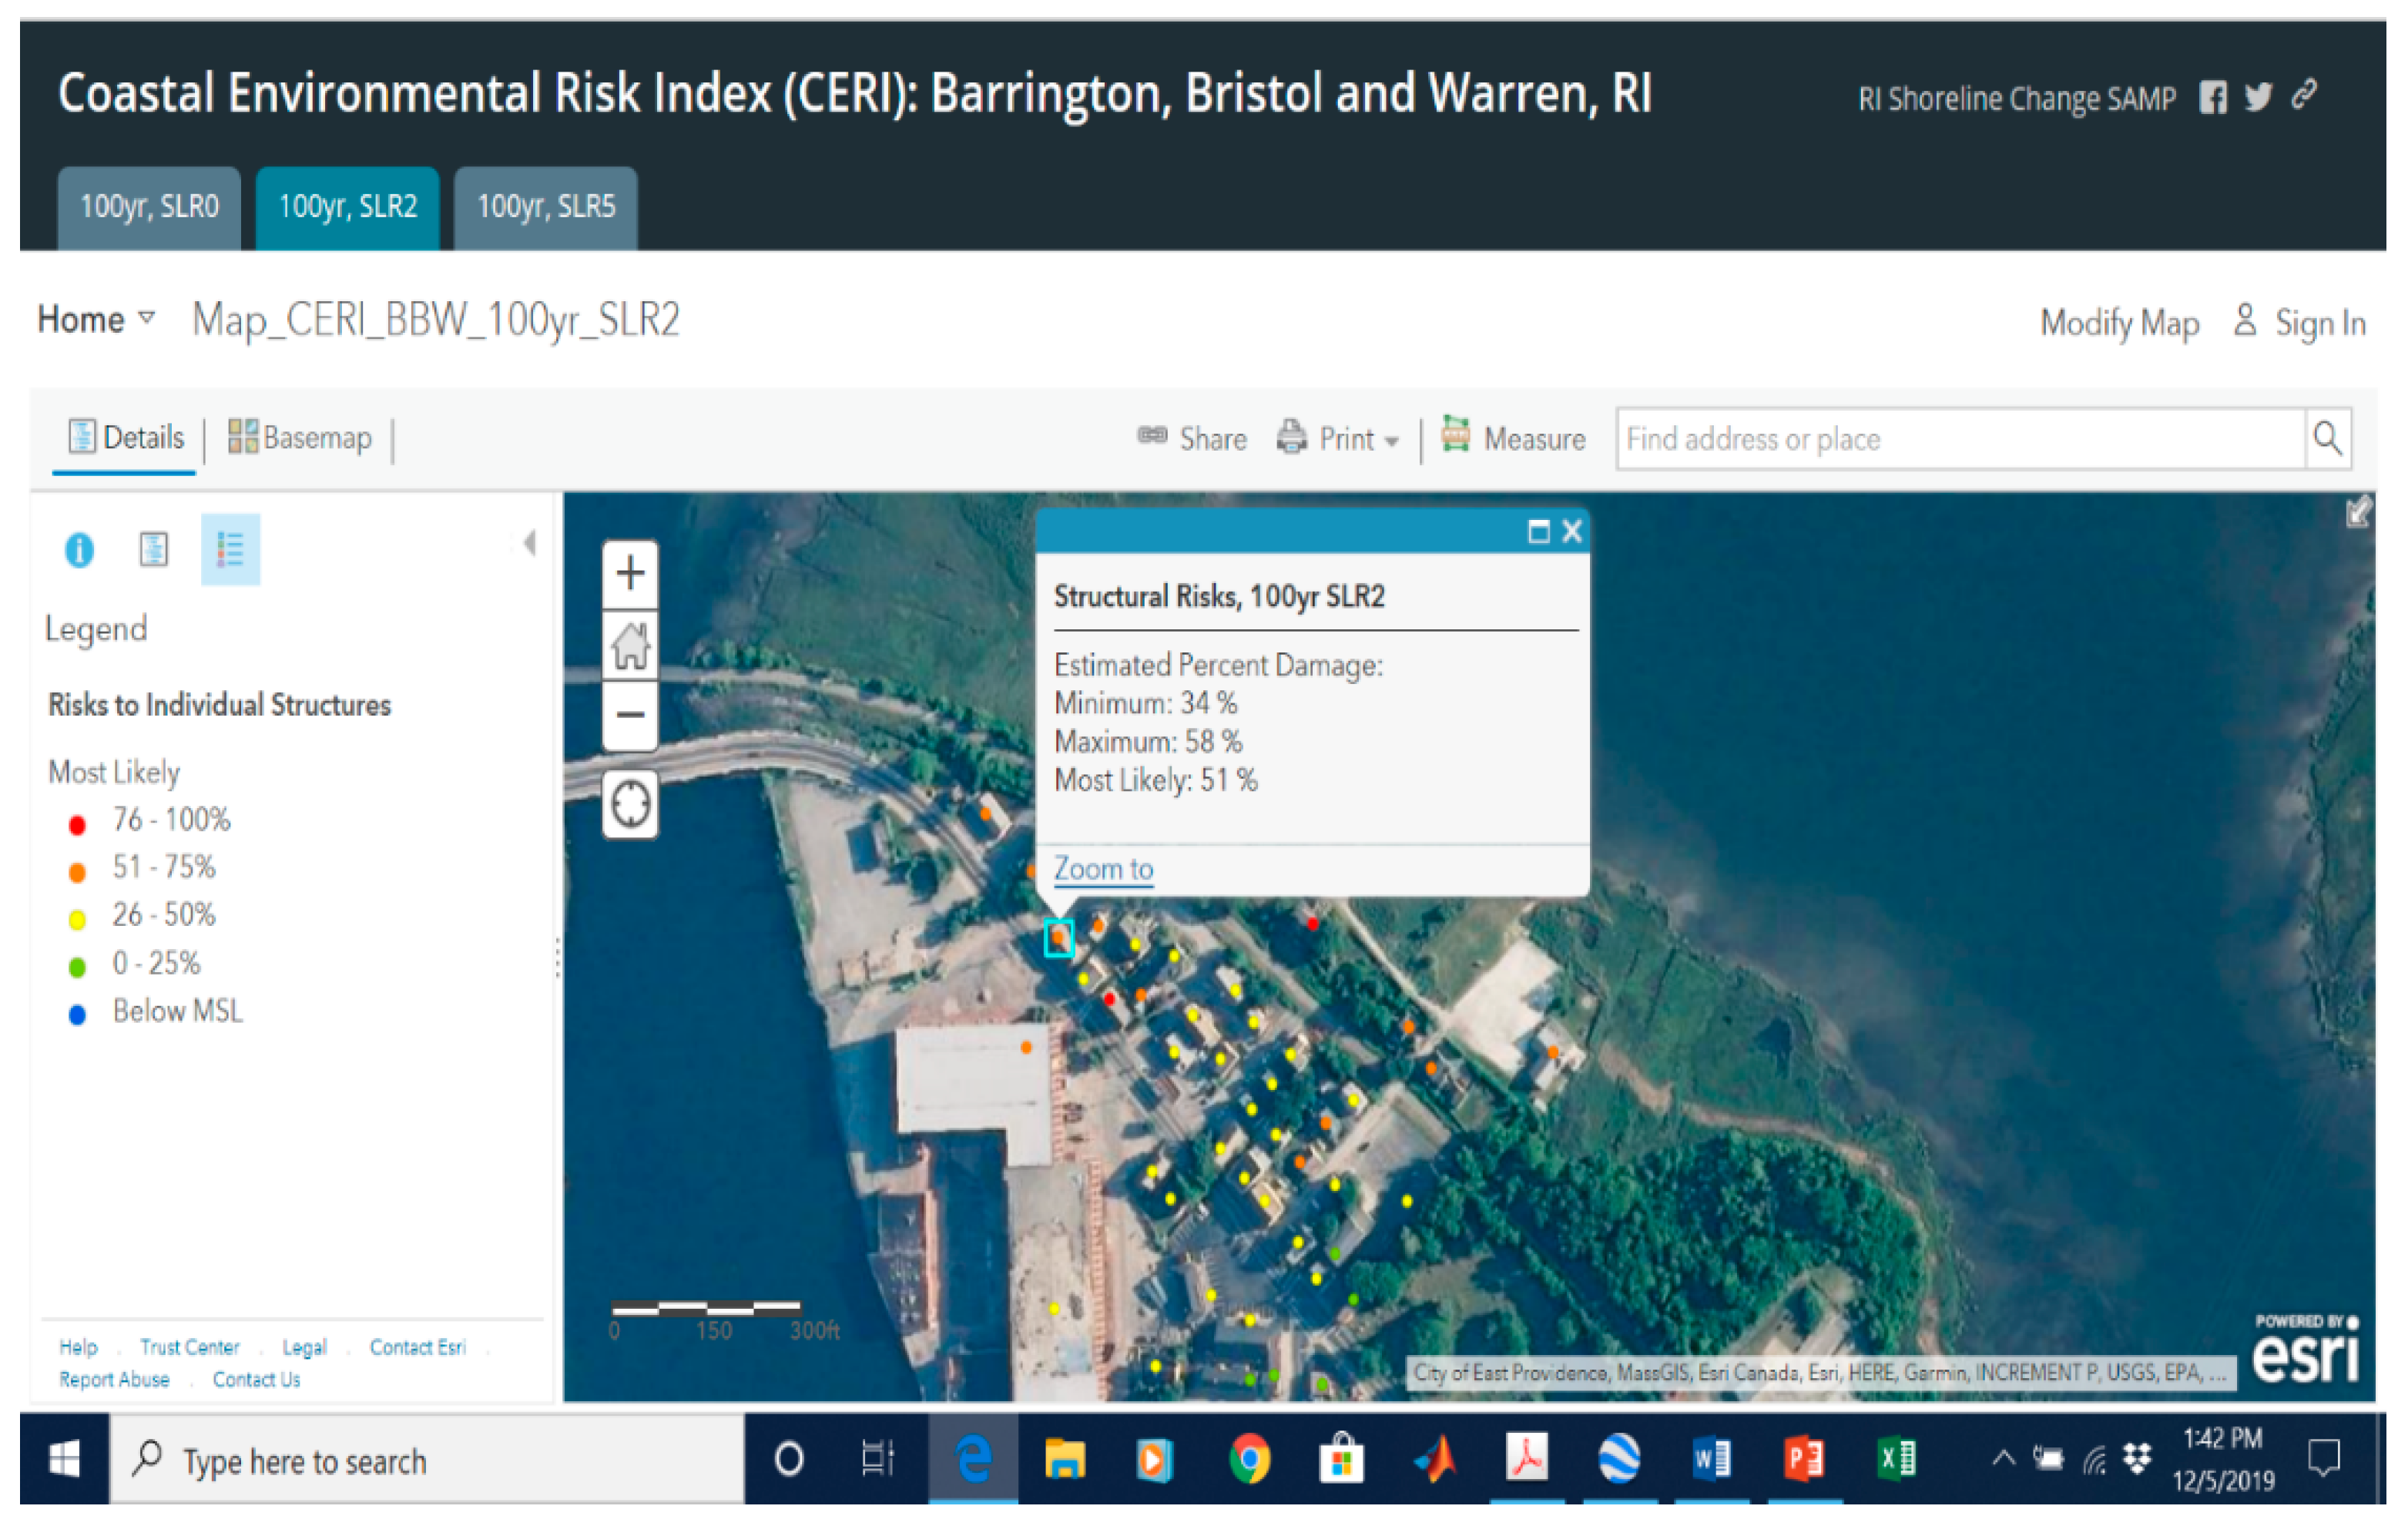
In discussing the use of CERI with permitting and municipal planning officials and those in supporting roles (engineers, builders, insurance agents, etc.) one issue of concern was to develop a product that provided a sense of the risk by location, rather than by structure, to assist in communicating localized risk to those interested in building on the coastal zone. In response to this request, a structural risk map was developed that provided a sense of the likely damage to structures located anywhere in the community. Figure 6 shows an example for Charlestown, RI without (left) and with 7 ft SLR (right). To generate these maps, it was assumed that the most common structure at highest risk in the town (Type 6A or B) was located at each grid point in the study area.
Based on the success of STORMTOOLs and CERI, HUD CDGB funded an effort to generate STORMTOOLs Design Elevation (SDE) maps, including the effects of SLR for the entire state. This project generated BFE maps (including effects of SLR) for all coastal communities in RI and provides one of the fundamental building blocks for the application of CERI to the entire state [4]. The maps are available at http://www.beachsamp.org/stormtools-design-elevation-sde-maps/, accessed on 11 December 2019.
STORMTOOLS and CERI have been well received by government and coastal communities, for which it is available. As an example, the CRMC Executive Director gave an invited presentation on STORMTOOLs, CERI and its application to coastal communities at a September 2016, Office of Management and Budget meeting on Coastal Resilience at the Whitehouse. The feedback from those attending was excellent.
In introducing STORMTOOLS to potential users in recent years, and in on-going discussions on the development, application, and implementation of CERI, it has become clear that the utility of these tools and access to them by the widest possible audience could be dramatically increased if they were available as a mobile phone App. This issue was highlighted at a FEMA National Flood Insurance Plan Round Table Discussion, organized by Senator Reed (RI-D), 12 December 2016, held at the Community College of Rhode Island (CCRI). The focus of the meeting was on flood mapping and how the results were provided to the community. Representatives from the insurance and building industries lamented the lack of current generation communication technology, and specifically a mobile phone App to help homeowners and their agents understand their risk.
With this in mind, Apps that are currently available to support storm flooding were briefly reviewed. We could find none that provided estimates of flood damage for a user specified structure.
The objective for this project is provided in Section 2, herein. This is followed by a detailed description of the technical approach to developing the App (Section 3). Section 4 provides a step by step summary of how to apply the App and some lessons learned during beta testing. Application of the 
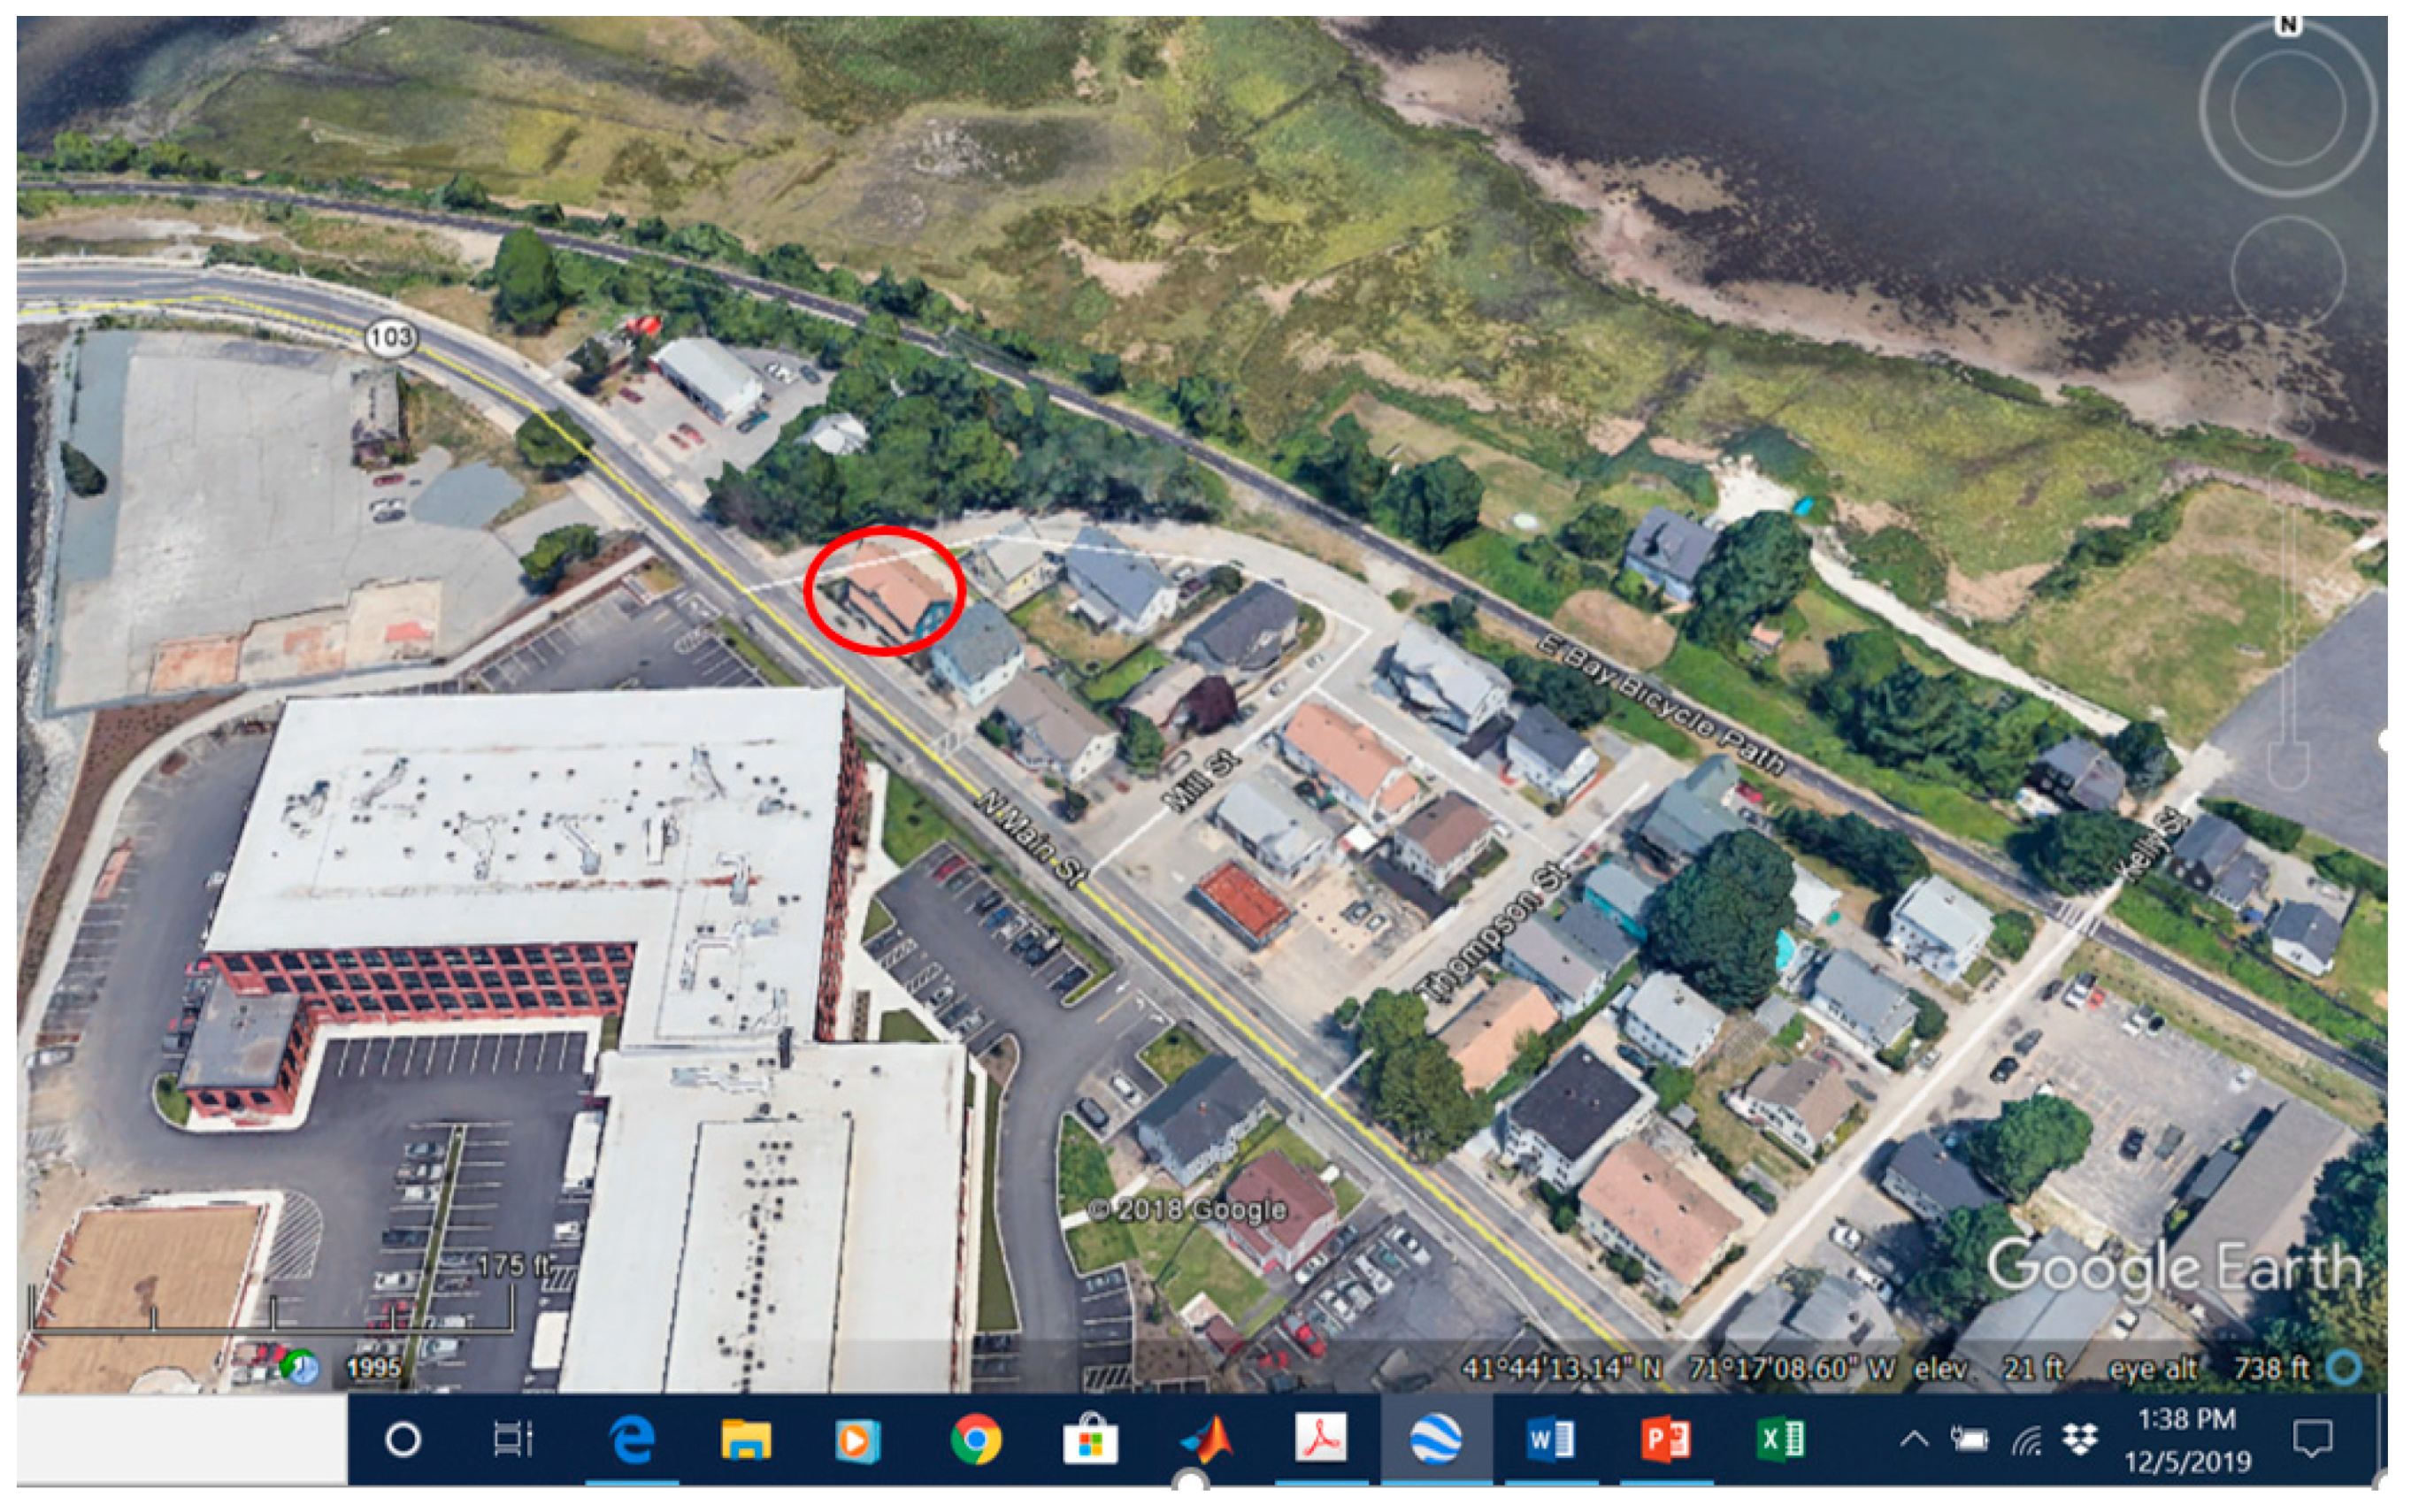
App to two structures, one located along the southern RI shoreline in South Kingstown near Green Hill Pond and the second located on North Main Street, Warren, RI adjacent to the Warren River bridge (Rte 114), are provided in Section 5. These examples show the ability of the App to investigate the impact of structure type and characteristics on damage at locations along the wave and erosion-impacted southern RI coast, and inside the more protected Narragansett Bay, where surge amplification is important. Section 6 provides a brief overview of the outreach process used in developing and testing the App and Section 7 provides the project conclusions.

2. Project Objective

The objective of the present effort is to develop, test, distribute, and evaluate a mobile phone App that allows the user to assess the risk from flooding and the associated damage at the individual structure level. The App will also provide a detailed characterization of key data that support the assessment of risk at the site. Data for the App are all currently available (from STORMTOOLs flooding maps, SDE maps, and CERI (http://www.beachsamp.org/resources/stormtools/, accessed on 9 December 2019). In this effort, the focus will be on developing the App for those individuals and organizations involved in coastal permitting and planning, with a primary focus on having all understand the risks and support the design of structures and infrastructure to meet those risks.

3. Technical Approach to App Development

The STORMTOOLS CERI Risk and Damage Assessment App is a mobile application for both iOS and Android operating systems that will provide users access to key site information (e.g., BFEs and grade elevation), and damage estimates for various flooding scenarios and mitigation strategies.
The application design is intended to intuitively guide a user through the steps of selecting a location of interest via a common map interface (similar to those used by apps such as Uber, DoorDash, etc.) and refine the characteristics of the location to be shown as specific calculations from the suite of STORMTOOLS CERI outputs.
Development of the mobile application leverages a popular cross-platform framework, React Native (https://facebook.github.io/react-native/, accessed on 11 December 2019), for mobile application development, allowing the STORMTOOLS CERI application to benefit from the best practices of larger development efforts, like those of Facebook, using the familiar industry library, React, as the core technology allows for easier future development efforts and upgrades. All software is developed under revision control using GitHub.

3.1. User Experience/User Workflow

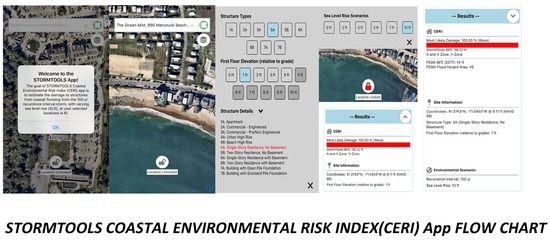
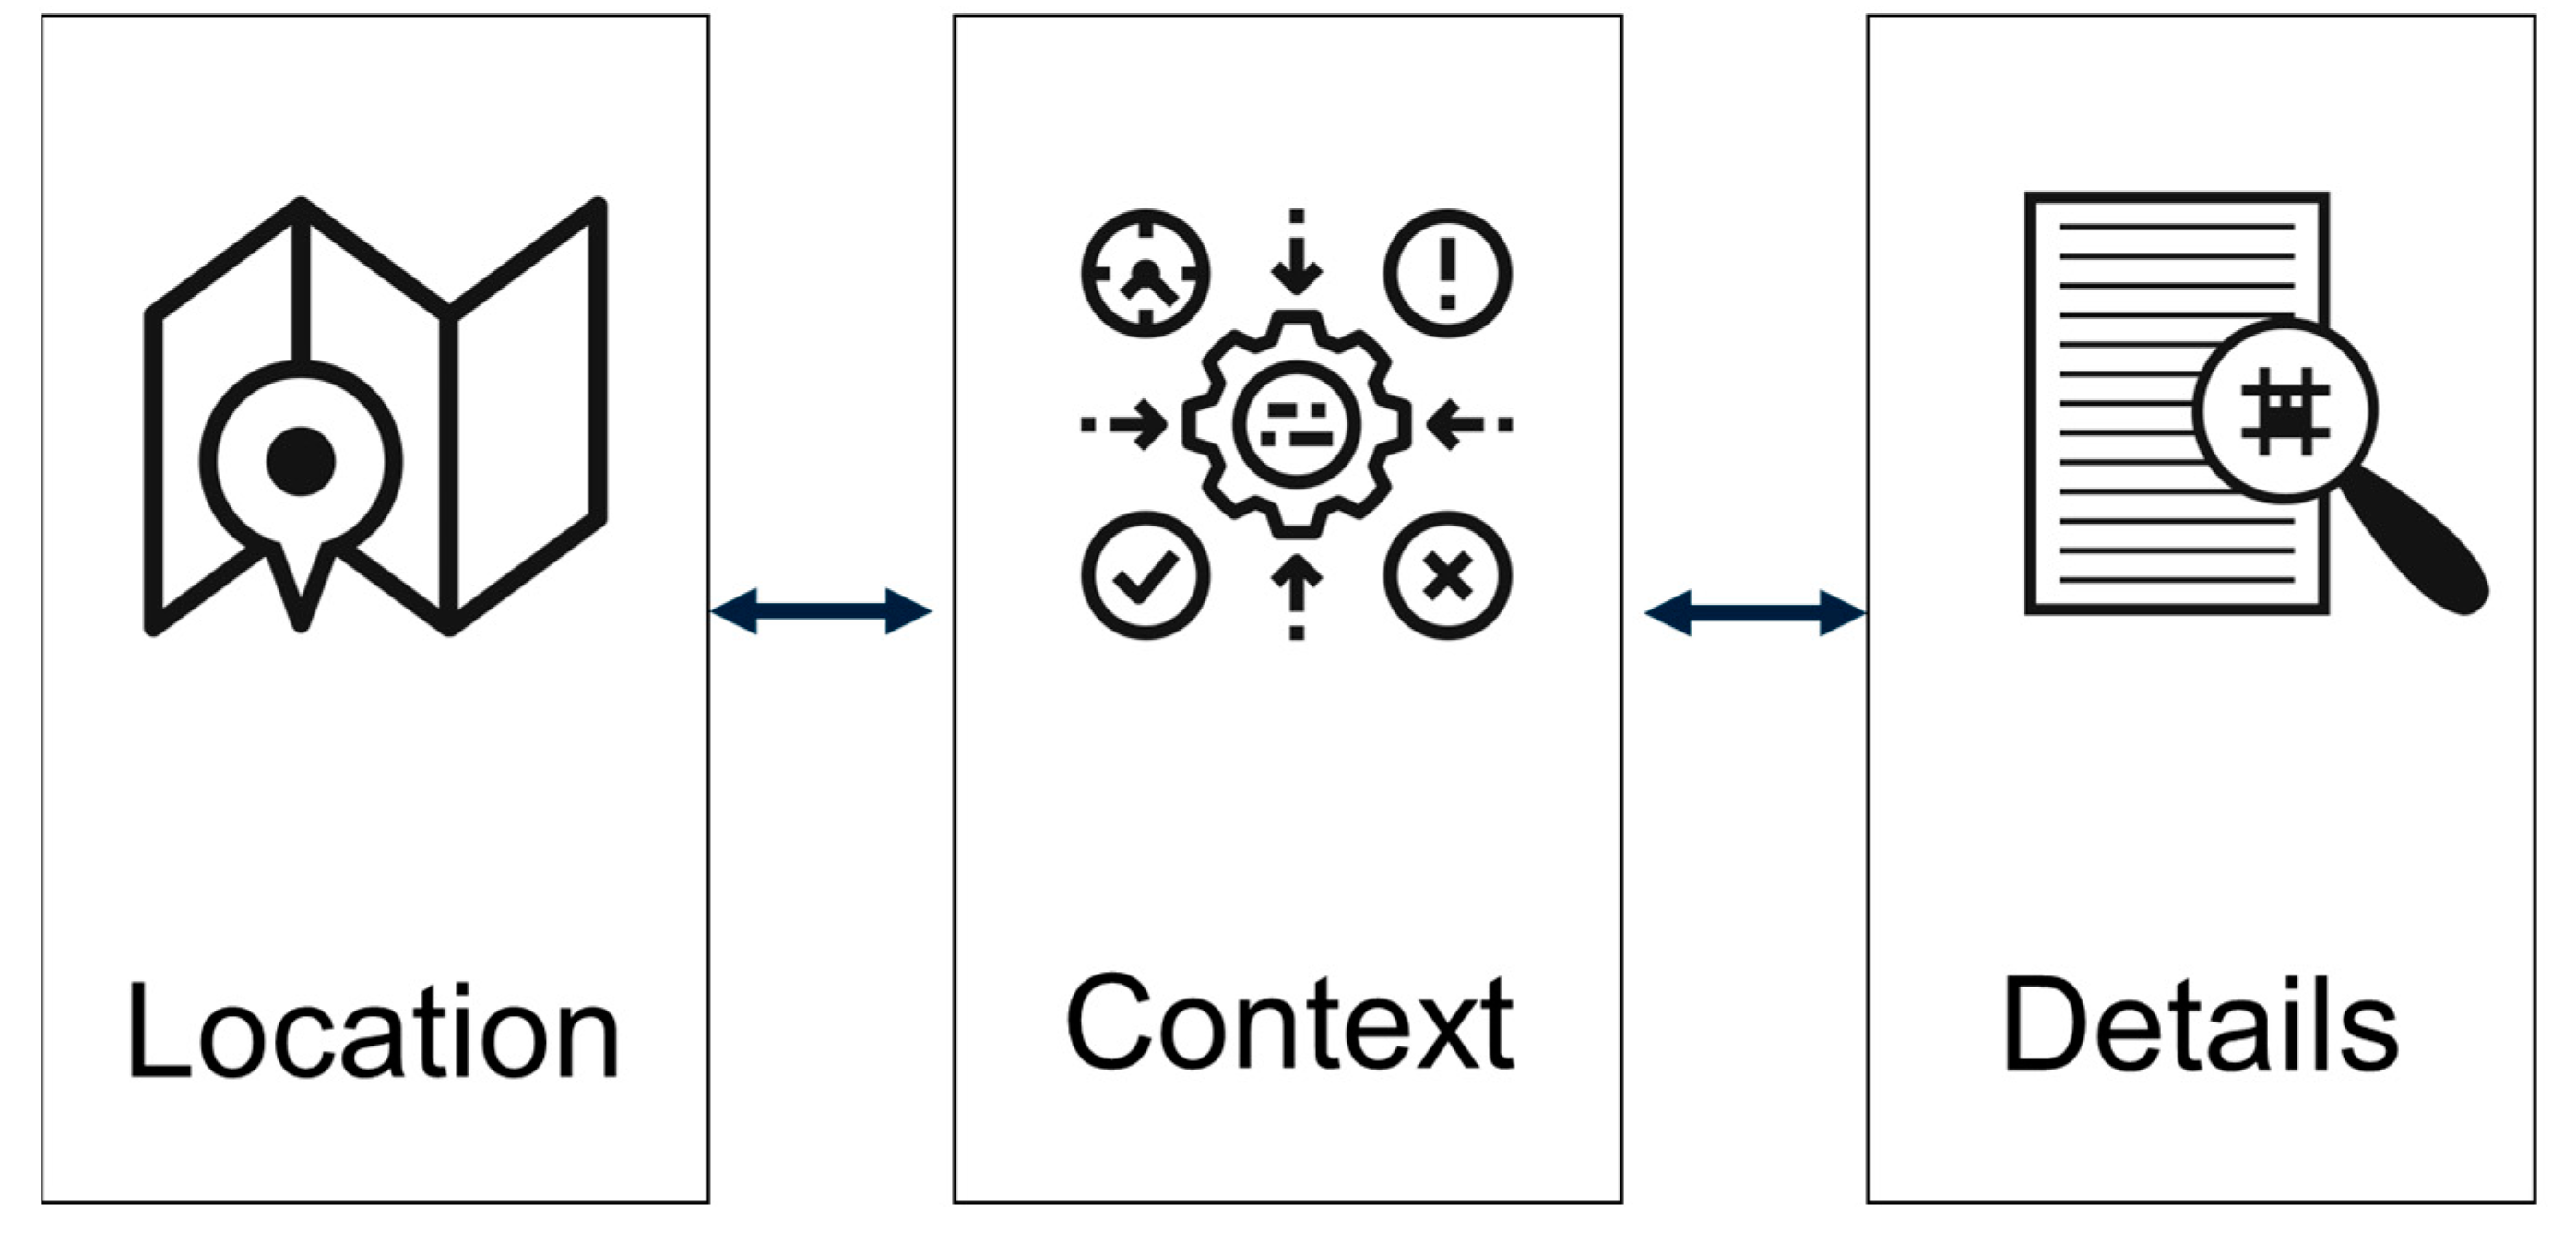
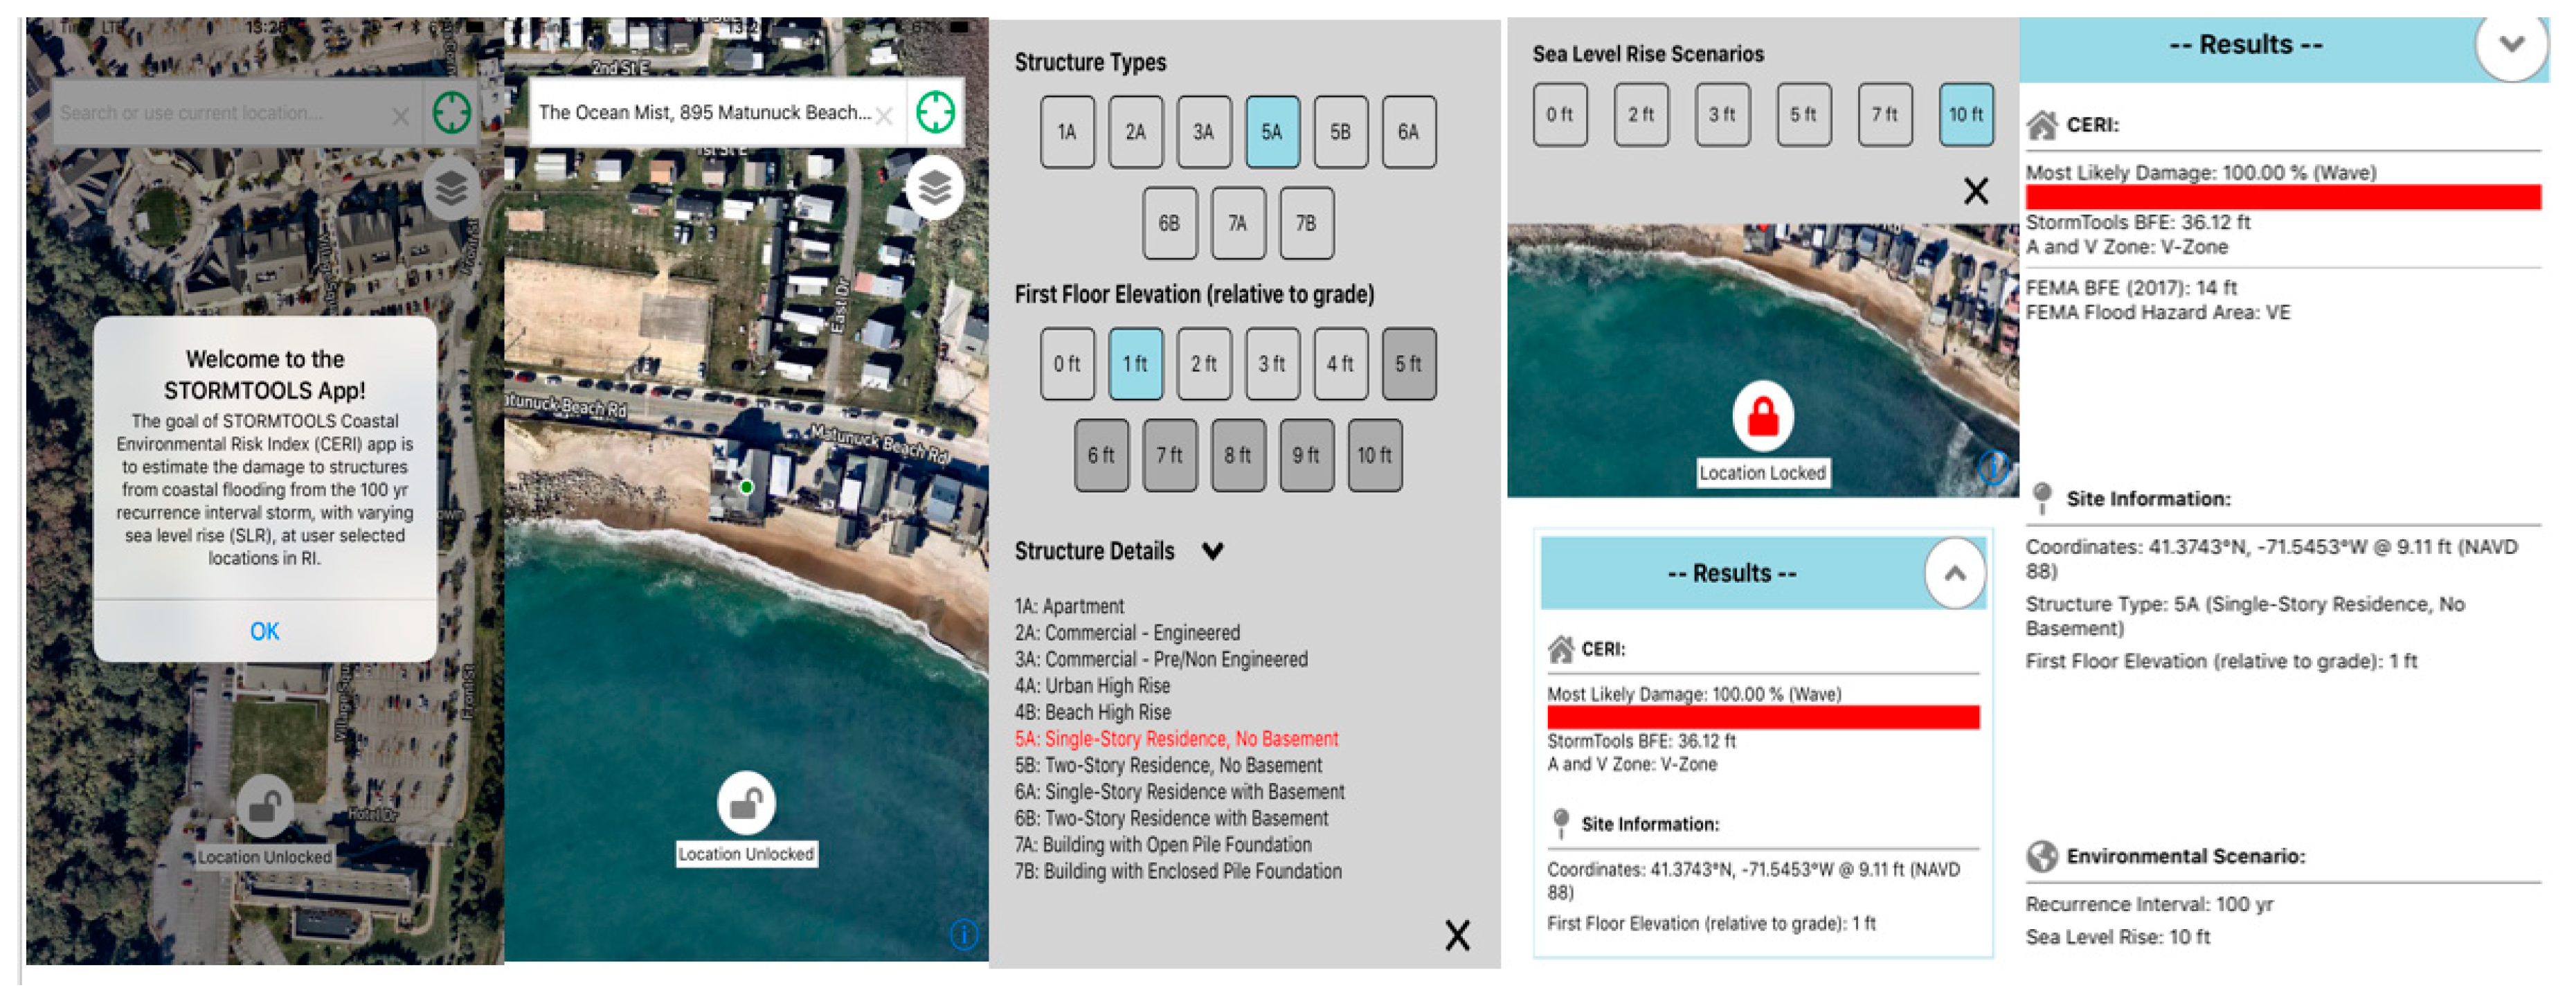
Following existing popular mobile application models, e.g., Uber, the User Experience (UX) of the STORMTOOLS CERI App consists of three simple steps, or screens, that users proceed through: 1. Location, 2. Context, and 3. Details (Figure 7).
Step 1, Location, allows the user to interactively position the geographic location of their request using a green dot centered on the screen. The map can be panned and zoomed/pinched to center a location of interest. A text input search above the map allows users to enter addresses or points of interest which are passed to an ESRI geolocation service hosted at the University of RI, Environmental Data Center (EDC).
The visible satellite base map layer is available at high zoom levels, allowing users to precisely position their request at the location of interest, such as the “front of house”.
Once a user has defined their location, they are able to lock the map (ensuring the location of interest is not accidentally modified on subsequent screens). Then a request is made to URI EDC servers for the relevant data and they are moved to the Context screen. Options are now available for the user to change the:
(1)
Structure Type (NACCS building types);
(2)
First Floor Elevation (FFE) (relative to grade as the user would see it);
(3)
Sea Level Rise (SLR) scenarios.
Within the Context screen, select fields of STORMTOOLS CERI output are displayed, informing the user of the calculated damage based on their location and selected options for structure and sea level rise. The user may investigate the impacts of different Structure Types, First Floor Elevations of a structure, and Sea Level Rise scenarios, which will update the output displayed.
A final screen, Details, removes the map from the user’s view, giving maximum space for more detailed STORMTOOLS CERI information. Additional details of Sea Level Rise scenario, recurrence interval and comparison to corresponding FEMA FIRM results are available on this final screen.
Users can navigate to previous screens (e.g., “Context to Location” or “Details to Context”) at any time using an arrow in the upper right corner.

3.2. Data Services

The original software development plan and architecture required an intermediate server in the cloud to process user requests and look up STORMTOOLS CERI output in a database hosted by URI EDC. During the initial stages of development, it was realized the existing ESRI database hosted by URI EDC and its associated services already provided the necessary information for the mobile application. The ArcGIS REST API Identify (https://developers.arcgis.com/rest/. accessed on 11 December 2019) operation allows the mobile application to retrieve information at a specific geographic location (latitude/longitude). By making several simultaneous calls to the ESRI Identify operation, the mobile application retrieves all the necessary data to combine with damage curves based on the user location and input.
Using this Identify operation directly, one can remove the requirement of an intermediate server. Total complexity is reduced, and system reliability increased by having fewer possible points of failure. Future upgrades and the addition of new STORMTOOLS CERI results are a straightforward operation that can readily be managed.
The mobile application is fully aligned with the technology stack of the comprehensive ESRI interface of STORMTOOLS CERI available online, further benefiting from updates to that platform.

3.3. Application Delivery/Installation

The STORMTOOLS CERI mobile application is available for download in both the Apple App Store for iOS and Google Play for Android based devices. By using these channels for application delivery, updates, and critical fixes can be seamlessly deployed to existing users. New users are able to install the mobile application within minutes.
It should be noted in designing the App and considering its application, that it can be used to evaluate risk and damage for a selected structure. It can also be used to explore how the risk and damage might change with modifications or flood-proofing steps. As an example, for structures with basements, damage begins to occur before the water reaches the first-floor elevation (FFE). This is because water enters the basement via the basement windows and hence impacts the infrastructure of the residential structure (e.g., hot water heater, furnace, and waste discharge system). Structures with basements experience 15–20% damage by the time the water reaches the first-floor elevation (FFE). As another example, a common option that is often considered to minimize flood damage is to elevate or increase the free board of the structure. This can be explored by performing damage estimates for varying elevation/free board heights. It is interesting to note that as the structure gets elevated the damage increases more rapidly with water elevation than for a structure that is not elevated. This is a result of the inundation and wave forces being applied higher on the structure, and hence increasing the loading moment.
Several rounds of internal testing were undertaken during the beta release of the App, validating the mobile applications methodology against that used at URI EDC. During these tests, some key assumptions leading to errors were found and corrected. In particular, from a mobile users’ perspective, the first-floor elevation (FFE) is assumed relative to grade rather than as a vertical datum (e.g., NAVD88).
An independent Python script was generated to replicate the process taken within the mobile application, allowing developers to verify this methodology on known hardware, and compare it to the various phones available to the developers. No numeric inconsistencies were found to be introduced by mobile phone architectures.
From October 2019 through December 2019, the rollout period, the mobile application was released to groups for internal testing, limited external testing, and finally a full public release. The application was downloaded and used by over 90 users, with modifications being made in November and early December 2019.

4. Step by Step Application of the App

Figure 8 shows the basic layout of the App, proceeding from input, on the left (Location), through to Context, to the results (Details) of the application, on the right. The text that follows presents a step by step guide to applying the App. This is followed by some brief notes, based on feedback from App users.
  • Download App from Apple Store or Google Play, search under STORMTQOLSCERI, available for both iOS and Android users.
    Jmse 08 00129 i001
  • Select location of the structure or the location of interest. Options: search using aerial imagery, address, or latitude/longitude (green dot).
    Location selected: Ocean Mist, 895 Matunuck Beach Road, South Kingstown, RI
    Latitude/Longitude: 41.3743 N, −71.5453 W
    Jmse 08 00129 i002
  • Lock map on selected location for analysis (lock symbol changes from white, unlocked, to red, locked. Location changes from green dot to red tear drop).
    Jmse 08 00129 i003
  • Select structure type and elevation (relative to grade elevation). Structure types are specified using the US Army Corp Engineers (USACE) North Atlantic Comprehensive Coast Study (NACCS) methodology [10] (see list of structural details at the bottom of the window) (Selected: 5A).
    Jmse 08 00129 i004
  • Select first-floor elevation (FFE) (relative to local grade elevation) (# steps are often used as a proxy, 3 steps=2 ft, 7. 5 in per step) (Selected: 1 ft, two steps). Note that if the FFE is based on the number of steps to the structure, it explicitly includes any freeboard included in the structure design.
  • Select sea level rise scenario. All cases assume once in 100 y return period coastal flooding with the sea level rise added (Selected: 10 ft).
    Jmse 08 00129 i005
  • Results (100 y, 10 ft sea level rise)
    Most likely damage: 100.00% from surge
    STORMTOOLS BFE: 36.12 ft (NAVD88), V zone
    FEMA FIRM BFE: 14 ft (NAVD88), VE zone
    Structure: 5A single-story residence, no basement
    FFE at grade elevation: 1 ft
    Grade elevation at structure (41.3743 N, −71.5453 W): 9.11 ft (NAVD88)
    Jmse 08 00129 i006
Notes:
Searching for structures by address often gives the location of the access to the structure (driveway connection to the adjacent road network) but not the actual location of the structure. Verify that the location of the structure has been selected.
When selecting the location for analysis remember that the grade elevation around a structure may vary substantially (e.g., front steps at several feet above grade, while rear of building might have a walk out basement also at grade). Use of the lowest adjacent grade (LAG) for the analysis is recommended to develop a conservative estimate of the damage.
Some rules of thumb: FFEs are typically 2 to 3 ft for structure Types 5 and 6 and 9 ft for Type 7 (pile-supported structures). Most residential structures in the RI coastal zone are Types 5 and 6.
Vertical references are provided for each measurement of elevation. For FFE, the reference is local grade elevation, and for the BFE the reference is NAVD88. For most of the RI coast, 0 ft NAVD88 is approximately equivalent to mean sea level (MSL).

5. Application to Selected Test Cases

The application of the App to two locations, one along the southern coast of RI where waves and erosion are critically important and the other inside Narragansett Bay where surge amplification dominates, are provided below to help demonstrate how the application works and to better understand its utility.

5.1. Green Hill Pond Southern RI Shoreline Test Site

The App was applied to a residence located behind the dune seaward of Green Hill Pond. The location of the site is provided in a Google Earth image shown in Figure 9. The structure is circled in red. The site was purposely selected to be some distance back from the coast so that the impact of sea level rise could be observed.
The App was applied to this residential structure assuming several different structure types and FFE values to highlight some of the capabilities of the App. The actual structure type at the site is 7B, with an FFE of 9 ft (relative to grade elevation). The results are summarized in Table 1. The location of the site (latitude/longitude) and its grade are provided first. Grade elevation is quite low at 3.7 ft (NAVD88) (note there is a small difference between the CERI analysis with grade elevation of 3.5 ft and the App selected location with a grade of 3.7 ft). With 4 ft of SLR, the foundation of the structure would be below MSL. The FEMA BFE for the site is 14 ft. The SDE BFE from the App increases from 14. 4 ft with no SLR to 31.59 ft with 10 ft of SLR. The increase in BFE is caused by the addition of SLR to the surge level and the increase in wave heights from the increased water level. Damage estimates were made if the structure were 5B, FFE- 3 ft; 6B, FFE-3 ft; and 7B, FFE- 9 ft to highlight the ability of the App to make estimates of damage for different structure types and FFEs. The first two cases were selected since they are the most common type of structure in the area and the last, since it is the actual structure type and the strategy most commonly used in the area to make residences more flood-resistant. For the no SLR case, the highest damage is for Type 6B (58.6%) and the lowest for 7B (30.3%). Type 5B is intermediate with a damage of 43.2%. Flood damage is highest for Type 6B, since flood waters can enter via the basement windows and lowest for the pile-supported Type 7B since the structure is substantially elevated relative to grade. The damage is projected to increase with SLR for all structure types, with the amount of the increase dependent on the structure type. For all cases, the damage reaches 100% for SLR values of 3 ft or greater. When the SLR reaches 5 ft or greater the structures foundation is below MSL.
CERI maps of damage are available for this community. Figure 10 shows the damage by individual structure in the study area for the no SLR case. The residence of interest is highlighted in the blue square. The display window shows details for the structure. The results are consistent with the App. It should be noted that the App can be used to determine the damage to structures surrounding the one selected by simply applying it to each structure of interest.

5.2. North Main Street, Warren, RI test site

The App was applied to a test site in Narragansett Bay on North Main Street, Warren, RI adjacent to the Rt 114 Warren River Bridge. The location of the structure is shown in the red circle in Figure 11. The building is type 6B with an FFE of 4 ft. An analysis was performed for building types 5B and 6B, with FFEs of 3 and 4 ft, to show the sensitivity of the results to the assumed structure type and FFE value. The results of the App application for this case are provided in Table 2. The structure has a grade elevation of 5.19 ft. If the sea level rise value exceeds this level, then the foundation of the structure would be below MSL and the structure is no longer viable.
The analysis shows that the percent damage for the 100 y no-SLR case increases with a decrease in FFE and increases if the structure is assumed to have a basement(6B); the former effect is due to the height of the FFE and the latter due to flooding via basement windows. The damage is projected to increase with SLR value, eventually reaching 100% for the 10 ft SLR case (note that the structure foundation would be below sea level for all cases of SLR greater than about 5 ft). The difference in percent damage in the higher SLR cases is consistent with that for the 0 ft SLR case, with Type 6B, FFE (3 ft) having the highest damage and Type 5B, FFE (4 ft), having the lowest values.
Figure 12 shows the damage by individual structure in the study area for the 2 ft SLR case from CERI. The residence of interest is highlighted in a blue square and the display window shows the details of damage to the structure. The results are consistent with the App. It should be noted that the App can be used to determine the damage to structures surrounding the one selected by simply applying it to each structure of interest.

6. Outreach Activities

An Advisory Board was selected to support the design, testing, and evaluation of the App. The names of the members and the organizations they represent are provided in the Acknowledgements section below. The Advisory Board met at project kick off in February 2019 to review the proposed effort, with a focus on the development, testing, and distribution of the App. They met again in July 2019 and, over the next few weeks, had individuals in their organization perform testing using the beta release of the App. With feedback from the Advisory Board, the App was revised with a new version released in early September 2019. In mid-September 2019, URI Ocean Engineering students, in one of the coastal resilience senior design classes, performed an in-depth test of the App for selected structures along the southern RI shoreline. A training session providing background on the Coastal Environmental Risk Index (CERI) and use of the App was held on 19 November 2019. This session was targeted to those operating and supporting the permitting process for coastal structures and infrastructure (e.g., CMRC permitting staff, other state permitting staff (e.g., RI Department of Environmental Management) coastal community building inspectors, engineers, and builders and insurance agents that support permit applicants). An additional presentation was held on 21 November 2019 at the CRMC Shoreline Change Special Area Management Plan (Beach SAMP) public stakeholder meeting and targeted the general public.

7. Conclusions

The STORMTOOLS CERI risk and damage App was constructed based on the methodology developed as part of the STORMTOOLs Coastal Environmental Risk Index (CERI) initiative. The goal of the App is to provide wider access to the results of the analysis. The CERI methodology uses BFEs, including the effects of sea level rise, provided in the form of STORMTOOLS Design Elevation (SDE maps), to characterize the environmental forcing during the 100 y storm event. The damage functions used in the analysis were based on those developed by the USACE as part of the NACCS study, using the most recent data available from the impact of Sandy (2012) on structures along the coasts of NY and NJ. Specification of structures at risk is categorized using the USACE damage assessment methodology. In applying the App, data for the BFEs and grade elevations were obtained from the URI EDC. Data on the FEMA FIRM BFEs were also available from this same source and provided in the App for comparison to the SDE (BFE) results. The grade elevation data, based on 2011 LIDAR data for the state, are provided by the App and have a horizontal resolution of approximately 3 ft (1 m) and 6 in (15 cm) vertically. Specification of the structure of interest is provided by the App user in terms of structure type and the associated First Floor Elevation (FFE). The calculations of the percent damage (structural) are performed by the App. They are not taken from the URI EDC database for CERI applications. Given this approach, the user can elect to investigate the impact of storm environmental conditions at any coastal location in the state, on any user selected structure type and characteristics. While the analysis is currently restricted to coastal flooding in RI, it can readily be extended to inland flooding with access to flood inundation levels. Given the design, the App can also be extended to other coastal states and only requires specification of the BFEs for the flooding scenarios of interest. In the absence of other BFE maps, the App can use estimates provided by FEMA FIRMS.
A step by step methodology to apply the App is provided, including data input by the user (location, type of structure and its attributes, and the environmental conditions of interest—100 y storm with user selected value for SLR)—and the output—calculation of damage (%) to the structure. The user can readily determine whether a structure is viable at a given location by comparing the grade elevation at the location of the structure with the sea level rise value selected. If the former is lower than the latter, then the structure foundation is below MSL and the structure will not exist. One of the other key variables in the analysis is the height of the first-floor elevation (FFE). This value is provided by the user, relative to local grade elevation, typically at the entrance to the structure or the lowest adjacent grade. FFEs are typically 2 to 3 ft for Type 5 and 6 structures and 9 ft for Type 7 (as a rule of thumb, step heights are typically 7.5 in per step, so four steps give approximately 3 ft).
Two examples of the application of the App are provided to illustrate the results for typical applications, one along the southern RI shoreline adjacent to Green Hill Pond and one on North Main Street in Warren, RI (inside Narragansett Bay). In both cases, the structure is set back some distance from the coast. The southern shoreline application is in an area where waves and shoreline erosion are critically important, while the application in Warren features a location where surge amplification inside Narragansett Bay is very important and erosion is very limited. In the applications provided, the damages from different type structures with varying FFE values were evaluated. As a general rule, structures with basements have higher damages than those without (Type 6 vs. Type 5) for the same level of flooding. For a given structure type, the higher the FFE, the lower the damage. Structures with pile foundations (Type 7) typically have substantially lower damages that those with an FFE a few feet above-grade. Elevation of structures is one of the most common strategies used to reduce the risk of flood damage.
In applying and testing the App, several critical variables have been identified in its use. In specifying the location of the structure, the user is cautioned to make sure that the location of the structure of interest is carefully selected. Use of the address search feature is often problematic since that approach might find the location of the road access to the structure but not the structure itself. It is recommended to verify the location of the structure using the aerial imagery provided in the App as a base map. When the location of the structure is selected, it specifies the location for which grade elevation is provided. For structures in relatively level terrain, the exact location for the analysis is not critically important. For structures where the grade elevation varies considerably, it is recommended to use the lowest adjacent grade (LAG). This can be found by applying the App to several locations around the edge of the structure.
The design, testing, and evaluation of the App was carried out with the support of an Advisory Board, representing a wide range of constituents in the state. Members of the Board are listed in the Acknowledgements section. The Advisory Board had members of their organization perform beta testing of the App and provided feedback on its utility and ease of use. In addition, a training session for those who will likely use the App as part of the permitting process for coastal structures was held. An outreach event for the general public was also performed as part of a CRMC Shoreline Change Special Area Management Plan public stakeholder meeting in November 2019.

Author Contributions

Conceptualization: M.L.S.; methodology and software: A.G., B.M., M.C., and N.V. (formerly with RPS and now at URI Coastal Institute); writing original draft: M.L.S. and B.M.K.; writing—review and editing: all; visualization: C.D.; supervision and administration: M.L.S. and G.F.; funding acquisition: G.F. and J.B. All authors have read and agreed to the published version of the manuscript.

Funding

The development of STORMTOOLS Risk and Damage App for the state of RI was supported by NOAA, Office of Coastal Management (OCM), Projects of Special Merit (PSM) (NOAA OCM PSM) program: Contract Number NA18NOS4190085, via a cooperative agreement between the RI Coastal Resources Management Council (CRMC) and the University of RI, Kingston, RI.

Conflicts of Interest

The authors declare no conflict of interest. The funders had no role in the design of the study; in the collection, analyses, or interpretation of data; in the writing of the manuscript, or in the decision to publish the results.

Advisory Board

The following individuals served on the Advisory Board for the project representing a wide range of constituents with interest in the App: Grover Fugate, Executive Director, RI Coastal Resources Management Council (CRMC)(chair); Joe Warner, Charlestown, RI Building Officer; Dave Caldwell, President, RI Builders Association; Joe Dwyer, Flood Plain Manager, RI Emergency Management Agency; Joshua Sargent, GIS Specialist II, RI Department of Environmental Management; Chuck Miccolis, Director, Insurance Institute for Building and Home Safety (IBHS); David Prescott, Save the Bay; and William Helt, The Nature Conservancy.

Acronyms

ADCIRC—ADvanced CIRCulation model
AST—Above Ground Storage Tank
BFE—Base Flood Elevation
CCRI—Community College of RI
CERI—Coastal Environmental Risk Index
CRMC—RI, Coastal Resources Management Council
CDBG—HUD —Community Development Block Grant
CI—URI—Coastal Institute
DEM—Digital Elevation Model
EDC—URI Environmental Data Center
ESRI—GIS software company, ArcView developer
FEMA—Federal Emergency Management Agency
FFE—First Floor Elevation
FIRM—Flood Insurance Rate Maps
HUD—Housing and Urban Development
LAG—Lowest Adjacent Grade
LIDAR—Laser Imaging, Detection, and Ranging
MSL—Mean Sea Level
NACCS—USACE, North Atlantic Coast Comprehensive Study
NAVD88—North Atlantic Vertical Datum, 1988.
NBC—Narragansett Bay Commission
NOAA NOS—National Ocean and Atmospheric Administration—National Ocean Survey
NRC—National Research Council
OHCD—HUD—Office of Housing and Community Development
OIG—Office of Inspector General
RMSE—Root Mean Square Error
RI GIS—Rhode Island—Geographic Information System
RPS—Global Professional Services Firm
SDE—STORMTOOLS Design Elevation maps (BFE maps with SLR)
SLR—Sea Level Rise
STWAVE—STeady state spectral WAVE model
SWEL—Still Water Elevation Level
STORMTOOLS—tools in support of storm analysis
SWAN—Simulating WAves Nearshore
URI—University of Rhode Island
USACE-US Army Corp of Engineers
WAM—Wave Model
WWTF—Wastewater Treatment Facility
XBeach—nearshore wave and geomorphological model

References

  1. Spaulding, M.L.; Isaji, T.; Damon, C.; Fugate, G. Application of STORMTOOLS’s simplified flood inundation model, with and without sea level rise, to RI coastal waters. In Proceedings of the ASCE Solutions to Coastal Disasters Conference, Boston, MA, USA, 9–11 September 2015. [Google Scholar]
  2. Cialone, M.A.; Massey, T.C.; Anderson, M.E.; Grzegorzewski, A.S.; Jensen, R.E.; Cialone, A.; Nadal-Caraballo, N.N.; Melby, J.A.; Ratcliff, J.J. North Atlantic Coast Comprehensive Study (NACCS) Coastal Storm Model Simulations: Waves and Water Levels; Report: ERDC/CHL TR-15-44; Coastal and Hydraulics Laboratory U.S. Army Engineer Research and Development Center: Vicksburg, MS, USA, 2015. [Google Scholar]
  3. Jensen, R.E.; Cialone, A.; McKee Smith, J.M.; Bryant, M.A.; Hesser, T.J. Regional wave modeling and evaluation for the North Atlantic coast comprehensive study. J. Waterw. Port Coast Ocean Eng. 2017, 143, B4016001. [Google Scholar] [CrossRef]
  4. Spaulding, M.L.; Grilli, A.; Damon, C.; Hashemi, R.; Anbaran, S.K.; Fugate, G. STORMTOOLS Design Elevation (SDE) Maps: Including Impact of Sea Level Rise, Report Prepared on Behalf of the RI; Coastal Resources Management Council: South Kingstown, WA, USA, 2019. [Google Scholar]
  5. Spaulding, M.L.; Grilli, A.; Damon, C.; Crean, T.; Fugate, G.; Oakley, B.A.; Stempel, P. STORMTOOLS: Coastal Environmental Risk Index (CERI). J. Mar. Sci. Eng. 2016, 4, 54. [Google Scholar] [CrossRef] [Green Version]
  6. NRC. Mapping the Zone: Improving Flood Map Accuracy; Committee on FEMA Flood Maps, Board on Earth Sciences and Resources/Mapping Science Committee, National Research Council: Washington, DC, USA, 2009; ISBN 978-0-309-13057-8. [Google Scholar]
  7. Office of Inspector General (OIG). FEMA Needs to Improve Management of Its Mapping Program; Report OIG-17-110; Department of Homeland Security: Washington, DC, USA, 2017.
  8. Spaulding, M.L.; Grilli, A.; Damon, C.; Fugate, G.; Oakley, B.A.; Isaji, T.; Schambach, L. Application of state of art modeling techniques to predict flooding and waves for an exposed coastal area. J. Mar. Sci. Eng. 2017, 5, 10. [Google Scholar] [CrossRef] [Green Version]
  9. Spaulding, M.L.; Grilli, A.; Damon, C.; Fugate, G.; Isaji, T.; Schambach, L. Application of state of art modeling techniques to predict flooding and waves for coastal area with a protected bay. J. Mar. Sci. Eng. 2017, 5, 14. [Google Scholar] [CrossRef] [Green Version]
  10. US ACE. North Atlantic Coast Comprehensive Study. Resilient Adaptation to Increasing Risk, Physical Depth Damage Function, Summary Report. 2015. Available online: http://www.nad.usace.army.mil/Portals/40/docs/NACCS/10A_PhysicalDepthDmgFxSummary_26Jan2015.pdf (accessed on 15 February 2020).
  11. Grilli, A.; Spaulding, M.L.; Damon, C.; Becker, A.; Menendez, J.; Stempel, P.; Crean, T.; Fugate, G. Application of the Coastal Environmental Risk Index (CERI) to Barrington, Bristol, and Warren; Coastal Resources Management Council: South Kingstown, WA, USA, 2018.
  12. Spaulding, M.L.; Grilli, A.; Damon, C.; Crean, T.; Fugate, G. Developing the RI Coastal Environmental Risk Index (CERI) to Inform State and Local Planning and Decision Making: Application to the Communities along the Southern RI Shoreline; Coastal Resources Management Council: South Kingstown, WA, USA, 2019.
  13. Schambach, L.; Grilli, A.; Grilli, S.; Hashemi, R.; King, J.W. Assessing the impact of extreme storms on barrier beaches along the Atlantic coastline: Application to southern Rhode Island coast. Coast. Eng. 2018, 133, 26–42. [Google Scholar] [CrossRef]
  14. Blanpied, T.; Kauffman, A.; O’Neil, C.; Proulx, N.; Rajacich, M.; Simpson, H.; Small, C.; White, J. Assessment of Damage from Storm Surge and Sea-Level Rise Along Matunuck Beach Road and Surrounding Communities; Ocean Engineering Senior Design Project; Ocean Engineering, University of RI: Narragansett, RI, USA, 2016. [Google Scholar]
  15. Bianchi, C.; Folkert, L.; Knight, J.; Madison, H.; Maroukis, M.; Quinn, B.; Schicho, J.; White, M. Assessment of Damage for the Misquamicut, RI Community from a 100 Year Storm Event and Sea Level Rise; Ocean Engineering Senior Design Project; Ocean Engineering, University of RI: Narragansett, RI, USA, 2017. [Google Scholar]
  16. Aiudi, M.; Day, E.; Girard, P.; Menefee, N.; Schwarz, M.; Zarba, E. Application of Coastal Environmental Risk Index to Providence and Fox Point Hurricane Barrier; Ocean Engineering Senior Design Project; Ocean Engineering, University of RI: Narragansett, RI, USA, 2018. [Google Scholar]
  17. Bowe, E.; Loo, M.; Ross, E.; Savastano, C.; Thirkell, S.; Weisman, J. Evaluating and Improving the Resilience of Waste-Water Treatment and Hazardous Material Storage Facilities in Upper Narragansett Bay to Coastal Flooding; Ocean Engineering Senior Design Project; Ocean Engineering, University of RI: Narragansett, RI, USA, 2019. [Google Scholar]
  18. Grilli, A.R.; Spaulding, M.L.; Oakley, B.; Damon, C. Mapping the coastal risk for the next century, including sea level rise and changes in the coastline: Application to Charlestown RI. Nat. Hazards 2017, 88, 389–414. [Google Scholar] [CrossRef]
  19. Small, C.; Blanpied, T.; Kauffman, A.; O’Neil, C.; Proulx, N.; Rajacich, M.; Simpson, H.; White, J.; Spaulding, M.L.; Baxter, C.D. Assessment of damage and adaptation strategies for structures and infrastructure from storm surge and sea level rise for a coastal community in Rhode Island, United States. J. Mar. Sci. Eng. 2016, 4, 67. [Google Scholar] [CrossRef] [Green Version]
  20. FEMA HAZUS. Multi-Hazard Loss Estimation Methodology Hurricane Model, Hazus®–MH 2.1, Technical Manual. This Manual Is Available on the FEMA Website; 2018. Available online: http://www.fema.gov/plan/prevent/HAZUS (accessed on 9 December 2019).
Figure 1. Flood inundation maps for Charlestown, RI for the 100 y flood event (http://www.beachsamp.org/resources/stormtools/, accessed on 6 February 2020).
Jmse 08 00129 g001
Figure 2. Flow chart for STORMTOOLS Coastal Environmental Risk Index (CERI) to assess damage from flooding and wind. (http://www.beachsamp.org/wp-content/uploads/2019/10/Developing_RI_CERI_FINAL.pdf, accessed on 6 February 2020).
Jmse 08 00129 g002
Figure 3. CERI predicted damage by structure for Charlestown, RI for 100 y and no sea level rise (SLR) (a) and 100 y plus 7ft of SLR (b), dunes eroded. Damage is shown by percent (see legend for ranges) and structures below Mean Sea Level (MSL) are noted in blue and those lost by erosion of the shoreline in black [5]. (also available at https://crc-uri.maps.arcgis.com/apps/MapSeries/index.html?appid=2a4ab310fecc4721935287e5a5f7ace4, accessed on 6 February 2020).
Jmse 08 00129 g003
Figure 4. Three-dimensional visualization of the predicted damage by structure for 100 y and no SLR (a) and 100 y plus 7ft of SLR (b), dunes eroded [5] (personal communication, with the permission from Peter Stempel, 2016).
Jmse 08 00129 g004
Figure 5. FEMA zone flooding zone map (left) (http://www.r3coastal.com/home/coastal-hazard-analysis-mapping/coastal-flood-hazard-mapping, accessed on 11 February 2020) and percent damage for single story structure elevated on stilts (center) and on grade, with a basement (right). The location of the flood inundation level is provided in the figure on the right side (red line) and the percent damage to the structure is shown above the structures, reproduced from [19], with the permission from Small, C. et al. 2016.
Jmse 08 00129 g005
Figure 6. CERI risk maps for 100 y dune-eroded scenario (a) and 100 y plus 7 ft SLR dune-eroded scenario (b). Structural risk is ranked from moderate (green) to extreme (red). A separate category (blue) shows locations where the structures will be below mean sea level (MSL) in 2100 (the assumed time at which the SLR reaches 7 ft.). (https://crc-uri.maps.arcgis.com/apps/MapSeries/index.html?appid=3ba5c4d9c0744392bec2f4afb6ee2286, accessed on 6 February 2020).
Jmse 08 00129 g006
Figure 7. User workflow—three steps: Location, Context, and Details.
Jmse 08 00129 g007
Figure 8. Overview of the App, proceeding from the input to the results (left to right).
Jmse 08 00129 g008
Figure 9. Location of the residential structure test site (circled in red) along the southern RI coast adjacent to Green Hill Pond.
Jmse 08 00129 g009
Figure 10. CERI risk to individual structures map showing the location of the structure of interest (blue square) in the vicinity of Green Hill Pond. The insert shows the projected damage to the structure for 100 y storm with no SLR (SLR0).
Jmse 08 00129 g010
Figure 11. Location of the residential structure test site (circled in red) on North Main Street, Warren, RI, adjacent to the Rte 114 bridge over the Warren River.
Jmse 08 00129 g011
Figure 12. CERI risk to individual structures map, showing the location of the structure (blue square) on North Main Street, Warren, RI, adjacent to the Rte 114 bridge over the Warren River. The insert shows the projected damage to the structure for 100 yr storm with no SLR.
Jmse 08 00129 g012
Table 1. BFE and percent (%) damage vs. sea level rise for selected structure at location near Green Hill Pond.
Location:41.3626 N71.6239 W---
Grade Elevation (ft, NAVD88)3.7-----
VariableSea Level Rise (ft)----
Base Flood Elevations (BFE)0235710
FEMA BFE (ft, NAVD88)14-----
SDE BFE (ft, NAVD88)14.417.8319.5722.9726.3831.59
Structure TypeStructural Damage (%)---
5B (2 story, no basement)- 3ft FFE43.1754.38100100100100
6B (2 story, with basement)- 3ft FFE58.665.85100100100100
7B (pile supported - open)- 9ft FFE30.350.3100100100100
Table 2. BFE and percent (%) damage vs. sea level rise for the selected structure North Main Street, Warren, RI.
Location:41.7368 N71.2868 W---
Grade Elevation (ft, NAVD88)5.19-----
VariableSea Level Rise (ft)----
Base Flood Elevations (BFE)0235710
FEMA BFE (ft, NAVD88)13-----
SDE BFE (ft, NAVD88)15.4417.8419.0621.4523.827.26
Structure TypeStructural Damage (%)----
5B (2 story, no basement)- 4ft FFE32.6843.4846.8859.5270.1100
5B (2 story, no basement)- 3ft FFE38.0948.854.264.8275.36100
6B (2 story, with basement)- 4ft FFE47.5958.4562.4668.878.6100
6B (2 story, with basement)- 3ft FFE53.4962.4665.7472.587.17100

