Article

Numerical Analysis of NOx Reduction Using Ammonia Injection and Comparison with Water Injection

by
María Isabel Lamas Galdo
1,*,
Laura Castro-Santos
1 and
Carlos G. Rodriguez Vidal
2
1
Escola Politécnica Superior, Universidade da Coruña, 15403 Ferrol, Spain
2
Norplan Engineering S.L., 15570 Naron, Spain
*
Author to whom correspondence should be addressed.
J. Mar. Sci. Eng. 2020, 8(2), 109; https://doi.org/10.3390/jmse8020109
Submission received: 8 January 2020 / Revised: 6 February 2020 / Accepted: 7 February 2020 / Published: 11 February 2020
(This article belongs to the Special Issue Marine Engines Performance and Emissions)

Abstract

:
This work analyzes NOx reduction in a marine diesel engine using ammonia injection directly into the cylinder and compares this procedure with water injection. A numerical model based on the so-called inert species method was applied. It was verified that ammonia injection can provide almost 80% NOx reduction for the conditions analyzed. Furthermore, it was found that the effectiveness of the chemical effect using ammonia is extremely dependent on the injection timing. The optimum NOx reduction was obtained when ammonia is injected during the expansion stroke, while the optimum injection timing using water is near top dead center. Chemical, thermal, and dilution effects of both ammonia and water injection were compared. The chemical effect was dominant in the case of ammonia injection. On the other hand, water injection reduces NOx through dilution and, more significantly, through a thermal effect.

1. Introduction

Nowadays, diesel engines rule the transportation sector and power most of the ships in the world. These engines are efficient compared with other thermal machines but emit harmful species such as nitrogen oxides (NOx), soot, carbon dioxide (CO2), sulfur oxides (SOx), carbon monoxide (CO), and non-burnt hydrocarbons (HC). Between these, NOx is a harmful component that must be reduced since it produces acidification of rain, photochemical smog, greenhouse effects, ozone depletion, and respiratory diseases. Several international, national, and regional policies have been developed to limit NOx and other pollutants. In the marine field, the European Commission and the Environmental Protection Agency limit emissions in the European Union and the United States, respectively. On an international level, the International Maritime Organization (IMO) maintains a comprehensive regulatory framework for shipping. In 1973, the IMO adopted Marpol 73/78, the International Convention for the Prevention of Pollution from Ships, designed to reduce marine pollution. In particular, Marpol Annex VI limits NOx emissions for marine ships depending on the manufacturing data, engine speed, and working geographical area.
Due to these increasingly restrictive regulations, several NOx reduction methods have been developed in recent years. One of them is the utilization of alternative fuels. The main alternative marine fuels may be found in two forms: liquid fuels including ethanol, methanol, bio-liquid fuel, and biodiesel; and gaseous fuels, including propane, hydrogen, and natural gas [1,2,3,4].
Operating under diesel, there are two procedures to reduce NOx, which are primary and secondary measures. The former reduces the amount of NOx during combustion, while the latter focuses on removing NOx from the exhaust gases through downstream cleaning techniques. It is well known that the main factors that influence NOx formation are the temperatures reached in the combustion process and the amount of time in which the combustion gases remain at high temperatures [5,6,7]. Based on this, primary measures focus on addressing these factors and reducing the concentrations of oxygen and nitrogen [8,9]. Well-known primary measures are exhaust gas recirculation (EGR), Miller timing, common rail, modification of injection and other parameters of the engine, and water addition. Water can be introduced as a fuel-water emulsion injected via the fuel valve, through separate nozzles or by humidifying the scavenge air. Despite the extensive research on primary measures along the recent years, a procedure to reduce NOx without decreasing emission of other pollutants and/or consumption has not effectively been developed. In this regard, secondary measures reduce NOx from the flue gas through downstream cleaning techniques. Many applications have been undertaken to reduce NOx by selective catalytic reduction (SCR) and selective non-catalytic reduction (SNCR). The disadvantages of SCR are its price, poor durability of catalysts, and deposition of particulate on the catalyst. These disadvantages are not present in SNCR, but this procedure is limited to a narrow temperature range with optimal temperatures that are much higher than those characteristic of flue gas from diesel engines [10]. This limitation constitutes a drawback for practical applications in exhaust gases from diesel engines. As SCR reducing agents, ammonia (NH3), urea, and cyanuric acid have been extensively employed. SNCR using ammonia, urea, and cyanuric acid are known as DeNOx [11,12], NOxOUT [13,14], and RAPRENO [15,16,17], respectively. Between these, this work focuses on NOx reduction using ammonia. The NOx reduction capabilities of ammonia were discovered in the seventies by Lyon [18], who found that ammonia selectively reduces NOx without a catalyst over the temperature range of 1100–1400 K. Typical exhaust gas temperatures from marine engines, around 300–450 °C [19], remain considerably lower than this optimal temperature range for NOx reduction. Comprehensive investigations have been reported about SNCR analyzing parameters such as temperature, the molar ratio (NH3/NO) [20], residence time, oxygen level, initial NOx, combustibles, and so on [21,22], verifying that the most important factor for NOx reduction is the temperature. Based on this result, Miyamoto et al. [23] proposed to reduce NOx emissions by injecting ammonia or urea directly into the cylinder. They found an optimum NOx reduction at injection timing 90° CA ATDC (crankshaft angle after top dead center), i.e., during the expansion stroke, under temperatures between 1100–1600 K. Nam and Gibbs [24] analyzed direct injection of urea and ammonia using a flow reactor which simulates a single cylinder diesel engine, while Nam and Gibbs [25] analyzed the influence of injection temperature, the molar ratio NH3/NO, residence time, and combustion products, focusing on kinetic parameters. Larbi and Bessrour [26] developed an analytical model to analyze ammonia injection and concluded that the temperature and thus injection timing is critical. In fact, if ammonia is injected near TDC (top dead center), it performs as a fuel instead of as a NOx reducing agent, since ammonia can also be employed as a fuel [27,28].
These aforementioned studies delivered interesting knowledge about ammonia injection, but an experimental analysis cannot provide complete information about the governing effects. In this regard, Computational Fluid Dynamics (CFD) offers an alternative method to analyze the performance and emissions on engines. In the field of medium and large marine engines, CFD is especially useful because an experimental setup is extremely expensive and a downscale model sometimes is not accurate enough. In particular, the so-called artificial inert species method allows us to investigate several chemical and physical effects separately. This method was initiated by Guo [29], who used an artificial inert component with the same properties as hydrogen to analyze the chemical, dilution and thermal effects of hydrogen addition on a HCCI engine. Voshtani et al. [30] and Neshat et al. [31] analyzed these chemical, dilution, and thermal effects on a blended fuel of isooctane and n-heptane. Subsequently, they studied these effects on reformer gas addition [32] and water addition [33].
This work presents a CFD analysis to study NOx reduction in a commercial marine engine, the Wärtsila 6 L 46. The NOx reduction procedure is based on ammonia injection during the expansion stroke. The artificial inert species method was applied to characterize thermal, dilution and chemical effects of ammonia injection. In addition, ammonia injection was compared with water (H2O) injection.

2. Materials and Methods

This section describes the engine analyzed and the numerical model employed to study the performance and emissions.

2.1. Description of the Engine Analyzed

As mentioned above, the engine analyzed is the Wärtsilä 6 L 46 (Wärtsilä Corporation, Finland) [34,35], diesel, six-cylinder, four-stroke, water-cooled, and turbocharged. Each cylinder of this engine has two intake and two exhaust valves and a fuel injector with 20 holes is situated at the center of the cylinder head. This is a direct injection engine, i.e., the fuel is injected directly into the cylinder. The injection pump provides injection pressures up to 1500 bar. Optionally, this engine includes the possibility to incorporate direct water injection (DWI) to incorporate water at 400 bar from an external pump unit to each injection. The injector is thus equipped with a dual nozzle with separate needles for water and fuel. This system was employed in the numerical model to simulate water or ammonia injection.
In the present work, a comprehensive analysis was performed in a Wärtsilä 6 L 46 installed on a tuna fishing vessel. Many parameters were characterized at different loads, such as in-cylinder pressure, consumption, indicated and effective power, scavenging air pressure and temperature, exhaust gas pressure and temperature, lubricating oil pressure and temperature, cooling water temperature, emissions, etc. Although this engine is designed to operate under heavy fuel oil, marine diesel oil operation is also possible. Since these data were taken on board and near the coast, marine diesel oil was employed. The viscosity and density of this fuel are 12.5 mm2/s and 885 kg/m3 at 15 °C and its sulfur content 0.89%. For instance, Figure 1 indicates the results of the in-cylinder pressure along the operating cycle, at 100% load. The engine performance analyzer MALIN 6000 was employed to characterize the in-cylinder pressure. This pressure transducer is connected to the bleed valve, located at the engine head, which acts as an indicator channel. It worth mentioning that the experimental pressure trace can be distorted due to pressure waves in the channel [36], and that no algorithm was applied to correct this drawback.
Other experimental data at different loads are indicated in Table 1. In particular, the speed, power, mean indicated pressure (MIP), maximum pressure, specific fuel consumption (SFC), and emissions. NOx, CO, HC, and CO2 emissions were analyzed using the Gasboard-3000 series (Wuhan Cubic) gas analyzers, particularly Gasboard-3030 for HC and Gasboard-3000 for NO, CO, and CO2. The load, speed, and SFOC were taken from the engine monitoring system.

2.2. Numerical Model

The open software OpenFOAM was employed in the present work. The mesh is indicated in Figure 2. In order to implement the movement of the piston and valves, a deforming mesh was used. In particular, Figure 2a represents the tridimensional mesh, Figure 2b a cross-section at BDC (bottom dead center), i.e., 180° or 540° CA ATDC, and Figure 2c a cross-section at TDC, i.e., 0° or 360° CA ATDC. Several meshes with different elements were tested in order to verify that the results are independent of the mesh size. Table 2 indicates the error obtained between experimental and numerical results of pressure and fractions using a mesh with 501,769 elements at BDC (mesh 1), as well as 802,527 elements (mesh 2) and 1,264,873 (mesh 3). As can be seen, there is no difference between the meshes 2 and 3. For this reason, the mesh 2 was chosen for the present work.
A new in-house solver was programmed using C++. Briefly, this solver is based on the RANS (Reynolds-averaged Navier Stokes) equations of conservation of mass, momentum, and energy. The k-ε turbulence model was chosen.
The standard Kelvin-Helmholtz and Rayleigh-Taylor breakup (KH-RT) model [37] was employed for fuel droplet breakup, and the Dukowicz model [38] for the heat-up and evaporation. A comprehensible analysis about the adequacy of breakup models can be found in the literature. Compared to other breakup models such as WAVE, TAB (Taylor Analogy Breakup), etc., the KH-RT model is more suitable for the high injection pressures that take place in diesel engines [39]. As indicated previously, ammonia and water injection were modeled through an injector equipped with a dual nozzle with separate needles for water/ammonia and fuel.
In order to solve the chemical kinetics, a reaction mechanism was programmed by adding the three kinetic schemes described in Section 2.1, Section 2.2 and Section 2.3 for combustion (131 reactions and 41 species), NOx formation (43 reactions and 20 species) and NOx reduction (131 reactions and 41 species), respectively. Several additional equations must be added to model chemical kinetics. Given a set of N species and m reactions, Equation (1), the local mass fraction of each species, fk, can be expressed by using Equation (2).
k = 1 N v k j M k k j k = 1 N v k j M k j = 1 , 2 ,     ,   m
t ( ρ f k ) + x i ( ρ u i f k ) = x i ( μ t S c t f k x i ) + S k
In the equations above, ρ is the density, u the velocity, v k j the stoichiometric coefficients of the reactant species Mk in the reaction j, v k j the stoichiometric coefficients of the product species Mk in the reaction j, Sct the turbulent Smidth number, and Sk the net rate of production of the species Mk by chemical reaction, given by the molecular weight multiplied by the production rate of the species, Equation (3).
S k = M W k d [ M k ] d t
where MWk is the molecular weight of the species Mk and [Mk] its concentration. The net progress rate is given by the production of the species Mk minus the destruction of the species Mk along the m reactions:
d [ M k ] d t = j = 1 m { ( v k j v k j ) [ k f j k = 1 N [ M k ] v k j k b j k = 1 N [ M k ] v k j ] }
where kfj and kfb are the forward and backward reaction rate constants for each reaction j.
The simulation started at 360° CA ATDC and the whole cycle was analyzed. The initial pressure was 1.31 bar, obtained from experimental measurements. Concerning boundary conditions, the intake valve pressure and temperature after the turbocharger were 2.72 bar and 514 K, respectively. The heat transfer from the cylinder to the cooling water was modeled as a combined convection-radiation type, Equation (5). Previous investigations [40] demonstrated the accuracy of this type of boundary condition in comparison with adiabatic or constant temperature:
q = h(TgasTwater)
where q is the heat transferred, Tgas the in-cylinder temperature, Twater the cooling water temperature (78 °C), and h the heat transfer coefficient, given by the following expression [41]:
h = 10.4 kb−1/4 (upiston/ν)3/4
where b is the cylinder bore, k the thermal conductivity of the gas, upiston the mean piston speed, and ν the kinematic viscosity of the gas. Substituting values into the above equation yields h = 4151 W/m2K.

2.2.1. Combustion Kinetic Scheme

The fuel was treated as n-heptane. The kinetic scheme of Ra and Reitz [42], based on 131 reactions and 41 species, was employed for combustion. Another common approach to treat combustion in CFD is to assume that the kinetics is so fast that chemical species remain at equilibrium due to the high temperatures. Nevertheless, previous works [43,44] indicated that a kinetic scheme is more accurate than the equilibrium hypothesis, since the cooling during the expansion process and dilution with the excess air elongates the time needed to achieve equilibrium. Indeed, several studies about diesel engines verified that the measured CO emissions are higher than those provided by the equilibrium concentrations. The reason is that one of the sources of CO in diesel engines are lean regions which are not able to burn properly [45,46]. This happens when the local turbulent and diffusion time scales are much smaller than the time required to achieve equilibrium. In these cases, the chemical equilibrium hypothesis leads us to overestimate the levels of the minor species. For these reasons, another procedure developed in the present work was the implementation of a chemical kinetic model. Figure 3 represents the CO and HC emissions experimentally and numerically obtained using chemical equilibrium and the kinetic model. As can be seen, the kinetic model improves the results. Regarding CO2 emissions, these remain practically inalterable so are not included in the figure. According to the improvement obtained using the kinetic model compared to the equilibrium assumption, the kinetic model developed by Ra and Reitz [42] was employed in the remainder of the present work.

2.2.2. NOx Formation Kinetic Scheme

The numerical model employs the kinetic scheme of Yang et al. [47], based on 43 reactions and 20 species. In CFD, it is common to employ the so called extended Zeldovich mechanism [48,49], based on 3 reactions and 7 species. Nevertheless, previous works [44,50] compared several kinetic schemes using experimental results and concluded that the model of Yang et al. provides satisfactorily accurate results.

2.2.3. NOx Reduction Kinetic Scheme

The kinetic scheme chosen for NOx reduction is the one proposed by Miller and Glarborg [51], based on 134 reactions and 24 species. The accuracy of this and other kinetic schemes was also compared with experimental measurements elsewhere [43,52], concluding that the model of Miller and Glarborg [51] provides satisfactorily accurate results.

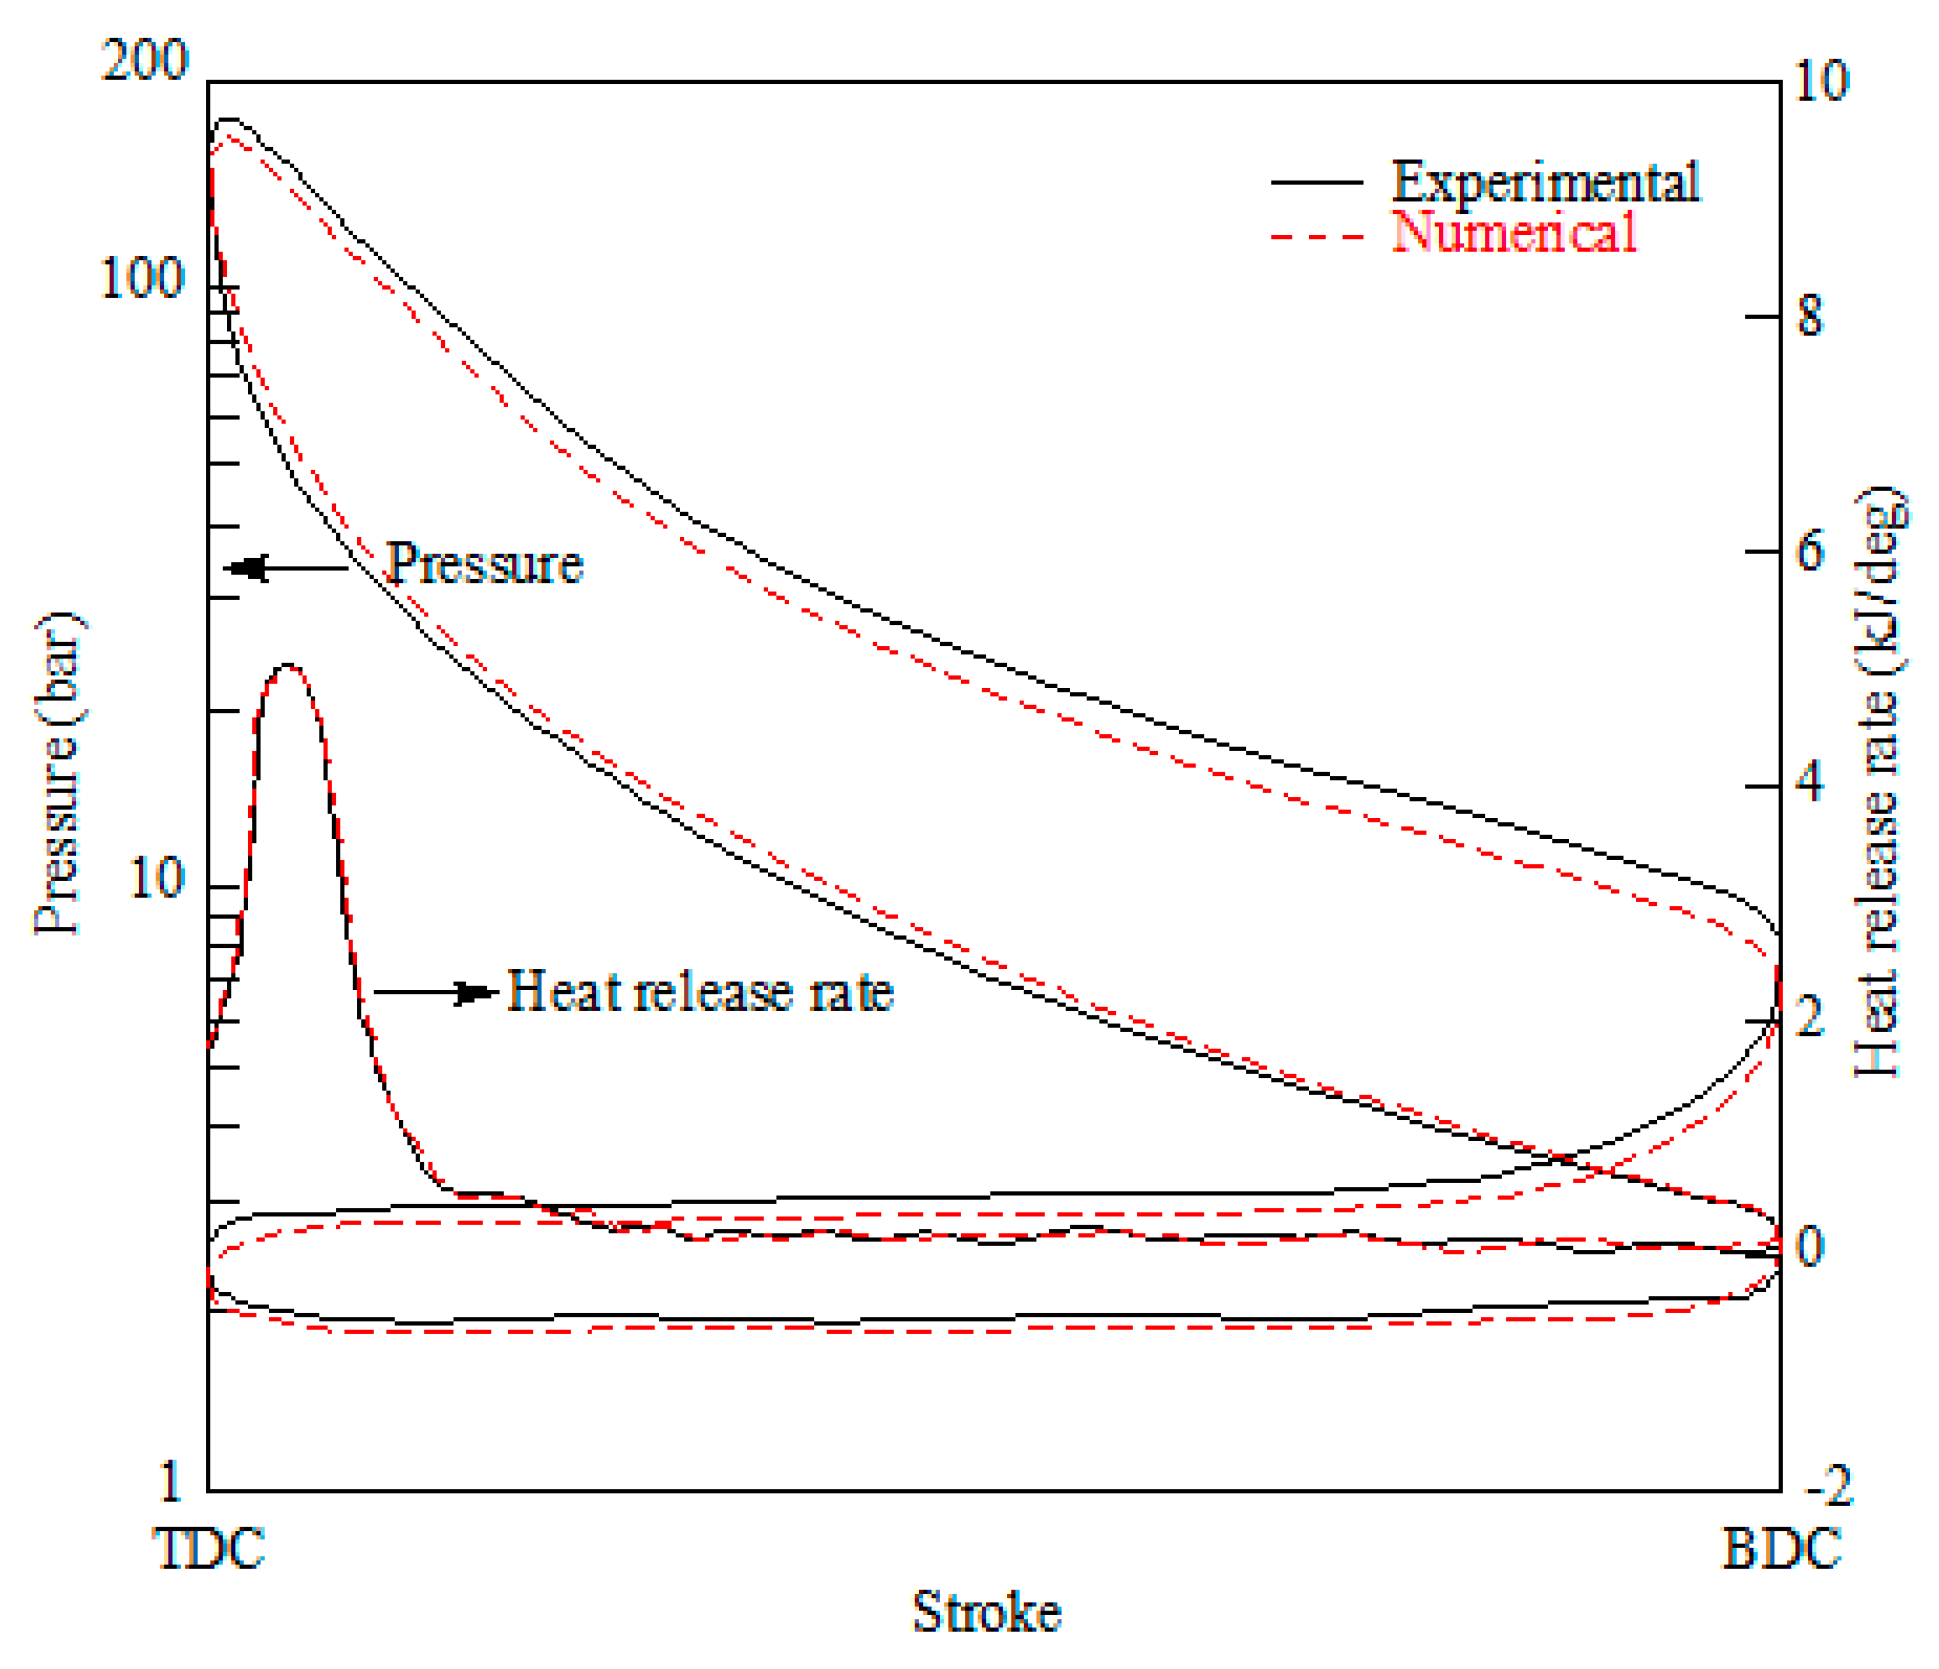
2.3. Validation of the Overall Numerical Model

The overall numerical model, summarized in Table 3, was validated using experimental measurements. The emissions and consumption obtained experimentally and numerically at several loads are shown in Figure 4. This figure includes CO, CO2, NOx, HC, and SFC. As can be seen, a reasonable correspondence between numerical and experimental results was obtained. The in-cylinder pressure obtained experimentally and numerically at 100% load is shown in Figure 5. This figure also indicates a satisfactory correspondence between experimental and numerical results. Other loads also provided satisfactory concordance between experimental and numerical results, and thus are not represented again.

3. Results and Discussion
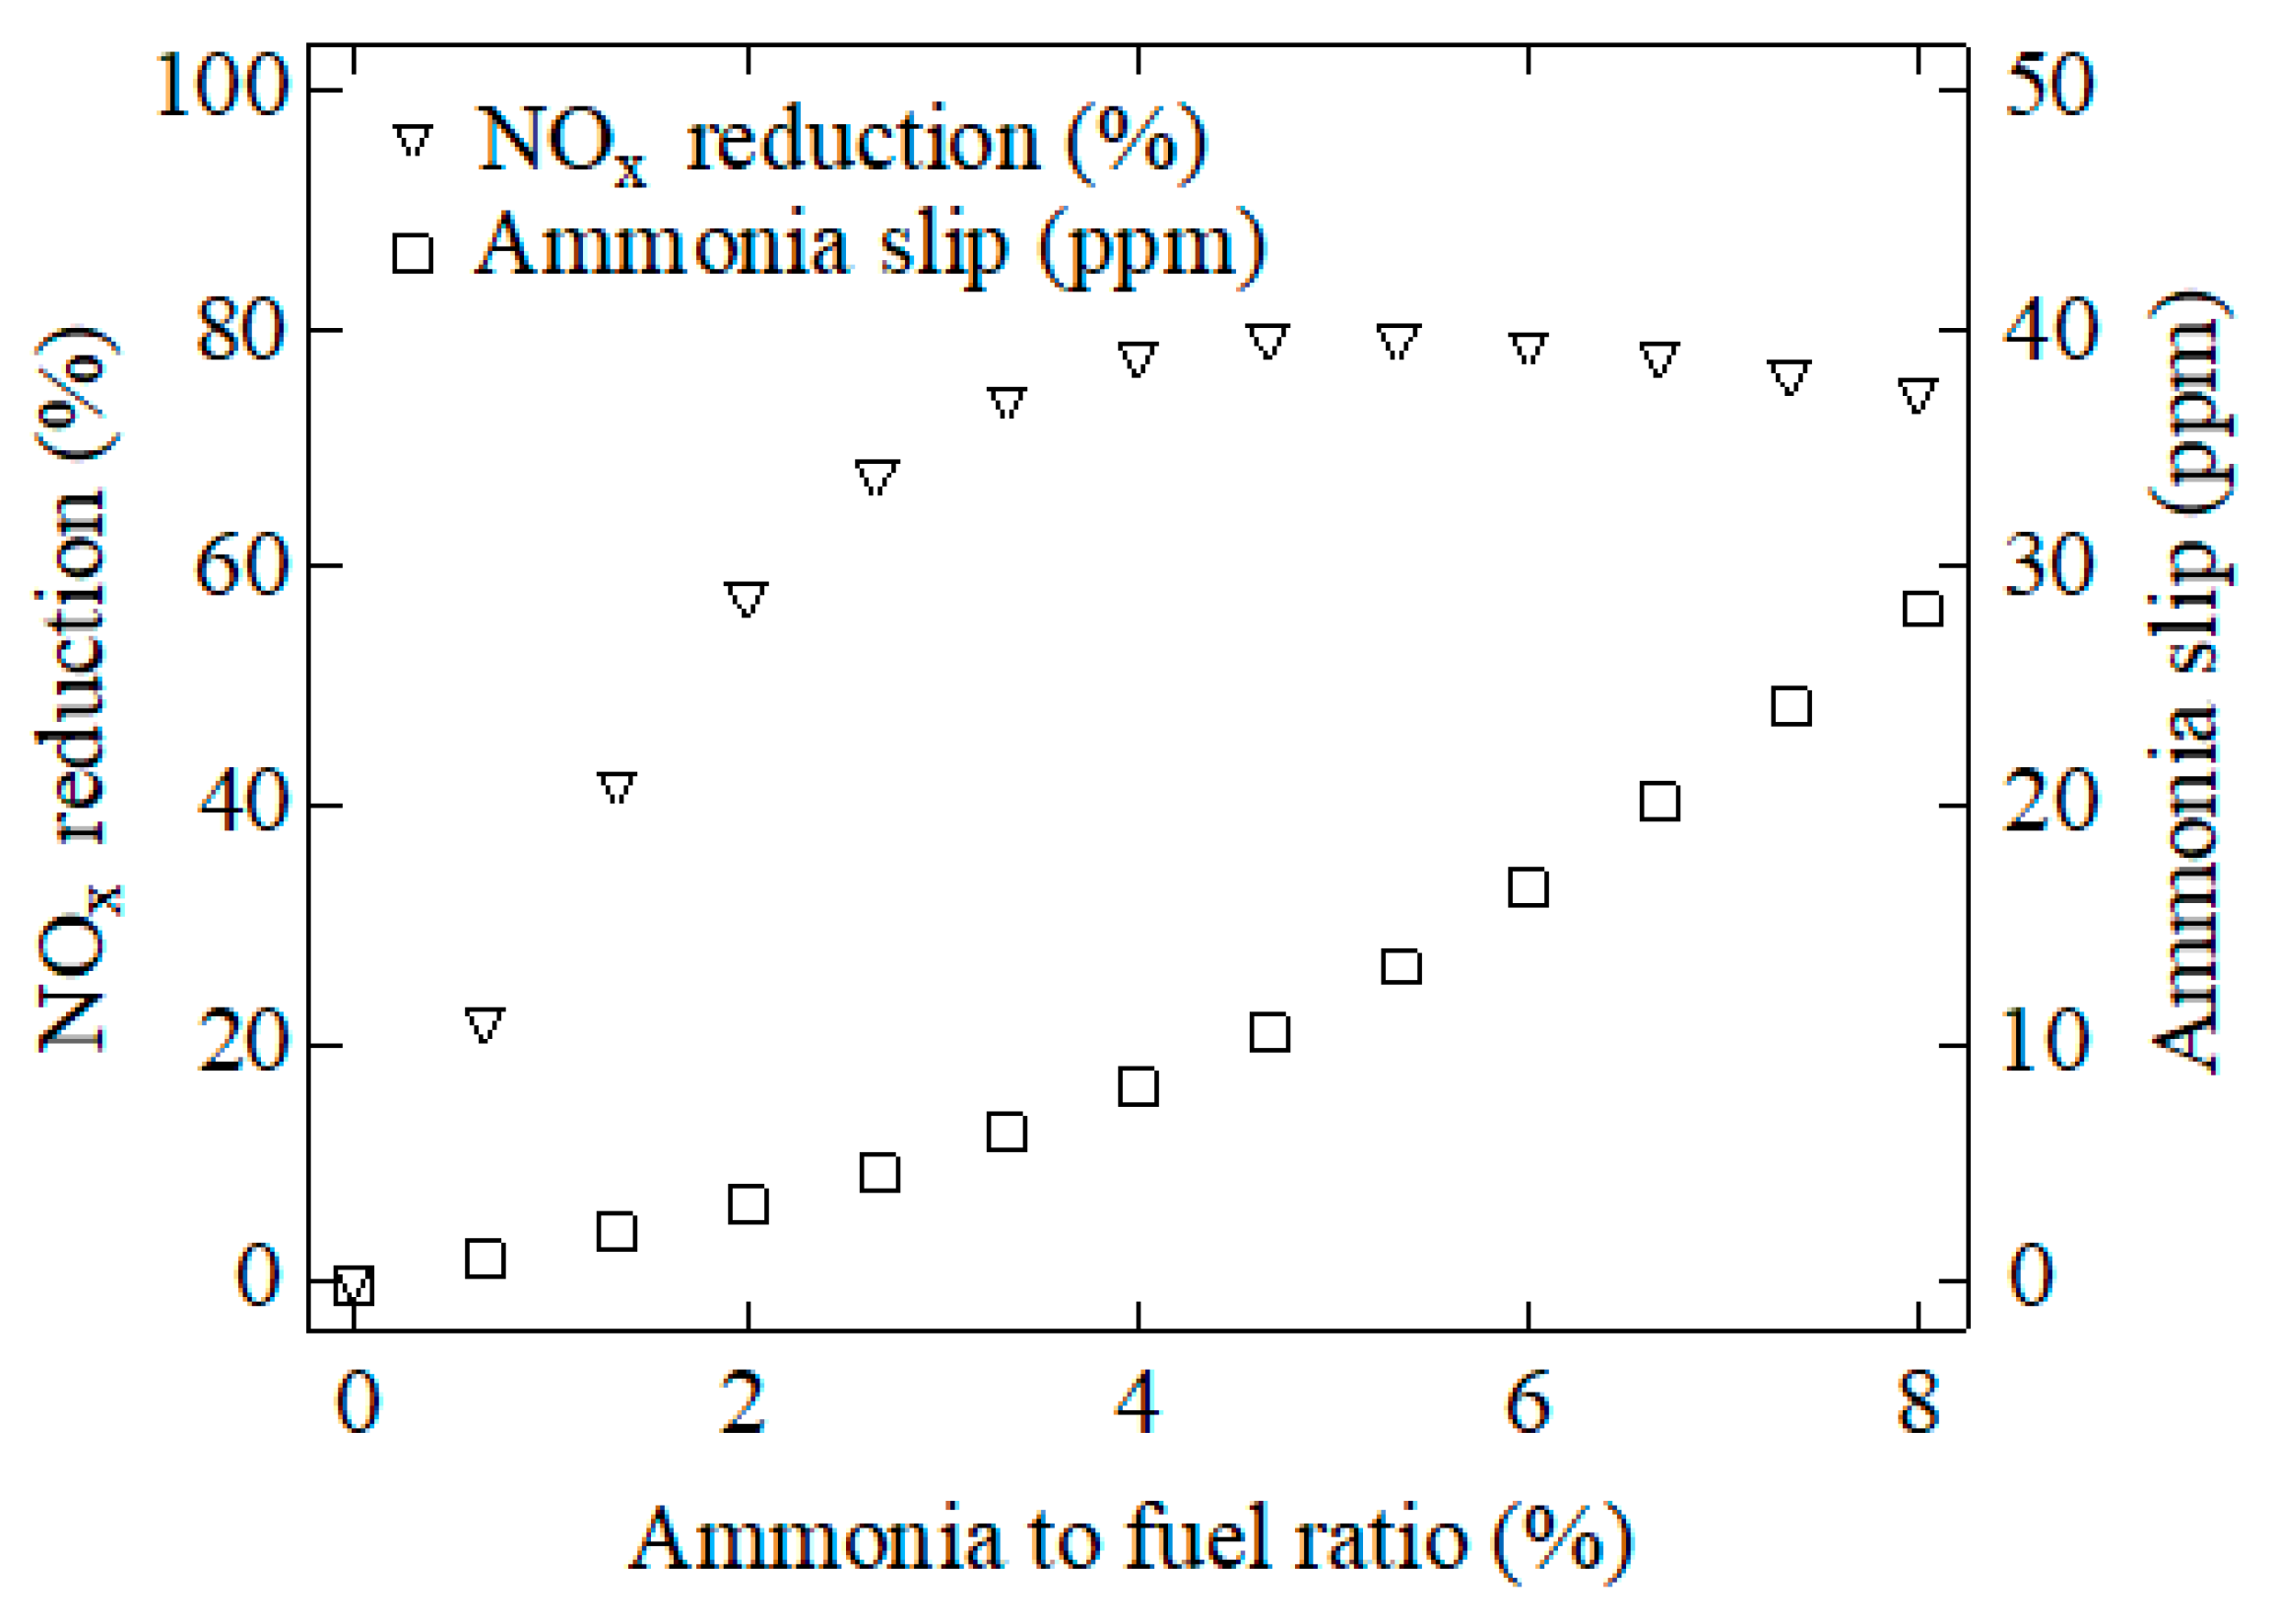
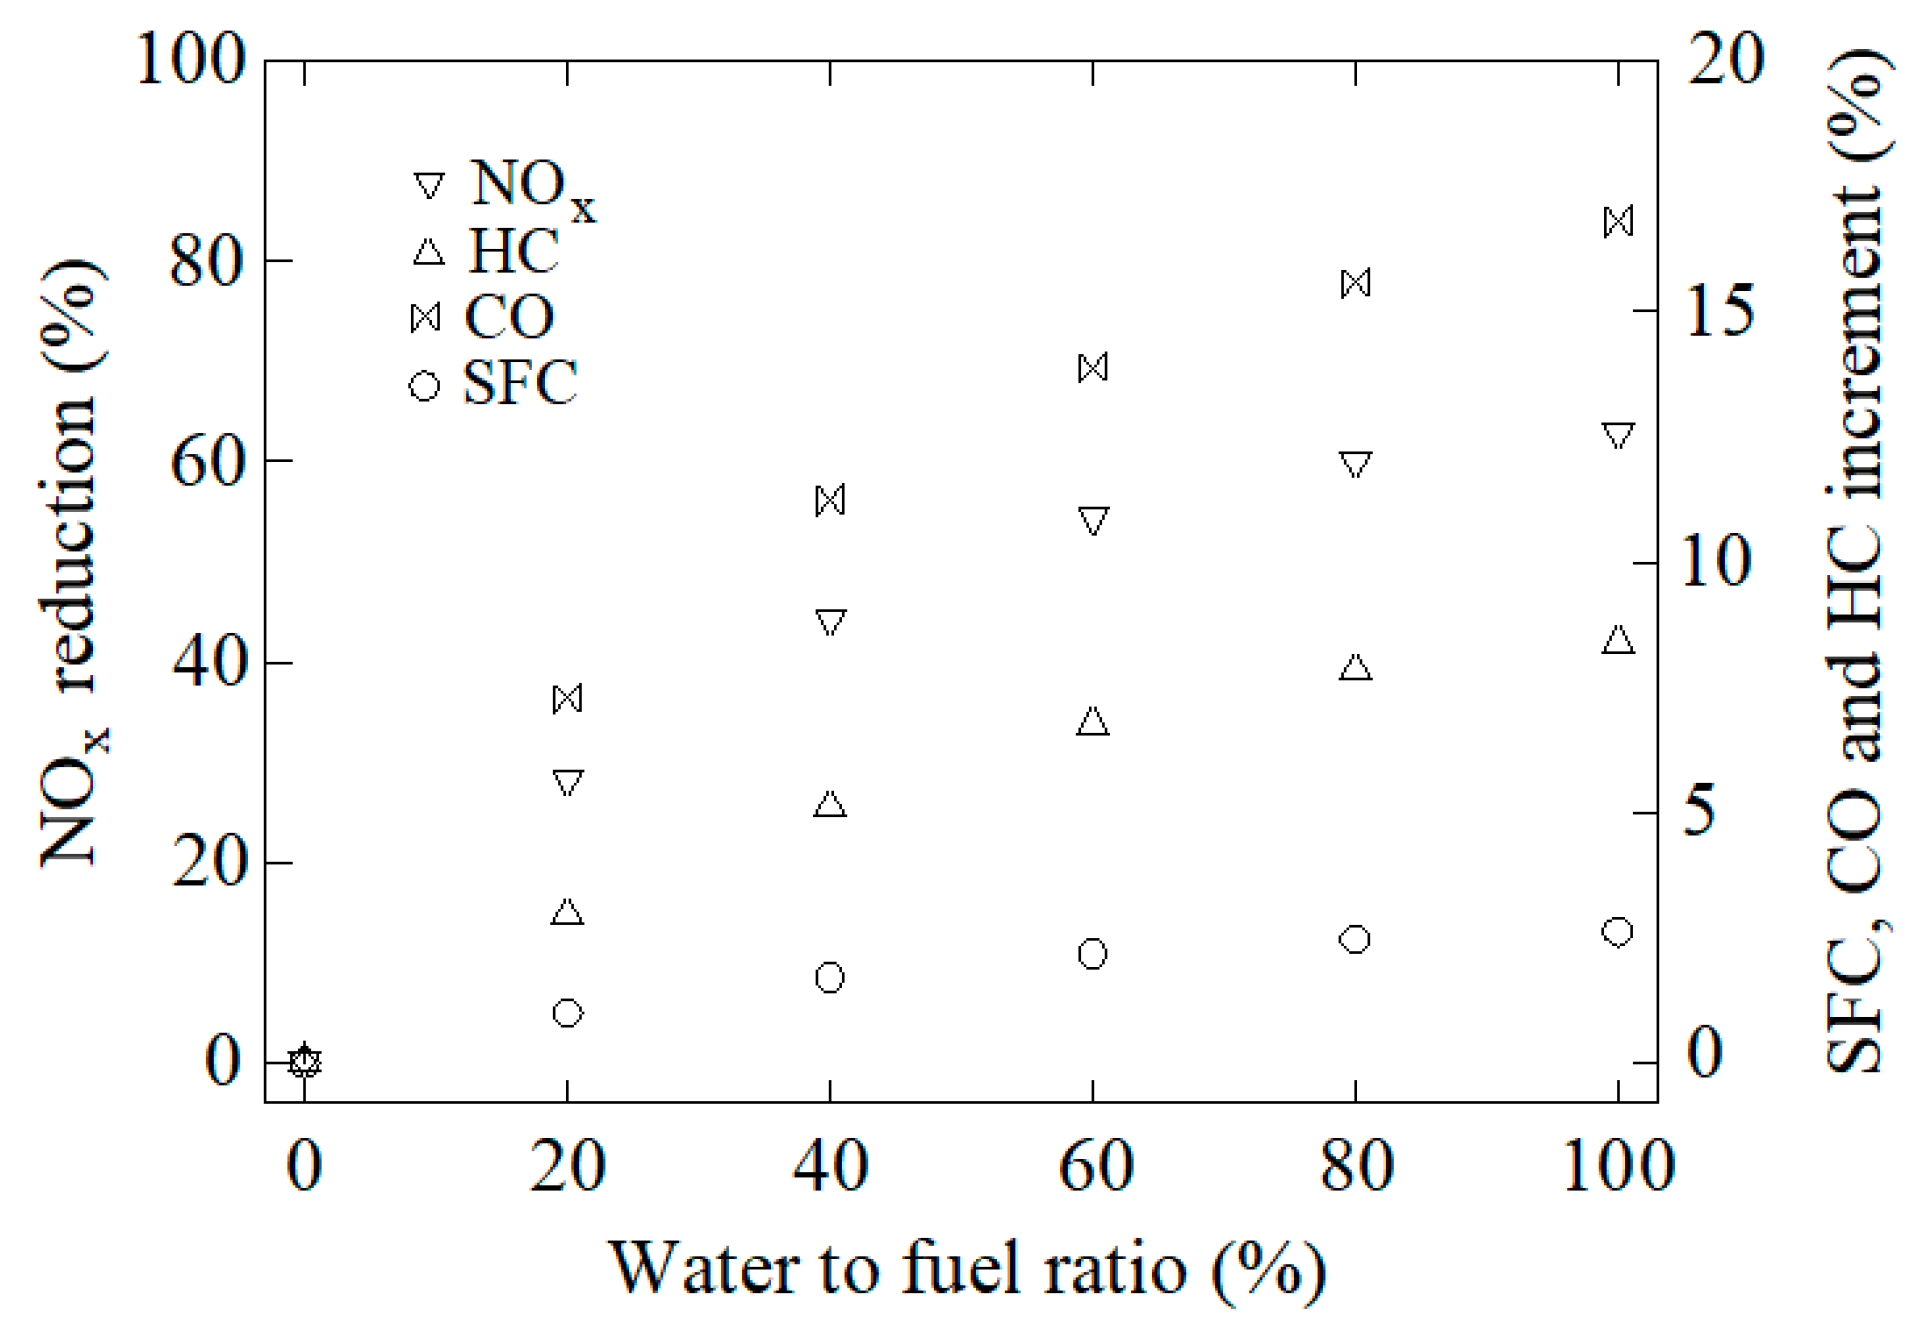
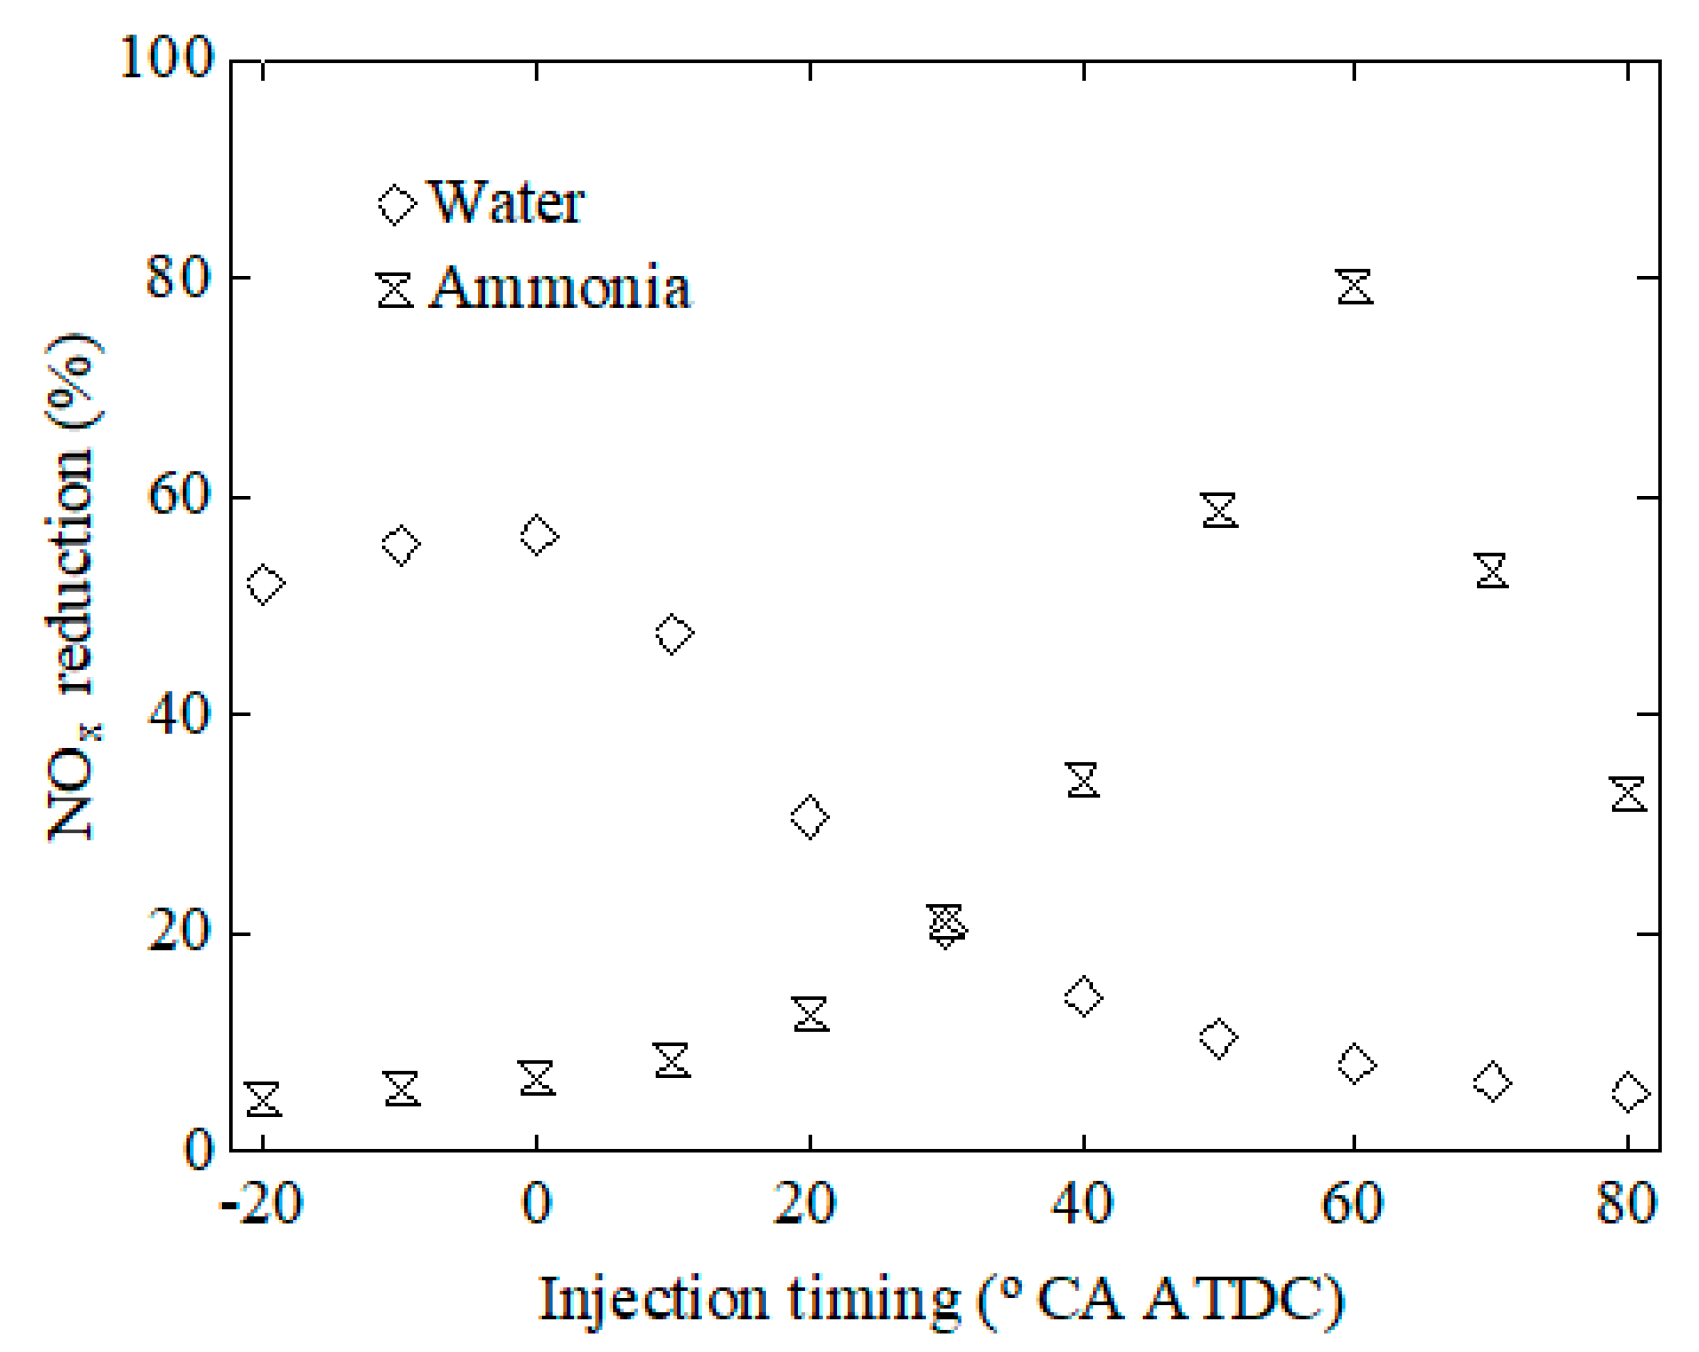
Once the numerical model was validated, it was employed to analyze NOx reduction through ammonia and water injection directly into the cylinder. This section presents the results obtained. First of all, results about NOx reduction are exposed and then results obtained from the artificial inert species method.

3.1. NOx Reduction

First of all, it is necessary to determine the appropriate quantity of ammonia and water. Regarding ammonia, its main disadvantage is the non-reacted ammonia slip in the exhaust gas. Ammonia is highly toxic, and thus it is important to maintain an un-reacted ammonia slip to the exhaust that is as low as possible. Figure 6 represents the NOx reduction as well as the ammonia slip in the exhaust gas against the ammonia to fuel ratio, Equation (7), at 100% load. In this figure, the ammonia injection took place 58.4° CA ATDC. This value was chosen because it provides the maximum NOx reduction, as will be shown below. The effect on CO, HC, and SFC remained practically negligible, so these are not represented in this figure. As can be seen, NOx reduction improves with the ammonia to fuel ratio, with a tendency to level off around 4%. Ammonia to fuel ratios higher than 3% provide a few additional NOx reductions with a considerable increment of un-reacted ammonia emitted to the atmosphere, and NOx reduction drops again for higher ratios since ammonia itself oxidizes to NO. For this reason, an ammonia to fuel ratio of 4% was employed in the remainder of the present work.
Ammonia   to   fuel   ratio   ( % ) = mass   of   ammonia mass   of   fuel 100
As indicated previously, the present work focuses on water injection through a dual nozzle with separated needles for water and fuel. Using this DWI system, typical water to fuel ratios, Equation (8), in practical applications are within the range 40%–70% [20]. Figure 7 shows the NOx reduction, as well as the effect on SFC, CO, and HC for water to fuel ratios from 0 to 100% at 100% load. As can be seen in this figure, the water to fuel ratio improves NOx reduction, but increments both consumption and emissions of CO and HC. For this reason and taking into account usual practical applications, a water to fuel ratio of 70% was employed in the remainder of the present work.
Water   to   fuel   ratio   ( % ) = mass   of   water mass   of   fuel 100
Figure 8 shows the effect of the injection timing on NOx reduction. Ammonia and water were compared using 4% ammonia to fuel ratio and 70% water to fuel ratio. As can be seen in this figure, using water injection a maximum 57.1% NOx reduction was obtained at −2.1° CA ATDC. On the other hand, if ammonia is injected around TDC, then the NOx reduction is considerably smaller than when using a water injection. Nevertheless, at 58.4° CA ATDC, NOx reduction reaches 78.1% using ammonia. As mentioned in the introduction, NOx reduction using ammonia is very sensitive to the temperature. Injected near TDC, ammonia is not efficient due to the excessive in-cylinder temperatures. Nevertheless, at 58.4° CA ATDC, the in-cylinder temperatures reduce to the optimal values required for NOx reduction using ammonia. Instead of 100% loads, at lower loads the in-cylinder temperatures are lower too and thus the optimum injection time takes place before 58.4° CA ATDC.
Figure 9 shows the maximum temperature for the base case without a water or ammonia injection, with a 4% ammonia to fuel ratio and with a 70% water to fuel ratio at 100% load. In these simulations, both ammonia and water were injected at −2.1° CA ATDC. As can be seen, water promotes a reduction in the combustion temperatures. The maximum temperature is lowered 93.2 °C if 70% water is injected at −2.1° CA ATDC. On the other hand, ammonia increases the maximum temperature 8.4 °C if this is injected at −2.1° CA ATDC. This explains the effect on CO, HC, and SFC. As indicated above, ammonia has a negligible effect on these parameters and water increases them. Water reduces the combustion temperature due to the increment in the specific heat capacity of the cylinder gases (water has higher specific heat capacity than air) and lowers the concentration of oxygen, which reduces the availability of oxygen for the NOx forming reactions. The main effect is a reduction in NOx emissions due to the lower temperatures, but water injection also promotes incomplete combustion and thus increases both CO and HC emissions as well as SFC. SFC is increased due to the lower pressures, which promotes lower power. On the other hand, when injected near TDC, ammonia acts as a fuel and slightly increases the combustion temperature with a negligible effect on CO, HC and SFC. In the next section, the chemical effect of water and ammonia will be analyzed too using the artificial inert species method.

3.2. Artificial Inert Species Method

In this section the so-called artificial inert species method [29,30,31,32,33] is applied to analyze the chemical, thermal, and dilution effects of both ammonia and water injection. The chemical effect is promoted by the chemical reactions. The thermal effect is promoted by the properties, specially the high specific heat capacity of ammonia and water which increases the heat absorption. The dilution effect is promoted by the presence of the additive, which reduces the possibility of reaction between fuel and air.
In the case of water injection, two artificial species were added: inertH2O and inertAIR. The species inertH2O has the same properties as water but does not participate in the chemical reactions. On the other hand, the species inertAIR has the same properties as air but does not participate in the chemical reactions. According to this, the difference between the results using water and inertH2O represents the chemical effect. The dilution effect of water injection is represented by the difference between the results using inertAIR and the base case without water. Finally, the difference between the results using inertH2O and inertAIR leads to the thermal effect of water injection. Figure 10 illustrates the contribution of thermal, dilution, and chemical effects of water injection for a water injection timing of −2.1° CA ATDC at a 100% load. As can be seen, the chemical effect is negligible. Water injection reduces NOx by the dilution and, more significantly, thermal effects. The thermal effect is important since water absorbs heat due to its high specific heat capacity. Since water has a higher specific heat capacity than air, the specific heat capacity of the cylinder gases is increased, leading to a reduction in the in-cylinder temperature and thus to the NOx emissions. Figure 10 also illustrates the importance of the dilution effect. The presence of water reduces the interaction between fuel and air and thus deteriorate the combustion process.
In the case of ammonia injection, two artificial species were added: inertNH3 and inertAIR. The species inertNH3 has the same properties as ammonia but does not participate in the chemical reactions. On the other hand, the species inertAIR has the same properties as air but does not participate in the chemical reactions. According to this, the difference of the results using ammonia and inertNH3 represents the chemical effect of ammonia injection. The dilution effect of ammonia injection is represented by the difference between the results using inertAIR and the base case without ammonia. Finally, the difference between the results using inertNH3 and inertAIR leads to the thermal effect of ammonia. Figure 11 illustrates the contribution of thermal, dilution, and chemical effects of ammonia injection for an ammonia injection timing of 58.4° CA ATDC at 100% load. As can be seen, the chemical effect is the only one responsible for NOx reduction, while the thermal and dilution effects are negligible.
If ammonia is injected near TDC, particularly at −2.1° CA ATDC, the NOx reduction is noticeably lower, Figure 12. The thermal and dilution effects become more important and the chemical effect is reduced.

4. Conclusions

This work presents a CFD analysis to study NOx reduction in a commercial marine engine, the Wärtsila 6 L 46. The NOx reduction is based on ammonia injection directly into the cylinder, and this measure was compared with water injection. The so-called artificial inert species method was employed. Inert species with the same properties of water, ammonia, and air were used to characterize the chemical, thermal, and dilution effects of water and ammonia injection.
It was found that the chemical effect using ammonia injection is extremely dependent on the injection timing. The optimum NOx reduction using ammonia is obtained when this is injected during the expansion stroke, leading to a significant chemical effect, and negligible thermal and dilution effects. The optimum NOx reduction using water is obtained when this is injected near TDC. Injected near TDC, water promotes NOx reduction by the dilution and, more significantly, the thermal effect. If ammonia is injected near TDC, the thermal and dilution effects become more significant but the global NOx reduction is noticeably lower than the values obtained when using water.

Author Contributions

Conceptualization, M.I.L.G. and C.G.R.V.; methodology, M.I.L.G. and C.G.R.V.; software, M.I.L.G. and C.G.R.V.; validation, M.I.L.G. and C.G.R.V.; formal analysis, M.I.L.G. and L.C.-S.; investigation, M.I.L.G. and C.G.R.V.; resources, M.I.L.G. and C.G.R.V.; writing—original draft preparation, M.I.L.G. and L.C.-S.; writing—review and editing, M.I.L.G. and L.C.-S. All authors have read and agreed to the published version of the manuscript.

Funding

This research received no external funding.

Acknowledgments

The authors would like to express their gratitude to Talleres Pineiro S.L., sale and repair of marine engines, as well as to Norplan Engineering S.L.

Conflicts of Interest

The authors declare no conflict of interest.

References

  1. Ammar, N.R.; Seddiek, I.S. Eco-environmental analysis of ship emission control methods: Case study RO-RO cargo vessel. Ocean Eng. 2017, 137, 166–173. [Google Scholar] [CrossRef]
  2. Seddiek, I.S.; ElGohary, M.M.; Ammar, N.R. The hydrogen-fuelled internal combustion engine for marine application with a case study. Brodogradnja 2015, 66, 23–38. [Google Scholar]
  3. ElGohary, M.M.; Seddiek, I.S. Utilization of alternative marine fuels for gas turbine power plant onboard ships. Int. J. Naval Archit. Ocean Eng. 2013, 5, 21–32. [Google Scholar] [CrossRef] [Green Version]
  4. Lamas, M.I.; Rodríguez, C.G.; Telmo, J.; Rodríguez, J.D. Numerical analysis of emissions from marine engines using alternative fuels. Polish Marit. Res. 2015, 22, 48–52. [Google Scholar] [CrossRef] [Green Version]
  5. Kuiken, K. Diesel Engines for Ship Propulsion and Power Plants, 3rd ed.; Target Global Energy Training: The Netherlands, 2017. [Google Scholar]
  6. Di Sarli, V. Stability and emissions of a lean pre-mixed combustor with rich catalytic/lean-burn pilot. Int. J. Chem. React. Eng. 2014, 12, 77–89. [Google Scholar] [CrossRef]
  7. Sencic, T.; Mrzljak, V.; Blecich, P.; Bonefacic, I. 2D CFD simulation of water injection strategies in a large marine engine. J. Mar. Sci. Eng. 2019, 7, 296. [Google Scholar] [CrossRef] [Green Version]
  8. Lamas, M.I.; Rodríguez, C.G.; Rodríguez, J.D.; Telmo, J. Internal modifications to reduce pollutant emissions from marine engines. A numerical approach. Int. J. Naval Archit. Mar. Eng. 2013, 5, 493–501. [Google Scholar] [CrossRef] [Green Version]
  9. Lamas, M.I.; Rodríguez, C.G.; Aas, H.P. Computational fluid dynamics analysis of NOx and other pollutants in the MAN B&W 7S50MC marine engine and effect of EGR and water addition. Int. J. Marit. Eng. 2013, 155, A81–A88. [Google Scholar]
  10. Puskar, M.; Bigos, P.; Balazikova, M.; Petkova, V. The measurement method solving the problems of engine output characteristics caused by change in atmospheric conditions on the principle of the theory of optimal temperature range of exhaust system. Meas. J. Int. Meas. Confed. 2013, 46, 467–475. [Google Scholar] [CrossRef]
  11. Rota, R.; Zanoelo, E.F.; Antos, D.; Morbidelli, M.; Carra, S. Analysis of the thermal DeNOx process at high partial pressure of reactants. Chem. Eng. Sci. 2000, 55, 1041–1051. [Google Scholar] [CrossRef]
  12. Glarborg, P.; Dam-Johansen, K.; Miller, J.A.; Kee, R.J.; Coltrin, M.E. Modeling the thermal DeNOx process in flow reactors. Surface effects and nitrous oxide formation. Int. J. Chem. Kinet. 1994, 26, 421–436. [Google Scholar] [CrossRef]
  13. Rota, R.; Antos, D.; Zanoelo, E.F.; Morbidelli, M. Experimental and modeling analysis of the NOxOUT process. Chem. Eng. Sci. 2002, 57, 27–38. [Google Scholar] [CrossRef]
  14. Birkhold, F.; Meinghast, U.; Wassermann, P. Analysis of the Injection of Urea-Water-Solution for Automotive SCR DeNOx-Systems: Modeling of Two-Phase Flow and Spray/Wall Interaction; SAE Technical Paper 2006-01-0643; SAE International: Warrendale, PA, USA, 2006. [Google Scholar] [CrossRef] [Green Version]
  15. Javed, M.T.; Irfan, N.; Gibbs, B.M. Control of combustion-generated nitrogen oxides by selective non-catalytic reduction. J. Environ. Manag. 2007, 83, 251–289. [Google Scholar] [CrossRef] [PubMed]
  16. Caton, J.A.; Xia, Z. The selective non-catalytic removal (SNCR) of nitric oxides from engine exhaust streams: Comparison of three processes. Trans. ASME 2004, 126, 234–240. [Google Scholar] [CrossRef]
  17. Miller, J.A.; Bowman, C. Mechanism and modeling of nitrogen chemistry in combustion. Prog. Energy Combust. Sci. 1989, 15, 287–338. [Google Scholar] [CrossRef]
  18. Lyon, R.K. Method for the Reduction of the Concentration of NO in Combustion Effluents Using Ammonia. U.S. Patent 3,900,554, 19 August 1975. [Google Scholar]
  19. Woodyard, D. Pounder’s Marine Engines and Gas Turbines, 9th ed.; Elsevier: Oxford, UK, 2009. [Google Scholar]
  20. Kimball-Linne, M.A.; Hanson, R.K. Combustion-driven flow reactor studies of thermal DeNOx reaction kinetics. Combust. Flame 1986, 64, 337–351. [Google Scholar] [CrossRef]
  21. Lyon, R.K.; Benn, D. Kinetics of the NO-NH3-O2 reaction. Symp. Combust. 1979, 17, 601–610. [Google Scholar] [CrossRef]
  22. Kasuya, F.; Glarborg, P.; Johnsson, J.E.; Dam-Johansen, K. The thermal DeNOx process: Influence of partial pressures and temperature. Chem. Eng. Sci. 1995, 50, 1455–1466. [Google Scholar] [CrossRef]
  23. Miyamoto, N.; Ogawa, H.; Wang, J.; Shudo, T.; Yamazaki, K. Diesel NOx reduction with ammonium deoxidizing agents directly injected into the cylinder. Int. J. Veh. Des. 1995, 16, 71–79. [Google Scholar] [CrossRef]
  24. Nam, C.M.; Gibbs, B.M. Selective non-catalytic reduction of NOx under diesel engine conditions. Proc. Combust. Inst. 2000, 28, 1203–1209. [Google Scholar] [CrossRef]
  25. Nam, C.M.; Gibbs, B.M. Application of the thermal DeNOx process to diesel engine DeNOx: An experimental and kinetic modelling study. Fuel 2002, 81, 1359–1367. [Google Scholar] [CrossRef]
  26. Larbi, N.; Bessrour, J. Measurement and simulation of pollutant emissions from marine diesel combustion engine and their reduction by ammonia injection. Adv. Mech. Eng. 2010, 41, 898–906. [Google Scholar] [CrossRef]
  27. Heywood, J. Internal Combustion Engine Fundamentals, 2nd ed.; McGraw-Hill Education: New York, NY, USA, 2018. [Google Scholar]
  28. Lesmana, H.; Zhang, Z.; Li, X.; Zhu, M.; Xu, X.; Zhang, D. NH3 as a transport fuel in internal combustion engines: A technical review. J. Energy Resour. Technol. 2019, 141, 070703–070714. [Google Scholar] [CrossRef]
  29. Guo, H.; Neill, W.S. The effect of hydrogen addition on combustion and emission characteristics of an n-heptane fueled HCCI engine. Int. J. Hydrog. Energy 2013, 38, 11429–11437. [Google Scholar] [CrossRef] [Green Version]
  30. Voshtani, S.; Reyhanian, M.; Ehteram, M.; Hosseini, V. Investigating various effects of reformer gas enrichment on a natural gas-fueled HCCI combustion engine. Int. J. Hydrog. Energy 2014, 39, 19799–19809. [Google Scholar] [CrossRef]
  31. Neshat, E.; Saray, R.K.; Hosseini, V. Effect of reformer gas blending on homogeneous charge compression ignition combustion of primary reference fuels using multi zone model and semi detailed chemical-kinetic mechanism. Appl. Energy 2016, 179, 463–478. [Google Scholar] [CrossRef]
  32. Neshat, E.; Saray, R.K.; Parsa, S. Numerical analysis of the effects of reformer gas on supercharged n-heptane HCCI combustion. Fuel 2017, 200, 488–498. [Google Scholar] [CrossRef]
  33. Neshat, E.; Bajestani, A.V.; Honnery, D. Advanced numerical analyses on thermal, chemical and dilution effects of water addition on diesel engine performance and emissions utilizing artificial inert species. Fuel 2019, 242, 596–606. [Google Scholar] [CrossRef]
  34. Lamas, M.I.; Rodríguez, C.G.; Rebollido, J.M. Numerical model to study the valve overlap period in the Wärtsilä 6L46 four-stroke marine engine. Polish Marit. Res. 2012, 19, 31–37. [Google Scholar] [CrossRef]
  35. Lamas, M.I.; Rodríguez, C.G. Numerical model to study the combustion process and emissions in the Wärtsilä 6L 46 four-stroke marine engine. Polish Marit. Res. 2013, 20, 61–66. [Google Scholar] [CrossRef] [Green Version]
  36. Polanowski, S.; Pawletko, R.; Witkowski, K. Influence of the indicator channel and indicator valve on the heat release characteristics of medium speed marine diesel engines. Key Eng. Mater. 2014, 588, 149–156. [Google Scholar] [CrossRef]
  37. Ricart, L.M.; Xin, J.; Bower, G.R.; Reitz, R.D. In-Cylinder Measurement and Modeling of Liquid Fuel Spray Penetration in a Heavy-Duty Diesel Engine; SAE Technical Paper 971591; SAE International: Warrendale, PA, USA, 1997. [Google Scholar] [CrossRef]
  38. Dukowicz, J.K. A particle-fluid numerical model for liquid sprays. J. Comput. Phys. 1980, 35, 229–253. [Google Scholar] [CrossRef]
  39. Weber, J. Optimization Methods for the Mixture Formation and Combustion Process in Diesel Engines, 1st ed.; Cuvillier Velag: Göttingen, Germany, 2008. [Google Scholar]
  40. Sigurdsson, E.; Ingvorsen, K.M.; Jensen, M.V.; Mayer, S.; Matlok, S.; Walther, J.H. Numerical analysis of the scavenge flow and convective heat transfer in large two-stroke marine diesel engines. Appl. Energy 2014, 123, 37–46. [Google Scholar] [CrossRef]
  41. Taylor, C.F. The Internal Combustion Engine in Theory and Practice, 2nd ed.; MIT Press: Cambridge, MA, USA, 1985. [Google Scholar]
  42. Ra, Y.; Reitz, R. A reduced chemical kinetic model for IC engine combustion simulations with primary reference fuels. Combust. Flame 2008, 155, 713–738. [Google Scholar] [CrossRef]
  43. Lamas, M.; Rodriguez, C.G. Numerical model to analyze NOx reduction by ammonia injection in diesel-hydrogen engines. Int. J. Hydrog. Energy 2017, 42, 26132–26141. [Google Scholar] [CrossRef]
  44. Lamas, M.I.; de Dios Rodriguez, J.; Castro-Santos, L.; Carral, L.M. Effect of multiple injection strategies on emissions and performance in the Wärtsilä 6L 46 marine engine. A numerical approach. J. Clean. Prod. 2019, 206, 1–10. [Google Scholar] [CrossRef]
  45. Sher, E. Handbook of Air Pollution from Internal Combustion Engines; Academic Press: Boston, MA, USA, 1998. [Google Scholar]
  46. Lapuerta, M.; Hernández, J.; Armas, O. Kinetic Modelling of Gaseous Emissions in a Diesel Engine; SAE Technical Paper 2000-01-2939; SAE International: Warrendale, PA, USA, 2000. [Google Scholar] [CrossRef]
  47. Yang, H.; Krishnan, S.R.; Srinivasan, K.K.; Midkiff, K.C. Modeling of NOx emissions using a super-extended Zeldovich mechanism. In Proceedings of the ICEF03 2003 Fall Technical Conference of the ASME Internal Combustion Engine Division, Erie, PA, USA, 7–10 September 2003. [Google Scholar]
  48. Zeldovich, Y.B.; Sadovnikov, D.A.; Kamenetskii, F. Oxidation of Nitrogen in Combustion; Institute of Chemical Physics: Moscow-Leningrad, Russia, 1947. [Google Scholar]
  49. Lavoie, G.A.; Heywood, J.B.; Keck, J.C. Experimental and theoretical investigation of nitric oxide formation in internal combustion engines. Combust. Sci. Technol. 1970, 1, 313–326. [Google Scholar] [CrossRef]
  50. Lamas, M.I.; Rodriguez, C.G. NOx reduction in diesel-hydrogen engines using different strategies of ammonia injection. Energies 2019, 12, 1255. [Google Scholar] [CrossRef] [Green Version]
  51. Miller, J.A.; Glarborg, P. Modeling the formation of N2O and NO2 in the thermal DeNOx process. Springer Ser. Chem. Phys. 1996, 61, 318–333. [Google Scholar]
  52. Lamas, M.I.; Rodriguez, C.G.; Rodriguez, J.D.; Telmo, J. Computational fluid dynamics of NOx reduction by ammonia injection in the MAN B&W 7S50MC marine engine. Int. J. Marit. Eng. 2014, 156, A213–A220. [Google Scholar] [CrossRef]
Figure 1. In-cylinder pressure at 100% load, experimentally measured.
Jmse 08 00109 g001
Figure 2. (a) Tridimensional mesh at BDC; (b) Cross-section mesh at BDC; (c) Cross-section mesh at TDC.
Jmse 08 00109 g002
Figure 3. HC and CO emissions experimentally and numerically obtained.
Jmse 08 00109 g003
Figure 4. NOx, HC, CO and CO2 emissions as well as BSFC experimentally and numerically obtained.
Jmse 08 00109 g004
Figure 5. In-cylinder pressure experimentally and numerically obtained at 100% load.
Jmse 08 00109 g005
Figure 6. NOx reduction and ammonia slip against the ammonia to fuel ratio. Ammonia injection timing: 58.4° CA ATDC.
Jmse 08 00109 g006
Figure 7. NOx reduction against the water to fuel ratio. Water injection timing: −2.1° CA ATDC.
Jmse 08 00109 g007
Figure 8. NOx reduction against the injection timing using ammonia and water. Ammonia to fuel ratio: 4%, water to fuel ratio: 70%.
Jmse 08 00109 g008
Figure 9. Maximum temperature without water nor ammonia injection; with a 4% ammonia to fuel ratio and an injection timing of −2.1° CA ATDC; water to fuel ratio: 70% and injection timing: −2.1° CA ATDC.
Jmse 08 00109 g009
Figure 10. Chemical, thermal, and dilution effects of water injection on NOx emissions. Water injection timing: −2.1° CA ATDC.
Jmse 08 00109 g010
Figure 11. Chemical, thermal, and dilution effects of ammonia injection on NOx emissions. Ammonia injection timing: 58.4° CA ATDC.
Jmse 08 00109 g011
Figure 12. Chemical, thermal, and dilution effects of ammonia injection on NOx emissions. Ammonia injection timing: −2.1° CA ATDC.
Jmse 08 00109 g012
Table 1. Experimental data.
Load (%)25355075100
Speed (rpm)500500500500500
Power (kW)2047.62367.82923.64051.15430.1
MIP (bar)8.113.917.620.022.5
Pmax (bar)102.7138.0160.4175.8182.3
SFC (g/kWh)173.2171.9169.8169.5172.1
EmissionsNOx (ppm)10481092114911671128
HC (ppm)510485448466515
CO (ppm)261255247268292
CO2 (%)3.54.66.97.98.3
Table 2. Error (%) at 100% load obtained using different mesh sizes.
PNOxCOHCCO2
Mesh 14.25.18.16.54.7
Mesh 24.14.97.96.44.6
Mesh 34.14.97.96.44.6
Table 3. Numerical models.
Turbulence Modelk-ε
Evaporation modelDukowicz
Breakup modelKH-RT
Combustion modelRa and Reitz
NOx formation modelYang et al.
NOx reduction modelMiller and Glarborg

