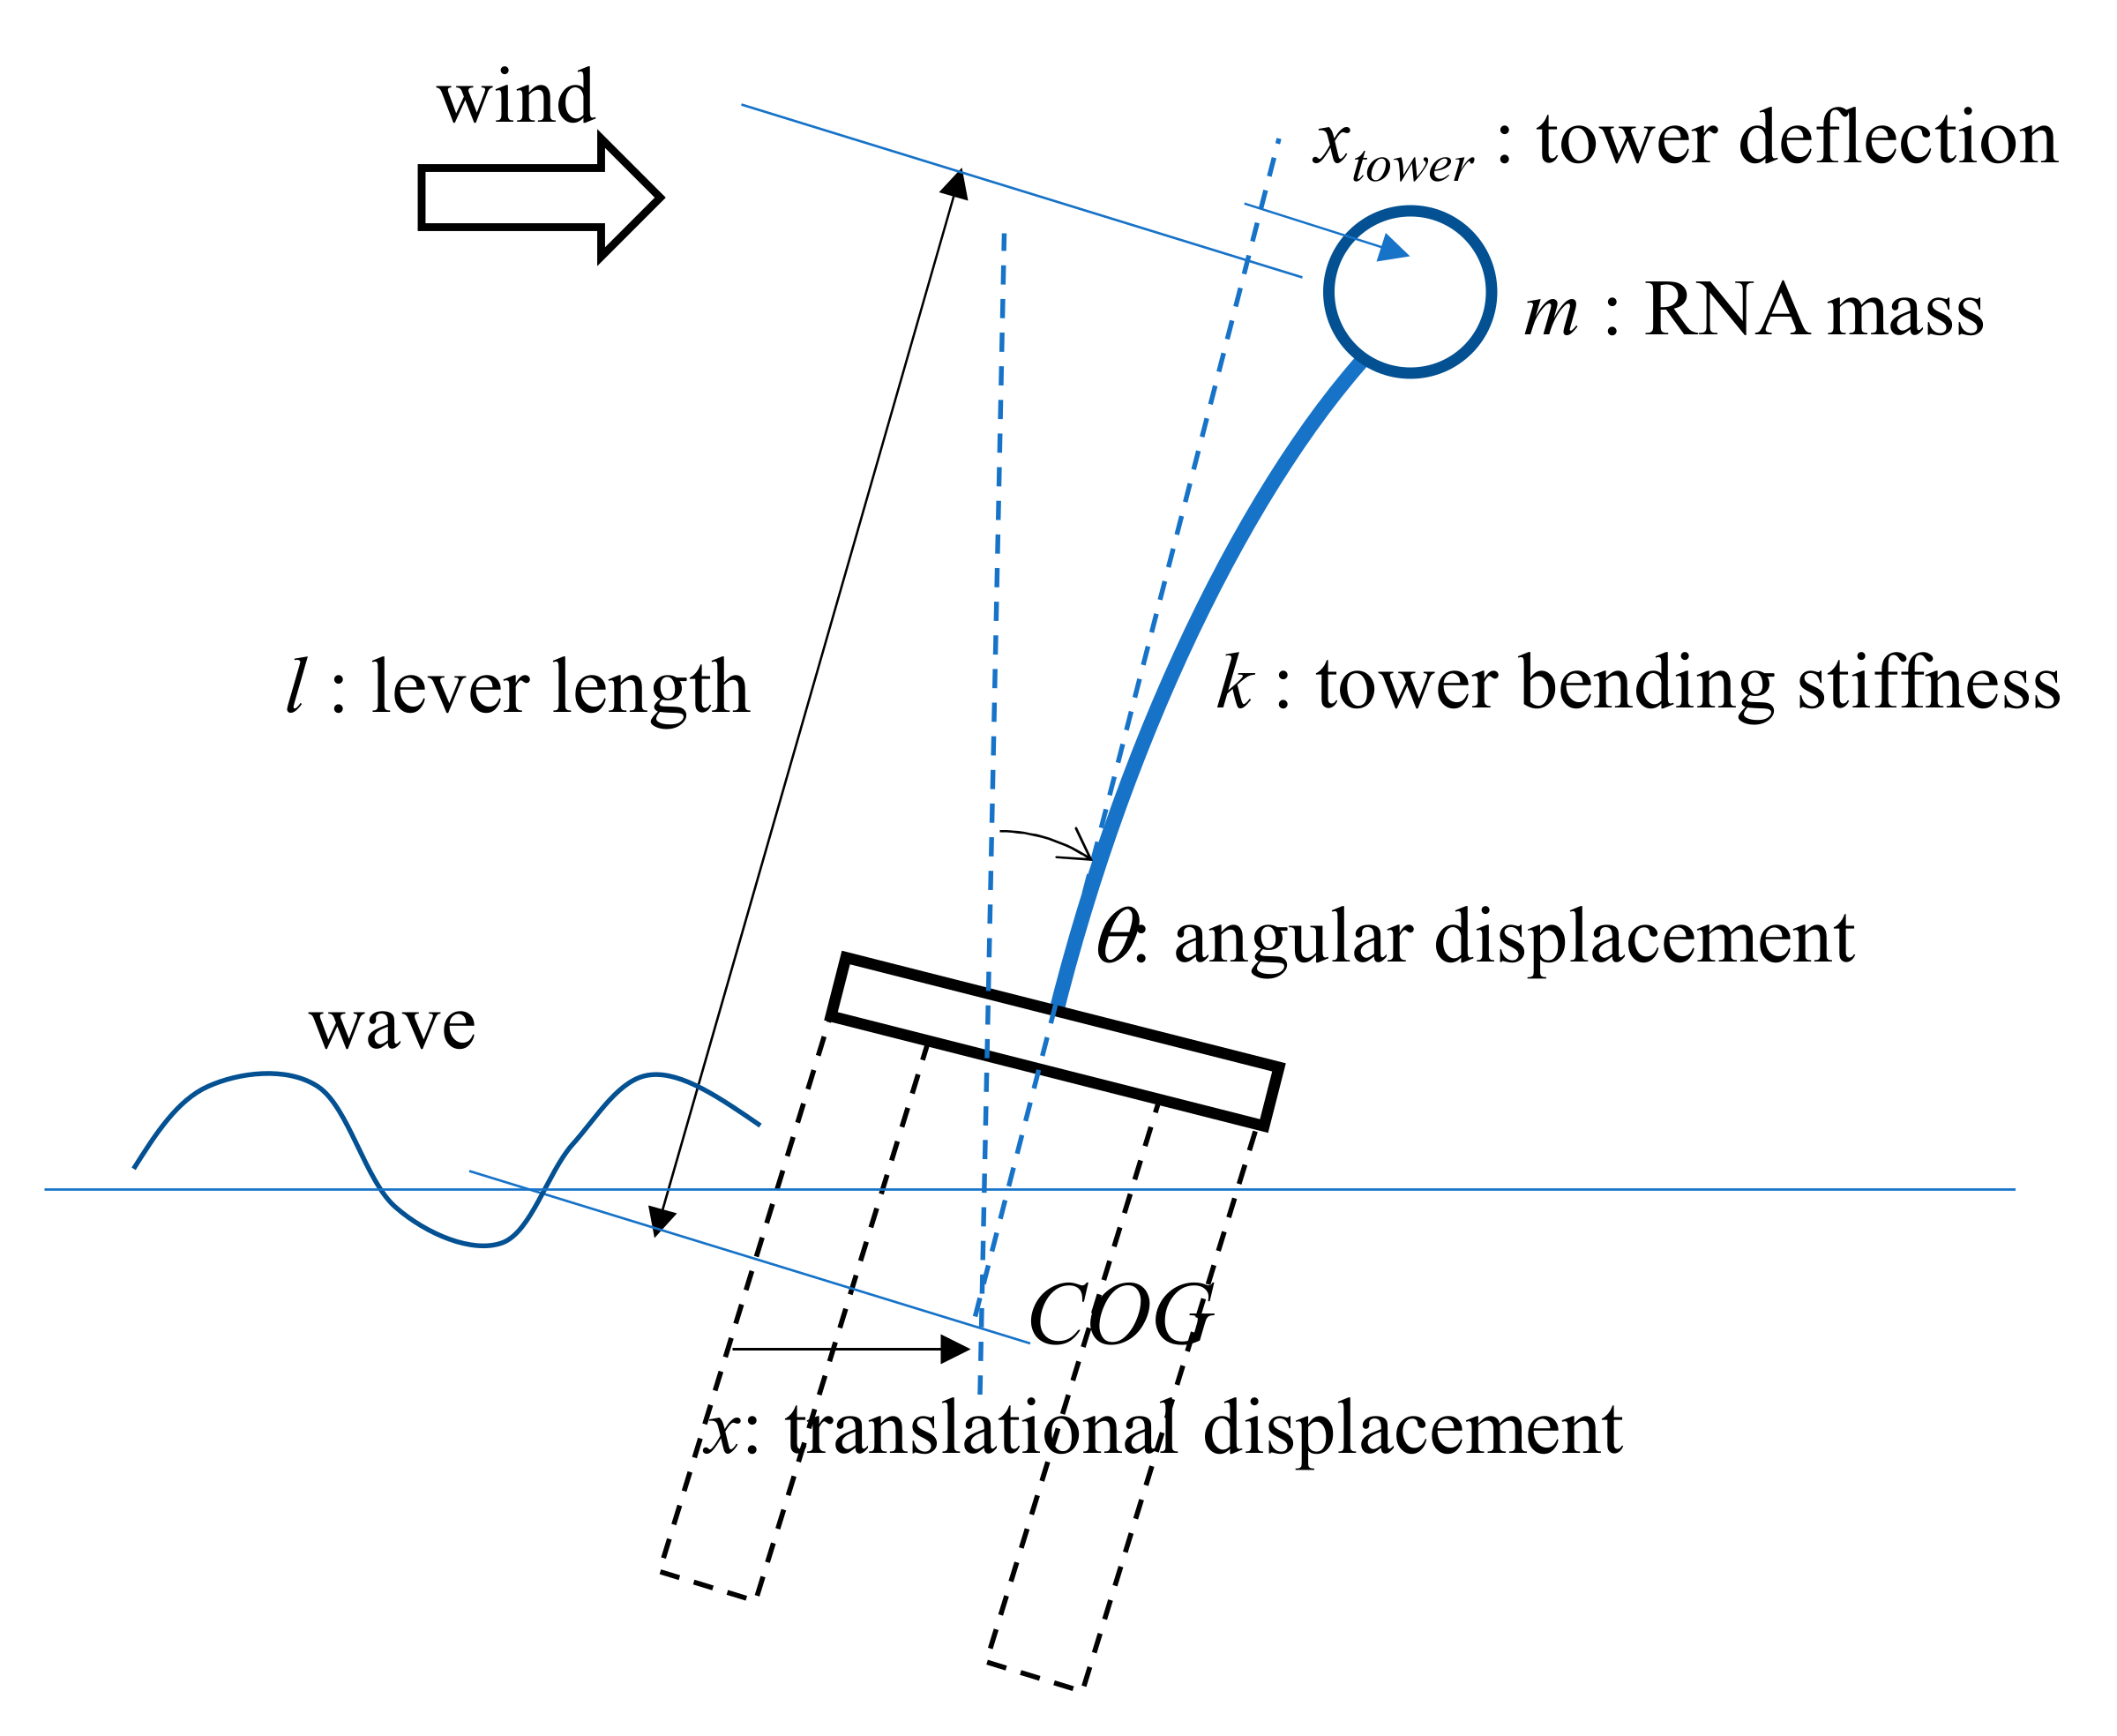
Figure 1.
Tower structural model supported by a floating platform.
Figure 1.
Tower structural model supported by a floating platform.
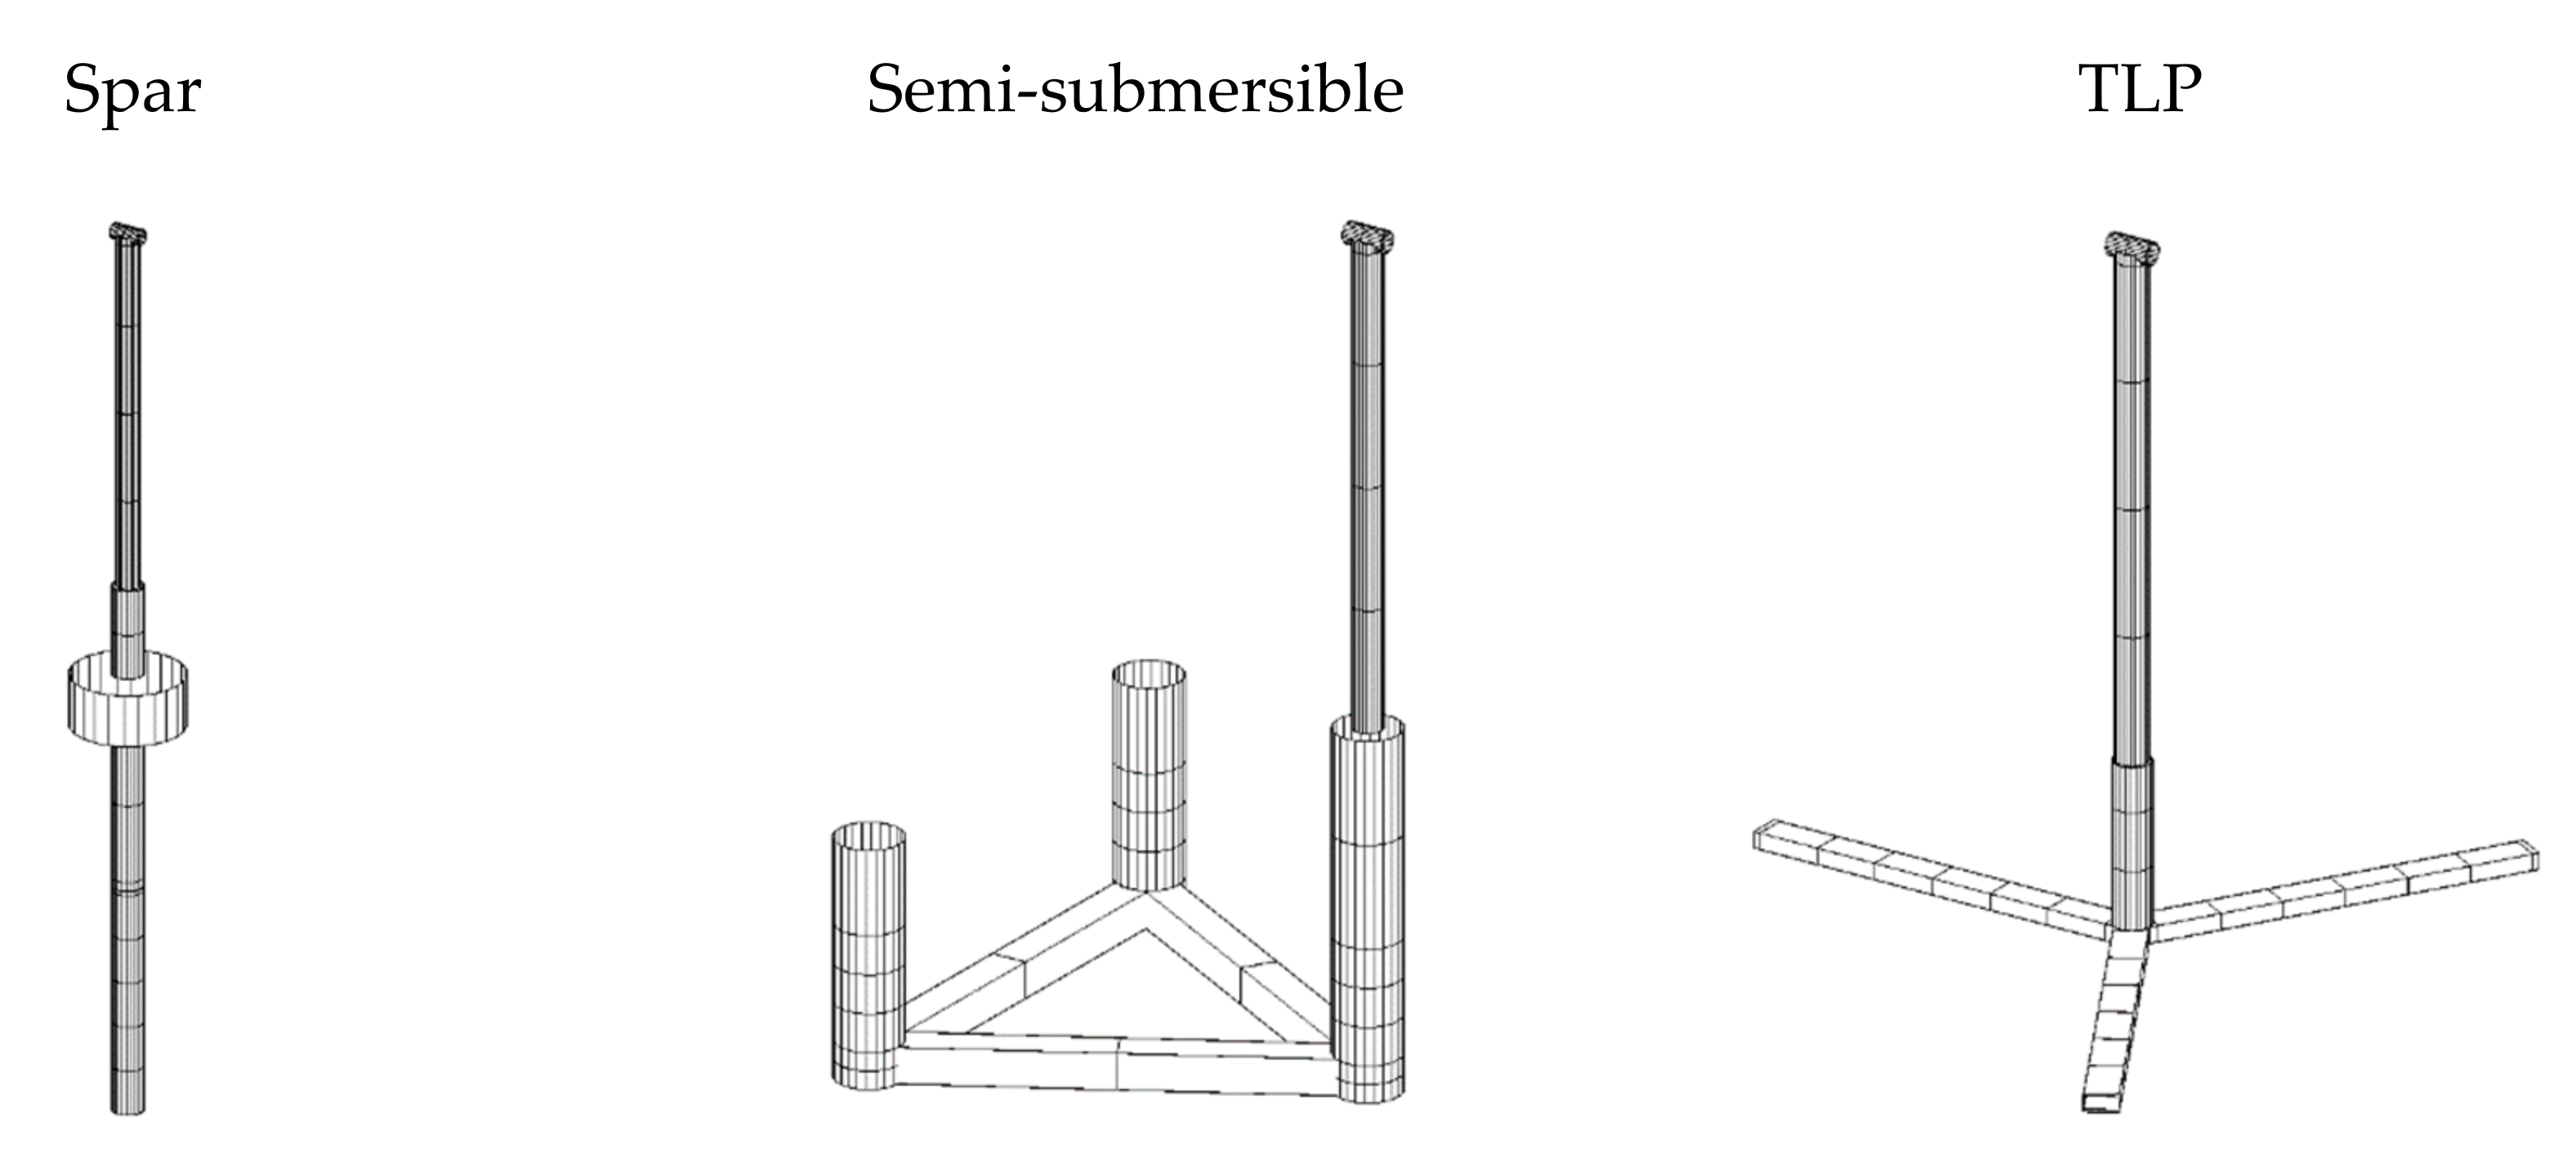
Figure 2.
The overview of the platform designs.
Figure 2.
The overview of the platform designs.
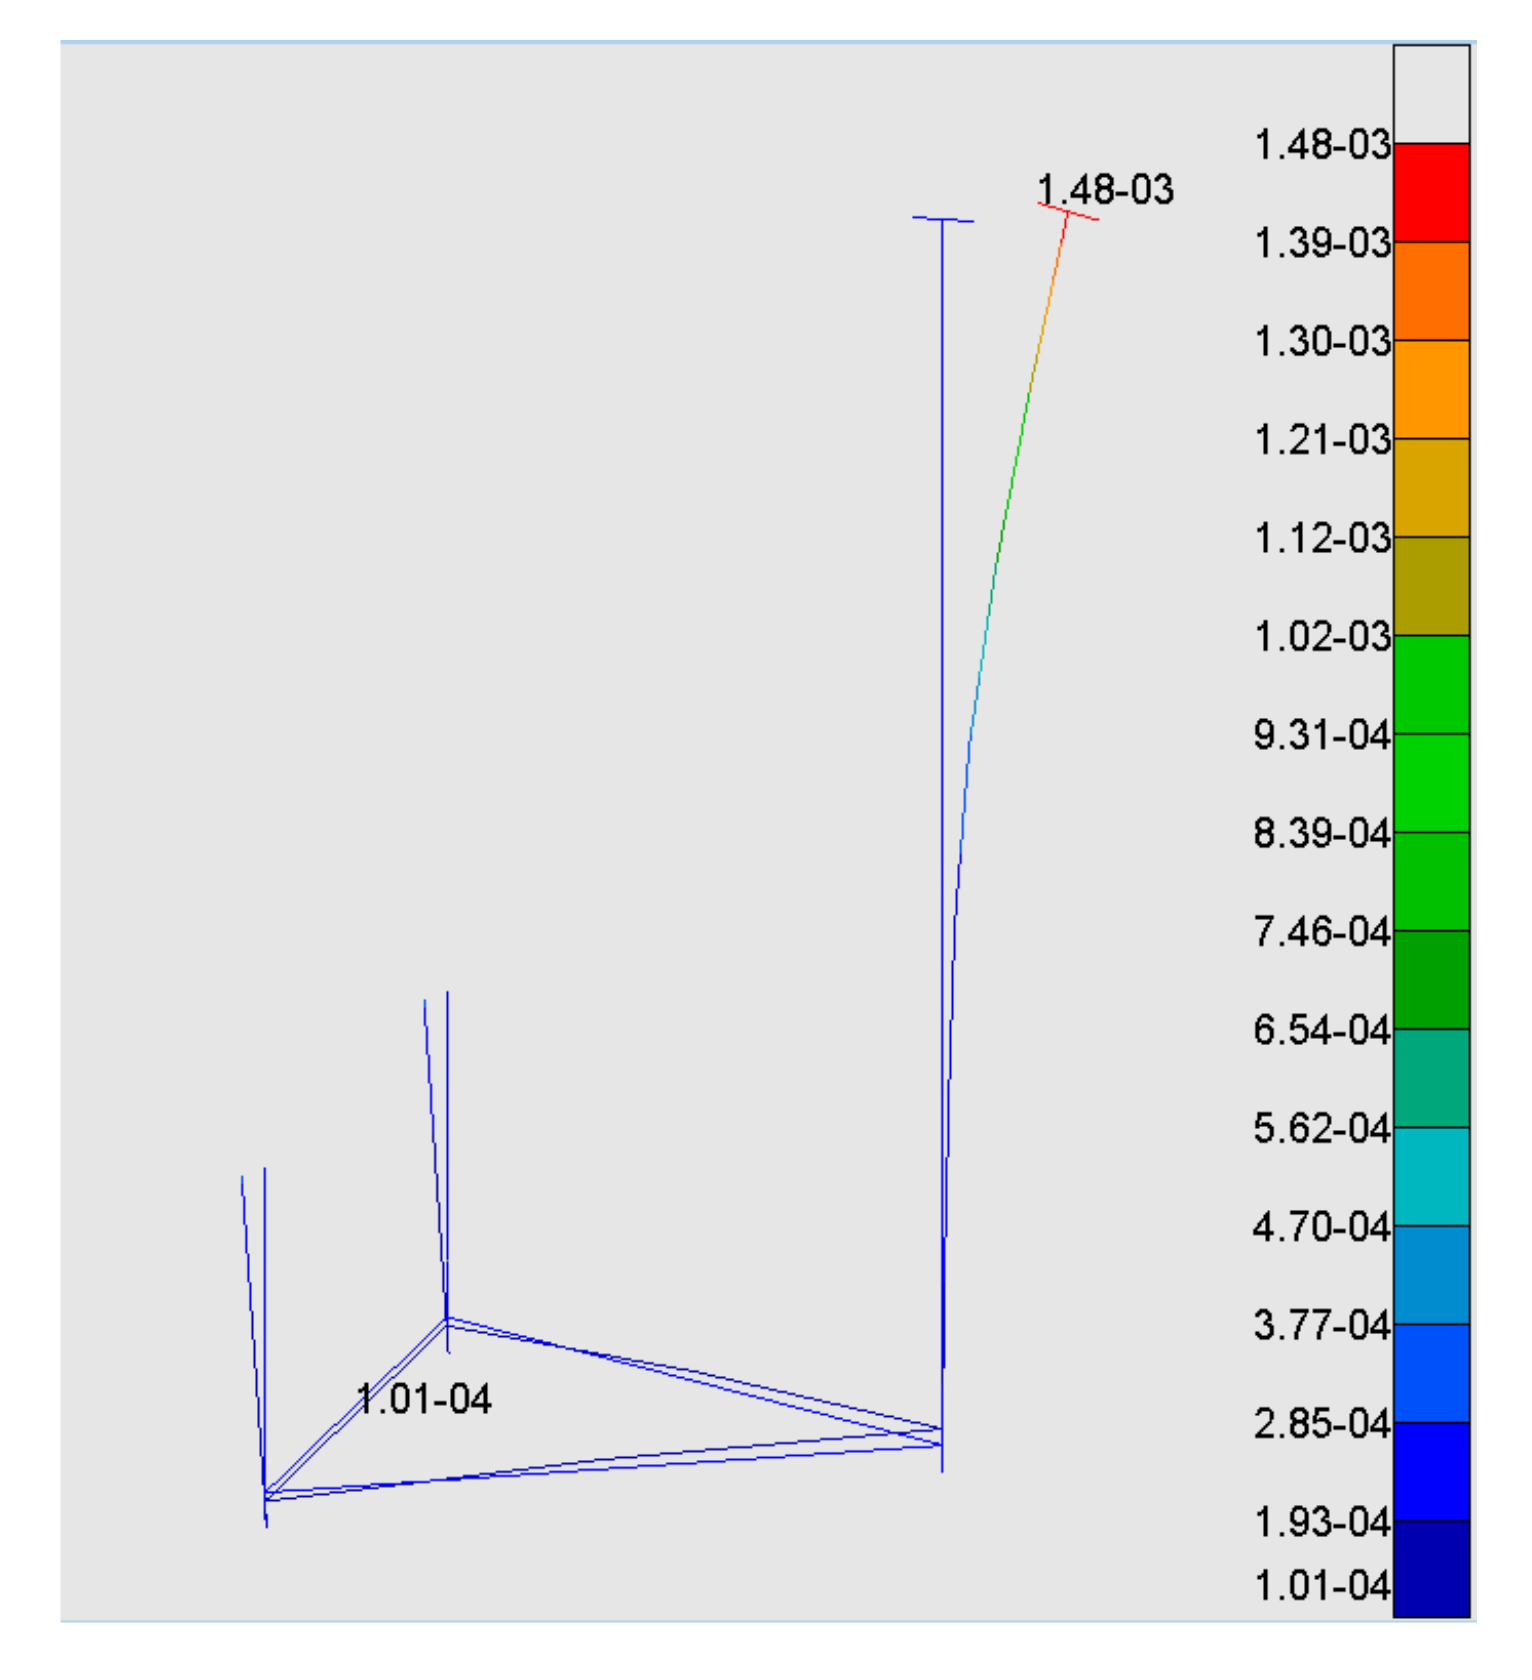
Figure 3.
Eigen mode of the semi-submersible platform at 2.10 rad/s.
Figure 3.
Eigen mode of the semi-submersible platform at 2.10 rad/s.
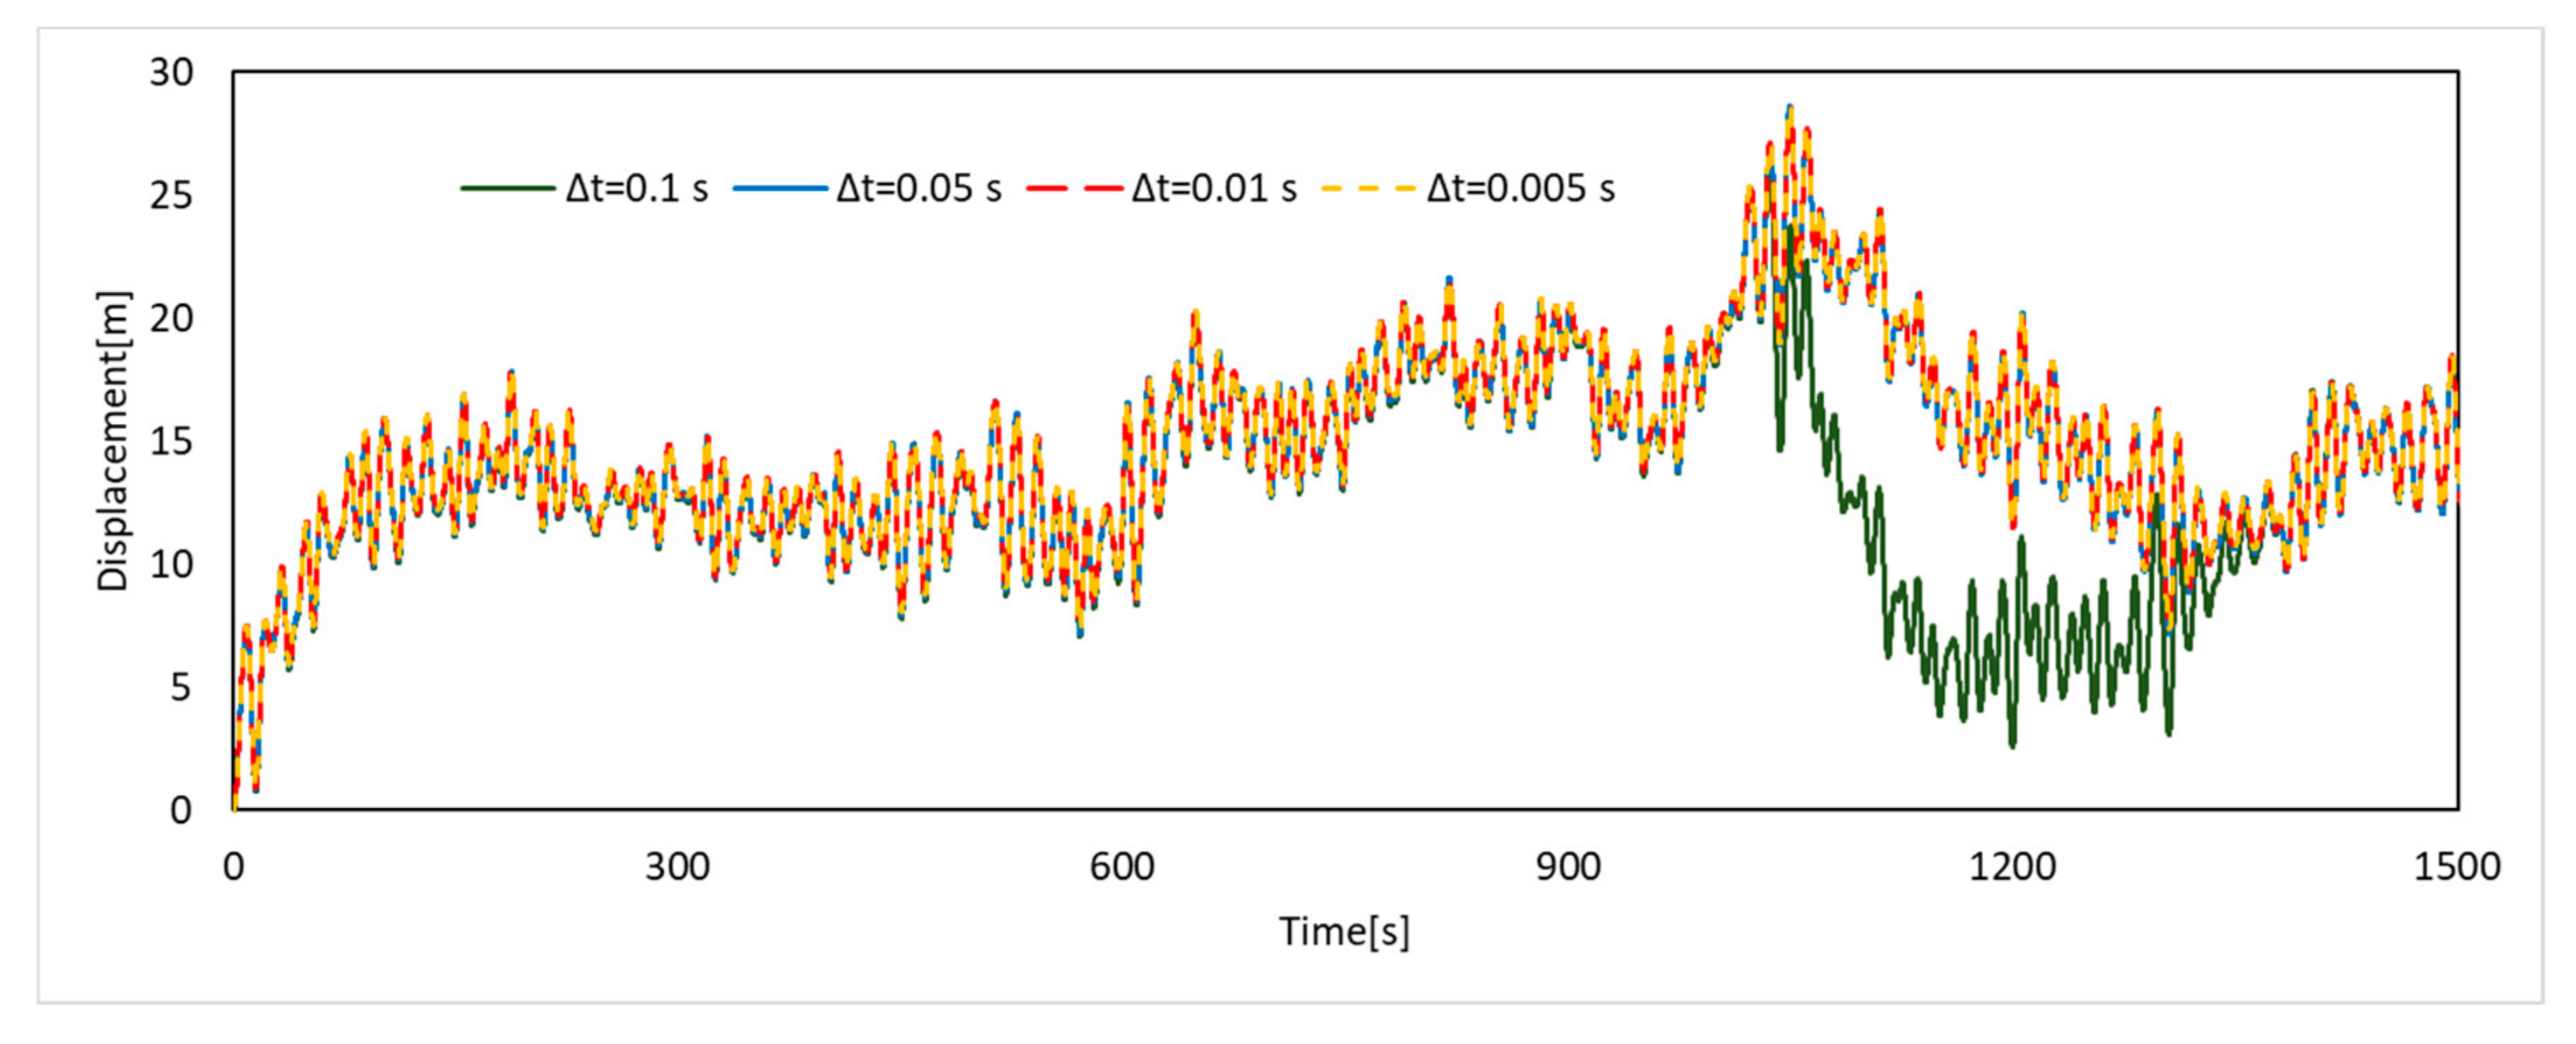
Figure 4.
Time series with varying time step in surge direction.
Figure 4.
Time series with varying time step in surge direction.
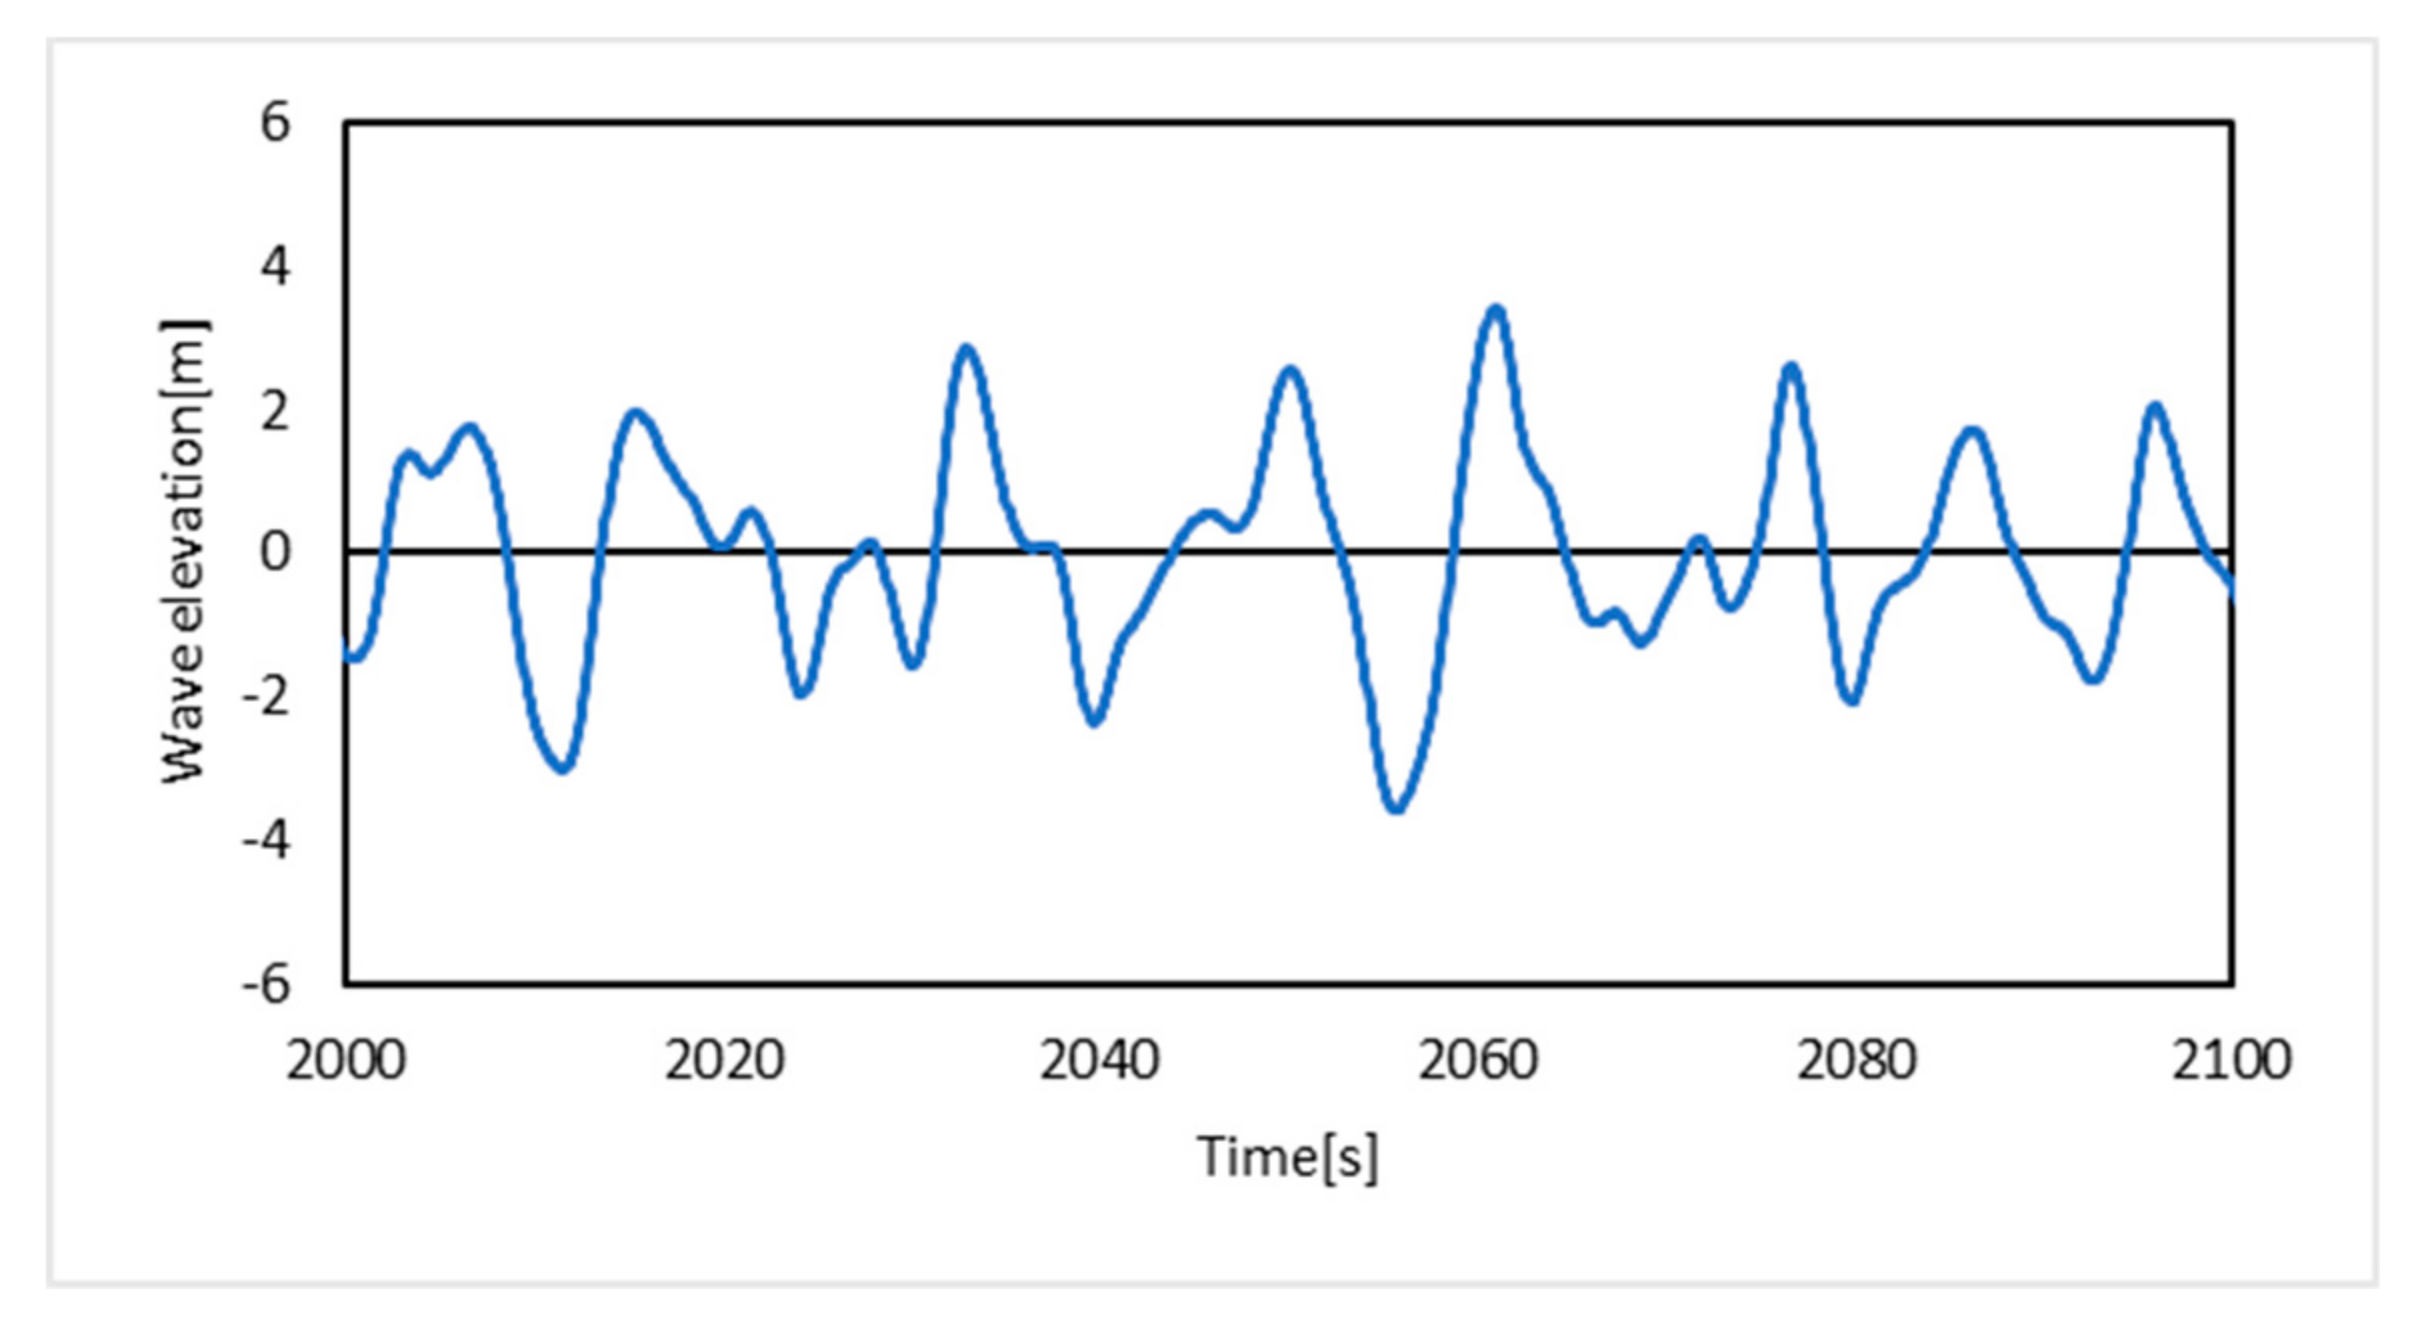
Figure 5.
Time series of wave elevation (Case 3, 15).
Figure 5.
Time series of wave elevation (Case 3, 15).
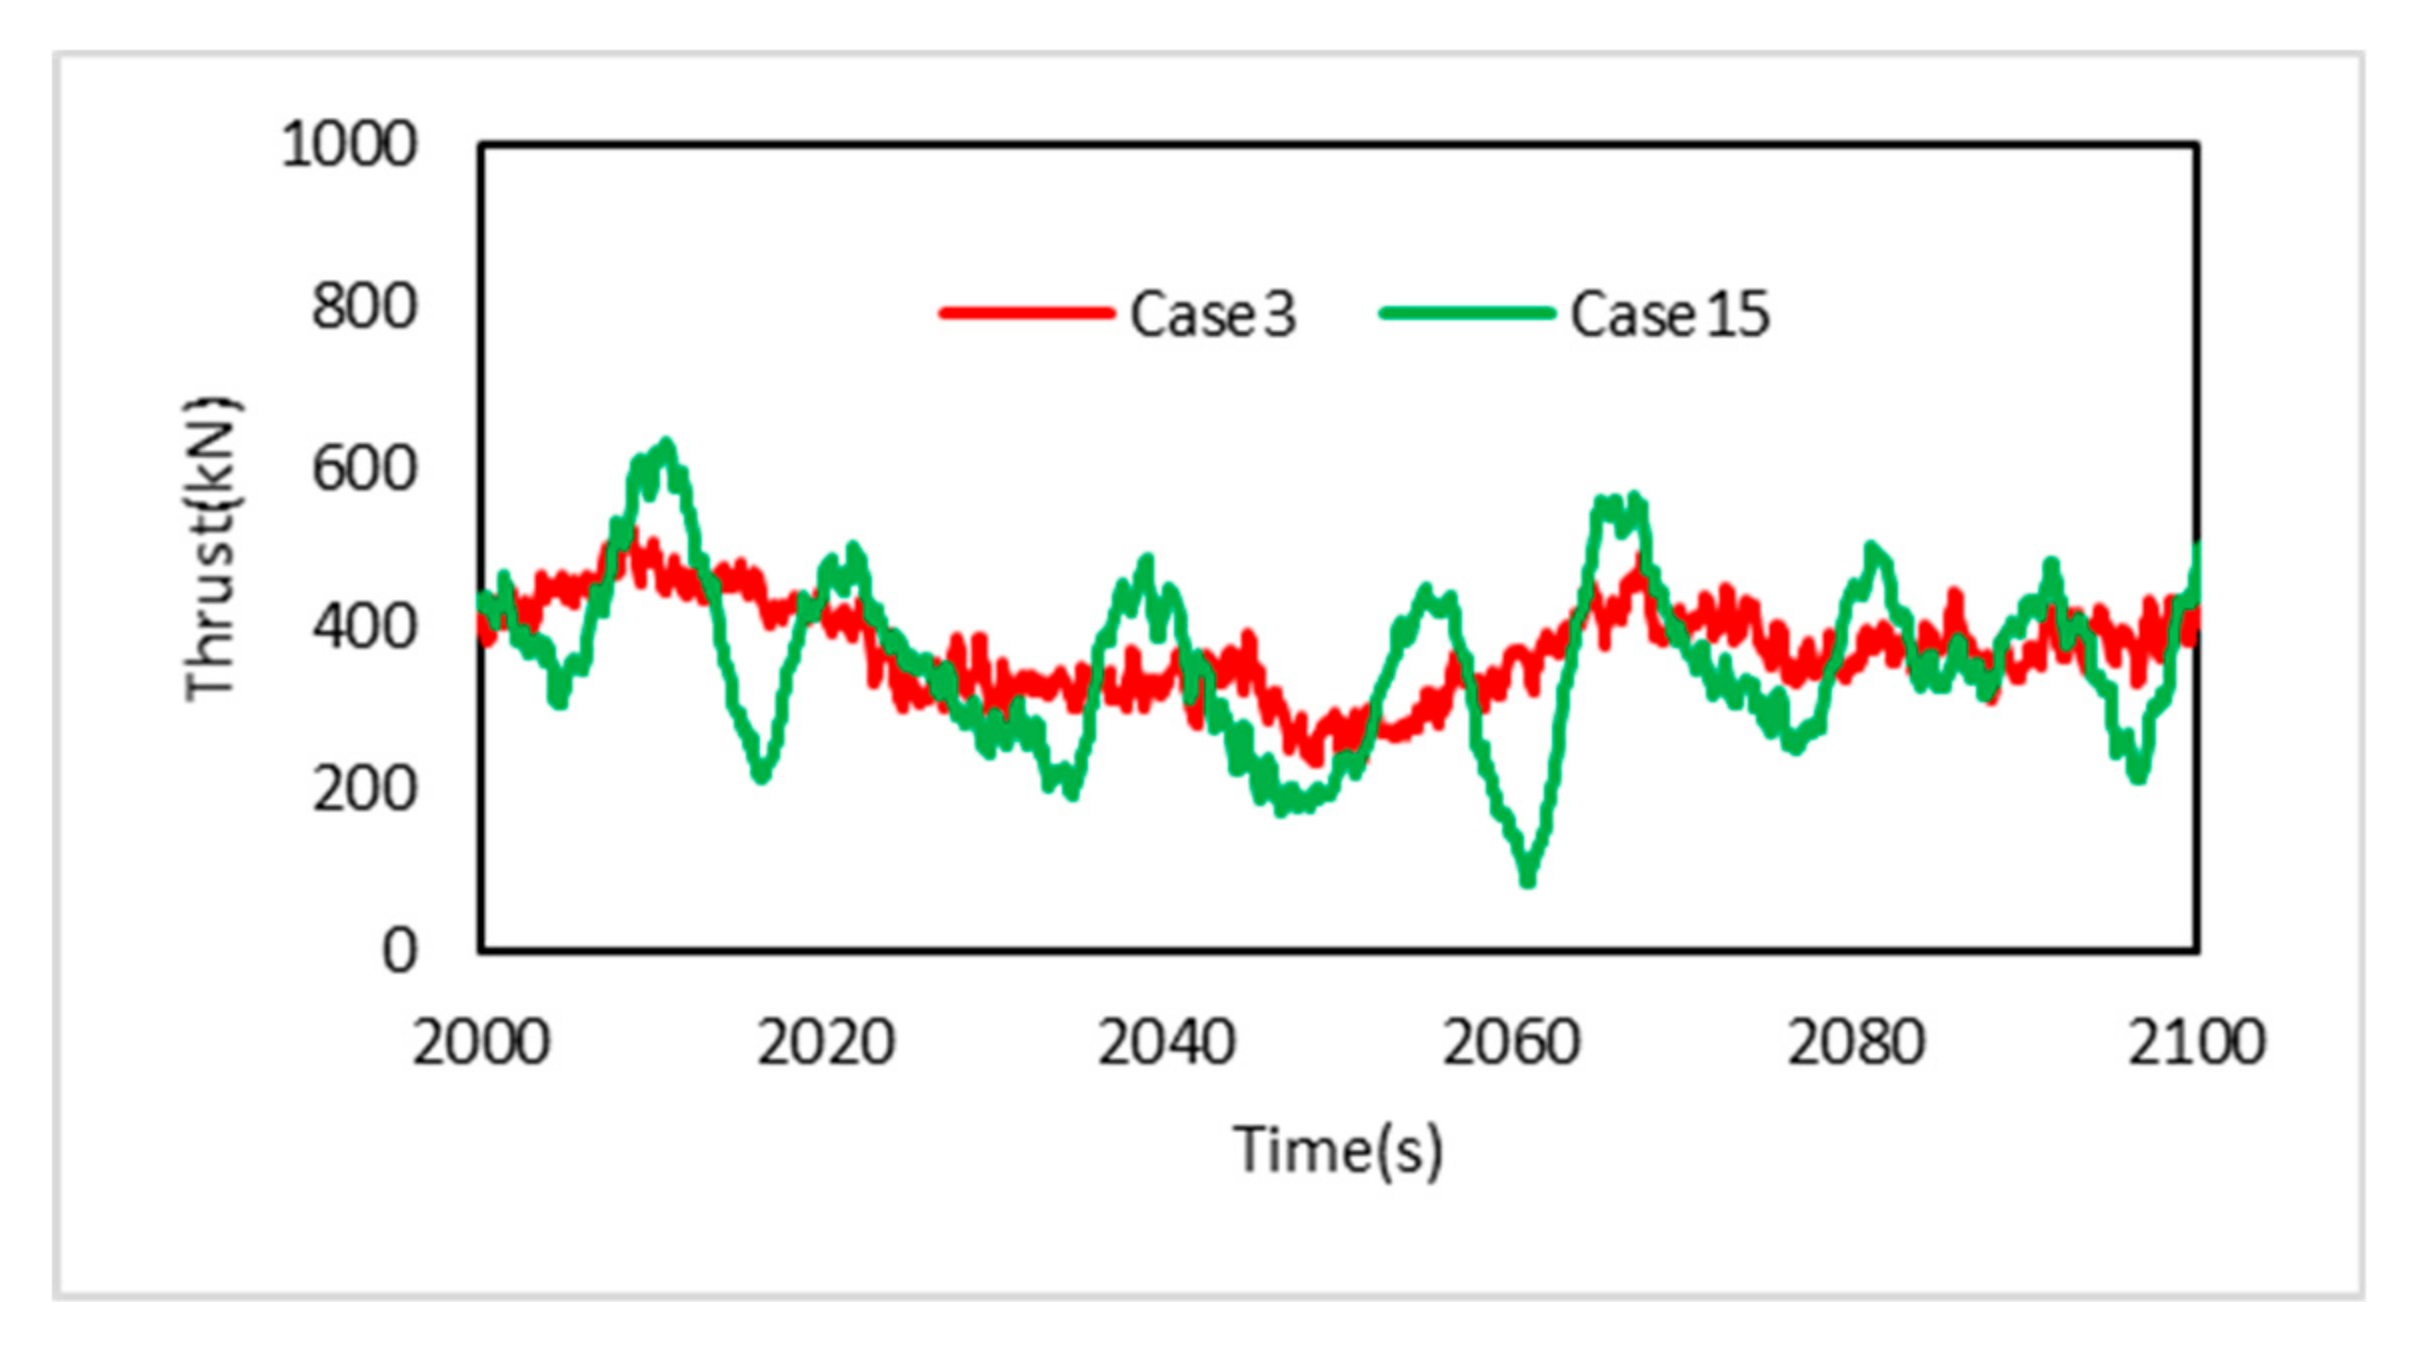
Figure 6.
Time series of thrust force (Case 3, 15).
Figure 6.
Time series of thrust force (Case 3, 15).
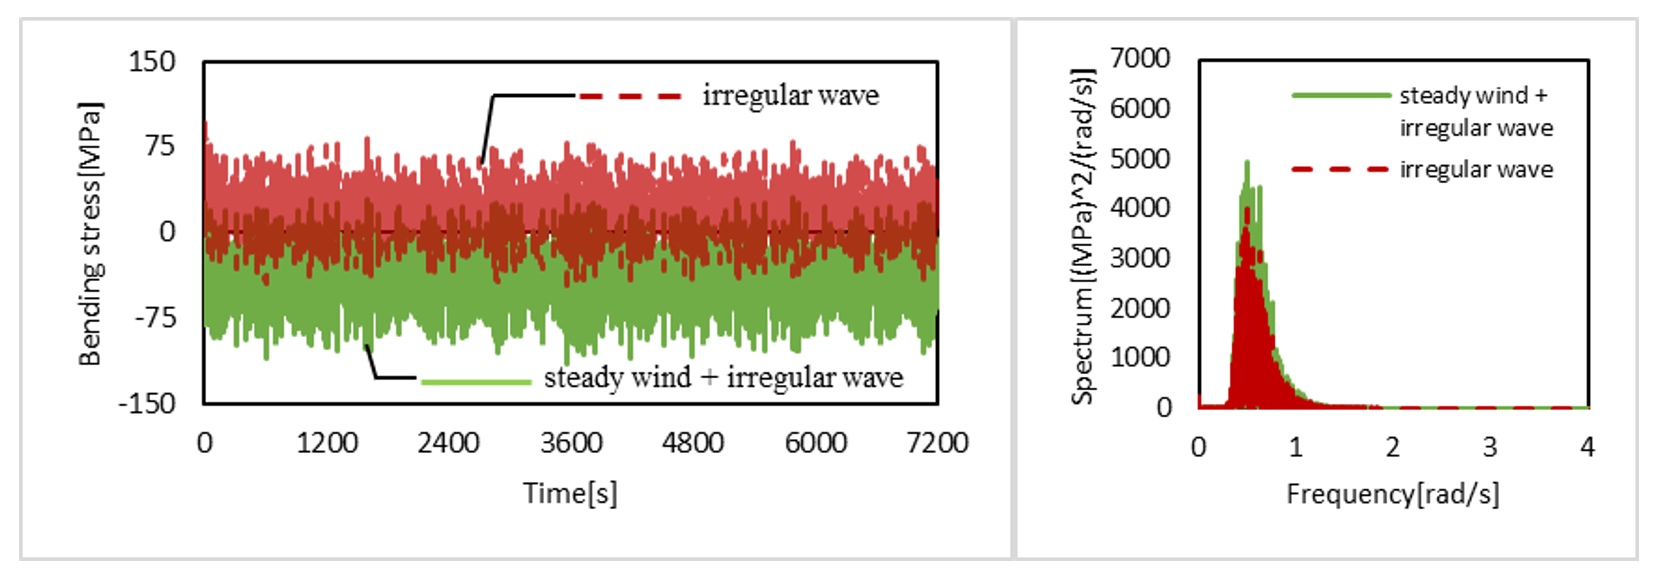
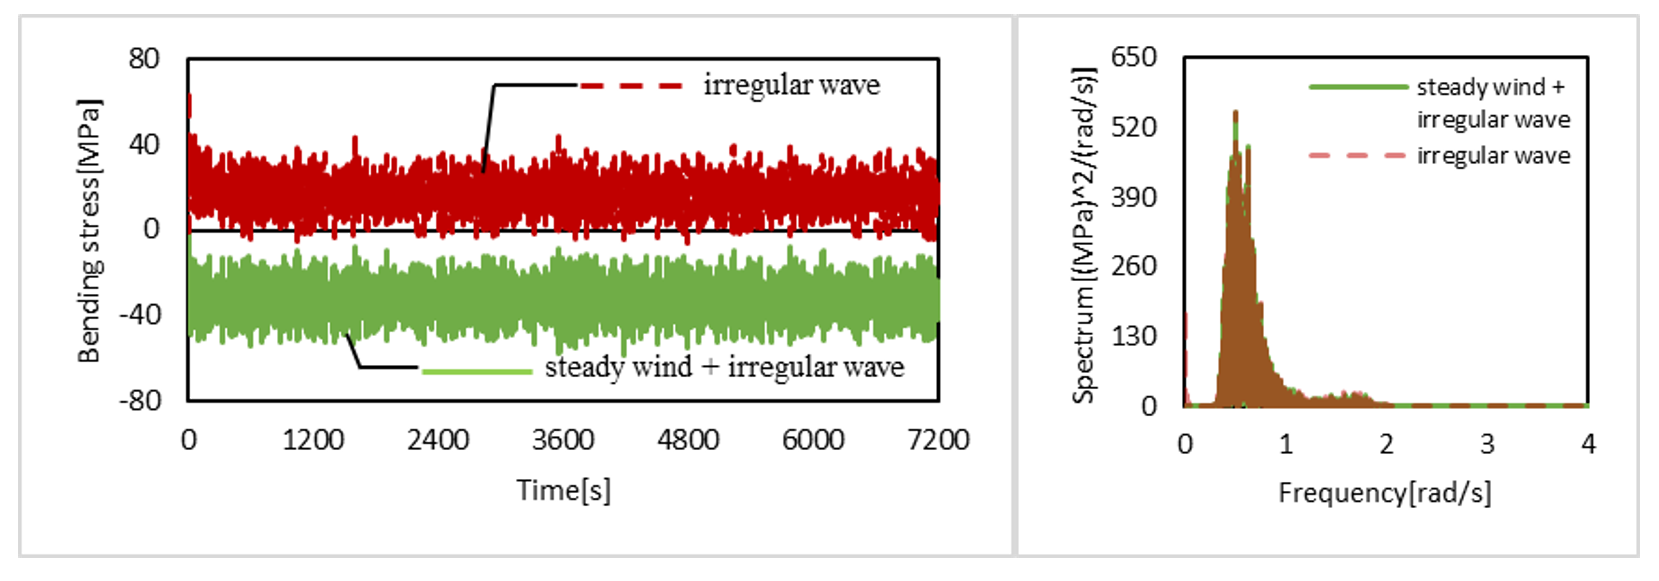
Figure 7.
Time history of bending stress and bending stress PSD of spar platform ( = 3.0 m).
Figure 7.
Time history of bending stress and bending stress PSD of spar platform ( = 3.0 m).
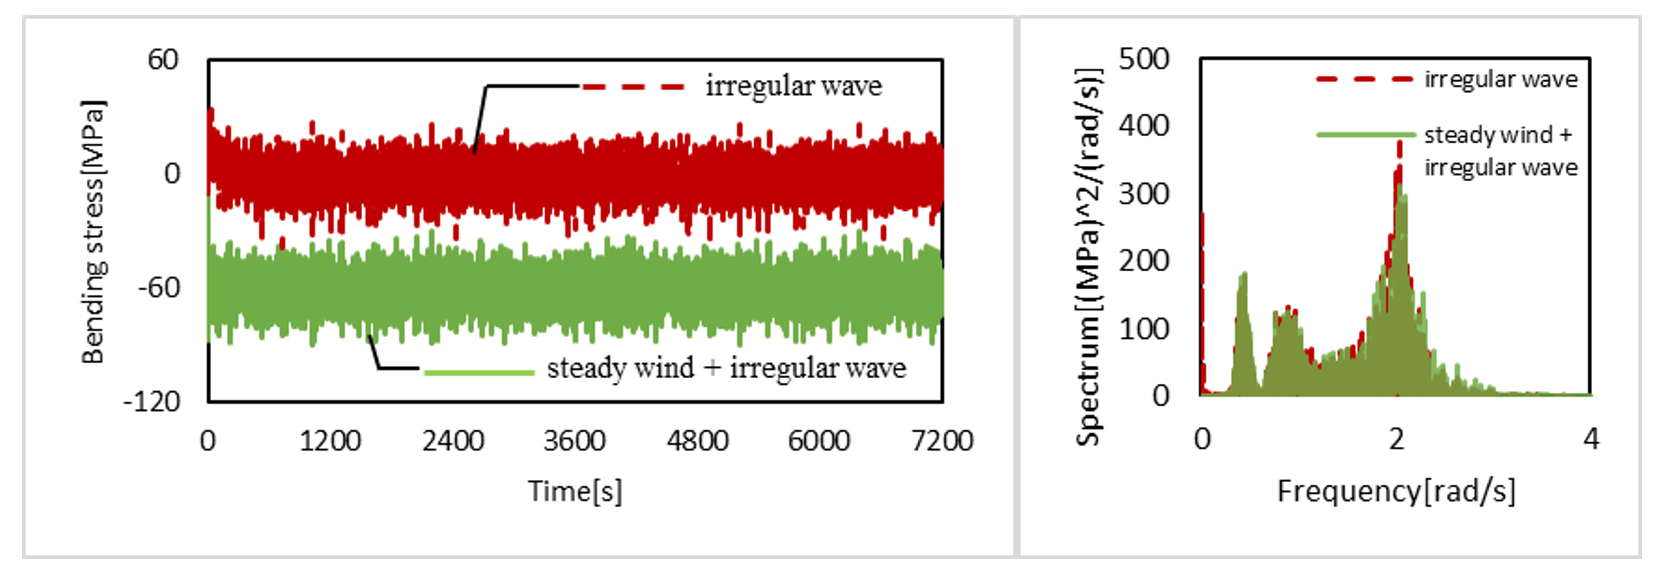
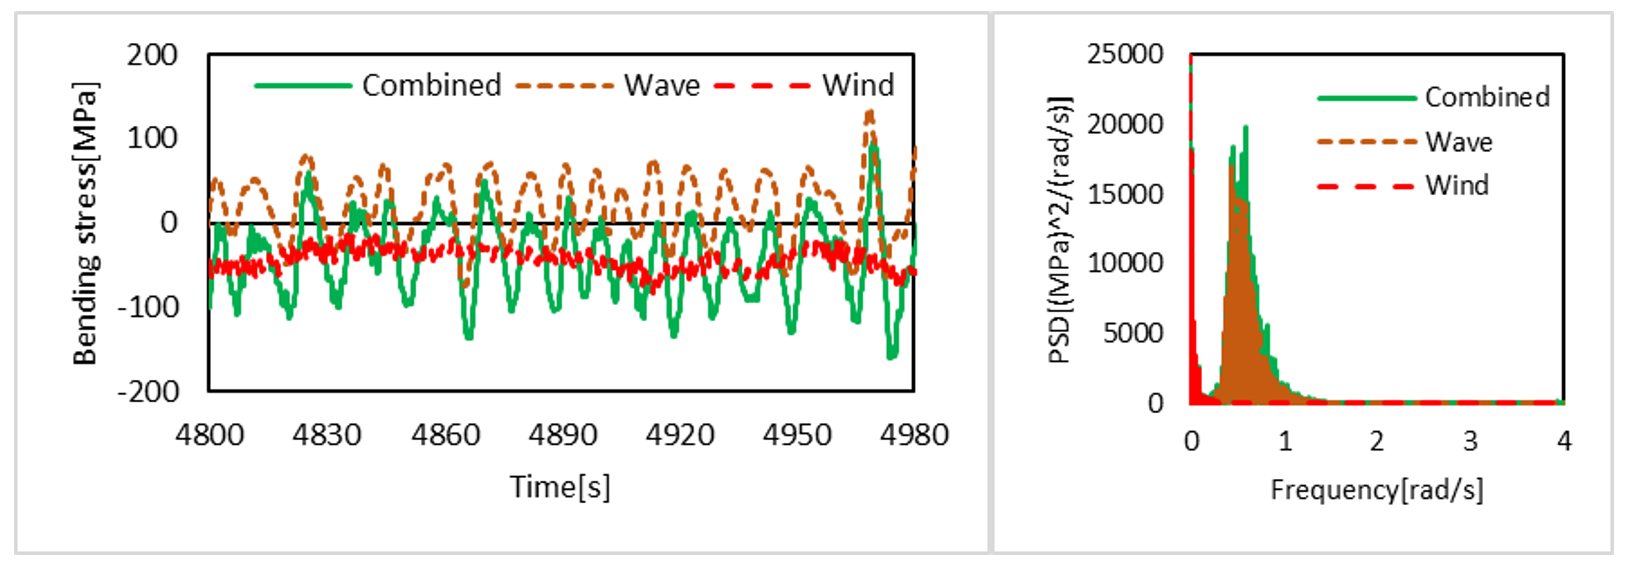
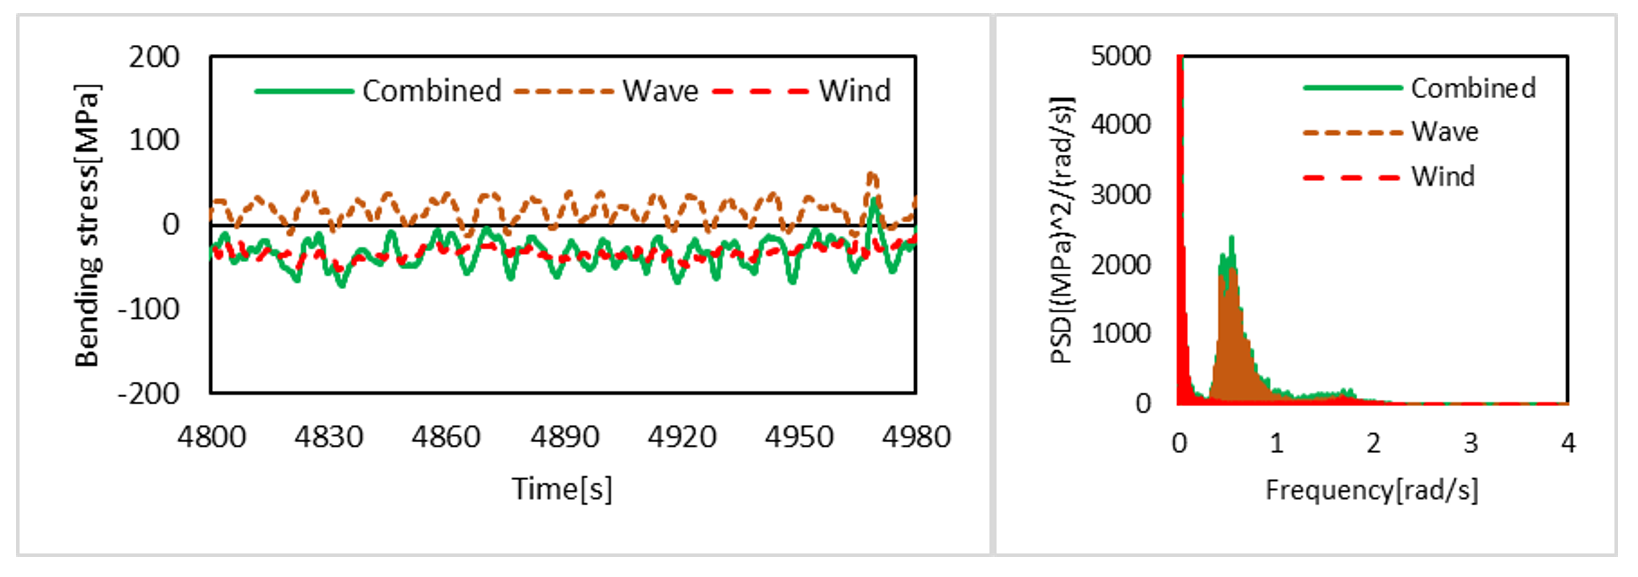
Figure 8.
Time history of bending stress and bending stress PSD of semi-submersible platform ( = 3.0 m).
Figure 8.
Time history of bending stress and bending stress PSD of semi-submersible platform ( = 3.0 m).
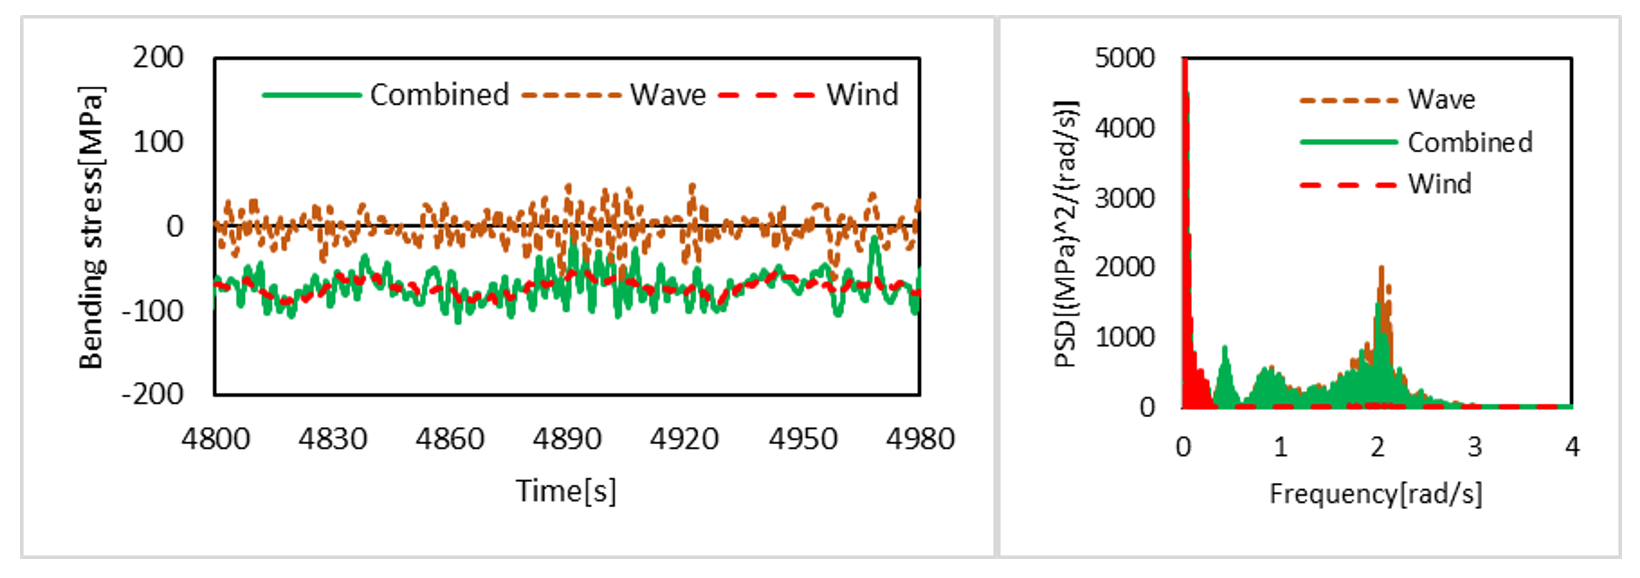
Figure 9.
Time history of bending stress and bending stress PSD of TLP platform ( = 3.0 m).
Figure 9.
Time history of bending stress and bending stress PSD of TLP platform ( = 3.0 m).
Figure 10.
Time history and PSD of bending stress of spar platform (Case 3, 12, 15).
Figure 10.
Time history and PSD of bending stress of spar platform (Case 3, 12, 15).
Figure 11.
Time history and PSD of bending stress of semi-submersible platform (Case 3, 12, 15).
Figure 11.
Time history and PSD of bending stress of semi-submersible platform (Case 3, 12, 15).
Figure 12.
Time history and PSD of bending stress of TLP platform (Case 3, 12, 15).
Figure 12.
Time history and PSD of bending stress of TLP platform (Case 3, 12, 15).
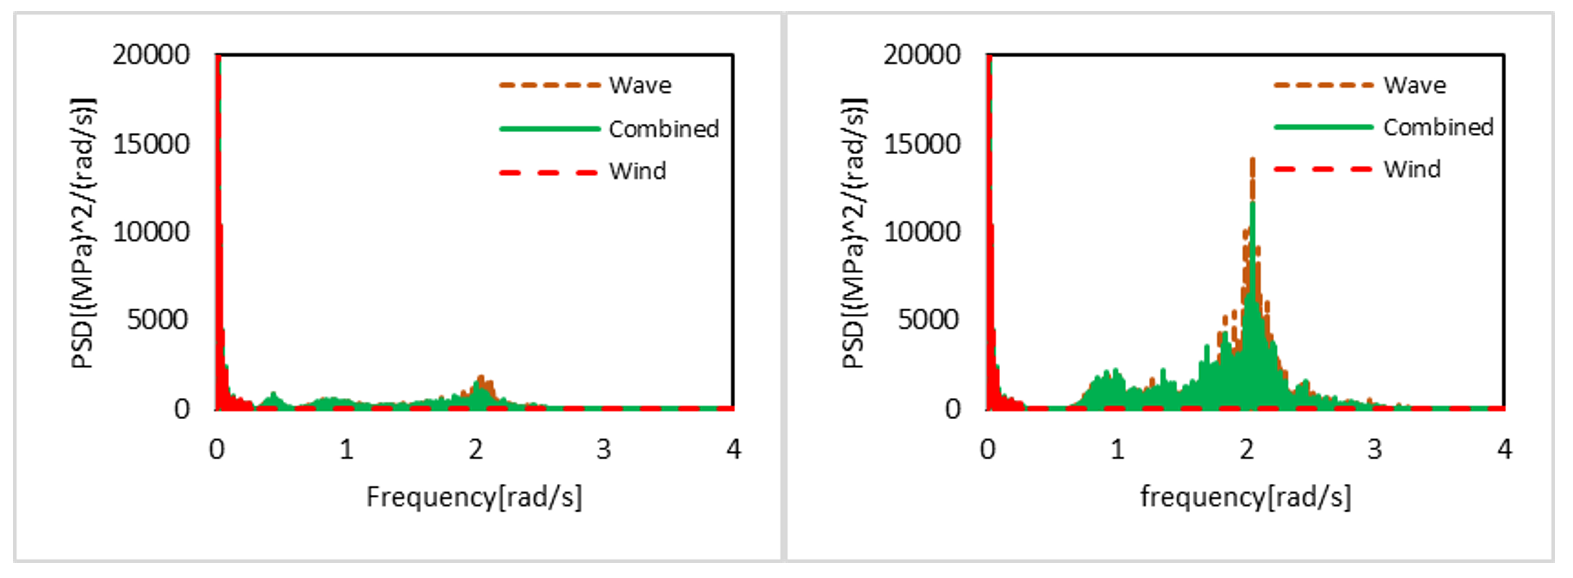
Figure 13.
PSD of bending stress with different wave periods (left: Case 15, right: Case 18).
Figure 13.
PSD of bending stress with different wave periods (left: Case 15, right: Case 18).
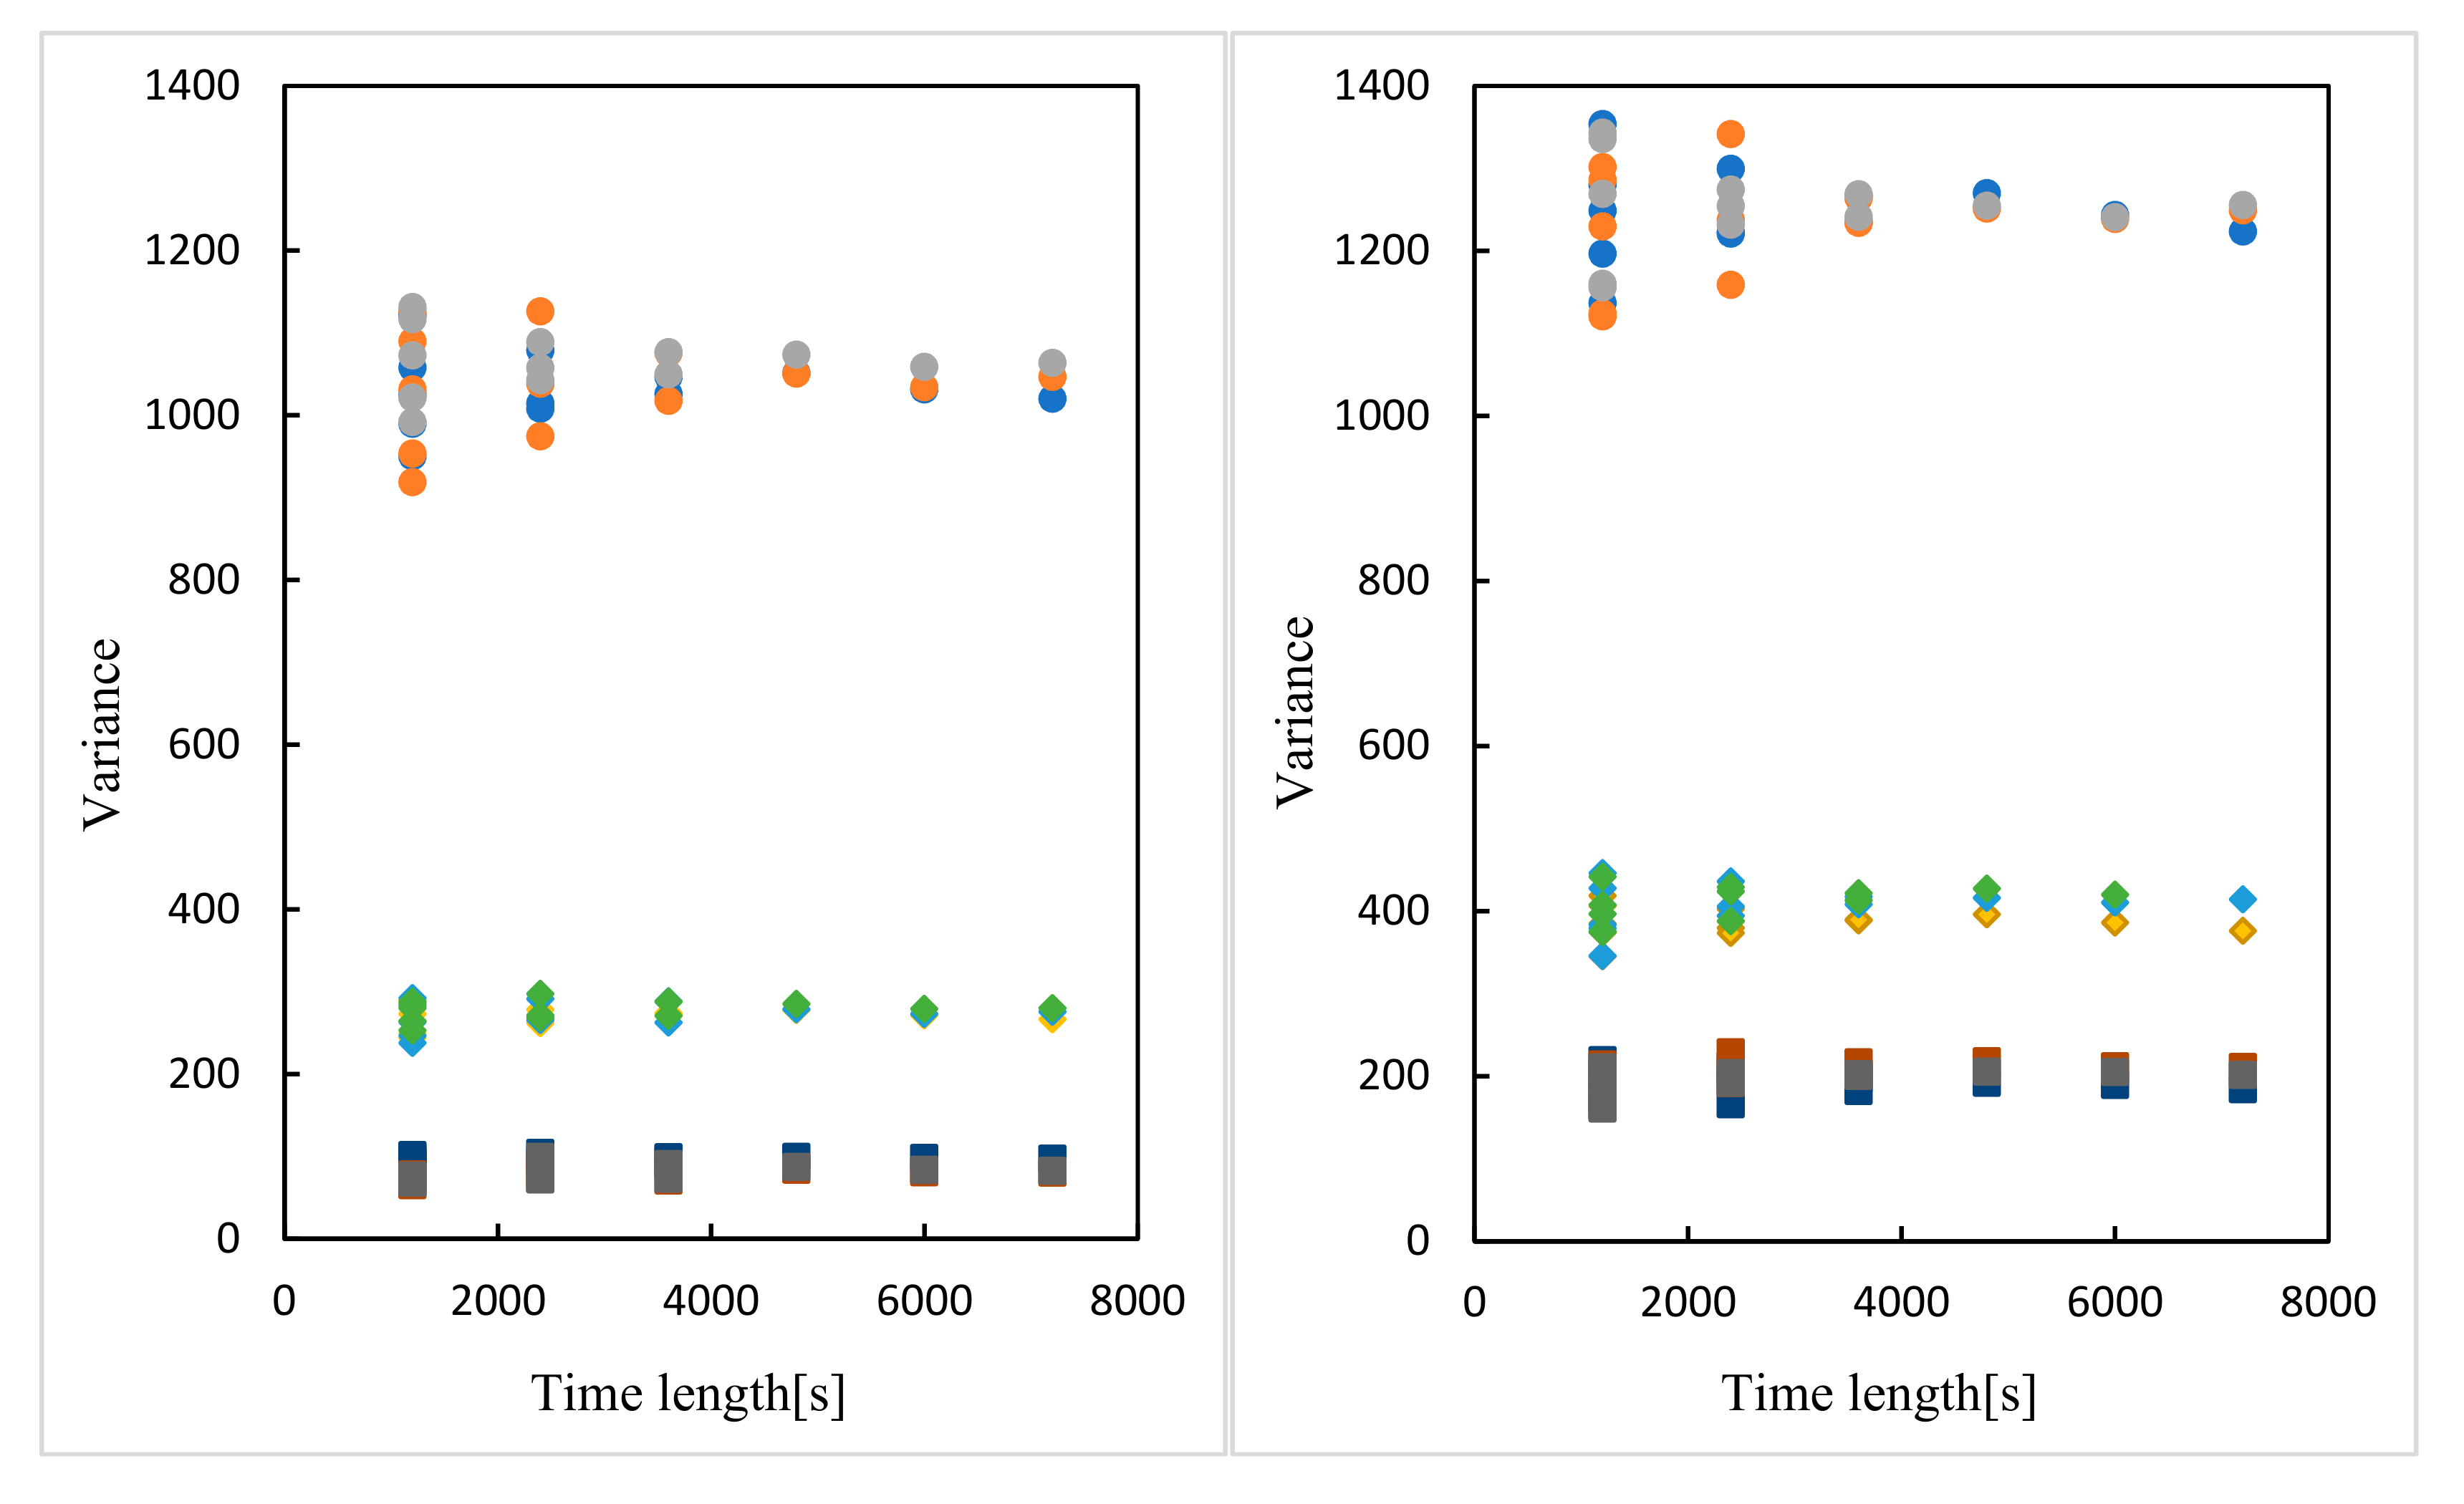
Figure 14.
Time length for calculation and the variance in spar platform (left: Case 9, 10, 11, right: Case 13, 14, 15).
Figure 14.
Time length for calculation and the variance in spar platform (left: Case 9, 10, 11, right: Case 13, 14, 15).
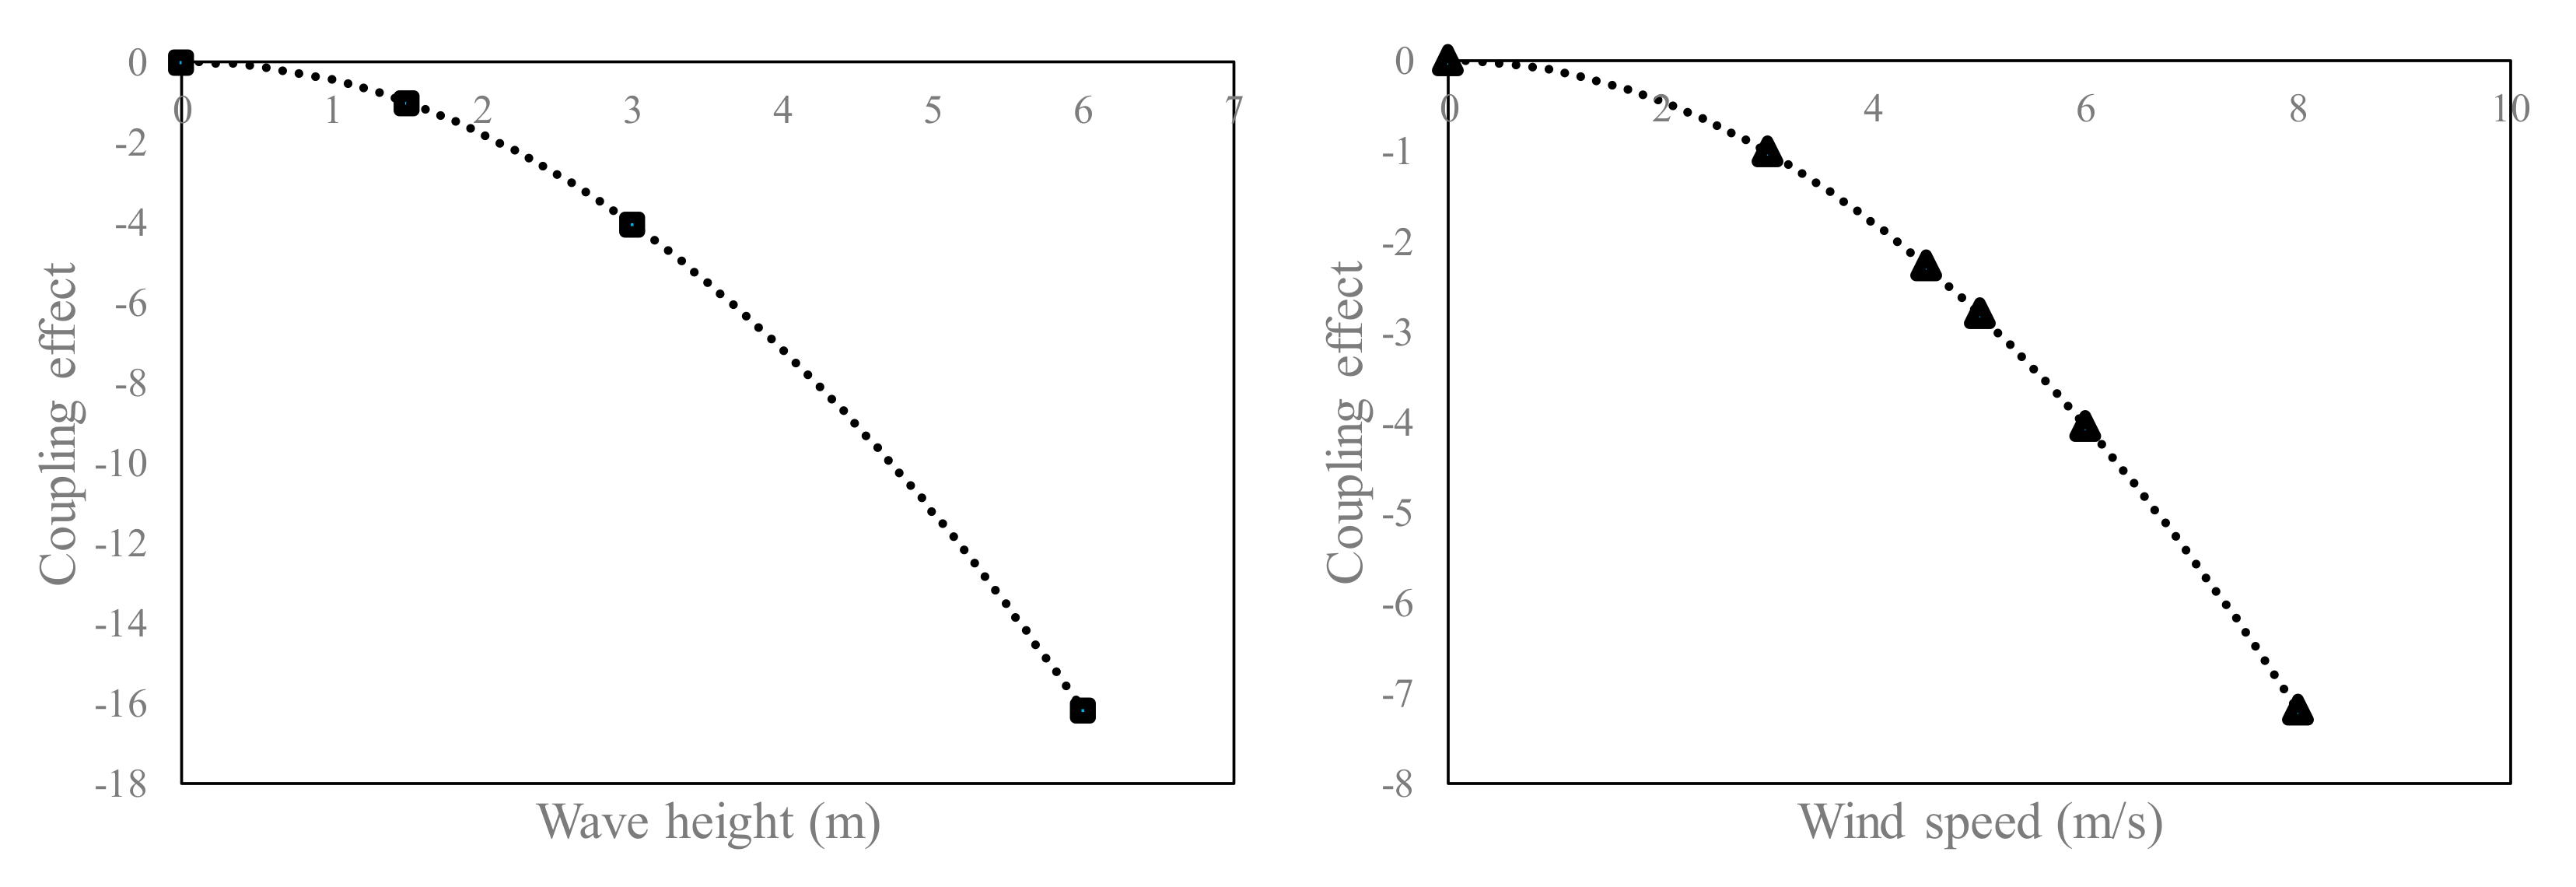
Figure 15.
Nonlinear coupling effects in the high frequency component as a function of wave height and wind speed.
Figure 15.
Nonlinear coupling effects in the high frequency component as a function of wave height and wind speed.
Table 1.
Main dimensions of three Floating Offshore Wind Turbines (FOWTs).
Table 1.
Main dimensions of three Floating Offshore Wind Turbines (FOWTs).
| | Spar | Semi-Submersible | TLP |
|---|
| Displacement | 9408 tons | 13126 tons | 3100 tons |
| Draft | 109.3 m | 25.0 m | 21.0 m |
| Tower height from the still water line | 90.0 m | 113.9 m | 87.1 m |
| KG | 51.0 m | 15.0 m | 26.0 m |
| Cross-sectional area of rectangular beam | - | 6.0 m × 6.0 m | 5.2 m × 2.6 m |
| Surge natural frequency | 0.0369 rad/s | 0.0392 rad/s | 0.128 rad/s |
| Sway natural frequency | 0.0369 rad/s | 0.0392 rad/s | 0.131 rad/s |
| Heave natural frequency | 0.165 rad/s | 0.341 rad/s | 1.90 rad/s |
| Roll natural frequency | 0.294 rad/s | 0.269 rad/s | 1.75 rad/s |
| Pitch natural frequency | 0.280 rad/s | 0.256 rad/s | 1.75 rad/s |
| Yaw natural frequency | 0.287 rad/s | 0.242 rad/s | 0.226 rad/s |
| Eigen frequency of the first flexible deformation (tower 1st bending) | 3.27 rad/s | 2.10 rad/s | 3.41 rad/s |
Table 2.
Gross properties of the NREL 5-MW baseline wind turbine.
Table 2.
Gross properties of the NREL 5-MW baseline wind turbine.
| Rating | 5 MW |
| Rotor orientation, configuration | Upwind, 3 blades |
| Rotor, hub diameter | 126 m, 3.0 m |
| Cut-in, Rated, Cut-out wind speed | 3.0 m/s, 11.4 m/s, 25.0 m/s |
| Cut-in, Rated rotor speed | 6.9 rpm, 12.1 rpm |
| Rotor mass | 110 tons |
Table 3.
Main dimensions of the tower.
Table 3.
Main dimensions of the tower.
| Length | 80.0 m |
| Tower mass | 130 tons |
| Diameter | 5.0 m |
| Thickness | 0.040 m |
Table 4.
Properties of the mooring.
Table 4.
Properties of the mooring.
| | Spar | Semi-Submersible | TLP |
|---|
| The number of mooring lines | 4 | 3 | 3 |
| Horizontal distance | 566 m | 485 m | 0 m |
| Vertical distance | 249 m | 275 m | 279 m |
| Initial tension | 2.20 × 10³ kN/m | 2.43 × 10² kN/m | 5.00 × 10³ kN/m |
| Spring constant | 1.00 × 101 kN/m | 5.00 × 101 kN/m | 1.00 × 10⁴ kN/m |
Table 5.
All the environmental conditions.
Table 5.
All the environmental conditions.
| | (m/s) | Hs (m) | Tp (s) | | (m/s) | Hs (m) | Tp (s) |
|---|
| Case 1 | 0.0 | 1.5 | 10.0 | Case 10 | 5.0 | 3.0 | 10.0 |
| Case 2 | 0.0 | 3.0 | 10.0 | Case 11 | 5.0 | 6.0 | 10.0 |
| Case 3 | 0.0 | 6.0 | 10.0 | Case 12 | 8.0 | 0.0 | - |
| Case 4 | 3.0 | 0.0 | - | Case 13 | 8.0 | 1.5 | 10.0 |
| Case 5 | 3.0 | 1.5 | 10.0 | Case 14 | 8.0 | 3.0 | 10.0 |
| Case 6 | 3.0 | 3.0 | 10.0 | Case 15 | 8.0 | 6.0 | 10.0 |
| Case 7 | 3.0 | 6.0 | 10.0 | Case 16 | 8.0 | 1.5 | 6.45 |
| Case 8 | 5.0 | 0.0 | - | Case 17 | 8.0 | 3.0 | 6.45 |
| Case 9 | 5.0 | 1.5 | 10.0 | Case 18 | 8.0 | 6.0 | 6.45 |
Table 6.
Variance of bending stress under steady wind and irregular wave of spar.
Table 6.
Variance of bending stress under steady wind and irregular wave of spar.
| | | |
|---|
| m | 116.61 | 151.64 |
| m | 448.80 | 583.21 |
| m | 1787.83 | 2223.22 |
Table 7.
Variance of bending stress under steady wind and irregular wave of semi-submersible.
Table 7.
Variance of bending stress under steady wind and irregular wave of semi-submersible.
| | | |
|---|
| m | 19.73 | 17.60 |
| m | 71.32 | 64.18 |
| m | 292.40 | 257.04 |
Table 8.
Variance of bending stress under steady wind and irregular wave of TLP.
Table 8.
Variance of bending stress under steady wind and irregular wave of TLP.
| | | |
|---|
| m | 17.76 | 16.23 |
| m | 62.31 | 61.66 |
| m | 229.66 | 233.51 |
Table 9.
The variance of bending stress under wind-only condition (Case 4, 8, 12).
Table 9.
The variance of bending stress under wind-only condition (Case 4, 8, 12).
| | | | |
|---|
| Spar | 45.03 (MPa2) | 108.65 (MPa2) | 301.33 (MPa2) |
| Semisub | 30.32 (MPa2) | 90.55 (MPa2) | 291.49 (MPa2) |
| TLP | 16.88 (MPa2) | 38.28 (MPa2) | 178.89 (MPa2) |
Table 10.
The coupling effect under stochastic wind and irregular wave condition (Case 5, 6, 7). Mean wind speed is 3.0 m/s.
Table 10.
The coupling effect under stochastic wind and irregular wave condition (Case 5, 6, 7). Mean wind speed is 3.0 m/s.
| | |
|
|
|
|
|---|
| m | Spar | 116.61 | 161.63 | 172.50 | 10.87 |
| Semisub | 19.73 | 50.05 | 48.31 | −1.74 |
| TLP | 17.76 | 34.64 | 32.14 | −2.50 |
| m | Spar | 448.80 | 493.83 | 537.92 | 44.09 |
| Semisub | 71.32 | 101.64 | 101.32 | −0.33 |
| TLP | 62.31 | 79.19 | 76.15 | −3.03 |
| m | Spar | 1787.83 | 1832.85 | 1933.45 | 100.60 |
| Semisub | 292.40 | 322.72 | 332.44 | 9.72 |
| TLP | 229.66 | 246.54 | 240.35 | −6.18 |
Table 11.
The coupling effect under stochastic wind and irregular wave condition (Case 9, 10, 11). Mean wind speed is 5.0 m/s.
Table 11.
The coupling effect under stochastic wind and irregular wave condition (Case 9, 10, 11). Mean wind speed is 5.0 m/s.
| | |
|
|
|
|
|---|
| m | Spar | 116.61 | 225.26 | 247.91 | 22.65 |
| Semisub | 19.73 | 110.27 | 107.91 | −2.36 |
| TLP | 17.76 | 56.04 | 54.19 | −1.85 |
| m | Spar | 448.80 | 557.46 | 646.68 | 89.22 |
| Semisub | 71.32 | 161.87 | 157.71 | −4.15 |
| TLP | 62.31 | 100.59 | 97.69 | −2.90 |
| m | Spar | 1787.83 | 1896.48 | 2164.14 | 267.66 |
| Semisub | 292.40 | 382.94 | 379.18 | −3.77 |
| TLP | 229.66 | 267.94 | 264.66 | −3.28 |
Table 12.
The coupling effect under stochastic wind and irregular wave condition (Case 13, 14, 15). Mean wind speed is 8.0 m/s.
Table 12.
The coupling effect under stochastic wind and irregular wave condition (Case 13, 14, 15). Mean wind speed is 8.0 m/s.
| | |
|
|
|
|
|---|
| m | Spar | 116.61 | 417.94 | 451.23 | 33.29 |
| Semisub | 19.73 | 311.21 | 306.58 | −4.63 |
| TLP | 17.76 | 196.64 | 194.86 | −1.78 |
| m | Spar | 448.80 | 750.14 | 889.82 | 139.69 |
| Semisub | 71.32 | 362.81 | 349.21 | −13.59 |
| TLP | 62.31 | 241.19 | 240.92 | −0.27 |
| m | Spar | 1787.83 | 2089.16 | 2542.85 | 453.69 |
| Semisub | 292.40 | 583.88 | 527.32 | −56.56 |
| TLP | 229.66 | 408.54 | 414.39 | 5.85 |
Table 13.
The coupling effect under stochastic wind and irregular wave condition for semi-submersible platform (Case 16, 17, 18).
Table 13.
The coupling effect under stochastic wind and irregular wave condition for semi-submersible platform (Case 16, 17, 18).
| |
|
|
|
|
|---|
| m | 116.61 | 417.94 | 451.23 | 33.29 |
| m | 448.80 | 750.14 | 889.82 | 139.69 |
| m | 1787.83 | 2089.16 | 2542.85 | 453.69 |


