Article

Evaluation of the Effects of the Enriched-Organic Diets Composition on European Sea Bass Welfare through a Multi-Parametric Approach

1
COISPA Technolgy and Research, Experimental Station for the Study of Sea Resources, 70126 Bari, Italy
2
Department of Earth and Marine Sciences, University of Palermo, 90100 Palermo, Italy
3
National Interuniversity Consortium for Marine Sciences (CoNISMa), 00196 Rome, Italy
*
Author to whom correspondence should be addressed.
J. Mar. Sci. Eng. 2020, 8(11), 934; https://doi.org/10.3390/jmse8110934
Submission received: 21 September 2020 / Revised: 9 November 2020 / Accepted: 12 November 2020 / Published: 17 November 2020
(This article belongs to the Special Issue New Perspectives in Sustainable Aquaculture)

Abstract

:
Three groups of European sea bass (Dicentrarchus labrax) were fed for seven months, with either a conventional diet or two different organic diets, which contain organic vegetables and a natural antioxidant compound. The two organic diets differed themselves in terms of raw proteins, fish oil, and lipid contents. Sea bass welfare condition was assessed in relation to these three diets, using 16 different indicators. These were: swimming activity (recovery test, muscle activity), haematological and serological stress indicators (haematocrit, haemoglobin, red-blood-cell count, cortisol, glucose, lactate), aspecific immunity parameter (lysozyme), indicators of exposure to organic contaminants (7-ethoxyresorufin-O-deethylase and glutathione-S-transferase), and growth parameters (weight gain, specific growth rate, feed conversion ratio, protein efficiency ratio, and hepato-somatic index). Most of these parameters individually did not give consistent responses, but their integration can provide an accurate evaluation of the fish welfare conditions among the three diet experimental groups. The multiparametric approach outlined a comprehensive picture of sea bass physiological state. The principal component analysis and the multi-criteria-decision-analysis were found to be useful tools for an integrated fish welfare assessment, highlighting that the best welfare condition was achieved in the experimental group fed with the protein-rich organic diet.

1. Introduction

Aquaculture plays a crucial role for supplying the increasing demand of animal protein to feed the growing world population [1]. However, the future expansion of aquaculture remains hampered by the demand for wild forage fish for the production of feed used for aquaculture, among other factors. Indeed, the capacity of wild fisheries to cope with the increasing demand for fishmeal and fish oil has reached the limit of sustainability [1]. Moreover, fishmeal and fish oil derived from the wild can be considered a vehicle of contamination as organochlorines, such as polychlorinated biphenyls (PCBs), polycyclic aromatic hydrocarbons (PAH), and dioxins, principally accumulate in the lipidic fraction [2]. These contaminants are attracting particular attention since exposure through diet can trigger a long-lasting effect on fish physiology, behaviour, and ultimately growth and reproduction [3]. As a result, aquaculture tends to move toward more sustainable and organic sources of fish meal and oil [4,5], even if the challenge of the transition is still huge [6].
Organic aquaculture is an alternative production that combines environmental friendly practices, the maintenance of biodiversity, preservation of natural resources, high animal welfare standards, and production methods in line with defined standard of quality, using natural substances and processes [7]. Organic feed is composed of a greater percentage of proteins and oils from land-based agriculture combined with natural antioxidants [4,8]. The partial substitution of fishmeal and fish oil with plant proteins and oils was found to be a promising alternative to fish protein (and oil) already adopted for commercial diets [9,10,11], while total substitution can disrupt physiological processes and growth performances [12,13]. Currently, soybean meal represents the predominant choice in terms of vegetable protein source, considering its relative high protein content and suitable amino acid profile [14]. Nevertheless, some limitations still exist regarding the soybean meal percentage that can be tolerated in fish feed formulation, especially for carnivorous fishes. For European sea bass (Dicentrarchus labrax), which is a key species of European marine aquaculture [15,16], a partial substitution of fish meal with raw plant material can be used, showing interesting results concerning the physiological and growth performances, along with an improved flesh quality [17,18]. These results are promising to support the transition towards more sustainable aquaculture, which would mitigate the environmental issues while ensuring good growth performances and the welfare of farmed fish.
In the last decades, the welfare of farmed fish received considerable attention, becoming a key point of the aquaculture [19,20,21,22,23,24]. The basis for fish welfare is that fish are sentient animals capable of experiencing good or bad feelings or emotional states [25]. Most of the animal welfare definitions could be linked to biological functions and/or feelings [22], although this has been recently questioned [26]. In the first case, the welfare is correlated with physiological state including the stress response measured for example by blood parameters (e.g., cortisol, glucose, lactate). In the second case, the welfare is more linked with avoiding negative (e.g., pain, fear, hunger) experiences measured, for example, by behavioural parameters (e.g., swimming activity, energetic balance) [27]. However, addressing fish welfare remains a complex issue due to the difficulty of finding realistic and objective indicators that can describe the overall response of the organisms in captivity [21,28]. In teleost fishes, the welfare is closely linked with the stress response [29]. Thus, the measure of cortisol, the major end-product of the hypothalamo–pituitary–interrenal (HPI) axis, is commonly used as a proxy of welfare in the aquaculture research [30,31]. In addition, changes in metabolism (e.g., lactate, glucose), hematological (e.g., hematocrit, hemoglobin), and immunity (lysozyme) features, constituting the secondary stress response [32,33], are also commonly used for welfare assessment (e.g., [34,35,36,37,38,39,40]). However, stress does not always mean suffering or low welfare [28]. Indeed, the stress could also be seen as an adaptive function that, in the short term, allows fish to preserve both single individual and population [28]. However, a prolonged stress condition is known to trigger higher cortisol levels in plasma that may result in an energy imbalance [41]. From this perspective, the cortisol could be used as the welfare indicator, but needs to be coupled with more integrative welfare indicators [42,43], such as behavior [44,45,46], swimming [47,48,49], or growth performances, which constitute the tertiary stress response [32]. In particular, the measurement of muscular activity, through electromyography (EMG), appeared to be a sensitive and promising method to assess the fish welfare status [34,50].
Previous studies have considered only specific aspects of the effects of diets with a partial substitution of proteins and antioxidants, such as feed conversion, immunity, or flesh quality. Thus, the main scope of the present study is a deeper investigation of the effect of the two organic diets (Dana Fish DAN-EC 1650TMand Dana Fish DAN-EC 2640TM) on the welfare of the European seabass in comparison to a conventional one (DAN-EX 1754TM). To do so, a holistic approach was adopted, including the measurement of primary (cortisol), secondary (i.e., lactate, glucose, hematologic parameters, lysozyme), and ultimately tertiary (i.e., swimming performances, muscular activity and growth parameters) stress response indicators. In parallel, we assessed the 7-ethoxyresorufin-O-deethylase (EROD) and glutathione-S-transferase (GST) enzymatic activities, as a functionality index of the hepatic microsomal mixed-function oxygenase (MFO) system [51,52], to assess possible effects of pollutant contamination through diet. In this study, multi-parametric analysis approaches were performed to obtain a better understanding of the effectiveness of a holistic approach to quantify welfare in organic aquaculture.

2. Materials and Methods

2.1. Ethical Consideration

Care and handling of fish were accomplished in accordance with the recommendations 2007/526/EU C2007 2525 on the accommodation and care of animals used for experimental and other scientific purposes. The experimental protocol was approved by the ethic committee on the animal experiments of COISPA. All the fish manipulations were performed on fish completely anaesthetized (stage 4: loss of reflex activity and no reaction to strong external stimuli; [53]) with a 30 mg L−1 of clove-oil to minimize pain and discomfort of fish. Survival after manipulations was 100%.

2.2. Experimental Design and Rearing Conditions

Adult sea bass (1.3 years old) were purchased in 2007 from a commercial hatchery (Panittica Pugliese S.p.A., Fasano, Italy) The fish came from the same eggs batch (wild broodstock) and they were left undisturbed during 2 months before the following experimental procedure. Water temperature (18 ± 0.5°C), O2 concentration (5.30 ± 0.16 ppm), pH (7.09 ± 0.02), photoperiod (12:12 D:L), and water recirculation (10 L min−1) were maintained constant during the entire duration of the experiment and did not differ between the different diets. Fish were fed by automatic feeders for a period of three hours (09:00–12:00 h) six days per week at 0.9% of the tank biomass.
After the acclimation period, fish were split in nine fibreglass tanks of 1.2 m3 (n = 3 for each diet), as reported in Table 1. Fish mean weights and mean total lengths were not statistically different among the different diet conditions (Kruskal–Wallis test: p > 0.05 for both, Table 1). The three groups of fish were fed for about seven months (from December 2007 to June 2008—208 days) with three different diets (see Table 2).
The first group was fed with a conventional diet (Dana Fish DAN-EX 1754TM, later called conventional) and served as a control, while the other two groups were fed with two different organic diets (Dana Fish DAN-EC 1650TM and Dana Fish DAN-EC 2640TM later called respectively organic diet 1 and 2; Table 2). The two organic diet according with the EU regulation (EC, 1358/2014) for organic aquaculture comprise <25% of fishmeal and <10% of fish oil (23% and 4% in the diet organic 1 and 13% and 9% in organic diet 2 respectively of fishmeal and fish oil). The two organic diets contained a greater content in vegetable proteins than the conventional diet (41.4% for organic diet 1 and 43.9% for organic diet 2 vs. 34.8% for conventional). Moreover, the vegetable component in organic diets coming from organic agriculture. The antioxidant compound used in the organic diets was the rosemary essential oil (200 g kg−1) while Butylated hydroxytoluene (BHT) was used in the conventional diet. The two organic diets differed each other both in proportion of the crude proteins (50% and 40% respectively for organic diet 1 and organic diet 2) and total lipids percentages (16% and 26%, respectively for organic diet 1 and organic diet 2; Table 2).

2.3. Blood and Hepatic Sampling and Morphometric Procedures

First, at the beginning of the experiment, fish (n = 20) were randomly and gently caught from their stock and anesthetized using clove oil as previously described. When fish were anesthetized (~after 3 min in anesthesia bathing), blood samples were taken using heparinized syringes (needle 23 G). Two intermediate blood samplings were then performed over the experiment (at 70 and 130 days after the beginning of the experiment) on seven fish from each tank (n = 21 fish per diet) and at the end of the experiment (208 day after), eight fish per tank were sampled (i.e., n = 24 fish per diet). In parallel, liver tissues were extracted from 20 fish at the beginning of the experiment and from 5 fish per tank at the end of the experiment (n = 45 fish in total). Fish euthanasia was realized using an overdose of clove oil (60 mg L−1). For each fish, the blood sample taken was circa 0.5 mL.
For each sample, 5 µL was directly stored at −20 °C for the haemoglobin (Hb) determination, other 5 µL were diluted in 1 mL of Hendriks solution for erythrocyte counts (RBCC) and stored at +4 °C, and about 25 µL to fill microhaematocrit tubes Haematocrit (Hct) quantification. The remaining part of the blood sample was centrifuged at 2000× g for 3 min to obtain plasma which was stored at −80 °C for cortisol, lysozyme, glucose and lactate further quantification.
The hepatic samples were stored at −80 °C before the analysis. The sea bass hepatic cytosolic and microsomal fractions were prepared as reported by Corsi et al. [54]. The hepatic sample were used to quantify the 7-ethoxyresorufin-O-deethylase (EROD) and glutathione-S-transferase (GST) enzymatic activities, as functionality index of the hepatic microsomal mixed-function oxygenase (MFO) system.
Finally, n = 10 fish per tank, at the beginning and in the intermediate sampling, and n = 20 fish per tank at the end were used for morphometric measurements: total length measured to the nearest 0.5 cm, total weight measured to the nearest 0.1 g, gutted weight to the nearest 0.01 g and liver weight to the nearest 0.01 g. The calculation of growth parameters is further presented in the Section 2.6.

2.4. Quantification of the Haematological and Serological Parameters and Enzymatic Activities

The Hb concentration was determined using cyanmethemoglobin method with a commercial kit (Sigma, St. Louis, Missouri, USA). Hct was determined using a micro-haematocrit tube filled directly by the syringe needle, centrifuged (15,000× g for three minutes) and immediately read. The number of RBCC was determined using a Bürker counting chamber under a light microscope (Nikon 400E, Nikon, Tokio, Japan) at 40× magnification. Plasma glucose and lactate concentrations were determined using a commercial kit (SentinelTM, Milan-Italy) based on the enzymatic-colorimetric Trinder reaction (GOD/PAP glucose and PAP lactate). Lysozyme concentration was measured using turbidimetric assay modified for microplate reader [41]. Plasma cortisol concentration was quantified by high performance liquid chromatography according to Vissali et al. [55] and modified for European sea bass as reported by Carbonara et al. [41].
EROD activity was determined, into the hepatic microsomal fraction, according to Burke & Mayer [56]. GST activity was determined by the hepatic cytosolic fraction and measured using spectrophotometer as described by Habig et al. [57], modified for microplate readers. By using a Shimadzu UV-160A visible spectrometer (Shimadzu, Kyoto, Japan) and bovine serum albumin as standard, the total amount of proteins was determined according to the procedure described by Bradford [58].

2.5. Critical Swimming Speed Tests and EMG Activity Monitoring

In order to monitor fish red muscle activity, a total of n = 18 individuals (n = 2 per tank; 6 per diet) were surgically implanted with CEMG-R11-25 (Lotek Wireless™; 12 g in air) and ~3–4% of fish weight radio transmitters as described in Lembo et al. [59]. Although a ratio between tag and weight of the fish not greater than 2% is generally considered optimal, this ratio is species specific and, in some cases, such as sea bass, it was observed that a ratio of 3–4% did not affect growth and swimming behaviour [34]. Specimens were randomly selected for the surgical implantation of EMG radio tags and were fasted 24 h before the surgical procedure [60]. Fish were gently caught from their rearing tank and bathed into anaesthetic about 5 min until loss of reflex activity and no reaction to strong external stimuli [53]. After this period gills were continuously irrigated with anaesthetic solution to proceed the surgery. EMG-tags were implanted into the peritoneal cavity through a 3 cm incision located 4–5 cm posterior to the pelvic girdle. The gold electrodes of the sensor were inserted in the red muscle band by mean of a hollow needle. The incision was closed with four independent sutures [34]. The surgery lasted on average 5 min, followed by a recovery time of about 10 min. After that, all fish were recovered successfully. Each tagged fish was treated with antibiotic injections (sodic-ampicillin-cloxacillin 1 mg kg−1 24 h−1) for 3 days after the surgery as described in Lembo et al. [61]. The fish resumed feeding circa 5 days after the surgery. The two gold tipped electrodes positioned in the red muscle of the fish allowed to decode the electromyographical signals (EMG) [62]. In the EMG-tag, the changing voltage in muscle activity was corrected, summed and stored every five seconds. Then, the average value was transmitted to a radio receiver as an entire adimensional number ranging from 0 to 50 [50], allowing for real time monitoring of each free swimming fish.
After this period all the fish were considered completely recovered from the surgery [63], and were subjected to a critical swimming speed test (Ucrit) in a Blažka style swimming chamber to calibrate EMG signals with the Ucrit test as described in Carbonara et al. [34]. Briefly, Ucrit is a swimming test in which fish swim in a chamber at increasing speed step (0.1 m s−1 every 10 min) until the fatigue is reached, determining the critical swimming speed of the challenged fish (Ucrit) [59]. The calibration gives the possibility to correlate each single swimming level to an activity index expressed as the EMG level [50]. In particular, the EMG level at the Ucrit speed represents the threshold limit of the aerobic muscular activity [34].
After the calibration in the critical swimming speed, fish were released in the experimental tanks and the EMG signals were recorded during the feeding period (9 AM–1 PM) and no-feeding period (2 PM–6 PM; starvation period). Daily average index of muscle activity is expressed as a ratio between the value of EMG recorded in tank and EMG value at Ucrit (EMG/ EMG at Ucrit). The measurement of EMG value lasted for 110 days.
Finally, at the end of the experiment, three fish per tank (n = 9 per diet treatment) were randomly selected to perform a recovery test, as described in Carbonara et al. [41]. The recovery test consists in submitting the fish to a second critical swimming test, one hour after the first one, to estimate both relative Ucrit1, Ucrit2 and the recovery ratio value (RR = Ucrit2/Ucrit1). The latter is a useful index to assess the fish capacity to restore the metabolic glycogen storage in muscle, after a first Ucrit test was already performed [64].

2.6. Growth Parameters Calculations

Fish growth performances were estimated for each tank (n = 3 tanks per diet treatment) as follow. Specific growth rate (SGR) was calculated according to the following equation [65]:
SGR = 100 × ( lnW t 2 lnW t 1 ) × T 1
where W is the total weight of the fish respectively at the end (t2) and the beginning (t1) of the experiment and T is the number of feeding days. The food conversion ratio (FCR) was calculated as the ratio of the feed supplied (kg of dry weight) per biomass of weight gained (kg). The protein efficiency ratio (PER) was calculated as the biomass gained (kg) divided by the total amount of proteins (kg) administered during the trial. The effects of the different treatments were also evaluated considering the hepato-somatic index (HSI), calculated as the liver weight divided by the gutted body weight of fish and expressed as percentage.

2.7. Statistical Analyses

Statistical analyses were performed using the R software [66] excepted otherwise mentioned, and were carried out at the 95% level of significance. All the data are reported as mean ± s.e.m. (standard error of the mean). All the data were prior checked for normality (Shapiro–Wilk test) and homogeneity of variance (Levene test).
The mean EMG values per day, the Ucrit1 and Ucrit2 values, growth parameters and biomarkers data were statistically analysed with one-way ANOVA or Kruskal–Wallis’ test depending on the condition of application. For the haematological and serological parameters, a two-way ANOVA was performed using the diet and time as fixed factors. Tukey’s post-hoc test was then applied to highlight differences between the diet groups.
The correlation between daily mean EMG values within diet treatments overtime, for the two registered periods, were first evaluated using the Pearson’s correlation test. The regressions of the two data collection periods (feeding and fasting) were then compared in each group by the analysis of covariance (ANCOVA). The comparisons between the recovery ratio (RR) values (Ucrit2/Ucrit1) and the value 1 (RR in fish completely recovered after the first Ucrit) in each diet group and the comparisons between Ucrit1 and Ucrit2 were performed using a Wilcoxon’s test.
Furthermore, a principal component analysis (PCA) was performed on sixteen of the parameters monitored (Hb, Hct, RBCC, SGR, HSI, FCR, PER, RR, EMG (feeding period), GST, EROD, gained weight, glucose, lactate, cortisol, lysozyme) in the three experimental groups using FactoMineR package [67]. The relevant dimensions of the PCA were selected using the acceleration factor method [68]. The PC score of the relevant axes were then downloaded and, Kruskal–Wallis test was performed and followed by Tukey test.
Among the 16 parameters used in PCA, seven were selected based on significant differences of these parameter between the diets (cortisol, glucose, lysozyme, SGR, HSI, RR, and EMG) to perform a multicriteria decision analysis (MCDA) by means of a non-structural fuzzy decision support system (NSFDSS), a decision-setting model used for ranking a set alternatives on the basis of agreed-upon criteria [69]. In this case, the decisions to be ranked are the three diets, and the decision factors (names thereafter also criteria) are 7 selected parameters. The non-structural fuzzy decision support system (NSFDSS) is a method for multi-criteria decision analysis (MCDA), belonging to the methods of deterministic preference modelling [69,70,71,72,73]. NSFDSS is used for ranking a set of possible decisions on the basis of agreed-upon decision factors. This multi-criteria decision technique, although generally applied in participatory management of natural resources [69,74], was considered particularly suitable to be applied to derive the ranking of the diets on the basis of observations of the 7 parameters, because based on a simpler scoring scale respect to other techniques (0, 0.5, 1). The NSFDSS requires, as other MCDA tools, that the problem is structured into different steps: decomposition, comparative judgment, and synthesis of priorities.
Thus, first a goal (fish welfare) is outlined then a decision tree is built moving downward to the lower levels to reaching more specific decision factors. The decision factors (level 1) or criteria deemed to be important for contributing to the goal are thus elicited; in our case the criteria are represented by the selection of the seven physiological parameters. Then, a number of different alternatives (level 2) are also defined to reach the goal. In our case, they are the diets. These alternatives are scored against each decision factor and then pairwise comparisons are made also between decision factors. The last step is the synthesis of priorities. Local priorities are multiplied by the priority of their corresponding criterion on the level above and then weighted by means of classification of criteria, constructing a sort of composite priority. In the NSFDSS, a comparative judgement and a synthesis of priorities were made. The former was performed by the construction of pairwise comparisons among the diets: each diet was compared with the others on the basis of each shared criterion; then, pairwise comparisons were made also among criteria. While, during the step of priorities synthesis, the local priorities were multiplied by the priority of their corresponding criterion and then weighted by means of classification of criteria as a sort of composite priority. The results of pairwise comparisons among diets according to the behaviour of each physiological parameter in relation to sea bass welfare. Moreover, the same analysis was conducted in the hypothesis of the equivalence of the criteria in the ranking of diets (“equal importance of criteria” hypothesis), in order to evaluate the differences of the results between the two hypotheses. The MCDA was performed using a freeware Excel sheet online [75].

3. Results

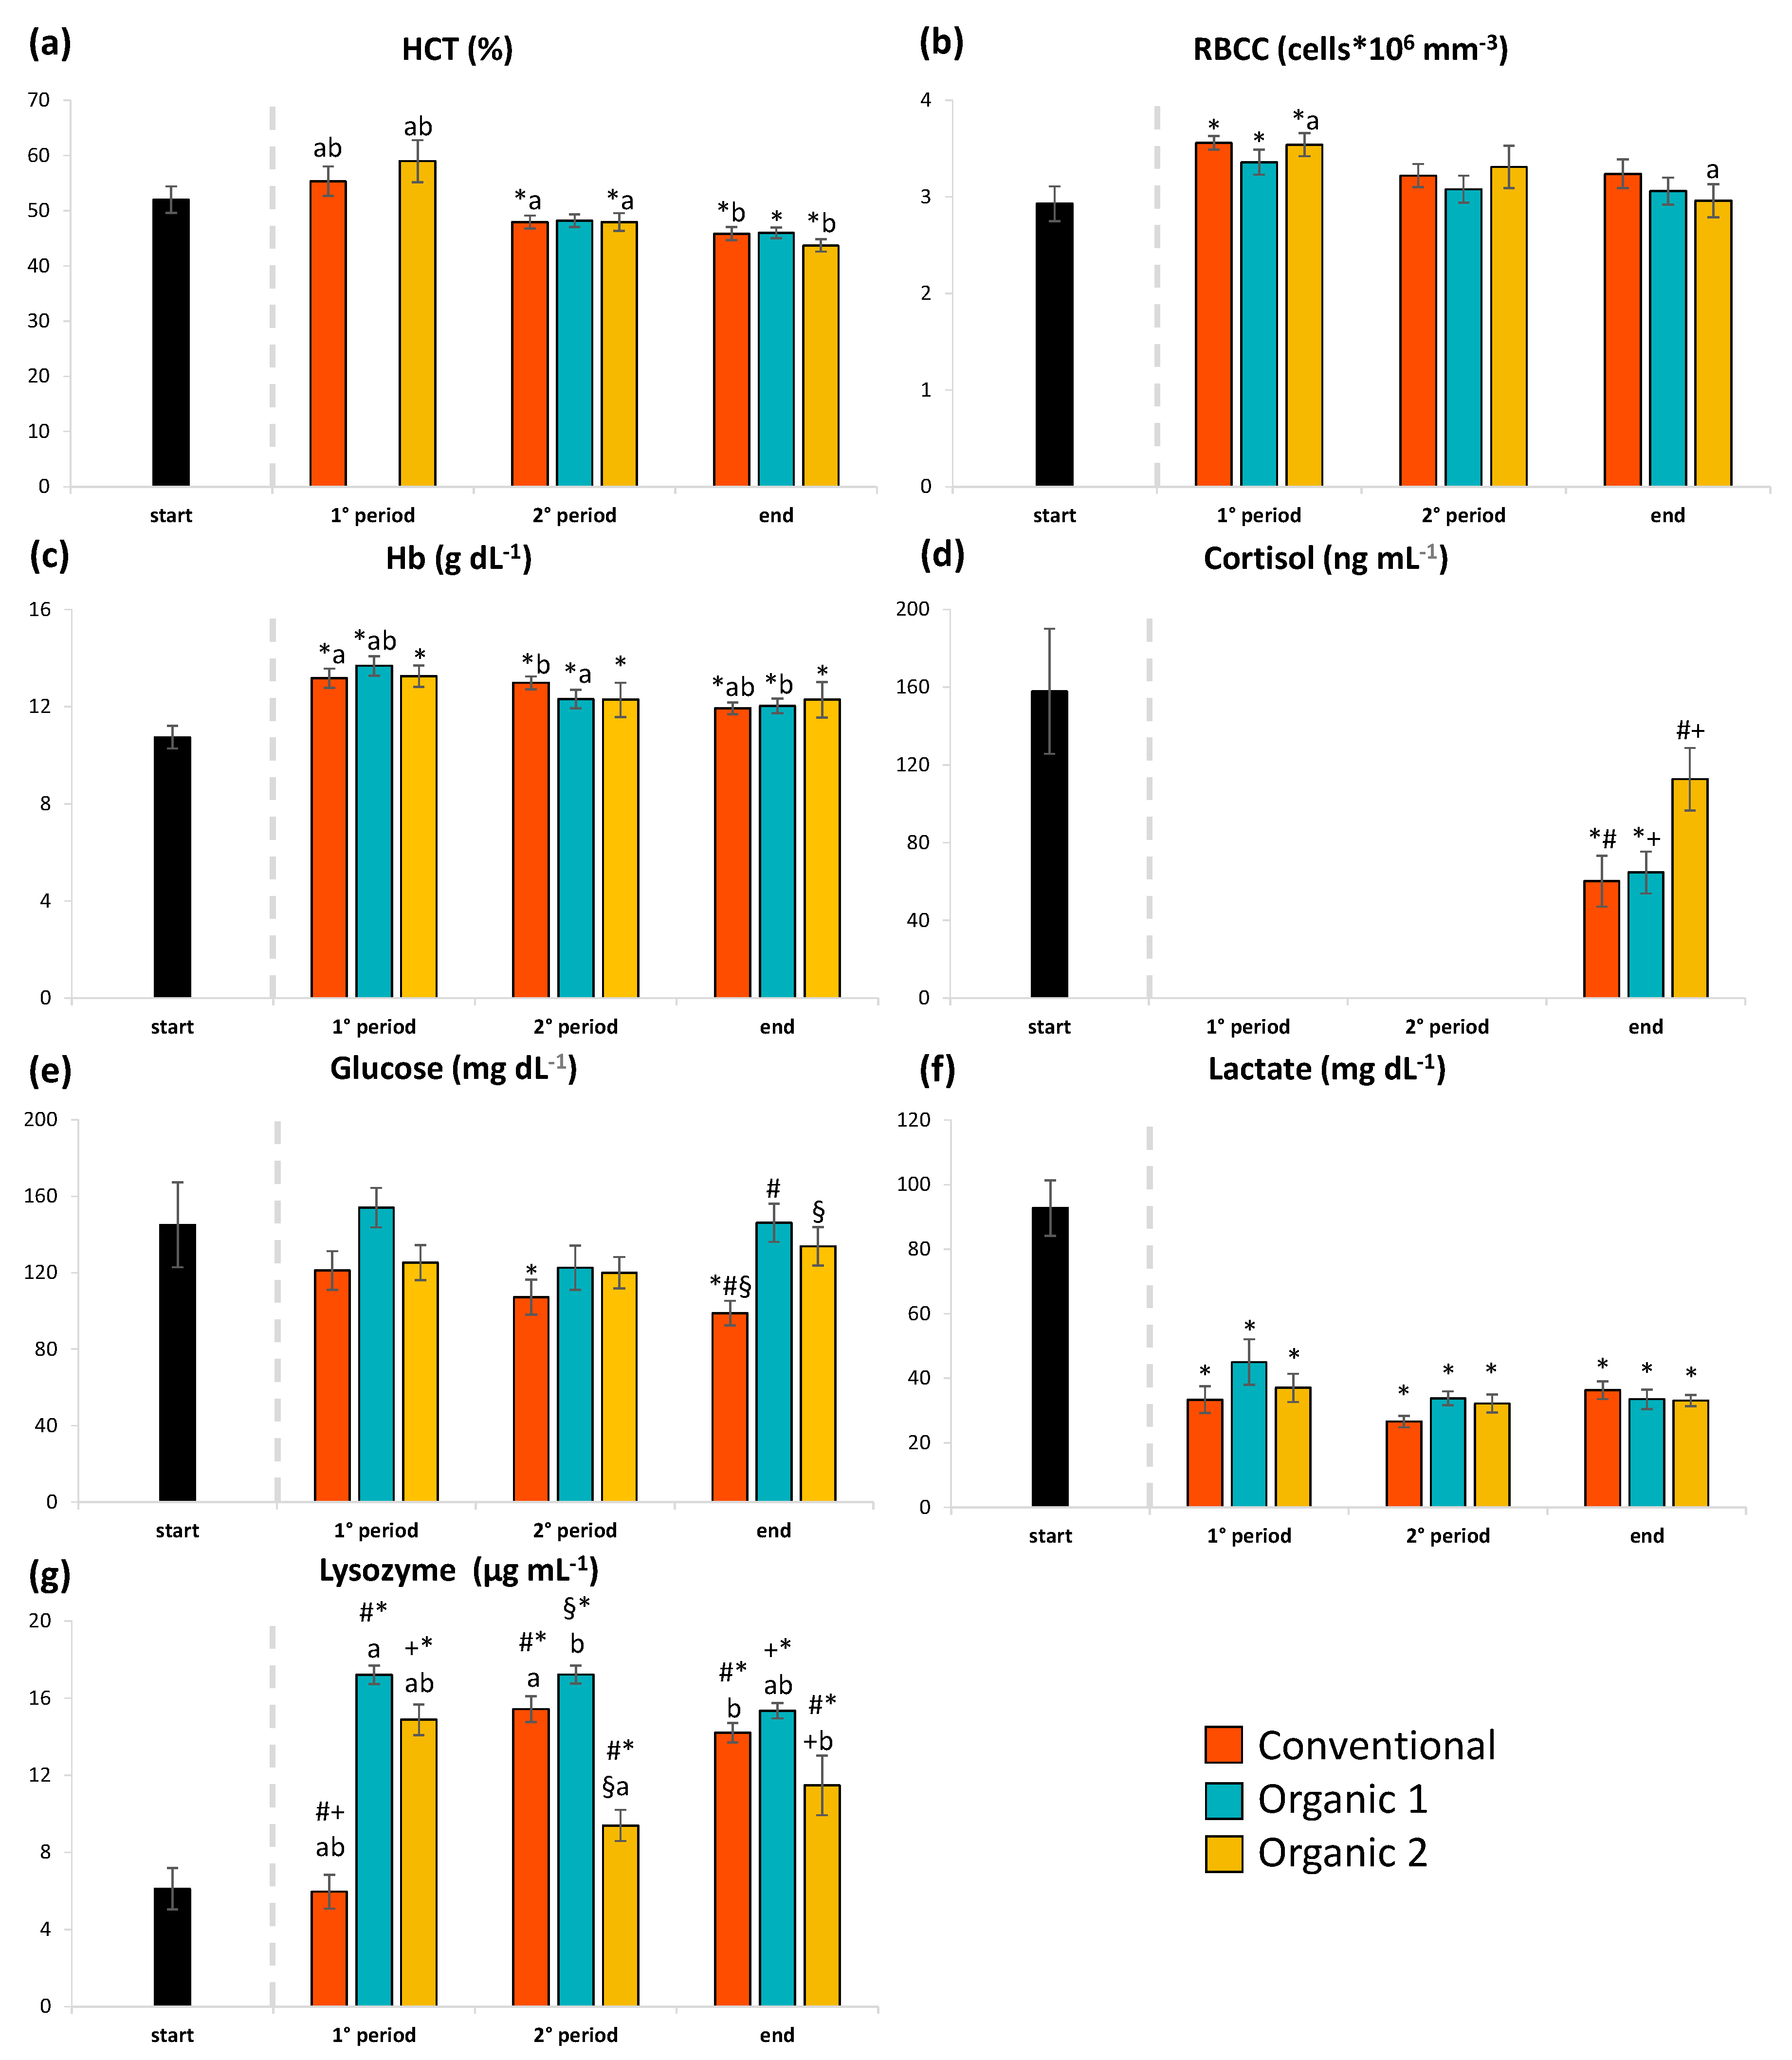
3.1. Haematological and Serological Parameters

No significant differences were found in the Hct values following the administration of the three diets during all experimental duration (ANOVA, p > 0.05; Figure 1a). Moreover, the haematocrit values decreased over the experimental period in all treatments, reaching levels significantly lower than those found at the beginning of the experiment (ANOVA, p < 0.05). The RBCC values showed a general increase for all the groups in the first two months in comparison with the beginning of the experiment (ANOVA, p < 0.05). In particular, this increment was significant for fish fed with the conventional diet and with the organic diet 2 (Tukey HSD, p < 0.05; Figure 1b). The Hb concentration showed a trend similar to the Hct and RBCC parameters, showing a significant increase in the first two months period for all the experimental groups (ANOVA, p < 0.05), and thereafter a significant reduction between the first and the second period of the experiment in fish fed with organic diet 1 (ANOVA, p < 0.05; Figure 1c).
Initial plasma cortisol concentration was significantly higher than the level recorded at the end of the experiment for the conventional diet and the organic diet 1 (Kruskal–Wallis test, p < 0.05; Figure 1d). At the end of the experiment, fish fed with a higher protein level (conventional and organic diet 1) showed the lower cortisol concentration than fish fed with the Organic diet 2 (Tukey HSD, p < 0.05). Plasma glucose levels showed a high variability within each diet group (Kruskal–Wallis, p < 0.05; Figure 1e). In particular, glucose concentration in fish fed with the conventional diet showed a progressive significant reduction of glucose levels (ANOVA, p < 0.05; Figure 1e). In all sampling points, the glucose level of the conventional diet group was significantly lower than the other experimental groups (Tukey HSD, p < 0.05). Lactate level was significantly higher for the first period than the following ones in all the experimental groups (ANOVA; p < 0.05; Figure 1f), showing a decrease over time. No significant differences between the diet treatments were found in each sampling point (ANOVA, p > 0.05 for each diet; Figure 1f).
Finally, the lysozyme concentration in all the diets was significantly higher at the end of the experiment than at the beginning (Kruskal–Wallis test, p < 0.001; Figure 1g). As for cortisol, the higher lysozyme levels were found in fish fed with diets rich in proteins (i.e., conventional and organic diet 1; Tukey HSD, p < 0.05; Figure 1g).

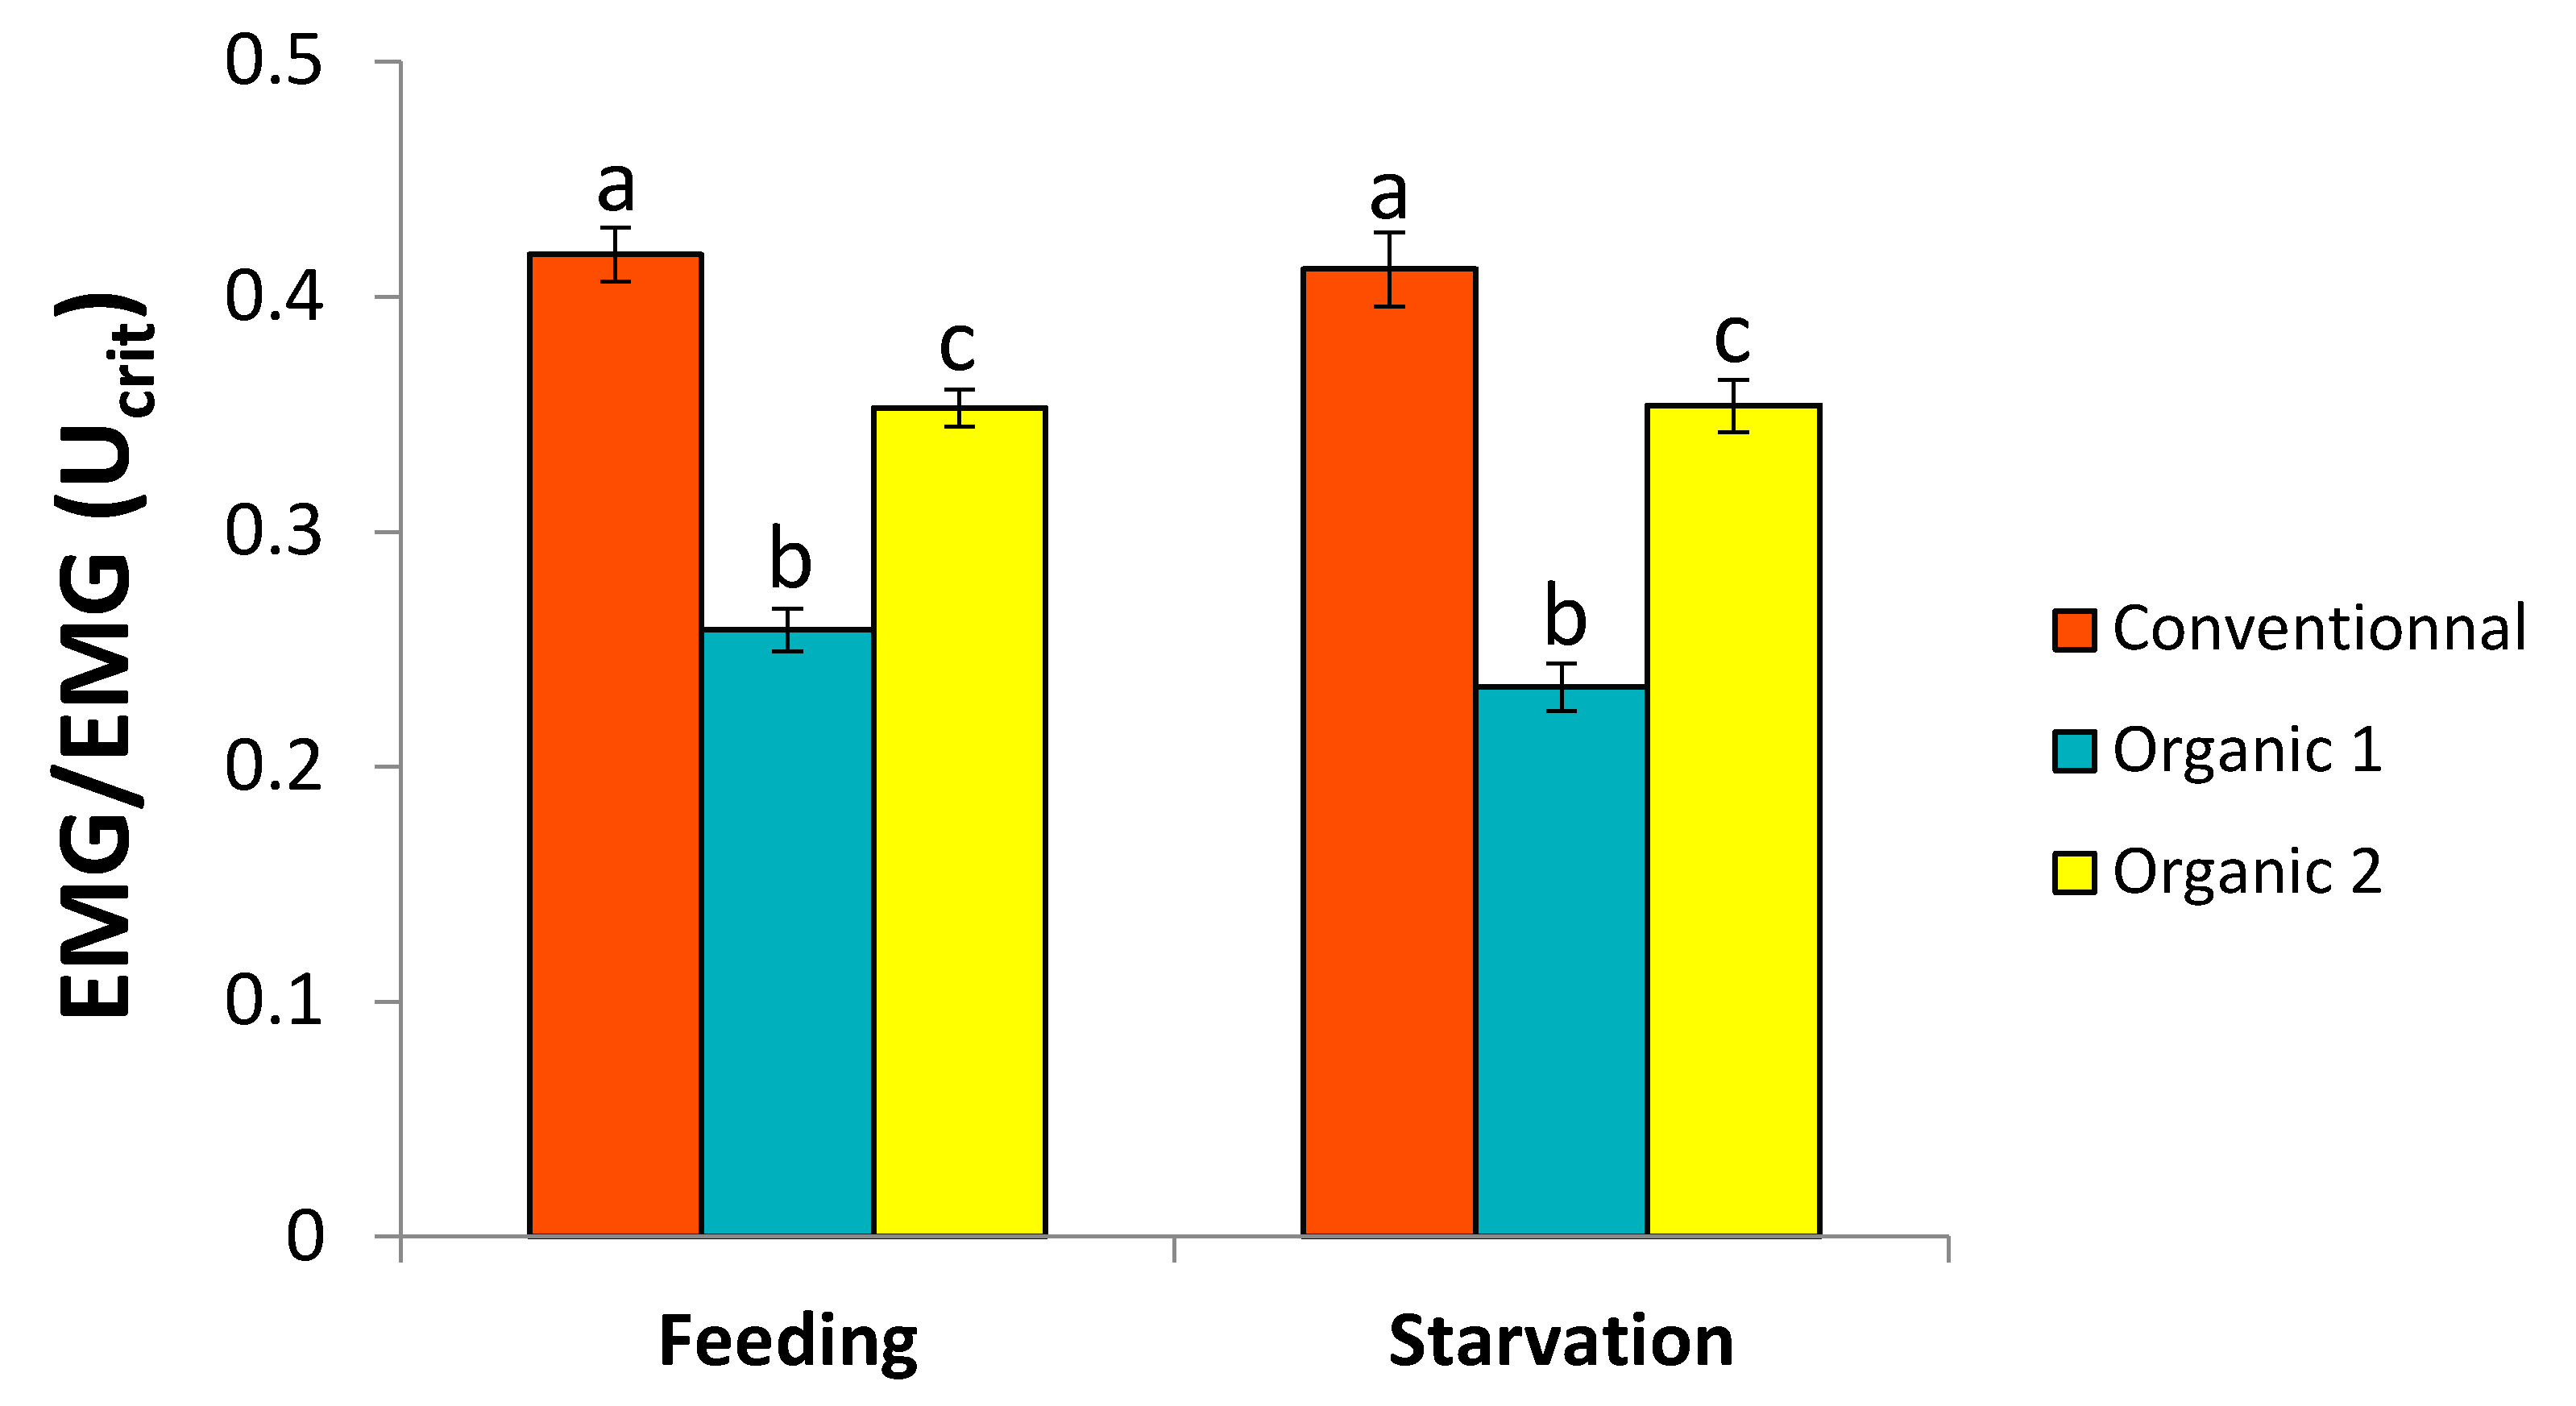
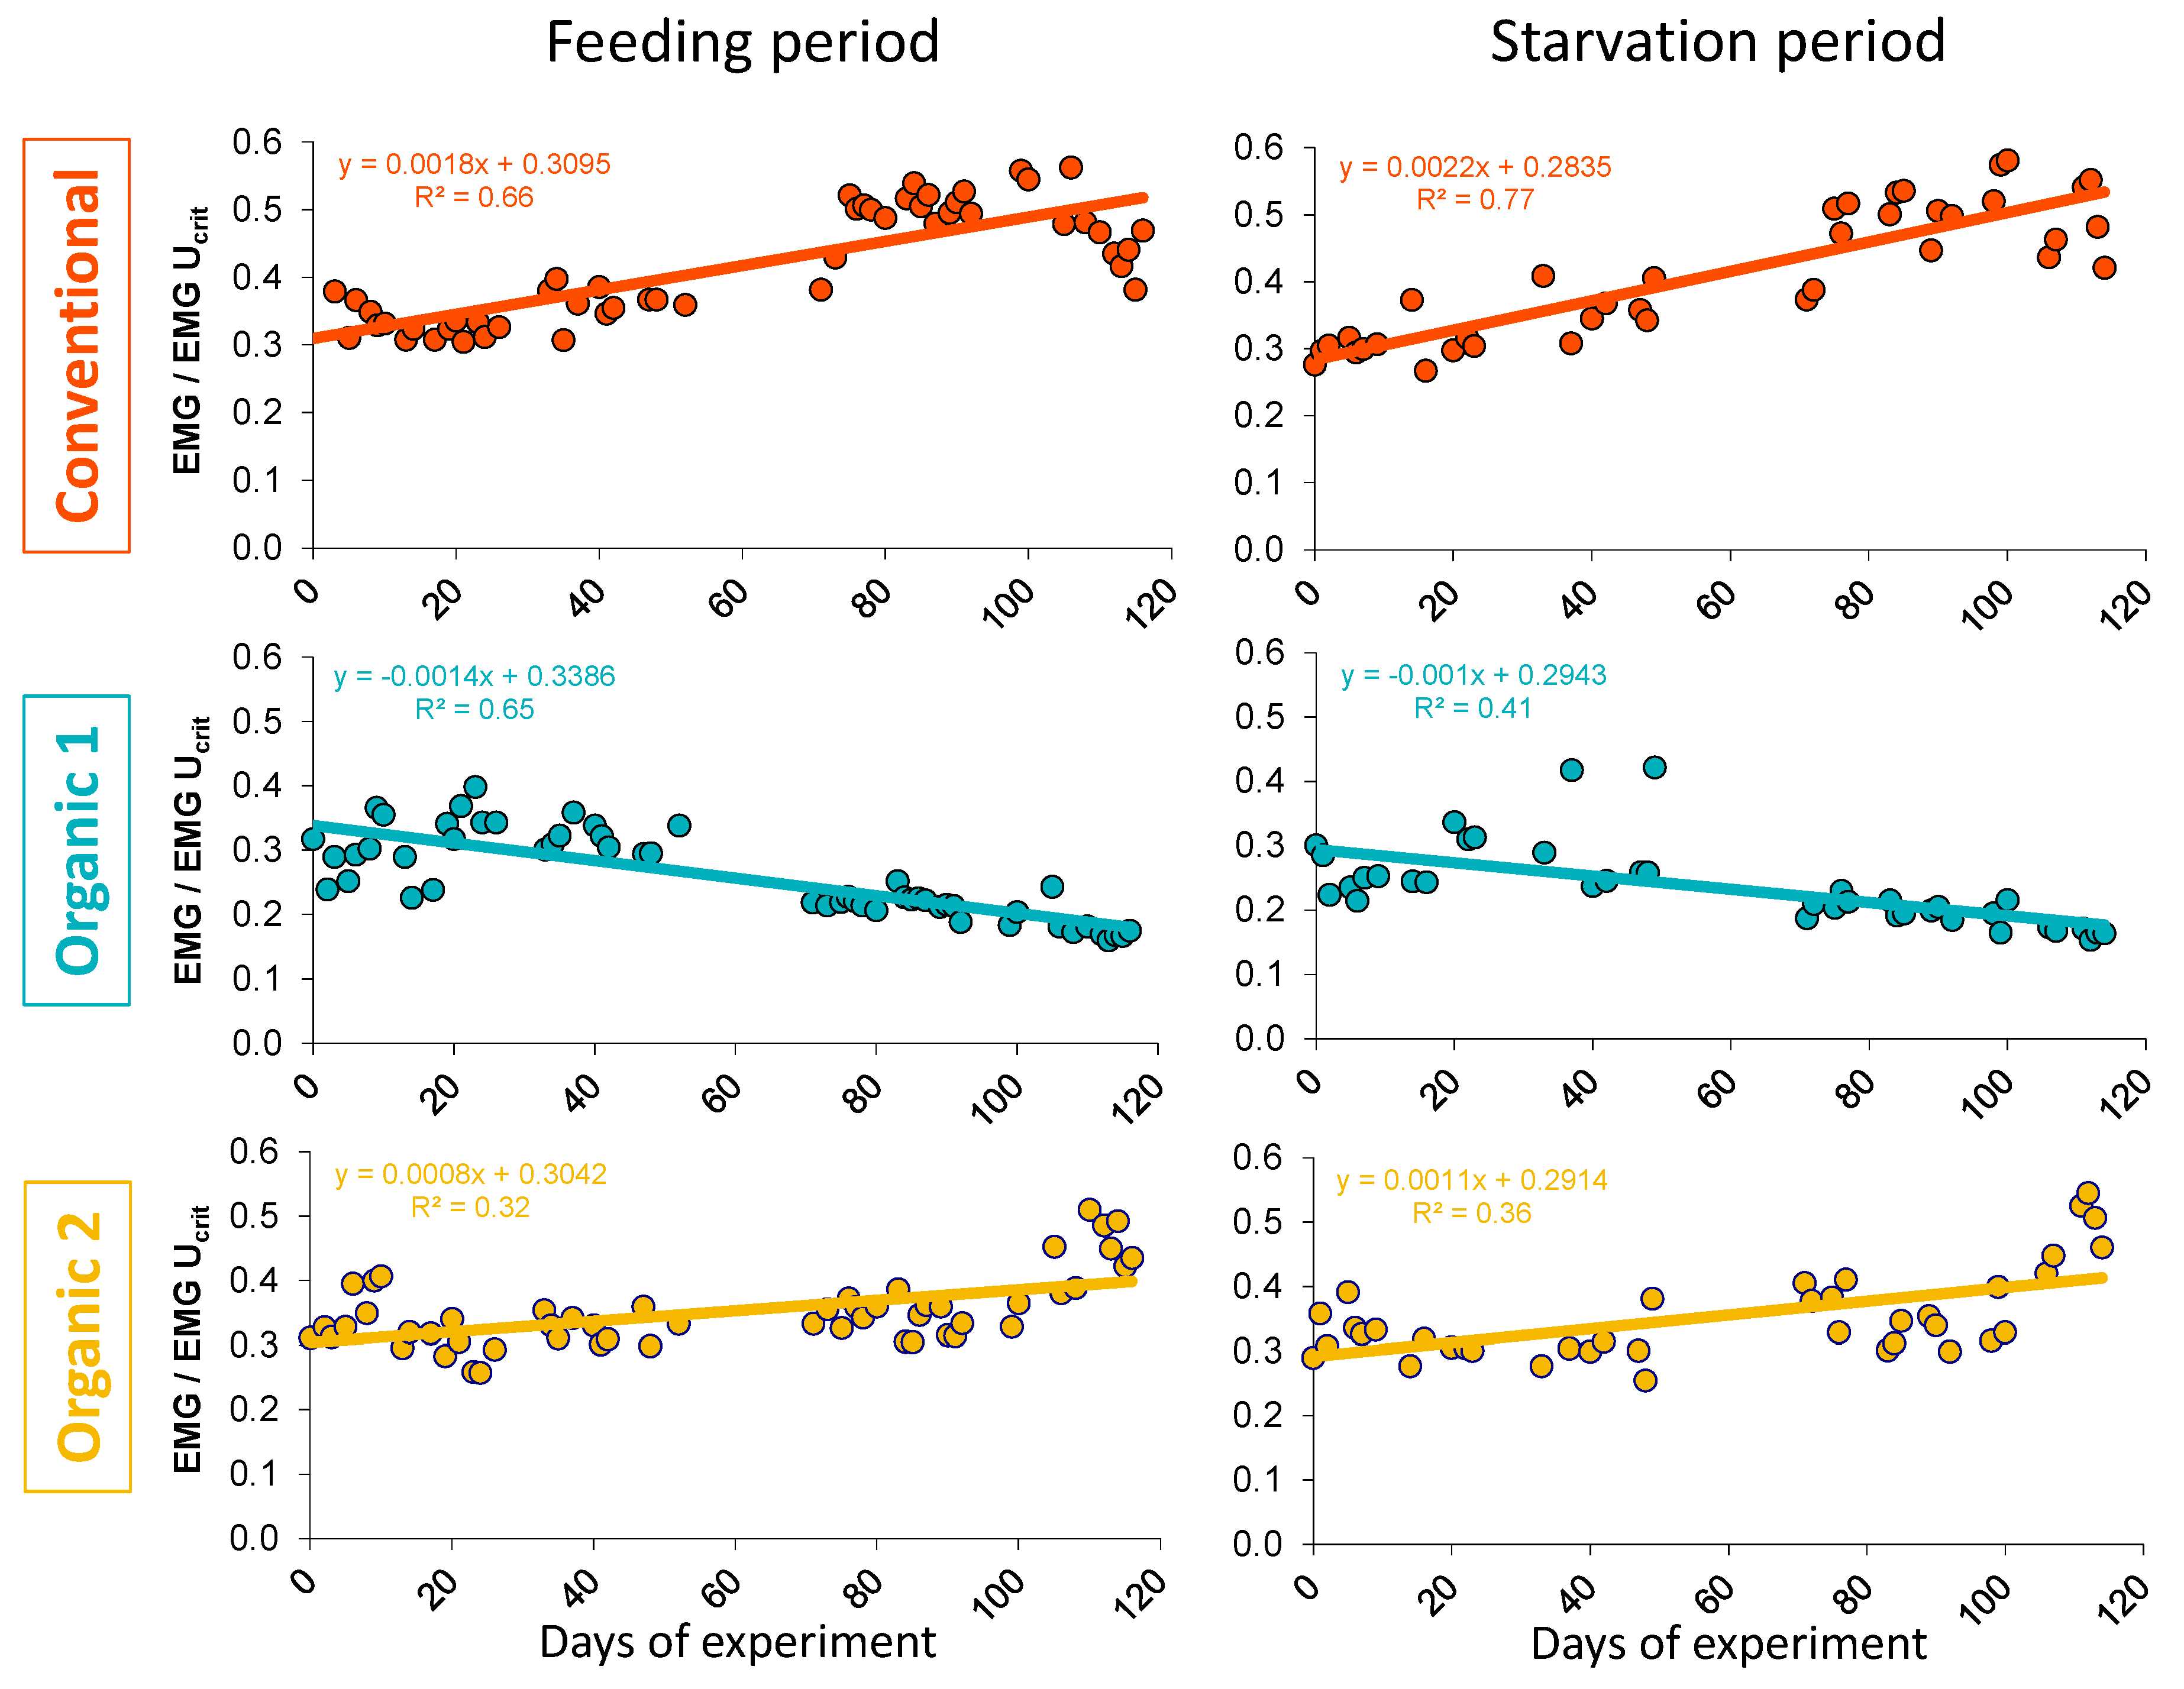
3.2. Physiological Parameters—Critical Swimming Speed and EMG

The average index of muscle activity (EMG) resulted significantly different among the three experimental diet groups but there were no significant differences between recording periods (i.e., feeding and starvation) (Kruskal–Wallis test, p < 0.05; Figure 2).
The post hoc test revealed that fish fed with the organic diet 1, richer in proteins, showed the lowest EMG value during feeding and starvation periods while the conventional ones showed the highest EMG value (Tukey HSD, p < 0.05). The daily mean value of EMG showed a significant correlation for the three diets with the time both for the feeding and starvation periods (Spearman rho test, p < 0.05 for all; Figure 3). In particular, the analysis of the direction of the Spearman correlation indicated that the EMG values have a significant negative trend during the experiment for fish fed by the diet Organic 1 (feeding period: p < 0.001; Starvation period: p < 0.001), while both the diet conventional and organic diet 2 showed positive trends during the experiment (feeding period: p < 0.001; starvation period: p < 0.05 for both) (Figure 3).
The analysis of covariance between the feeding and starvation periods showed that the slopes were significantly different between the three diets (ANCOVA, Fcalc > Fcrit), while the values of the intercepts were significantly different only for fish fed by the diet Organic 1 (ANCOVA, Fcalc > Fcrit). The average values of the two consecutive critical swimming speed tests (Ucrit) and the recovery ratio are reported in the Table 3.
First, there is no difference for both Ucrit1 and Ucrit2 values between the three diets (Kruskal–Wallis, p > 0.05 for all). Although, fish fed the conventional diet did not show a significant difference between the Ucrit1 and Ucrit2 values (Wilcoxon test, p > 0.05), this result was not confirmed by the analysis of RR. Indeed, only the fish fed with the conventional diet displayed a RR lower than 1 (Wilcoxon test, p < 0.05).

3.3. Specific Biomarkers—EROD and GST

All three experimental diets induced a decrease of the EROD activity over time, especially for fish fed with the conventional diet and the organic diet 2 (Kruskal–Wallis test, p < 0.05; Table 4). No significant differences were found between the three diets, and no significant differences were observed over time for the GST activity regardless of diet (Kruskal–Wallis test, p > 0.05 for all; Table 4).

3.4. Growth Parameters

At the end of the experiment, hepato-somatic index (HSI) was higher than the initial value in all groups (ANOVA, p < 0.001). In addition, significant differences were also found between all diets for other growth parameters indexes (Tukey HSD, p < 0.05 for all; Table 4). In more details, the SGR was significantly lower in fish fed with the conventional diet in comparison to fish fed by the two organic diets (Kruskal–Wallis, p < 0.05). On the contrary, the FCR and PER were not influenced by the diets (Kruskal–Wallis, p > 0.05, Table 4). Fish fed with the two organic diets showed better growth performances both in terms of length and weight gained compared to fish fed with the conventional diet (Tukey HSD, p < 0.05 for all; Table 4).

3.5. PCA and NSFDSS Results

According to the acceleration factor method, the relevant components of the PCA were the first three, together explaining 56.9% of the data variability (Table 5). The first component of the PCA, which explained 27.3% of the observed data variability, was mainly driven by the SGR, weight gain, FCR, PER, EMG and EROD activity. Individual displaying high values on this component are those that showed better PER, a lower FCR, better growth performances, but higher EROD activity (Table 5). This suggests that individuals with high values on the first component are those displaying higher welfare status. For the component 2 of the PCA, which explained 16.7% of the observed data variability, it was mainly driven by cortisol and lysozyme concentration, EROD activity and PER (Table 5). Individual displaying high value on this component are those with high plasmatic cortisol and low lysozyme concentration, low EROD activity and high PER (Table 5). Thus, we can consider that individuals with high values on the second component are individuals displaying lower welfare status. Finally, the component 3 of the PCA, which explained 13.2% of the observed data variability, was mainly driven by Hb, RBCC, cortisol, and glucose. Individual displaying high value on this component also displayed higher levels of RBCC, HB, cortisol, glucose, and GST. Since high values on this component are linked both to high cortisol/glucose values and high HB/RBCC values, the link between this component and welfare is more delicate to clearly establish.
Looking to the individual positioning of the PCA (Figure 4a), the two-organic diet treatments had close and positive values on the first component of the PCA while the conventional diet is located far away from these two groups, displaying negative values on the first component (Figure 4a). Even if the PC scores of the two organic diets are close on the first component, the organic diet 1 showed higher PC score values than the organic diet 2, meaning higher welfare level regarding to the first component (Tukey, p < 0.05; Figure 4b). On the second component, the conventional diet is located between the two organic diets (Figure 4a) with higher values for the organic diet 2 and lower values for organic diet 1. Statistical analysis of the PC scores of the component 2 revealed significant differences between all diet treatments with lower values for the organic diet 1, meaning a higher welfare level for this group (Figure 4c).
Moreover, according to the NSFDSS analysis, the best score relative to the welfare status of fish was achieved by the organic diet richer in proteins (Organic diet 1, score = 1.000; Table 6), confirming the results of the PCA analysis, followed by the conventional diet (0.953). In Table 7 are reported the scores of the three diets respect to each of the 7 parameters considered. The results showed that respect to EMG, cortisol and lysozyme the conventional diet is equivalent to Organic 1, both in the highest position, while for RR and HIS, the conventional diet is in highest position. On the other hand, respect to SGR and glucose, the Organic 1 and 2 are equivalently in highest position. In the Hypothesis 1, the NSFDSS showed that the parameter characterized by highest score is EMG, followed by RR, while glucose and lysozyme have null score (Table 8). The same ranking among the diets was obtained in the two hypotheses (hypothesis 1: ranked criteria; hypothesis 2: equal importance of criteria), in which the organic diet 1 and conventional diets showed the best and second score respectively. The organic diet 2 showed a lower score in both cases (Table 6).

4. Discussion

Aims of the study were first to define the physiological effects of the diets in sea bass, looking to different parameters monitored individually. Then, a multi parametric approaches have been conducted to have a whole organism view using PCA and MCDA analyses. During the experiment, sixteen different parameters commonly used to evaluate fish welfare condition were considered: haematological (Hct, Hb, RBCC), plasmatic (glucose, lactate, cortisol, lysozyme), muscle activity (EMG, recovery tests), specific biomarkers (EROD, GST), and growth performances (gained weight, SGR, HIS, FCR, PER). All these parameters could bring an overview for evaluating the welfare status of fish in response to different diets (conventional: DAN-EX 1754TM and two organic diets 1 and 2: DAN-EC 1650TM and DAN-EC 2640TM respectively).
Feeding composition is essential to regulate the specific needs of the species, and thus are important for assuring fish welfare under aquaculture conditions. For carnivorous fish species, such as European sea bass, the use of fish meal (or fish oil) is important for protein acquisition, but have to be controlled, due both to the decrease of wild fish stock and levels of pollutants in food [76]. In the present study, we followed the EROD and GST activities, both of which are specific biomarkers of the exposure to dioxins and dioxin-like compounds, and polycyclic aromatic hydrocarbons (PAH) [51,77], including in European sea bass [78]. The values of the EROD and GST activities for fish fed with commercial diets seemed comparable to both the values measured in the present study [78,79,80]. Therefore, a possible environmental contamination from dioxins and dioxin-like compounds can be excluded. However, the activity of EROD was inhibited following the exposure to the conventional diet and the organic diet 2, while it did not for fish fed with the organic diet 1. This inhibition may be due to exposure to other chemicals which are present in these diets [51,81]. However, at the end of the experiment, the levels of both EROD and GST are similar between the three diet treatments, suggesting that the changes in physiological parameters discussed below are probably not related to potential pollutant exposure through diet.
Cortisol is the major stress hormone in teleost fishes [31], activating of physiological and behavioural responses modulating growth and reproduction [33,82]. In our study, the higher initial level of cortisol observed may be likely due to a stress condition attributable to the transport and the adaptation to new rearing conditions, since European sea bass is known to be high stress responder [83,84]. At the end of the trial, the cortisol level was significantly lower both in conventional diet and organic diet 1 than in the organic diet 2. However, since the high variability of cortisol values and great number of different stimuli that could influence their concentration, this hormone should not be used alone as operational welfare indicator [34,43]. By considering the secondary stress responses, the plasmatic glucose showed a sharp decrease from the beginning to the end of the experimental period in fish fed with the conventional diet similarly to cortisol level pattern; but not for the organic diets. Moreover, the higher initial level of lactate also seems to be related to the high cortisol level at the beginning of the experiment. Then, the lactate levels did not vary significantly in response to the different diets. Moreover, during the first two months of our experiment, the haematological parameters shown a global increase in all diet groups. Among the haematological parameters, RBCC and Hb seemed to be more stable. However, data resulting from the present work did not show any significant relationship between the haematological parameters and the diet composition, as reported by Mourente et al. [85] for diets differing in their lipid origin (animal vs. vegetable). Then, lysozyme is used as a general indicator of fish nonspecific immunity [86,87], which can also be modulated by cortisol level [34,41,88]. In this study, fish fed with the diets containing higher protein concentrations (conventional and organic diet 1) showed higher plasmatic lysozyme levels, as previously reported in European sea bass [89]. Together, these results confirm that the relative high protein content in these diets is essential for fishes to create such a level of nonspecific immunity and cope with potential diseases [90,91].
In contrast to physiological blood indicators, the use of swimming performances to assess fish welfare in relation to the diet is still at its embryonic stage, as demonstrated by the limited amount of studies [60,92,93,94]. The Ucrit test is widely used as indicator of swimming performances of fish [34]. However, a single Ucrit test is not really as sensitive to metabolic disturbances as the determination of the recovery ratio (RR), using two consecutive Ucrit tests [34,64]. Exhaustive exercise depletes glycogen storages, as a response to the physiological increase of cortisol levels to cope with the increased energy requested. Thus, healthy fish should rapidly restore metabolic energy after a test of critical swimming speed and should be able to perform a similar Ucrit, showing a RR value close or equal to one. On the contrary, physiological disturbances, such as stress, generate high level of cortisol, that inhibits muscle glycogen synthesis [95], impairs the recovery and the RR value is significantly lower than one [41]. Interestingly, in this study, the RR was lower for fish fed by the conventional diet than for organic diets, suggesting a lower capacity to cope with stress and ensure good growth performances [82,96].
EMGs record bioelectrical voltage changes, which are proportional to the degree and duration of muscle tension, as well as to the energetic demand of the individual for swimming and living activities [97]. Telemetry technology has produced specific EMG tags, which are useful for evaluating fish activity and energy in response to environmental conditions during free swimming in real time [50,61]. The quantitative monitoring of muscular activity achieved through EMG has already been successfully assessed in relation to different aquaculture conditions, such as starvation and/or feeding periods, transportation activities, rearing densities [34,50,98]. Thus, a change of the fish muscular activity (EMG) shows a sensible response of the organism to the environmental factors. In this view, the muscle activity, expressed as EMG, has been demonstrated as a sensitive index of fish welfare [34,50,99]. In our work, the initial mean daily EMG values were similar for the three diets (roughly around 30%), indicating a similar physiological condition at the beginning of the experiment. During the experimental period, fish fed with organic diet 1 showed a significant negative trend, while the other two diet groups showed positive trends both during feeding and starvation sampling period. Considering that a lower proportion of saturated fatty acid and a higher amount of linoleic acid in the diet can affect the cardiac function [100,101], these results indicated how the three diets could have a significant influence on the muscle activity (EMG). Moreover, the decrease of EMG over time was representative of lower use of white muscle [59]. This physiological situation minimizes the use of anaerobic reserves, placing fish in favorable conditions to cope with stress. In contrast, the other two experimental groups (conventional and organic diet 2) used a larger proportion of anaerobic metabolism (up to 50%), that stands for a lower storage of metabolic energy that should be useful to cope with stressful situations.
Then, the measurement of HSI, which is used as biomarker of the hepatic functionality, was found comparable with the literature for sea bass [102,103]. We observed higher values for fish fed with the two organic diets than those individuals fed with the conventional one. In the case of the organic diet 2, it was probably due to the higher lipid concentration [85,103,104]. In addition, the increment of the HSI for fish fed with the organic diet 1 could be attributed to the different protein sources (animal vs. vegetable) or to the different antioxidant compounds [105]. However, this hypothesis should be demonstrated with specific analysis of the effect of rosemary essential oil on the hepatic functionality.
Concerning growth parameters, it is difficult to compare with the literature because in general a smaller size is used to amplify the growth differences over time. Nevertheless, after one year of monitoring, Kavadias & Dessypris [106] reported a comparable SGR value for fish ranging from 300 to 400 g. In the present study, both the SGR and the weight gained at the end of the experiment were higher in the organic diets than in the conventional one. These results are consistent with the results and expectations looking to the EMG and the RR data.
However, the link between the swimming performances, growth and blood parameters are not completely consistent when studied individually. Indeed, when there is a high number of variables (i.e., 16 in this study), it could be difficult to rise a clear conclusion on the welfare status of fish because some variables are going in one sense and others are going in the opposite sense. Therefore, in this study, we performed a multi-parametric analysis using both a principal component approach (PCA), as already shown to be efficient in this context [37,107], and a multi criteria decision analysis (MCDA), which appears to be an innovative approach in the context of animal welfare [108]. The PCA allowed us to discriminate the effects of the three different diets upon all the sixteen parameters used. Overall, we found that low EMG values were correlated with better growth (Component 1 of the PCA) and low cortisol values were correlated with higher lysozyme values (Component 2 of the PCA). These correlations between the variables drove the different components of the PCA, allowing to discriminate the better welfare status for fish depending on their diet treatment (i.e., low EMG values and better growth for component 1, low cortisol concentration and high lysozyme for component 2). Fish fed by the two organic diets were clearly different from fish fed by the conventional one, overall displaying lower EMG values and higher growth performances (PCA component 1), suggesting better welfare status. Moreover, the organic diet 1 differed from organic diet 2, displaying higher plasmatic lysozyme concentration and lower cortisol concentration (PCA component 2), suggesting higher welfare status. Using the PCA method, fish fed with organic diet 1 showed better welfare status on the two components of the PCA, clearly suggesting the best welfare status for this diet treatment. However, fish fed with the conventional diet showed controversial results, such as good plasmatic parameters (glucose, lactate, cortisol) and worse physiological parameters (EMG and recovery), and SGR.
In the MCDA, the effects of the diets were analysed not only in terms of differences between the experimental groups as in the case of PCA, but above all in terms of effects on welfare. Thus, among the 16 parameters monitored in the study not all captured a difference (significant difference among the diets at the end of the experiment) in the experimental context. For this reason, we chose for the multicriteria decision analysis only the parameters which at the end of the experiment showed significant differences between the experimental groups (diets), which were related to welfare, and which therefore contributed more than the others to discriminate the effects of the three diets on sea bass welfare. Therefore, for example in the case of lysozyme if the fish fed with the organic diet 1, at the end of the experiment, showed greater lysozyme level in comparison with the other diets, this was evaluated positively (see Section 2.7, Table 6 and Table 7) with respect to welfare, as well as a higher cortisol in one of the experimental groups was evaluated negatively with respect to welfare. In this perspective, the MCDA analysis allowed us a more effective evaluation of the three diets in term of “welfare effect”. Thus, the seven parameters that were shown to be more sensitive to the different diet compositions (cortisol, glucose, lysozyme, SGR, HSI, RR, and EMG) were integrated in a diagnostic frame to perform a MCDA by means of a non-structural fuzzy decision support system (NSFDSS). Higher welfare score was found in fish fed by the organic diet 1, confirming the results highlighted by the PCA. The low cortisol level, the high lysozyme concentration, the swimming activity (mostly sustained by the aerobic metabolism), the greater metabolic recovery capacity, and the better growth performances (SGR) are in agreement with a better physiological condition. On the contrary, fish fed with the organic diet 2 showed the lowest welfare score, with the prevalence of negative effects on welfare, suggesting that the conventional diet is more appropriate than this one for European sea bass aquaculture.
Fish welfare evaluation remains a complex issue to be evaluated using a single parameter and/or group of parameters. Indeed, haematological parameters in fish lack a threshold reference levels useful to univocally diagnose impaired welfare [109]. In disturbance conditions (e.g., not appropriate feed), fish are faced with higher living costs [30], reducing the reserve energy budget intended to cope with stressful situations, and this affects the fish well-being. The complementary use of functional-based parameters (e.g., haematological and biochemical profile) and feeling-based parameters (e.g., behavioural profile) could give a more comprehensive view, validating the diagnosis of fish welfare induced by culture practices [34,110].
Overall, results of this work indicate that the organic diet, if it is well balanced, could be a good trade-off in term of growth performance and physiological fish welfare. In term of sustainability, aquaculture has a lower carbon footprint in comparison to other protein production systems (e.g., cattle, pork, poultry) [111]. In particular, organic aquaculture, due the higher component of vegetable origin, has the potential to effectively address the sustainability challenges that humans are facing [112].

5. Conclusions

In conclusion, both in terms of growth performances and physiological welfare status, this study supports the transition towards organic aquaculture for European sea bass, by nevertheless choosing the diet adapted to the need of the species. This transition towards organic agriculture can also benefit humans by providing higher quality products, and thus enhancing health [113]. The multiparametric approach has enabled to outline a comprehensive picture of the physiological state of sea bass fed with three different diets. Even if not all of the sixteen parameters gave globally consistent response, the use of all the parameters gave a strong decision criterion. The parameters that gave a whole organism response, such as EMG, recovery ratio, and growth parameters proved to be sensitive to assess welfare condition [34,110]. Other physiological indicators, such as cortisol concentration, glucose, or lysozyme, are important for welfare assessment, even if these parameters are highly variable (e.g., [43] for cortisol). Finally, the PCA and MCDA methods appeared to be powerful tools to assess welfare in aquaculture using a multi-parametric approach, as recommended by Huntingford et al. [28].

Author Contributions

Conceptualization, P.C.; formal analysis, W.Z., I.B., and S.A.; investigation, P.C., I.B., M.D., and S.A.; writing—original draft, P.C., M.C., and I.B.; writing—review and editing, S.A.; supervision, P.C. and M.C. All authors have read and agreed to the published version of the manuscript.

Funding

This study was supported by the Regional Government of Puglia (Italy), INTERREG program.

Acknowledgments

We acknowledge the three anonymous reviewers for useful insights and comments on the previous version of the manuscript.

Conflicts of Interest

The authors declare no conflict of interest.

References

  1. FAO. The State of Fisheries and Aquaculture in the World 2018—Meeting the Sustainable Development Goals; FAO: Rome, Italy, 2018; ISBN 9789251305621. [Google Scholar]
  2. Focardi, S.; Corsi, I.; Franchi, E. Safety issues and sustainable development of European aquaculture: New tools for environmentally sound aquaculture. Aquac. Int. 2005, 13, 3–17. [Google Scholar] [CrossRef]
  3. Ulbrich, B.; Stahlmann, R. Developmental toxicity of polychlorinated biphenyls (PCBs): A systematic review of experimental data. Arch. Toxicol. 2004, 78, 252–268. [Google Scholar] [CrossRef] [PubMed]
  4. Gould, D.; Compagnoni, A.; Lembo, G. Organic Aquaculture: Principles, Standards and Certification. In Organic Aquaculture Impacts and Future Developments; Springer: Cham, Switzerland, 2019; pp. 1–22. [Google Scholar]
  5. Mente, E.; Jokumsen, A.; Carter, C.G.; Antonopoulou, E.; Tacon, A.G. Chapter 8 Nutrition in relation to organic aquaculture: Sources and strategies. In Organic Aquaculture Impacts and Future Developments; Springer: Cham, Switzerland, 2019; pp. 141–188. [Google Scholar]
  6. Mente, E.; Karalazos, V.; Karapanagiotidis, I.T.; Pita, C. Nutrition in organic aquaculture: An inquiry and a discourse. Aquac. Nutr. 2011, 17. [Google Scholar] [CrossRef]
  7. Lembo, G.; Mente, E. Organic Aquaculture. Impacts and Future Developments; Springer: Cham, Switzerland, 2019; ISBN 9783030056025. [Google Scholar]
  8. Turchini, G.M.; Torstensen, B.E.; Ng, W.-K. Fish oil replacement in finfish nutrition. Rev. Aquac. 2009, 1, 10–57. [Google Scholar] [CrossRef]
  9. Kaushik, S.J.; Seiliez, I. Protein and amino acid nutrition and metabolism in fish: Current knowledge and future needs. Aquac. Res. 2010, 41, 322–332. [Google Scholar] [CrossRef]
  10. Palmegiano, G.B.; Gai, F.; Gasco, L.; Lembo, G.; Spedicato, M.T.; Trotta, P.; Zoccarato, I. Partial replacement of fish meal by T-Iso in gilthead sea bream (Sparus aurata) juveniles diets. Ital. J. Anim. Sci. 2009, 8, 869–871. [Google Scholar] [CrossRef]
  11. Montero, D.; Izquierdo, M. Welfare and health of fish fed vegetable oils as alternative lipid sources to fish oil. In Fish Oil Replacement and Alternative Lipid Sources in Aquaculture Feeds; CRC Press: Boca Raton, FL, USA, 2010; pp. 439–486. [Google Scholar] [CrossRef]
  12. Geay, F.; Ferraresso, S.; Zambonino-Infante, J.L.; Bargelloni, L.; Quentel, C.; Vandeputte, M.; Kaushik, S.; Cahu, C.L.; Mazurais, D. Effects of the total replacement of fish meal and fish oil by plant sources on the hepatic transcriptome of European sea bass (Dicentrarchus labrax). In Proceedings of the Aquaculture Europe 11, Mediterranean Aquaculture 2020, Rhodes, Greece, 18–21 October 2011; pp. 377–378. [Google Scholar]
  13. Borquez, A.; Serrano, E.; Dantagnan, P.; Carrasco, J.; Hernandez, A. Feeding high inclusion of whole grain white lupin (Lupinus albus) to rainbow trout (Oncorhynchus mykiss): Effects on growth, nutrient digestibility, liver and intestine histology and muscle fatty acid composition. Aquac. Res. 2011, 42, 1067–1078. [Google Scholar] [CrossRef] [Green Version]
  14. Zhou, Q.C.; Mai, K.S.; Tan, B.P.; Liu, Y.J. Partial replacement of fishmeal by soybean meal in diets for juvenile cobia (Rachycentron canadum). Aquac. Nutr. 2005, 11, 175–182. [Google Scholar] [CrossRef]
  15. Vandeputte, M.; Gagnaire, P.-A.; Allal, F. The European sea bass: A key marine fish model in the wild and in aquaculture. Anim. Genet. 2019, 195–206. [Google Scholar] [CrossRef]
  16. Teletchea, F. Domestication of marine fish species: Update and perspectives. J. Mar. Sci. Eng. 2015, 3, 1227–1243. [Google Scholar] [CrossRef] [Green Version]
  17. Izquierdo, M.S.; Obach, A. Dietary lipid sources for seabream and seabass: Growth performance, tissue composition and flesh quality. Aquaculture 2003, 9, 397–407. [Google Scholar] [CrossRef]
  18. Bonvini, E.; Bonaldo, A.; Mandrioli, L.; Sirri, R.; Dondi, F.; Bianco, C.; Fontanillas, R.; Mongile, F.; Gatta, P.P.; Parma, L. Effects of feeding low fishmeal diets with increasing soybean meal levels on growth, gut histology and plasma biochemistry of sea bass. Animal 2018, 12, 923–930. [Google Scholar] [CrossRef] [PubMed]
  19. FSBI. Fish Welfare. Briefing Paper; FSBI: Cambridge, UK, 2002; Volume 44. [Google Scholar]
  20. Ashley, P.J. Fish welfare: Current issues in aquaculture. Appl. Anim. Behav. Sci. 2007, 104, 199–235. [Google Scholar] [CrossRef]
  21. Huntingford, F.A.; Kadry, S. Welfare and fish. In Fish Welfare; Branson, E.J., Ed.; Wiley: Blackwell, UK, 2008. [Google Scholar]
  22. Lembo, G.; Carbonara, P.; Fabris, A.; Manfrin, A.; Zupa, W. Welfare Issues and Veterinary Treatments. In Organic Aquaculture; Springer: Cham, Switzerland, 2019; pp. 119–140. [Google Scholar]
  23. Saraiva, J.L.; Arechavala-Lopez, P. Welfare of fish—No longer the elephant in the room. Fishes 2019, 4, 39. [Google Scholar] [CrossRef] [Green Version]
  24. Saraiva, J.L.; Arechavala-Lopez, P.; Castanheira, M.F.; Volstorf, J.; Studer, B.H. A global assessment of welfare in farmed fishes: The fishethobase. Fishes 2019, 4, 30. [Google Scholar] [CrossRef] [Green Version]
  25. Dawkins, M.S. From an animal’s point of view: Motivation, fitness, and animal welfare. Behav. Brain Sci. 1990, 13, 1–9. [Google Scholar] [CrossRef]
  26. Arlinghaus, R.; Cowx, I.G.; Key, B.; Diggles, B.K.; Schwab, A.; Cooke, S.J.; Skiftesvik, A.B.; Browman, H.I. Pragmatic animal welfare is independent of feelings. Science (80) 2020, 370, 180. [Google Scholar]
  27. Huntingford, F.A.; Kadri, S. Taking account of fish welfare: Lessons from aquaculture. J. Fish Biol. 2009, 75, 2862–2867. [Google Scholar] [CrossRef]
  28. Huntingford, F.A.; Adams, C.; Braithwaite, V.A.; Kadri, S.; Pottinger, T.G.; Sandøe, P.; Turnbull, J.F. Current issues in fish welfare. J. Fish Biol. 2006, 44, 332–372. [Google Scholar] [CrossRef] [Green Version]
  29. Prunet, P.; Øverli, O.; Douxfils, J.; Bernardini, G.; Kestemont, P.; Baron, D. Fish welfare and genomics. Fish Physiol. Biochem. 2012, 38, 43–60. [Google Scholar] [CrossRef]
  30. Martos-sitcha, J.A.; Mancera, J.M.; Prunet, P.; Magnoni, L.J. Editorial: Welfare and Stressors in Fish: Challenges Facing Aquaculture. Front. Physiol. 2020, 11, 162. [Google Scholar] [CrossRef] [PubMed]
  31. Sadoul, B.; Geffroy, B. Measuring cortisol, the major stress hormone in fishes. J. Fish Biol. 2019, 94, 540–555. [Google Scholar] [CrossRef] [PubMed] [Green Version]
  32. Barton, B.A. Stress in Fishes: A Diversity of Responses with Particular Reference to Changes in Circulating Corticosteroids. Integr. Comp. Biol. 2002, 42, 517–525. [Google Scholar] [CrossRef] [PubMed]
  33. Schreck, C.B.; Tort, L. The concept of stress in fish. In Fish Physiology; Elsevier: Amsterdam, The Netherlands, 2016; Volume 35, pp. 1–34. ISBN 1546-5098. [Google Scholar]
  34. Carbonara, P.; Scolamacchia, M.; Spedicato, M.T.; Zupa, W.; Mckinley, R.S.; Lembo, G. Muscle activity as a key indicator of welfare in farmed European sea bass (Dicentrarchus labrax L. 1758). Aquac. Res. 2015, 46, 2133–2146. [Google Scholar] [CrossRef]
  35. Montero, D.; Izquierdo, M.S.; Tort, L.; Robaina, L.; Vergara, J.M. High stocking density produces crowding stress altering some physiological and biochemical parameters in gilthead seabream, Sparus aurata, juveniles. Fish Physiol. Biochem. 1999, 20, 53–60. [Google Scholar] [CrossRef]
  36. Huntingford, F.A. Implications of domestication and rearing conditions for the behaviour of cultivated fishes. J. Fish Biol. 2004, 65, 122–142. [Google Scholar] [CrossRef]
  37. Carbonara, P.; Alfonso, S.; Zupa, W.; Manfrin, A.; Fiocchi, E.; Pretto, T.; Spedicato, M.T.; Lembo, G. Behavioral and physiological responses to stocking density in sea bream (Sparus aurata): Do coping styles matter? Physiol. Behav. 2019, 212, 112698. [Google Scholar] [CrossRef]
  38. Varsamos, S.; Flik, G.; Pepin, J.F.; Bonga, S.E.W.; Breuil, G. Husbandry stress during early life stages affects the stress response and health status of juvenile sea bass, Dicentrarchus labrax. Fish Shellfish. Immunol. 2006, 20, 83–96. [Google Scholar] [CrossRef] [Green Version]
  39. Turnbull, J.; Bell, A.; Adams, C.; Bron, J.; Huntingford, F. Stocking density and welfare of cage farmed Atlantic salmon: Application of a multivariate analysis. Aquaculture 2005, 243, 121–132. [Google Scholar] [CrossRef]
  40. North, B.P.; Turnbull, J.F.; Ellis, T.; Porter, M.J.; Migaud, H.; Bron, J.; Bromage, N.R. The impact of stocking density on the welfare of rainbow trout (Oncorhynchus mykiss). Aquaculture 2006, 255, 466–479. [Google Scholar] [CrossRef]
  41. Carbonara, P.; Corsi, I.; Focardi, S.; Lembo, G.; Rochira, S.; Scolamacchia, M.; Spedicato, M.T.; Mckinley, R.S. The effects of stress induced by cortisol administration on the repeatability of swimming performance tests in the European sea bass (Dicentrarchus labrax L.). Mar. Freshw. Behav. Physiol. 2010, 43, 283–296. [Google Scholar] [CrossRef]
  42. Mormède, P.; Andanson, S.; Aupérin, B.; Beerda, B.; Guémené, D.; Malmkvist, J.; Manteca, X.; Manteuffel, G.; Prunet, P.; van Reenen, C.G.; et al. Exploration of the hypothalamic-pituitary-adrenal function as a tool to evaluate animal welfare. Physiol. Behav. 2007, 92, 317–339. [Google Scholar] [CrossRef] [PubMed]
  43. Ellis, T.; Yildiz, H.Y.; López-Olmeda, J.; Spedicato, M.T.; Tort, L.; Øverli, Ø.; Martins, C.I.M. Cortisol and finfish welfare. Fish Physiol. Biochem. 2012, 38, 163–188. [Google Scholar] [CrossRef] [PubMed]
  44. Martins, C.I.M.; Galhardo, L.; Noble, C.; Damsgård, B.; Spedicato, M.T.; Zupa, W.; Beauchaud, M.; Kulczykowska, E.; Massabuau, J.C.; Carter, T.; et al. Behavioural indicators of welfare in farmed fish. Fish Physiol. Biochem. 2012, 38, 17–41. [Google Scholar] [CrossRef] [Green Version]
  45. Sadoul, B.; Mengues, P.E.; Friggens, N.C.; Prunet, P.; Colson, V. A new method for measuring group behaviours of fish shoals from recorded videos taken in near aquaculture conditions. Aquaculture 2014, 430, 179–187. [Google Scholar] [CrossRef]
  46. Alfonso, S.; Sadoul, B.; Cousin, X.; Bégout, M.-L. Spatial distribution and activity patterns as welfare indicators in response to water quality changes in European sea bass, Dicentrarchus labrax Article. Appl. Anim. Behav. Sci. 2020, 104974. [Google Scholar] [CrossRef]
  47. Shingles, A.; McKenzie, D.J.; Taylor, E.W.; Moretti, A.; Butler, P.J.; Ceradini, S. Effects of sublethal ammonia exposure on swimming performance in rainbow trout (Oncorhynchus mykiss). J. Exp. Biol. 2001, 204, 2691–2698. [Google Scholar]
  48. McKenzie, D.J.; Höglund, E.; Dupont-Prinet, A.; Larsen, B.K.; Skov, P.V.; Pedersen, P.B.; Jokumsen, A. Effects of stocking density and sustained aerobic exercise on growth, energetics and welfare of rainbow trout. Aquaculture 2012, 338–341, 216–222. [Google Scholar] [CrossRef]
  49. Muñoz, L.; Aspillaga, E.; Palmer, M.; Saraiva, J.L.; Arechavala-Lopez, P. Acoustic Telemetry: A Tool to Monitor Fish Swimming Behavior in Sea-Cage Aquaculture. Front. Mar. Sci. 2020, 7. [Google Scholar] [CrossRef]
  50. Cooke, S.J.; Thorstad, E.B.; Hinch, S.G. Activity and energetics of free-swimming fish: Insights from electromyogram telemetry. Fish Fish. 2004, 5, 21–52. [Google Scholar] [CrossRef]
  51. Whyte, J.J.; Jung, R.E.; Schmitt, C.J.; Tillitt, D.E. Ethoxyresorufin-O-deethylase (EROD) activity in fish as a biomarker of chemical exposure. Crit. Rev. Toxicol. 2000, 30, 347–570. [Google Scholar] [CrossRef] [PubMed]
  52. Teles, M.; Gravato, C.; Pacheco, M.; Santos, M. a Juvenile sea bass biotransformation, genotoxic and endocrine responses to beta-naphthoflavone, 4-nonylphenol and 17 beta-estradiol individual and combined exposures. Chemosphere 2004, 57, 147–158. [Google Scholar] [CrossRef] [PubMed]
  53. Iversen, M.; Finstad, B.; McKinley, R.S.; Eliassen, R.A. The efficacy of metomidate, clove oil, Aqui-STM and Benzoak® as anaesthetics in Atlantic salmon (Salmo salar L.) smolts, and their potential stress-reducing capacity. Aquaculture 2003, 221, 549–566. [Google Scholar] [CrossRef]
  54. Corsi, I.; Mariottini, M.; Sensini, C.; Lancini, L.; Focardi, S. Cytochrome P450, acetylcholinesterase and gonadal histology for evaluating contaminant exposure levels in fishes from a highly eutrophic brackish ecosystem: The Orbetello Lagoon, Italy. Mar. Pollut. Bull. 2003, 46, 203–212. [Google Scholar] [CrossRef]
  55. Vissali, M.; Maricchiolo, M.V.; Genovese, L. Utilizzo dell’HPLC per la determinazione del cortisolo in specie ittiche. Biol. Mar. Mediterr. 2000, 7, 933–935. [Google Scholar]
  56. Burke, M.D.; Mayer, R.T. Ethoxyresorufin: Direct fluorimetric assay of a microsomal o-dealkylation which is preferentially inducible by 3-methylcholanthrene. Drug Metab. Dispos. 1974, 2, 583–588. [Google Scholar] [PubMed]
  57. Habig, W.H.; Pabst, M.J.; Jakoby, W.B. Glutathione S-Transferases: The first enzymatic step in mercapturic acid formation. J. Biol. Chem. 1974, 249, 7130–7139. [Google Scholar]
  58. Bradford, M. A rapid and sensitive method for quantitation of microgram quantities of protein utilizing the principle of protein-dye binding. Anal. Biochem. 1976, 72, 248–254. [Google Scholar] [CrossRef]
  59. Lembo, G.; Carbonara, P.; Scolamacchia, M.; Spedicato, M.T.; McKinley, R.S. Use of muscle activity indices as a relative measure of well-being in cultured sea bass Dicentrarchus labrax(Linnaeus, 1758). Hydrobiologia 2007, 582, 271–280. [Google Scholar] [CrossRef]
  60. McFarlane, W.J.; Cubitt, K.F.; Williams, H.; Rowsell, D.; Moccia, R.; Gosine, R.; McKinley, R.S. Can feeding status and stress level be assessed by analyzing patterns of muscle activity in free swimming rainbow trout (Oncorhynchus mykiss Walbaum)? Aquaculture 2004, 239, 467–484. [Google Scholar] [CrossRef]
  61. Lembo, G.; Carbonara, P.; Scolamacchia, M.; Spedicato, M.T.; Bjørnsen, J.E.; Holand, B.; McKinley, R.S. Introduction of a new physiological sensor: An acoustic EMG transmitter. Fish. Manag. Ecol. 2008, 15, 333–338. [Google Scholar] [CrossRef]
  62. McKinley, R.S.; Power, G. Measurement of activity and oxygen consumption for adult lake sturgeon (Acipenser fulvescens) in the wild using radiotransmitted EMG signals. In Wildlife Telemetry: Remote Monitoring and Tracking of Animals; Priede, I.G., Swift, S.M., Eds.; Ellis Horwood: West Sussex, UK, 1992; pp. 307–318. [Google Scholar]
  63. Alfonso, S.; Zupa, W.; Manfrin, A.; Fiocchi, E.; Dioguardi, M.; Dara, M.; Lembo, G.; Carbonara, P.; Cammarata, M. Surgical implantation of electronic tags does not induce medium-term effect: Insights from growth and stress physiological profile in two marine fish species. Anim. Biotelemetry 2020, 8, 21. [Google Scholar] [CrossRef]
  64. Jain, K.E.; Birtwell, I.K.; Farrell, A.P. Repeat swimming performance of mature sockeye salmon following a brief recovery period: A proposed measure of fish health and water quality. Can. J. Zool. 1998, 1496, 1488–1496. [Google Scholar] [CrossRef]
  65. Hopkins, K.D. Reporting Fish Growth: A Review of the Basics. J. World Aquac. Soc. 1992, 23, 173–179. [Google Scholar] [CrossRef]
  66. R Core Team. R: A Language and Environment for Statistical Computing; R Foundation for Statistical Computing: Vienna, Austria, 2015. [Google Scholar]
  67. Lê, S.; Josse, J.; Husson, F. FactoMineR: An R Package for Multivariate Analysis. J. Stat. Softw. 2008, 25. [Google Scholar] [CrossRef] [Green Version]
  68. Raîche, G.; Walls, T.A.; Magis, D.; Riopel, M.; Blais, J.G. Non-graphical solutions for Cattell’s scree test. Methodology 2013, 9, 23–29. [Google Scholar] [CrossRef] [Green Version]
  69. Tam, C.M.; Tong, T.K.L.; Leung, A.W.T.; Chiu, G.W.C. Site Layout Planning using Nonstructural Fuzzy Decision Support System. J. Constr. Eng. Manag. 2002, 128, 220–231. [Google Scholar] [CrossRef] [Green Version]
  70. Leung, P. Multiple-criteria decision-making (MCDM) applications in fishery management. Int. J. Environ. Technol. Manag. 2006, 6. [Google Scholar] [CrossRef]
  71. Belton, V.; Stewart, T. Multiple Criteria Decision Analysis—An Integrated Approach; Kluwer Academic: Boston, MA, USA, 2002. [Google Scholar]
  72. Chen, S.Y. Engineering Fuzzy Set Theory and Application; National Defense Industry Press: Beijing, China, 1998. [Google Scholar]
  73. Tam, C.M.; Tong, T.K.L.; Chiu, G.W.C. Comparing non-structural fuzzy decision support system and analytical hierarchy process in decision-making for construction problems. Eur. J. Oper. Res. 2006, 174, 1317–1324. [Google Scholar] [CrossRef]
  74. Lembo, G.; Bellido, J.M.; Bitetto, I.; Facchini, M.T.; García-Jiménez, T.; Stithou, M.; Vassilopoulou, V.C.; Spedicato, M.T. Preference modeling to support stakeholder outreach toward the common fishery policy objectives in the north Mediterranean Sea. Front. Mar. Sci. 2017, 4, 328. [Google Scholar] [CrossRef] [Green Version]
  75. Tong, T.K.L. Free Multi-Criteria Decision Aiding (MCDA) Tools for Research Students 2008. Available online: https://sites.google.com/site/mcdafreeware/ (accessed on 17 November 2020).
  76. FAO. Fish as Feed Inputs for Aquaculture. Practices, Sustainability and Implications; Hasan, M.R., Halwart, M., Eds.; FAO: Rome, Italy, 2009; ISBN 9789251064191. [Google Scholar]
  77. Okey, A.B. Enzyme induction in the cytochrome P450 system. Pharmacology 1990, 45, 241–298. [Google Scholar]
  78. Novi, S.; Pretti, C.; Cognetti, A.M.; Longo, V.; Marchetti, S.; Gervasi, P.G. Biotransformation enzymes and their induction by β-naphtoflavone in adult sea bass (Dicentrarchus labrax). Aquat. Toxicol. 1998, 41, 63–81. [Google Scholar] [CrossRef]
  79. Gravato, C.; Santos, M.A. Beta-naphthoflavone liver EROD and erythrocytic nuclear abnormality induction in juvenile Dicentrarchus labrax L. Ecotoxicol. Environ. Saf. 2002, 52, 69–74. [Google Scholar] [CrossRef] [PubMed]
  80. Teles, M.; Pacheco, M.; Santos, M. a Biotransformation, stress and genotoxic effects of 17beta-estradiol in juvenile sea bass (Dicentrarchus labrax L.). Environ. Int. 2006, 32, 470–477. [Google Scholar] [CrossRef] [PubMed]
  81. Tysklind, M.; Bosveld, A.B.T.; Patrik, A.; Eske, V.; Theo, S.; Willem, S.; Rappe, R.C.; van den Berg, M. Inhibition of ethoxyresorufin-O-deethylase (EROD) activity in mixtures of 2,3,7,8-tetrachlorodibenzo-p-dioxin and polychlorinated biphenyls. Environ. Sci. Pollut. Res. 1995, 211. [Google Scholar] [CrossRef]
  82. Sadoul, B.; Vijayan, M.M. Stress and Growth. In Fish Physiology; Elsevier Inc.: Amsterdam, The Netherlands, 2016; Volume 35, pp. 167–205. ISBN 9780128027288. [Google Scholar]
  83. Samaras, A.; Santo, C.E.; Papandroulakis, N.; Mitrizakis, N.; Pavlidis, M.; Höglund, E.; Pelgrim, T.N.M.; Zethof, J.; Spanings, F.A.T.; Vindas, M.A.; et al. Allostatic load and stress physiology in European seabass (Dicentrarchus labrax L.) and gilthead seabream (Sparus aurata L.). Front. Endocrinol. (Lausanne) 2018, 9, 451. [Google Scholar] [CrossRef] [Green Version]
  84. Alfonso, S.; Sadoul, B.; Gesto, M.; Joassard, L.; Chatain, B.; Geffroy, B.; Bégout, M.-L. Coping styles in European sea bass: The link between boldness, stress response and neurogenesis. Physiol. Behav. 2019, 207, 76–85. [Google Scholar] [CrossRef] [PubMed]
  85. Mourente, G.; Good, J.E.; Thompson, K.D.; Bell, J.G. Effects of partial substitution of dietary fish oil with blends of vegetable oils, on blood leucocyte fatty acid compositions, immune function and histology in European sea bass (Dicentrarchus labrax L). Br. J. Nutr. 2007, 98, 770–779. [Google Scholar] [CrossRef] [PubMed] [Green Version]
  86. Balfry, S.K.; Maule, G.; Iwama, G.K. Coho salmon Oncorhynchus kisutchstrain differences in disease resistance and non-specific immunity, following immersion challenges with Vibrio anguillarum. Dis. Aquat. Organ. 2001, 47, 39–48. [Google Scholar] [CrossRef] [PubMed]
  87. Saurabh, S.; Sahoo, P.K. Lysozyme: An important defence molecule of fish innate immune system. Aquac. Res. 2008, 39, 223–239. [Google Scholar] [CrossRef]
  88. Weyts, F.A.A.; Cohen, N.; Flik, G.; Verburg, V.K.B.M.L. Interactions between the immune system and the hypothalamo-pituitary-interrenal axis in fish. Fish Shellfish Immunol. 1999, 9, 1–20. [Google Scholar] [CrossRef]
  89. Sitjà-Bobadilla, A.; Pérez-Sànchez, J. Diet related changes in non-specific immune response of European sea bass (Dicentrarchus labrax L.). Fish Shellfish Immunol. 1999, 9, 637–640. [Google Scholar] [CrossRef]
  90. Boshra, H.; Li, J.; Sunyer, J.O. Recent advances on the complement system of teleost fish. Fish Shellfish Immunol. 2006, 20, 239–262. [Google Scholar] [CrossRef] [PubMed]
  91. Martin, S.A.M.; Król, E. Nutrigenomics and immune function in fish: New insights from omics technologies. Dev. Comp. Immunol. 2017, 75, 86–98. [Google Scholar] [CrossRef] [Green Version]
  92. Wilson, C.M.; Friesen, E.N.; Higgs, D.A.; Farrell, A.P. The effect of dietary lipid and protein source on the swimming performance, recovery ability and oxygen consumption of Atlantic salmon (Salmo salar). Aquaculture 2007, 273, 687–699. [Google Scholar] [CrossRef]
  93. McKenzie, D.J.; Higgs, D.A.; Dosanjh, B.S.; Deacon, G.; Randall, D.J. Dietary fatty acid composition influences swimming performance in Atlantic salmon (Salmo salar) in seawater. Fish Physiol. Biochem. 1998, 19, 111–122. [Google Scholar] [CrossRef]
  94. Wagner, G.N.; Balfry, S.K.; Higgs, D.A.; Lall, S.P.; Farrell, A.P. Dietary fatty acid composition affects the repeat swimming performance of Atlantic salmon in seawater. Comp. Biochem. Physiol. A. Mol. Integr. Physiol. 2004, 137, 567–576. [Google Scholar] [CrossRef]
  95. Milligan, C.L. A regulatory role for cortisol in muscle glycogen metabolism in rainbow trout Oncorhynchus mykiss Walbaum. J. Exp. Biol. 2003, 206, 3167–3173. [Google Scholar] [CrossRef] [Green Version]
  96. Korte, S.M.; Olivier, B.; Koolhaas, J.M. A new animal welfare concept based on allostasis. Physiol. Behav. 2007, 92, 422–428. [Google Scholar] [CrossRef] [Green Version]
  97. Zupa, W.; Carbonara, P.; Spedicato, M.T.; Lembo, G. Modelling swimming activities and energetic costs in European sea bass (Dicentrarchus labrax L., 1758) during critical swimming tests. Mar. Freshw. Behav. Physiol. 2015, 48, 341–357. [Google Scholar] [CrossRef]
  98. Chandroo, K.P.; Cooke, S.J.; McKinley, R.S.; Moccia, R.D. Use of electromyogram telemetry to assess the behavioural and energetic responses of rainbow trout, Oncorhynchus mykiss (Walbaum) to transportation stress. Aquac. Res. 2005, 36, 1226–1238. [Google Scholar] [CrossRef]
  99. Cooke, S.J.; Chandroo, K.P.; Beddow, T.A.; Moccia, R.D.; McKinley, R.S. Swimming activity and energetic expenditure of captive rainbow trout Oncorhynchus mykiss (Walbaum) estimated by electromyogram telemetry. Aquac. Res. 2000, 31, 495–505. [Google Scholar] [CrossRef]
  100. Paige, J.A.; Liao, R.; Hajjar, R.J.; Foisy, R.L.; Cory, C.R.; O’Brien, P.J.; Gwathmey, J.K. Effect of a high omega-3 fatty acid diet on cardiac contractile performance in Oncorhynchus mykiss. Cardiovasc. Res. 1996, 31, 249–262. [Google Scholar] [CrossRef] [Green Version]
  101. Mckenzie, D.J. Effects of dietary fatty acids on the respiratory and cardiovascular physiology of fish. Comp. Biochem. Physiol. Part A Mol. Integr. Physiol. 2001, 128, 605–619. [Google Scholar] [CrossRef]
  102. Bonaldo, A.; Roem, A.J.; Fagioli, P.; Pecchini, A.; Cipollini, I.; Gatta, P.P. Influence of dietary levels of soybean meal on the performance and gut histology of gilthead sea bream (Sparus aurata L.) and European sea bass (Dicentrarchus labrax L.). Aquac. Res. 2008, 39, 970–978. [Google Scholar] [CrossRef]
  103. Yildiz, M.; Sener, E.; Timur, M. Effects of variations in feed and seasonal changes on body proximate composition of wild and cultured sea bass (Dicentrarchus labrax L.). Turkish J. Fish. Aquat. Sci. 2007, 7, 45–51. [Google Scholar]
  104. Montero, D.; Robaina, L.; Caballero, M.J.; Ginés, R.; Izquierdo, M.S. Growth, feed utilization and flesh quality of European sea bass (Dicentrarchus labrax) fed diets containing vegetable oils: A time-course study on the effect of a re-feeding period with a 100% fish oil diet. Aquaculture 2005, 248, 121–134. [Google Scholar] [CrossRef] [Green Version]
  105. Lanari, D.; Agaro, E.D. Alternative plant protein sources in sea bass diets. Ital. J. Anim. Sci. 2005, 4, 365–374. [Google Scholar] [CrossRef]
  106. Kavadias, B.S.; Dessypris, A. Annual cycles of growth rate, feeding rate, food conversion, plasma glucose and plasma lipids in a population of European sea bass (Dicentrarchus labrax L.) farmed in floating marine cages. J. Appl. Ichthyol. 2003, 19, 29–34. [Google Scholar] [CrossRef]
  107. Sadoul, B.; Leguen, I.; Colson, V.; Friggens, N.C.; Prunet, P. A multivariate analysis using physiology and behavior to characterize robustness in two isogenic lines of rainbow trout exposed to a confinement stress. Physiol. Behav. 2015, 140, 139–147. [Google Scholar] [CrossRef]
  108. Botreau, R.; Veissier, I.; Perny, P.; Capdeville, J. Multicriteria evaluation of animal welfare at farm level: An application of MCDA methodologies. Found. Comput. Decis. Sci. 2008, 33, 287–316. [Google Scholar]
  109. Houston, A.H. Review: Are the Classical Hematological Variables Acceptable Indicators of Fish Health? Trans. Am. Fish. Soc. 2004, 126, 879–894. [Google Scholar] [CrossRef]
  110. Carbonara, P.; Dioguardi, M.; Cammarata, M.; Zupa, W.; Vazzana, M.; Spedicato, M.T.; Lembo, G. Basic knowledge of social hierarchies and physiological profile of reared sea bass Dicentrarchus labrax (L.). PLoS ONE 2019, 14, e0208688. [Google Scholar] [CrossRef] [PubMed]
  111. Sonesson, U.; Davis, J.; Ziegler, F. Food Production and Emissions of Greenhouse Gases: An Overview of the Climate Impact of Different Product Groups; SIK Institutet för Livsmedel Och Bioteknik: Gothenborg, Sweden, 2010; p. 26. [Google Scholar]
  112. Angel, D.; Jokumsen, A.; Lembo, G. Aquaculture Production Systems and Environmental Interactions. In Organic Aquaculture; Springer: Cham, Switzerland, 2019; pp. 103–118. ISBN 9783030056032. [Google Scholar]
  113. Mie, A.; Andersen, H.R.; Gunnarsson, S.; Kahl, J.; Kesse-Guyot, E.; Rembiałkowska, E.; Quaglio, G.; Grandjean, P. Human health implications of organic food and organic agriculture: A comprehensive review. Environ. Heal. A Glob. Access Sci. Source 2017, 16, 111. [Google Scholar] [CrossRef] [PubMed] [Green Version]
Figure 1. Mean ± SEM of the haematological and serological parameters measured over the experimental duration (start, 1° period, 2° period and end of the experiment) among the different diets. (a) HCT (%); (b) RBCC (cells 106 mm−3); (c) Hb (g dL−1); (d) Cortisol (ng mL−1); (e) Glucose (mg dL−1); (f) Lactate (mg dL−1); (g) Lysozyme (µ mL−1). An asterisk (*) denotes a significant difference from the “start” value. Similar symbols (#, +, §) denote significant difference in treatments comparisons. Similar letters (a, b) denote significant differences in time-points comparisons (Tukey HSD, p < 0.05).
Jmse 08 00934 g001
Figure 2. Mean ± SEM of the red muscle activity recorded (EMG)/red muscle activity at the Ucrit (EMG Ucrit) during the feeding starvation periods for the three diets. Different letters indicate significant difference between diets (Tukey, p < 0.05).
Jmse 08 00934 g002
Figure 3. Mean daily red muscle activity values (EMG/EMG Ucrit) during the feeding and starvation periods for the three diets (Conventional, red; organic diet 1, blue and organic diet 2, yellow). Equation and R2 are reported for significant correlation (Spearman’s correlation, p < 0.05).
Jmse 08 00934 g003
Figure 4. Principal component analysis. (a) Visualization of the individual positioning of the individual on the PCA as a function of diets. Confidence ellipses drawn around the levels of the categorical variable diet treatment with a confidence level of 0.95; (b) Individual PC score for the first component as a function of diet treatment; (c) Individual PC score for the first component as a function of diet treatment. Both for (b,c), different letters indicate groups significantly different (Tukey HSD, p < 0.05).
Jmse 08 00934 g004
Table 1. Mean ± SEM of the morphometric and rearing variables for the three tanks of each diet at the beginning of the experiment. Fish mean weights and mean total lengths were not statistically different in the nine experimental tanks (Kruskal-Wallis, p > 0.05).
DietTanknMean Weight (g)Biomass (kg)Mean Length (cm)Density (kg m−3)
DAN-EX 1754
(Conventional)
142297.8 ± 15.412.51302 ± 6.0010.43
241336.4 ± 2413.79313 ± 7.9311.49
342324.9 ± 16.613.65312 ± 5.4011.38
DAN-EC 1650
(Organic 1)
442317.5 ± 14.113.34308 ± 4.1511.12
542312.7 ± 21.413.13295 ± 9.6910.94
642339.1 ± 28.914.24315 ± 9.7811.87
DAN-EC 2640 (Organic 2)742327.8 ± 17.513.77305 ± 6.8511.48
840319.3 ± 23.612.77306 ± 7.7510.64
941322.2 ± 13.313.2306 ± 7.4611
Table 2. Composition of the three experimental diets: conventional (DAN-EX 1754) and two organic diets (Organic diet 1 and 2, DAN-EC 1650 and DAN-EC 2640 respectively).
Raw Material (%)Conventional Organic 1Organic 2
Rough proteins54 5040
Gross fats17 1626
Rough ashes9.16 10.598.64
Rough fibers2.01 2.893.39
Phosphorus1.27 1.741.31
Additives
Copper (mg kg−1)5 55
Vitamin A (I.U. g−1)0.72 0.720.72
Vitamin D3 (I.U. g−1)0.11 0.110.11
Vitamin E (mg kg−1)198 198198
BHT (mg kg−1)79 00
Rosmary essential oil (mg kg−1)0 200200
Proteic compounds (%) Proteic compounds in organic diets (%)
Fish flour54.65Fish flour56.8838.25
Soybean proteic concentrate15Roasted organic soy extract10.4911.10
Fish oil10.07Fish oil5.2317.29
Wheat8.83Organic wheat12.5012
Wheat gluten4Extract of organic colza2.205.99
Hulled roasted soy flour4Roasted organic soybeans1011.10
Peas3Extract of organic sunflower seed2.203.76
Vitamin pre-mix0.45Vitamin pre-mix0.500.50
BHT—Butylated hydroxytoluene.
Table 3. Mean ± SEM of the relative Ucrit1 (BL s−1), Ucrit2 (BL s−1) and the recovery ratio values for the diet treatments.
DietMean Weight (g)Ucrit1 (BL s−1)Ucrit2 (BL s−1)Recovery Ratio
Conventional403.7 ± 8.94.1 ± 0.143.8 ± 0.150.93 ± 0.03 *
Organic 1416.9 ± 19.13.9 ± 0.103.8 ± 0.140.99 ± 0.02
Organic 2403.8 ± 15.143.6 ± 0.103.5 ± 0.020.98 ± 0.02
*—indicates the recovery ratio values significantly different from 1 (Wilcoxon test, p < 0.05).
Table 4. Mean ± SEM of EROD and GST activities and the growth parameters during the experimentation for the three diets (Conventional, organic 1 and 2).
ParameterStartConventionalOrganic 1Organic 2
EROD
(nmol min−1 mg−1)
50.1 ± 3.58*
37.5 ± 4.96
47.3 ± 3.28*
38.4 ± 3.38
GST
(nmol min−1 mg−1)
60.0 ± 2.6656.3 ± 4.2158.2 ± 5.6550.4 ± 4.65
HSI (%)1.03 ± 0.05*, #, +
1.66 ± 0.06
*, #, §
1.99 ± 0.07
*, +, §
2.3 ± 0.09
TL (mm)306.9 ± 2.4#, +
350 ± 2.3
#
357± 2.7
+
360 ± 2.6
Weigth (g)321.9 ± 6.7#, +
509.9 ± 11.43
#
546.7 ± 12.76
+
545.6 ± 11.76
SGR (%) #, +
0.29 ± 0.011
#
0.33 ± 0.01
+
0.33 ± 0.005
FCR 5.31 ± 0.6804.92 ± 0.2135.06 ± 0.356
PER (%) 36.01 ± 4.3740.82 ± 4.2949.90 ± 3.54
Survival rate (%) 827877
An asterisk (*) denotes a significant difference from the “start” value (Tukey, p < 0.05). Moreover the symbol #, +, § denote significant differences among the diets at end of the experiment.
Table 5. Contribution of the sixteen variables to the different three first components of the principal component analysis (PCA) and data variance explained by each component. Only significant contributions are shown in the table (p < 0.05). Bold indicate a contribution higher than |0.5|.
VariablesComponent 1Component 2Component 3
HCT 0.38
RBCC 0.230.54
HB 0.260.52
Cortisol0.190.580.52
Glucose0.310.20.63
Lactate
Lysozyme −0.51−0.29
EROD0.64−0.670.31
GST−0.17−0.830.5
HSI0.410.32
SGR0.98
RR0.16 0.31
EMG−0.540.45
PER0.670.59−0.41
FCR−0.950.26
Weight gain0.98
Variance explained (%)27.316.413.2
Table 6. Diagnostic frame of the scores obtained by each diet treatment in the two study hypotheses by means of the NSFDSS. The case with the ranking of criteria is named Hypothesis 1 and the “equal importance of criteria” hypothesis is called Hypothesis 2.
DietHypothesis 1Hypothesis 2
Organic 11.0000.928
Conventional0.9530.901
Organic 20.4280.520
Table 7. Diagnostic frame of the scores obtained for the three diets respect to each criterion (parameter) by means of the NSFDSS. These scores are the same for Hypothesis 1 and Hypothesis 2.
DietEMGRRCortisolSGRHSIGlucose Lysozyme
Conventional1110.33310.3331
Organic 110.333110.53811
Organic 20.3330.3330.33310.2510.333
Table 8. Diagnostic frame of the scores obtained for the criteria (parameters) by means of the NSFDSS in the case of Hypothesis 1.
Parameters (Criteria)Score
EMG1
RR0.333
Cortisol0.176
SGR0.111
HSI0.053
Glucose0.00
Lysozyme0.00
Publisher’s Note: MDPI stays neutral with regard to jurisdictional claims in published maps and institutional affiliations.

