Article

Application of Sentinel-2 Multispectral Data for Habitat Mapping of Pacific Islands: Palau Republic (Micronesia, Pacific Ocean)

1
ENEA, Division Models and Technologies for Risks Reduction, 40129 Bologna, Italy
2
ENEA, Division Protection and Enhancement of Natural Capital, 19100 La Spezia, Italy
*
Author to whom correspondence should be addressed.
J. Mar. Sci. Eng. 2019, 7(9), 316; https://doi.org/10.3390/jmse7090316
Submission received: 31 July 2019 / Revised: 22 August 2019 / Accepted: 31 August 2019 / Published: 12 September 2019
(This article belongs to the Special Issue Remote Sensing in Coastline Detection)

Abstract

:
Sustainable and ecosystem-based marine spatial planning is a priority of Pacific Island countries basing their economy on marine resources. The urgency of management coral reef systems and associated coastal environments, threatened by the effects of climate change, require a detailed habitat mapping of the present status and a future monitoring of changes over time. Here, we present a remote sensing study using free available Sentinel-2 imagery for mapping at large scale the most sensible and high value habitats (corals, seagrasses, mangroves) of Palau Republic (Micronesia, Pacific Ocean), carried out without any sea truth validation. Remote sensing ‘supervised’ and ‘unsupervised’ classification methods applied to 2017 Sentinel-2 imagery with 10 m resolution together with comparisons with free ancillary data on web platform and available scientific literature were used to map mangrove, coral, and seagrass communities in the Palau Archipelago. This paper addresses the challenge of multispectral benthic mapping estimation using commercial software for preprocessing steps (ERDAS ATCOR) and for benthic classification (ENVI) on the base of satellite image analysis. The accuracy of the methods was tested comparing results with reference NOAA (National Oceanic and Atmospheric Administration, Silver Spring, MD, USA) habitat maps achieved through Ikonos and Quickbird imagery interpretation and sea-truth validations. Results showed how the proposed approach allowed an overall good classification of marine habitats, namely a good concordance of mangroves cover around Palau Archipelago with previous literature and a good identification of coastal habitats in two sites (barrier reef and coastal reef) with an accuracy of 39.8–56.8%, suitable for survey and monitoring of most sensible habitats in tropical remote islands.

1. Introduction

Coral reefs, seagrasses, and mangroves are threatened worldwide by climate change, whose main effects are sea temperature increase and ocean acidification [1,2,3]. In addition, the frequency of discrete extreme warming events (heat waves) threatening global biodiversity has increased, with projections indicating they will become more frequent [4]. Moreover, coastal coral ecosystems are threatened by additional anthropogenic pressures as overfishing, urbanization, and tourism [5]. Consequences are producing concerns for the maintenance of ecosystem functioning and the associated flow of services that coral reefs provide.
Having a deep cultural heritage for ocean conservation, the Pacific Ocean countries are strong advocates of a ‘Blue Economy Strategy’ and the sustainable use of ocean resources for economic growth, and are turning towards an increased reliance on green tourism. Palau Republic, among others, has emerged as a global leader in ocean conservation, receiving the 2012 Future Policy Award for developing the world’s best policies to protect oceans and coasts. People living in Pacific Islands depend on healthy coastal ecosystems for their survival. Ecosystems such as coral reefs, mangroves, and seagrass beds favor coastal protection, provide food, building materials, and they represent the principal economic incomes for fishing and tourism industries [5]. Hermatypic corals are the most sensitive organisms to the synergic effects of warming, hurricane destruction, and ocean acidification [1]. Future climate scenery predicts that over the coming decades coral mortality may reach up to 60% in the areas where shallow coral reefs are present [6], driving to the elimination of most warm water coral reefs by 2040–2050 [1]. Hence, the preservation of global reef biodiversity, the monitoring of climate change effects on reef and islands together with the development of global strategies to reduce greenhouse gas emissions are among the major management issues to counter the effects of climate change [7].
The need to effectively manage coral reef systems and their associated coastal environments, such as mangroves and seagrasses, requires the ability to document their present status and monitor changes over time. Benthic habitat mapping of coastal ecosystems is an important and essential mean to provide marine resource assessments for coastal management and ecological analysis. Habitat mapping by remote sensing allows large scale environmental patterns and is highly cost-effective compared to the sampling of physical areas achievable by field survey, which provide accurate data but at highly detailed scales [8,9,10,11,12,13]. RS imagery were used in conjunction with state-of-the-art RS algorithms to map reefs geomorphology and habitat distribution [14,15,16,17].
Today, widely available orthorectified satellite imagery (Google Earth) and rapid development and cost reduction in GIS, multibeam echosounders, Lidar, and RS technologies are making large-scale morphometric quantification of reefs feasible [18,19,20].
In 2001, the “Millennium Coral Reef Mapping Project—Understanding, Classifying and Mapping Coral Reef Structures Worldwide Using High Resolution Remote Sensing Spaceborne Images” examined ~1500 images to design a thematically rich (966 classes) geomorphological classification scheme, used to interpret and map every single reef of the planet. Distributed as Geographic Information System (GIS) layers in late 2003, the map products have been used for a variety of applications, from establishment of marine protected areas in Papua New Guinea and Eastern Caribbean, reef condition assessment in the Caribbean, morphometric analyses of Maldivian reefs, and geochemical budgets in French Polynesian atolls [21].
Sentinel mission is one of the last RS programs dedicated to the study of marine and coastal environment. A constellation of two satellites, Sentinel-2 A and B, was launched in 2015 by European Space Agency (ESA) as part of the Copernicus Program. The Sentinel-2 satellites carries an innovative wide swath high-resolution multi-spectral imagery with 13 bands (443–2190 nm) in the visible, near infrared, and short wave infrared part of the spectrum. The combination of high spatial resolution of 10–20–60 m, novel spectral capabilities, a swath width of 290 km, a global coverage of land surfaces from 56° S to 84° N and frequent revisit times (5–15 days) provides unprecedented views of Earth. Sentinel mission not only offers continuity of services for the moderate resolution multispectral Spot XS and Landsat Thematic Mapper series sensors, but it also has several technical improvements that may lead to enhanced capability in coral reef mapping applications [22,23,24].
The aim of this paper is to enhance the effectiveness of RS repositories as a powerful tool for coastal resources assessment and management of remote Pacific islands, where mapping data are missing or lacking at present. A low-cost methodological approach for a preliminary habitat classification useful for coral coastal management purposes is proposed for Palau Archipelago (Micronesia). Different available resources such as free satellite images from the Copernicus Open Access HUB services and ancillary information as Google Earth imagery, scientific reports and literature were used to create maps of relevant habitats without field data validation. Results on mangrove forest distribution around the islands and on habitat classes in two sites (barrier reef and coastal reef) are compared with available detailed habitat maps of the Palau coastal area, and pros and cons of this approach are discussed.

2. Materials and Methods
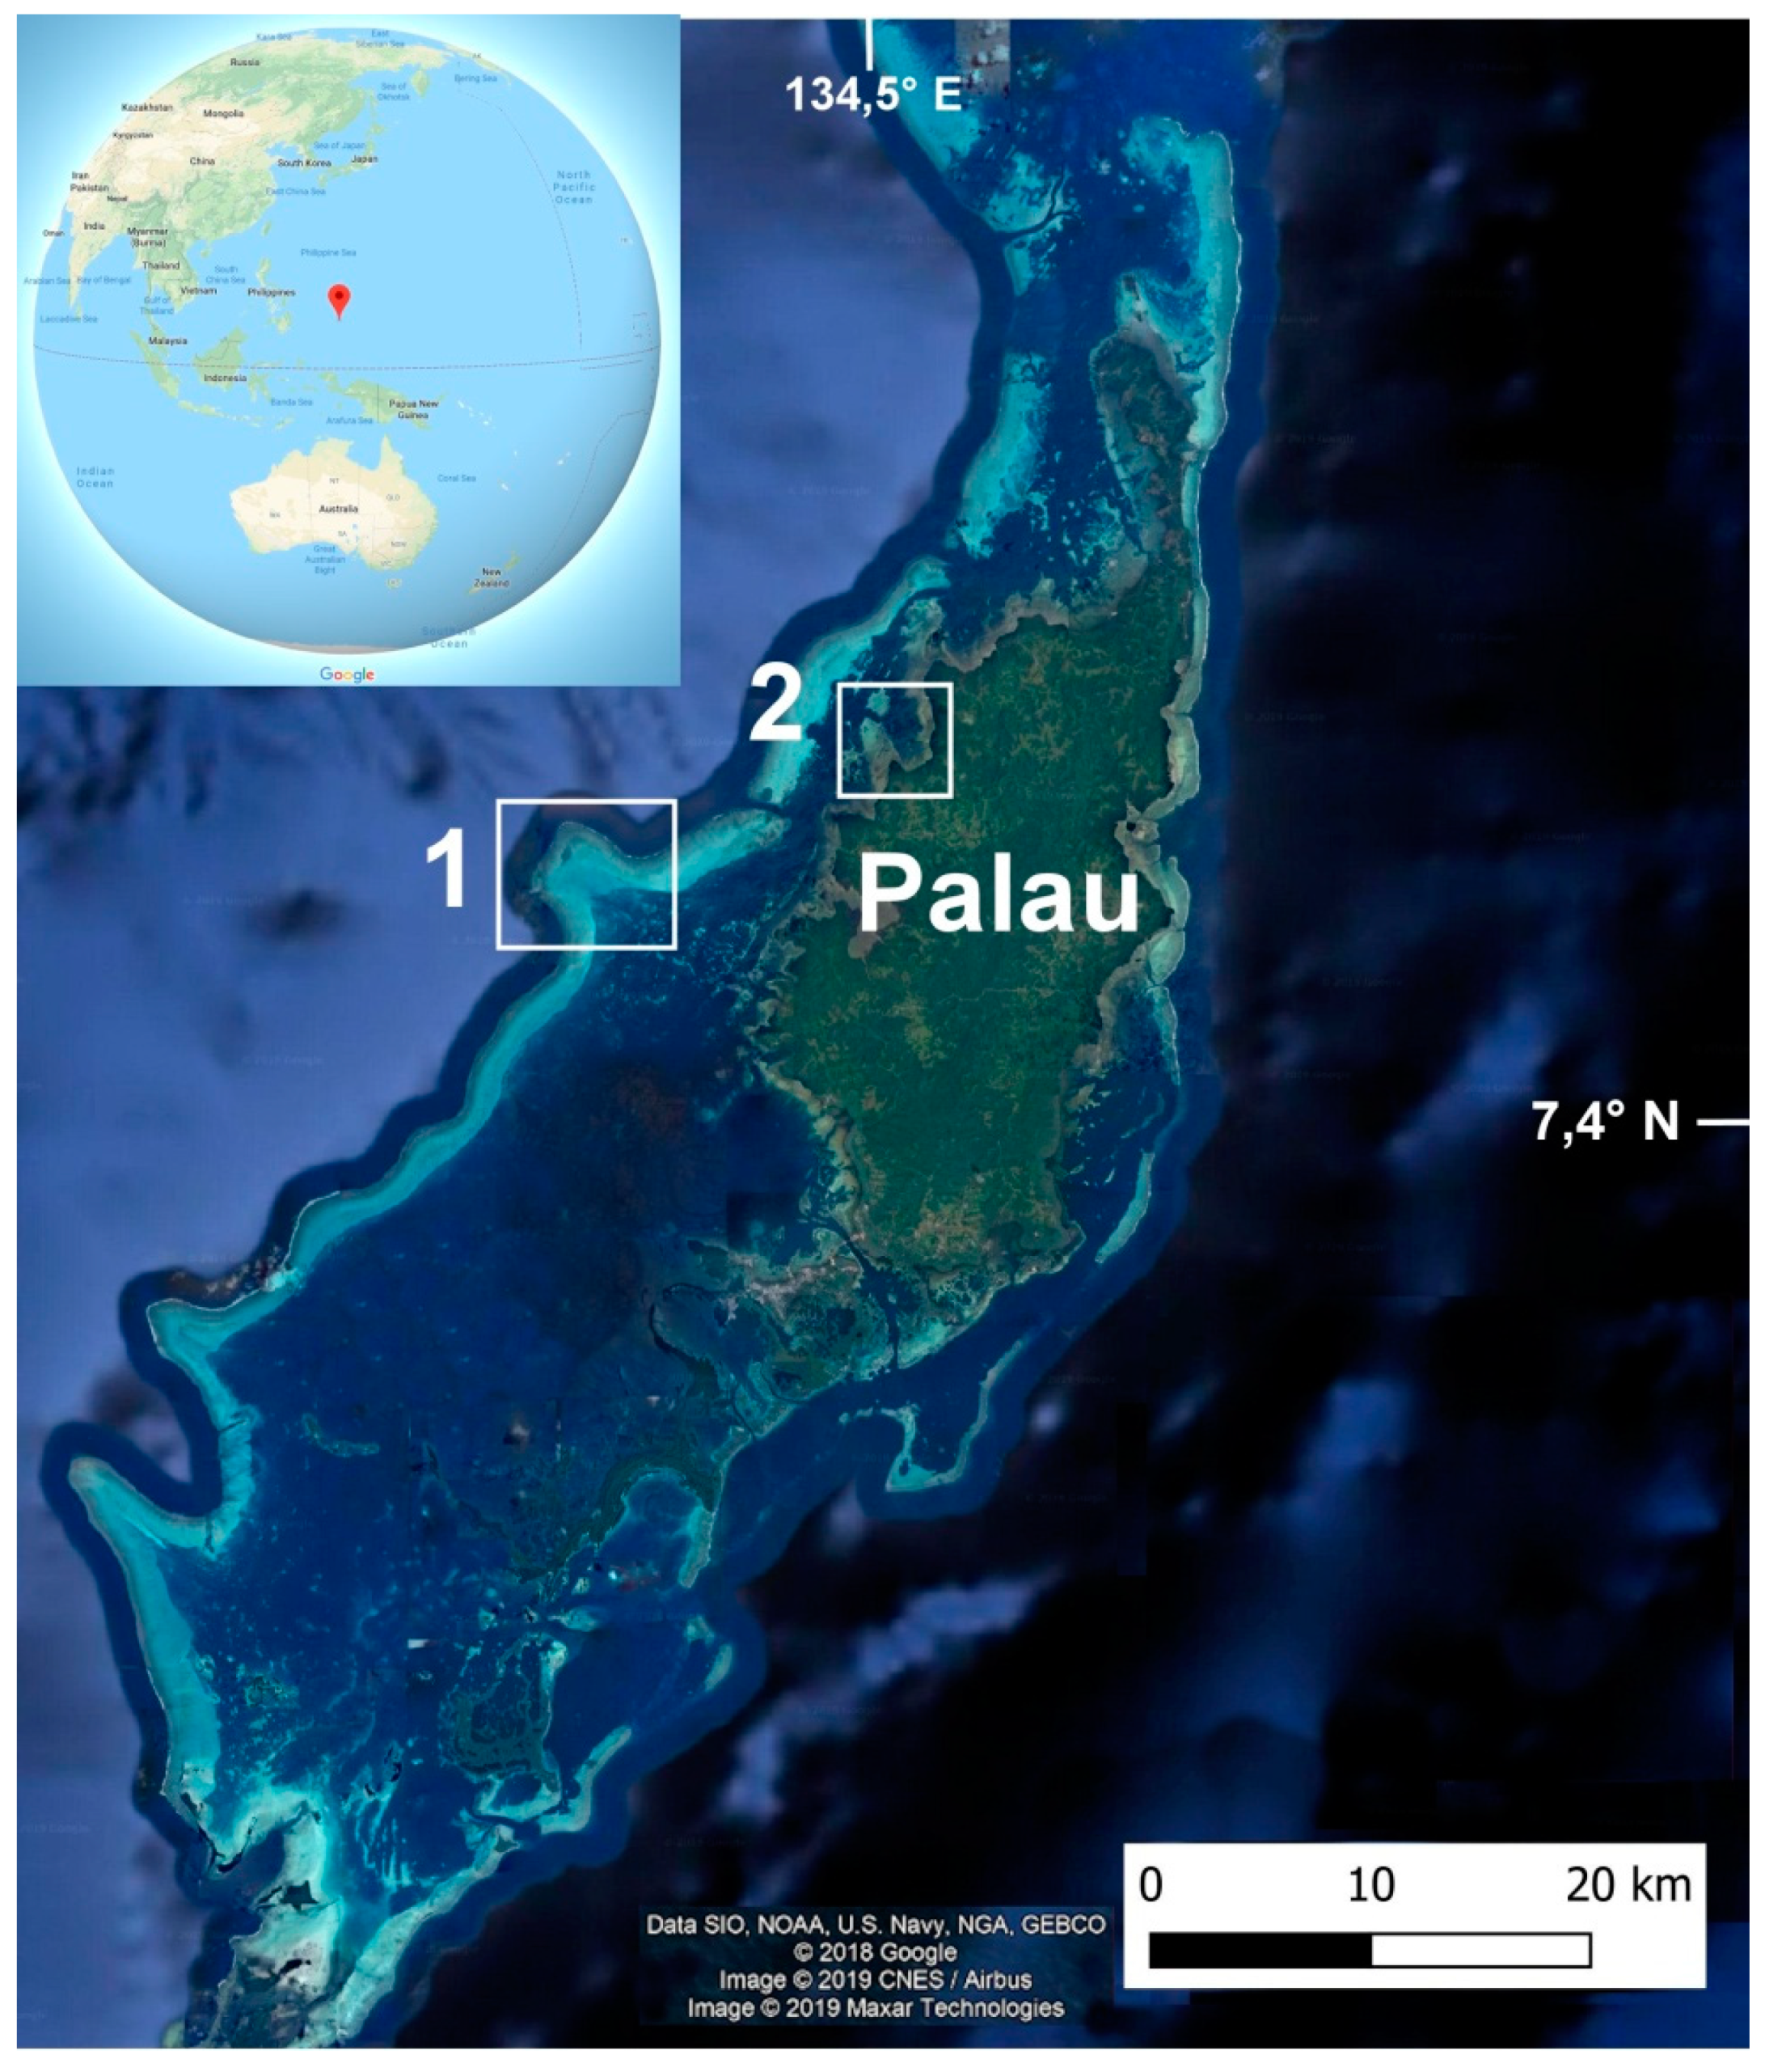
2.1. Study Area

The Republic of Palau is an island country located in the western Pacific Ocean; the country contains approximately 340 islands, forming the western chain of the Caroline Islands in Micronesia, and has an area of around 466 square kilometres (Figure 1).
The Palauan coral reef ecosystem has the most diverse flora and fauna of Micronesia. Palau has some of the most extensive seagrass beds in all of Micronesia, hosting 10 species of seagrass [25]. Seagrasses are valuable habitats that provide important ecological components of coastal ecosystems worldwide. Moreover, one of the most significant ecosystems in Palau are the mangrove forests, the transition zone between terrestrial and marine ecosystems. The most extensive areas of mangrove forests occur along the west coast of the main island of Palau Republic (Babeldaob), covering approximately 80 percent of the shoreline. In the mangrove forest of Palau, there are 18 mangrove trees and associated plant species, the most diverse in Micronesia. These habitats provide a number of ecological functions, from nurseries for juvenile fish to food and shelter for invertebrates and rare, protected species as sea turtles, crocodiles, and dugongs. Mangroves are ecologically important also because they help stabilize coastal areas by trapping and holding sediments washed down from inland areas and local watersheds. Moreover, the islands of the Pacific region lie in one of most seismically active regions of the world and for the coastal population mangrove forests are often the first line of defence against such natural calamities.

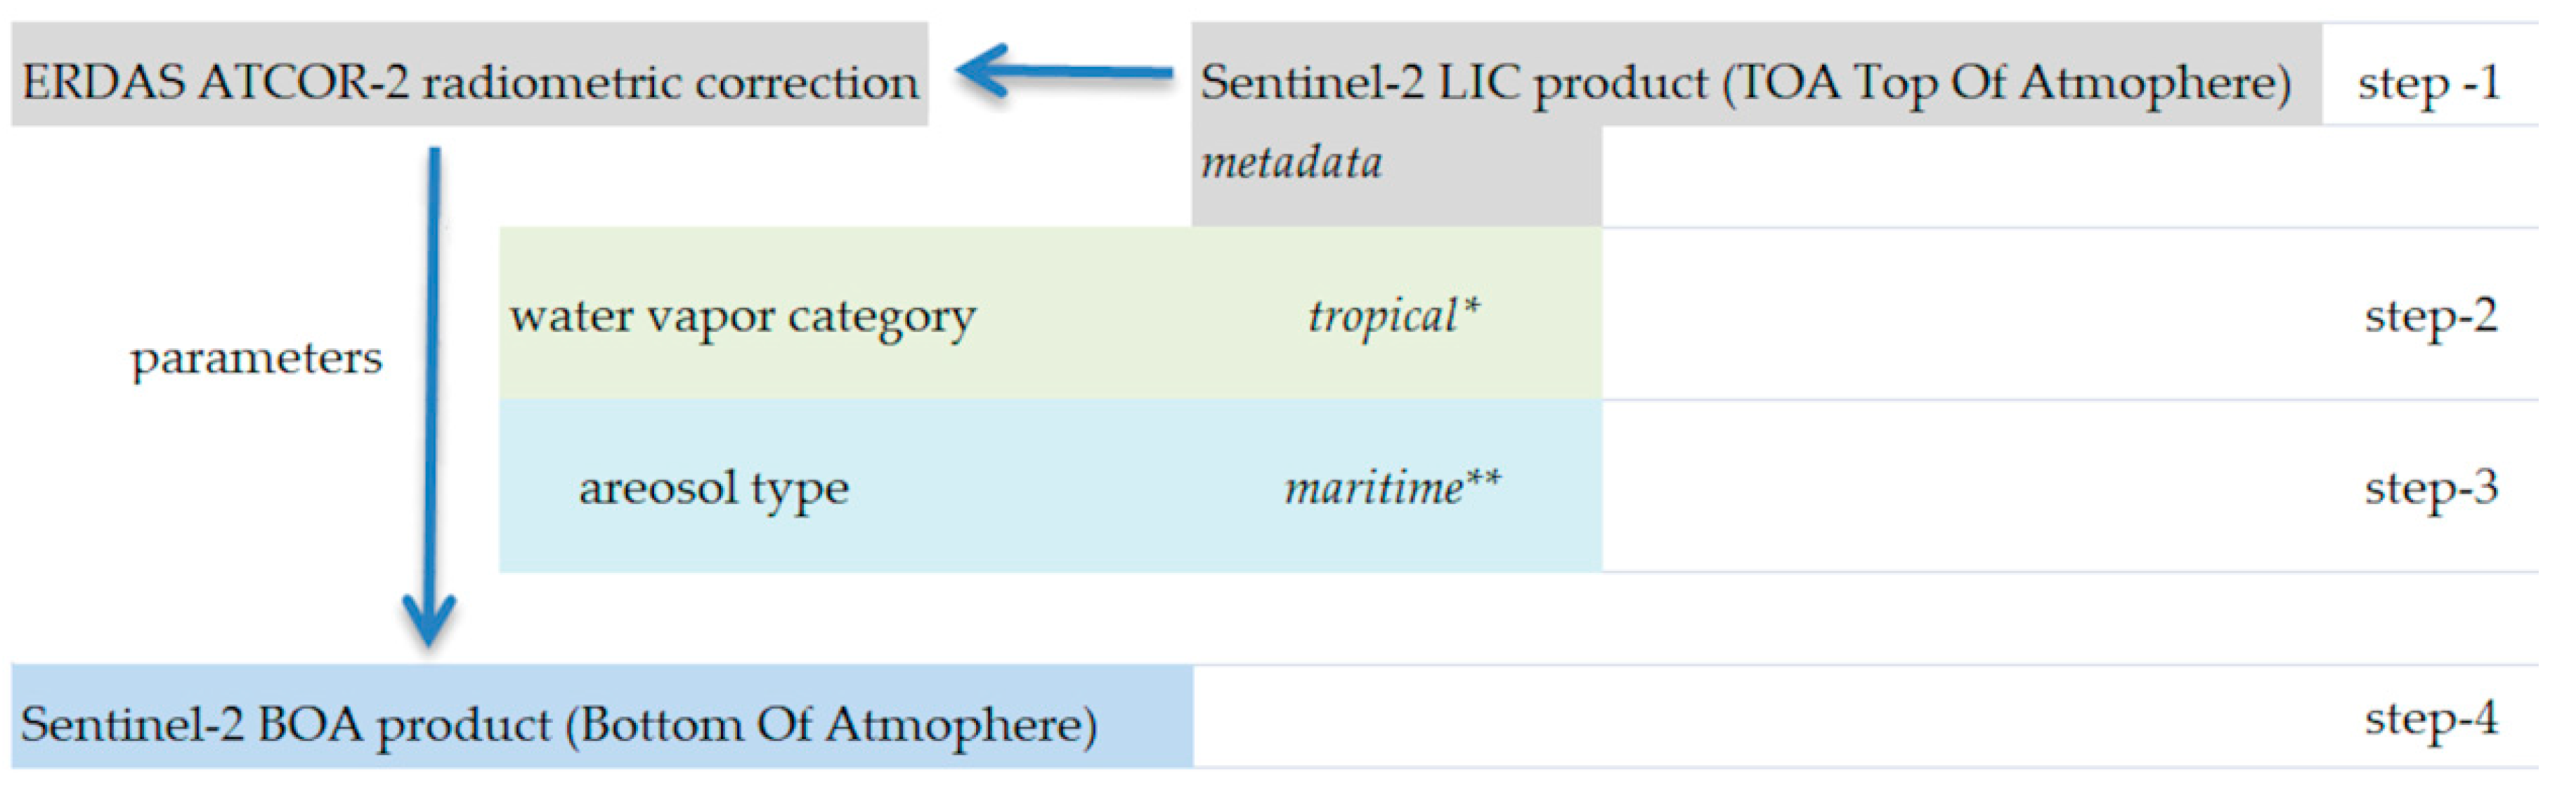
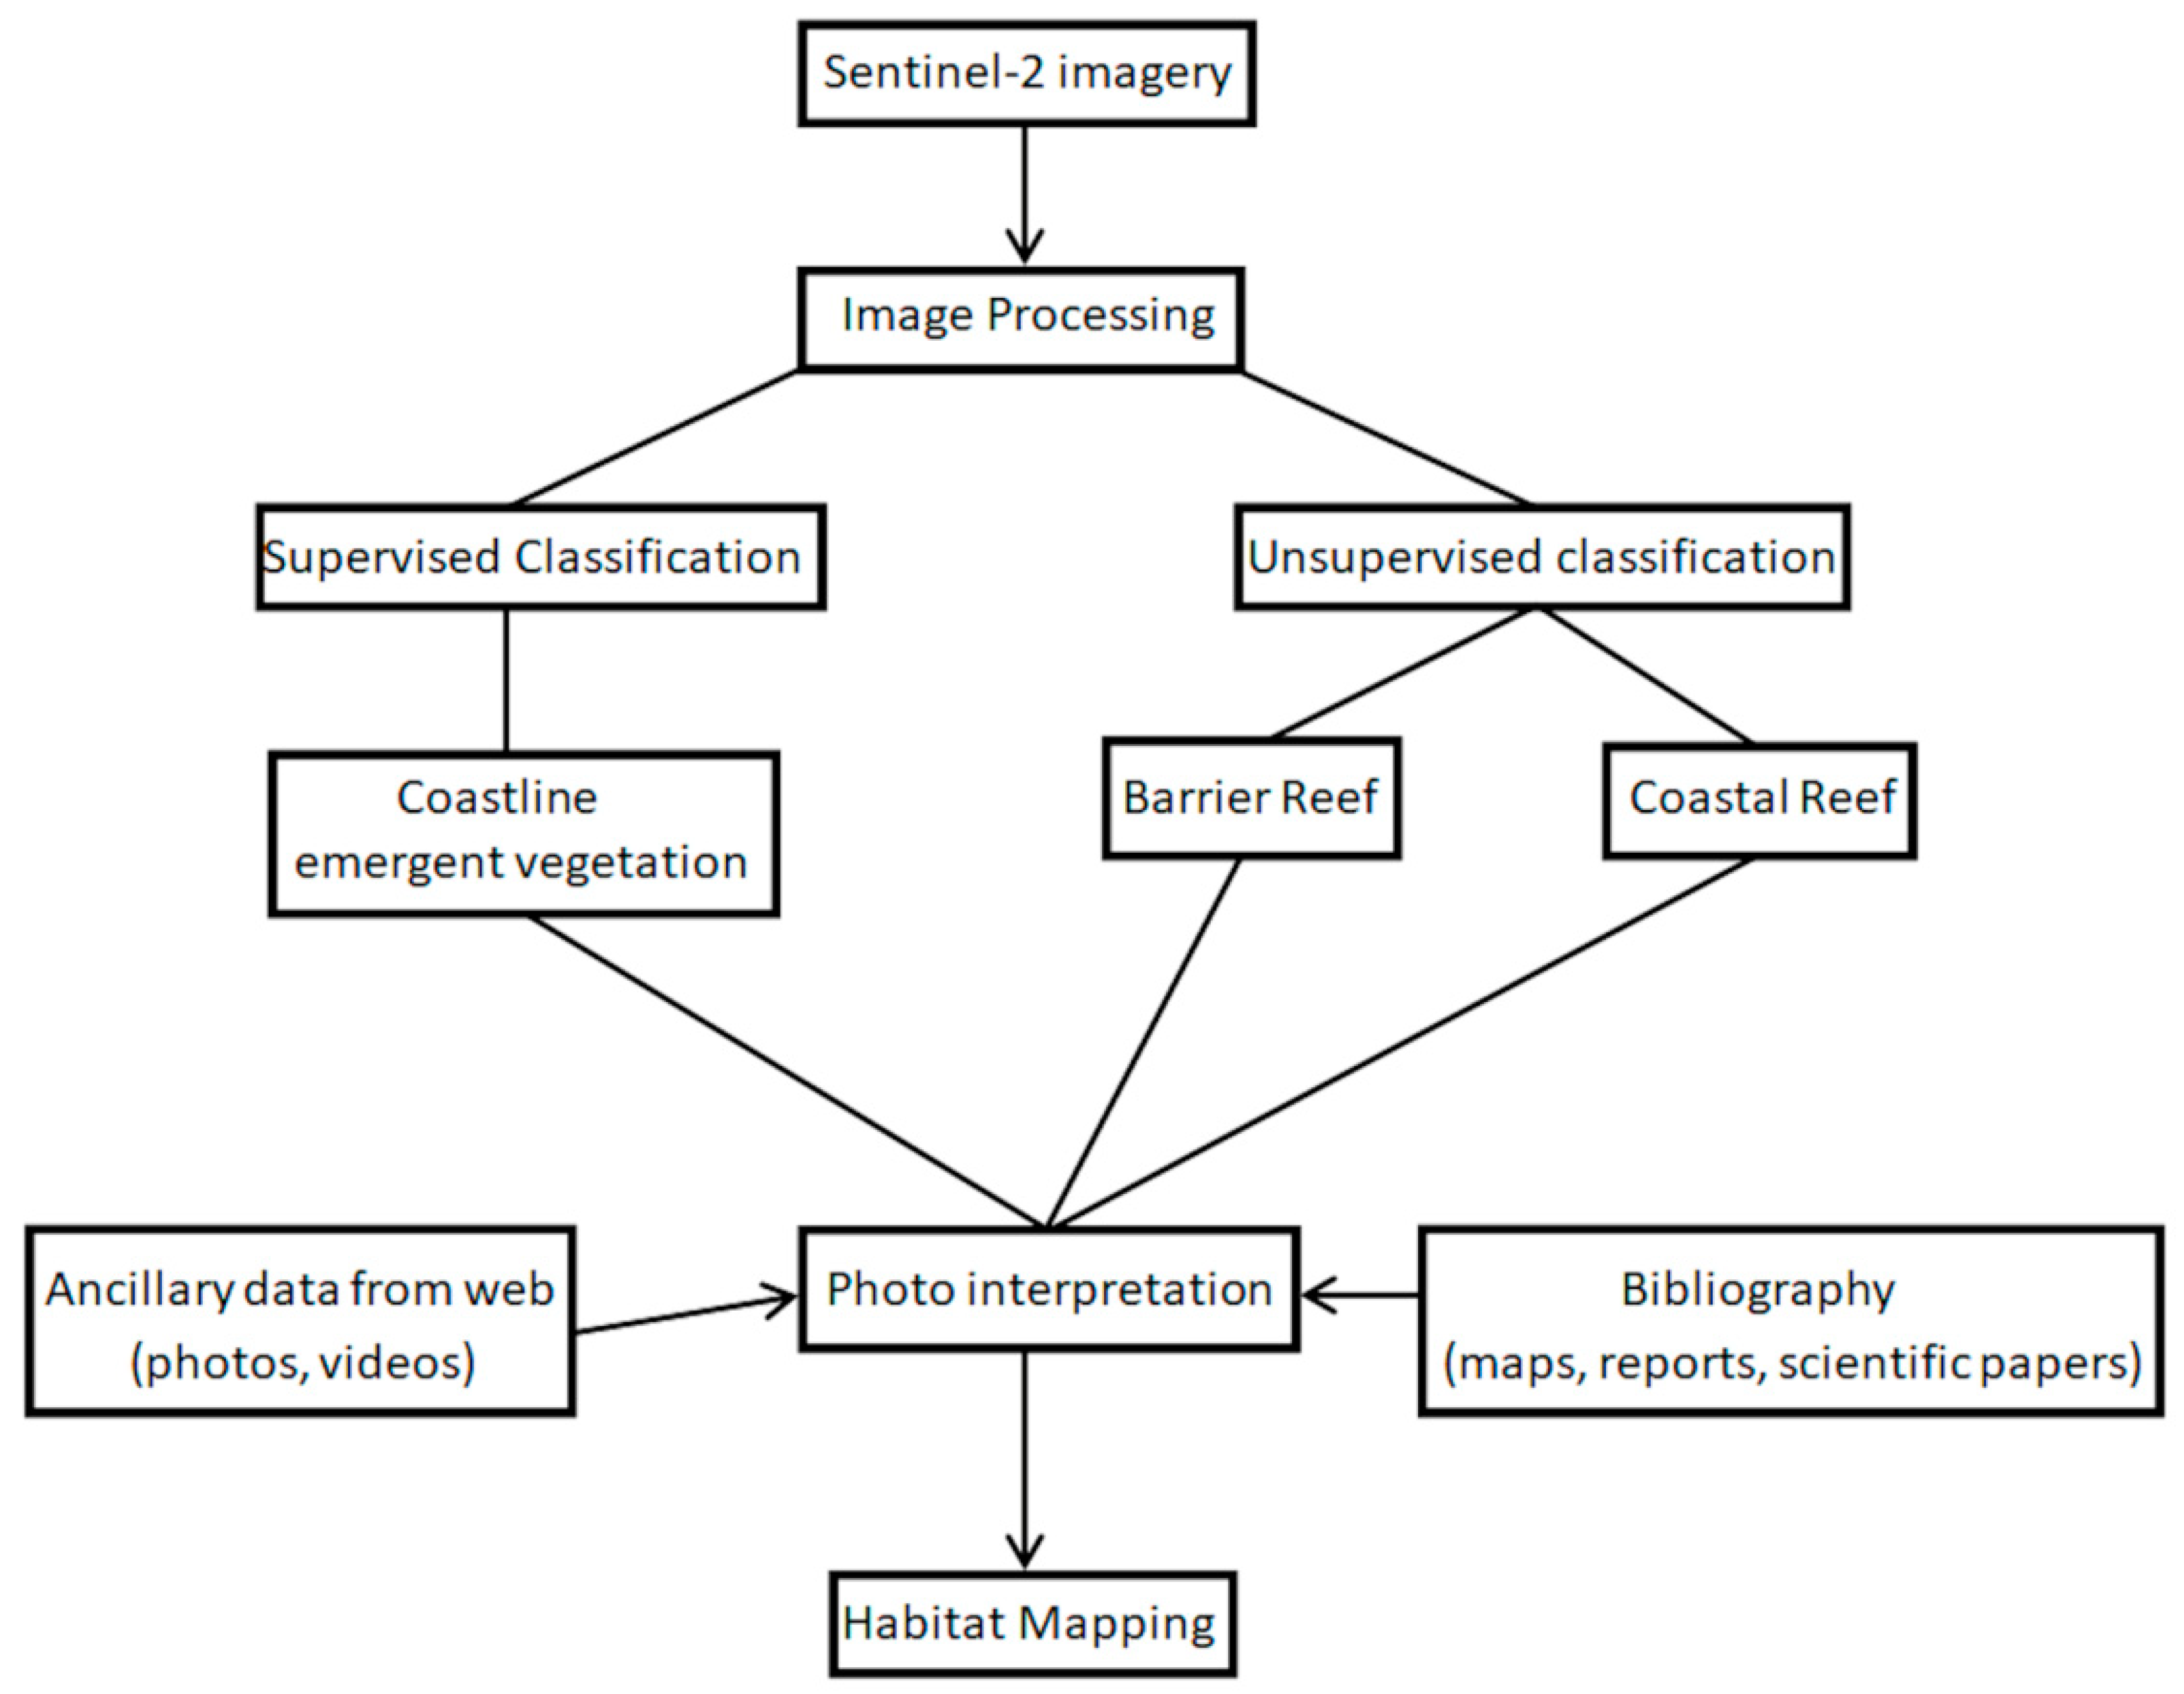
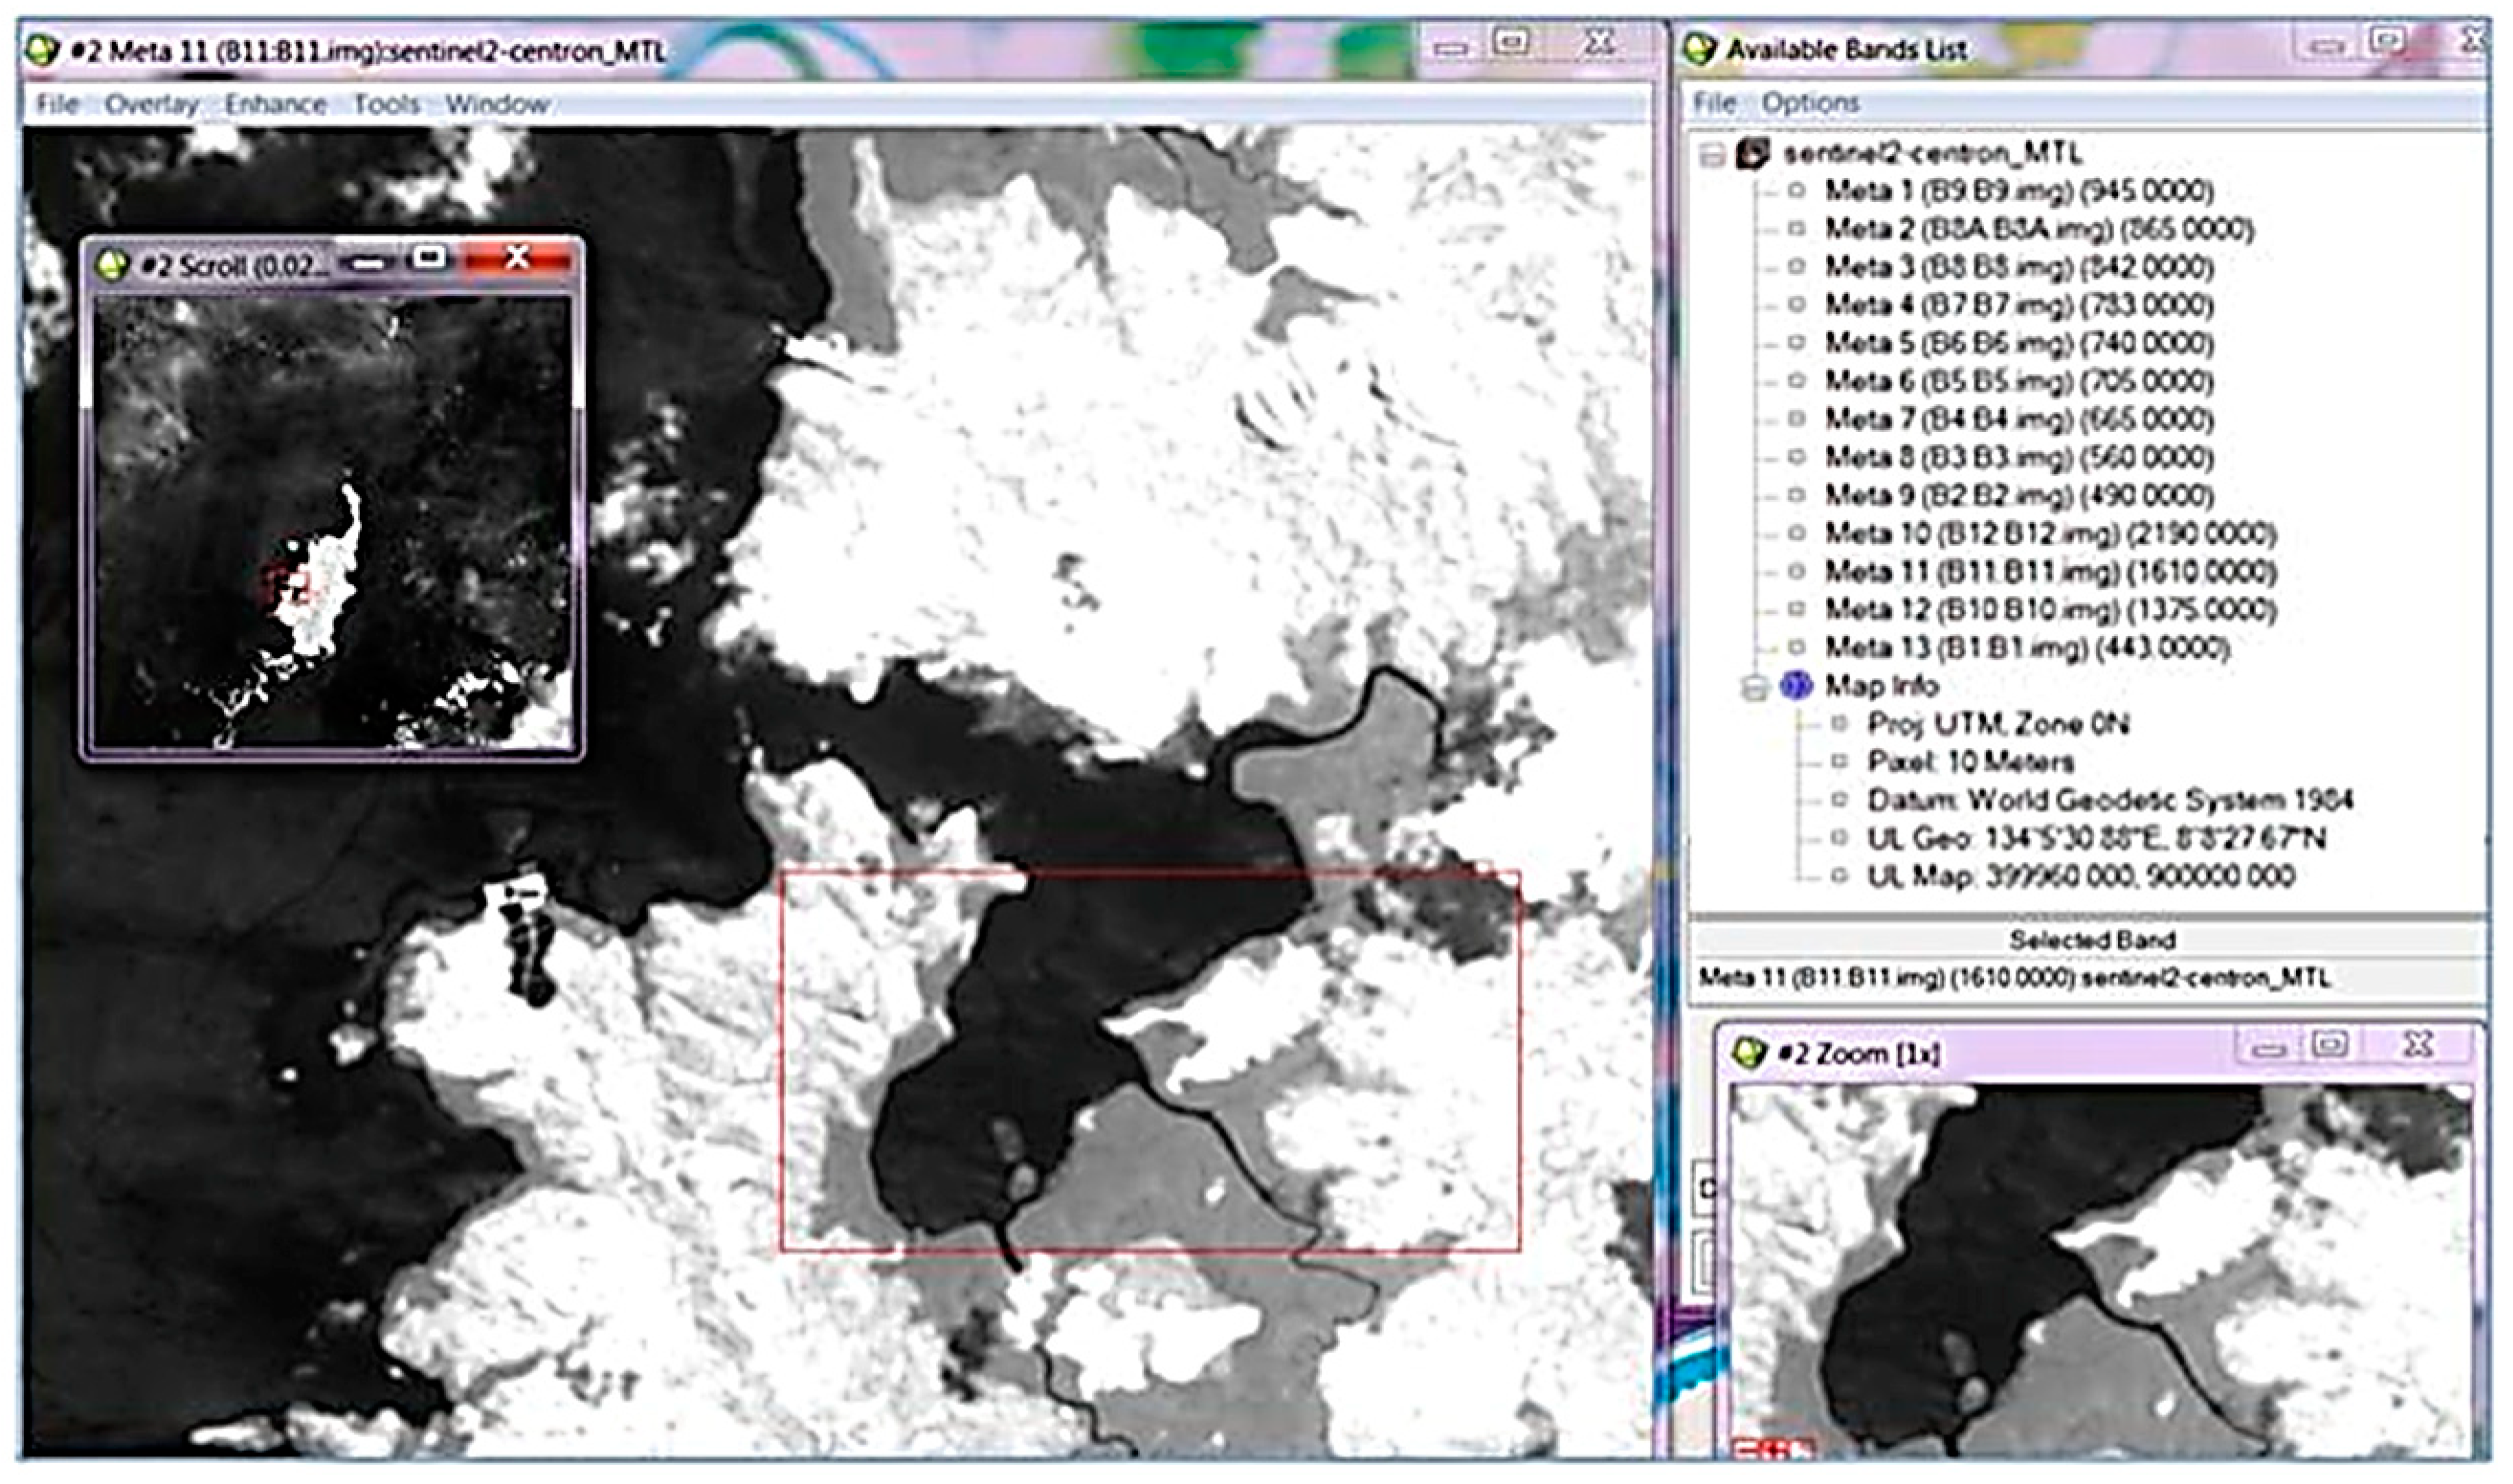
2.2. Image Processing and Shallow-Water Benthic Classification

Two Sentinel-2 2017 satellite images (4 July 2017) were downloaded from the open source portal of the European ESA-Copernicus project (https://scihub.copernicus.eu/). Sentinel-2 product used in this work provides orthorectified Top-Of-Atmosphere (TOA) reflectance (Level 1-C), with sub-pixel multispectral registration. Cloud and land/water masks are included in the product. SENTINEL-2 products are available to users in SENTINEL-SAFE (Standard Archive Format for Europe) format, including image data in JPEG2000 format, quality indicators, auxiliary data, and metadata (https://sentinel.esa.int/web/sentinel/user-guides/SENTINEL-2-msi/data-formats). The SAFE format has been designed to act as a common format for archiving and conveying data within ESA Earth Observation archiving facilities. The SAFE format wraps a folder containing image data in a binary data format and product metadata in XML. This flexibility allows the format to be scalable enough to represent all levels of SENTINEL products. The SENTINEL-2 product refers to a directory folder that contains a collection of information and includes: manifest.safe file which holds the general product information in XML; preview image in JPEG2000 format; subfolders for measurement datasets including image data (granules/tiles) in GML-JPEG2000 format; subfolders for datastrip level information; subfolder with auxiliary data (e.g., International Earth Rotation & Reference Systems (IERS) bulletin); HTML previews.
The ERDAS ATCOR radiative transfer model was used for atmospheric corrections (Figure 2): it eliminates atmospheric and topographic effects in satellite imagery and extracts physical surface properties, such as surface reflectance, emissivity, and temperature. ATCOR Workflow employs a database containing the result of radiative transfer calculations based on MODTRAN® 5.
The processed multispectral satellite images showed the presence of calm, clear waters, and—considering the shallow depths—water penetrating correction and sun glint corrections procedures were not applied [26,27]. To this end, standard atmospheric corrections have been carried out, considering the type of atmospheric column, the SENTINEL-2 image acquisition period and the sensor instrument parameters that the ERDAS software automatically recognizes by reading the metadata at the beginning of the acquisition procedure.
All Sentinel-2 bands were processed and ‘re-sampled’ in order to get the highest resolution possible (10 m); then the ENVI image analysis software was used for classification procedures.
Two separate approaches were used to classify inland mangrove cover and habitat classes related to coral platform; the analysis processing chain is illustrated in Figure 3.
First, for the ‘coastline emergent vegetation’ or mangrove classification, all Sentinel-2 13 bands were processed and ‘resampled’, building a metafile, in order to get the highest resolution possible (10 m). Then Band 11 (wavelength range 1542–1685 nm) was particularly enhanced in order to distinguish the land, habitat of mangroves, and sea (Figure 4).
The spectral signatures of mangroves and land vegetation were extracted from the Sentinel-2 image and here reported to show their spectral separability (Figure 5).
Hence, the ENVI ‘supervised classification’ through ‘region of interest’ (ROI) and ‘maximum likelihood’ methods were applied in order to separate the land from mangroves and sea. This approach allowed to compute the total shoreline length and the mangroves cover for the whole Palau Archipelago (Figure 6).
For the habitat classification related to coral platforms, we restricted the analyses to two sites, located in the western side of the main Palau island (Figure 1) and representatives of the two main morphological zones of the island: the barrier reef (site no. 1) and the coastal reef (site no. 2). The ENVI algorithm that showed better results was the ‘unsupervised isodata classification’ performed for a maximum of 20 classes on Sentinel-2 using bands 2-3-4-8 with 10 m of resolution. Unsupervised classification yields an output image in which a number of classes are identified and each pixel is assigned to a class [28]. This classification often results in too many land cover classes, particularly for heterogeneous land cover types, and classes often need to be combined to create a meaningful map; the classification is useful when there is no pre-existing field data or detailed aerial photographs for the image area, and the user cannot accurately specify training areas of known cover type. In marine habitat classification, the unsupervised isodata classification is considered the most appropriate for an approach with no sea truth validation [29,30,31].
The spectral signatures of the reef coverage were extracted from Sentinel-2 image and here reported on a plot (Figure 7) to show the spectral separability among them. To check the reliability of atmospheric corrections and subsequent classification of the Sentinel-2 image, the ROI of the coverage classes present in the coralligenous environment was extracted.
The image interpretation for the coastal benthic classification was based on two main components: the geomorphologic description of the seabed and the biological relevance of the associations living in the zone (Table 1).
We referred to the NOAA (National Oceanic and Atmospheric Administration, Silver Spring, MD, USA) Shallow-Water Benthic Habitats Manual [32] to identify priority habitats in terms of ecological function and coral presence. Hence, on the barrier reef, the following five main habitat classes were used for RS classification:
(1) The ‘fore reef’ is the outward part of the reef barrier. On its underwater cliff, all coral biodiversity is concentrated along the first 20–40 m of depth. It represents the most important reservoir for coral maintenance and survival; (2) The ‘reef crest’ is the part of the outer barrier reef more exposed to open-ocean waves. Its associated subclasses are the living coral and one algal ridge formed mainly by coralline algae. It is the most important area of the barrier for the defence of the coastline and it is the most sensitive to mortality due to low tides, elevated seawater temperatures, and storms; (3) The ‘back reef’ is the area of the barrier reef formed by a coral platform and is limited towards the coastline by the lagoon. It may be very large and in its shallow areas is characterized by an eroded platform and rubbles with associated subclasses of coralline algae, massive corals, and algal turf. It is the area where fragments of corals of the reef crest damaged by open-ocean waves may survive. The slope of the back reef limited by the lagoon is normally formed by sand and coral rubbles; (4) The ‘patch reef’ includes as subclasses the scattered living coral formations like coral knob, coral head, irregular little islands of aggregated corals surrounded by sand, found on the back reef, on coral platform, or dispersed in the lagoon. The patch reef is important because it includes isolated living reef that represent a ‘reservoir’ both in term of larvae and individuals of different coral species; (5) The ‘lagoon’ is the area between the back reef and the coastline. Here coral, sand, and rubble are abundant. However, the lagoon represents a limit for the RS investigations when the depth may exceed 30 m. In this deep area, indicated as ‘deep lagoon’, the coral cover may be important but should be investigated with other methodologies (transects, multibeam, side scan sonar). The species of coral inhabiting the lagoon and the deep lagoon could be an important reservoir of larvae for the surrounding communities.
On the coastal reef, the following three main habitat classes were used:
(1) The ‘coastal fringing reef’ or ‘coastal reef crest’ is the seaward fringe of the coastal reef flat. Its associated subclasses are living corals in good health; this habitat class is subjected to erosion by waves and it is the most important indicator of the coastal reef erosion together with blue holes; (2) The ‘coastal reef flat’ includes the reef platform formed by dead coral surrounding the coast of the major island and it can reach the coastline as a rock substrate. Its subclasses include seagrasses and algae (mainly macroalgae) in the area where fine sediments are deposited. Its importance is related to the coastal defence from erosion; (3) Shoreline and emergent vegetation is formed from the emergent vegetation habitat composed primarily of red mangroves, generally found in areas which are sheltered from high-energy waves.
Finally, the classes ‘unknown’ or ‘unclassified’ represent the uninterpretable areas due to cloud shadow, water depth, or other interference.

2.3. Validation of Image Interpretation
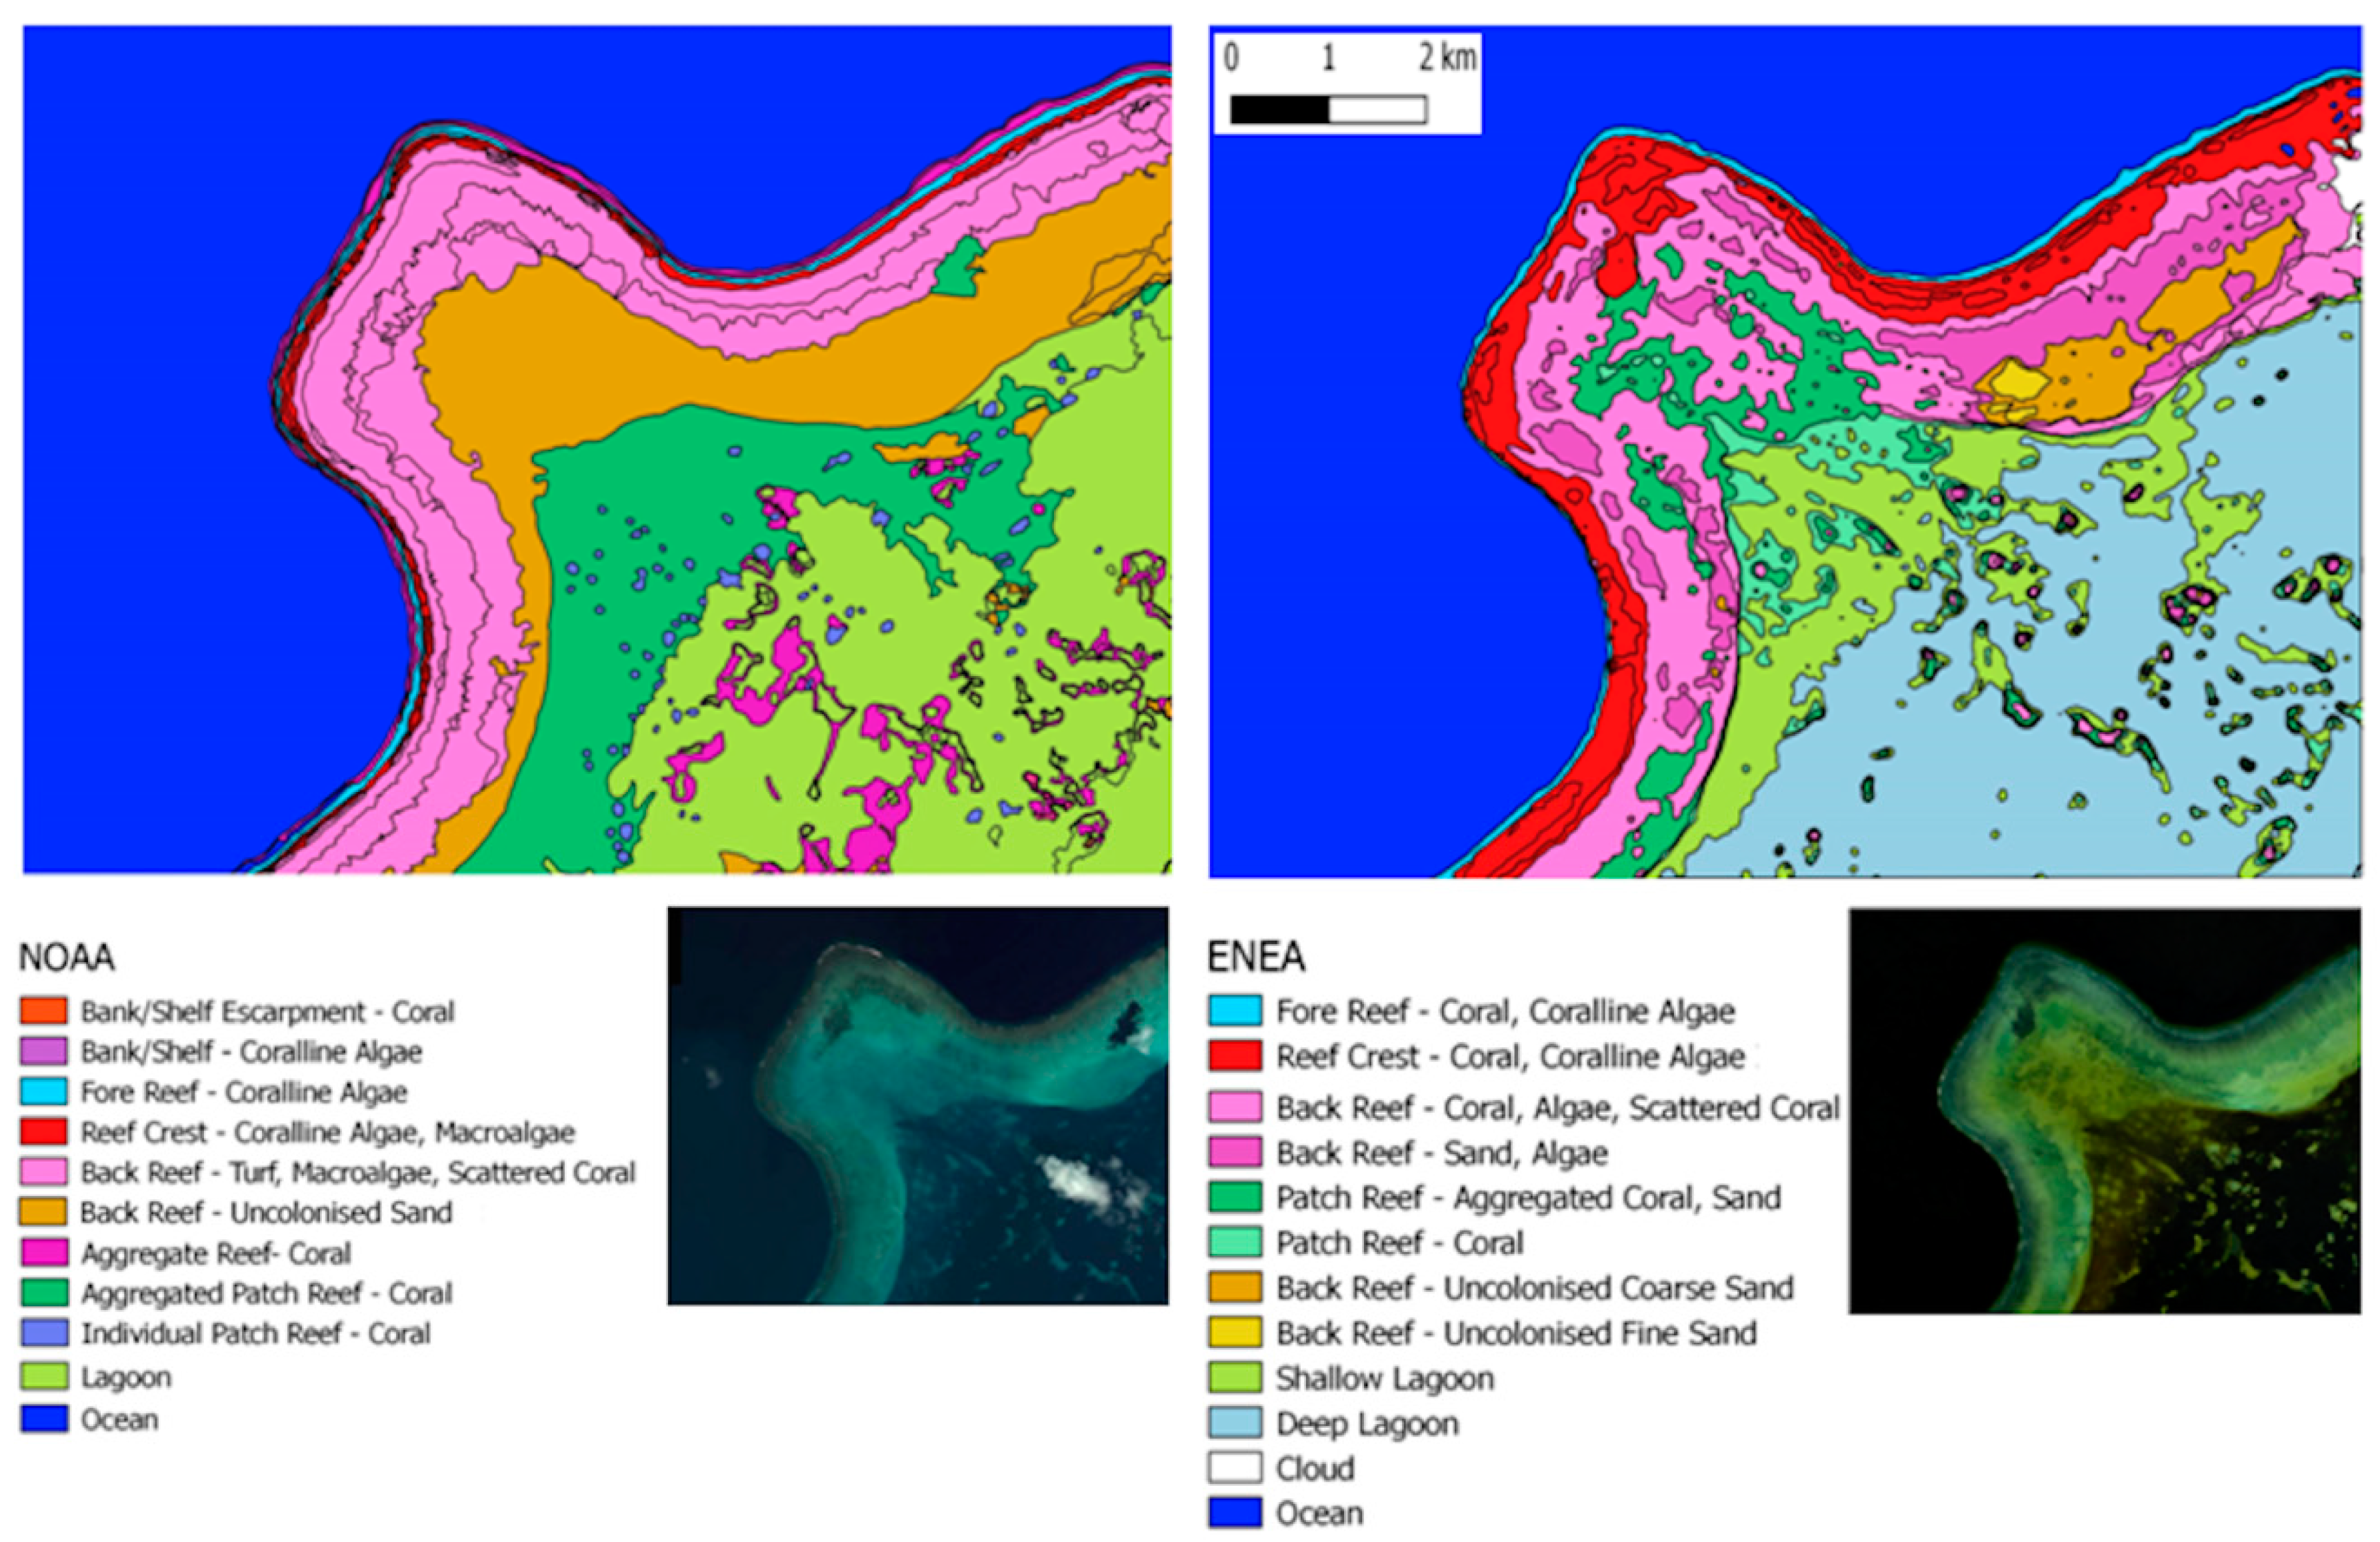
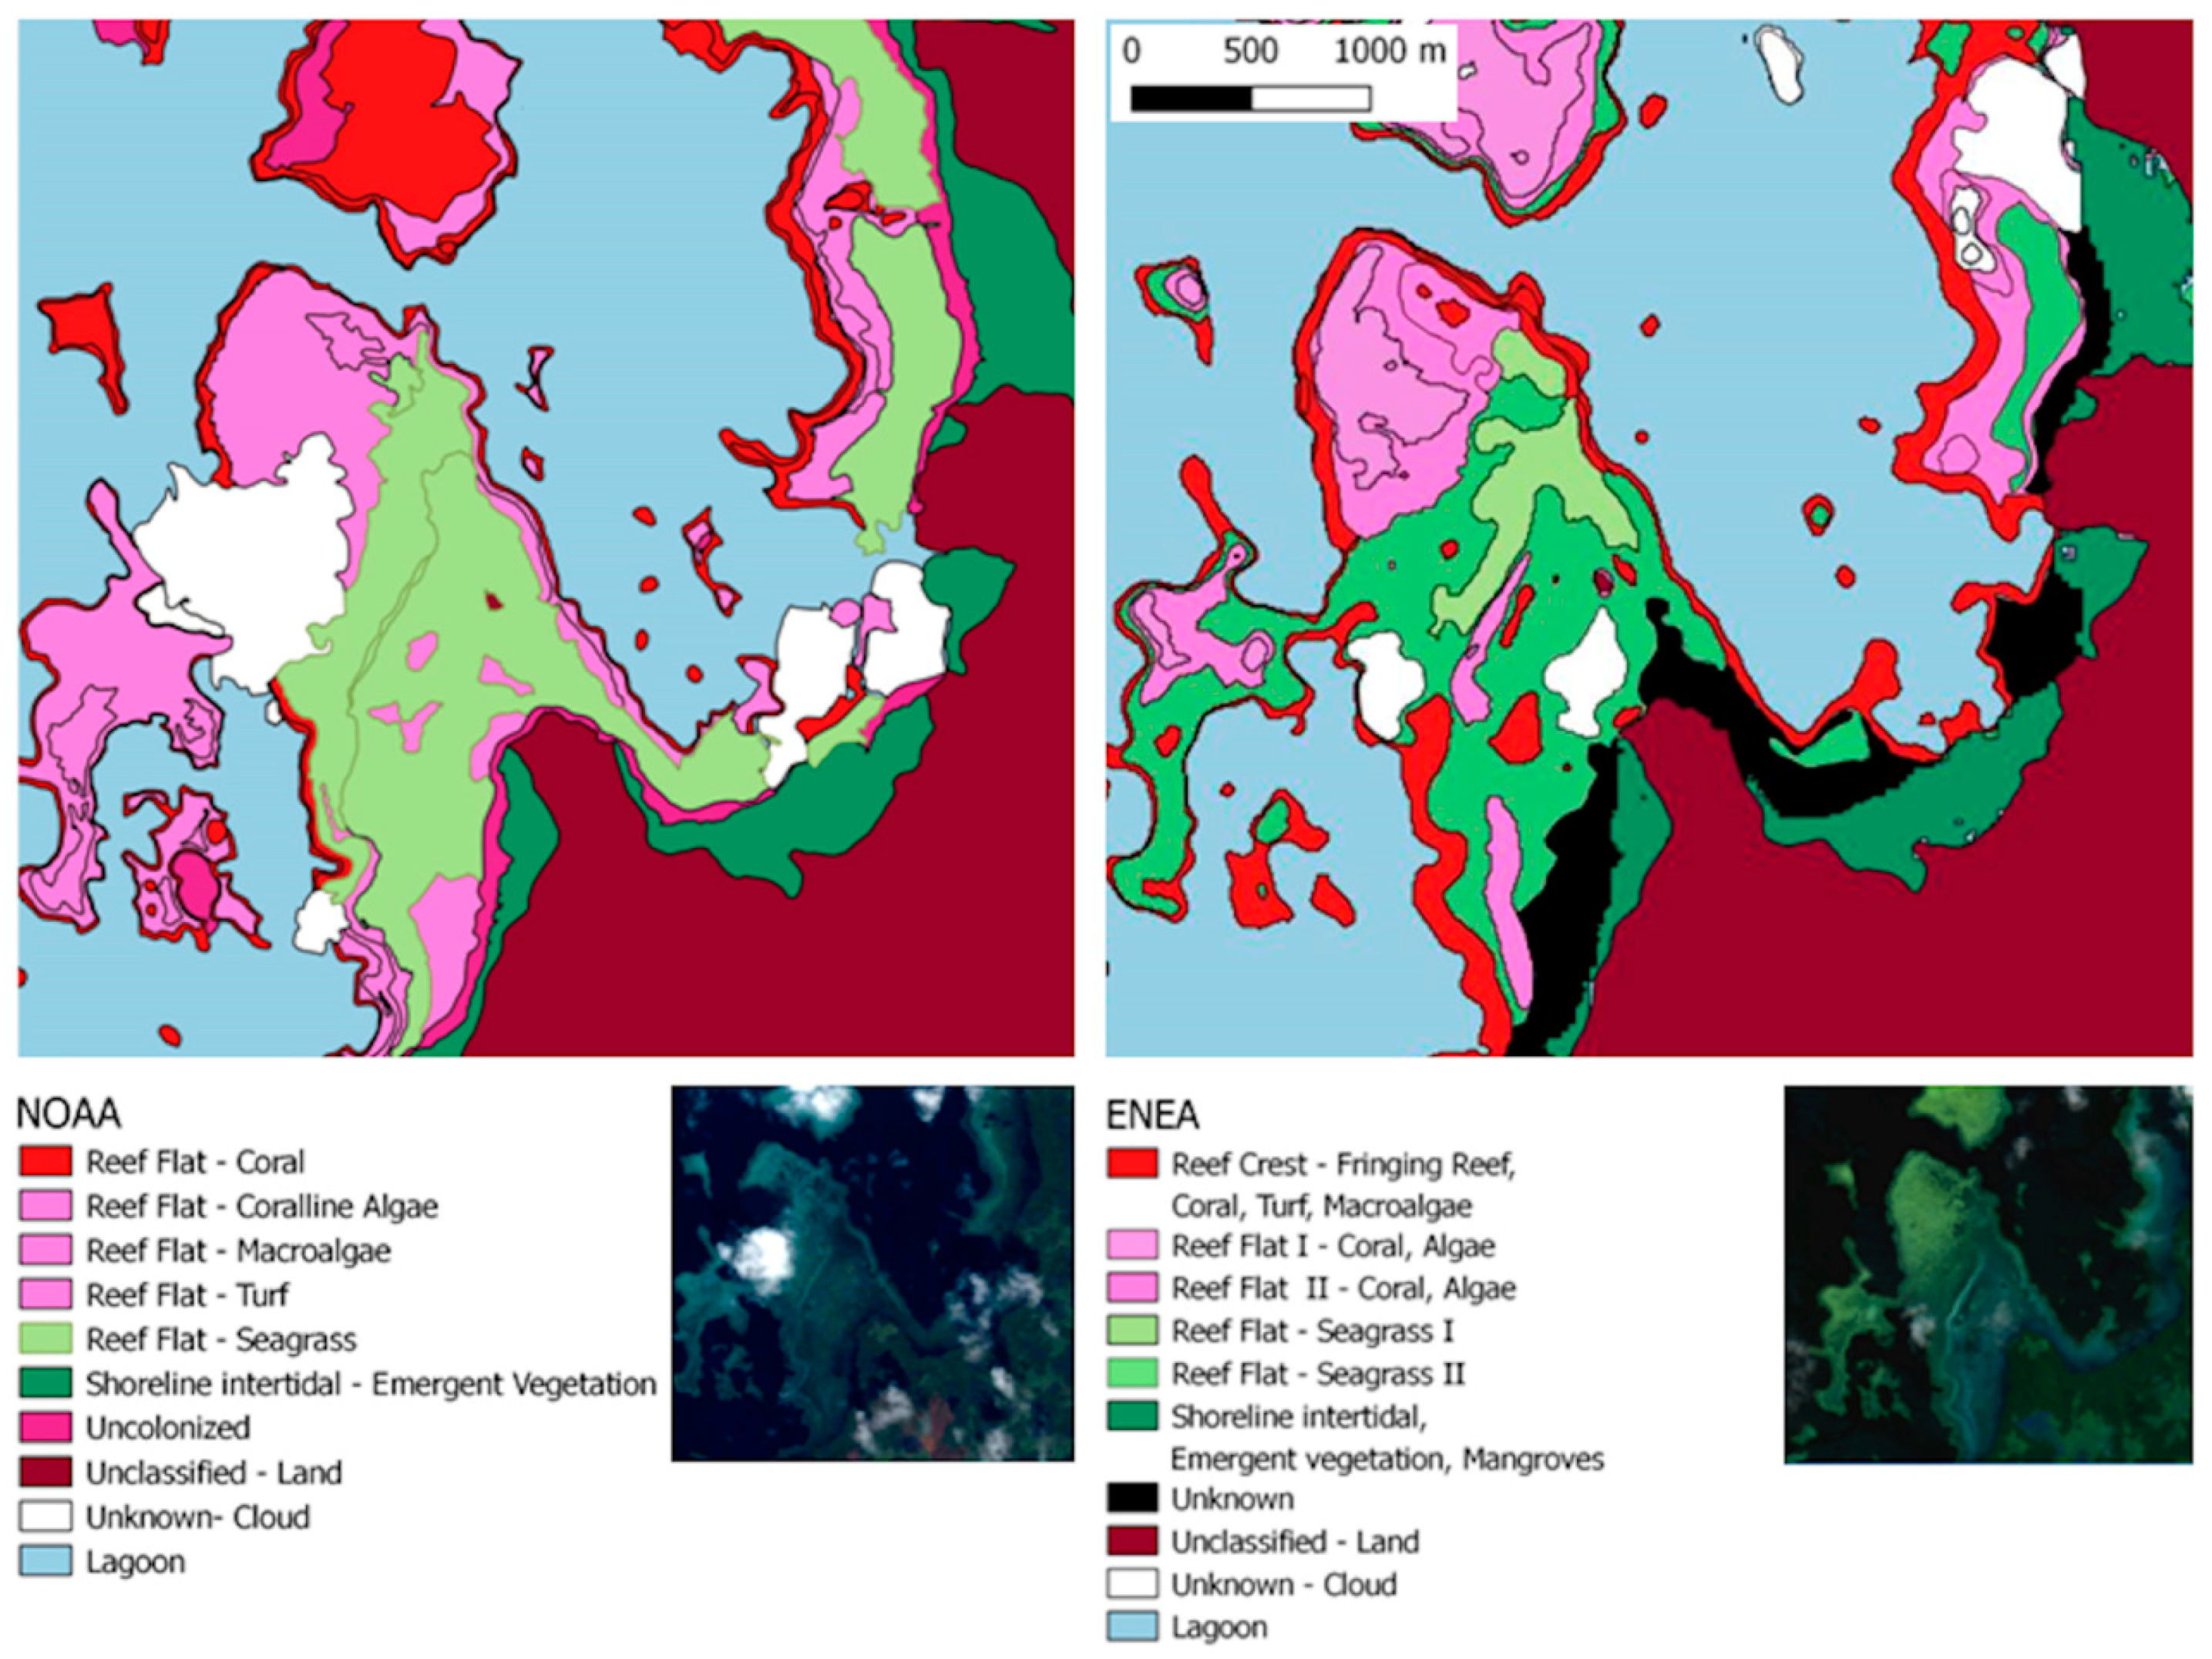
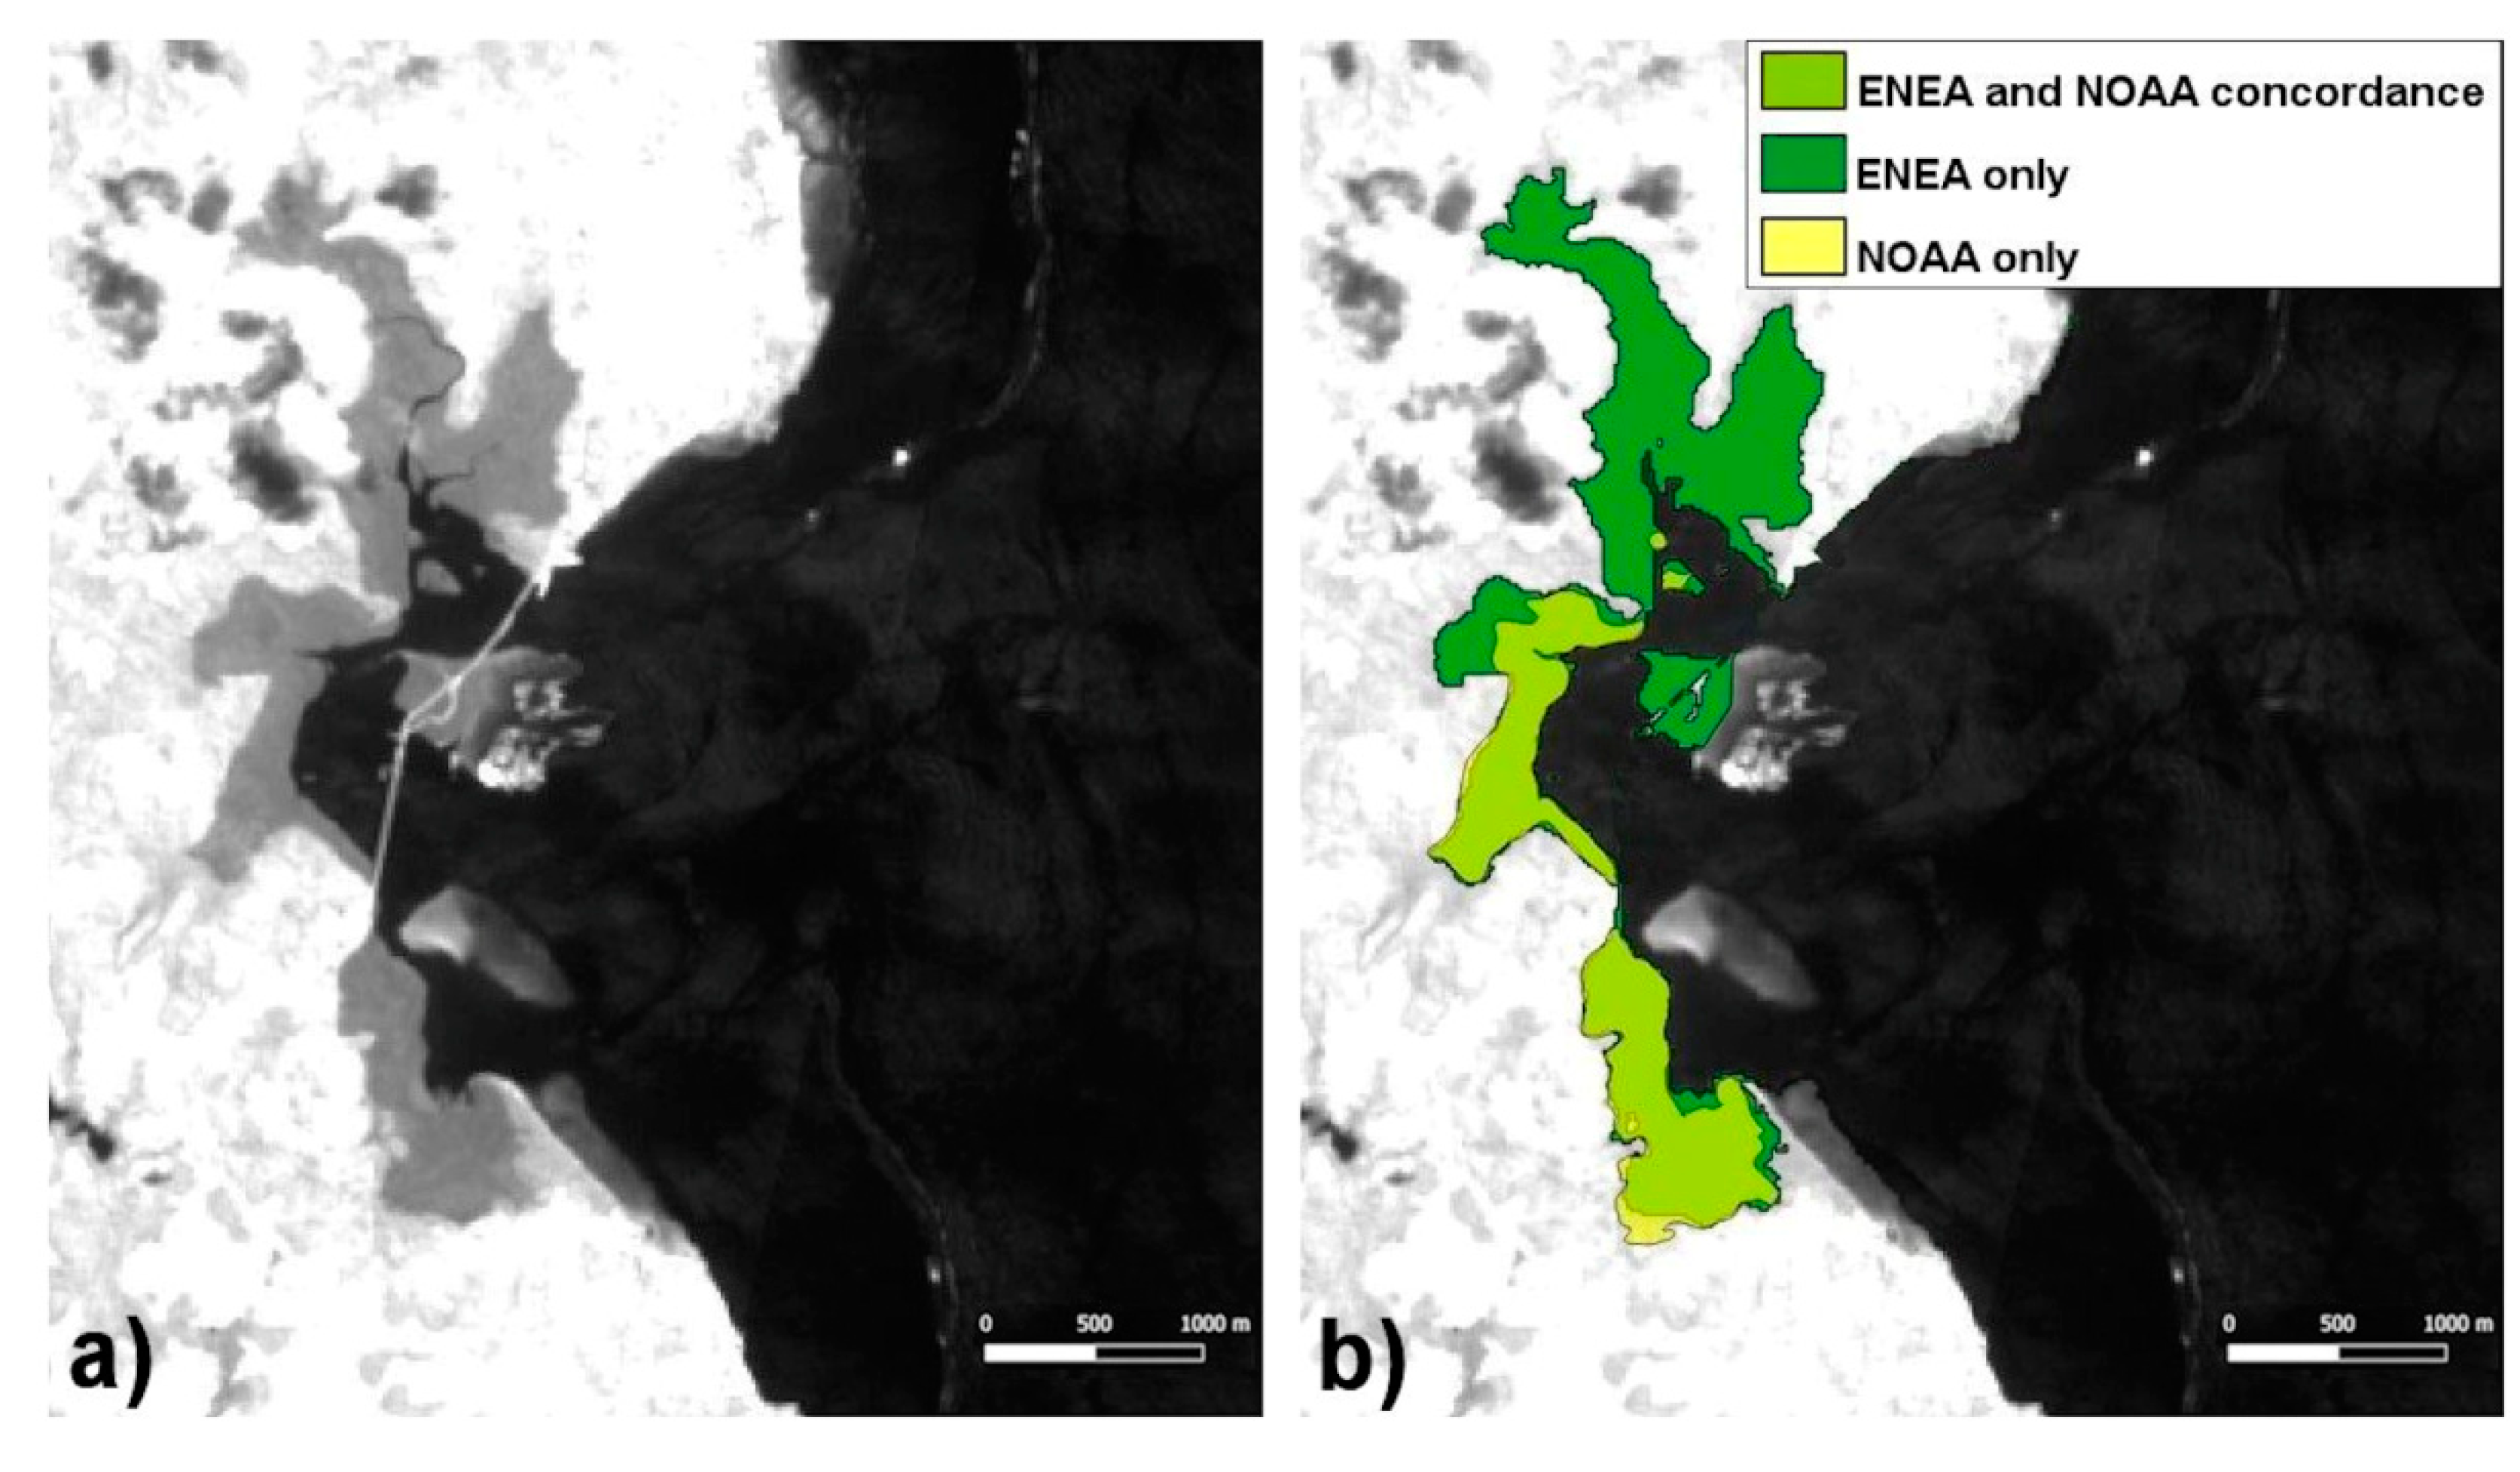
To validate the Sentinel-2 image interpretations, the habitat mapping results were compared with available Palau NOAA maps (https://products.coastalscience.noaa.gov/collections/benthic/e102palau/). These maps are the final results of a 4-year project [33]: NOAA collected 2002 and 2004 multispectral Ikonos and supplemental Quickbird satellite imagery of Palau Archipelago with spatial resolution of 4 m (raw multispectral) and 1 m (pan sharpened). Color balanced imagery proved suitable for visual extraction of the habitat classes. NOAA image process included atmosphere correction, deglinting, color balancing, orthorectification, correction for water column effects and pan sharpening. Collection constraints were set to control environmental effects such as glare, glint and other interferences that would limit visualization of benthic features. NOAA multiple collects were conducted to mosaic multiple scenes up to a maximum of 10% cloud cover. These images were used by NOAA to manually interpret and delineate geomorphologic features, cover types, and habitat boundaries. NOAA maps were produced following the schemes for habitat classification prepared by coral reef biologists and mapping experts. Ground validation information was used to investigate uncertainties on the photo-interpreter behalf during the decision-making process of the manual delineation of zones or structures. To test the interpretation accuracy, sea-truth validation was performed by NOAA through 623 benthic habitat characterizations conducted in four areas of Palau. Results showed an overall accuracy in habitat identification from 88.4 to 97.3% and with a thematic accuracy of the habitat classification schemes ranging from 0.79 Tau for detailed cover (79.9% overall accuracy) to 0.96 Tau for major structure (97.3% overall accuracy).
In the present work, main habitat classes cover derived from Sentinel-2 data were compared with NOAA and used as reference data for accuracy evaluation of the proposed method.

3. Results

The shoreline length and the mangrove cover were calculated for the whole Palau Archipelago. A comparison between NOAA results [28] on 2003–2006 Ikonos imagery and the present work on 2017 Sentinel-2 images is shown in Table 2. Shoreline and mangroves area values show relevant differences in the considered period, equal to 18.8% and 25.0%, respectively. The shoreline length of the Republic of Palau is calculated by NOAA, derived from 2003–2006 Ikonos Imagery, as 1021 km by visual interpretation and manual delineation of satellite imagery.
Regarding the mangrove habitat, thanks to the Band 11 of the Sentinel-2 imagery, the mangrove cover for the whole Palau Archipelago was determined with a resolution of 10 m and with a great accuracy. The optimum classification is mathematically confirmed by the Jeffries-Matusita distances among classes: the output is shown in Table 3. Good coefficients range between 1.999 and 2.000 [34].
As well as mangroves, also for coastal benthic habitats, Jeffries-Matusita (JM) spectral separability coefficients (Table S1, Supplementary Materials) confirm values between 1.9–2.0 among the different classes, with the only exception for the combination back–reef sand–algae and patch reef coral–sand with a JM value of 1.8, probably linked to the sedimentological features and texture of these classes due to the presence of biodetritic sand in the two classes. The image processing steps confirm the classes spectral reflectance, since bottom-types are statistically separable and identifiable on the base of their reflectance spectra [35]. The scatter plot shows a high spectral separability among coral reef classes (Figure 8).
Unsupervised isodata classification allowed the identification of 12 habitat classes/subclasses for the barrier reef (site no. 1) and 10 classes/subclasses for the coastal reef (site no. 2) (Figure 9 and Figure 10). To test the goodness of the habitat classification performed on Sentinel-2 images, data were compared with NOAA habitat maps from Ikonos satellite imagery and sea-truth validations carried out in the period 2002–2004 [33]. Comparison of habitat classifications on the barrier reef (Figure 9) shows how the classification with Sentinel-2 image was not able to identify the class bank/shelf escarpment, i.e., the deeper area of the outward barrier found on NOAA images. In Sentinel-2 classification, the whole area was identified as fore reef. The reef crest and the back reef showed differences between NOAA findings [33] and our results. The area of reef crest was thinner and better defined in NOAA maps, wider in our estimation. On the contrary, the back reef and the patch reef areas were more defined in Sentinel-2 imagery where both scattered corals and patch reef were identified as well as the nature of the bottom (sandy or hard bottom).
The extension in hectares (ha) of the three main barrier reef areas (Table 4) showed an overestimation of Sentinel-2 classification of 12.3% for bank/shelf–fore reef and 20.0% for reef crest and back reef areas, differently an underestimation of lagoon area of 20.3%.
The comparison for the coastal reef area of Palau (Figure 10) showed the suitability of Sentinel-2 images for the recognition of the main habitat classes on the reef platform found by NOAA in 2004. Both the reef crest (or fringing reef) and reef flat were recognized in Sentinel-2 images and classification.
The extension in hectares (ha) of the three main coastal reef areas (Table 4) showed an underestimation of Sentinel-2 classification of 33.9% for the reef crest and an overestimation of reef flat of 34.1%. Differently, the seagrasses were clearly identified by the classification and the two sub-classes showed differences in density or species. In this case clear differences in the spatial extent of the seagrass beds were found in comparison with NOAA data back to nearly 15 years.

4. Discussion

4.1. Shoreline, Mangroves, Coral Reefs, and Seagrasses

The difference in shoreline length (Table 2 in results paragraph) is due to the diverse techniques applied for shoreline extraction: manual digitalization (NOAA) and the use of classification algorithms by satellite imagery (ENEA). Furthermore, the wide range of shoreline values could be produced from the different nominal scale of source maps applied in order to extract the coastline [36].
Regarding the mangrove habitat, notwithstanding the different methodologies or imagery applied in NOAA and ENEA studies, the mangrove cover comparison with previous data is interesting. The difference in the extension of the mangroves from 2003–2006 imagery to 2017 is evidenced, but the disparity of NOAA and ENEA habitat mapping methods imposes caution when interpreting this result. The difference equal to 1100 ha between NOAA and ENEA (Table 2 in results paragraph), meaning an increase of the mangrove cover equal to 25.0% in the last decade (2006–2017), is not convincing. The difference between NOAA and ENEA mangrove habitat mapping is likely due to gaps in previous maps. Diachronic maps allow the measurements of temporal changes through concordance and discordance maps. Figure 11 shows a focus of this evidence in the eastern side of the main island of Palau, where it is possible to observe a great concordance between ENEA and NOAA mangrove cover (light green, Figure 11) but also significative discordances like a wide mangrove cover identified only by the present work (dark green, Figure 11) and a very limited mangrove cover identified only by NOAA.
On the basis of these results, it is important to note that RS comparisons with different satellite imageries and methods could have some embedded drawbacks. Moreover, the present work’s mangrove cover, equal to 5500 ha (Table 2), is in good agreement with 2011 estimations [37]. These latter were achieved with Landsat Enhanced Thematic Mapper (ETM+) data, with images collected during epoch centered on the year 2000, along with very high resolution images such as Ikonos and Quickbird. The overall estimation of 5666 ha for Palau Archipelago [37] is nearly coincident with our results (5500 ha) suggesting an overall equilibrium in Palau Archipelago in the last decades (only 3% difference in hectares in around 17 years). For these reasons an overall equilibrium in the mangrove forests is considered reliable.
With regard to coral reefs and seagrasses, the classification analysis demonstrates that the coral bottom-types are statistically separable and identifiable based on their reflectance spectra. We reason that features in reflectance arise primarily as a result of spectral absorption processes. Radiative transfer modeling shows that in typically clear coral reef waters, dark substrates such as corals have a depth-of-detection limit on the order of 10–20 m [35].
To measure the accuracy of the method proposed on barrier reef and coastal reef zones, we compared results of habitat mapping cover data of main classes from Sentinel-2 image versus data from NOAA maps assumed as reference data. The accuracy varied from 44.3 to 54.6% for the barrier reef estimations and from 39.8 to 56.8% for the coastal reef estimations (Table 4). These results are in the range of overall accuracy estimated for large area studies such as those performed for the Great Barrier Reef (GBR), where overall accuracy estimations of user/producer on Landsat 8 OLI classification for geomorphic zonation and benthic cover types were respectively 59.5 and 32.8% [24]. On the Southern Section Cairn GBR management region, the Sentinel-2 benthic mapping analysis performed on eight reefs with sea truth data validations produced an overall accuracy of 49% using six categories [32].
Reef flat subclasses showed differences between our and NOAA results (Figure 10): two areas were identified by unsupervised classification, but it was impossible to attribute them to turf or algae with different cover. The seagrasses were clearly identified and the cover showed a variation and two further sub-classes probably related to different density or different species were found.

4.2. Limits and Challenges of the Present Approach vs. Similar Studies

In the present work, Palau Island habitat classes/subclasses were chosen with the objective to achieve a RS habitat map centred on the most ecologically important habitats sensitive to climate changes in the Pacific region, like coral reefs, seagrasses, and mangroves. Habitat classes were combined in a unique geomorphological and ecological classification, a method considered as the most appropriate for RS of tropical coastal areas [29]. The unsupervised classification used for benthic habitat classification exploits the advantages of statistical segmentation to find natural boundaries in a dataset and provides consistent classification at multiple sites with little to no ground truth required [30]. However, without a ground validation, it was not possible to map turf, coralline algae, macroalgae, and seagrasses at species level. Differently, the mangrove cover along the island coastline has been identified with high detail, in relation to the high radiometry of the Sentinel-2 spectral signals (14 bit). The method showed its potentiality for medium (seasonal) and long-time (decadal) assessment of changes in sensible communities like seagrasses, also in conjunction with past Landsat 8 imagery collections, but it is limited to main habitat reconnaissance of large-scale habitat mapping [31].
Sensitivity of coral reefs, seagrasses, and mangroves to any effect of climate change varies for the three habitats. It is difficult to separate any effects of climate change from those produced by coastal development and land use practices. In the past six decades, the Palau Archipelago experienced in 1998 and 2010 two episodes of extreme heat associated with El Niňo, considered conducive for coral bleaching [38]. Bleaching was most severe in the north-western lagoon, whereas in the bays where temperatures were higher than elsewhere, bleaching and mortality were low. Although the intensity and duration of elevated temperatures are strong predictors of a coral’s fate, affecting survival and reproduction [4], the extent of bleaching is different not only by site but it can affect also deep reef. For this reason, the survey of shallow water coral habitats with RS assumes a greater importance as they are source for new propagules also for deeper outer slope coral communities [39]. Seagrasses are likely to be highly sensitive to increases in sea surface temperature, whether they occur as short-term spikes over periods of hours or as chronic exposures for weeks or months. Temperature extremes are known to reduce seagrass growth and lead to plant mortality with reduced carbon sequestration and habitat alteration [4,40]. Increases in seawater temperature also translate into increased disturbance via stronger extreme weather events such as heavy rainfall and tropical cyclones and storms, which put additional stress on seagrass habitats. Direct climate change impacts on mangrove ecosystems are likely to be less significant than the effects of associated sea level rise [2,41]. Sensitivity of mangroves to increased sea surface temperature is likely to be moderate. Rise in temperature and the direct effects of increased CO2 levels are likely to increase mangrove productivity, change the timing of flowering and fruiting, and expand the ranges of mangrove species into higher latitudes.

5. Conclusions

The proposed approach showed how nowadays the availability of different resources such as free Sentinel-2 imagery and ancillary information allows a reliable classification of marine habitats and the quantification of high value tropical habitats colonized by coral, seagrasses, and mangroves. The accuracy of the method and a revisiting period of the Sentinel-2 satellites of 5–15 days offer the possibility to follow communities covers from season to season and to assess environmental changes over time. Although the value of ground validation is evident to disentangle some uncertainty of interpretation, we demonstrate that the proposed approach is appropriate for extensive large-scale habitat classifications in remote sites like Palau Republic and all Pacific islands. Furthermore, the present methodology can be a good base for future monitoring programmes to be conducted also by resident personnel trained in studies for Marine Spatial Planning and Marine Protected Areas.
Finally, the present work demonstrates the chance offered by free availability of imagery and information to optimize time and resources through worldwide collaboration of research teams to mitigate the effects of climate change in remote Pacific islands.

Supplementary Materials

The following are available online at https://www.mdpi.com/2077-1312/7/9/316/s1, Table S1: Jeffries-Matusita spectral separability coefficients: values are between 1.9–2.0 among the different classes, except the combination “back–reef sand–algae and patch reef coral–sand” with a JM value of 1.8.

Author Contributions

Conceptualization, F.I. and E.C.; Methodology, F.I., A.P., M.B., I.D., E.C., and S.C.; Formal analysis, F.I., E.C., A.P., M.B., I.D., and S.C.; Writing—original draft preparation, A.P., I.D., S.C., and M.B.; Writing—review and editing, A.P., I.D., S.C., and F.I.

Funding

This research received no external funding.

Acknowledgments

We thank N.M. Caminiti for supporting our work, and D. Dominici S. Petric, E. Wang and three anonymous referees whose suggestions greatly improved the manuscript.

Conflicts of Interest

The authors declare no conflict of interest.

References

  1. Hoegh-Guldberg, O.; Mumby, P.J.; Hooten, A.J.; Steneck, R.S.; Greenfield, P.; Gomez, E.; Harvell, C.D.; Sale, P.F.; Edwards, A.J.; Caldeira, K.; et al. Coral Reefs Under Rapid Climate Change and Ocean Acidification. Science 2007, 318, 1737–1742. [Google Scholar] [CrossRef] [Green Version]
  2. Waycott, M.; McKenzie, L.M.; Mellors, J.E.; Ellison, J.C.; Sheaves, M.T.; Collier, C.; Schwarz, A.; Webb, A.; Johnson, J.E.; Payri, C.E. Vulnerability of mangroves, seagrasses and intertidal flats in the tropical Pacific to climate change. In Vulnerability of Tropical Pacific Fisheries and Aquaculture to Climate Change; Bell, J.D., Johnson, J.E., Hobday, A.J., Eds.; Secretariat of the Pacific Community: Noumea, New Caledonia, 2011. [Google Scholar]
  3. Hoegh-Guldberg, O.; Poloczanska, E.S.; Skirving, W.; Dove, S. Coral Reef Ecosystems under Climate Change and Ocean Acidification. Front. Mar. Sci. 2017, 4, 00158. [Google Scholar] [CrossRef]
  4. Smale, D.A.; Wernberg, T.; Oliver, E.C.J.; Thomsen, M.; Harvey, B.P.; Straub, S.C.; Burrows, M.T.; Alexander, L.V.; Benthuysen., J.A.; Donat, M.C.; et al. Marine heatwaves threaten global biodiversity and the provision of ecosystem services. Nat. Clim. Chang. 2019, 306, 306–312. [Google Scholar] [CrossRef]
  5. Hughes, T.P.; Baird, A.H.; Bellwood, D.R.; Card, M.; Connolly, S.R.; Folke, C.; Grosberg, R.; Hoegh-Guldberg, O.; Jackson, J.B.; Kleypas, J. Climate Change, Human Impacts, and the Resilience of Coral Reefs. Science 2003, 301, 929–933. [Google Scholar] [CrossRef] [Green Version]
  6. Grottoli, A.G.; Rodrigues, L.J.; Palardy, J.E. Heterotrophic plasticity and resilience in bleached corals. Nature 2006, 440, 1186–1189. [Google Scholar] [CrossRef]
  7. Wilkinson, C.R.; Buddemeier, R.W. Global Climate Change and Coral Reefs: Implications for People and Reefs; Technical Report for the UNEP-IOC-ASPEI-IUCN Global Task Team on the Implications of Climate Change on Coral Reefs; IUCN: Gland, Switzerland, 1994. [Google Scholar]
  8. Mumby, P.J.; Harborne, A.R. Development of a systematic classification scheme of marine habitats to facilitate regional management and mapping of Caribbean coral reefs. Biol. Conserv. 1999, 88, 155–163. [Google Scholar] [CrossRef]
  9. Jupiter, S.; Roelfsema, C.M.; Phinn, S.R. Science and management. In Coral Reef Remote Sensing; Goodman, J.A., Phinn, S.R., Purkis, S., Eds.; Springer: Berlin, Germany, 2013; pp. 403–427. [Google Scholar]
  10. Hedley, J.D.; Roelfsema, C.M.; Chollett, I.; Harborne, A.R.; Heron, S.F.; Weeks, S.; Skirving, W.J.; Strong, A.E.; Eakin, C.M.; Christensen, T.R.L.; et al. Remote Sensing of Coral Reefs for Monitoring and Management: A Review. Remote Sens. 2016, 8, 118. [Google Scholar] [CrossRef]
  11. Green, E.P.; Mumby, P.J.; Edwards, A.J.; Clark, C.D. A review of remote sensing for the assessment and management of tropical coastal resources. Coast. Manag. 1996, 24, 1–40. [Google Scholar] [CrossRef]
  12. Phinn, S.R.; Roelfsema, C.M.; Stumpf, R. Remote sensing: Discerning the promise from the reality. In Integrating and Applying Science: A Handbook for Effective Coastal Ecosystem Assessment; Longstaff, B.J., Carruthers, T.J.B., Dennison, W.C., Lookingbill, T.R., Hawkey, J.M., Thomas, J.E., Wicks, E.C., Woerner, J., Eds.; IAN Press: Cambridge, MD, USA, 2010. [Google Scholar]
  13. Phinn, S.R.; Hochberg, E.; Roelfsema, C.M. Airborne photography, multispectral and hyperspectral remote sensing on coral reefs. In Coral Reef Remote Sensing; Goodman, J.A., Phinn, S.R., Purkis, S., Eds.; Springer: Berlin, Germany, 2013; pp. 3–25. [Google Scholar]
  14. Andréfouët, S.; Claereboudt, M.; Matsakis, P.; Pagès, J.; Dufour, P. Typology of atoll rims in Tuamotu Archipelago (French Polynesia) at landscape scale using SPOT HRV images. Int. J. Remote Sens. 2001, 22, 987–1004. [Google Scholar] [CrossRef]
  15. Andréfouët, S.; Kramer, P.; Torres-Pulliza, D.; Joyce, K.E.; Hochberg, E.J.; Garza-Pérez, R.; Mumby, P.J.; Riegl, B.; Yamano, Y.; White, W.H.; et al. Multi-site evaluation of IKONOS data for classification of tropical coral reef environments. Remote Sens. Environ. 2003, 88, 128–143. [Google Scholar]
  16. Naseer, A.; Hatcher, B.G. Inventory of the Maldives coral reefs using morphometrics generated from LANDSAT ETM+ imagery. Coral Reefs 2004, 23, 161–168. [Google Scholar] [CrossRef]
  17. Yamano, H.; Shimazaki, H.; Matsunaga, T.; Ishoda, A.; McClennen, C.; Yokoki, H.; Fujita, K.; Osawa, Y.; Kayanne, H. Evaluation of various satellite sensors for waterline extraction in a coral reef environment: Majuro Atoll, Marshall Islands. Geomorphology 2006, 82, 398–411. [Google Scholar] [CrossRef]
  18. Naseer, A.; Hatcher, B.G. Assessing the integrated growth response of coral reefs to monsoon forcing using morphometric analysis of reefs in Maldives. In Proceedings of the 9th International Coral Reef Symposium, Bali, Indonesia, 23–27 October 2000; Volume 1, pp. 75–80. [Google Scholar]
  19. Storlazzi, C.D.; Logan, J.B.; Field, M.E. Quantitative morphology of a fringing reef tract from high resolution laser bathymetry: Southern Molokai, Hawaii. Geol. Soc. Am.Bull. 2003, 115, 1344–1355. [Google Scholar] [CrossRef]
  20. Giardino, C.; Bresciani, M.; Fava, F.; Matta, E.; Brando, V.E.; Colombo, R. Mapping Submerged Habitats and Mangroves of Lampi Island Marine National Park (Myanmar) from in Situ and Satellite Observations. Remote Sens. 2016, 8, 2. [Google Scholar] [CrossRef]
  21. Andréfouët, S.; Muller-Karger, F.E.; Robinson, J.A.; Kranenburg, C.J.; Torres-Pulliza, D.; Spraggins, S.A.; Murch, B. Global assessment of modern coral reef extent and diversity for regional science and management applications: A view from space. In Proceedings of the 10th International Coral Reef Symposium, Okinawa, Japan, 28 June–2 July 2004; Volume 2, pp. 1732–1745. [Google Scholar]
  22. Hedley, J.D.; Roelfsema, C.M.; Phinn, S.R.; Mumby, P.J. Environmental and sensor limitations in optical remote sensing of coral reefs: Implications for monitoring and sensor design. Remote Sens. 2012, 4, 271–302. [Google Scholar] [CrossRef]
  23. Hedley, J.; Roelfsema, C.; Koetz, B.; Phinn, S. Capability of the SENTINEL-2 mission for tropical coral reef mapping and coral bleaching detection. Remote Sens. Environ. 2012, 120, 145–155. [Google Scholar] [CrossRef]
  24. Hedley, J.D.; Roelfsema, C.; Brando, V.; Giardino, C.; Kutser, T.; Phinn, S.; Mumby, P.J.; Barrilero, O.; Laporte, J.; Koetz, B. Coral reef applications of Sentinel-2: Coverage, characteristics, bathymetry and benthic mapping with comparison to Landsat 8. Remote Sens. Environ. 2018, 216, 598–614. [Google Scholar] [CrossRef]
  25. Golbuu, Y.; Bauman, A.J.; Kuartei, J.; Victor, S. The State of Coral Reef Ecosystems of Palau. In The State of Coral Reef Ecosystems of the United States and Pacific Freely Associated States; Waddell, J., Ed.; NOAA Technical Memorandum NOS NCCOS 11; NOAA/NCCOS Center for Coastal Monitoring and Assessment Biogeography Team: Silver Spring, MD, USA, 2005; pp. 488–507. [Google Scholar]
  26. Kerra, M.J.; Purkisb, S. An algorithm for optically-deriving water depth from multispectral imagery in coral reef landscapes in the absence of ground-truth data. Remote Sens. Environ. 2018, 210, 307–324. [Google Scholar] [CrossRef]
  27. Hedley, J.D.; Harborne, A.R.; Mumby, P.J. Technical note: Simple and robust removal of sun glint for mapping shallow-water benthos. Int. J. Remote Sens. 2005, 26, 2107–2112. [Google Scholar] [CrossRef]
  28. Richards, J.A. Remote Sensing Digital Image Analysis. An Introduction; Springer: Berlin, Germany, 2006; pp. 1–454. [Google Scholar]
  29. Mumby, P. Methodologies for Defining Habitats. In Tropical Coastal Management. Habitat Classification and Mapping; Edwards, A.J., Ed.; UNESCO: Paris, France, 2000; pp. 131–139. [Google Scholar]
  30. Foster, G.; Gleason, A.; Costa, B.; Battista, T.; Taylor, C. Acoustic application. In Coral Reef Remote Sensing, A Guide for Mapping, Monitoring and Management; Goodman, J.A., Purkis, S.J., Phinn, S.R., Eds.; Springer: New York, NY, USA, 2013; pp. 221–225. [Google Scholar]
  31. Bouvet, G.; Ferraris, J.; Andrefouet, S. Evaluation of large-scale unsupervised classification of New Caledonia reef ecosystem using Landsat ETM+ imagery. Oceanol. Acta 2003, 26, 281–290. [Google Scholar] [CrossRef]
  32. NOAA Biogeography Branch. Shallow-Water Benthic Habitats of American Samoa, Guam, and the Commonwealth of the Northern Mariana Islands: Manual; NOAA National Ocean Service, National Centers for Coastal Ocean Science: Silver Spring, MD, USA, 2005; p. 33. [Google Scholar]
  33. Analytical Laboratories of Hawaii. Mapping of Benthic Habitat of Palau; Technical Report for NOAA; NOAA: Silver Spring, MD, USA, 2007; pp. 1–37. [Google Scholar]
  34. Padma, S.; Sanjeevi, S. Jeffries Matusita based mixed-measure for improved spectral matching in hyperspectral image analysis. Int. J. Appl. Earth Obs. Geoinf. 2014, 32, 138–151. [Google Scholar] [CrossRef]
  35. Hochberg, E.J.; Atkinson, M.J.; Andrefouet, S. Spectral reflectance of coral reef bottom-types worldwide and implications for coral reef remote sensing. Remote Sens. Environ. 2003, 85, 159–173. [Google Scholar] [CrossRef]
  36. Weisstein, E.W. Coastline Paradox. From MathWorld-A Wolfram Web Resource. Available online: http://mathworld.wolfram.com/CoastlineParadox.html (accessed on 22 August 2019).
  37. Bhattarai, B.; Giri, C. Assessment of mangrove forests in the Pacific region using Landsat imagery. J. Appl. Remote Sens. 2011, 5, 1–11. [Google Scholar] [CrossRef]
  38. Barkley, H.C.; Cohen, A.L.; Mollica, N.R.; Brainard, R.E.; Rivera, H.E.; DeCarlo, T.M.; Lohmann, J.P.; Drenkard, E.J.; Alpert, A.E.; Young, C.W.; et al. Repeat bleaching of a central Pacific coral reef over the past six decades (1960–2016). Commun. Biol. 2018, 1, 1–10. [Google Scholar] [CrossRef]
  39. Colin, P.L. Ocean warming and the reefs of Palau. Oceanography 2018, 31, 126–135. [Google Scholar] [CrossRef]
  40. Collier, C.J.; Waycott, M. Temperature extremes reduce seagrass growth and induce mortality. Mar. Pollut. Bull. 2014, 83, 483–490. [Google Scholar] [CrossRef]
  41. Ellison, J.C. Possible impacts of predicted sea-level rise on South Pacific mangroves. In Sea-Level Changes and Their Effects; Noye, J., Grzechnik, M., Eds.; World Scientific: Singapore, 2001; pp. 49–72. [Google Scholar]
Figure 1. The main island of the Palau Republic (Micronesia—West Pacific). Numbers indicate the barrier reef zone (site no. 1) and coastal reef zone (site no. 2) where the shallow-water benthic habitat mapping was performed (basemap and inset Google © 2019).
Jmse 07 00316 g001
Figure 2. Atmospheric correction steps: ERDAS ATCOR radiative transfer model used for Sentinel-2 L1C product. * Tropical corresponds to a water vapor column of 4.11 cm at sea level, while ** Maritime represents the aerosol conditions in areas close to the sea.
Jmse 07 00316 g002
Figure 3. Workflow diagram illustrating the steps followed for the habitat mapping of Palau.
Jmse 07 00316 g003
Figure 4. Sentinel-2 satellite image on the Republic of Palau on 4 July 2017, with a 10 m spatial resolution. Enhanced Band 11 was used, showing the land (white), the mangrove cover (grey), the sea (black).
Jmse 07 00316 g004
Figure 5. Spectral signatures of mangroves and terrestrial vegetation in Sentinel-2 spectral bands.
Jmse 07 00316 g005
Figure 6. Sentinel-2 satellite image (Band 11) on the Republic of Palau on 4 July 2017, with a 10 m spatial resolution: the ROIs in the process of a ‘supervised classification’ (on the left); the classification result (on the right) where land is orange, the mangrove cover is green, the sea is blue. Clouds are isolated and labelled as unclassified.
Jmse 07 00316 g006
Figure 7. Spectral signatures of reef coverage (the barrier reef zone, site no. 1) in ERDAS software.
Jmse 07 00316 g007
Figure 8. Scatter plot of the coral reef class coverage, showing a high classes separability.
Jmse 07 00316 g008
Figure 9. Comparison between habitat classifications in the barrier reef zone (site no. 1, see Figure 1). On the left, NOAA’s map and 2004 Ikonos imagery (informative layers downloaded from https://products.coastalscience.noaa.gov/collections/benthic/e102palau/); on the right, present work (ENEA) habitat map and 2017 Sentinel-2 imagery.
Jmse 07 00316 g009
Figure 10. Comparison between habitat classifications in the Coastal Reef zone (site no. 2, see Figure 1). On the left, NOAA’s map and 2004 Ikonos imagery (informative layers downloaded from https://products.coastalscience.noaa.gov/collections/benthic/e102palau/); on the right, present work (ENEA) habitat map and 2017 Sentinel-2 imagery.
Jmse 07 00316 g010
Figure 11. (a) A detail of the east sector of the Republic of Palau, with Sentinel-2 enhanced Band 11, where dark grey is the mangrove cover; (b) mangrove cover diachronic map showing a concordance wide area of mangroves identified by ENEA and NOAA (light green); two discordance areas with ENEA mangrove cover only (dark green) and NOAA mangrove cover only (yellow), respectively.
Jmse 07 00316 g011
Table 1. Geomorphological description and biological importance of the main classes/subclasses used for the Palau habitat mapping with Sentinel-2 imagery.
ZoneHabitat ClassesHabitat SubclassesGeomorphological DescriptionBiological Relevance
Barrier ReefBank/shelf and fore reefcoral, coralline algaeunderwater coral cliffdense coral, high biodiversity, coral reservoir
Reef crest coral, coralline algaewindward coral platform shelf edge, algae ridgedense coral, high biodiversity
Back reef scattered coral, flesh algaecoral platform, sand channelsmedium to scarse coral density
Patch reefcoral/coralline algaecoral knob, aggregate coralmedium coral density, coral reservoir
Lagoonsand coral knoll, massive coralsand, rubbles, coral medium to dense coral density, coral reservoir
Coastal ReefReef crestcoral, coralline algaeseaward coastal coral platform, shelf edge high coral density, high biodiversity, coral reservoir
Reef flatcoral, flesh algae, seagrasses coral platformhigh coral density, high biodiversity, coral reservoir
Uncolonizedoutward limit of mangrove areasand/mud nursery area for fish, shrimps, etc.
Emergent vegetationmangroveintertidal/sand/mudhigh primary productivity area
Table 2. Length of shoreline (km) and mangrove areas (ha) on Palau Archipelago computed in the present work (ENEA) and by NOAA (Analytical Laboratories of Hawaii, 2007). Differences are in percentages (%).
ZoneENEANOAAENEA vs. NOAA
2017(2003–2006)(%)
Shoreline (km)12131021+18.8
Mangroves area (ha)55004400+25.0
Table 3. ROI matrix separability, for the SENTINEL-2 imagery, using Jeffries-Matusita algorithm.
ZoneJeffries-Matusita Coefficients
Land–Sea2.000–2.000
Sea–Mangroves2.000–2.000
Land–Mangroves1.999–1.999
Table 4. Palau: Habitat classes cover (ha) in the two zones of the barrier reef (site no. 1) and coastal reef (site no. 2) computed for the 2017 in the present work (ENEA) and by NOAA (Analytical Laboratories of Hawaii, 2007) in 2004. Differences in accuracy are in percent (%).
ZoneHabitat ClassesENEA (ha)NOAA (ha)ENEA vs. NOAA Overall Accuracy (%)
Bank/shelf and fore reef12,00310,68852.9
Barrier reefReef crest and back reef40,56833,79454.6
Lagoon951211,94044.3
Coastal reefReef crest1555235139.8
Reef flat4231322256.8

