Validation of the Hazard and Vulnerability Analysis of Coastal Erosion in the Caribbean and Pacific Coast of Colombia


Abstract
:1. Introduction
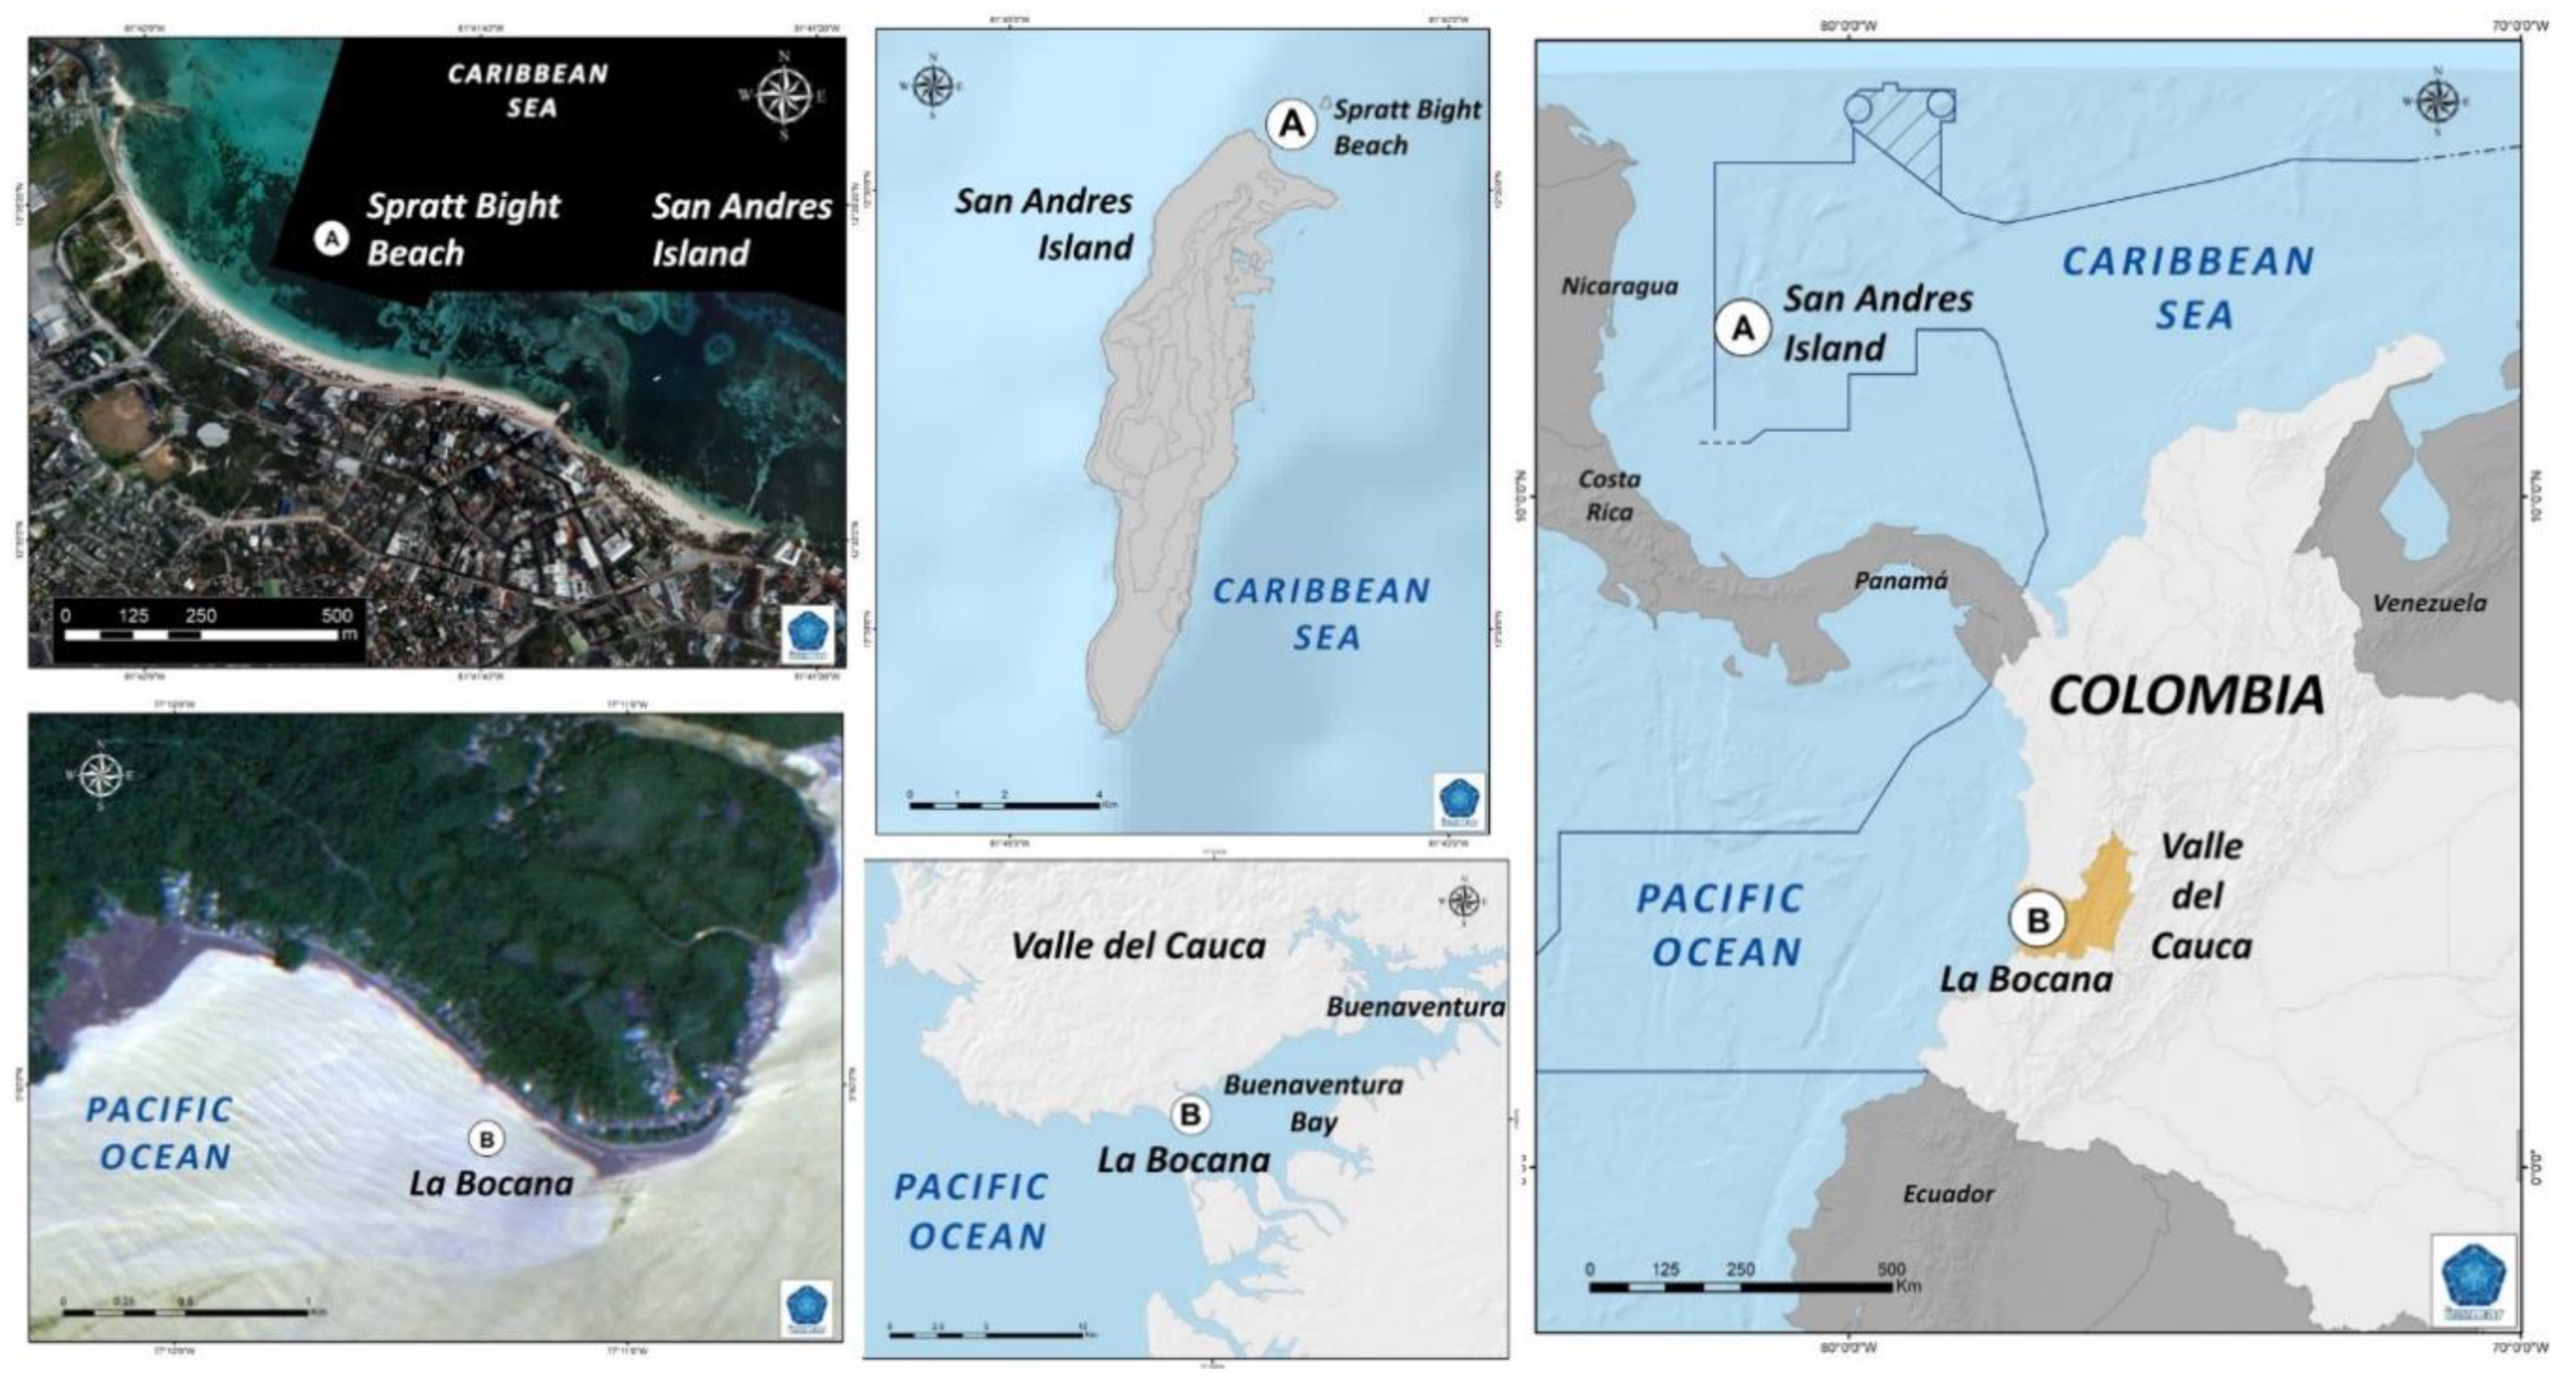
1.1. Study Area: Spratt Bight Beach, San Andrés Island, Caribbean Coast
1.2. Study Area: La Bocana, Buenaventura Bay, Pacific Coast
2. Materials and Methods
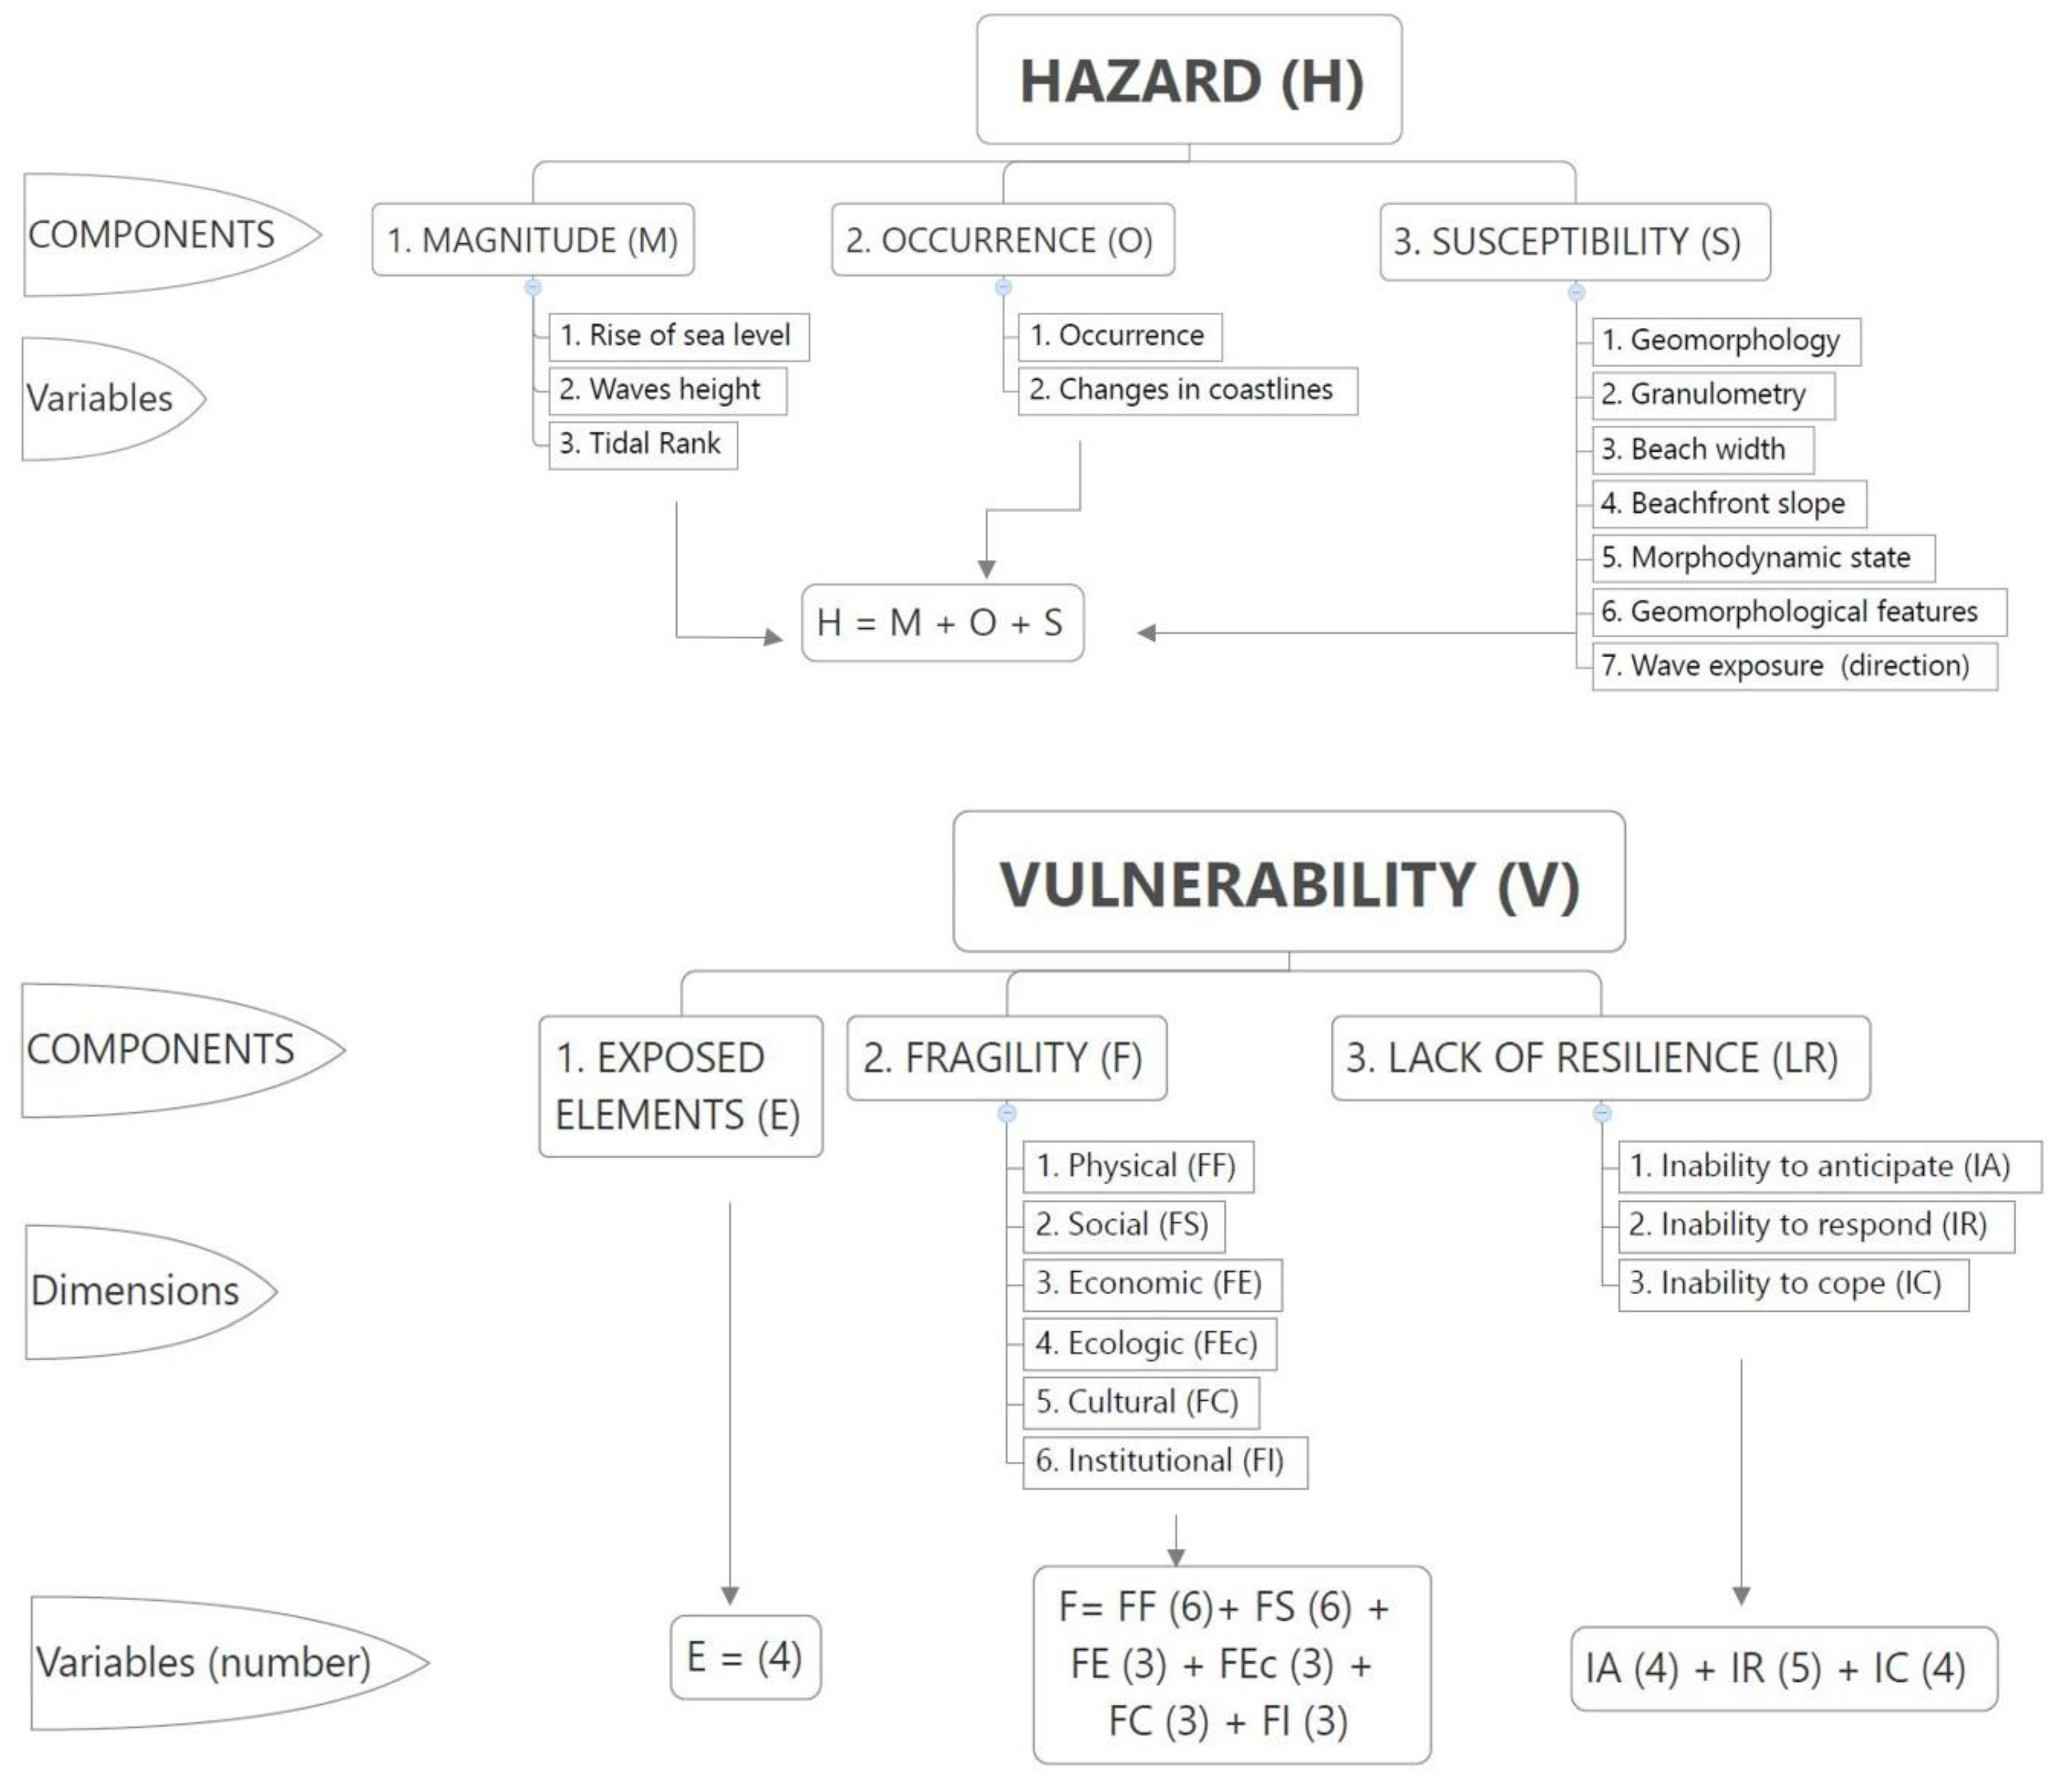
2.1. Hazard
2.2. Vulnerability
3. Results
3.1. Case Study: Spratt Bight Beach, San Andrés Island, Caribbean Coast
3.1.1. Hazard
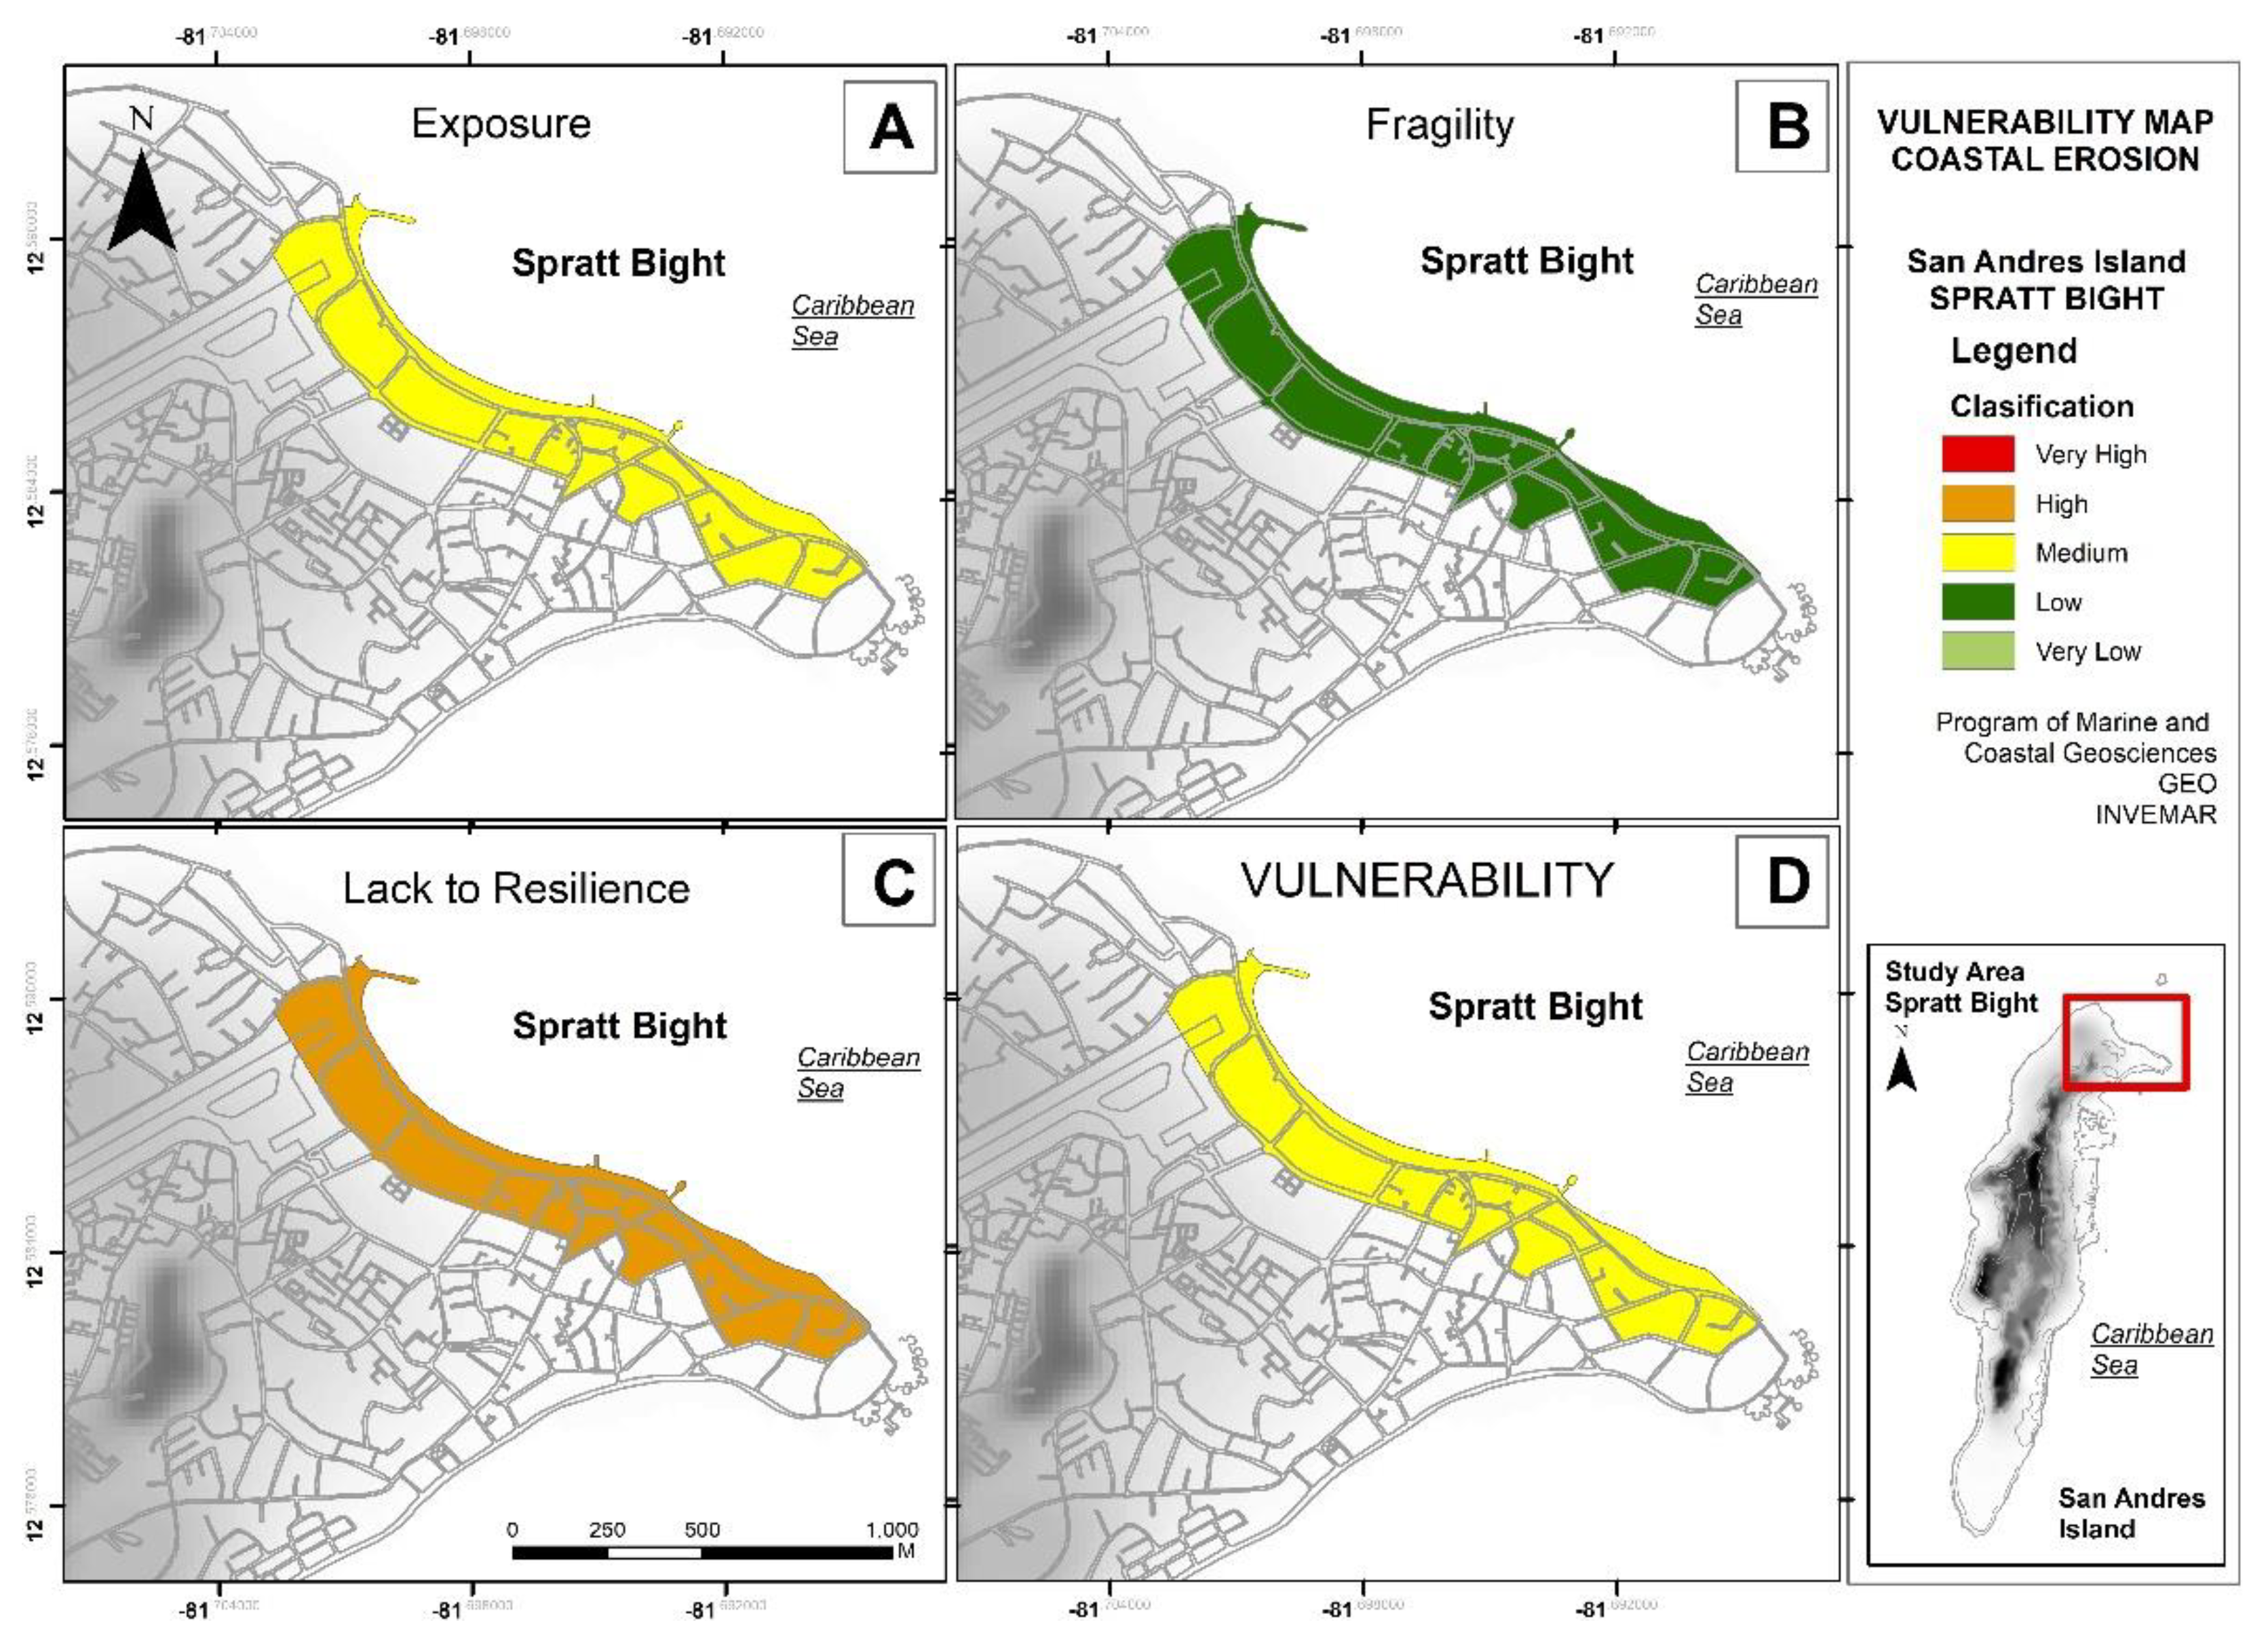
3.1.2. Vulnerability
3.2. Case Study: La Bocana, Bay of Buenaventura, Pacific Coast
3.2.1. Hazard
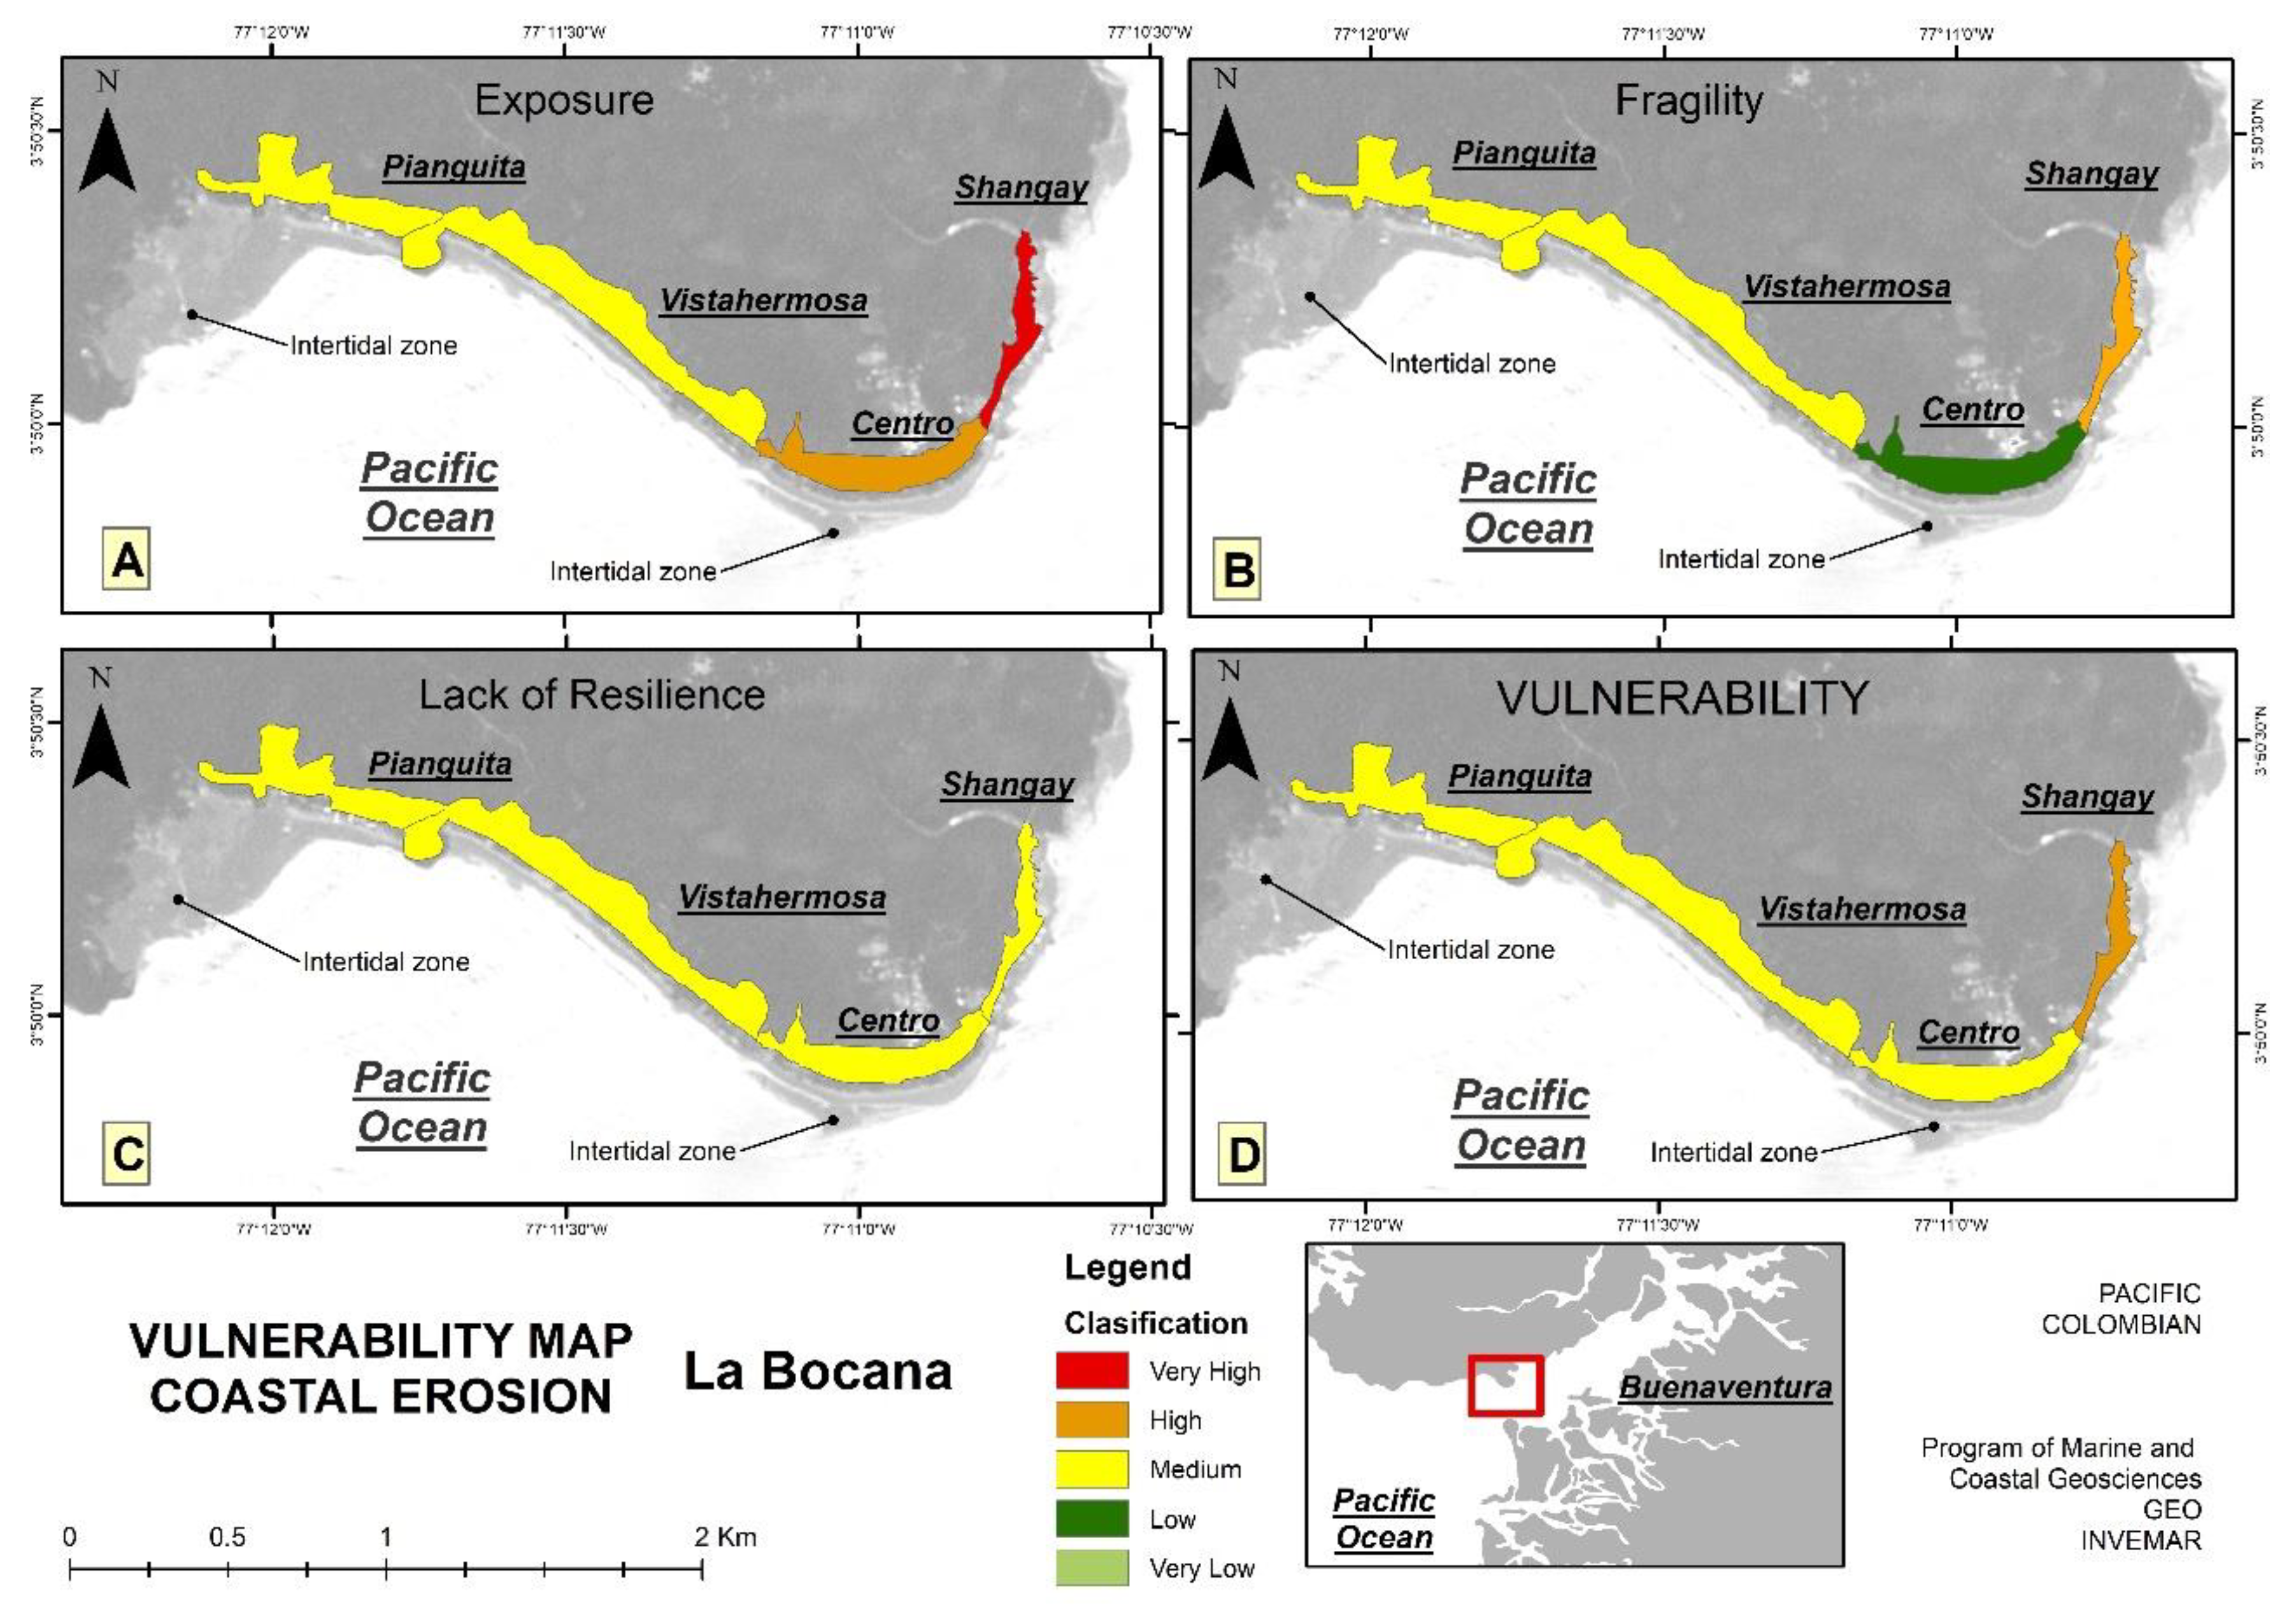
3.2.2. Vulnerability
3.3. Spratt Bight, San Andrés Island, Caribbean Coast vs. La Bocana, Buenaventura Bay, Pacific Coast
3.3.1. Hazard
3.3.2. Vulnerability
4. Discussion
5. Conclusions
Author Contributions
Funding
Acknowledgments
Conflicts of Interest
References
- Merlotto, A.; Bértola, G. Consecuencias socio-económicas asociadas a la erosión costera en el Balneario Parque Mar Chiquita, Argentina. Investig. Geogr. 2007, 43, 143–160. [Google Scholar] [CrossRef]
- INGEOMINAS. Estudio de las Amenazas Geológicas de la Isla de San Andrés; Convenio No 055-95; Ingeominas-Coralina: Bogotá, Colombia, 1996. [Google Scholar]
- Ossa, J.M. Evaluación de la Influencia Antrópica en Los Cambios en la Línea de Costa y la Erosión Litoral en la Isla de San Andrés Caribe Colombian; Universidad EAFIT: Medellín, Colombia, 2004. [Google Scholar]
- Posada, B.O.; Guzmán, W. Diagnóstico de la Erosión Costera en las Islas de San Andrés, Providencia y Santa Catalina. Recomendaciones Generales Para el Manejo y Control de la Erosión; Convenio 010/2006; Coralina—Invemar Informe Técnico Final: Santa Marta, Colombia, 2007. [Google Scholar]
- Cooper, J.A.G.; McKenna, J. Social justice in coastal erosion management: The temporal and spatial dimensions. Geoforum 2008, 39, 294–306. [Google Scholar] [CrossRef]
- Kapsimalis, V.; Poulos, S.E.; Karageorgis, A.P.; Pavlakis, P.; Collins, M. Recent evolution of a Mediterranean deltaic coastal zone: Human impacts on the Inner Thermaikos Gulf, NWAegean Sea. J. Geol. Soc. 2005, 162, 897–908. [Google Scholar] [CrossRef]
- Posada, B.O.; Henao, W. Diagnóstico de la Erosión en la Zona Costera del Caribe Colombiano; Serie Publicaciones Especiales No. 13; Invemar: Santa Marta, Colombia, 2008. [Google Scholar]
- Posada, B.O.; Morales-Giraldo, D.; Henao, W. Diagnóstico de la Erosión Costera del Territorio Insular Colombiano; Serie Publicaciones Especiales No. 24; Invemar: Santa Marta, Colombia, 2011. [Google Scholar]
- Posada, B.O.; Henao, W.; Guzmán-Ospitia, G. Diagnóstico de la Erosión y Sedimentación en la Zona Costera del Pacífico Colombiano; Serie Publicaciones Especiales No. 17; Invemar: Santa Marta, Colombia, 2009. [Google Scholar]
- Varnes, D.J. Slope movement types and processes. In Landslides: Analysis and Control Transportation and Road Research Board; Schuster, R.L., Krizek, R.J., Eds.; National Academy of Science: Washington, DC, USA, 1978; pp. 11–33. [Google Scholar]
- UNDRO. Natural Disaster and Vulnerability Analysis; Office of the United Nations Disaster Relief Coordinator Ginebra: Geneva, Switzerland, 1979. [Google Scholar]
- Gonzalez, A.J. Memorias de las VI Jornadas Geotécnicas Colombianas. In Metodología Para Evaluación de Riesgo por Deslizamientos a Nivel Intermedio; Sociedad Colombiana de Ingenieros: Bogotá, Colombia, 1990. [Google Scholar]
- Mora, S. Inestabilidad de Laderas en la Cuenca Alta del Rio Chicamocha; UNDRO-Oficina Nacional para la Prevención y Atención de Desastres (ONAD) de Colombia: Bogotá, Colombia, 1990. [Google Scholar]
- Kollura, R.V. Health risk assessment. Principles and practices. In Risk Assessment and Management Handbook; Kolluro, R.V., Bartell, S.M., Pitblado, R.M., Scott-Stricoff, R., Eds.; McGraw-Hill: New York, NY, USA, 1996; p. 688. [Google Scholar]
- Blaikie, P.; Cannon, T.; David, I.; Wisner, B. Vulnerabilidad el Entorno Social, Político y Económico de Los Desastres; LA RED de Estudios Sociales: Limon, Costa Rica, 1996. [Google Scholar]
- Contreras, D.; Kienberger, S. “D.4.2 Handbook of Vulnerability Assessment in Europe” MOVE, Methods for the Improvement of Vulnerability Assessment in Europe; European Commission Dg Enviroment: Salzburg, Autria, 2011. [Google Scholar]
- Merlotto, A.; Piccolo, M.C. Vulnerabilidad social en Necochea-Quequén, provincia de Buenos Aires, Argentina. In Proceedings of the 12 Encuentro de Geógrafos de América Latina, Observatorio Geográfico de América Latina, Montevideo, Uruguay, 3–7 April 2009. [Google Scholar]
- Boruff, B.J.; Emrich, C.; Cutter, S.L. Erosion hazard vulnerability of US coastal counties. J. Coast. Res. 2005, 215, 932–942. [Google Scholar] [CrossRef]
- Gornitz, V.M. Vulnerability of the East coast, USA to future sea level rise. J. Coast. Res. 1990, 9, 201–237. [Google Scholar]
- McLaughlin, S.; McKenna, J.; Cooper, J.A.G. Socioeconomic data in coastal vulnerability indices: Constraints and opportunities. J. Coast. Res. 2002, 36, 487–497. [Google Scholar] [CrossRef]
- Carpenter, N.E.; Dickson, M.E.; Walkden, M.J.A.; Nicholls, R.J.; Powrie, W. Effects of varied lithology on soft-cliff recession rates. Mar. Geol. 2014, 354, 40e52. [Google Scholar] [CrossRef]
- Luo, S.L.; Wang, H.J.; Cai, F. An integrated risk assessment of coastal erosion based on fuzzy set theory along Fujian coast, southeast China. Ocean Coast. Manag. 2013, 84, 68–76. [Google Scholar] [CrossRef]
- Young, E.; Muir, D.; Dawson, A.; Dawson, S. Community driven coastal management: An example of the implementation of a coastal defence bund on South Uist, Scottish Outer Hebrides. Ocean Coast. Manag. 2014, 94, 30e37. [Google Scholar] [CrossRef]
- Li, X.; Zhou, Y.; Tian, B.; Kuang, R.; Wang, L. GIS-based methodology for erosion risk assessment of the muddy coast in the Yangtze Delta. Ocean Coast. Manag. 2015, 108, 97–108. [Google Scholar] [CrossRef]
- Alexandrakis, G.; Manasakis, C.; Kampanis, N.A. Valuating the effects of beach erosion to tourism revenue. A management perspective. Ocean Coast. Manag. 2015, 111, 1–11. [Google Scholar] [CrossRef]
- Alexandrakis, G.; Poulos, S.E. An holistic approach to beach erosion vulnerability assessment. Sci. Rep. 2014, 4, 6078. [Google Scholar] [CrossRef] [PubMed]
- Alexandrakis, G.; Ghionis, G.; Poulos, S.E.; Kampanis, N.A. Greece. In Coastal Erosion and Protection in Europe: A Comprehensive Overview; Pranzini, E., Ed.; Earthscan Ltd: London, UK, 2013; pp. 355–377. [Google Scholar]
- Bosom, E.; Jimenez, J.A. Probabilistic coastal vulnerability assessment to storms at regional scale e application to Catalan beaches (NW Mediterranean). Nat. Hazards Earth Syst. Sci. 2011, 11, 475–484. [Google Scholar] [CrossRef]
- Pranzini, E.; Williams, A. Coastal Erosion and Protection in Europe; Routledge: Abingdon, UK, 2013; p. 457. [Google Scholar]
- Gopalakrishnan, S.; Smith, M.D.; Slott, J.M.; Murray, A.B. The value of disappearing beaches: A hedonic pricing model with endogenous beach width. J. Environ. Econ. Manag. 2011, 61, 297–310. [Google Scholar] [CrossRef] [Green Version]
- Houston, J.R. The Economic Value of Beaches: A 2013 Update. Shore Beach 2013, 81, 3–11. [Google Scholar]
- Ozyurt, G.; Ergin, A. Improving Coastal Vulnerability Assessments to Sea-Level Rise: A New Indicator-Based Methodology for Decision Makers. J. Coast. Res. 2010, 262, 265–273. [Google Scholar] [CrossRef]
- Kumar, T.S.; Mahendra, R.S.; Nayak, S.; Radhakrishnan, K.; Sahu, K.C. Coastal Vulnerability Assessment for Orissa State, East Coast of India. J. Coast. Res. 2010, 26, 523–534. [Google Scholar] [CrossRef]
- Sousa, P.H.G.O.; Siegle, E.; Tessler, M.G. Vulnerability assessment of Massaguaηu Beach (SE Brazil). Ocean Coast. Manag. 2013, 77, 24–30. [Google Scholar] [CrossRef]
- Alexandrakis, G.; De Vita, S.; Di Vito, M. Preliminary risk assessment at Ustica based on indicators of natural and human processes. Ann. Geophys. 2019, 61, 63. [Google Scholar] [CrossRef]
- Monioudi, I.Ν.; Asariotis, R.; Becker, A.; Bhat, C.; Dowding-Gooden, D.; Esteban, M.; Feyen, L.; Mentaschi, L.; Nikolaou, A.; Nurse, L.; et al. Climate Change Impacts on Critical International Transportation Assets of Caribbean Small Island Developing States (SIDS): The Case of Jamaica and Saint Lucia. Reg. Environ. Chang. 2018, 18, 2211–2225. [Google Scholar] [CrossRef]
- Gaillard, J.C. Resilience of traditional societies in facing natural hazards. Disaster Prev. Manag. 2007, 16, 522–544. [Google Scholar] [CrossRef] [Green Version]
- INVEMAR-GEO. Erosión Costera en la Isla de San Andrés; Actividad GEO-BPIN Invemar: Santa Marta, Colombia, 2014. [Google Scholar]
- DANE-Departamento Nacional de Estadísticas. Available online: http://www.dane.gov.co/index.php/poblacion-y-demografia/proyecciones-de-poblacion (accessed on 1 November 2013).
- INVERMAR-CORALINA. Evaluación de la Vulnerabilidad Por Ascenso en el Nivel del Mar (ANM) y Propuesta de Lineamientos de Adaptación en las Islas de San Andrés, Providencia y Santa Catalina; Convenio Interadministrativo de Asociación No. 003 de 2013, Final Report; Invemar-Coralina: Santa Marta, Colombia, 2014. [Google Scholar]
- Escobar, A.M. Terminal Turístico y Productivo Para el Desarrollo Sostenible en La Bocana; Pontificia Universidad Javeriana: Bogotá, Colombia, 2009. [Google Scholar]
- De Alcaldía, B. Plan. de Ordenamiento Territorial (POT); Municipio de Buenaventura Resumen ejecutivo: Buenaventura, Colombia, 2014. [Google Scholar]
- Alcántara-Carrió, J. Los Riesgos Naturales en el Litoral: La Amenaza Creciente; Servicio de publicaciones Universidad Católica de Valencia: España, Spain, 2008. [Google Scholar]
- Martínez, N.; Rodríguez, O.; Robertson, K. Amenazas naturales en el litoral Pacífico colombiano asociadas al ascenso del nivel del mar. Cuad. Geogr. 2005, 14, 83–96. [Google Scholar]
- Gornitz, V.M.; Daniels, R.C.; White, T.W.; Birdwell, K.R. The development of a coastal risk assessment database: Vulnerability to sea-level rise in the U.S. Southeast. J. Coast. Res. 1994, 12, 327–338. [Google Scholar]
- Merlotto, A.; Bertola, G.R. Mapa de riesgo por erosión costera de la provincia de Buenos Aires. In CONICET e Instituto de Geología de Costas y del Cuaternario; Universidad Nacional de Mar del Plata: Mar del Plata, Argentina, 2010. [Google Scholar]
- INVEMAR-GEO. Amenaza y Vulnerabilidad Por Erosión Costera en el Centro Poblado La Barra, Corregimiento de Ladrilleros—Buenaventura Valle del Cauca; Proyecto BPIN Invemar: Santa Marta, Colombia, 2013. [Google Scholar]
- Thomas, Y.F.; Nicole-Lerma, A.; Posada, B.O. Atlas Climatológico del Mar Caribe Colombiano; Gobernación del Magdalena Invemar: Santa Marta, Colombia, 2012. [Google Scholar]
- Thomas, Y.F.; Ricaurte-Villota, C.; Coca-Domínguez, O. Atlas Climatológico del Océano Pacífico Colombiano y Áreas Adyacentes; Invemar: Santa Marta, Colombia, 2014. [Google Scholar]
- Rangel-Buitrago, N.; Posada-Posada, B.O. Determinación de la vulnerabilidad y el riesgo costero mediante la aplicación de herramientas SIG y métodos multicriterio en la línea de costa, Caribe colombiano. Rev. Intróp. 2013, 8, 29–42. [Google Scholar]
- Wilches-Chaux, G. La Vulnerabilidad global. In Los Desastres no Son Naturales; Maskrey, A., Ed.; Primera edición LA RED de estudios sociales: Bogotá, Colombia, 1993; pp. 11–44. [Google Scholar]
- Ojeda, O.; Castro, E.; Valencia, A.; Fonseca, S. Evaluación de Riesgos Por Fenómenos de Remoción en Masa Guía Metodológica; INGEOMINAS—CVC Escuela Colombiana de Ingeniería: Bogotá, Colombia, 2001. [Google Scholar]
- Cardona, O.D. Indicators of Disaster Risk and Risk Management: Program for Latin America and the Caribbean; Inter-American Development Bank: Washington, DC, USA, 2007. [Google Scholar]
- Ricaurte-Villota, C.; Coca-Domínguez, O.; González, M.E.; Bejarano-Espinosa, M.; Morales, D.F.; Correa-Rojas, C.; Briceño-Zuluaga, F.; Legarda, G.A.; Arteaga, M.E. Amenaza y Vulnerabilidad Por Erosión Costera en Colombia: Enfoque Regional Para la Gestión del Riesgo; Serie de Publicaciones Especiales de INVEMAR: Santa Marta, Colombia, 2018. [Google Scholar]
- MADS-INVEMAR. Estudios Para la Prevención y Mitigación de la Erosión Costera; Convenio MADS-INVEMAR: Santa Marta, Colombia, 2012. [Google Scholar]
- Stronkhorst, J.; Levering, A.; Hendriksen, G.; Rangel-Buitrago, N.; Rosendahl Appelquist, L. Regional coastal erosion assessment based on global open access data: A case study for Colombia. J. Coast. Conserv. 2018, 22, 787–798. [Google Scholar] [CrossRef]
- Wang, G.; Liu, Y.; Wang, H.; Wang, X. A comprehensive risk analysis of coastal zones in China. Estuar. Coast. Shelf Sci. 2014, 140, 22–31. [Google Scholar] [CrossRef]
- Stive, M.J.F.; Aarninkhof, S.G.J.; Hamm, L.; Hanson, H.; Larson, M.; Wijnberg, K.M.; Nicholls, R.J.; Capobianco, M. Variability of shore and shoreline evolution. Coast. Eng. 2002, 47, 211–235. [Google Scholar] [CrossRef]
- Galgano, F.A. Shoreline behavior along the Atlantic coast of Delaware. Middle States Geogr. 2008, 41, 74–81. [Google Scholar]
- Bird, E.C.F. Coastal Geomorphology: An Introduction; Wilts John Wiley & Sons Ltd: Chippenha, UK, 2008. [Google Scholar]
- Davidson-Arnott, R.; Ollerhead, J. Coastal Erosion and Climate Change; Prince Edward Island Department of Environment: Charlottetown, PE, Canada, 2011. [Google Scholar]
- Narra, P.; Coelho, C.; Sancho, F.; Palalane, J. CERA: An open-source tool for coastal erosion risk assessment. Ocean Coast. Manag. 2017, 142, 1–14. [Google Scholar] [CrossRef]
- Martínez, M. Perspectiva geográfica de la vulnerabilidad ante amenazas de origen natural. Universidad Nacional de Colombia. In Memorias del XI Encuentro de Geógrafos de América Latina; EGAL, Geopolítica, Globalización y Cambio Ambiental, Retos en el Desarrollo Latinoamericano: Bogotá, Colombia, 2007; pp. 121–122. [Google Scholar]
- Martínez, M. Los geógrafos y la teoría de riesgos y desastres ambientales. Perspect. Geogr. 2009, 14, 241–263. [Google Scholar]
- Meza, C.A. Colección Antropología en la Modernidad. In Tradiciones Elaboradas y Modernizaciones Vividas Por Pueblos Afrochocoanos en la Vía al Mar; Instituto Colombiano de Antropología e Historia: Bogotá, Colombia, 2010. [Google Scholar]
- Solé, C. Modernidad y Modernización México; Universidad Autónoma Metropolitana: México City, NM, USA, 1998. [Google Scholar]
- Rempis, N.; Alexandrakis, G.; Tsilimigkas, G.; Kampanis, N. Coastal use synergies and conflicts evaluation in the framework of spatial, development and sectoral policies. Ocean Coast. Manag. 2018, 166, 40–51. [Google Scholar] [CrossRef]
- Luís, S.; Lima, M.L.; Roseta-Palma, C.; Rodrigues, N.; Sousa, L.P.; Freitas, F.; Alves, F.L.; Lillebø, A.I.; Parrod, C.; Jolivet, V.; et al. Psychosocial drivers for change: Understanding and promoting stakeholder engagement in local adaptation to climate change in three European Mediterranean case studies. J. Environ. Manag. 2018, 223, 165–174. [Google Scholar] [CrossRef] [PubMed]
- White, G.F. Human Adjustment to Floods Department of Geography Research Paper; University of Chicago: Chicago, IL, USA, 1945; p. 29. [Google Scholar]
- Castrillón, C.; Martínez, M.; Puentes, M.; Sánchez, R.; Tocancipá-Falla, J. Conocimiento Local y Riesgo Por Tsunami en Guapi, Cauca; Universidad del Cauca: Popayán, Colombia, 2016. [Google Scholar]


| Component | Variables | Hazard Ranking | |||||
|---|---|---|---|---|---|---|---|
| Very Low (1) | Low (2) | Medium (3) | High (4) | Very High (5) | Reference | ||
| Magnitude (M) | Tide amplitude (m) | 0–1 | 1.1–2 | 2.1–3 | 3.1–4 | >4.1 | [19,45,46] |
| Average height of breaking waves (m) | 0–0.4 | 0.41–0.8 | 0.81–1.2 | 1.21–1.6 | >1.6 | [19,45,46] | |
| Sea-level rise (mm/year) | Decline 1 | Relative stability (0) | Increase of up to 0.5 | Increase between 0.5 to 1 | Increase >1 | [19,45] | |
| Occurrence (O) | Coastline variation (m/year) | Accumulation (> 0.5) | Stability (0.5 to 0) | Rate of change (0 to –0.5) | Rate of change (−0.51 to −1) | Rate of change (>−1) | [19,45,46] |
| Occurrence | Future | - | Past | - | Present | This research | |
| Susceptibility (S) | Geomorphology | Low cliffs of rock with a minimal beach | High cliffs of rock without beach | Beaches with high cliffs River and marine terraces | Sandy beaches with low river and sea terraces | Beach Mangrove swamp | [19,45,46] |
| Granulometry (millimeters) | >1 Very thick sand to gravels | 0.51–1 Thick sands | 0.26–0.5 Medium sands | 0.126–0.25 Fine sands | Less than 0.125 Very thin and sludge | [34] | |
| Beach width (m) | More than 80 | 50–80 | 25–50 | 10–25 | 0–10 | [46] | |
| Beachfront slope | More than 8.1° | 8°–6.1° | 6°–4.1° | 4°–2.1° | 2°–0° | [46] | |
| Morphodynamic state | Dissipative | - | Intermediate | - | Reflective | [47] | |
| Geomorphological features | No features | - | 1–2 features | - | More than 2 features | [50] | |
| Wave exposure (direction) | With obstacles 0° | - | Indirect waves 45° | - | Direct waves 90° | [50] | |
| Component | Variable | Ranking | ||||||
| Very Low (1) | Low (2) | Medium (3) | High (4) | Very High (5) | Reference | |||
| Exposure (E) | Distance to vegetation covers (m) | More than 80 | Between 80 and 50 | Between 50 and 30 | Between 30 and 10 | Less than 10 | [16] | |
| Population density (inhabitants/Ha) | 0–27 | 28–44 | 43–59 | 60–77 | More than 77 | [16,46,53] | ||
| Housing density (houses/ha) | 0–10 | 11–20 | 21–30 | 31–40 | More than 41 | [16,46] | ||
| Number of infrastructure services | Less than 10 | 11–15 | 16–20 | 21–25 | More than 26 | [16,46] | ||
| Component | Dimension | Variable | Vulnerability Ranking | |||||
| Very Low (1) | Low (2) | Medium (3) | High (4) | Very High (5) | Reference | |||
| Fragility (F) | Physical Fragility (FP) | Material | Rustic (wood) | - | Masonry | - | Concrete | This research |
| Ceilings | Lightweight | - | Roof tile | - | Heavy (concrete) | This research | ||
| Housing status | Good conditions | Regular state | - | Disrepair | This research | |||
| Index K. Coastal Structure | Extreme (K > 1) | Maximum (K = 0.51–1) | Mean (K = 0.11–0.5) | Minimum (K = 0.0001–0.1) | No structures (K = 0) | [50] | ||
| Service Infrastructure | More than 10 | 8–9 | 5–7 | 3–4 | Less than 2 | [53] | ||
| Communication-Roads | Main roads | Re-labeled road | Track, trail, path | Waterway | Wooden bridges | [20] | ||
| Social Fragility (FS) | Age of the population | From 18 to 55 years old | - | >55 years old | - | <18 years old | [16,46,53] | |
| Employment, sector and time of dedication | More than 80% tourism sector | - | More than 80% farming sector | - | More than 80% fishing sector | [34,53] | ||
| Work intensity | Full time | - | Half time | - | Unemployed | [53] | ||
| Education of the population | More than 80% professional | - | More than 80% high school | - | More than 80% primary school/without education | [53] | ||
| Educational facilities | University/high school | - | High school/primary school | Primary school | Without schools | [53] | ||
| Health services | Level III (hospital) | - | Level II (hospital) | Level I (health center) | Without health services | [53] | ||
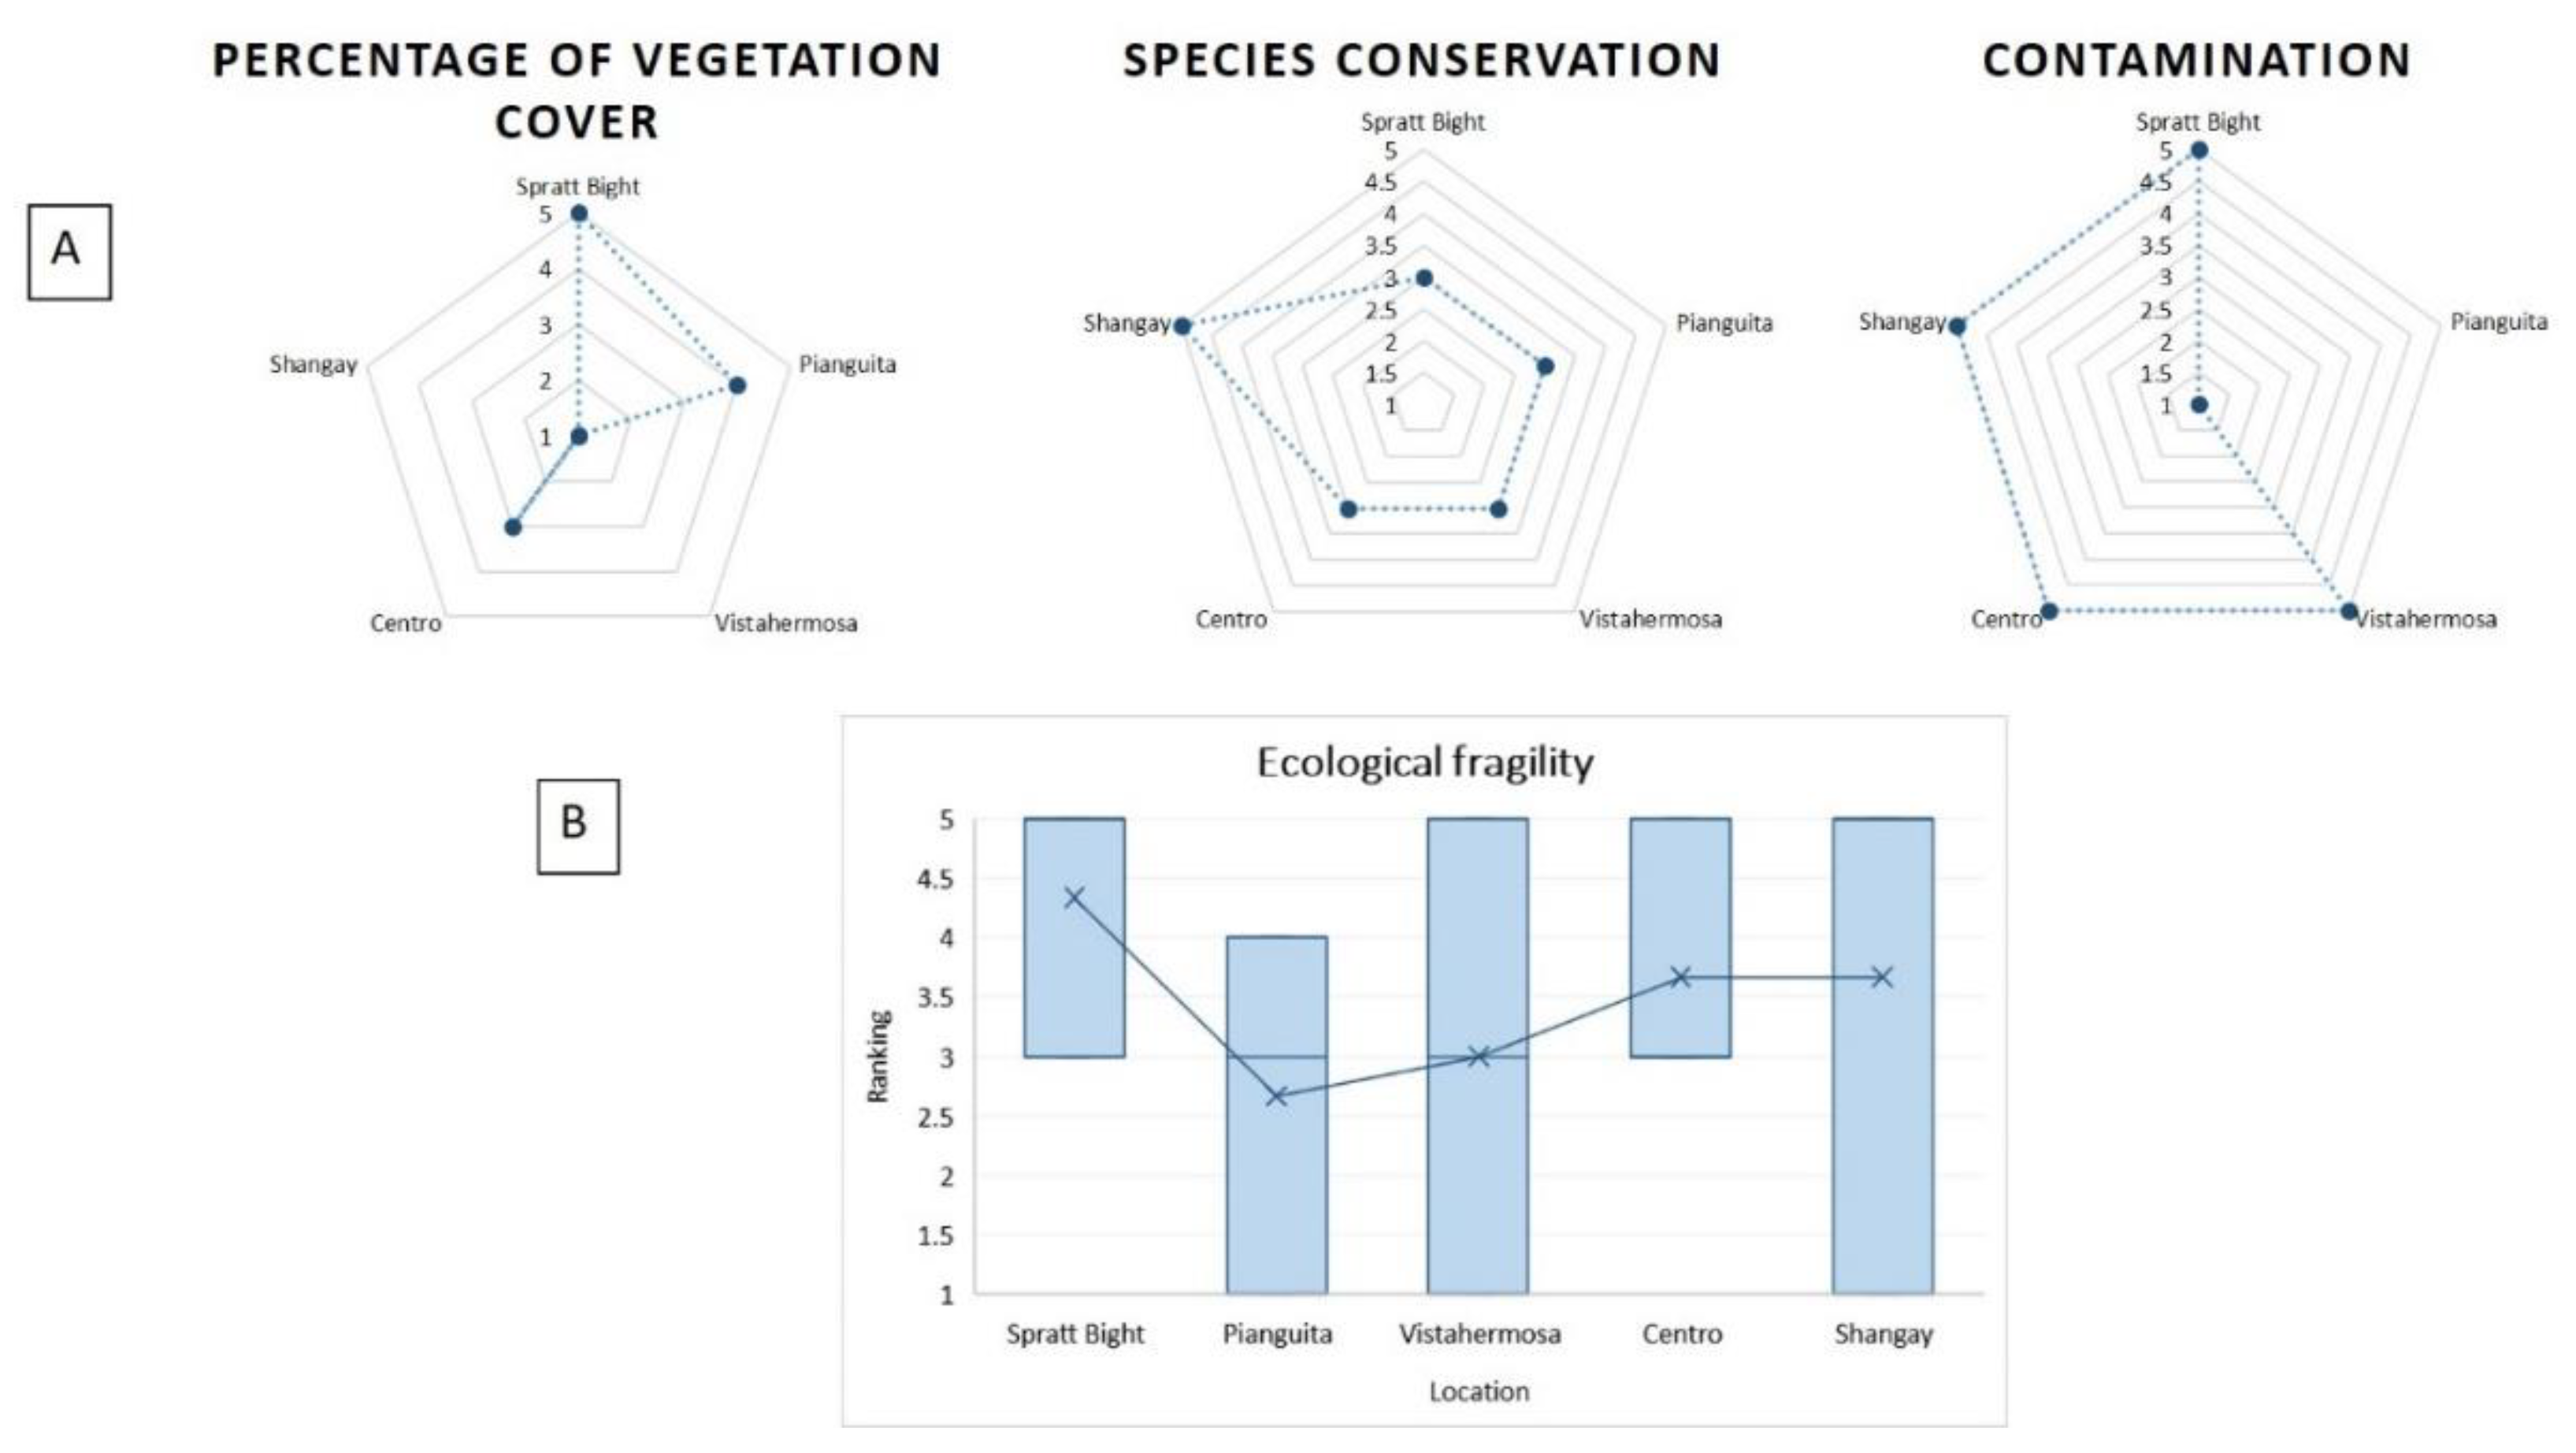
| Ecological Fragility (FEc) | Percentage of vegetation cover | More than 80% coverage | Between 60% and 80% coverage | Between 30 and 50% coverage | Between 10% and 30% coverage | Less than 10% coverage | [16] | |
| Species conservation | Permanent presence of birds and sea turtles | - | Occasional presence of birds and sea turtles | - | No presence of birds or sea turtles | [16] | ||
| Contamination | No trash | - | Occasional presence of garbage | - | Continuous accumulation of garbage | This research | ||
| Economic Fragility (FE) | Tourism vocation | Full time | - | Tourist season | - | No tourism | This research | |
| Economic activities | Tourism, fishing, and other activities (commerce, services) | - | Tourism and fishing | - | Only fishing | This research | ||
| Ecosystem services | Foods/materials/tourism | - | 2 services | - | 0–1 service | This research | ||
| Cultural Fragility (FC) | Forest practices | Presence | - | - | - | No presence | [16] | |
| Cultural beach practices | Presence | - | - | - | No presence | [16] | ||
| Ethnic communities | Presence | - | - | - | No presence | [16,20] | ||
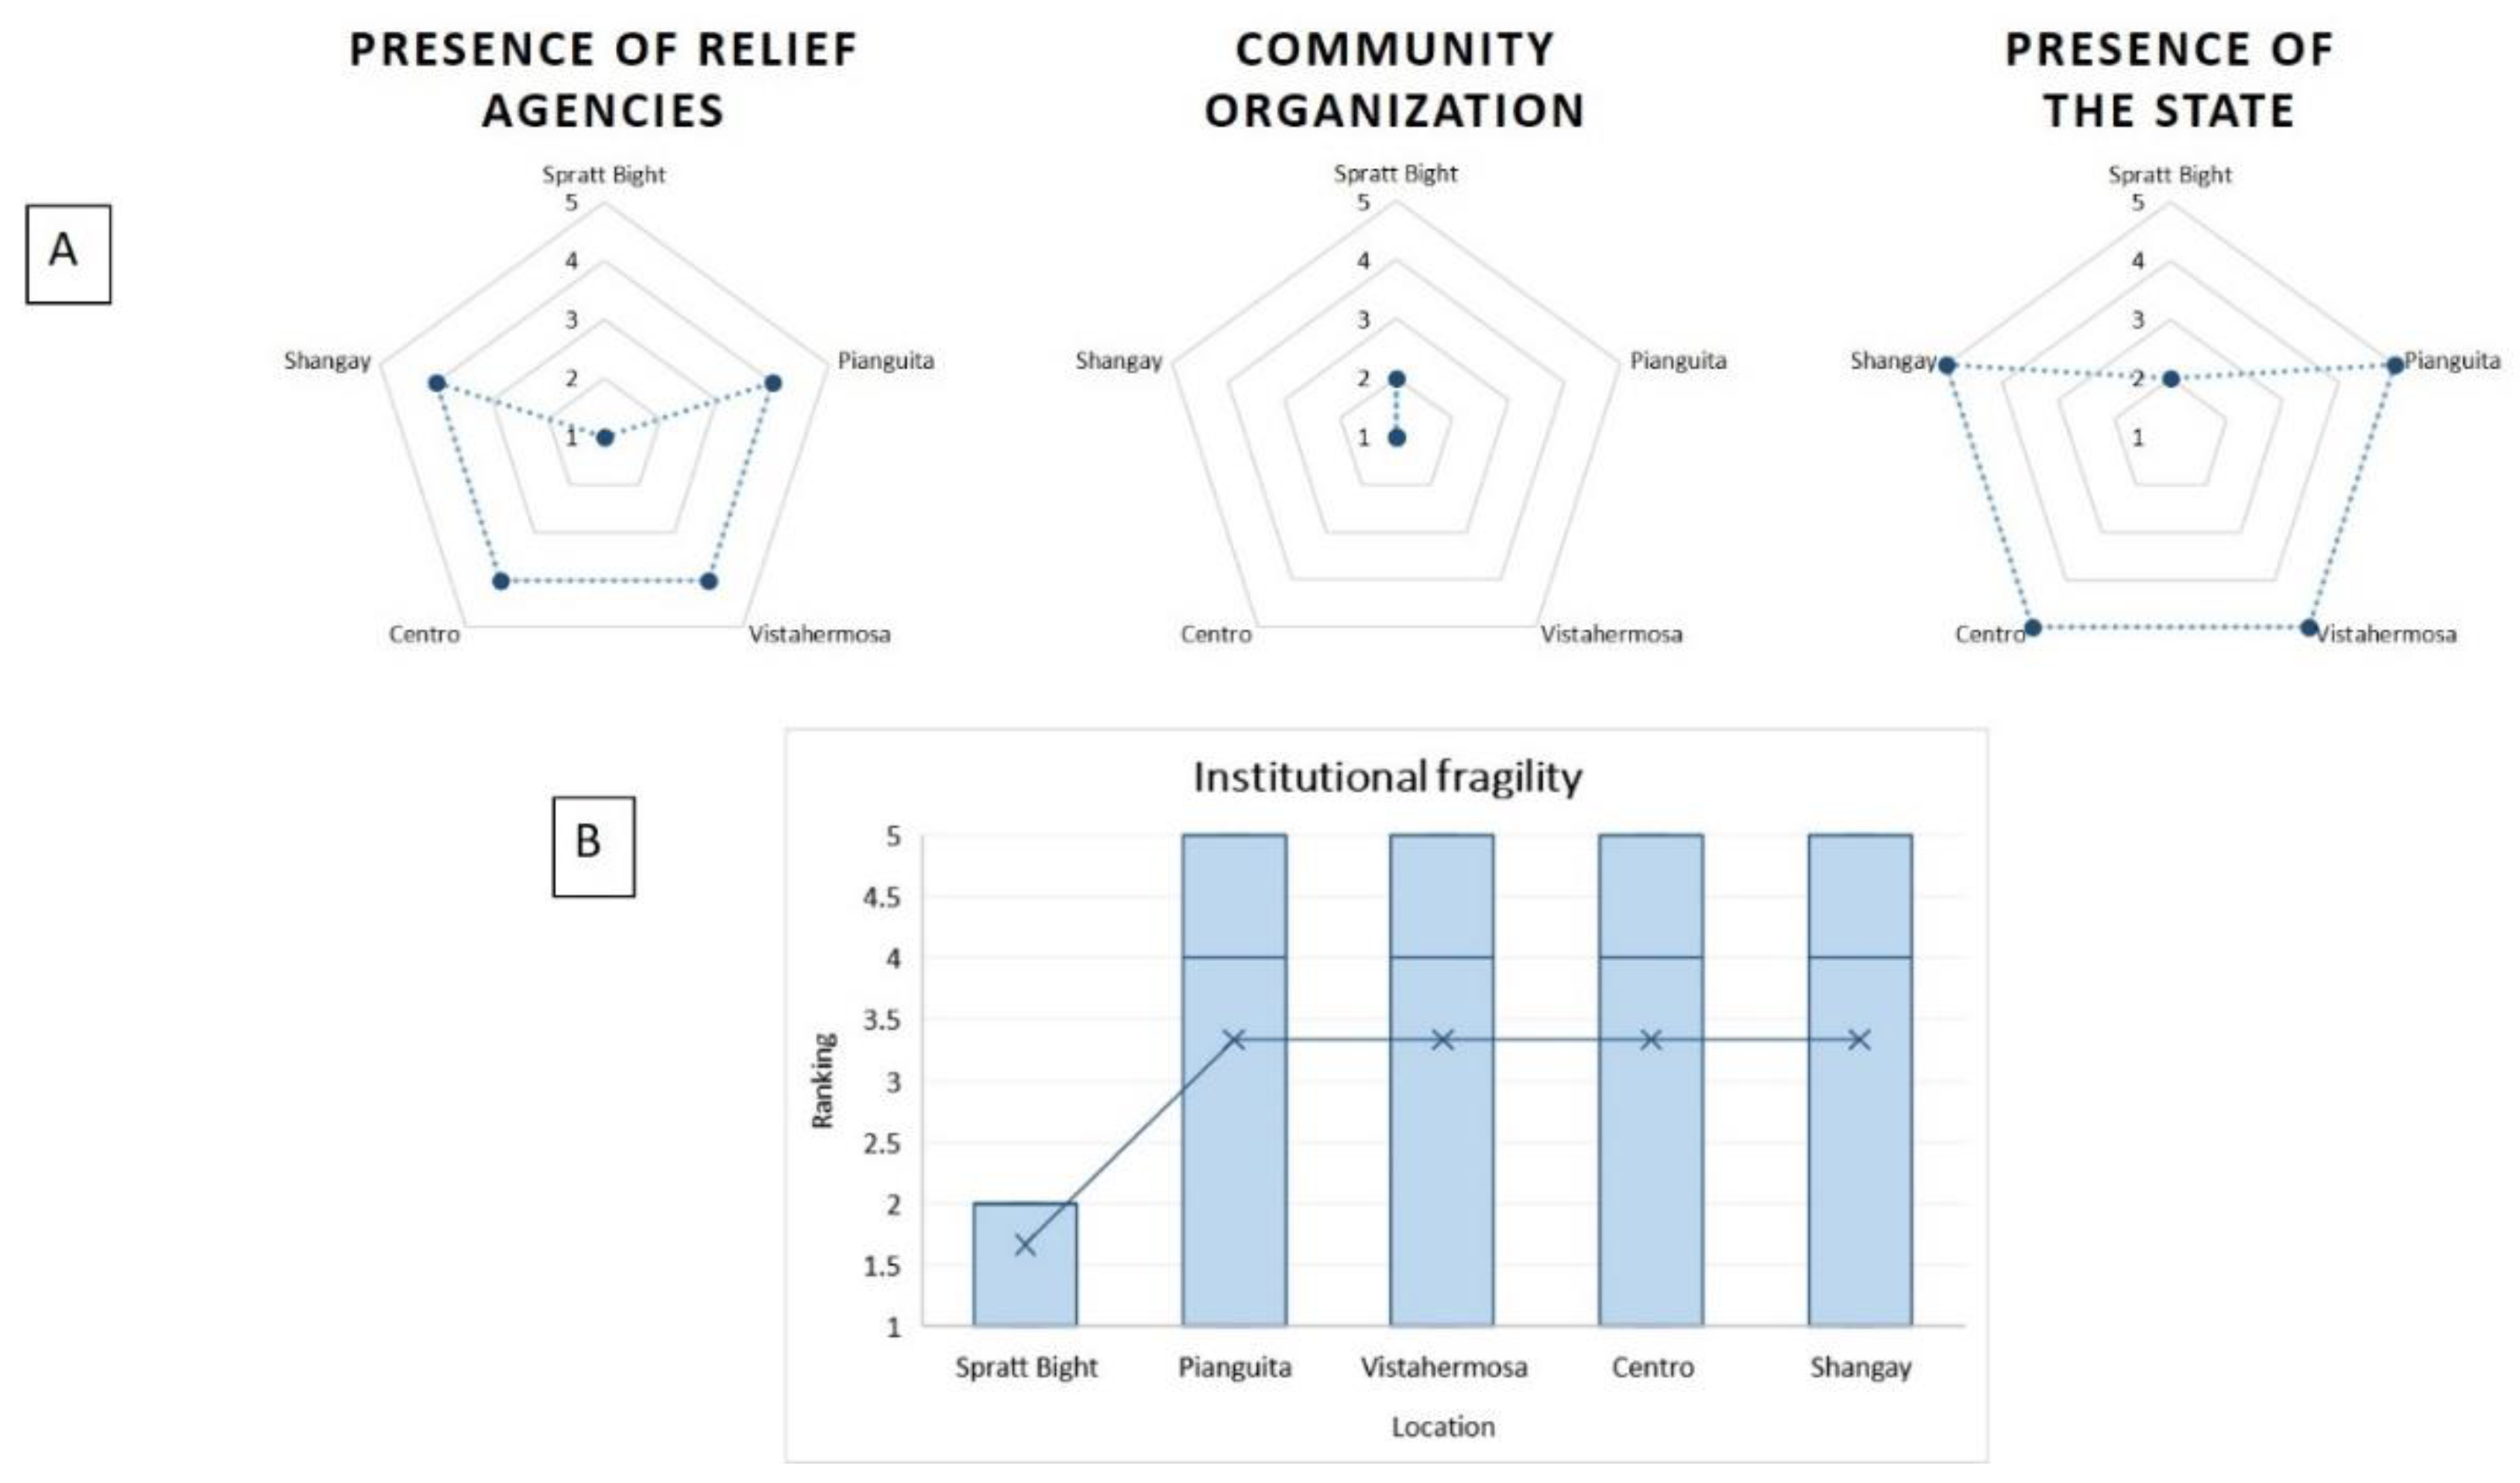
| Institutional Fragility (FI) | Presence of relief agencies | Permanent | For seasons | Remote control | Critical moments | No presence | [16,53] | |
| Community organization | Permanent | For seasons | Remote control | Critical moments | No presence | [16,53] | ||
| Presence of the State | Permanent | For seasons | Remote control | Critical moments | No presence | [16,53] | ||
| Component | Dimension | Variable | Ranking | |||||
| Very Low (1) | Low (2) | Medium (3) | High (4) | Very High (5) | Reference | |||
| Lack of Resilience (R) | Inability to anticipate (IA) | Mitigation works | More than 80% | Between 60% and 80% | Between 30% and 50% | Between 10% and 30% | Less than 10% | [16] |
| Type of housing constructions | Rustic (wood) more than 80% | Rustic (wood) between 60% and 80% | Rustic (wood) 50% and concrete 50% | Concrete between 60% and 80% | Concrete more than 80% | [53] | ||
| Knowledge of coastal erosion | More than 80% | Between 60% and 80% | Between 30% and 50% | Between 10% and 30% | Less than 10% | [16] | ||
| Emergency plan | Coastal erosion emergency plan | - | - | - | No emergency plan | [16] | ||
| Inability to cope (IC) | Distance to relief agencies | In the town | - | Within 5 km | - | More than 5 km | [16] | |
| Access (Roads) | Land rout | - | Airway | - | Seaway | [20] | ||
| Evacuation routes | Have evacuation routes | - | - | - | No evacuation routes | [16] | ||
| Distance to capital city | Less than 5 km (any type of road) | - | 10–20 km (route with limited access) | - | More than 20 km (route only air or water) | [16] | ||
| Inability to respond (IR) | Ceilings | Lightweight | - | Roof tile | - | Heavy (concrete) | This research | |
| Housing | Rustic (wood) more than 80% | Rustic (wood) between 60% and 80% | Rustic (wood) 50% and concrete 50% | Concrete between 60% and 80% | Concrete More than 80% | This research | ||
| House insurance | They have home insurance | - | - | - | They do not have home insurance | This research | ||
| Vegetation response | Vegetation present | - | - | - | Without presence of vegetal cover | [16] | ||
| Community organization | Community social organization present | - | - | - | No community social organization present | [53] | ||
| Scale | Hazard | Vulnerability | |
|---|---|---|---|
| Very High | 160–200 | Physical systems currently present coastal erosion processes, with high erosion rates. External conditions can present high incidences of oceanographic factors, whereas geological and geomorphological conditions present highest values of weakness or susceptibility to coastal erosion. | Exposure levels have the highest values; housing, ecosystems, and populations are located on the coastline. The systems or dimensions show the greatest weakness in each element, which have the lowest capacity to respond, cope, and recover. |
| High | 120–159 | The systems present or have presented some process of coastal erosion. Oceanographic conditions are strong and can have a greater incidence on the coastline, with high values of magnitude. Most of the intrinsic variables of the continental area have the conditions for coastal erosion processes to be generated. | Elements that present a high level of exposure to a hazard, and high fragility conditions, characterized by rigid structural elements, construction systems that do not allow a response and are in a state of advanced deterioration. Elements or systems are incapable of recovering from the effects caused by a phenomenon. |
| Moderate | 80–119 | Possibly coastal erosion occurs or be presented, with intermediate rates. The magnitude of incidence in terms of external variables has intermediate values or ranges between high and low values, for example, it can have a high wave and a micro-tidal regime. The physical conditions of the coastline present intermediate values, meaning that the natural conditions are moderately strong to respond to coastal erosion. | Elements that present a moderate level of exposure to the hazard, with intermediate levels of fragility, characterized by structural elements (socio-economic, institutional, etc.) whose state and resilience are acceptable. A population or ecosystems with limitations to respond and adapt to changes generated by an event. |
| Low | 40–79 | Accretion or stability values on the coastline. Some incidence variables are not strong, and the coastal area has strengths to resist coastal erosion in most of the variables. | Elements that can present a relatively low level of exposure to a given phenomenon, with fragility characterized by structural typology resistant and in good condition. Socioeconomic population capable of recovering from a drastic change in its environment. Building systems are not rigid and have the capacity to mobilize. |
| Very low | 0–39 | It presents accretion values, weak conditions of attack to the coast. The intrinsic systems of the coastline remain strong and resistant to the different processes that can weaken them and generate coastal erosion. | They are systems that have very low exposure or are far away from the coastline. Most of the systems have very low fragility, i.e., they have been strengthened, and have high capacity to adapt, respond, and cope with coastal erosion. |
| Variables | Location | Ranking | ||||
|---|---|---|---|---|---|---|
| 1 | 2 | 3 | 4 | 5 | ||
| Tide amplitude | Spratt Bight | 100% | - | - | - | - |
| La Bocana | - | - | - | - | 100% | |
| Average height of breaking waves | Spratt Bight | - | - | - | 100% | - |
| La Bocana | - | 70.59% | 29.41% | - | - | |
| Sea-level rise | Spratt Bight | - | - | - | - | 100% |
| La Bocana | - | - | 100% | - | - | |
| Magnitude (M) (score and percentage) | Spratt Bight | - | - | 116.67 100% | - | - |
| La Bocana | - | - | 116.67 69.70% | 133.33 30.30% | - | |
| Variables | Location | Ranking | ||||
|---|---|---|---|---|---|---|
| 1 | 2 | 3 | 4 | 5 | ||
| Coastline variation | Spratt Bight | 14.29% | - | 42.86% | 28.57% | 14.29% |
| La Bocana | 21% | 21% | 32% | - | 26% | |
| Occurrence | Spratt Bight | - | - | 57% | - | 43% |
| La Bocana | - | - | 74% | - | 26% | |
| Occurrence (O) (score and percentage) | Spratt Bight | - | 50.00 14.28% | 100.00 42.87% | 150.00 28.57% | 200.00 14.28% |
| La Bocana | - | 50.00 18.18% | 100.00 54.55% | - | 200.00 27.27% | |
| Variables | Location | Ranking | ||||
|---|---|---|---|---|---|---|
| 1 | 2 | 3 | 4 | 5 | ||
| Geomorphology | Spratt Bight | - | - | - | - | 100% |
| La Bocana | 5.88% | 2.94% | - | - | 91.18% | |
| Granulometry | Spratt Bight | - | - | - | 100% | - |
| La Bocana | 5.88% | - | - | - | 94.12% | |
| Beach width | Spratt Bight | 64.29% | 35.71% | |||
| La Bocana | 20.59% | 8.82% | 38.24% | 26.47% | 5.88% | |
| Beachfront slope | Spratt Bight | 71.43% | - | - | - | 28.57% |
| La Bocana | - | - | - | - | 100% | |
| Morphodynamic state | Spratt Bight | - | - | 100% | - | - |
| La Bocana | - | - | 100% | - | - | |
| Geomorphological features | Spratt Bight | 100% | - | - | - | - |
| La Bocana | - | - | 70.59% | - | 29.41% | |
| Wave exposure (direction) | Spratt Bight | - | - | 28.57% | - | 71.43% |
| La Bocana | 29.41% | - | 50.00% | - | 20.59% | |
| Susceptibility (S) (score and percentage) | Spratt Bight | - | - | - | 121.43 (61.54%) 135.71 (7.69%) 150.00 (30.77%) 100.00% | - |
| La Bocana | - | - | 114.29 12.12% | 142.86 60.61% | 178.57 27.27% | |
| Dimension | Location | Ranking | ||||
|---|---|---|---|---|---|---|
| 1 | 2 | 3 | 4 | 5 | ||
| Hazard (H) (score and percentage) | Spratt Bight | - | - | 116.66 30.77% | 150.00 69.23% | - |
| La Bocana | - | - | 116.67 18.18% | 154.16 66.67% | 170.83 15.15% | |
© 2019 by the authors. Licensee MDPI, Basel, Switzerland. This article is an open access article distributed under the terms and conditions of the Creative Commons Attribution (CC BY) license (http://creativecommons.org/licenses/by/4.0/).
Share and Cite
Coca-Domínguez, O.; Ricaurte-Villota, C. Validation of the Hazard and Vulnerability Analysis of Coastal Erosion in the Caribbean and Pacific Coast of Colombia. J. Mar. Sci. Eng. 2019, 7, 260. https://doi.org/10.3390/jmse7080260
Coca-Domínguez O, Ricaurte-Villota C. Validation of the Hazard and Vulnerability Analysis of Coastal Erosion in the Caribbean and Pacific Coast of Colombia. Journal of Marine Science and Engineering. 2019; 7(8):260. https://doi.org/10.3390/jmse7080260
Chicago/Turabian StyleCoca-Domínguez, Oswaldo, and Constanza Ricaurte-Villota. 2019. "Validation of the Hazard and Vulnerability Analysis of Coastal Erosion in the Caribbean and Pacific Coast of Colombia" Journal of Marine Science and Engineering 7, no. 8: 260. https://doi.org/10.3390/jmse7080260