Article

Motion Control of Pentapod Offshore Wind Turbines under Earthquakes by Tuned Mass Damper

1
State Key Laboratory of Coastal and Offshore Engineering, Dalian university of Technology, Dalian 116024, China
2
Institute of Earthquake Engineering, Faculty of Infrastructure Engineering, Dalian University of Technology, Dalian 116024, China
3
Marine Department, Renewable Energy Engineering Institute, Power China Huadong Engineering Corporation Limited, Hangzhou 311122, China
*
Author to whom correspondence should be addressed.
J. Mar. Sci. Eng. 2019, 7(7), 224; https://doi.org/10.3390/jmse7070224
Submission received: 9 June 2019 / Revised: 30 June 2019 / Accepted: 6 July 2019 / Published: 16 July 2019

Abstract

:
The dynamic characteristics of a bottom-fixed offshore wind turbine (OWT) under earthquakes are analyzed by developing an integrated analysis model of the OWT. Further, the influence of the interactions between the rotor and support system on the structural responses of the OWT subjected to an earthquake is discussed. Moreover, a passive control method using a tuned mass damper (TMD) is applied to the OWT to control the responses under earthquakes. The effects of the mass ratio, location and tuned frequency of the TMD on controlling structural responses of the OWT under different recorded seismic waves are studied.

1. Introduction

Earthquakes are potential risk factors for offshore wind farms in the coastal regions of China, such as the Bohai bay. High capacity offshore wind turbines (OWT) will be constructed along the coast of China in the next five years, where they may be subjected to high intensity earthquakes. Hence, earthquake loads would be one of the dominant loads to consider for OWT designs in such regions.
Bazeos et al. [1], Witcher [2], Hänler et al. [3], Zhao and Maisser [4] adopted the suggested load combinations in the OWT design standards of GL and DNV to perform the seismic analysis of OWTs. Bazeos et al. [1] considered the pseudostatic aerodynamic loads suggested by Riziotis and Madsen [5] and seismic loads in the stability analysis of the tower of wind turbines (WTs). Witcher [2] applied the corrected aeroelastic interaction model of the WT to perform the analysis under combined seismic and wind loads, and the states of the WTs under operation, emergency shutdown, and parked cases were modelled. Hänler et al. [3], Zhao and Maisser [4] modelled the soil-foundation interaction in the analysis and proved the importance of the higher mode shapes in earthquake analyses.
Moreover, the dynamic model tests of the OWT under combined seismic, wind, and wave loads were also performed by Prowell et al. [6,7], Zheng et al. [8], and Wang et al. [9,10]. Prowell et al. [6,7] investigated the responses of an OWT under seismic and wind loads, and proved that aerodynamic damping can reduce the global response to some degree in the FA direction. Zheng et al. [8] experimentally researched the interaction of seismic and wave loads, and recommended that proper combinations of these loads should be applied in the seismic analysis of OWTs to obtain realistic structural responses. Wang et al. [9,10] performed a series of model tests of OWTs under combined seismic, wind, and wave loads, discovered the aerodynamic and hydrodynamic damping effects, and concluded that the aerodynamic and hydrodynamic loads may have comparable effects on the responses when the peak ground acceleration (PGA) of the seismic excitation is small.
On the other hand, Penzien et al. [11] recommended that proper plastic response should be considered in the seismic analysis of offshore structures. Therefore, Kim et al. [12], Nuta et al. [13], and Sadowski et al. [14] investigated the inelastic response of OWTs under seismic loads. Kim [11] performed the seismic fragility analysis of OWTs considering the non-linear effects of soil-pile interaction and suggested that the applied ground motion should be calculated for each soil layer to obtain equitable fragility curves of the structure. Nuta et al. [13] investigated the probability of damage in tubular steel towers at varying seismic hazard levels, defined the fragility curves of the towers by considering different damage states in the analysis, and proved that large safety factors must be considered in the design against the phenomenon of overloading under seismic loads. Sadowski et al. [14] researched the responses of the tower under seismic loads with respect to geometric imperfections and discussed the influence of the imperfections on the capacity of the structure.
In the research on OWTs under seismic loads, the scholars gradually realised that proper structural control strategies should be applied to the WTs to reduce the responses under earthquakes. Some researchers have applied passive control methods using tuned mass dampers (TMDs), multiple tuned mass dampers (MTMDs), and tuned liquid column dampers (TLCD) on the OWTs to reduce the structural responses under the operating aerodynamic and hydrodynamic loads. In the studies of Stewart and Lacker [15], an optimal TMD was mounted on the OWT to reduce the responses of fixed and floating OWTs; however, the control effect of TMD was found to be insignificant on the monopile OWT due to the discrepancies between the dominated frequency of the response under wave load and the TMD’s tuning frequency. Dinh and Basu [16] investigated the control effects of MTMD on a spar-type floating OWT and proved that the damping of TMD is insignificant to the reduction of structural responses, and the TMD should be tuned around the dominated frequencies of the structural responses to achieve significant control effects. Colwell and Basu [17] conducted numerical analyses and discovered that the fatigue life of the tower of OWT could be increased by the implantation of TLCD on the structure.
In this paper, the structural responses of a Pentapod OWT under different seismic waves are analyzed based on an integrated seismic analysis model in FAST to research the dynamic characteristics of the OWT under earthquake loads. Subsequently, a TMD is mounted on the OWT with the intention of reducing the structural responses under earthquakes. Finally, the influence of the TMD parameters on the structural responses control of the OWT under different seismic waves are discussed.

2. Theories for the Seismic Analysis of OWT

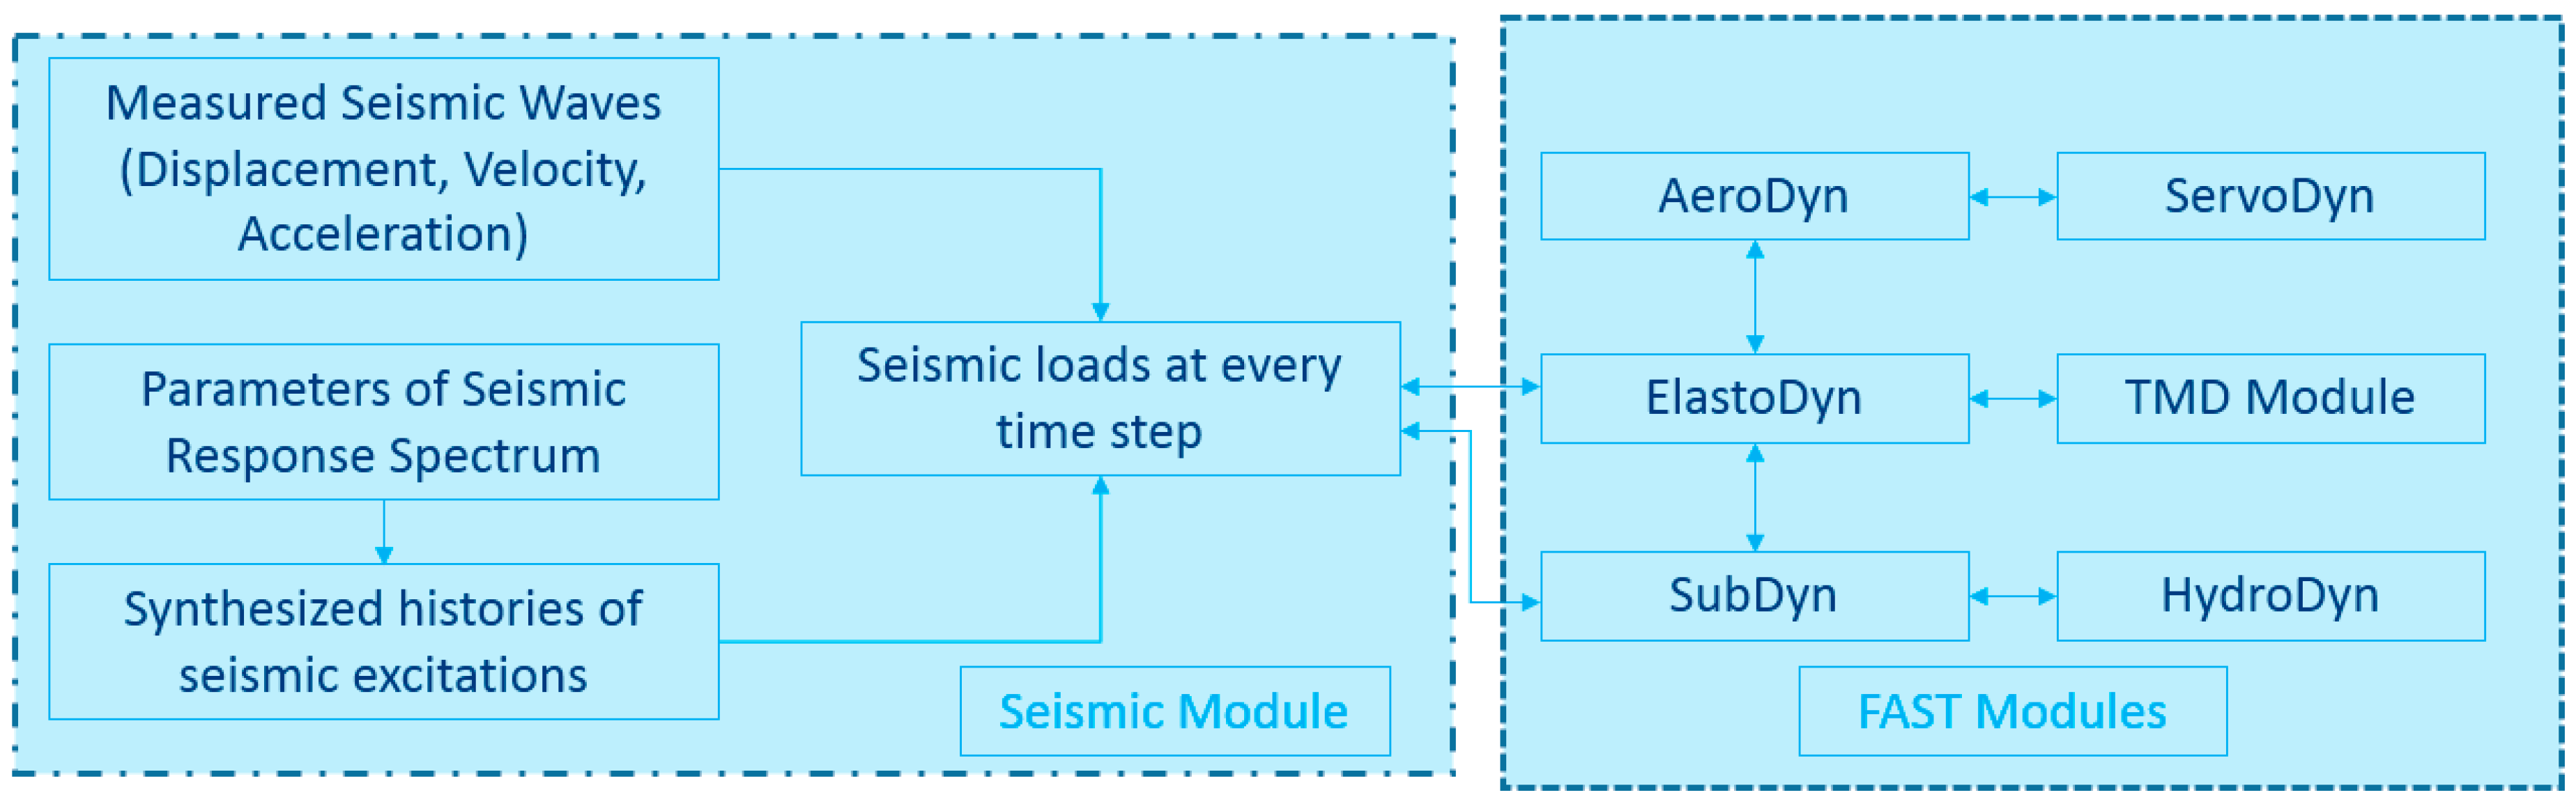
2.1. Seismic Analysis of an Integrated OWT Model

Generally, the equation of motion for structures subjected to earthquake loads can be written as follows:
[ M ] { u ¨ ( t ) } + [ C ] { u ˙ ( t ) } + [ K ] { u ( t ) } = [ M ] { u ¨ g } ,
where [M], [C], and [K] are the structural mass, damping, and stiffness matrices, respectively; { u   ¨ ( t ) }, { u ˙   ( t ) }, and {u(t)} are the vectors of structural acceleration, velocity, and displacement, respectively; and { u ¨ g } is the vector of input ground acceleration.
For the seismic analysis of OWTs, the rotor and nacelle are commonly simplified as concentrated masses in Equation (1), hence the flexibility of the rotor and interaction between the rotor and support system are neglected. To compute response of OWTs more accurately, an integrated coupling analysis model suitable for computing responses of OWTs subjected to earthquakes is suggested. Based on the combined modal and multibody dynamics formulation, the model of rotor nacelle assembly (RNA) is established by twelve degrees of freedom (DOFs). The flexibility of the drive-shaft system is modelled by three DOFs; nine DOFs are used to model the motion of the rotor system in the flapwise and edgewise directions, respectively [18]. Hence, the interactions of the rotor, servo, and support system are taken into account in the updated seismic analysis of OWTs.
Significantly different from the wind and wave loads, earthquakes are typical wide-band stochastic processes. A seismic module is added to the coupled model of the OWT under wind and wave loads in FAST, as shown in Figure 1. FAST is a time-domain numerical tool to capture the coupled aero-hydro-servo-elastics response of OWTs. According to Figure 1, it can be seen that the FAST is mainly consist of AroDyn, HydroDyn, ServoDyn, ElastoDyn and SubDyn modules for the coupled analysis of bottom fixed OWTs. AeroDyn and HyoDyn is the aero- and hydro-dynamics module, respectively. The mechanical control strategies of the OWT shall be implemented in the ServoDyn module, such as the variable speed control, blade pitch control and the emergency shutdown. The responses of the blades and the tower shall be analyzed based on the ElastoDyn module. Meanwhile, the finite element model of the substructure of the bottom fixed OWT is established in the SubDyn module by the linear beam element.
For the recompiled FAST with the seismic module, the earthquakes can be the user-provided input or the synthetically generated time histories based on the suggested earthquake response spectrum. The user input seismic waves can be supplied in terms of acceleration, velocity or displacement. For the synthetic time histories, the artificial seismic wave is generated based on the user specified parameters. The earthquakes can be applied in any combination of three directions specified in the global coordinate system as shown in Figure 2, such as the two horizontal and one vertical direction.
The procedure for the coupled analysis of OWTs can be summarized as follows.
In procedure 1, the seismic module receives the parameters of the numerical model of the OWT, such as the mass of the rotor blades, tower, and substructure, from the ElastoDyn and SubDyn modules of FAST.
In procedure 2, the seismic module reads the histories of the recorded seismic waves or synthesised seismic waves according to the parameters in the input files.
In procedure 3, the seismic module calculates the relevant seismic loads and delivers it to the ElastoDyn module of FAST at every time step when the simulation time reaches the threshold time of earthquake occurrence.

2.2. Integrated Model of OWT for Seismic Analysis

The reference OWT structure is redesigned by combined the NREL 5-MW baseline WT [19] and a practical Pentapod OWT substructure constructed in the eastern coastal regions in China as shown in Figure 3a. The rating power of the practical OWT is identical with the NREL 5 MW baseline WT. The sectional geometries of the tower such as both the diameter of the tower of the practical and baseline wind turbine are also same. So the Pentapod substructure of the practical OWT can be directly applied to the baseline wind turbine, as shown in Figure 3a. While the height of the substructure is redesigned in order to satisfy the hub height of the baseline wind turbine, and the dimensions of the redesigned Pentapod is shown in Figure 3b,c. Meanwhile, the dynamic characteristics and ultimate capacities of the reference OWT is checked based on the DNV GL standards [20] in order to ensure the safety of the structure.
Further, the integrated coupling analysis model of the reference OWT is established in FAST with the updated Seismic module. The schematic diagram of the fully coupled analysis model under the seismic loads is shown in Figure 4.

2.3. Load Cases for Seismic Analysis of OWT

Presently, the semi-integrated analysis method is widely adopted to design and check OWT on the base of the linear combination of seismic, wind and wave loads recommended by the DNVGL [21] and IEC [22] standards, indicating that the interactions of seismic, wind and wave loads are neglected. However, an integrated model of OWT under earthquakes is established to carry out sophisticated analysis in the paper. Then, the dynamic response of a parked OWT with multi-year mean water level under seismic excitations is studied in order to reveal the dynamic characteristics of the structure under the seismic cases, as shown in Figure 4.
As listed in Table 1, the dynamic characteristics and structural responses of the OWT in the standstill condition under the recorded seismic waves are investigated. Based on the geological conditions, requirements of the standards [22], and the seismic fortification intensity of the offshore wind farm, the parameters of the recorded seismic excitations are determined and applied in the integrated analysis of OWTs. Figure 5a shows the acceleration time histories of the selected seismic excitations, such as the El Centro, Taft, Northridge, and Chichi waves. From the figure, it can be observed that the Chichi wave has the largest peak ground acceleration (PGA), which is 0.37 g. The Fourier amplitudes of the selected seismic waves are shown in Figure 5b. The Figure demonstrates that the seismic excitations comprise of abundant frequency components in the range of 0.1–10 Hz, which includes the lower natural frequencies of general offshore structures.
The seismic excitations listed in Table 1 are applied in the F–A direction which is consistent with the X axis in the global coordinate system as shown in Figure 2.

3. Structural Responses of the OWT under Seismic Loads

3.1. Dynamic Characteristics of OWT

The fully coupled analysis model of the reference OWT is created in FAST based on the parameters of the NREL 5-MW baseline WT and the geometries of the Pentapod substructure. An equivalent pile model is used to model the pile-soil interaction in the fully coupled analysis model. The length of the equivalent pile is assigned as 18.26 m, which is 8.3 times the pile diameter, based on the similarity of the fundamental frequency. Dynamic characteristics of the fully coupled model are analyzed by the free-decay testing method.
The free-decay testing method is an extensively used method to calculate the natural frequencies of structures. Based on the free-decay testing method, an initial displacement or rotation angle of the structure shall be designated, then the natural frequencies of the structure can be determined based on the Fourier amplitudes or power spectral density functions of the decayed histories of the structural displacement or acceleration.
During the study, an initial displacement is designated at the blade tip, tower top and tower base, respectively. The natural frequencies of the blades and the integrated structure are derived based on the decayed accelerations of the blades and the tower. Figure 6 shows the Fourier amplitudes of the decayed histories of the blade tip and tower accelerations, and the corresponding analysis results are listed in Table 2.

3.2. Acceleration Responses

In this section, comparisons of tower accelerations under different types of seismic excitations are carried out. The recorded El Centro and Taft seismic waves were applied to the parked OWT along the FA direction, which is perpendicular to the rotating plane of the OWT. Moreover, the threshold time for the activation of the seismic loads was considered in the analysis to account for the stochastic nature of the seismic waves. The threshold value was 150 s for the seismic analysis of a parked OWT, and the total simulation time was 400 s.
Variations in the dynamic amplification factors (DAFs) with the height of the tower under different seismic excitations are recorded, as shown in Figure 4, to investigate the influence of the seismic excitation type. The DAF under earthquake loads can be expressed as Equation (2).
DAF = PSA PGA ,
where PSA is the peak acceleration response at a location, e.g., the maximum or minimum values of the acceleration time histories at the nacelle; PGA is the peak ground acceleration, e.g., the PGA of El Centro seismic wave = 0.21 g, as shown in Figure 5a.
Compared to the other seismic waves, the Northridge seismic wave stimulates the maximum DAFs along the height of the tower, as shown in Figure 7, and the maximum DAF under the Northridge wave is about 6.36, as listed in Table 3, at an elevation of 60 m on the tower. Statistics of the acceleration time histories at the tower top and the maximum tower accelerations corresponding to the maximum DAFs under different seismic waves are listed in Table 3. It can be observed that the Chichi seismic wave stimulates the maximum tower acceleration due to its high PGA. On the other hand, the PGA of the Northridge seismic wave is comparatively smaller than that of the El Centro and Chichi seismic waves; however, it stimulates significant accelerations at the tower top, comparable to the responses under the El Centro and Chichi seismic waves.
The dynamic characteristics of the accelerations at the tower top and the maximum tower accelerations are illustrated in Figure 8. The following results can be obtained:
(1)
Other than the first two natural frequencies of OWT, the higher-order frequency components dominate the tower accelerations under earthquakes, especially for the Northridge seismic wave.
(2)
For the nacelle accelerations of the OWT under seismic excitations, the responses are mainly dominated by the first two natural frequencies of the OWT.
(3)
Under the El Centro and Taft seismic waves, the fifth natural frequency of the OWT dominates the tower accelerations, as shown in Figure 8a,b.
(4)
Figure 8c demonstrates that the higher-order frequency components are stimulated under the Northridge seismic wave, which influence the tower accelerations significantly.
(5)
Under the Chichi seismic wave, the influence of the first three natural frequencies of the OWT on the tower accelerations is non-negligible, as shown in Figure 8d.
From these comparisons, the dominant frequencies of tower accelerations are found to vary significantly due to the aforementioned differences between the seismic waves.

3.3. Mudline Bending Moment

Figure 9a,b show the mudline bending moments under different seismic excitations. Compared to the other three seismic excitations, it can be seen that the Chichi seismic wave stimulates the largest bending moments, which can be attributed to the significant PGA of the Chichi seismic wave. The dynamic characteristics of bending moments in the frequency domain are shown in Figure 9c,d. Different results can be found by comparing them with the dynamic characteristics of the tower accelerations. The second mode shape of the OWT dominates the bending moments, unlike the responses of the tower accelerations shown in Figure 7. Moreover, for the Chichi seismic wave, the influence of the blade’s first flap mode of the rotor system cannot be neglected, as shown in Figure 9d.

4. Vibration Control of OWT using TMD

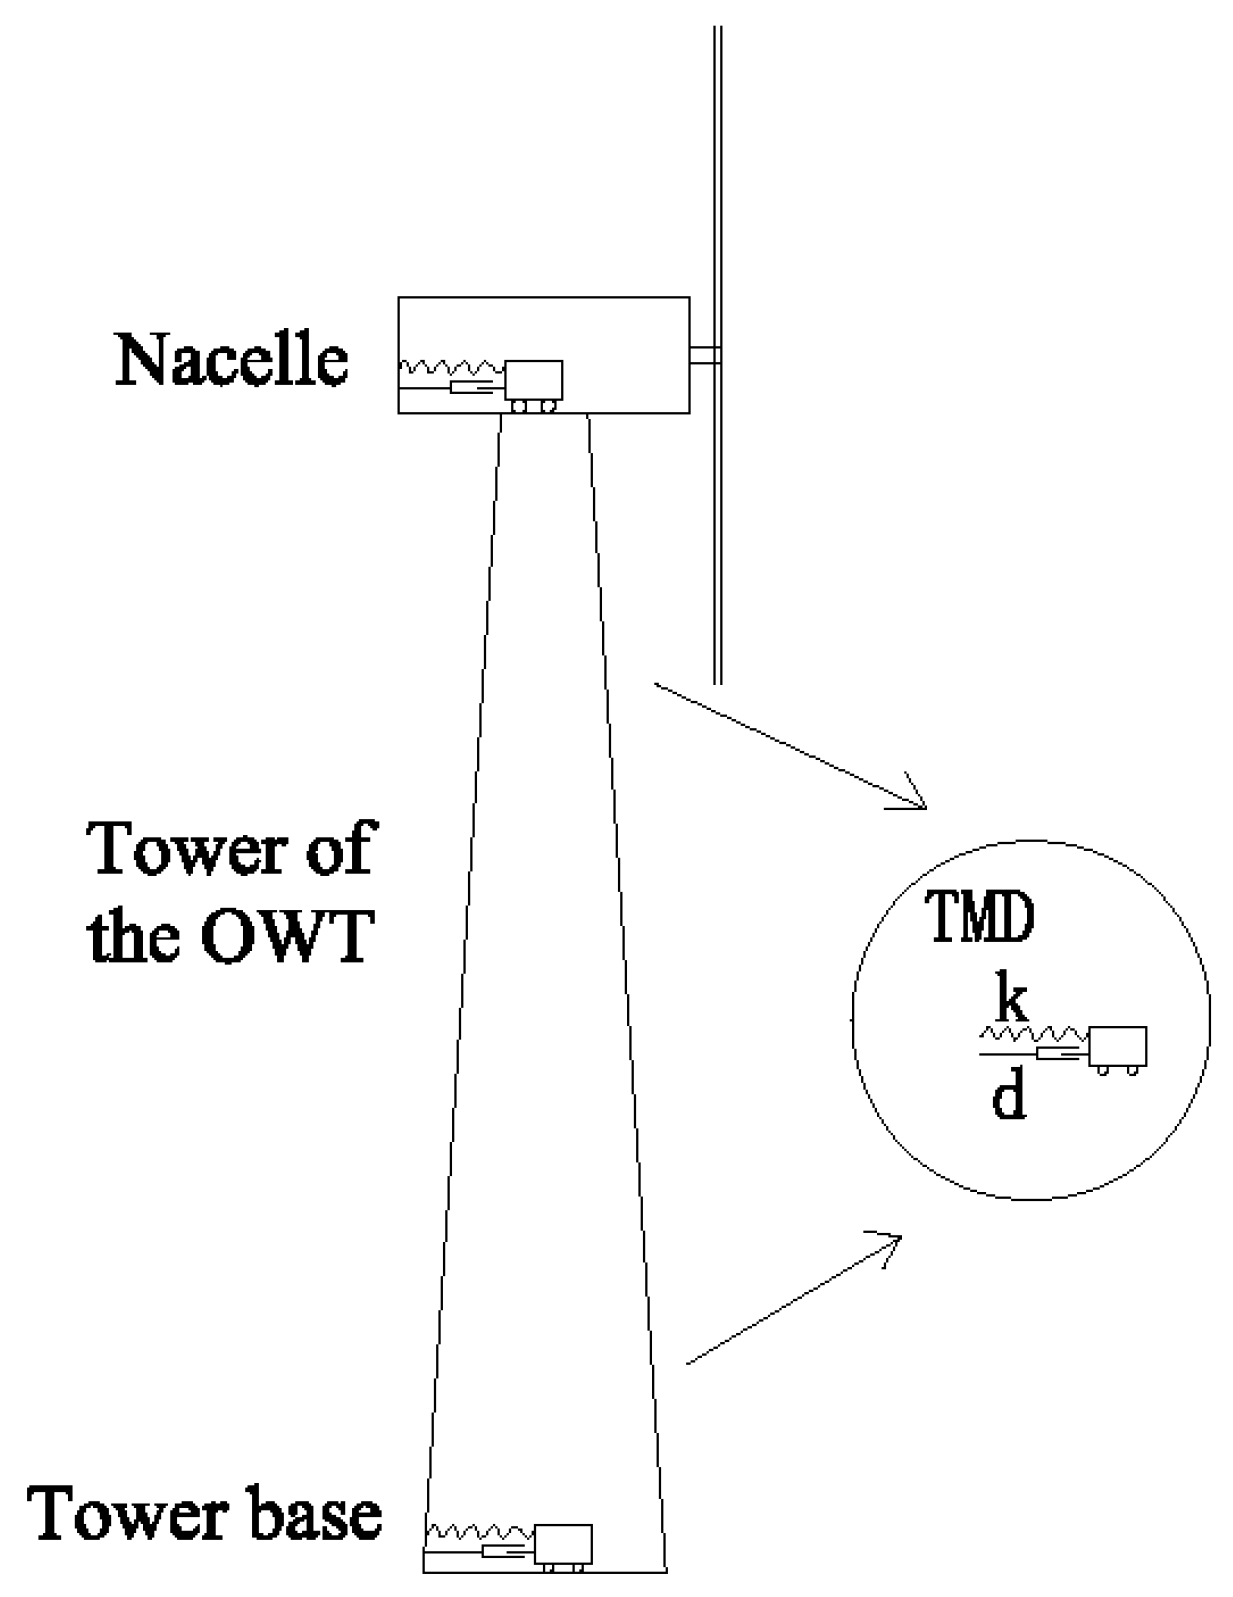
4.1. Governing Equation of Motion of OWT with TMD

During the study, a TMD is added to the tower of the OWT based on the released TMD module [23] in FAST. So the passive control method of TMD is applied to control the response of OWT under the seismic cases, as shown in Figure 1. The coupled governing equation of motion of OWT with TMD under earthquakes can be written as:
[ M ] { u ¨ ( t ) } + [ C ] { u ˙ ( t ) } + [ K ] { u ( t ) } { E } ( C TMD u ˙ TMD + K TMD u TMD ) = [ M ] { u ¨ g }
M TMD u ¨ TMD ( t ) + C TMD u ˙ TMD ( t ) + K TMD u TMD ( t ) = M TMD u ¨ OWT ( t ) ,
where MTMD, CTMD, and KTMD are the mass, damping, and stiffness of the TMD, respectively; { u ¨ TMD ( t ) } , { u ˙ TMD ( t ) }, and {uTMD (t)} are the parameters of TMD’s acceleration, velocity, and displacement, respectively; {E} is a unit vector that represents the location of the TMD on the OWT; and u ¨ OWT ( t ) is the corresponding velocity of the OWT with respect to the location of the TMD.
The selection of parameters of TMD will determine control effect on the OWT responses under earthquakes. The optimal design standards of TMD suggested by Zhou [24] and Connor [25] can be expressed as Equations (5) and (6).
f opt = ( 1 + 0.5 μ m ) 1 2 ( 1 + μ m )
ζ opt = 0.5 μ m ,
where fopt is the optimized frequency ratio of TMD, fopt = fTMD/fOWT; fTMD is the tuning frequency of TMD; fOWT is the selected natural frequency of OWT; μm is the mass ratio, μm = MTMD/MOWT; MOWT is the mass of OWT; and ζopt is the optimized damping ratio of TMD.
Then, the parameters of TMD can be calculated by μm, fopt and ζopt based on Equations (7)–(9).
M TMD = μ m M OWT
f T M D = f opt f OWT ;   K T M D = M TMD ( 2 π f T M D ) 2
C T M D = 4 π ζ opt f TMD M TMD .

4.2. Design of TMDs for OWT under Earthquakes

The parameters of the tuning frequency, locations and mass are essential for designing TMD. According to the dynamic characteristics of the Pentapod OWT under earthquakes, the first two natural frequencies of the OWT which are the dominant frequencies of the tower accelerations and mudline bending moments, are designated as the tuning frequencies of TMDs. Meanwhile, the nacelle and the tower base were selected as the alternative locations for TMDs, as shown in Figure 10. Further, the mass ratios such as 1%, 2% and 3% were selected to determine the optimized parameters of TMD in Equations (5) and (6). The upper limit of the TMD’s mass ratio was selected as 3%, which is a recommended value for the motion control of offshore structures under earthquakes by Zhou [24]. Table 4 lists the calculated parameters of the TMD based on the optimal design formulas and the suggested mass ratios. As listed in Table 4, the tuning frequency of TMD is slightly different from the selected natural frequency of OWT due to the influence of fopt, such as the tuning frequency of TMD01 is 0.303Hz, and the corresponding natural frequency of OWT is 0.305 Hz.
Table 5 lists the load cases used for investigating the influence of TMD parameters on the reduction in the structural responses of the OWT under seismic excitations. To investigate the influence of PGA on the control effects of TMD, El Centro seismic waves with different PGAs are also considered as cases T1–T48, as listed in Table 5.

4.3. Influence of Seismic Waves with Varying PGAs on Vibration Control

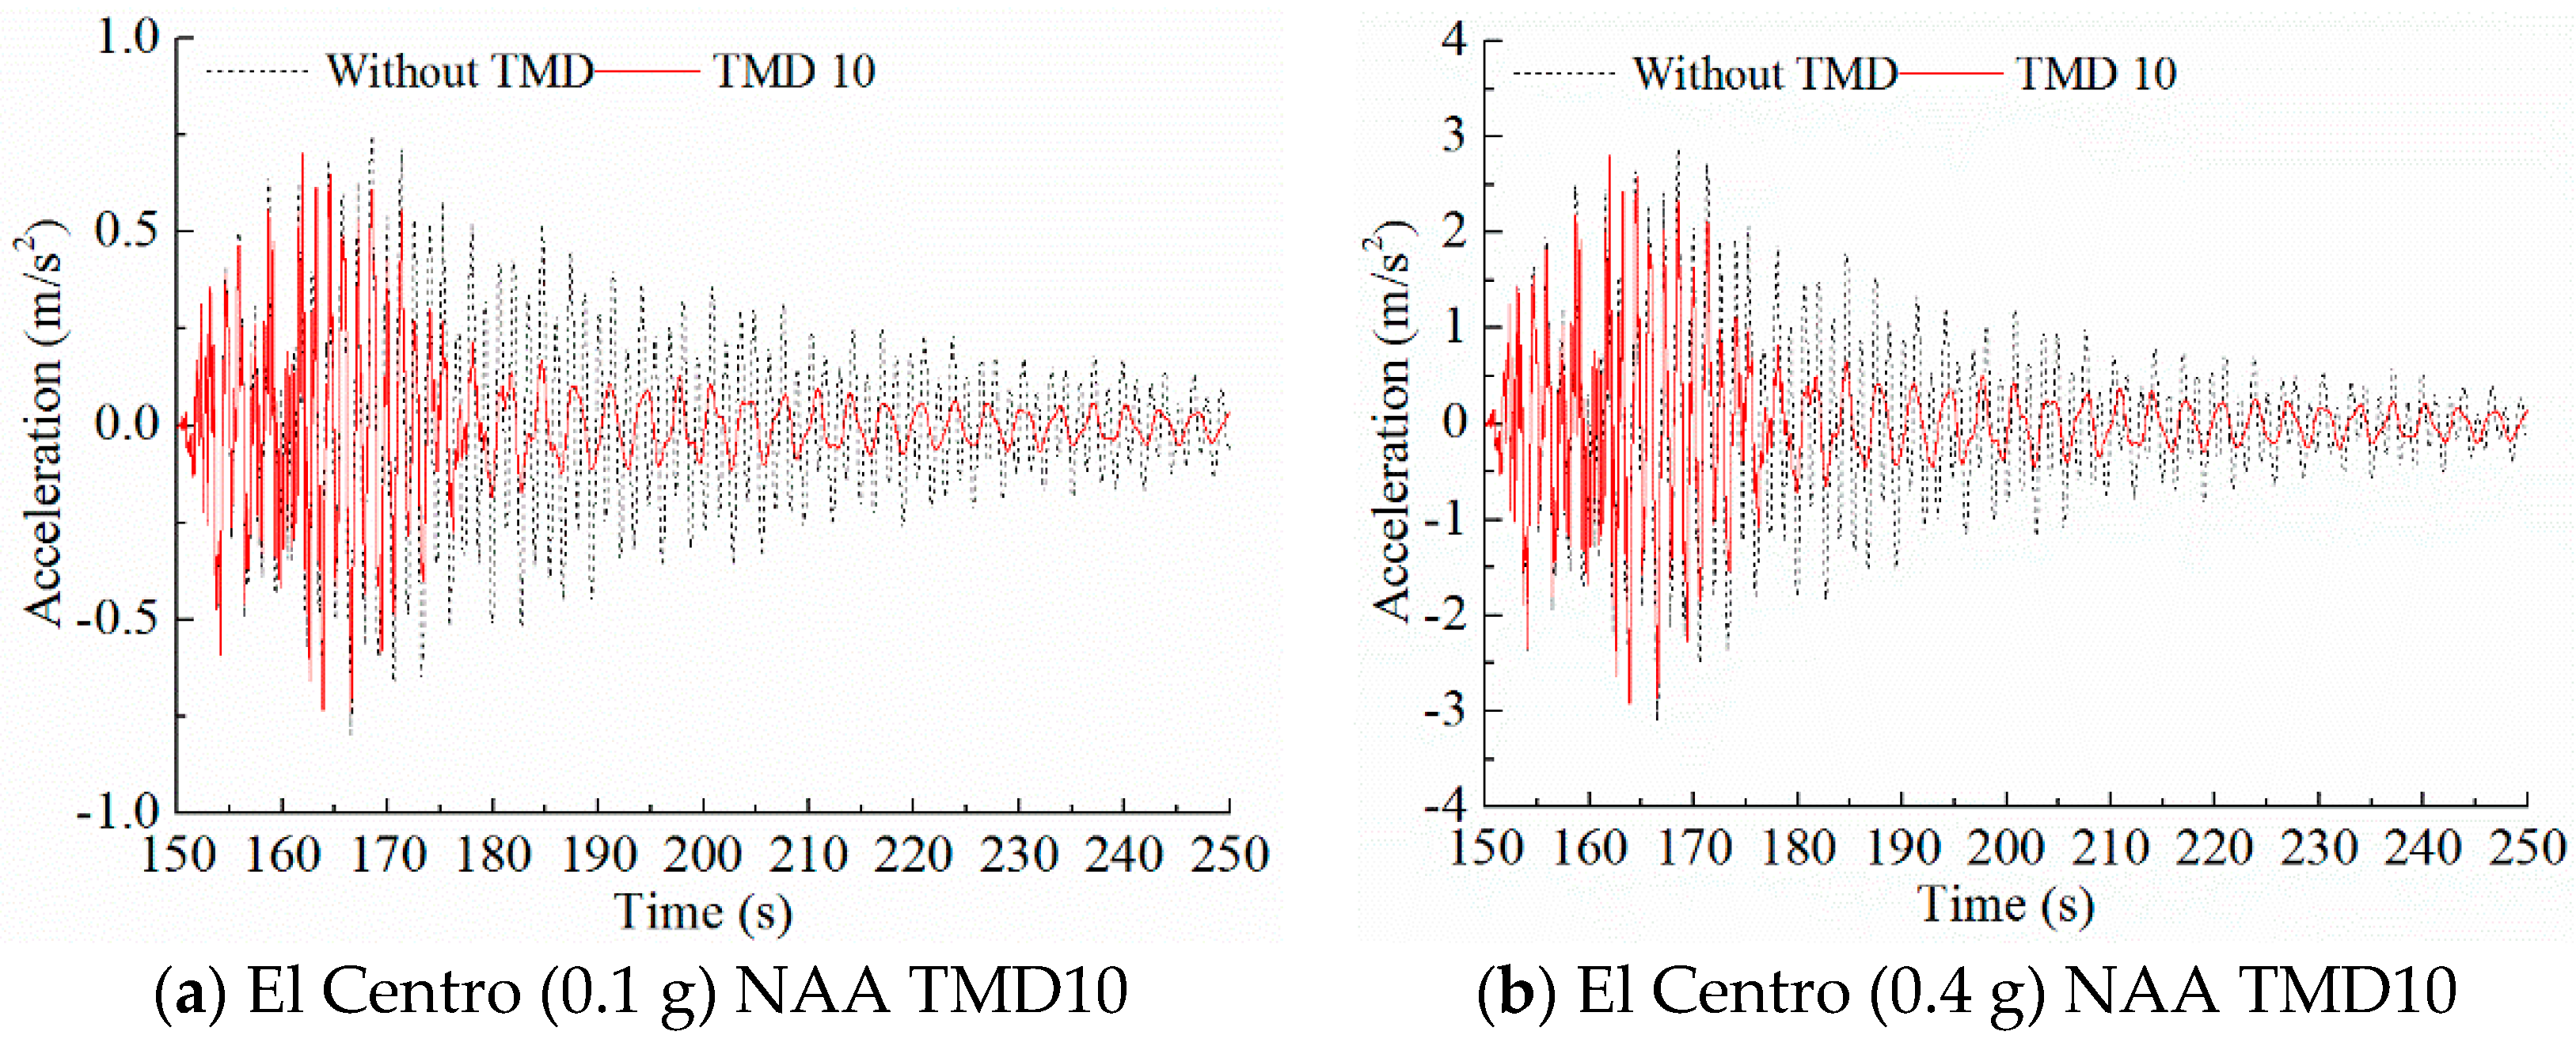
4.3.1. Control Effect of TMD on the NAA

According to the dynamic characteristics of nacelle acceleration (NAA) under the El centro seismic wave shown in Figure 8, the frequency component of 0.305 Hz and 0.742 Hz is discovered to be the dominant frequencies of the response which is the first two natural frequencies of OWT, respectively. Meanwhile, the influence of the second order natural frequency is discovered to be more prominent.
So the reduction of the nacelle acceleration under such seismic case achieved by the TMD with the tuning frequency of the second natural frequency of the OWT is presented in order to investigate the effectiveness of TMD, such as the reducing of the structural responses achieved by TMD10–TMD12. On the other hand, in order to research the influence of the PGA of seismic waves on the control effect of TMD, El Centro seismic waves with different PGAs are also applied to the model. The reduction in the NAA time histories are illustrated in Figure 11, it can be seen that TMD10 reduces the NAA significantly under the El Centro seismic wave of PGA 0.1 g. With the increase in the PGA, the control effects of TMD decreases, as shown in Figure 11b; however, the reduction in NAA is still prominent.
Further details on the influence of the PGA on the control effect of TMD can be understood from Figure 12. Variations in the statistics of NAAs controlled by TMD01–03 and TMD10–12 under El Centro seismic waves with varying PGAs are shown in Figure 11, which tuning frequency is the fundamental and second order natural frequency of the OWT, respectively. The term reduction ratio in the Figures can be defined as,
Reduction   ratio = ( S t a t i s t i c s S t a t i s t i c s TMD ) S t a t i s t i c s × 100 %
where Statistics is the maximum or minimum value or the standard deviation of the structural responses of the OWT without TMD and StatisticsTMD is the corresponding maximum or minimum value or standard deviation of the responses reduced by the TMD.
Initially, the ineffectiveness of TMD01 can be observed from the slight reduction in the statistics, as shown in the Figure 12. TMD03 is found to be more effective in reducing the maximum values when the PGA of the El Centro seismic wave is 0.1 g, as shown in Figure 12a. However, the control effects of TMD03 decrease significantly with the increase in the PGA of the El Centro seismic wave; e.g., the reduction ratios of TMD03 for the maximum values of NAAs are 12.8% and 9% under the El Centro seismic waves of PGAs 0.1 and 0.4 g, indicating that the control effects of TMD03 weaken remarkably with the increasing of the PGA of El Centro seismic wave.
Further, Figure 12b demonstrates that TMD10–12 are more efficient in reducing the standard deviations of NAAs, and the maximum reduction ratio of the standard deviations of the responses exceeds 40%. Influence of the PGAs of seismic waves can also be discovered for such effective TMDs that the reducing ratio of TMD10 decreases to only 29% under the El Centro seismic wave with the maximum PGA.

4.3.2. Control Effect of TMD on the Mudline Bending Moment

The influence of the PGAs on the control effect of bending moment is studied in this section. Figure 13 illustrates the reduction in the time histories of bending moments under El Centro seismic waves of PGAs 0.1 and 0.4 g.
For TMD10, the bending moments under load case T10 (El Centro 0.1 g) and T56 (El Centro 0.4 g) is decreased significantly. Further detailed comparisons are depicted in Figure 14, based on the reduction in the statistics achieved. It can be observed that the control effects of TMD10 and 11 are sensitive to the variations in PGA. The reduction ratios of the maximum values is comparatively smaller than that of standard deviations, which can exceed 50%. Meanwhile, the reduction ratios of TMD01 decrease significantly under the El Centro seismic wave of the highest PGA, and the control effects cannot be improved even by increasing the mass of the TMDs under such seismic excitations.

4.4. Influence of the Seismic Excitations on Vibration Control

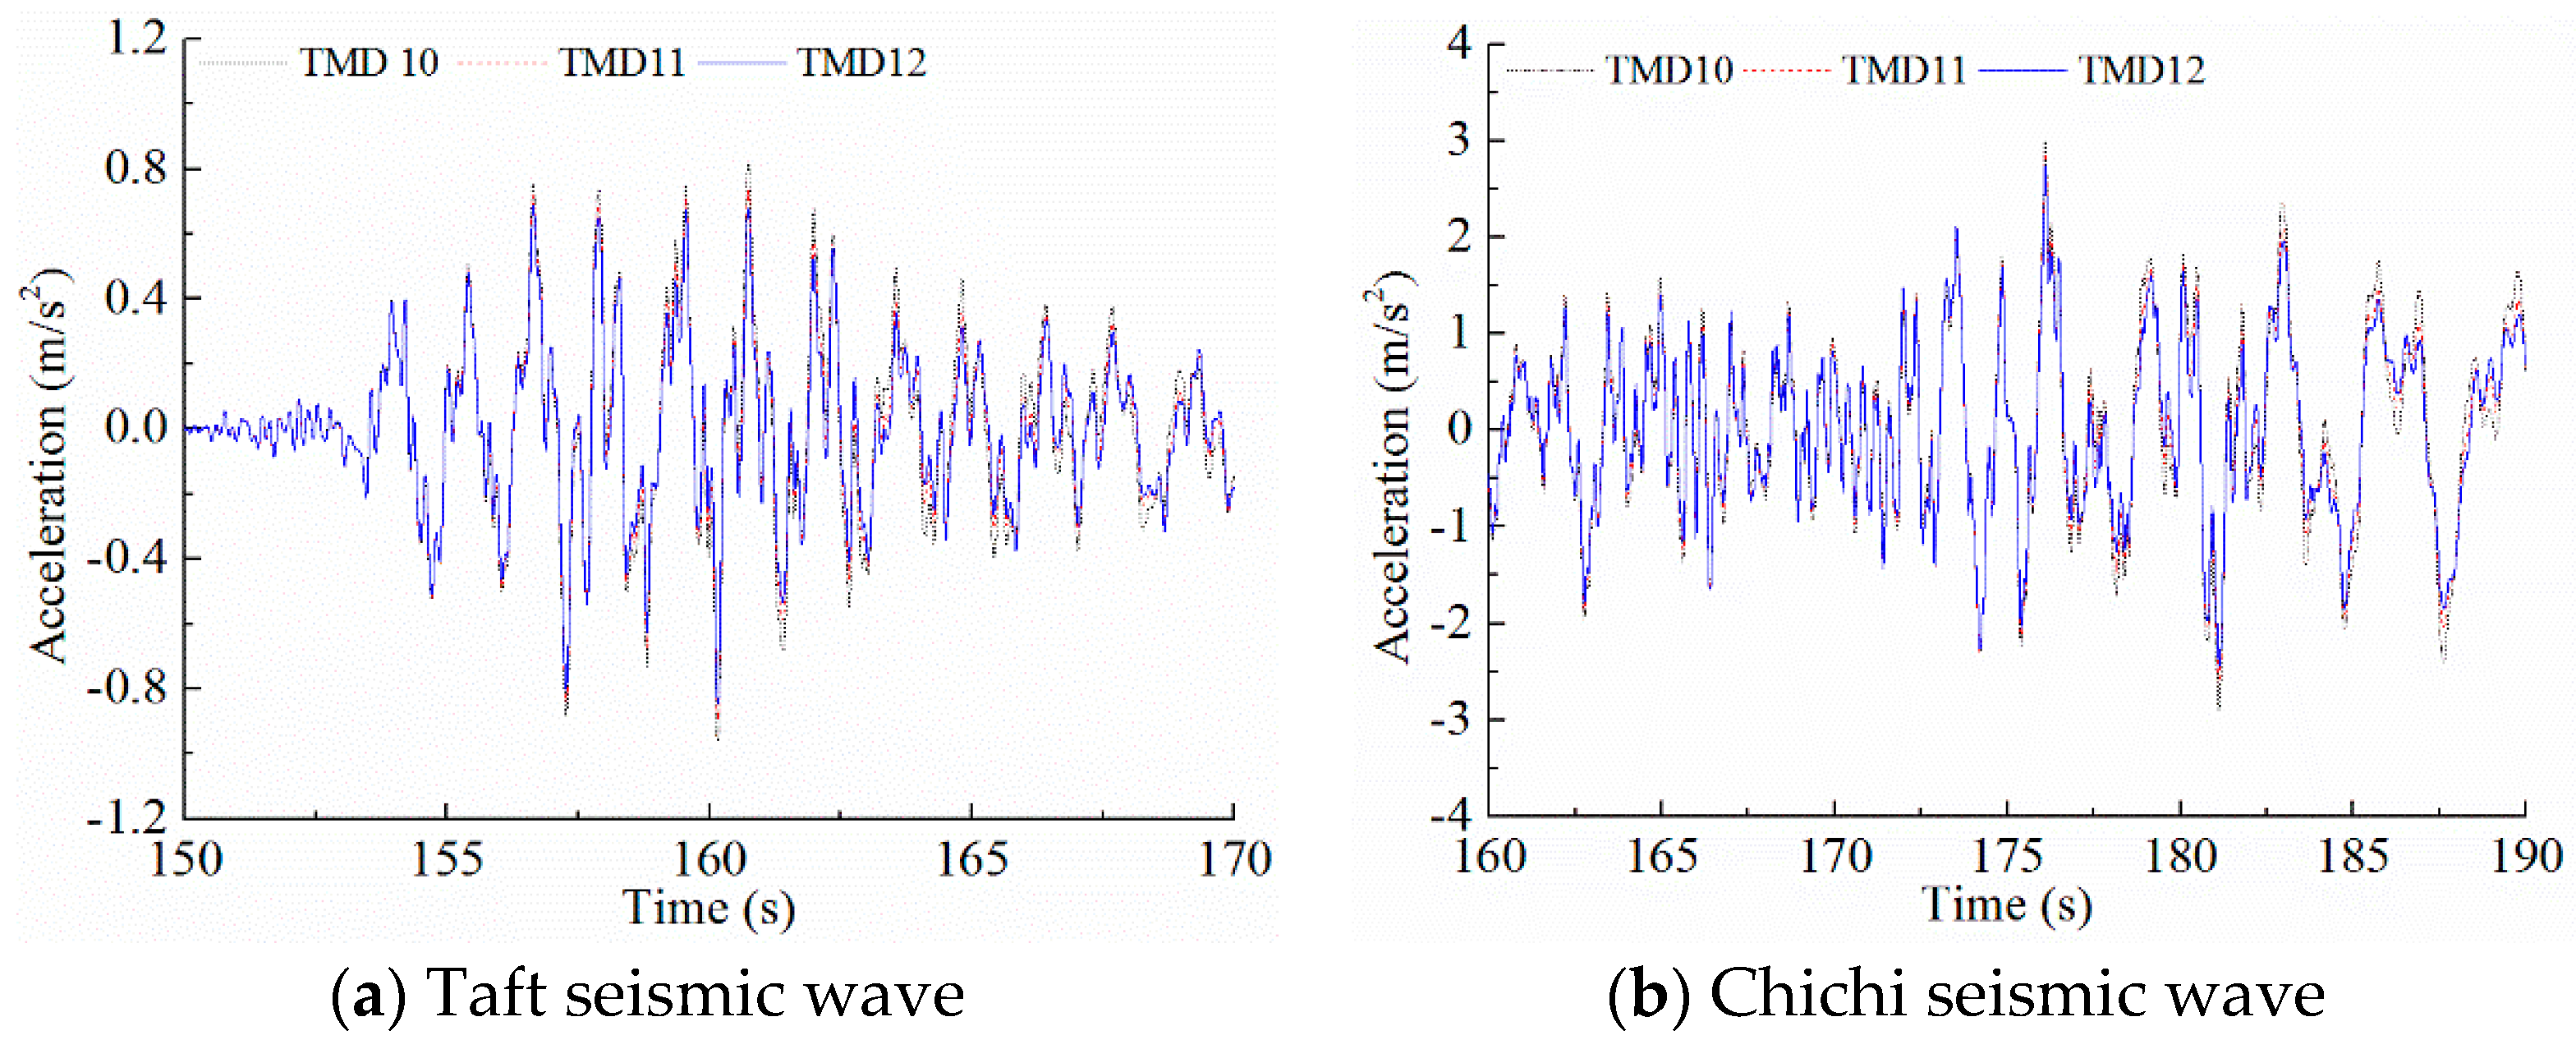
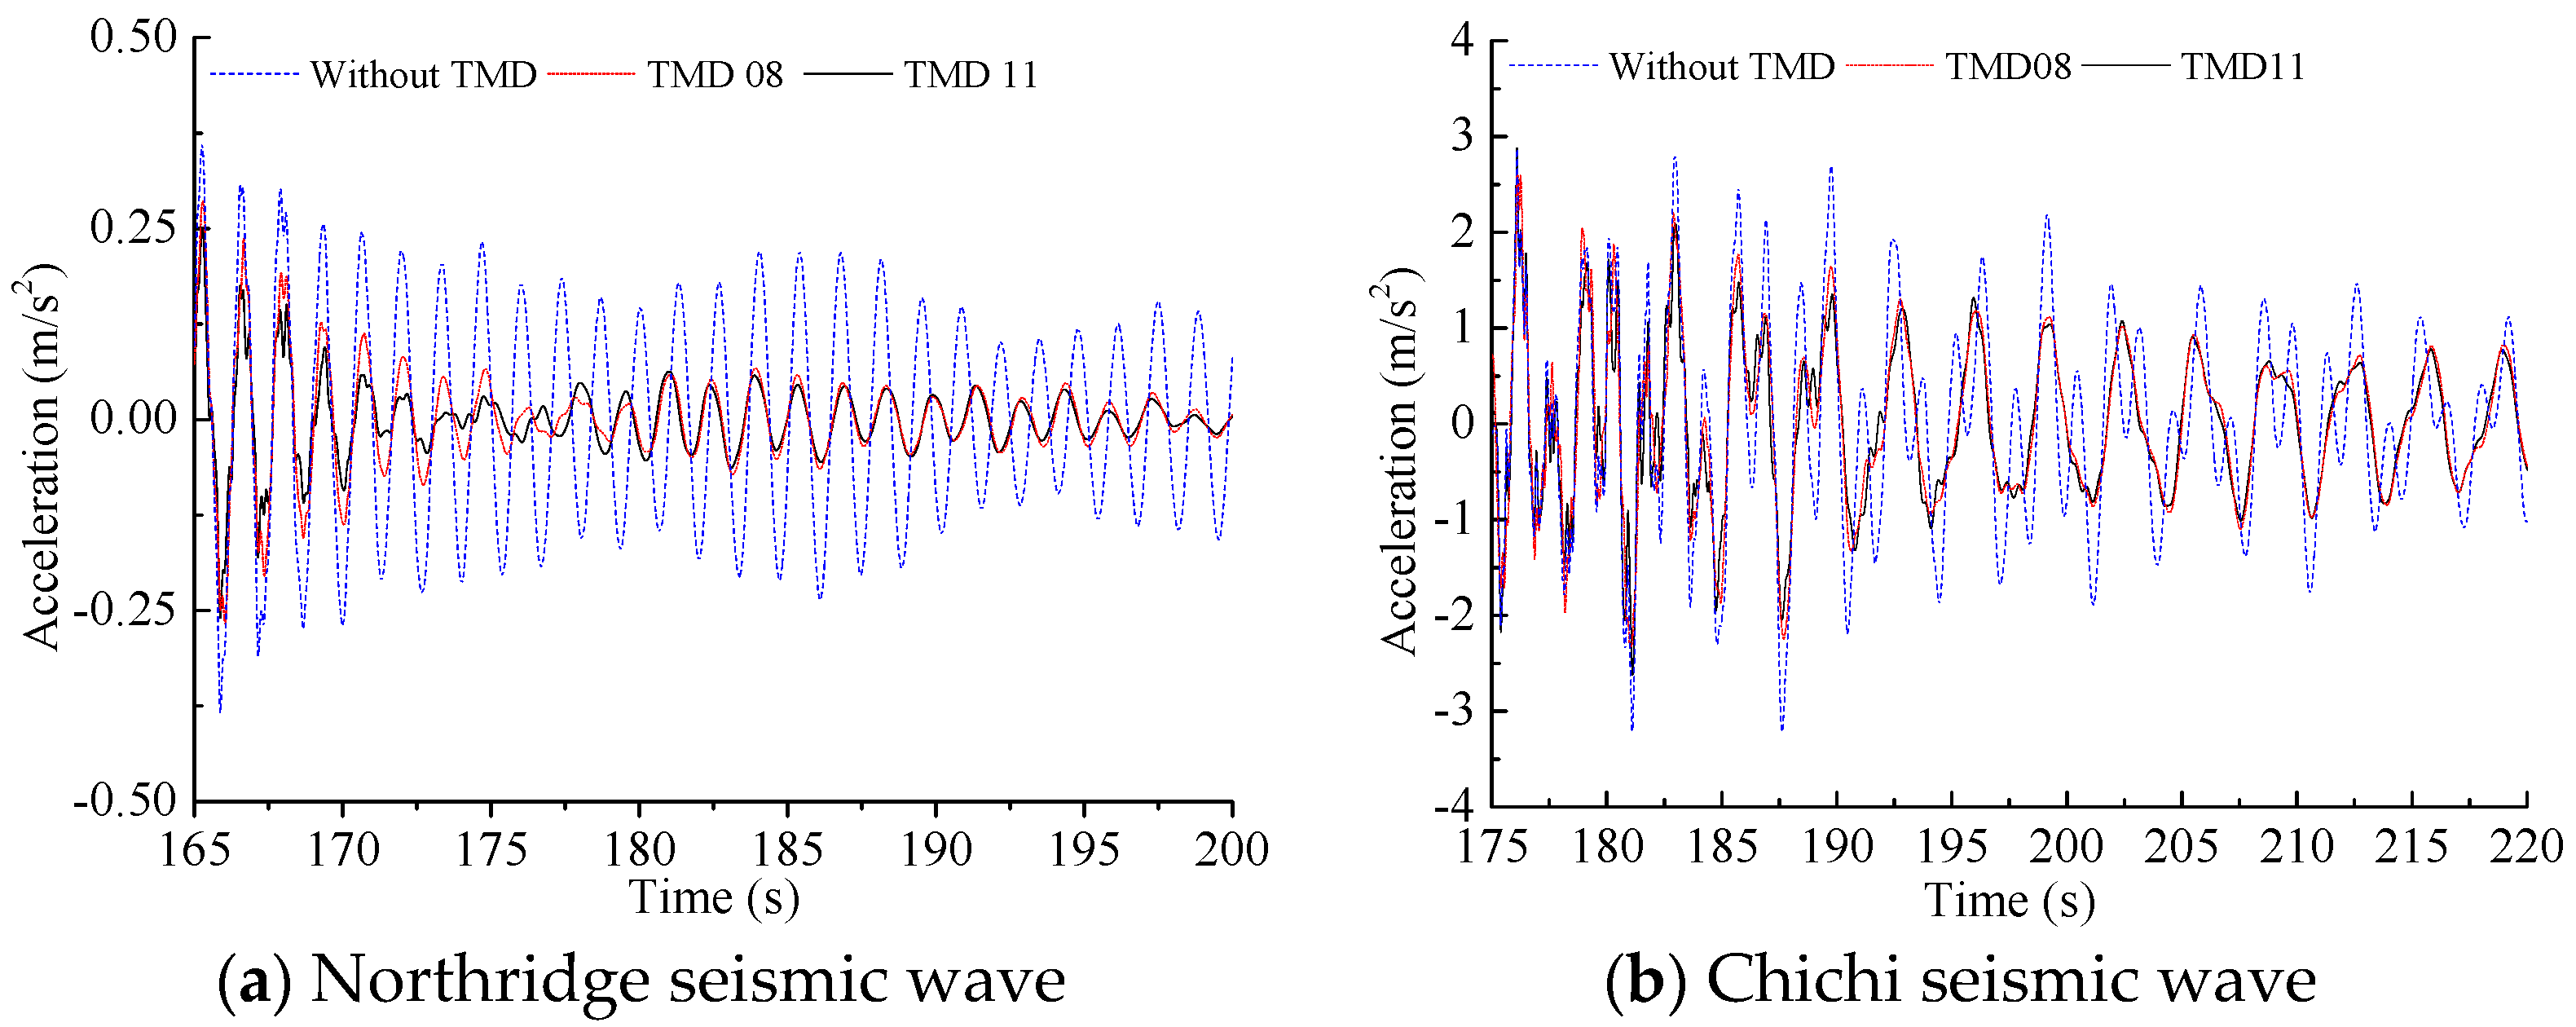
4.4.1. Control Effect of TMD on NAA under Different Seismic Excitations

Figure 15 illustrates the reduction in NAAs by the TMD under different seismic excitations. It can be seen that the reduction in NAA by TMD01 is rather insignificant under the Northridge seismic waves, unlike that under the Chichi seismic waves, as shown in Figure 15a,c. Significant decrease in the NAA is achieved by TMD07 under the Northridge seismic wave, as shown in Figure 15b. The comparison of Figure 15c,d indicates that the control effects of TMD01 and 07 under the Chichi seismic wave are nearly identical.
From the above discussions, it can be seen that the type of the seismic wave influences the control effect of TMD significantly, which can be attributed to the characteristics in the frequency domains of the responses. For the NAA under the Northridge seismic wave, the dominant frequency of the response is the second natural frequency of the OWT. However, the nearly identical control effects of TMD01 and 07 under the Chichi seismic wave can be attributed to the comparable influence of the first two natural frequencies on the NAA under the Chichi seismic wave, as shown in Figure 8.
Figure 16 compares the effectiveness of TMD1–12 under the listed load cases of Table 5 based on the reductions in the maximum values and standard deviations of the bending moment time histories. As shown in Figure 16, using TMD, diverse control effects of the OWT under different types of seismic excitations are observed; however, the effectiveness of the TMD in reducing the standard deviations are reserved, especially for the Taft seismic wave. The reduction ratio of standard deviations of the NAAs under the Taft seismic wave nearly reaches to 55%. Although TMD02 and 03 marginally reduce the responses under the El Centro seismic wave, remarkable reduction ratios are obtained under the Chichi seismic wave. Furthermore, Figure 15 illustrates that TMD07–09 can reduce the statistics under the Taft and Northridge seismic waves significantly, while a more drastic reduction is found under the Chichi seismic wave.

4.4.2. Variations in Bending Moments by TMD under Different Seismic Excitations

Reduction in mudline bending moments by TMD under different seismic excitations is shown in Figure 17. Trends similar to the control effects of TMD01 and 07 on the accelerations at the tower top can be found for the reduction in bending moments under the Chichi seismic wave. The obvious control effect of TMD10 on the bending moments under the Northridge seismic wave can be observed from Figure 17b, indicating that the tuning frequency of TMD07 is the dominant frequency of the response under that excitation. On the other hand, limited control effect of TMD01 is observed in Figure 17a due to the significant discrepancies between the tuning frequency of TMD and the dominant frequency of bending moments under the Northridge seismic wave. Furthermore, the reduction in the bending moments in Figure 17d is more distinct than the results in Figure 17c, especially in the periods of 190–250 s, indicating that under the Chichi seismic wave, more energy is captured by the second natural frequency of the OWT, as shown in Figure 9d, which is the tuning frequency of TMD07.
Variations in reduction ratios of bending moment statistics by TMD under different seismic excitations are displayed in Figure 18. From the figure, it can be seen that TMD10–12 are more effective in reducing the standard deviations of the bending moments under the Taft and Northridge seismic waves, and the maximum reduction ratio exceeds 60%. Reduction ratios decrease significantly under the Chichi seismic wave because the first two natural frequencies are both dominant frequencies of the bending moments. Only one TMD designed with one tuned frequency such as the first or the second order frequency of the OWT is installed in the OWT, which is not effective for controling the response with more than one dominant frequency.

4.5. Influence of TMD’s Mass Ratio on Vibration Control

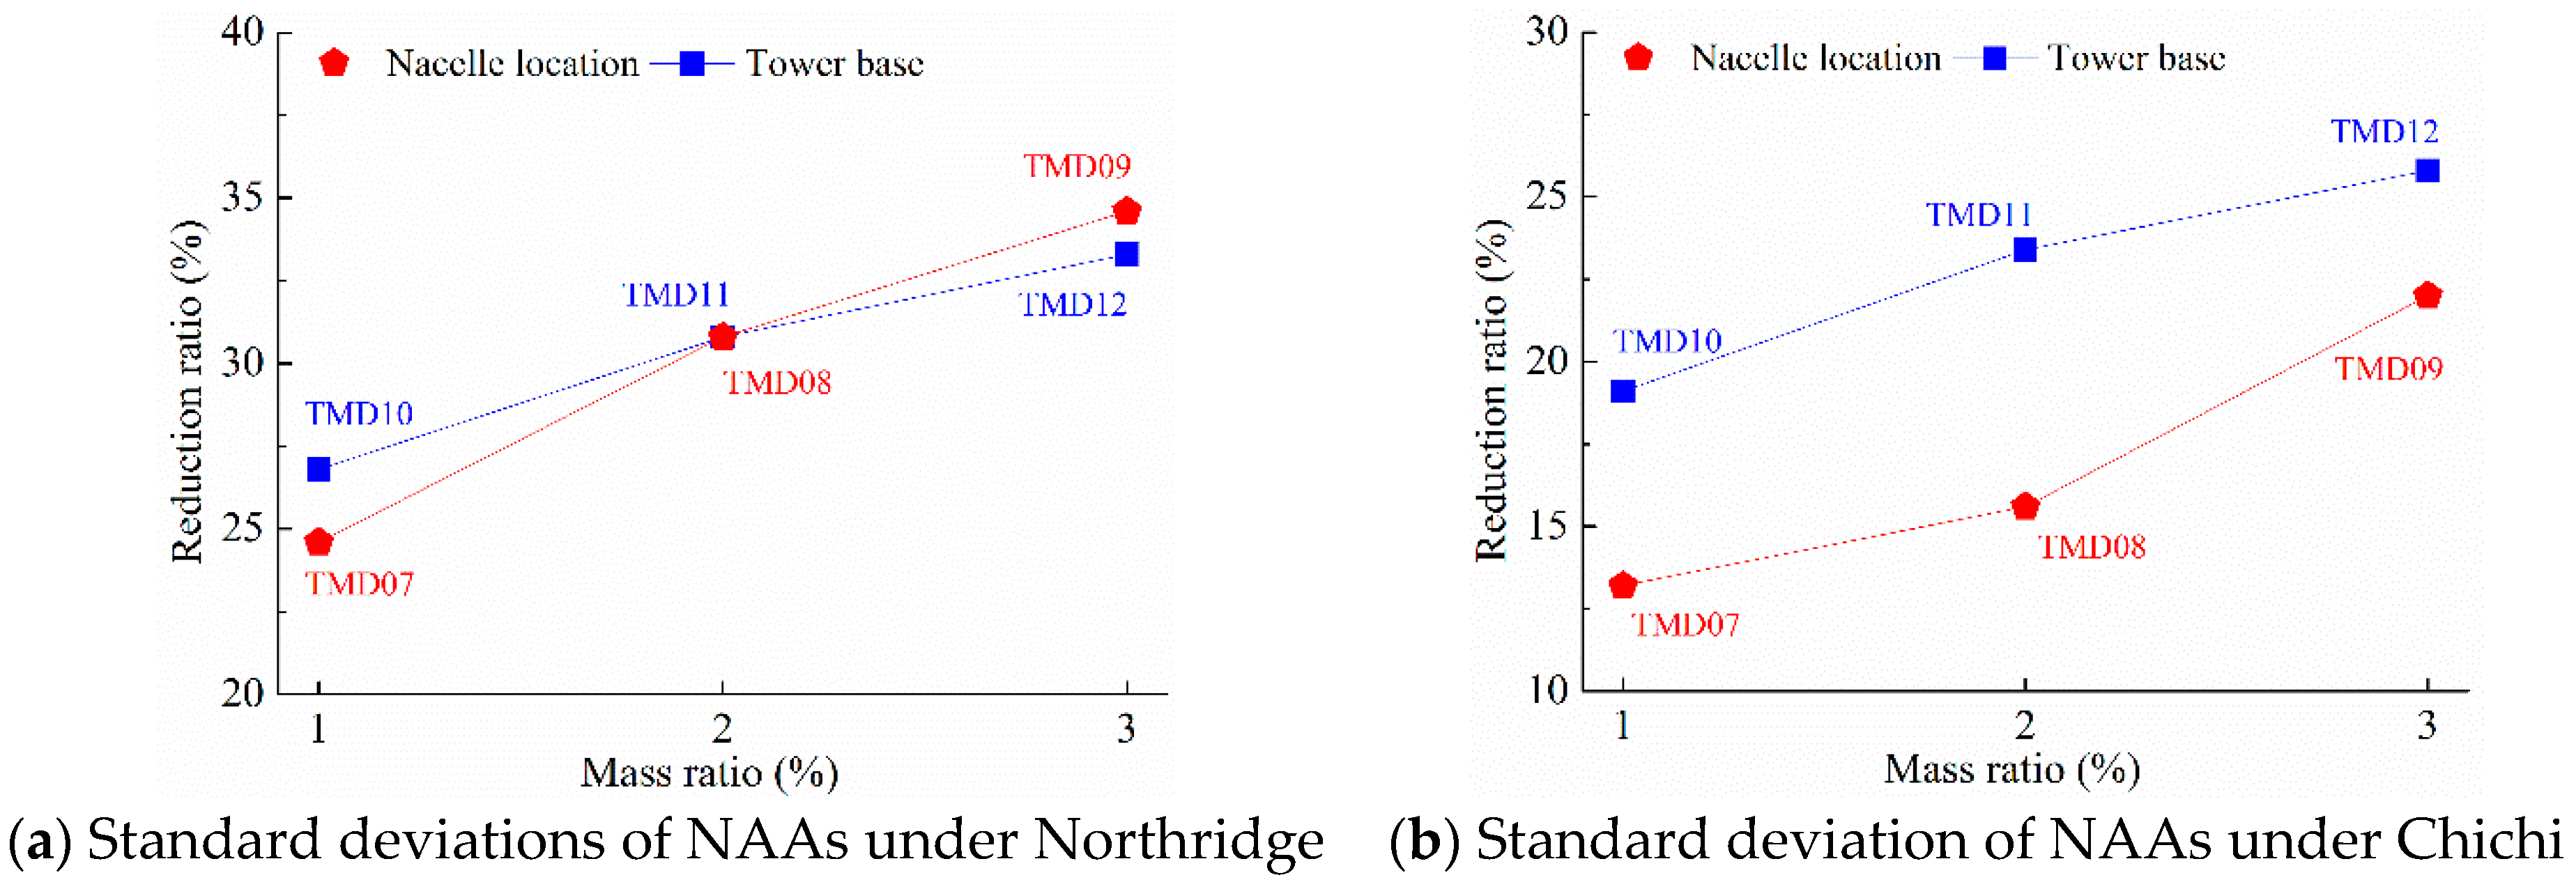
4.5.1. Influence of TMD’s Mass Ratio on the Reduction in NAAs

TMDs with different mass ratios such as 1% (TMD04, 07, 10), 2% (TMD05, 08, 11) and 3% (TMD06, 09, 12), are also considered in the study to analyze the effects of mass ratios on their control effects. Figure 19 illustrates the reduction in NAAs by TMD10 and 12 under the Taft and Chichi seismic waves. From the Figure, it can be seen that the improvements in the control effects obtained by increasing the mass of the TMD are trivial, though the mass ratio of TMD12 is increased threefold than that of TMD10, as listed in Table 4.
Figure 20 shows the variation of reduction ratio with respect to mass ratio of TMD. For the effective TMD, it is found that the achieved reduction ratios can be improved by increasing the mass ratios, however, an increase in the mass ratio of TMD cannot result in a proportional increase in the reduction ratio. From Figure 20b, the reduction ratio of the standard deviations of NAAs under the Taft seismic wave is 43.2% for TMD10 with 1% mass ratio and 52.4% for TMD12 with 3% mass ratio. Increment in the reduction ratio is only 9.2%, while the mass of the TMD is triple. For the ineffective TMD, such as for TMD04–06; it can be seen that improvements cannot be obtained in the reduction ratios by an increase in the mass ratios, such as for the reduction in the maximum values of NAAs shown in Figure 20a.

4.5.2. Influence of TMD’s Mass Ratio on the Reduction in Bending Moments

Influence of TMD with increased mass on the reduction in bending moments under the Taft and Chichi seismic waves can be observed from Figure 21. The results similar to the reduction in NAAs under the same load cases can be obtained for the reduction in bending moments. The expected control effects cannot be achieved only by increasing the mass ratios of the TMD, especially under the Chichi seismic wave.
The influence of TMD’s mass ratio on the reduction in bending moments can be observed from Figure 22. Remarkable control effects of TMD10–12 on the standard deviations of bending moments under the El Centro, Taft, and Northridge seismic waves can be found. The reduction ratio of the standard deviations by TMD10 and 12 under the Taft seismic wave were 51.8% and 61%, respectively. However, the achieved increment in the reduction ratio of bending moments was only 9.2% for a triple increase in the mass ratio of TMD.

4.6. Influence of TMD’s Location on Vibration Control

4.6.1. Influence of TMD’s Location on the Reduction of NAAs

As shown in Figure 23, TMD08 and 11 are selected to demonstrate the influence of TMD’s location on its control effects. It can be observed that the TMD mounted at the nacelle (TMD08) or tower base (TMD11) decreases the NAAs under the Northridge seismic wave remarkably, as shown in Figure 23a. Meanwhile, according to Figure 22b, the control effects are limited by comparing with the reducing of the NAAs under the El Centro seismic wave, but the comparable control effects of the selected TMD08 and 11 under the Chichi seismic wave still can be discovered. So the nacelle and tower base would be the alternative optimal locations for the TMD to control the NAAs under such seismic waves.
The reduction ratios of standard deviations of NAAs are illustrated in Figure 24. From Figure 24a, the reduction ratios of the standard deviations for the TMD installed at tower base or nacelle under the Northridge seismic wave are close for the corresponding cases such as TMD07 and 10, TMD08 and 11, TMD09 and 12. So the control effects are approximately same for the selected TMD’s locations. According to Figure 24b, the reduction ratios of the standard deviations are different. For the corresponding cases, the reduction ratios achieved by TMD08 and 11 under such seismic case are about 15.6% and 23.4%, respectively. Hence, the tower base is a more appropriate location than the nacelle for mounting the TMD under the Chichi seismic wave.

4.6.2. Influence of TMD’s Location on Reduction in Bending Moments

The influence of TMD’s location on the reducing of the bending moment under the Northridge and Chichi seismic wave is shown in Figure 25. According to the comparisons shown in Figure 25a,b, it can be seen that approximately identical with the reducing of the nacelle accelerations under the selected seismic waves, the comparable control effects of TMD 08 and 11 on the bending moment under such seismic cases are also observed.
Meanwhile, the reduction ratios of the relevant statistics under such seismic cases by TMDs with varying locations are shown in Figure 26. From Figure 26a, the reduction ratios of the standard deviations of the response under the Northridge seismic wave achieved by TMD08 and 11 are about 27.2% and 39.7%, respectively. The reduction ratios of the standard deviations achieved by TMD09 and 12 are about 26.6% and 42.4%, respectively. Thus, the tower base is the more feasible location for the control of the mudline bending moment by TMD under such seismic wave.
Similarly, under the Chichi seismic wave, the location of TMD07–09 improved the reduction in the bending moment, as shown in Figure 26b. The reduction ratios of standard deviations achieved by TMD11 is about 18.6%, which increased approximately 6.2% by changing the location of TMD from nacelle for TMD08 to the tower base. So the locations of the TMD influence the control effects significantly.
Therefore, both the nacelle and tower base are the appropriate places to mount the TMD to control the motion of the OWT under earthquakes. Furthermore, the control effects of the OWT response by TMDs mounted at the tower base are better than the ones at the nacelle.

4.7. Influence of TMD’s Tuning Frequency on Vibration Control

4.7.1. Influence of TMD’s Tuning Frequency on the Reduction in NAAs

The tuning frequency of TMD is another essential parameter that should be emphasised in the design of TMD. TMDs listed in Table 4 are selected to perform the investigation on the influence of TMD’s tuning frequency on its control effects. From the table, the TMDs are divided into two categories by the tuning frequencies. One is that the tuning frequency is the fundamental frequency of the OWT such as TMD01–03 and TMD07–09; the other is that the TMDs designate the second order natural frequency of the OWT as the tuning frequency such as TMD04–06 and TMD10–12.
The influence of the tuning frequency on the control effects of OWT under earthquakes are shown in Figure 27. The significant discrepancies of the control effects between the TMDs with different tuning frequencies is observed. From Figure 27a, the control effects of TMD03 under El Centro seismic wave improved significantly by changing its tuning frequency from the fundamental frequency of the OWT to the second order frequency, and the reduction ratios of the standard deviations achieved by TMD03 was increased from 12% to about 41.3%. Approximate improvements can also be discovered from TMD04–06 and TMD10–12 under such seismic waves. So an effective method to improve the limited control effects TMD01–06 is to adjust the tuning frequencies of such TMDs from the fundamental frequency to the second order natural frequency of the OWT.
From Figure 27b,c, the reduction ratio of the standard deviations under the Northridge seismic wave achieved by TMD03 and 09 were about 10.7% and 33.3%, respectively; the reduction ratio of the standard deviations under the Taft seismic wave achieved by TMD03 and 09 were about 5.8% and 42.7%, respectively. On the other hand, different from the above introduced seismic cases, it can be discovered the comparable control effects of TMD01–03 and TMD07–09 on the NAAs under the Chichi seismic wave, as shown in Figure 27d. So both the first two natural frequencies of the OWT are the feasible tuning frequencies under such seismic case.

4.7.2. Influence of TMD’s Frequency on the Reduction in Bending Moment

Figure 28 shows the influence of the TMD’s tuning frequency on the reduction of the bending moment under the different seismic cases. From the Figure, the prominent control effects of the TMDs are discovered when the second natural frequency of the OWT is designated as the tuning frequency. Reduction ratios of standard deviations achieved by TMD12 and 06 under the El Centro seismic wave were about 50.3 and 3.8%, respectively, as shown in Figure 28a. Although an optimum location and prominent mass ratio are selected in the design of TMD06, the control effects on the bending moments are trivial due to the discrepancy in the tuning frequency. If the tuning frequency of TMD06 is adjusted from the fundamental frequency of the OWT to the second natural frequency, the increments in the reduction ratio can reach 45%. Same tuning frequencies can also be applied to the TMD under the Northridge seismic wave, according to Figure 28b. It can be seen that the reduction ratios of bending moments achieved by TMD12 and 06 are 42.4% and 7.5%, respectively. Meanwhile, the same results can be obtained for TMD01–03 and TMD07–09 under the El Centro, Northridge and Taft seismic wave.
On the other hand, it should also be noted that limited control effects of TMD are observed under the Chichi seismic wave by comparing with reducing of the responses under the other seismic cases, as shown in Figure 28d. From Figure 9d, it can be seen that in addition to the second natural frequency, the influence of the fundamental frequency of the OWT is also non-negligible under such seismic load cases. Hence, a TMD with single tuning frequency cannot effectively control the vibration of the OWT under the Chichi seismic wave.

5. Conclusions

Based on the integrated analysis model, the structural responses and dynamic characteristics of a Pentapod OWT under seismic excitations are studied. The influence of the rotor and the activation of higher-order modes of the OWT under seismic excitations can be observed. Further, a TMD is mounted on the OWT to control the structural responses under different seismic excitations. From the research, the following conclusions can be drawn:
(1)
From the results that the mudline bending moments are influenced by the mode of the rotor blade, the influence of the rotor system on the motion of the support system cannot be neglected in the seismic analysis of OWTs. Thus, it is of necessity to establish the integrated model of the OWT to obtain reasonable structural responses under earthquakes.
(2)
For the tower accelerations, the seismic excitations can stimulate higher-order frequency components and it can become the dominant frequency for the structural responses, especially for the seismic waves with abundant frequencies around the natural frequencies of OWTs, such as the Northridge seismic wave.
(3)
Using TMD, the influences of the PGA and type of seismic excitation on the control effects of the OWT are investigated. It can be observed that these parameters of the input seismic wave can influence the control effects of TMD remarkably.
(4)
The parameters of TMD, such as the tuning frequency and location, are more essentials than the mass ratio in the design of TMD. The higher-order dominant frequencies are proved as the more effective tuning frequencies for reducing the structural responses of the OWT under seismic excitations; e.g., TMD tuned with the second natural frequency of the OWT can achieve more effective control than the TMD tuned with the fundamental frequency.
(5)
The locations of TMD installed in nacelle or tower base are validated as the appropriate locations to control the nacelle accelerations and bending moments of the OWT.
(6)
The studies prove that the control effects of the TMD can be improved by increasing the mass of the TMD only when an effective tuning frequency and location are adopted.
(7)
Limited control effects of TMDs are observed when the structural responses are composed of multi-dominant frequencies, such as the nacelle accelerations and bending moments under the Chichi seismic wave. Additional tuning frequencies or more TMDs may be necessary to achieve significant control effects under such load cases.

Author Contributions

W.W.: Writing and data collection; X.L.: Data analysis, interpretation and revising; Z.P.: Figures and tables; Z.Z.: Numerical analysis and revising.

Funding

This research was funded by National Natural Science Foundation of China [Grant No. 51879040].

Acknowledgments

The authors would like to acknowledge the support from the National Natural Science Foundation of China (Grant No. 51879040).

Conflicts of Interest

The authors declare no conflict of interest.

References

  1. Bazeos, N.; Hatzigeorgiou, G.D.; Hondros, I.D.; Karamaneas, H.; Karabalis, D.L.; Beskos, D.E. Static, seismic and stability analyses of a prototype wind turbine steel tower. Eng. Struct. 2002, 24, 1015–1025. [Google Scholar] [CrossRef]
  2. Witcher, D. Seismic analysis of wind turbines in the time domain. Wind Energy 2005, 8, 81–91. [Google Scholar] [CrossRef]
  3. Häenler, M.; Ritschel, U.; Warnke, I. Systematic modelling of wind turbine dynamics and earthquake loads on wind turbines. In Proceedings of the European Wind Energy Conference and Exhibition 2006, EWEC 2006, Athens, Greece, 27 February–2 March 2006. [Google Scholar]
  4. Zhao, X.; Maisser, P. Seismic response analysis of wind turbine towers including soil-structure interaction. Proc. Inst. Mech. Eng. Part K J. Multi-Body Dyn. 2006, 220, 53–61. [Google Scholar] [CrossRef]
  5. Riziotis, V.A.; Madsen, H.A. Wind Energy Systems: Optimising Design and Construction for Safe and Reliable Operation; Woodhead Publishing Limited: Shaston, UK, 2010. [Google Scholar]
  6. Prowell, I. An Experimental and Numerical Study of Wind Turbine Seismic Behavior. Ph.D. Thesis, University of California, San Diego, CA, USA, 2011. [Google Scholar]
  7. Prowell, I.; Elgamal, A.; Uang, C.M.; Enrique Luco, J.; Romanowitz, H.; Duggan, E. Shake table testing and numerical simulation of a utility scale wind turbine including operational effects. Wind Energy 2014, 17, 997–1016. [Google Scholar] [CrossRef]
  8. Zheng, X.Y.; Li, H.; Rong, W.; Li, W. Joint earthquake and wave action on the monopile wind turbine foundation: An experimental study. Mar. Struct. 2015, 44, 125–141. [Google Scholar] [CrossRef] [Green Version]
  9. Wang, W.H.; Gao, Z.; Moan, T.; Li, X. Model Test of an Offshore Bottom Fixed Pentapod Wind Turbine under Seismic Loads. In Proceedings of the International Conference on Ocean, Offshore and Arctic Engineering, Busan, Korea, 19–24 June 2016. [Google Scholar]
  10. Wang, W.H.; Gao, Z.; Moan, T.; Li, X. Model Test and Numerical Analysis of a Multi-pile Offshore Wind Turbine under Seismic, Wind, Wave and Current Loads. J. Offshore Mech. Arct. Eng. 2016, 139, 031901. [Google Scholar] [CrossRef]
  11. Penzien, J.; Kaul, M.K.; Berge, B. Stochastic response of offshore towers to random sea waves and strong motion earthquakes. Comput. Struct. 1972, 2, 733–756. [Google Scholar] [CrossRef]
  12. Kim, D.H.; Lee, S.G.; Lee, I.K. Seismic fragility analysis of 5 MW offshore wind turbine. Renew. Energy 2014, 65, 250–256. [Google Scholar] [CrossRef]
  13. Nuta, E.; Christopoulos, C.; Packer, J.A. Methodology for seismic risk assessment for tubular steel wind turbine towers: application to Canadian seismic environment. Can. J. Civ. Eng. 2011, 38, 293–304. [Google Scholar] [CrossRef]
  14. Sadowski, A.J.; Camara, A.; Málaga-Chuquitaype, C.; Dai, K. Seismic analysis of a tall metal wind turbine support tower with realistic geometric imperfections. Earthq. Eng. Struct. Dyn. 2017, 46, 201–219. [Google Scholar] [CrossRef]
  15. Stewart, G.; Lackner, M.A. Offshore wind turbine load reduction employing optimal passive tuned mass damping systems. IEEE Trans. Control Syst. Technol. 2013, 21, 1090–1104. [Google Scholar] [CrossRef]
  16. Dinh, V.N.; Basu, B. Passive control of floating offshore wind turbine nacelle and spar vibrations by multiple tuned mass dampers. Struct. Control Health Monit. 2015, 22, 152–176. [Google Scholar] [CrossRef]
  17. Colwell, S.; Basu, B. Tuned liquid column dampers in offshore wind turbines for structural control. Eng. Struct. 2009, 31, 358–368. [Google Scholar] [CrossRef]
  18. Jonkman, J.M.; Buhl, M.L., Jr. FAST User’s Guide; Technical Report No. NREL/EL-500-38230; National Renewable Energy Laboratory: Golden, CO, USA, 2005.
  19. Jonkman, J.; Butterfield, S.; Musial, W.; Scott, G. Definition of A 5-MW Reference Wind Turbine for Offshore System Development; Technical Report No. NREL/TP-500-38060; National Renewable Energy Laboratory: Golden, CO, USA, 2009.
  20. DNV GL. DNV GL-ST-0126: Support Structures for Wind Turbines; DNV GL: Oslo, Norway, 2018. [Google Scholar]
  21. DNV GL. DNV GL-ST-0437: Loads and Site Conditions for Wind Turbines; DNV GL: Oslo, Norway, 2016. [Google Scholar]
  22. IEC. IEC 61400-1: Wind Turbine-Part 1: Design Requirements; IEC: Geneva, Switzerland, 2012. [Google Scholar]
  23. Cava, L.W.; Lackner, M.A. Theory Manual for the Tuned Mass Damper Module in FAST v8; Technical Report; University of Massachusetts: Amherst, MA, USA, 2015. [Google Scholar]
  24. Zhou, F.L. Structural Motion Control in Civil Engineering; Seismological Press: Beijing, China, 1997. [Google Scholar]
  25. Connor, J.J. Introduction to Structural Motion Control; Prentice Hall: Upper Saddle River, NJ, USA, 2003. [Google Scholar]
Figure 1. Recompiled integrated seismic analysis model of offshore wind turbine (OWT) in FAST.
Jmse 07 00224 g001
Figure 2. The global coordinate system in FAST.
Jmse 07 00224 g002
Figure 3. Dimensions of the reference OWT.
Jmse 07 00224 g003
Figure 4. Schematic of the integrated analysis model of the reference OWT under earthquakes.
Jmse 07 00224 g004
Figure 5. Measured seismic excitations.
Jmse 07 00224 g005
Figure 6. Free decay test of the reference OWT.
Jmse 07 00224 g006
Figure 7. Dynamic amplification factors (DAFs) along the tower height under seismic excitations.
Jmse 07 00224 g007
Figure 8. Fourier amplitudes of nacelle and tower accelerations under seismic excitations.
Jmse 07 00224 g008
Figure 9. Mudline bending moments under seismic excitations.
Jmse 07 00224 g009
Figure 10. Schematic of the alternative locations for the tuned mass dampers (TMD) mounted on the OWT.
Jmse 07 00224 g010
Figure 11. Reduction in nacelle acceleration (NAA) by TMDs under El Centro seismic wave.
Jmse 07 00224 g011
Figure 12. Reduction ratios of NAAs by TMDs under El Centro seismic wave.
Jmse 07 00224 g012
Figure 13. Reduction in bending moments by TMDs under El Centro seismic wave.
Jmse 07 00224 g013
Figure 14. Reduction ratios of bending moments by TMD under El Centro seismic wave.
Jmse 07 00224 g014
Figure 15. Reduction in NAAs by TMDs under different seismic excitations.
Jmse 07 00224 g015
Figure 16. Reduction ratios of standard deviations of NAAs by TMDs under different earthquakes.
Jmse 07 00224 g016
Figure 17. Reduction in bending moments by TMDs under different seismic excitations.
Jmse 07 00224 g017
Figure 18. Reduction ratios of standard deviations of bending moments under earthquakes by TMD.
Jmse 07 00224 g018
Figure 19. Reduction in NAAs by TMDs under Taft and Chichi seismic waves.
Jmse 07 00224 g019
Figure 20. Reduction ratios of statistics of the NAAs under Taft seismic waves.
Jmse 07 00224 g020
Figure 21. Reduction in bending moments by TMDs under Taft and Chichi seismic waves.
Jmse 07 00224 g021
Figure 22. Reduction ratios of statistics of bending moments under Taft seismic waves.
Jmse 07 00224 g022
Figure 23. Reduction in NAAs by TMDs under Northridge and Chichi seismic waves.
Jmse 07 00224 g023
Figure 24. Reduction ratios of the NAAs under Northridge and Chichi seismic waves.
Jmse 07 00224 g024
Figure 25. Reduction in bending moments by TMDs under Northridge and Chichi seismic waves.
Jmse 07 00224 g025
Figure 26. Reduction in bending moments under Northridge and Chichi seismic waves.
Jmse 07 00224 g026
Figure 27. Reduction ratios of NAAs under El Centro and Northridge seismic waves.
Jmse 07 00224 g027
Figure 28. Reduction ratios of bending moments under seismic excitations.
Jmse 07 00224 g028
Table 1. Load cases for the seismic analysis of offshore wind turbine (OWT).
Seismic WavesPGA (g)StateWinds and WavesSeismic Direction
El Centro0.21Parked-In F-A direction
Taft0.16Parked-In F-A direction
Northridge0.13Parked-In F-A direction
Chichi0.37Parked-In F-A direction
Table 2. Natural frequencies of the integrated analysis model of the reference OWT in FAST.
Order of the FrequencyValues (Hz)Note
1st OWT0.305In F-A direction
1st Flap0.690First blade collective flap mode
2nd OWT0.742In F-A direction
3rd OWT1.544
4rd OWT1.824
2nd Flap2.029Second blade collective flap mode
5th OWT2.521In F-A direction
6th OWT3.640
7th OWT4.620
Table 3. Maximum values of the nacelle and tower acceleration time histories.
Maximum ValuesSeismic Excitations
El CentroTaftNorthridgeChichi
Peak ground acceleration (PGAs) (m/s2)2.061.571.273.63
Nacelle acceleration (NAAs) (m/s2)1.580.970.752.87
DAF of NAA0.770.620.59 0.79
Acceleration at the tower top (TTAs) (m/s2)4.662.826.847.28
DAF of TTA2.261.805.392.01
Maximum acceleration along the height of the tower (MTAs) (m/s2)5.823.628.089.29
DAF of MTA2.83 2.31 6.36 2.56
Table 4. Optimized parameters of tuned mass dampers (TMD) for the vibration control of OWT under seismic excitations.
TMD No.Optimised ParametersParameters of TMDTMD Location
μm (%)foptζoptMTMD (kg)fTMD (Hz)KTMD (N/m)CTMD (N/ms−1)
TMD 011.00.9930.0514,8970.30352,1482787Nacelle
TMD 022.00.9850.0729,7950.300102,7697826
TMD 033.00.9780.0944,6920.298151,92314,272
TMD 041.00.9930.0514,8970.30352,1482787Tower base
TMD 052.00.9850.0729,7950.300102,7697826
TMD 063.00.9780.0944,6920.298151,92314,272
TMD 071.00.9930.0514,8970.736311,3156810Nacelle
TMD 082.00.9850.0729,7950.734613,51819,120
TMD 093.00.9780.0944,6920.726906,96234,871
TMD 101.00.9930.0514,8970.736311,3156810Tower base
TMD 112.00.9850.0729,7950.734613,51819,120
TMD 123.00.9780.0944,6920.726906,96234,871
Table 5. Load cases for the vibration control of OWT under earthquake load.
Case No.Seismic excitationState of OWTTMD No.
T1–T12El Centro (0.1 g)ParkedTMD01–12
T13–T24El Centro (0.15 g)TMD01–12
T25–T36El Centro (0.2 g)TMD01–12
T37–T48El Centro (0.4 g)TMD01–12
T49–T60Taft TMD01–12
T61–T72NorthridgeTMD01–12
T73–T84ChichiTMD01–12

