Article

Coastal Processes and Influence on Damage to Urban Structures during Hurricane Irma (St-Martin & St-Barthélemy, French West Indies)

1
UMR GRED, University Paul-Valéry-Montpellier, CEDEX 5, 3–34199 Montpellier, France
2
DIRAG, Météo-France–Fort-de-France CEDEX, 97262 Martinique, France
3
LARGE, University of the French West Indies, Pointe à Pitre, 97157 Guadeloupe, France
J. Mar. Sci. Eng. 2019, 7(7), 215; https://doi.org/10.3390/jmse7070215
Submission received: 5 April 2019 / Revised: 25 June 2019 / Accepted: 28 June 2019 / Published: 12 July 2019
(This article belongs to the Special Issue Storm Erosion)

Abstract

:
This study aims to better understand coastal processes associated with extreme cyclonic events through the study of the coastal changes, flooding and damage that resulted from the passage of a category 5 hurricane (Irma) on 6 September 2017 over the islands of Saint-Martin and Saint-Barthélemy in the Lesser Antilles. Hurricane Irma was contextualized from tropical cyclone track data and local weather observations collected by Météo-France, as well as high-resolution numerical modelling. Field work involved the study of accretion coasts through qualitative observations, topo-morphological and sedimentary surveys, as well as image acquisition with Unmanned Aerial Vehicle (UAV) surveys during two trips that were made 2 and 8 months after the catastrophe. Wave propagation and flood numerical models are presented and compared to field data. Our field analysis also reports on the devastating impacts of storm surges and waves, which reached 4 and 10 meters height, respectively, especially along east-facing shores. The approaches reveal a variety of morpho-sedimentary responses over both natural and highly urbanized coasts. The analysis shows the effects of coastal structures and streets on flow channeling, on the amplification of some erosion types, and on water level increase. Positive spatial correlation is found between damage intensity and marine flood depth. The signatures of ocean-induced damage are clear and tend to validate the relevance of the intensity scale used in this study.

1. Introduction

Small tropical islands are often exposed and vulnerable to extreme events such as tropical cyclones, tsunamis, earthquakes and others [1,2,3]. These extreme events, interacting with exposed and vulnerable human and natural systems can lead to disasters [4]. The catastrophic events capture both political and public attention. Their effects highlight the root causes of the vulnerability of these territories: geographic isolation, exiguity, economic discrepancies, socio-spatial segregation, coastal vulnerability [5,6,7]. On 6 September 2017, Hurricane Irma devastated the islands of Saint-Martin and Saint-Barthélemy in the northern Lesser Antilles. The islands are located in a region of already serious hurricane threat [8,9]. Such an extreme event is an opportunity to collect new data describing the effects of a category 5 hurricane on coastal systems and urban structures. Six weeks after Hurricane Irma’s landfall, an assessment of its impacts was conducted along the beaches of Saint-Martin and Saint-Barthélemy Islands and highlighted the large variability in their nature and severity. The initial evaluation was completed in May 2017.
Firstly, in order to better understand flood dynamics, we produced a wave propagation and flood model that was used to quantify and map the impacts of Hurricane Irma on Saint-Martin and Saint-Barthélemy. We also produced maps based on surge, wave and flood data obtained using topographic and morpho-sedimentary marks observed along the coast [10,11,12]. Indeed, coastal flooding is a common consequence of hurricanes, affecting first and foremost low-lying fractions of the coast and sometimes overtopping or even breaching dikes and dunes [12,13,14,15]. On the other hand, flood genesis and dynamics are sometimes confusing, straying far from predefined scenarios [16,17]. In addition, meteorological data allow characterizing Hurricane Irma’s intensity and the distribution of the strongest winds.
Secondly, Hurricane Irma severely impacted the coast itself. It produced numerous effects on coastal environments, and the characteristics thereof raise several questions: what are the morphodynamic and sedimentary responses of the coast to extreme marine meteorological forces? How do these responses manifest themselves? Are there any differences between the responses of developed and natural coasts? Are Hurricane Irma’s effects likely to lead to tipping points or radical splits in coastal systems? These questions have spawned a prolific amount of studies that move us away from any determinism or fatalism [14,18,19,20]. In order to address these questions, we analyzed coastal changes (coastline variability, beach recovery, etc) and ecosystems (resistance of species to wind and waves).
Lastly, 95% of the buildings were damaged on Saint-Martin [21]. However, damage evaluation methods differ between mapping services (Copernicus, SERTIT), resulting in large uncertainties. Using innovative methods, we carry out damage evaluation at high spatial resolution and propose to combine the types of damage resulting from either sea or wind hazards with an adapted typology [22].
The underestimation of the effects of hurricanes, and occasionally the incorrect knowledge thereof, as well as recurrent lack of preparation and prevention encourage us to analyze these extreme events and their impacts on small islands [23], with a focus on Hurricane Irma’s landfall over two islands in the French West Indies.

2. Study Area

The island of Saint-Martin, located in the northern part of the Lesser Antilles, is a small island split into two political entities: on one side, Sint Maarten, belonging to the Netherlands; on the other, Saint-Martin, belonging to France (Figure 1). The island covers 90 km2, 50 of which are on the French side. Since the early 1980s, the island has experienced rapid demographic growth. The population was estimated at over 73,000 in 2015 by INSEE and the Department of Statistics Sint Maarten, whereas it was less than 22,000 in 1982. The French population amounted to 35,941 people in 2014, versus 8072 in 1982.
Over the last few decades, demographic pressure in the coastal areas of Saint-Martin has increased accordingly. Urban development has grown denser, and several neighborhoods have appeared from scratch without any kind of real estate planning or respect of construction norms.
Saint-Martin island has a diversified topography with hills, dry valleys, coastal plains and steep bays. The highest point is Paradise Peak, at 411 meters (Figure 1). The Terres-Basses peninsula is connected to the main island mass by two tombolos that surround Simpson Bay Lagoon. The coastline has an irregular morphology and topography: rocky shores make up 2/3 of the island, with the rest being characterized by pocket beaches [5]. Low-elevation coastal zones are mainly characterized by small beach barrier systems which are prone to natural hazards because of topo-morphological characteristics (Table A1). Extreme waves often have enough energy to overtop the dune crest because the height of its dunes rarely exceed 4 meters (Table A1).
The seafloor around the island consists of a rocky shelf. Maximum depth over the shelf does not exceed 30 meters, which suggests possible suspension of inert sediments by long-period waves. This seafloor is home to coral populations that are concentrated on the northeastern side of the island.
The island of Saint-Barthélemy mainly consists of underwater volcanic deposits covered by Eocene limestone. This dry rocky pebble of an island covers 25 km2 and forms a V that is open northwards (Figure 2). In 2015, the population was estimated at 9625 people, with an average density of 458 inhabitants/km2 [24]). It is unevenly distributed across the island, with most people living near the coast. The rocky coastline of the southeast is free of any continuous urban development.
The steep hills do not exceed 300 meters (the highest point is Morne de Vitet at 286 m, see Figure 2). Coastal plains are small and comprise several ancient lagoons that may have been transformed into salt marshes in the past. Some beaches are protected by a barrier reef farther offshore. The longest beaches are located in the north (See Figure 2: Flamands Bay, Cayes Bay, Sint Jean Bay, Lorient Bay, Grand-Cul-de-Sac Bay), while those in the south, on the windward side, are smaller and consist of coarser, more heterogeneous material (Toiny Bay, Governor Bay). As Saint Martin island, coasts are highly vulnerable to extreme events because of intrinsic characteristics (topography, geomorphology) and human induced pressures. Some mangroves are scattered around the lagoons (Grand Étang, Grand Saline, Sint Jean Bay) and at the edge of well-sheltered beaches such as Grand Cul-de-Sac (Figure 2). Other coastal plant species are also present, such as Sesuvium portulacastrum (or sea purslane) and Scaevola taccada, an invasive introduced species.
Dominant winds and waves for both Saint-Martin and Saint-Barthélemy are from the east-northeast and the southeast. Wave heights generally range from 1 to 2 meters with short periods of 4 to 6 seconds. These islands are also exposed to swells coming from the north/northeast, with peak periods larger than 10s and significant wave heights over 2 m (e.g., [24]. The islands are microtidal, with a mixed tide yet a pronounced diurnal component.

3. Hurricane Characteristics

The 2017 hurricane season in the Atlantic was exceptional in several ways. It witnessed the landfall of two category-5 hurricanes over the Lesser Antilles in less than two weeks in September 2017, which was unprecedented since the beginning of meteorological records in 1850. On the one hand, Irma was the strongest Atlantic hurricane ever recorded outside of the Caribbean Sea and Gulf of Mexico, with peak maximum sustained winds (MSW) of 287 km/h [25]. On the other hand, Hurricane Maria experienced rapid intensification from category 1 to 5 in only 15 hours, a feature only matched by Hurricane Wilma in 2005. Furthermore, category-4 Hurricane Jose severely disturbed rescue operations in Saint-Martin and Saint-Barthélemy when approaching the islands only 3 days after Irma’s landfall. And last but not least, category-4 Hurricane Harvey beat an all-time rainfall record with 1318 mm in August 2017, severely impacting the Houston, Texas region.
The islands of Saint-Martin and Saint-Barthélemy, despite Irma’s record-breaking intensity, are located in a region where serious hurricane threat was identified before Irma [8,9]. Since 1945 and the beginning of U.S. reconnaissance flights over potentially hazardous tropical cyclones (tropical depressions, tropical storms and hurricanes, hereafter TCs), which markedly improved the monitoring and description of Atlantic TCs, the northern Lesser Antilles around Saint-Martin and Saint-Barthélemy have typically been crossed by ~3 TCs per decade, a rather moderate level of TC activity (Figure 3a,b). Indeed, this area lies at the western end of the so-called TC Main Development Region (MDR), an east-west oriented corridor in the tropical North Atlantic where easterly tropical waves from Africa develop into so-called Cape-Verde TCs that eventually reach the Caribbean and North America [26]. The MDR is characterized by TC frequency of up to 4–5 per decade, i.e., similar to that reached in the Gulf of Mexico and western Caribbean Sea, but lower than that off the U.S. East Coast, which reach 6-7 TCs per decade (Figure 3a).
On a regional scale, TC activity near Saint-Martin and Saint-Barthélemy is similar to most islands in the Lesser Antilles, although a general trend of increasing TC frequency with latitude may be distinguished in the best-track data, with the highest levels found to the north and east of Saint-Martin and Saint-Barthélemy (Figure 3b).
However, most Atlantic TCs do not develop into hurricanes and stay at storm level, with generally limited impacts associated with MSW below 64 knots. An even smaller fraction reaches the major hurricane stage (category 3 and beyond, MSW over 96 knots), which is generally limited to a portion of the whole lifetime. The spatial distribution of major hurricane (MH) frequency is quite different from that of all TCs: the highest levels of 1–2 MHs per decade are found between the MDR and North America (Figure 3c), reflecting the fact that Cape-Verde TCs gradually strengthen as they travel across the MDR, before decaying as they approach the American continent. Although fewer MHs on record lead to somewhat patchier distribution of TC activity (Figure 3a,c), a southeast-northwest oriented corridor of elevated MH frequency crossing the northern Lesser Antilles is evident in historical best-track data. Saint-Martin and Saint-Barthélemy are located right in the middle of this pathway. In addition, a regional maximum frequency of 1–1.5 MHs per decade located to their immediate northwest make the islands and the neighboring Anguilla the land areas in the eastern Caribbean most exposed to MH hazard, far ahead of the central and southern Lesser Antilles (Figure 3d).
A total of 36 TCs had their centers come closer than 100 km of Saint-Martin between 1945 and 2017 (Figure 4a), with roughly the same proportion of tropical depressions (12), tropical storms (10) and hurricanes (14). Hurricane intensity and proximity are among the key factors of damage on small islands such as Saint-Martin and Saint-Barthélemy: both minor hurricanes (categories 1 and 2) passing nearby or making landfall (e.g. Alice 1955, Lenny 1999, Gonzalo 2014) and MHs travelling further away (e.g. Luis 1995, Omar 2008, Earl 2010) pose a significant threat (Figure 4b). Although Dog (1950) and Donna (1960) were both very close to Saint-Martin (14 km and 6 km, respectively) and major category-3 hurricanes, Irma stands out not only as the sole category-5 hurricane (MSW = 287 km/h) but also as making landfall on the island.
Except for its extreme intensity and large horizontal extent (34-kt wind radii were of the order of 200–300 km, Figure 5a; see also Figure 5e), Hurricane Irma was a typical Cape-Verde TC. It was officially identified on August 30, 2017 at 00:00 UTC (in the remainder of the paper, all hours are expressed in UTC) as a tropical depression to the west of Cape Verde (Figure 5a) by the National Hurricane Center (NHC). Over the mostly westward propagation, the TC gradually strengthened until becoming a category-5 hurricane a few hundred kilometers east of Saint-Martin on September 5, 2017 at 12:00, then crossed the northern Lesser Antilles, the Greater Antilles, the Florida peninsula, and finally the southern U.S., where it officially ended on September 13, 2017 at 06:00.
Upon crossing Saint-Martin, Irma had reached its peak intensity. Although anemometers from Météo-France (the French meteorological service) stations on Saint-Martin and Saint-Barthélemy stopped operating a couple of hours before actual landfall, the last data records from Gustavia indicate that instantaneous wind gusts were as strong as 244 km/h at 08:07 and suggest much larger peak values (Figure 5b). The WRF ARW atmospheric model [29] is used at 280-m resolution with 3D Large Eddy turbulence in order to examine Irma gust effects over Saint-Martin. A part of these results was published by [30]. This previous simulation setup was improved in the present study with (1) a higher resolution linked with an upgraded land-use map combining the 300 m ESA CCI landcover map and OpenStreetMap data, (2) the use of the 3D Large Eddy turbulence, which is more appropriate for turbulent wind gusts, and (3) a proper hurricane vortex initialization method. All of these improvements allowed for better reproduction of hurricane gusts perturbed by island terrain effects. The simulation was initialized on 6 September at 06:00, assimilating a Holland (1980) parametric vortex with the hybrid Ensemble-3DVAR method [31]. 6-hourly ECMWF operational analyses with 0.1° resolution were used as initial and boundary conditions. The model reproduces both the observed hurricane track and intensity well (not shown) with sustained winds above 80 m/s (i.e., 288 km/h). Model outputs allow for the identification of the most affected coastal areas in Saint-Martin (gusts above 280 km/h): Philipsburg from Cole Bay to Blanche Point Bay, Mullet Beach, and the East coast from Babit Point to Lucas Bay (Figure 5c). Maximum simulated wind speeds reached 320 km/h in Philipsburg Little Bay. On the Northwest side, less affected by Irma’s strong winds, gust values of 260 km/h were simulated at Nettle Bay.
The pressure drop inside Irma’s eye was as low as 914 hPa (not shown). This is roughly 100 hPa lower than background sea level pressure, meaning Irma had the potential to trigger a one-meter storm surge from the inverse barometer effect alone, in addition to contributions from winds, currents and waves. Significant wave heights around Saint-Martin reached 10 m (over a local depth of ~20 m) according to Météo-France estimates (Figure 5d) from the WaveWatchIII spectral wave model at 200 m resolution [32,33], with maximum heights exceeding 12 m. A 2–3 m storm surge was forecast by Météo-France with the Hycom2d barotropic coastal circulation model [34]. This is in reasonable agreement with the 2.04 m surge measured at the Marigot tide gauge in Saint-Martin on 6 September 2017 at 10:31 a.m. given the strong model sensitivity to hurricane track and intensity [35].
Unfortunately, island rain gauges were out of order during the event, and no meteorological radars exist on these small islands. Météo-France does, however, operate such radar on the island of Guadeloupe (located approximately 250 km southeast of Saint-Martin), which allowed forecasters to monitor the event and track the hurricane eye with higher accuracy compared to satellite imagery (Figure 5e). It was also used to estimate rainfall amounts over the area. Although not exceptional, precipitation totals estimated by Météo-France exceeded 150 mm in only 6 hours. Such intense rainfall caused flooding that added up to the coastal inundation already provoked by the pressure-, wind- and wave-induced storm surge.

4. Methods and Tools

Several topo-morphological, sedimentary and anthropic indicators were evaluated to characterize the impacts of Hurricane Irma. The chosen indicators allowed for an evaluation of flooding extent and amplitude, local effects including the influence of coastal structures and beachfront homes, and coastal changes. Study sites with various degrees of urbanization were selected in order to assess the related diversity of morpho-sedimentary responses. The characteristics of indicator groups are detailed for each study site on Table A1. The methodologies associated with each indicator are detailed below.

4.1. Evaluation of Coastal Changes

The analysis of the effects of Hurricane Irma in terms of coastal flooding, coastline changes and damage was partly based on the use of satellite images. In particular, Pléiades images with a resolution of 50 cm (French Spatial Agency CNES and Airbus France©) were considered for the month of September 2017, while older WorldView-2 images for the month of February 2017, also with a 50-cm resolution (Digital Globe Inc.©, USA) were used as a reference. In addition, we shot videos and photographs of the post-Irma coastline using Unmanned Aerial Vehicle (UAV) surveys (Phantom 4 Pro multirotor aircraft from DJI) with a photographic resolution of 20 megapixels (see Figure 1 and Figure 2: Nettle Bay, Grand Case, Orient Bay and Toiny). Pre- and post- Hurricane Irma coastlines and swash limits were digitized at a scale of 1:600. Shoreline digitalization was based on geomorphological aspects, the configuration of vegetation and coastal developments [36,37]. Wherever the shoreline was partially stabilized by buildings, we also digitized the limit of swash uprush (called swash limit pre- and post-Irma on the figures) to represent beach erosion. Geomorphological effects–bioclastic accumulation features, coral boulders, beachrock slabs and ablation features–were measured (Table A1) and mapped.
Eyewitness accounts proved to be very useful. People living in coastal areas shared their experience of the event (duration, hurricane eye, perception. etc.) and their knowledge of the coast. They sometimes described a coastal landscape that is now very different from the one they knew before the storm. Moreover, these interviews demonstrated good knowledge of hurricanes among the population and of the behaviors that should be adopted in such situations [38].

4.2. Evaluation of Flooding

Maximum significant wave heights and water levels were computed using SCHISM-WWM, a state-of-the-art wave-current coupled model that includes an accurate and efficient wetting-drying algorithm [39]. Computations were performed on an unstructured grid with resolution spanning from 10 km in the deep ocean to about 40 m at the coastline. The model was further refined (up to 10 m resolution) in three areas where additional topographic and new bathymetric data had been previously collected from field surveys using a single-beam sensor in Orient Bay and Grand Case on Saint-Martin (Figure 1), and Toiny on Saint-Barthélemy (Figure 2). It was blended with all the already available data: a 100 m resolution Digital Elevation Model around Saint-Martin and Saint-Barthélemy provided by the Hydrographic and Oceanographic Service of the French Navy (SHOM), as well as global GEBCO data [40] for the open ocean. Inland, new high-resolution DEMs had been derived from UAV, and merged with pre-existing 50 m resolution data from the French National Geographic Institute (BD-TOPO, IGN). The model was forced over the whole domain by astronomic tidal potentials, and at the domain boundaries by 6 harmonic constituents: M2, S2, K2, K1, O1, N2. Wind and pressure fields were also prescribed every 15 min. They were inferred from parametric models close to the hurricane center. We used the formulation of Holland [41] for the pressure field. The wind models of Emanuel and Rotunno [42] and Holland [41] were preferred for the hurricane inner core and outer region, respectively. This choice is expected to yield good results for a category 5 hurricane, according to the findings of Krien et al. [43]. CFSR (Climate Forecast System Reanalysis, [44]) data was applied far from the hurricane center for both wind and pressure.
Morpho-sedimentary marks, the landwardmost reported detritus lines and evidence of damage were also used to map the maximum inundation extent, along with measurements of maximum water levels and causes of flooding (coastal flooding, lagoon overflow, surface runoff) whenever possible.

4.3. Evaluation of Coastal Ecosystems

For each study area, the type of vegetation and its origin (introduced or indigenous species) were described. This evaluation was used to qualify the storm effects on vegetation (e.g., uprooted plants, vegetation burned by salt, decapitated coconut palms) and to estimate the resistance of various species to wind and waves.
Coral reefs must have played a key role in the dissipation of wave energy over relatively short distances [45,46,47]. Nevertheless, we were not able to quantify these interactions, even though we observed large quantities of fresh and inert coralline material, especially along those coasts that are not at all urbanized (or very little).

4.4. Wind and Marine Flood Damage Intensity Scale for Buildings (WFDS)

The main challenge when dealing with the effects of a tropical cyclone is to discriminate between sea- and wind-induced damage [48,49,50,51,52].
Therefore, most scales of damage intensity for buildings integrate these two effects in a combined way [22]. Likewise, the proposed intensity scale integrates the effects of wind and marine flooding and includes 6 damage levels. Levels ND (Negligible Damage), LD (Low Damage) and MD (Moderate Damage) are visible mainly from field observations, while levels HD (High Damage), VD (Very high Damage) and CD (Completely Destroyed) can be detected from aerial or satellite images with fine enough resolution (Figure 6). Level HD introduces a threshold of serious damage (damage to structures) that could compromise the stability of the building. This scale is particularly suitable for visual field and UAV surveys.

4.5. Damage Mapping from Field & UAV Surveys

The WFDS classification was applied to 3 sites with areas of similar surface (~0.5 km2) that had suffered from the combined effects of flooding and wind at Nettle Bay (NB), Grand-Case (GC) and Orient Bay (OB) on Saint-Martin (Figure 1). This represents a total 514 buildings that were diagnosed, including 344 in areas affected by marine flooding. Field surveys were coupled with 3D photo-interpretation from UAV imagery acquired before the first reconstruction operations. The images were obtained from an altitude of 70 m using cross-flights to generate orthophotographies with a 1-2 cm resolution and digital surface models (DSM) obtained from image correlation (photogrammetry) performed with the Pix4Dmapper software (Pix4D SA, Switzerland). These views offer a much higher resolution than the 50-cm resolution Pléiades satellite images. Cross-referencing with field observations (facades in particular) provides a very reliable damage diagnosis, similar to field truth.

5. Results

5.1. Major Coastal Impacts of Hurricane Irma

The field analyses revealed that west-facing shorelines were much more sheltered. Winds and waves affected east-facing coasts. The largest surge reached more than 3 meters to Nettle Bay and Cayes Bay and maximum wave heights reached 6 meters to Nettle Beach and more along the rocky coasts. The shore receded particularly along the natural coasts while the urbanized beaches seem to be stabilized by buildings. Hurricane Irma caused several different styles of morphological response and resulted in a wide range of washover penetration distances. However the variety of morpho-sedimentary responses fluctuated according to the degree of coastline artificialization (Table A1). Changes were rapid, although some were temporary and short-lived.
Urbanized coasts such as Grand Case, Nettle Bay and Orient Bay showed strong sensitivity to hurricane effects. During Hurricane Irma’s landfall on Saint-Martin, large waves broke on defensive walls and building facades, as well as transverse and longitudinal protective riprap. Wave reflection enhanced erosion and caused a variety of damage: undermined foundations, broken water pipes, seawalls collapsed along with habitable structures (Figure 7a,b). The coastline of urbanized beaches seems to be stabilized by buildings. Wherever there is an urban beach (Table A1) such as Nettle Bay, Grand Case (Saint-Martin) or Flamands Bay (Saint-Barthélemy), shoreline change in some areas was minimal with some reduction in beach width (Figure 8a–c). However, and even without coastline recession, large waves induced by swash motion caused considerable beach erosion. Inland sediment transfer was blocked by the wall of buildings, sending sediments back towards the shoreface (see Figure 8a). Figure 8 shows the onshore migration of the swash zone.
Shoreline protection structures were too low and inadequate to absorb the surge. For example, coastal erosion reached 15 m near the leeward side of the breakwaters in Nettle Bay (Figure 8a). Many ripraps were displaced by wave action and erosion processes (Marigot, Orient Bay). These heavy stone blocks caused widespread damage to residential housing and hotels (Figure 7c), which will result in a significant increase in repair costs. Some buildings that were gutted by the sea trapped significant volumes of sand (1 to 2 m3) and boulders weighing over a ton (Figure 7d).
Along less artificialized coasts with a sufficiently large buffer zone (Table A1) such as Toiny on Saint-Barthélemy or the northern part of Orient Bay on Saint-Martin, the most common ablation feature was a scarp at the beach/dune interface (Figure 9a). It traced a more or less continuous line depending on the obstacles met by the waves (vegetation, properties, roads, etc.). The dunes that had been attacked by the waves had a more abrupt profile, sometimes flattened at the top (Figure 9b).
Both the beach and the frontage of the entire dune suffered from severe erosion. For example, the shoreline retreated by over 15 m in Toiny Bay and around 50 m in the northern part of Orient Bay (Figure 10a,b). Strong winds and large waves destroyed vegetation through uprooting, while waves moved beach sediment inland. Sediment transfer appeared important there. Indeed, the extreme waves produced numerous washover deposits (Table A1). They mainly consist of bioclastic sand. The largest washovers were observed on beaches with little development and generally few topographical constraints such as Toiny Bay and Orient Bay (Figure 10a,b). There, the washover was able to extend over the coastal plain, filling the pond and depositing sand on roads and inside homes. The most impressive example is probably that formed in the western part of Nettle Bay (13,000 m2). It reveals the amount of sediment transfer from the shoreface to inland areas, resulting from the suspension of fresh, available sediment combined with the transport of inert sediment located beyond the depth of closure for fair-weather waves. During the process, urbanized beachfronts were able to mitigate the transport of material inland, and thus the formation of washovers (Figure 11c).
Hurricane Irma also led to beachrock exhumation (Figure 11a), which points to a temporary change in the morphodynamic equilibrium of the sandy coast [53]. In both the medium and the long run, systematic beachrock exhumation conveys an erosion trend.
Behind the front line of coastal vegetation, which was greatly damaged (downed plants, total or partial uprooting, bent or broken trunks, decapitated coconut palms, and vegetation hypersalinity), certain indigenous species showed greater resistance, such as Coccoloba uvifera (seagrape) and some mangrove types such as Laguncularia racemosa and Conocarpus erectus. In contrast, Avicennia germinans and Rhizophora mangle experienced high rates of mortality [54]. Those species highly resistant to wind and salt played a fundamental role as mechanical obstacles and sediment traps (Figure 11b). Coconut trees trapped washover sand, as evidenced by the silting of trunks over 3 meters high. Mangroves located on pond banks retained sand, as in Orient Bay (Saint-Martin) where small dunes were formed in front of the seagrapes. There is no doubt that these indigenous species promote beach resilience by protecting low-lying coastal areas from waves and by trapping bioclastic materials [55].
Lastly, wave energy transported significant amounts of material from the reef flat to the beach (e.g., Toiny, Orient Bay). Hurricane Irma generated waves of great strength that broke corals and transported blocks of coral rock. This material was essentially inert (skeletons, boulders, sand and shell conglomerates), suggesting that coral blocks had been broken before Irma. Storm waves also transported material that was already present on the beach. It is often distinguished by its darker color with respect to freshly transported deposits. Boulders were stacked on top of each other. Well sorted, tiled and facing the incident swell, these heaps of coral material formed more or less continuous unconsolidated alongshore bands [56]. The beach slope displayed a staircase topography with an abrupt, rather concave slope. These deposits were only observed on less artificialized shores where morpho-sedimentary processes were not contained by coastal structures and seafront urbanization. Biochemical and physico-chemical processes will promote the lithification and consolidation of bioclastic materials.
Severe coastal changes highlight the intensity of Hurricane Irma. In order to better understand the origin of such changes, we developed a wave and flood model for several study sites, ranging from little to highly urbanized. The model results were then compared to field data.

5.2. Storm Surge Numerical Modeling and Geomorphological Observations

The improved numerical model is in close agreement with previous results [30,57] regarding sea states. With significant wave heights reaching about 9–10m offshore, at 15–20m depth these values are in agreement with operational forecasts issued by Météo-France (Figure 5d), and suggest that significant wave heights are essentially limited by wave breaking on the east coast.
West-facing shorelines were much more sheltered. In Grand Case, for example, the model predicts that waves striking the eastern part of the bay were about 4 times less energetic than those hitting the cemetery in the west. Such a dichotomy is consistent with traces left by the hurricane. Indeed, we observed marine deposits 6 m a.s.l. in front of the cemetery (which was protected by a rock riprap), while deposits in the eastern part of the bay did not exceed 3 m a.s.l. Yet, the model fails to reproduce the surge in Grand Case. While geomorphologic data suggest a surge of about 2 m in the east and 3 m further west, the values predicted by the model do not exceed 1–1.5 m (Figure 12a,b). This finding suggests that the inverse barometer, wind surge and wave setup were probably not the only processes responsible for the observed surge. Other mechanisms not accounted for by the model such as infragravity waves [43,58] or runoff might have played a major role. Indeed, water levels were higher in side streets, cul-de-sacs, as well as homes and residences surrounded by walls (e.g., Mercure Hotel in Nettlé Bay). Densely urbanized beachfronts such as Grand Case formed a concrete wall against storm waves. However, the sea penetrated behind the row of beachfront houses through non-urbanized areas, and flooding was amplified by surface runoff (particularly in Gustavia and Grand Case). Locally and near the shoreline, floods were exacerbated. Further work is needed to better understand the relative contributions of all these processes to the observed water levels.
According to field data, the extent of flooding in Orient Bay is rather well reproduced by the numerical model (Figure 13c,e,f). Flooding in this area may be explained by an extreme (and essentially wind-driven) surge, which reached about 4 m. The model predicts a surge of about 1.5 m for Toiny (Figure 13b,d). This value is only slightly lower than dune crest height, so that waves were presumably energetic enough to inundate shallow areas further inland, such as the pond. Field observations indeed confirm marine flooding of the pond (Figure 10). From the location of marine deposits, we estimate wave heights at 6 m a.s.l. in the western part of the bay, while waves would have reached 4 m a.s.l. further east due to the absence of topographic obstacles.
Hurricane Irma caused extensive damage that was assessed from space by Copernicus and SERTIT. However, motivated by the sometimes contradictory satellite estimates, we analyzed the damage with more accurate indicators, making a building-by-building field assessment supported by UAV surveys.

5.3. Building Damage Assessments

In the French part of Saint-Martin, Hurricane Irma caused the deaths of eleven people and very serious damage to the building stock. Official reports indicate that 95% of the buildings (i.e., about 16,000 units) were damaged, with 20% being completely destroyed, including several public buildings [21]. The prefecture, the media library and 4 out of 21 schools are now considered irrecoverable. The water supply, electricity, landline and mobile phone networks have been partially or totally cut off in some districts. The total cost of the insured damage was estimated at 1.17 billion EUR for Saint-Martin, 823 million EUR for Saint-Barthélemy [21]. Independent expertise claimed that damage was in fact much lower, estimating that only 5% of the buildings had been destroyed or rendered completely unusable (www.archi-urgent.com).
Rapid damage mapping services also provided different assessments based on the photo-interpretation of Pléiades-1B© satellite images from 09/10/2017 [59]. Indeed, according to GIS data provided by the Copernicus Emergency Management Service (EMS) [60], 58% of the building stock suffered damage of a level greater than or equal to the MD class, with 20.7% of buildings being completely destroyed (CD class). The SERTIT [61] mapping service, also involved within the framework of the International Charter Space and Major Disasters, estimated this fraction at 47.4%, with only 9.5% of buildings being completely destroyed. The damage share in the storm-surge affected area was extracted from the flood envelope estimated after Hurricane Irma by Cerema & DEAL Guadeloupe [62]. Depending on the source that was considered for overall damage assessment, it accounts for 22.9% (SERTIT) to 25.4% (Copernicus) of the total number of buildings in Saint-Martin.
To overcome the challenge posed by large variability in these assessments, a more accurate damage diagnosis was required. It made use of both field and UAV surveys in 3 sectors affected by wind and marine flooding. Such diagnosis required the development of a 6-level damage intensity scale, the WFDS (Section 3). This scale allowed for relating the distribution of damage to marine flood depths and thus estimating the specific signal of sea-related damage despite the concurrent presence of wind-induced damage.

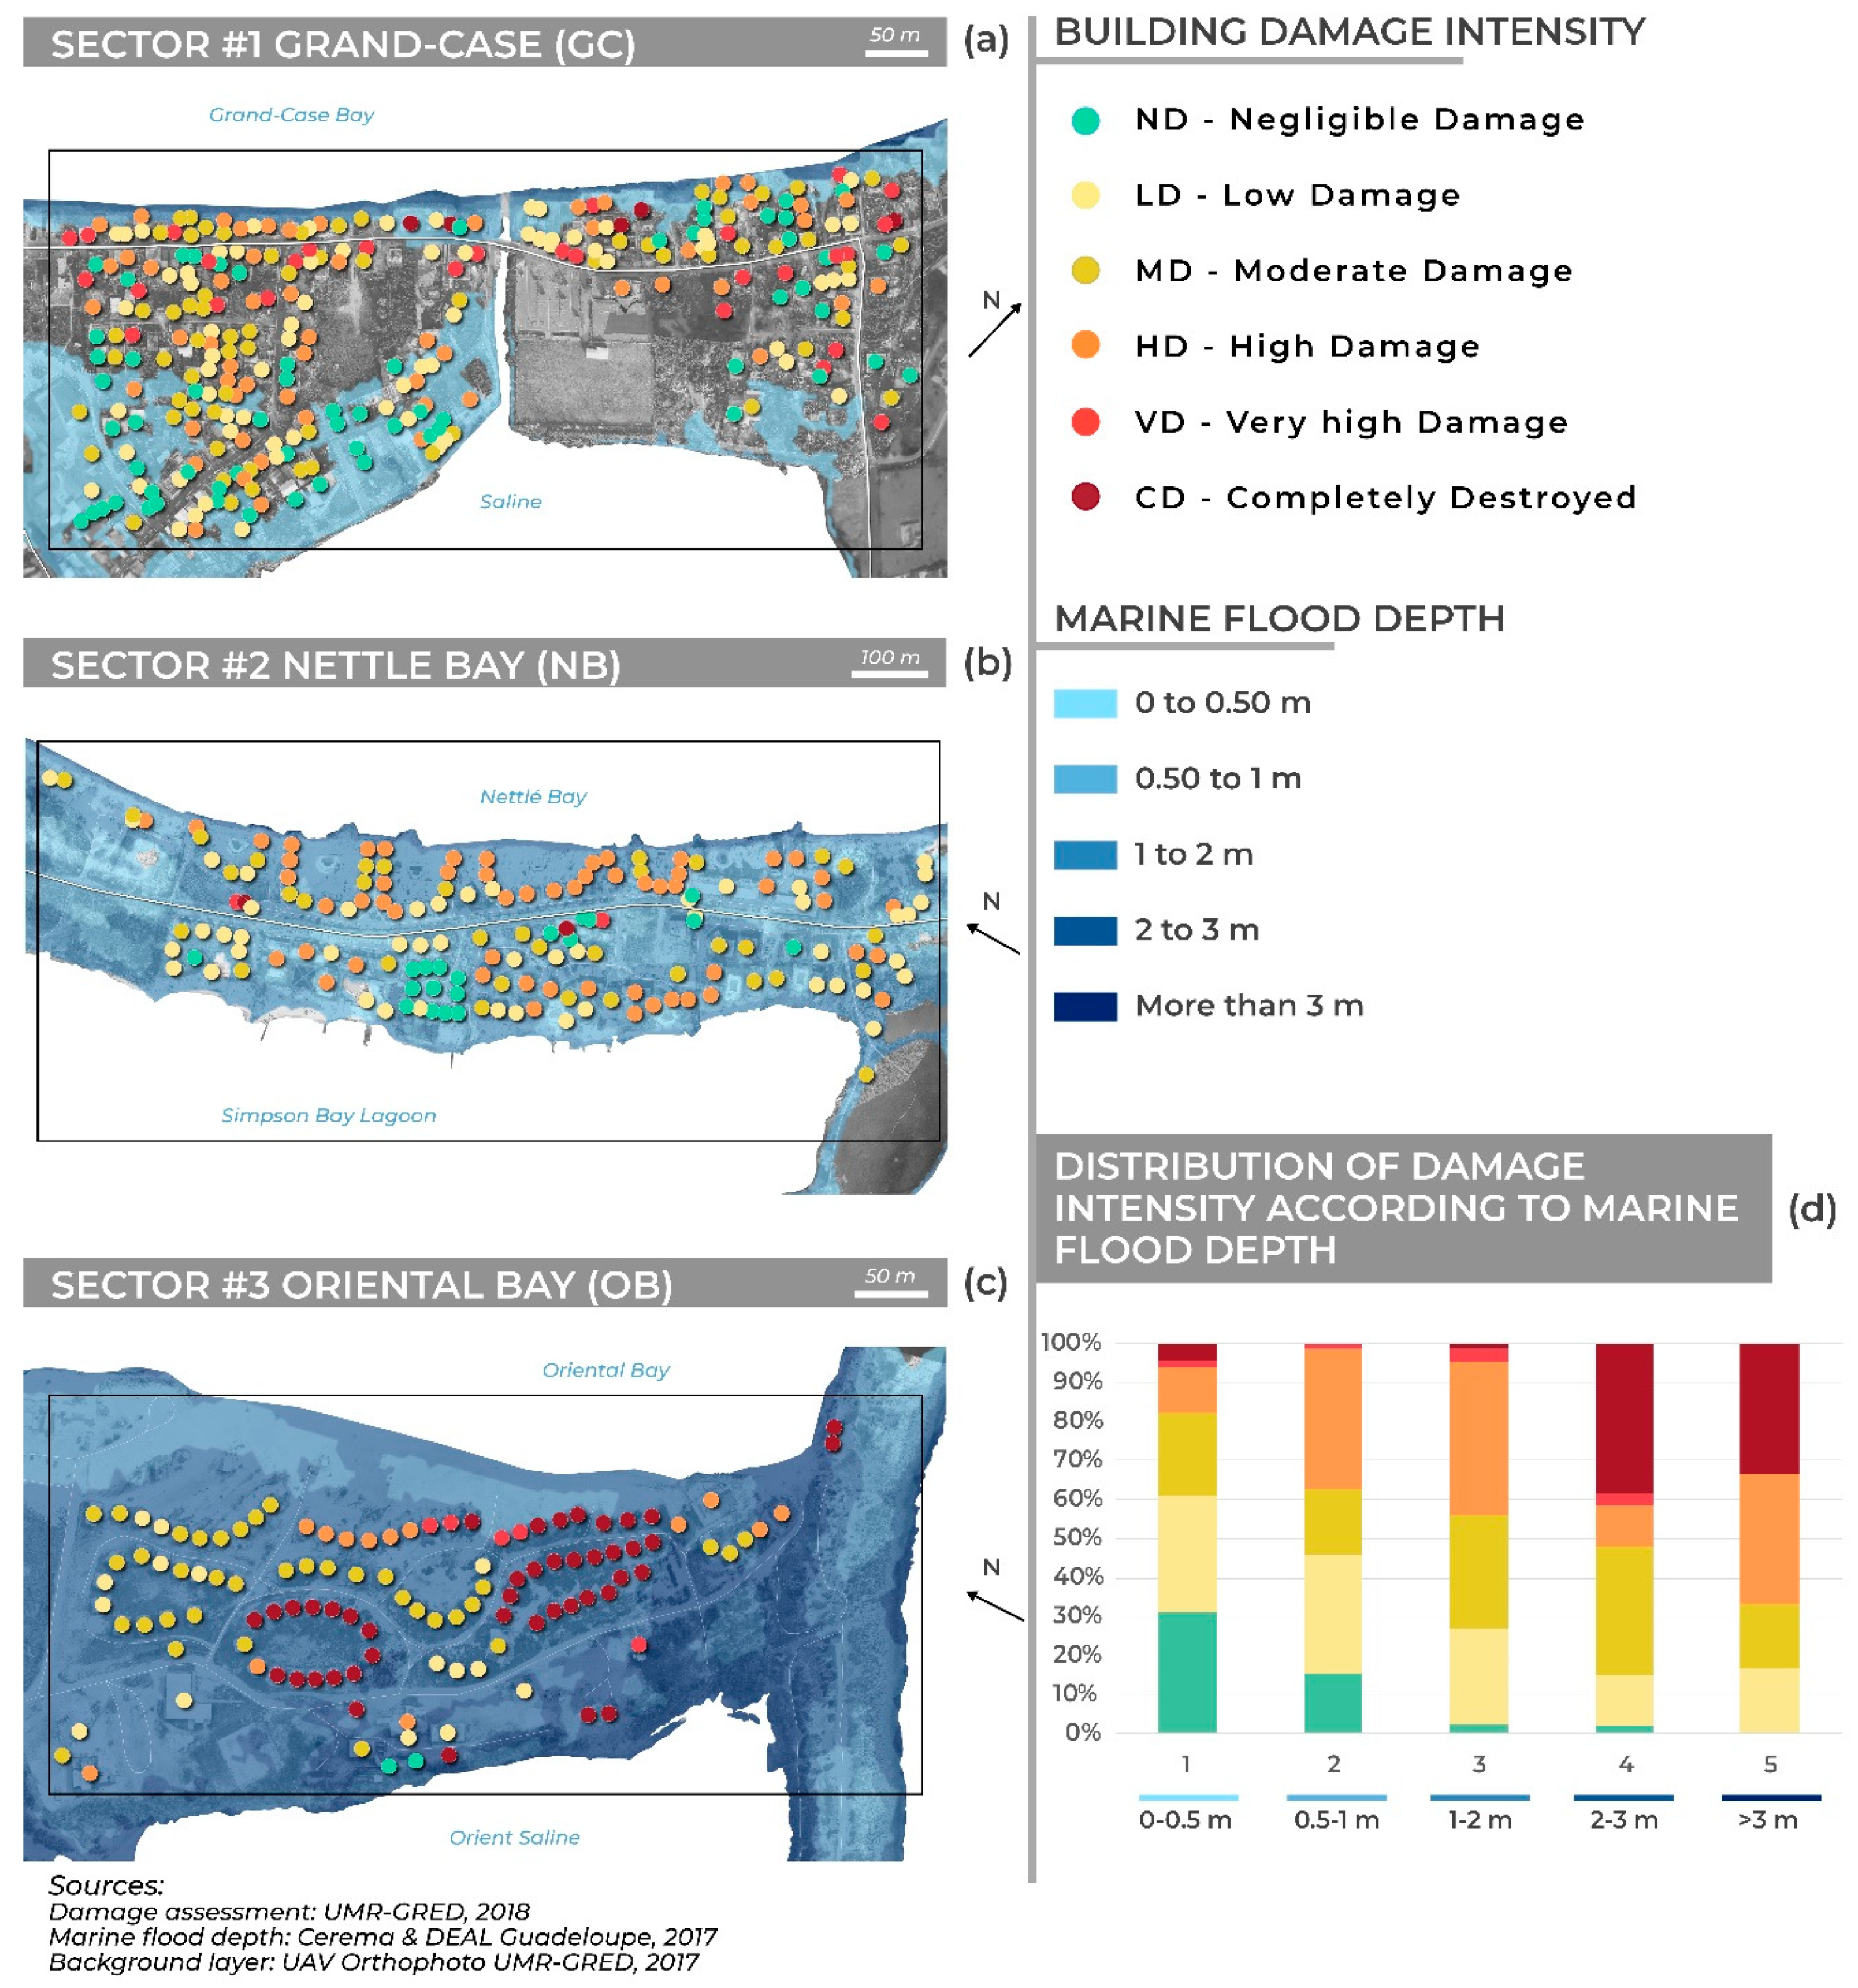
5.4. Spatial Correlation between Damage Intensity and Marine Flooding

Under hurricane wind exposure, two major types of damage were reported: the destruction of roof coverings, sometimes including roof frameworks, and that of external joinery such as canopies, doors and windows (bay windows in particular). Under hurricane wave and storm surge exposure, damage mainly concerned furniture, coatings, internal and external joinery, terraces, partitions and sometimes load-bearing structures such as walls and pillars. The damage processes involved include the effects of lateral pressure, block impacts, accumulation of sand and various debris, foundation scouring, flooding and corrosion by salinization.
Positive spatial correlation is found between damage intensity and flood depth, which were classified according to the WFDS and divided into 5 classes, respectively (Figure 14). Such a correlation is evidenced without distinction of the building type by plotting the distribution of damage intensities according to water levels for the entire sample comprising three distinct areas (Figure 14d). As expected, there tends to be an increase in damage intensity with flood depth. Indeed, deeper flooding combined with the presence of wave breakers, may generate lateral pressure that lead to large structural damage, particularly at the waterfront. These surge-related effects may combine with those associated with hurricane winds. Thus, for a uniform building stock, we can derive the statistical part of the observed damage due to combined effects of sea and wind. For example, the percentage of buildings exceeding the HD damage threshold increases from 20% to 66% (a factor 3.3) from the 0–0.5 m water level class to the 3 m+ class. Such non-linear correlation can also be expressed in terms of preliminary damage curves that may be used in scenarios of economic loss.

5.5. Field & UAV (GRED) vs Satellite Damage Assessment (Copernicus EMS)

Our WFDS damage scale can be reduced to 4 levels in order to facilitate comparison with the estimates provided by satellite operators of the Copernicus EMS service, by grouping classes D0/D1 (ND: Negligible to slight damage) and D3/D4 (HD: Highly Damaged) (Figure 15a). If we first consider the total number of buildings in the 3 study zones, it appears that Copernicus takes many more buildings into account than in reality (+36%), especially for classes ND (+35%) and MD (+54%). This overestimation is explained by the fact that Copernicus uses the vector layers of the OpenStreetMap project which contain too many building polygons. This analysis can be refined by focusing on the spatial reliability of the diagnoses, comparing only the buildings common to both sources. We then consider a tolerance margin of 2 damage levels, which allows us to integrate the uncertainties related to the grouping of our damage classes. As a result, there are significant diagnostic differences between our field & UAV damage assessment on the one hand, and those provided by satellite operators on the other hand. Indeed, Copernicus EMS underestimates the number of damaged buildings for classes ND (−7%) and HD (−18%), but overestimates CD (+2.5%) and MD (+21%) class damage. The underestimation of the ND class is likely due to the impossibility of distinguishing slight damage from satellite imagery, whether due to wind or sea. The overestimation of moderate MD damage may be explained by an excessive tendency to classify as moderate any damage that is not really visible on satellite images. The Grand-Case sector is very representative of this tendency (Figure 15b). Minor and/or sea-related damage are not well appreciated by the satellite operator. The large diversity of architectural styles in this sector also seems to complicate the task of operators. Indeed, diagnostic errors are less frequent in other sectors that present more homogeneous building styles.
Empirical distributions will need to be consolidated with new data samples (Figure 14). Nevertheless, we can already grasp the signature of sea-induced damage, which seems to validate the relevance of the intensity scale used here. Indeed, the same type of analysis carried out with damage data produced by Copernicus did not provide any significant results. This is largely due to the impossibility to see damage on facades from satellite images, especially for waterfront buildings. More generally, it may be explained by the lack of 3D acquisition from Pléiades imagery. Equivalent curves for wind alone have yet to be established using future high-resolution atmospheric models. Such damage curves may also be established for different types of buildings, in a way similar to damage curves for earthquakes [63] or tsunamis [64]. The objective is to accurately model potential losses in the event of future tropical cyclones.

6. Discussion

6.1. Effects of Hurricane Irma on Storm Surge and Waves

Irma was an exceptional hurricane that will leave a lasting mark in the history of the Lesser Antilles. Coasts were strongly affected by winds, waves and torrential rain. Storm surge and waves numerical modeling have been estimated from numerical modelling at over 3 and 10 meters height, respectively, on the coasts most exposed to wind and waves; that is to say, the east coast of Saint-Martin and the north coast of Saint-Barthélemy. The geomorphologicial observations revealed locally higher water levels that may be explained by wave buildup and breaking, or by other processes such as long infragravity waves [65]. However, we were not able to determine the influence of coral barriers due to a lack of bathymetric data. High-resolution bathymetric lidar data are currently being acquired for Saint-Martin and Saint-Barthélemy, and will be of great interest to better assess the role of coral barriers along with the influence of the seafloor on hydrodynamic conditions.

6.2. Complex Causes of Flooding

The wave and flood models used in this study allow for visualization of the flooding extent near the coast. However, the spatial resolution considered here does not allow reporting of any site effects (due to the presence of streets, homes, residences surrounded by walls). Indeed, locally and near the sea, field data indicate that the water levels were amplified and lead to enhanced flooding. The torrential rain that poured down on urban areas was combined with coastal flooding and lagoon overflow. Consequently, flooding dynamics were complex. Traditionally, hurricane risk management systems mainly address the risk of coastal flooding and ignore the importance of surface runoff [17]. Yet the risk of simultaneous peaks for both flooding and surface runoff is real and can be catastrophic [16]. This study reveals the added value of integrating all of the local effects induced by the passage of a hurricane.

6.3. Effects of Hurricane Irma on Coastal Systems

The effects of Hurricane Irma on the coastal systems of Saint-Martin and Saint-Barthélemy were conditioned by the capacity of beaches to resist and adjust, which differs according to the degree of human pressure exerted on the coast [30]. Adjustment was difficult or even impossible in those coastal systems compressed between urbanization and the sea. The lack of material transfer led to the erosion and sometimes the temporary disappearance of the beach. Without sufficient sediment stocks, the resilience of urban beaches is expected to be slow and complicated [15], especially in case of preexisting tendency for coastal erosion. Preexisting tendency for coastal system degradation can make recovery more difficult [66].
On urban beaches or coastal systems without dune morphologies, post-hurricane beach recovery is slow (or even absent). Indeed, the artificialization of sedimentary cells limits or even blocks sediment transfers. Coastal defences (wave breakwaters, sea walls) emerge as a key structural control on coastal dynamics. According to Woodruff et al. [67], urbanized coasts enhance the devastating effects of extreme waves on beaches and coastal erosion. Densely urbanized beachfronts form an obstacle to coastal flow, but in return, damage to buildings is often extremely high [68]. The field observations underscore several processes responsible for damage outside and inside homes located along the shore:
  • waves cause scouring of foundations and of building walls, as well as displacement of protective riprap. Failures were observed at the corners or edges of structures or in areas of flow convergence.
  • they break shutters, doors and patio doors;
  • materials are projected onto facades and into homes;
  • direct flooding cause damage to building contents (walls, floor, electrical systems).
A majority of the destroyed homes and damaged foundations were observed when narrow beaches and dunes were insufficiently high and wide or even non-existent to protect them.
The restoration of these artificialized beaches requires the implementation of protective actions such as nourishment, which is costly at the least and must be repeated regularly, as well as nature-based defence projects (mangrove and reef restoration), with reported benefits ranging from reductions in storm damage to reductions in coastal structure costs [69]. Adjustment time to new conditions is short, but recovery time is long.
Along more natural coasts, coastal systems are better adapted to extreme hydrodynamic conditions. Hurricane Irma wave impacts were largely constructional and accretionary. During and after Irma’s passage, beach tops migrated inland, fed by beach erosion. Shorelines were nourished with fresh coralline sediments. This reveals the major role played by coral reefs on beach recovery [12]. Dunes or coastal bluffs, immediately inland of the beach, either resist wave energy that exceeded the beach capacity, or supplement the beach volume and beach area through erosion. Along beaches with a buffer zone wider than 20 meters, we observed limits with a predominance of erosion on the seaward side, and on the landward side we observed beach growth with washover and dunes. This limit indicates an energy threshold that is clearly perceptible through coral blocks almost aligned along this line. Such a transfer mechanism, however, must not mask the complexity of the parameters (sources of sediment, shore morphology, beach slope, etc.) involved in coastal resilience [67].
Even if the mangrove is not very extensive on the islands, it helped with reducing damage. Mangroves are often described as a plant formation capable of attenuating wave heights and surge (e.g., [69,70]), but as mentioned by Zhang et al. [39], this requires very large, dense and old mangroves, which are not found on the islands of Saint-Martin and Saint-Barthélemy. Only the ~300-m wide mangrove at Baie d’Embouchure (Saint-Martin) may have carried out this function, but the dampening impact was probably reduced because of an extremely high surge that covered a significant part of the mangrove with water. Nevertheless, the mangrove helped reduce damage by retaining heterogeneous and coarse debris (sheet metal, driftwood, boats) and limited the erosion of soil, banks and beach barrier. Mangrove recovery is slow [71], and it will take at least 15 years to reach a similar level after Irma. There is a risk that such asynchrony between the recovery of beaches and that of ecosystems may lead to much greater degradation if intense meteorological phenomena were to strike these islands in the near future. It is therefore indispensable to define a reforestation policy to protect coastal environments in the event of new hurricane landfall.

7. Conclusions

The goal of this article was to present several aspects of Hurricane Irma’s landfall over the islands of Saint-Martin and Saint-Barthélemy: meteorological data, modeling of waves and storm surges, coastal changes, related effects of waves and flooding, damage typology and spatialization.
Hurricane Irma was a typical (yet extreme) Cape-Verde tropical cyclone. Model outputs allow for identification of the most affected coastal areas in Saint-Martin (gusts above 280 km/h). Maximum simulated wind speeds reached 320 km/h in Philipsburg Little Bay. Significant wave heights around Saint-Martin and Saint Barthélemy reached 10 m.
We demonstrated that surge and wave run-up were variable in terms of levels and geographical sectors. Winds and waves affected east-facing coasts. West-facing shorelines were much more sheltered. The largest surges reached over 3 meters at Nettle Bay and Cayes Bay, while maximum wave heights reached 6 meters at Nettle Beach and more along the rocky coasts. In addition, we think that wave resonance appear to be a key element causing flooding and play a significant role in runup amplification.
The extent of flooding is rather well reproduced by the numerical model. On the other hand, values predicted by the model do not exceed 1–1.5 m while geomorphologic data suggest maximum surge of about 3–4 m. We think that wind induced and pressure induced surge, together with wave setup, were probably not the only processes responsible for the observed surge. Other mechanisms not accounted for by the model such as infragravity waves or runoff might have played a major role. Indeed, intense rainfall caused flooding that added up to the coastal inundation already provoked by the pressure-, wind- and wave-induced storm surge.
We have highlighted the variability in coastal responses, which depend on the degree of coastal urbanization and on the type of development (homes, protective structures, etc.), as well as on intrinsic features of the coastal cell (wave-cut platform, beach slope, particle size distribution, etc.) and coastal ecosystems (introduced vs. indigenous vegetation):
-
In urban coastal zones, the coastline has not really receded but the urban beach has suffered from severe erosion. Indeed, the coastal system is compressed between urbanization and the sea, which reduces post-hurricane beach recovery. Such configuration exacerbates the effects of hurricane waves on beaches, vegetation and shore protection structures. Scouring was the source of many structural failures, often amplified at the corners or edges of structures or in areas of flow convergence. Shore protection structures were inadequate to absorb the surge and extreme wave energy. Locally, buildings increased wave impacts and therefore beach erosion and damage. In return, damage to buildings were often extremely high.
-
Along naturals coast, beach sand was transported from the nearshore and the lower beach to the upper beach and back of the beach (washover deposits). Sediments were also trapped by the most resistant plants, contributing to beach accretion and forming along shore bands of coral material. Large parts of the mangrove were destroyed, damaged or flattened; however, the mangrove helped reduce damage. The question of coastal resilience and/or new coastal resilience trajectory remains open. Indeed, coasts respond to altered conditions external to the system or to changes triggered by internal thresholds that cannot be predicted on the basis of external stimuli [3,72]. This natural coastal variability make it difficult to identify the combined effects of hurricanes and sea level rise. It will require long-term evaluation of the coasts in order to better evaluate recovery processes and low-frequency variations [73].
The link between coastal risk and damage was clearly demonstrated with an original approach based on a damage typology that is adapted to the considered territory and an interpretation of damage that associated ground-based descriptions and UAV image interpretation. Copernicus EMS rapid damage mapping service introduces significant errors in damage diagnosis from satellite, in terms of numbers, intensity and location. It can introduce significant biases into the statistical and overall estimation of destruction and cost of tropical cyclones. It therefore seems important to take these uncertainties into account, or at least to mention them in future estimates of post-cyclone damage. We also encourage the Copernicus EMS to make its assessments more reliable by sharing experience and data with field and UAV survey operators.
Hurricane Irma was exceptional, but the disaster is also inevitably due to political, social and economic factors. For three decades, the demographic and urban development along the coasts of the islands of Saint-Martin and Saint-Barthélemy contributed to the creation of a catastrophe. Laws and urban planning regulations exist but are seldom or not enforced at all, just like coastal regulations, which are inconsistent. According to French law no 96-1241 of 30 December 1996 relative to development, protection and use of the “fifty geometric steps” zone in overseas departments: “Any private or public person in possession of a deed of property is excluded from the public marine domain of the State and thus from coastal law.” The reduction of the risks and of the effects of catastrophes must include reinvestment by the French government, particularly on Saint-Martin, which is faced with more critical social and economic constraints relative to Saint-Barthélemy [7].
The lessons to be learned from this event are considerable in terms of both basic and applied research. The quality of the collected information contributed to a description of the event dynamics in order to bring the inevitable and unpredictable into the realm of the possible. The goal now is to use this extreme experience in order to optimize future territorial planning on small islands.

Author Contributions

Conceptualization, T.R.; Methodology, T.R., F.L., T.C. and Y.K.; Validation, all the authors; Writing—Original Draft Preparation, T.R.; Writing—Review & Editing, T.R., A.B., F.L., Y.K. and P.P.; M.G. has digitalized the coastlines; M.P. has piloted the Unmanned Aerial Vehicle. Funding acquisition, N.Z. and F.L.; The final manuscript has been approved by all the authors.

Funding

This research was supported by the ERDF/C3AF (grant number CR/16-115) and ANR/TIREX projects (grant number ANR-18-OURA-0002-05).

Acknowledgments

We would like to show our gratitude to Elise Chatrefou, Yannick Dervout and Thierry Dupont for their help in the compilation and interpretation of operational Météo-France productions and in the processing of data from the HURDAT2 database. The setups of the WaveWatchIII and Hycom2d models for the Lesser Antilles were developed in cooperation between the Shom and Météo France in the framework of the HOMONIM project with support from the DGPR and the DGSCGC. The authors wish to thank Martin Robustelli who helped to upgrade the land-use map of Saint-Martin. We would like to thank the reviewers for their insightful comments on the paper.

Conflicts of Interest

The authors declare no conflict of interest.

Appendix A

Table A1. Assessment of the physical impacts of Hurricane Irma on coastal areas.
Study AreaGeneral Characteristics of the Sandy CoastCoastal ProcessesSurge /Maximum Wave Height (Hmax in Meters)Coastal Damage and Flooding
AbrasionAccretion
Red Bay
SXM
Beach (L: 1.6km, W: 20–40 m) and dunes (height ~3m)
Beachrock
Pond (1.6 km2)
Coastal homes
Beach and dune erosion
Beachrock exhumation
Vertical erosion in front of the homes: 1–1.2 m
Numerous washovers (extension max: 35 m)
Transport of reef blocks of various sizes (max 108 kg) and of carbonate sand
Sands deposited in the pond
Landward transport of broken slabs
Hmax: 3 m
Hmax: 6–8 m on the rocky cape
Coastal homes flooded
Wall collapse
Vertical scouring and displacement of protective riprap
Undermining of foundations
Nettle Bay
SXM
Beach barrier-inlet system (L: 4km, W: 105–405 m)
Urban front (houses and hotels)
Sandy beach erosion
Dune scarp erosion
(> 0.4 m)
Beachrock exhumation
Sediment transfer and accretion on the upper beach
Average extension of the washover deposits: 20–30 m
Transport of reef blocks of various sizes (max 300 kg)
Massive coral slabs broken and detached from the reef
Surge: 3–4 m
Hmax: 6 m
Hmax: 6–8 m on the rocky cape
Houses and hotels partially or totally destroyed
Vertical scouring at seawall
Displacement of protective riprap
Decapitated coconut trees
Marigot
SXM
No beach
Urban waterfront
Transport of coral blocks of various sizes onto the roadSurge ~2 m
Hmax: 4 m
Urban waterfront floodedSeawall damage
Displacement of protective riprap
Orient Bay
SXM
Bay beach (L: 2.1 km –W: 20–40 m)
Lagoon (2.3 km2) and mangrove
Urban coast in the southern part
Sandy beach erosion Accretion on the upper beach (dune formation)
Maximal extension of the washover deposits: 45 m
Transport of reef blocks of various sizes
mangrove: mechanical obstacle, sediment and detritus trap
Surge: 3 m
Hmax: 5 m
Hmax: 9–10 m on the rocky cape
Houses and hotels partially or totally destroyed
Displacement of protective riprap
Uprooted coconuts trees
Downed plantsMangrove hypersalinity
Grand-Case
SXM
Urban beach (L: 1.9 km–W:0–18 m)
Coastal front urban
Heavy beach erosion
Vertical erosion in front of the houses: 0.5 m
Sand accumulation through non-urbanized areas
Transport of single coral blocks
Surge: 3 m
Hmax: 5–6 m
Wall collapse
Undermining of foundations
Damage along the waterfront
Marcel Bay
SXM
Bay beach (L: 0.4 km–W: 15–25 m)
Riverine mangrove
Coconut trees
Seaside resort
Sandy beach erosionLight sand transfer
Average extension of the washover deposits: 25 m
Surge: 3 m
Hmax: 3 m
Partially and totally destroyed buildings (resort)
Mangrove hypersalinity
Decapited coconut trees
Lorient Bay
SB
Bay beach (L: 1 km–W: 0–0.15 m)
Beachrock
Urban front (houses and hotels)
Dune scarp erosion > 0.5 mNumerous washovers through non-urbanized areas
Maximal extension of the washover deposits: 30 m
Single coral blocks deposited on the beach
Surge: 2 m
Hmax: over 3 m on the rocky cape
Houses and hotels partially destroyed and flooded
Wall collapse
/Undermining of foundations and significant damage
Cayes Bay
SB
Sandy beach (L: 0.6 km–W: 2–20 m) and corals blocks
Urban front (houses and hotels)
Dune scarp erosion > 0.5 m–1 m
Exhumation of beachrock
Sediment transfer on the upper beach
Transport of variously-sized reef blocks
Surge: 2–2.5 m
Hmax: 3–4 m
Housing and hotels partially destroyed
Undermining of foundations
Displacement of protective riprap
Decapitated coconut trees
Grand Cul de Sac
SB
Beach barrier system (L: 1.1 km–W: 45–65 m)
Barrier reef
Lagoon (1.5 km2) connected to the sea
Urbanized beach barrier (resorts)
Beach erosion
Exhumation of beachrock
Landward transport of broken slabs and reef blocks (0.1–0.2 m)
Accumulation of coral rubble (shingle)
Coral blocks trapped by the mangrove
Surge: 3 m
Hmax < 5 m
Housing and hotels partial destroyed and inundated
Wall collapse
Undermining of foundations
Displacement of protective riprap
Downed plants
Hypersalinity of the mangrove
Flamands Bay
SB
Bay beach (L: 0.7 km –W: 20–38 m)
Urbanized beach barrier (resorts)
Heavy marine erosion between buildings (300 to 800m3)
Dune scarp erosion > 1.7 m max
Exhumation of beachrock
Transport of reef blocks (max 50 kg)Surge: 3 m
Hmax: 5 m on the dune
Hmax: 8–10 m on the rocky cape
Damaged buldings (resort)
Wall collapse
Undermining of foundations and significantly damaged
Uprooted coconut trees
Toiny Bay
SB
Beach barrier system (L: 0.5 km–W: 8–22 m)
Pond (0.4 km2) and mangrove
Dune scarp erosion > 0.5 mNumerous large washover
Average extension of the washover deposits: 20 to 35 m
Cluster or ridges coral blocks
Transport of large reef blocks (max 230 kg)
Vegetation: mechanical obstacle and sediment trap on the upper beach
Surge: 2.5–3 m
Hmax > 4 m on the beach
Hmax >6 m on the rocky cape
Uprooting (pandanus and coconut trees)
Downed plants

References

  1. Meheux, K.; Dominey-Howes, D.; Lloyd, K. Natural hazard impacts in small island developing states: A review of current knowledge and future research needs. Nat. Hazard. 2007, 40, 429–446. [Google Scholar] [CrossRef]
  2. Hoeke, R.K.; McInnes, K.L.; Kruger, J.C.; McNaught, T.R.J.; Hunter, J.R.; Smithers, S.G. Widespread Inundation of Pacific Islands Triggered by Distant-Source Wind-Waves. Global Planet. Chang. 2013, 108, 128–138. [Google Scholar] [CrossRef]
  3. Nurse, L.A.; Mcleaen, R.F.; Agard, J.; Briguglio, L.P.; Duvat-Magnan, V.; Pelesikoti, N.; Tompkins, E.; Webb, A. Small islands. (Part B: Regional Aspects. Contribution of Working Group II to the Fifth Assessment Report of the Intergovernmental Panel on Climate Change.) In Climate Change 2014: Impacts, Adaptation, and Vulnerability; Cambridge University Press Cambridge: Cambridge, UK, 2014; pp. 1613–1654. [Google Scholar]
  4. Gaillard, J.C. Vulnerability, capacity and resilience: Perspectives for climate and development policy. J. Int. Dev. 2010, 22, 218–232. [Google Scholar] [CrossRef]
  5. Duvat, V. Le Système du Risque à Saint-Martin (Petites Antilles Françaises). 2008. Available online: http://journals.openedition.org/developpementdurable/7303 (accessed on 1 September 2018). (In French).
  6. Theng, S. L’île de Saint-Barthélemy (Petites Antilles): Une destination du tourisme de luxe. 2014. Available online: http://journals.openedition.org/etudescaribeennes/6831 (accessed on 9 July 2019). (In French).
  7. Nicolas, T.; Pagney Bénito-Espinal, F.; Lagahé, É.; Gobinddass, M.-L. Les catastrophes cycloniques de septembre 2017 dans la Caraïbe insulaire au prisme de la pauvreté et des fragilités sociétales. [cyclonic disasters of September 2017 in the insular Caribbean with the prism of poverty and societal fragility]. EchoGéo 2018, 46. Available online: http://journals.openedition.org/echogeo/16439 (accessed on 1 February 2019). (In French).
  8. Desarthe, J.; Moncoulon, D. Quatre siècles de cyclones tropicaux dans les départements français d’outre-mer. [Four centuries of tropical cyclones in the French overseas departments]. La Météorologie. 2017, 99, 52–58. (In French) [Google Scholar] [CrossRef]
  9. Mazurie, R.; Chauvin, F.; Degrace, J.-N. Commentaire sur l’article “Quatre siècles de cyclones tropicaux dans les départements français d’outre-mer”. [Comments on “Four centuries of tropical cyclones in the French overseas departments”]. La Météorologie 2018, 101, 62. (In French) [Google Scholar] [CrossRef]
  10. Morton, R.A.; Sallenger, A.H., Jr. Morphological impacts of extreme storms on sandy beaches and barriers. J. Coast. Res. 2003, 19, 560–573. [Google Scholar]
  11. Wang, P.; Horwitz, M.H. Erosional and depositional characteristics of regional overwash deposits caused by multiple hurricanes. Sedimentology 2007, 54, 545–564. [Google Scholar] [CrossRef]
  12. Etienne, S.; Terry, J.P. Coral boulders, gravel tongues and sand sheets: Features of coastal accretion and sediment nourishment by Cyclone Tomas (March 2010) on Taveuni Island, Fiji. Geomorphology 2012, 175–176, 54–65. [Google Scholar] [CrossRef]
  13. Brill, D.; May, S.; Engel, M.; Reyes, M.; Pint, A.; Opitz, S.; Dierick, M.; Anne, G.L.; Esser, S.; Brückner, H. Typhoon Haiyan’s sedimentary record in coastal environments of the Philippines and its palaeotempestological implications. Nat. Hazards Earth Syst. Sci. 2016, 16, 2799–2822. [Google Scholar] [CrossRef]
  14. Duvat, V.; Magnan, A.; Étienne, S.; Salmon, C.; Pignon-Mussaud, C. Assessing the impacts of and resilience to Tropical Cyclone Bejisa, Reunion Island (Indian Ocean). Nat. Hazard. 2016, 83, 1–40. [Google Scholar] [CrossRef]
  15. Rey, T.; Le Dé, L.; Leone, F.; David, G. Leçons tirées du cyclone Pam au Vanuatu (Mélanésie): Aléas côtiers, crues éclairs et dommages. [Learning from TC Pam in Vanuatu (Melanesia): Coastal hazards, flash flood and damage]. Géomorphologie Relief Process. Environ. 2018, 23, 343–356. (In French) [Google Scholar]
  16. Boyett, R. Post-Hurricane Isaac assessment: Modeling confirms the HSDRRS had little impact on areas outside the system. Riverside Mag. (USACE—New Orleans District.) 2013, 13–14. [Google Scholar]
  17. Torres, M.A.; Jaimes, M.A.; Reinoso, E.; Ordaz, M. Event-based approach for probabilistic flood risk assessment. Int. J. River Basin Manag. 2014, 12, 377–389. [Google Scholar] [CrossRef]
  18. McInnes, K.L.; Walsh, K.J.E.; Hubbert, G.D.; Beer, T. Impact of sea level rise and storm surges on a coastal community. Nat. Hazard. 2003, 30, 187–207. [Google Scholar] [CrossRef]
  19. De La Torre, Y.; Lecacheux, S.; Pedreros, R.; Balouin, Y. Modélisation de la houle cyclonique dans le lagon de Mayotte. In Proceedings of the Xèmes Journées Nationales Génie Côtier-Génie Civil, Sophia Antipolis, France, 14–16 October 2008; pp. 325–334. [Google Scholar]
  20. Canavesio, R.; Jeanson, M.; Etienne, S. La gestion du risque cyclonique en polynésie française et ses límites: Exemple du cyclone tropical Oli, février 2010. [Cyclonic risk management and its limits in French Polynesia: Example of TC Oli, February 2010]. Bulletin de l’Association des Géographes Français 2014, 3, 396–408. (In French) [Google Scholar]
  21. Gustin, P. Repenser les Iles du Nord pour une reconstruction durable. [Rethinking Northern islands (FWI) for a sustainable recontruction]. Rapport Délégation interministérielle à la reconstruction des îles de Saint-Barthélemy et de Saint-Martin. 2017. Available online: https://www.gouvernement.fr/irma-reconstruction-des-iles-de-saint-barthelemy-et-saint-martin. (accessed on 1 September 2018). (In French).
  22. Friedland, C.J. Residential building damage from hurricane storm surge: Proposed methodologies to describe, assess and model building damage. Ph.D. Thesis, Louisiana State University, Baton Rouge, LA, USA, 2009. [Google Scholar]
  23. Kelman, I. Climate Change and Other Catastrophes: Lessons from Island Vulnerability and Resilience. Moving Worlds J. Transcult. Writ. 2014, 14, 127–140. [Google Scholar]
  24. IEDOM. Institut d’émission des Départements d’Outre-Mer. [Institute of Emission in French Overseas Departements]. Available online: https://www.iedom.fr/IMG/pdf/iedom-rapport_annuel_2018-planche_2.pdf (accessed on 15 March 2019). (In French).
  25. Cangialosi, J.P.; Latto, A.S.; Berg, R. Hurricane Irma; Tropical Cyclone Report, National Hurricane Center: Miami, FL, USA, 2018. Available online: https://www.nhc.noaa.gov/data/tcr/AL112017_Irma.pdf (accessed on 1 March 2019).
  26. Landsea, C.W. A climatology of intense (or major) Atlantic hurricanes. Mon. Weather Rev. 1993, 121, 1703–1713. [Google Scholar] [CrossRef]
  27. Knapp, K.R.; Kruk, M.C.; Levinson, D.H.; Diamond, H.J.; Neumann, C.J. The International Best Track Archive for Climate Stewardship (IBTrACS): Unifying tropical cyclone data. Bull. Amer. Meteorol. Soc. 2010, 91, 363–376. [Google Scholar] [CrossRef]
  28. Landsea, C.W.; Franklin, J.L. Atlantic hurricane database uncertainty and presentation of a new database format. Mon. Wea. Rev. 2013, 141, 3576–3592. [Google Scholar] [CrossRef]
  29. Skamarock, W.C.; Klemp, J.B.; Dudhia, J.; Gill, D.O.; Barker, D.M.; Duda, M.G.; Huang, X.Y.; Wang, W.; Powers, J.G. A Description of the Advanced Research WRF version 3. Tech. Rep. NCAR/TN-475+STR. National Center for Atmospheric Research, 2008. Available online: http://www.mmm.ucar.edu/wrf/users/docs/arw_v3.pdf (accessed on 1 April 2018).
  30. Duvat, V.; Pillet, V.; Volto, N.; Krien, Y.; Cécé, R.; Bernard, D. Geomorphology High human influence on beach response to tropical cyclones in small islands: Saint-Martin Island, Lesser Antilles. Geomorphology 2019, 325, 70–91. [Google Scholar] [CrossRef]
  31. Clayton, A.M.; Lorenc, A.C.; Barker, D.M. Operational implementation of a hybrid ensemble/4D-Var global data assimilation at the Met Office. Q. J. Roy. Meteorol. Soc. 2013, 139, 1445–1461. [Google Scholar] [CrossRef]
  32. Tolman, H.L. A third-generation model for wind waves on slowly varying, unsteady, and inhomogeneous depths and currents. J. Phys. Oceanogr. 1991, 21, 782–797. [Google Scholar] [CrossRef]
  33. Osinski, R.; Dalphinet, A.; Aouf, L.; Palany, P. Estimation of the hundred year return level of the significant wave height for the French Guiana coast. Brazil. J. Oceanogr. 2018, 66, 325–334. [Google Scholar]
  34. Bleck, R. An oceanic general circulation model framed in hybrid isopycnic cartesian coordinates. Ocean Modell. 2002, 4, 55–88. [Google Scholar] [CrossRef]
  35. Casitas, S.; Pasquet, A.; Michaud, H.; Baraille, R.; Jourdan, D. Modélisation des surcotes avec HYCOM pour les départements d’outre-mer. [Surge modelisation with HYCOM for french overseas department]. In Proceedings of the XVèmes Journées Nationales Génie Côtier–Génie Civil, La Rochelle, France, 14–16 October 2018. (In French).
  36. Faye, I. La Dynamique du trait de côte sur les littoraux sableux d’Afrique de l’Ouest. Approches régionale et locale par photo-interprétation, traitement d’images et analyse de cartes anciennes. [Coastline dynamics on the sandy coasts of West Africa. Regional and local approaches through photo-interpretation, image processing and analysis of old maps]; Thèse de doctorat de géographie, Université de Bretagne Occidentale: Brest, France, 2010. (in French) [Google Scholar]
  37. Lemoigne, B.; Paulineau, M.; Nachbaur, A.; Stépanian, A. Établissement d’un état de référence du trait de côte de la Martinique: Situation en 2010 et évolution historique depuis 1951. [Establishment of a baseline state of the coastline of Martinique: Situation in 2010 and historical evolution since 1951]; Rapport Final; BRGM/RP-61686-FR150: Orélans, France, 2013; p. 85. (In French) [Google Scholar]
  38. Terry, J.P. Geomorphic influences on the variability of coastal erosion and deposition on Ambae Island, Vanuatu, caused by Ouragan Funa in January 2008. In Advances in Geosciences; Oh, J.H., Ed.; World Scientific Publishing: Singapore, 2010; Volume 16, pp. 193–202. [Google Scholar]
  39. Zhang, K.; Liu, H.; Li, Y.; Xu, H.; Shen, J.; Rhome, J.; Smith, T.J. The role of mangroves in attenuating storm surges. Estuarine Coast. Shelf Sci. 2012, 102–103, 11–23. [Google Scholar] [CrossRef]
  40. Becker, J.J.; Sandwell, D.T.; Smith, W.H.F.; Braud, J.; Binder, B.; Depner, J.; Fabre, D.; Factor, J.; Ingalls, S.; Kim, S.-H.; et al. Global Bathymetry and Elevation Data at 30 Arc Seconds Resolution: SRTM30_PLUS. Mar. Geod. 2009, 32, 355–371. [Google Scholar] [CrossRef]
  41. Holland, G. An Analytic Model of the Wind and Pressure Profiles in Hurricanes. Mon. Weather Rev. 1980, 108, 1212–1218. [Google Scholar] [CrossRef]
  42. Emanuel, K.; Rotunno, R. Self-stratification of tropical cyclone outflow, Part I: Implications for storm structure. J. Atmos. Sci. 2011, 68, 2236–2249. [Google Scholar] [CrossRef]
  43. Krien, Y.; Arnaud, G.; Cécé, R.; Ruf, C.; Belmadani, A.; Bernard, D.; Islam, A.K.M.S.; Durand, F.; Testut, L.; Palany, P.; et al. Can We Improve Parametric Cyclonic Wind Fields Using Recent Satellite Remote Sensing Data? Remote Sens. 2018, 10, 1963. [Google Scholar] [CrossRef]
  44. Saha, S.K.; Halder, S.; Suryachandra Rao, A.; Goswami, B.N. Modulation of ISOs by land-atmosphere feedback and contribution to the interannual variability of Indian summer monsoon. J. Geophys. Res. 2012, 117, 1–14. [Google Scholar] [CrossRef]
  45. Turner, R.J. Beachrock. In Encyclopedia of Coastal Science; Schwartz, M.L., Ed.; Kluwer Academic Publishing: Amsterdam, The Netherlands, 2002. [Google Scholar]
  46. Monismith, S.G.; Rogers, J.S.; Koweek, D.; Dunbar, R.B. Frictional wave dissipation on a remarkably rough reef. Geophys. Res. Lett. 2015, 42, 4063–4071. [Google Scholar] [CrossRef]
  47. Rogers, J.S.; Monismith, S.G.; Koweek, D.A.; Dunbar, R.B. Wave dynamics of a Pacific Atoll with high frictional effects. J. Geophys. Res. Oceans. 2016, 121, 350–367. [Google Scholar] [CrossRef]
  48. Adams, B.J.; Womble, J.A.; Mio, M.Z.; Turner, J.B.; Mehta, K.C.; Ghosh, S. Field Report: Collection of Satellite-Referenced Building Damage Information in the Aftermath of Hurricane Charley; MCEER, University at Buffalo, State University of New York: New York, NY, USA, 2004; p. 16. [Google Scholar]
  49. Mese, M.D. Wind versus flood coverage and Hurricane Katrina. Class Action Litig. Rep. 2005, 6, 795–797. [Google Scholar]
  50. Hinckley, J.M. Guidelines for Determination of Wind Versus Water Causation of Hurricane Damage. In Proceedings of the Fourth Forensic Engineering Congress, Cleveland, OH, USA, 6–9 October 2006. [Google Scholar]
  51. Adams, B.J.; Womble, J.A.; Ghosh, S.; Friedland, C. Deployment of remote sensing technology for multi-hazard post-Katrina damage assessment within a spatially-tiered reconnaissance framework. In Proceedings of the Fourth International Workshop on Remote Sensing for Post Disaster Response, Cambridge, UK, 25 September 2006. [Google Scholar]
  52. Womble, J.A.; Smith, D.A.; Adams, B.J. Use of emerging remote-sensing technologies to determine neighborhood wind/water damage patterns. In Proceedings of the Structures Congress 2008, Vancouver, BC, Canada, 24–26 April 2008. [Google Scholar]
  53. Rey, T.; Le Dé, L.; Leone, F.; Gilbert, D. An integrative approach to understand vulnerability and resilience post-disaster: The 2015 cyclone Pam in urban Vanuatu as case study. Disaster Prev. Manag. 2017, 26, 259–275. [Google Scholar] [CrossRef]
  54. Herteman, M. Analyse et diagnostic écologique post-cyclone Irma 2017 à Saint-Martin. [Ecological analysis and diagnostic after TC Irma (2017) in Saint-Martin]. Rapport, compte du Conservatoire du Littoral, French. July 2018; 93. (In French) [Google Scholar]
  55. Griggs, G. Coasts in Crisis: A Global Challenge, 1st ed.; University of California Press: Oakland, CA, USA, 2017; p. 360. [Google Scholar]
  56. Kelletat, D.; Schellmann, G. Tsunamis on Cyprus: Field evidences and 14C dating results. Zeitschrift fur Geomorphologie (NF) 2002, 46, 19–34. [Google Scholar] [CrossRef]
  57. Pillet, V.; Duvat, V.K.E.; Krien, Y.; Cécé, R.; Arnaud, G.; Pignon-Mussaud, C. Assessing the impacts of shoreline hardening on beach response to hurricanes: Saint-Barthélemy, Lesser Antilles. Ocean Coast. Manag. 2019, 174, 71–91. [Google Scholar] [CrossRef]
  58. Gawehn, M.; van Dongeren, A.; van Rooijen, A.; Storlazzi, C.D.; Cheriton, O.M.; Reiniers, A. Identification and classification of very low frequency waves on a coral reef flat. J. Geophys. Res. Oceans 2016, 121, 7560–7574. [Google Scholar] [CrossRef]
  59. CNES. Post-event image: Pleiades-1B© CNES (2017), distributed by Airbus DS (acquired on 10/09/2017 at 14:40, GSD 0.5 m, approx. 40% cloud coverage in AoI, 16.2° off-nadir angle). 2017. Available online: https://emergency.copernicus.eu/mapping/system/files/components/EMSR232_05GRANDCASE_02GRADING_MAP_v2_200dpi.pdf (accessed on 1 November 2017).
  60. Copernicus EMS. Mapping activation EMSR232, Grand Case & Marigot: Grading Map, scale 1:14000, published 2017-09-21, product version: v2, quality approved. 2017. Available online: https://emergency.copernicus.eu/mapping/list-of-components/EMSR232 (accessed on 1 November 2017).
  61. SERTIT. Évaluation des dommages, situation mi-septembre 2017: Saint-Martin. [Damage Assessing, mid-september 2017 Situation: Saint Martin]. Echelle 1:23000. Available online: http://sertit.u-strasbg.fr/RMS/action.php?id=1165404211#P1 (accessed on 1 December 2017).
  62. CEREMA & DEAL Guadeloupe. Aléa submersion marine actualisé par l’évènement IRMA du 6 septembre 2017. [Storm surge hazard including TC IRMA (6th 2017)].. Available online: http://www.com-saint-martin.fr/ (accessed on 15 January 2018). (In French).
  63. Del Gaudio, C.; De Martino, G.; Di Ludovico, M.; Manfredi, G.; Prota, A.; Ricci, P. Verderame GM. Empirical fragility curves from damage data on RC buildings after the 2009 L’Aquila earthquake. Bull. Earthq. Eng. 2017, 15, 1425–1450. [Google Scholar] [CrossRef]
  64. Valencia, N.; Gardi, A.; Gauraz, A.; Leone, F.; Guillande, R. New tsunami damage functions developed in the framework of SCHEMA project: Application to European-Mediterranean coasts. Nat. Hazards Earth Syst. Sci. 2011, 11, 2835–2846. [Google Scholar] [CrossRef]
  65. Giardino, A.; Nederhoff, K.; Vousdoukas, M. Coastal hazard risk assessment for small islands: Assessing the impact of climate change and disaster reduction measures on Ebeye (Marshall Islands). Reg. Environ. Change 2018, 18, 2237–2248. [Google Scholar] [CrossRef]
  66. Ding, D.; Yang, J.; Li, G.; Dada, O.A.; Gong, L.; Wang, N.; Wang, X.; Zhang, B. A geomorphological response of beaches to Typhoon Meari in the eastern Shandong Peninsula in China. Acta Oceanol. Sin. 2015, 34, 126–135. [Google Scholar] [CrossRef]
  67. Woodruff, J.D.; Irish, J.L.; Camargo, S.J. Coastal flooding by tropical cyclones and sea-level rise. Nature 2013, 504, 44–52. [Google Scholar] [CrossRef] [PubMed] [Green Version]
  68. Mortlock, T.R.; Metters, D.; Soderholm, J.; Maher, J.; Lee, S.B.; Boughton, G.; Stewart, N.; Zavadil, E.; Goodwin, I.D. Extreme water levels, waves and coastal impacts during a severe tropical cyclone in northeastern Australia: A case study for cross-sector data sharing. Nat. Hazards Earth Syst. Sci. 2018, 18, 2603–2623. [Google Scholar] [CrossRef]
  69. Narayan, S.; Beck, M.W.; Reguero, B.G.; Losada, I.J.; van Wesenbeeck, B.; Pontee, N. The Effectiveness, Costs and Coastal Protection Benefits of Natural and Nature-Based Defences. PLoS ONE 2016, 11, e0154735. [Google Scholar] [CrossRef] [PubMed]
  70. Darryl, D.E.; Mitsch, V.J. Coastal protection from tsunamis and cyclones provided by mangrove wetlands—A review. Int. J. Biodivers. Sci. Ecosyst. Serv. Manag. 2015, 11, 71–83. [Google Scholar]
  71. Imbert, D. Hurricane disturbance and forest dynamics in east Caribbean mangroves. Ecosphere 2018, 9, e02231. [Google Scholar] [CrossRef] [Green Version]
  72. Nicholls, R.J.; Wong, P.P.; Burkett, V.R.; Codignotto, J.O.; Hay, J.E.; McLean, R.F.; Ragoonaden, S.; Woodroffe, C.D. Coastal systems and low-lying areas. Climate Change 2007: Impacts, Adaptation and Vulnerability. In Contribution of Working Group II to the Fourth Assessment Report of the Intergovernmental Panel on Climate Change; Cambridge University Press: Cambridge, UK, 2007; pp. 315–356. [Google Scholar]
  73. Etienne, S. Marine inundation hazards in French Polynesia: Geomorphic impacts of tropical cyclone Oli in February 2010. In Natural Hazards in the Asia-Pacific Region: Recent Advances and Emerging Concepts; Terry, J., Goff, J., Eds.; Geological Society: London, UK, 2012; Volume 361, pp. 21–39. [Google Scholar]
Figure 1. Location of study sites on Saint-Martin.
Jmse 07 00215 g001
Figure 2. Location of study sites on Saint-Barthélemy.
Jmse 07 00215 g002
Figure 3. Frequency of (a,b) all TCs and (c,d) Major Hurricanes (MH from category 3 to category 5) in (a,c) the North Atlantic basin and (b,d) the Lesser Antilles region from 1945 to 2016, expressed as average numbers per decade. TC center position data from the International Best Tracks Archive for Climate Stewardship (IBTrACS, [27] version 3.10 were projected onto regular (a,c) 0.5° × 0.5° and (b,d) 1/8° × 1/8° grids (the latter to better account for regional-scale variations in TC frequency), and a Gaussian decay in TC counts with a 100-km e-folding scale was applied to account for TC influence away from the center and to reduce noise originating from the relatively small number of TCs on record. Note the difference in color scales and contour intervals between the four panels. Saint-Martin is located just south of Anguilla and northwest of the smaller Saint-Barthélemy at approximately 63°W, 18°N.
Jmse 07 00215 g003
Figure 4. (a) Number of tropical depressions (TD), tropical storms (TS), and hurricanes from category 1 to 5 (H1 to H5) between 1945 and 2017 whose center approached Saint-Martin (63.1°W, 18.1°N) by a distance of 100 km or less according to HURDAT2 Atlantic TC best-track data [28]. TC type is that when the TCs were closest to Saint-Martin. (b) Minimum distance from Saint-Martin to TC center (km) as a function of MSW (km/h) for the 14 hurricanes displayed on a).
Jmse 07 00215 g004
Figure 5. Characteristics of Hurricane Irma: (a) Track of Irma (08/30–09/13/2017) in the North Atlantic from the Cape-Verde area to the North American continent from HURDAT2 data. The insert focuses on Irma’s landfall over the islands of Barbuda, Saint-Barthélemy and Saint-Martin, which was struck on 09/06/17 at 11:15 UTC. (b) Wind gust time series (km/h) recorded in Gustavia, Saint-Barthélemy on 09/06/17. (c) Simulated peak wind gusts (km/h) at 280 m scale over Saint-Martin from the WRF model. (d) Significant wave height (m) around Saint-Martin on 09/06/17 11:00 UTC from the WaveWatchIII model. (e) Radar reflectivity on 09/06/2017 10:30 UTC from the Météo-France radar in Guadeloupe. Numbers expressed in dBZ are the exact values. Values in mm/h are provided as a reference only.
Jmse 07 00215 g005aJmse 07 00215 g005b
Figure 6. Wind and marine Flood Damage intensity Scale for buildings (WFDS) designed for field and UAV surveys.
Jmse 07 00215 g006
Figure 7. Examples of impacts of Hurricane Irma on coastal buildings and coastal protection structures. (a) Foundation undermining and overall significant damaged; (b) vertical scouring and wall collapse; (c) riprap displacement and sediment transfer to the hotel; (d) stone displacement and room filled with boulders, cobbles and sand.
Jmse 07 00215 g007
Figure 8. Hurricane Irma: coastal change and maximum flood extent (measured) in three urbanized areas on Saint-Martin: (a) Nettle Bay; (b) Grand Case; (c) Orient Bay.
Jmse 07 00215 g008
Figure 9. Morphological impacts of Hurricane Irma: (a) beach erosion; (b) dune erosion and uprooted vegetation.
Jmse 07 00215 g009
Figure 10. Hurricane Irma: coastal change and maximum flood extent (measured) in two non-urbanized areas on Saint-Barthélemy and Saint-Martin: (a) Toiny Bay; (b) Orient Bay (North).
Jmse 07 00215 g010
Figure 11. Sediment transfer by Hurricane Irma.
Jmse 07 00215 g011
Figure 12. Maximum simulated significant wave heights (in meters) and mean wave directions (vectors) at the peak for Saint-Martin (a) and Saint-Barthélemy (b).
Jmse 07 00215 g012
Figure 13. Maximum computed water levels (in meters) for: (a) Grand Case, (b) Toiny, (c) Saint-Martin, (d) Saint-Barthélemy, (e) Orient Bay. (f) shows the inundation depth (in meters) estimated by the numerical model for Orient Bay.
Jmse 07 00215 g013
Figure 14. Building damage intensity maps for 3 study areas on Saint-Martin (a,b,c) and distribution of damage intensity according to marine flood depth (d).
Jmse 07 00215 g014
Figure 15. Comparison and co-visualization of damage assessment to buildings from field & UAV surveys (GRED) from estimation of satellite operators (Copernicus EMS) (sector of Grand-Case, St-Martin).
Jmse 07 00215 g015

