1. Introduction
Vortex-induced vibration (VIV) is a typical fluid-structure interaction behavior, which has significant effects on slender structures, such as marine risers [
1], tall buildings [
2], cables of bridges [
3], and receiver tubes of concentrated solar power plants [
4]. In recent years, a great deal of effort has been made to reveal the mechanism of VIV and some milestone findings have been reported in several review works of Sarpkaya [
5], Gabbai and Benaroya [
6], Williamson and Govardhan [
7], Wu, et al. [
8], and Rashidi, et al. [
9].
One key parameter, the mass ratio
m*, which characterizes the structural mass
ms relative to the mass of displaced fluid
ρπD2/4 (where
ρ is the fluid density and
D is the cylinder diameter), has a significant influence on the VIV characteristic of a circular cylinder. It is well known that cylinders with low mass ratios have much broader lock-in ranges than those with high mass ratios. Furthermore, high mass ratio cylinders are less influenced by the variation of the added mass coefficient, because the added mass is a lower percentage of the total mass per unit length [
7,
10].
The vibration frequency and amplitude of an elastically mounted rigid circular cylinder with high mass ratio in air undergoing cross-flow (CF) VIV have been well characterized by Feng [
11]. It was found that there were two types of amplitude response depending upon the mass-damping parameter
Cn (where
Cn = 2
m ×
ζ, being
ζ the structural damping ratio), namely the initial and lower branches. However, the VIV response at low mass ratio and low mass-damping are different. Comparisons of VIV responses in water and air were made by Khalak and Williamson [
12]. It was observed that a low mass ratio yielded a much higher peak amplitude. Moreover, the VIV response not only contains the initial and lower branches, but also includes a much higher “upper response branch” between them. Govardhan and Williamson [
13,
14] studied the CF VIV of an elastically-mounted rigid cylinder at low mass-damping conditions. Large-amplitude vibrations were observed once the mass ratio was less than a critical value of 0.542. Meanwhile, the extension of large-amplitude response regarding flow velocity tends to be infinite.
Low mass ratio and high aspect ratio
L/D (where
L is the structural length) flexible cylinders (e.g., risers, tendons and marine cables) have been widely used in ocean and offshore engineering; consequently, much research attention has been made. Willden and Graham [
15] numerically studied the CF VIV of a long (
L/D = 1544), flexible pipe in uniform flow field. Its mass ratio varied from 1.0–3.0 and its effect on VIV behaviors was examined. It was shown that the long flexible pipe vibrated in a multi-modal form and the excited modes responded at the Strouhal frequency. Trim, et al. [
16] conducted experiments to study the VIV response of a marine riser in uniform and linear shear currents. The riser model had a mass ratio of 1.60 and an aspect ratio of 1405. It was found that in-line (IL) fatigue damage of the marine riser was as severe as CF fatigue damage. Chaplin, et al. [
17] measured the VIV response of a vertical tension riser in stepped flows by vertically towing a pipe model of length 13.12 m, diameter 2.8 cm (i.e.,
L/D = 468.5), and mass ratio 3.0 along a towing tank. It was observed that CF response could be excited to the 8th mode and the standard deviation of vibration amplitude ratio was close to 0.53. With the help of digital particle image velocimetry (DPIV) technique, Xu, et al. [
18] investigated the velocity and vorticity fields in the vicinity of a flexible riser with a mass ratio of 1.35 and an aspect ratio of 181. The Reynolds numbers covered the range of 9400–47,000. Three vortex modes ‘2P’, ‘2S’, and ‘P+S’ were identified in the near wake of the riser. Huera-Huarte and Bearman [
19,
20] performed an experimental investigation on a single vertical riser of length 1.5 m, external diameter 16.0 mm (i.e.,
L/D = 93.75), and mass ratio 1.8 in a stepped flow. It was reported that the maximum dimensionless CF vibration amplitude and mean drag coefficient were approximately 0.7 and 3.0, respectively. Moreover, accompanied by the increasing reduced velocity, the drag effect was significantly amplified with increasing bi-directional response in the lock-in region. Song, et al. [
21] experimentally studied the VIV response of a long riser model with a mass ratio of 1.0 and an aspect ratio of 1750. CF and IL amplitudes were measured to be almost 2.8
D and 1.3
D, respectively. Huera-Huarte, et al. [
22] found that, for a flexible cylinder with mass ratios of 1.1 and 2.7, the maximum VIV displacement amplitude was larger than 3.0
D. More recently, our term carried out towing tank experiments to study the streamwise VIV of a flexible cylinder with a mass ratio of 1.39 and an aspect ratio of 195.5 [
23].
Several conclusions can already be drawn from the above literature: (a) the amplitude response significantly increases with the decrease of mass ratio and mass-damping parameter [
7,
10,
13]; (b) the VIV characteristic of a low mass ratio cylinder is more complicated than that of a high mass ratio cylinder due to the influence of the added mass [
11,
12]; (c) the vibration feature of an elastically mounted rigid cylinder with critical mass ratio have been studied thoroughly [
13,
14]. However, up to now, few works are available on the hydrodynamics of flexible cylinders with very low mass ratios, despite the experimental works of Seyed-Aghazadeh and Modarres-Sadeghi [
24] which investigated the VIV response of a flexible cylinder of mass ratio 0.47 and aspect ratio 67 by using a reconstruction algorithm. In this paper, a series of experimental tests were carried out to study the CF VIV responses of and hydrodynamic forces on a flexible pipe with a critical mass ratio 0.54 and an aspect ratio 181.8. The displacement amplitude, response frequency, fluid forces (including mean drag force, lift force, and added mass force) were studied and discussed. It is expected that the present results can improve the understanding of VIV characteristic of a long flexible and low mass ratio pipe. Thus, they are of high significance for the design of flexible slender structures in ocean and offshore engineering.
The organization of the rest of the paper is as follows.
Section 2 describes the experimental setup.
Section 3 introduces the reconstruction algorithm used for transferring the strain signals to displacement responses.
Section 4 presents and analyzes the measurement results. Finally, some conclusions as well as future prospect are drawn in
Section 5.
2. Experimental Setup
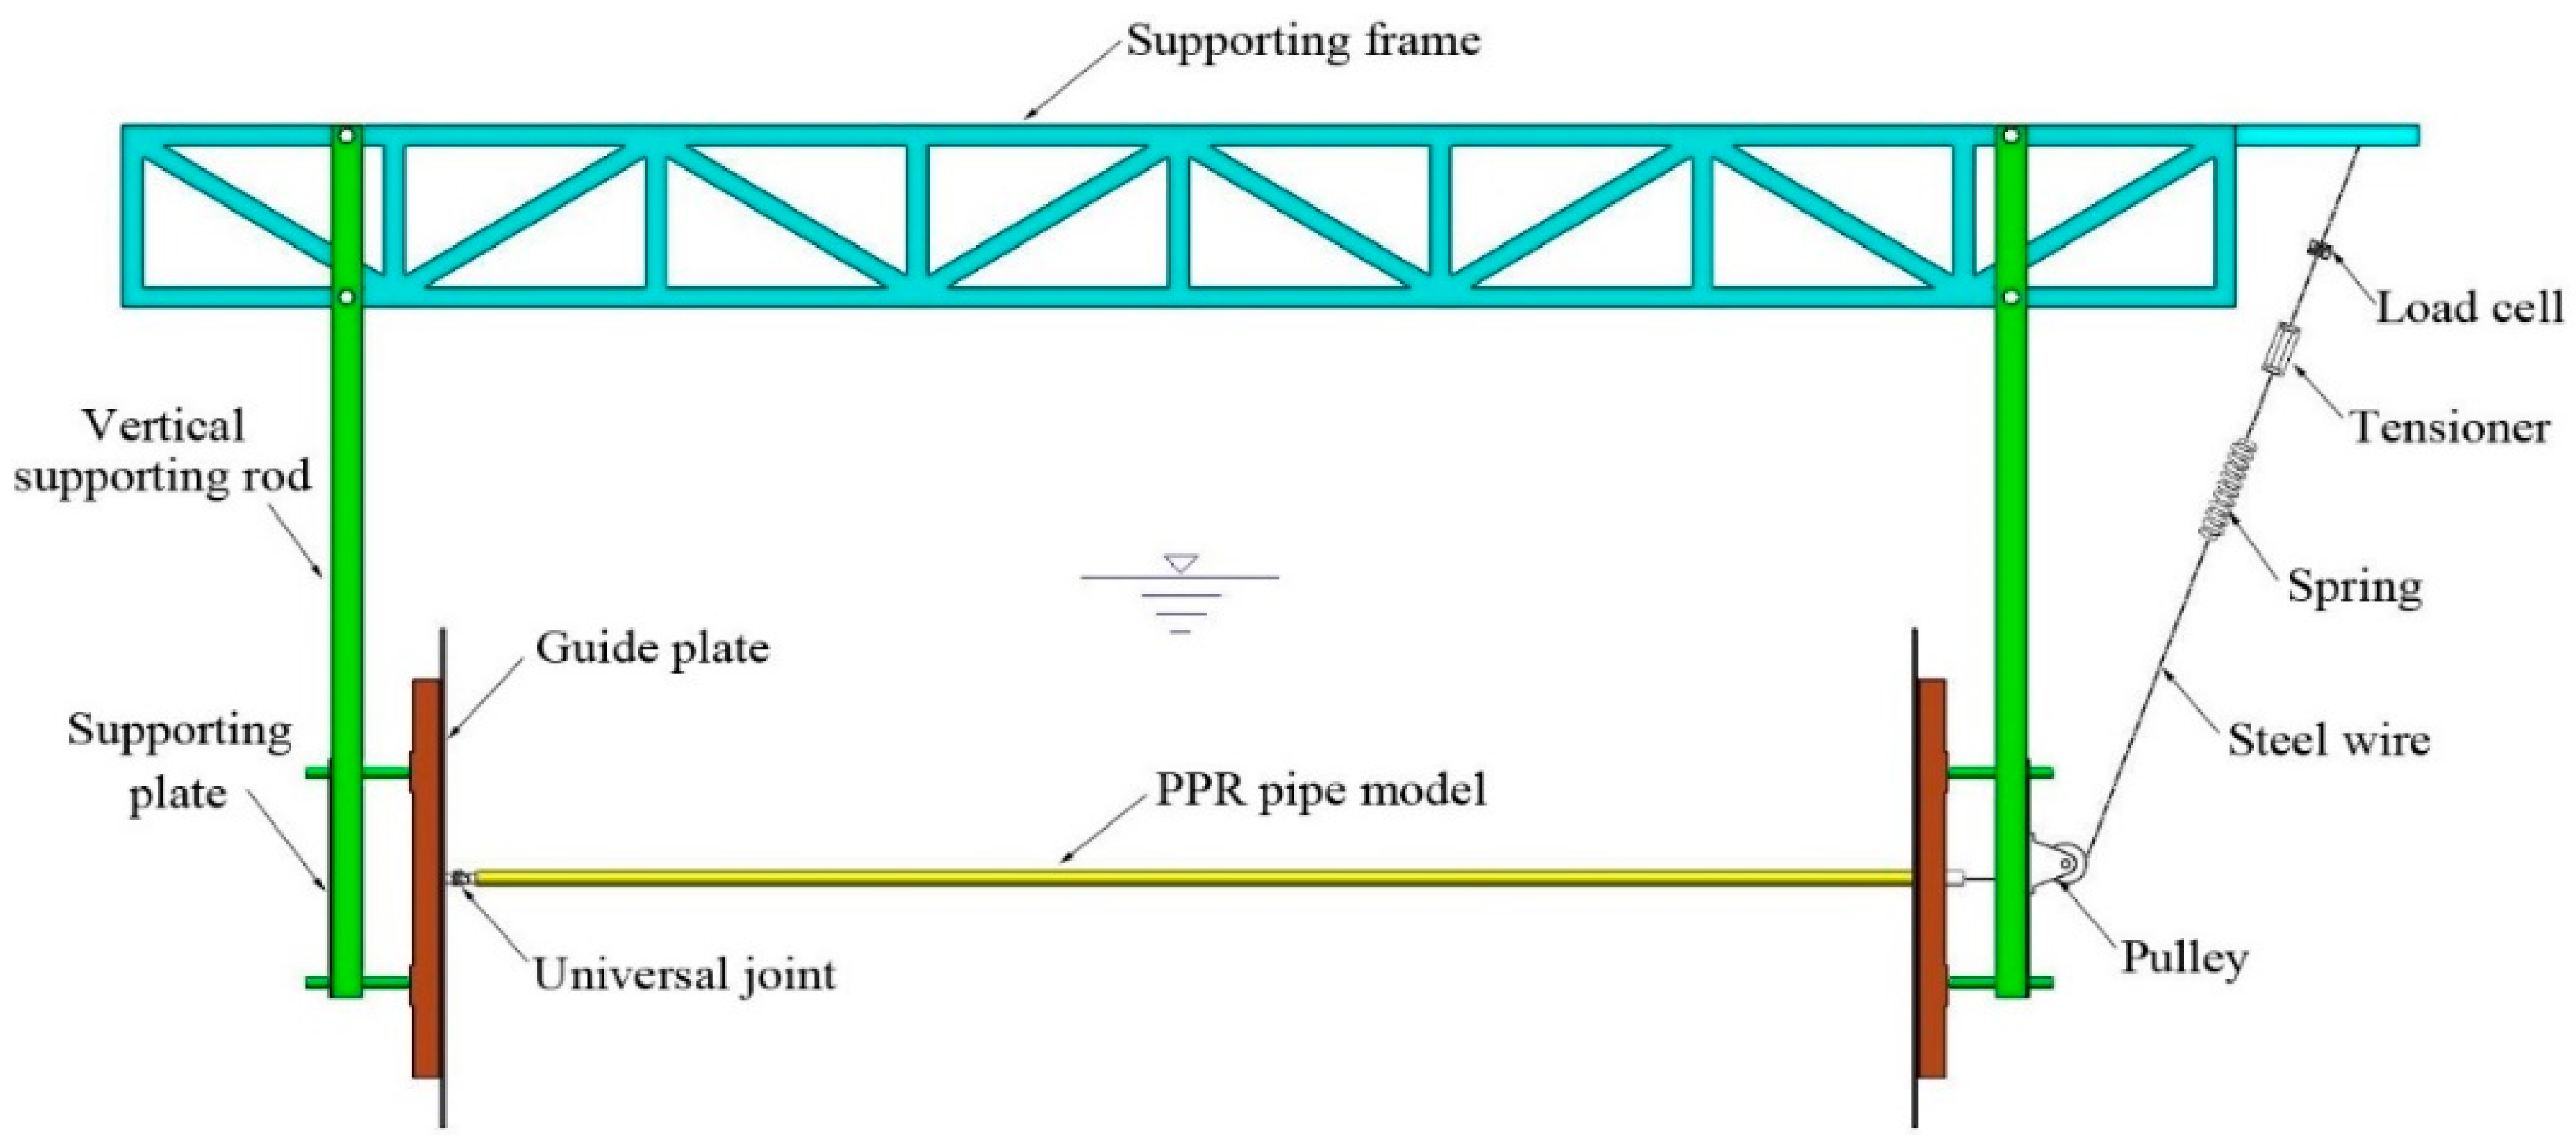
The experiment was performed in a 137-m-long, 7-m-wide, and 3.3-m-deep towing tank at the State Key Laboratory of Hydraulic Engineering Simulation and Safety, Tianjin University. The experimental device mainly consisted of four parts: a polypropylene random (PPR) pipe model, an axial tension adjustment device, a vertical supporting system, and a horizontal supporting frame. The pipe model was fixed on a moving carriage. During the tests, it was towed in still water along the water tank to implement a uniform fluid flow condition. A similar device has been used in our earlier experiments, in which the streamwise VIV [
23] and the VIV reduction of a flexible cylinder fitted with helical strakes [
25,
26] were studied.
Figure 1 shows the sketch of the experimental setup.
The pipe was made of PPR due to its small density and strong deformation resistivity. The mass per unit length of the PPR pipe model was 0.205 kg/m, so the mass ratio is approximately equal to 0.54. The value is close to the critical mass ratio of an elastically mounted rigid circular cylinder undergoing VIV [
13,
14]. The pipe was 4.0 m long and had a small bending stiffness,
EI = 4.88 Nm
2 (where
E is the Young’s modulus and
I is the moment of inertia).
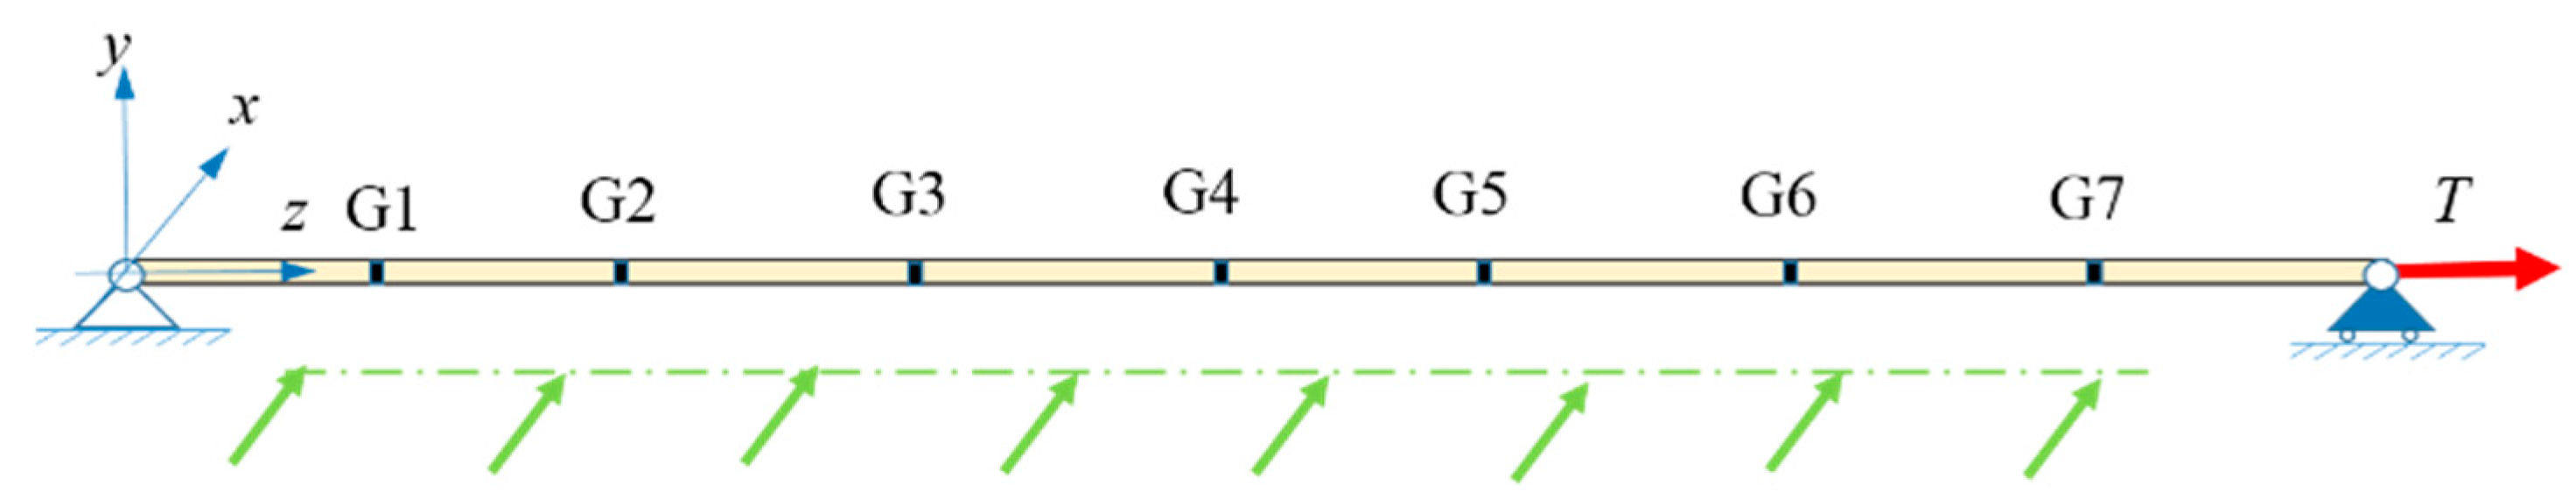
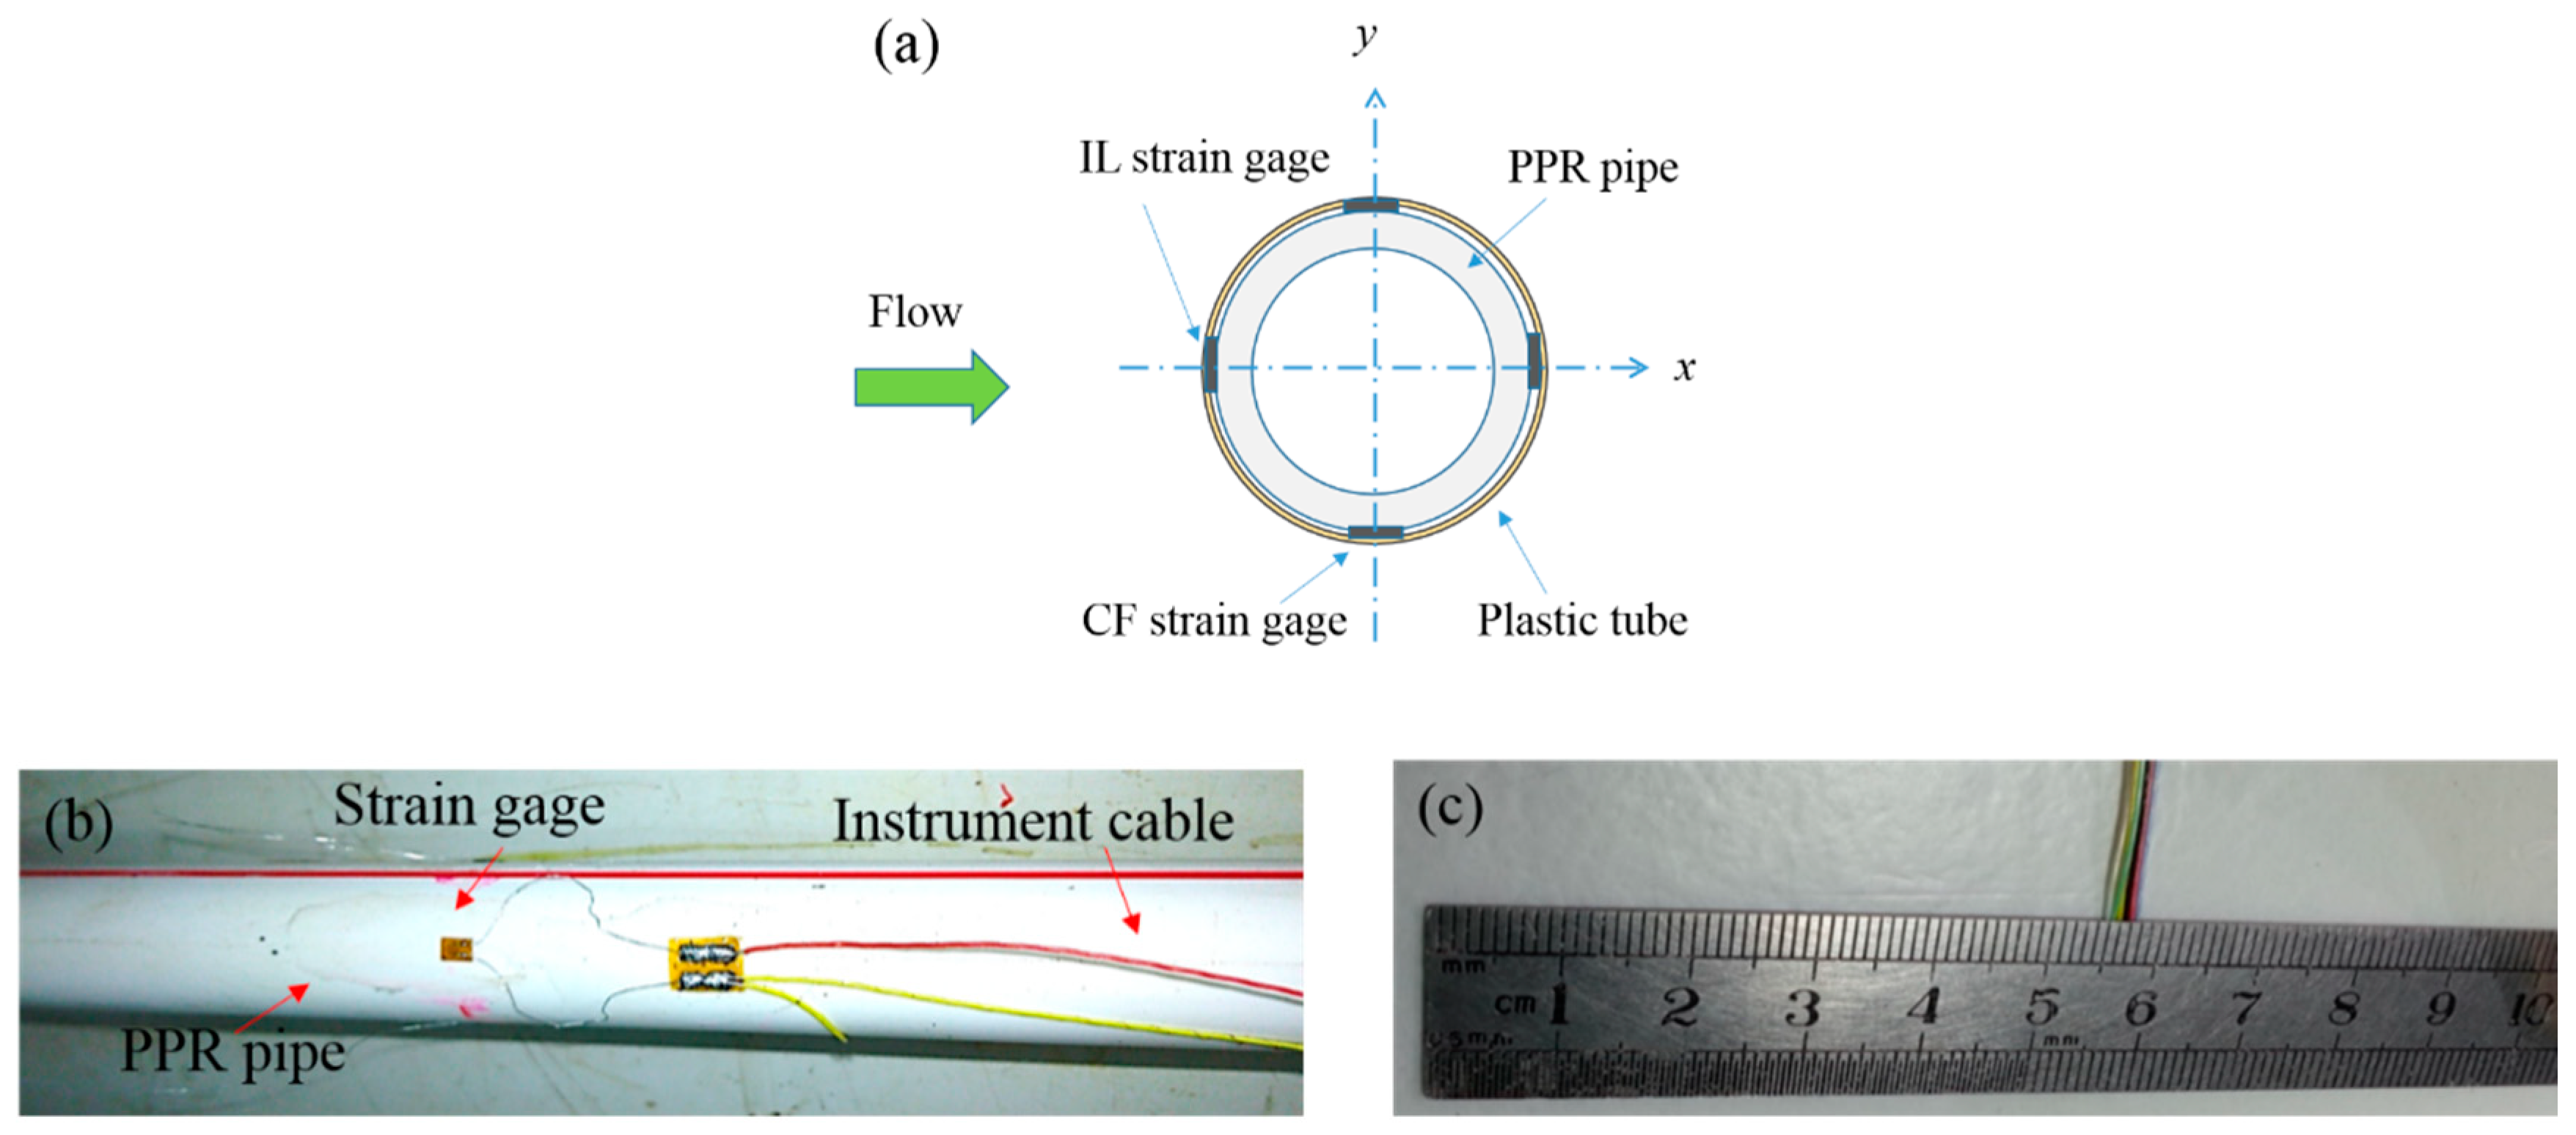
Figure 2 illustrates the seven measurement positions G1–G7 that evenly distributed along the pipe. At each position, as shown in
Figure 3, four resistance strain gages were pasted to the outer surface of pipe. Among them, two gages were oriented toward the
x-direction (IL) while the other two gages were oriented toward the
y-direction (CF). A heat shrink tube was covered on the outer surface of PPR pipe. In this way, a smooth wall boundary was implemented and the instrumentation cables and strain gages could be protected and insulated from the fluid. The final external diameter of the pipe model was 22.0 mm and the aspect ratio was equal to 181.8.
The axial pre-tension in the experiment is a parameter needs to be carefully weighed. On the one hand, there will be a considerable drag-induced IL deflection if the axial pre-tension is small. On the other hand, a large pre-tension will lead to a very stiff pipe. Thus, high mode responses of VIV can only be excited in the case of high towing velocities. After a reasonable trade off, two axial tension forces (
T = 200 N and 300 N) were adopted in our experiment. They were exerted through adjusting the tensioner. A load cell was used to measure real-time axial tension on the vibrating pipe. Free decay tests were performed in the air and still water, respectively. It showed that the damping ratio of the pipe in the air was 0.0082 and the CF fundamental frequencies in the water were 2.32 Hz and 2.83 Hz with respect to the two axial tension forces. All main physical properties of PPR pipe are summarized in
Table 1.
The vertical supporting system was composed of two vertical supporting rods, two supporting plates and two guide plates. The vertical supporting rods were fixed to the horizontal supporting frame at its top end. On the bottom end, it was connected with the supporting plates. Parallel to the supporting plates, there mounted two guide plates. The guide plates were designed to weaken the flow disturbance caused by the supporting plates and vertical supporting rods. One end of the pipe was pinned connected with the guide plate through a universal joint, while the other end was treated as a simple support condition. Thus, the pipe could bend in both IL and CF directions, but its torsion and translation were resisted. Furthermore, the axial elongation of the pipe was free. It was controlled by a steel wire that passed through the hollow poles on the supporting plate and connected to a spring.
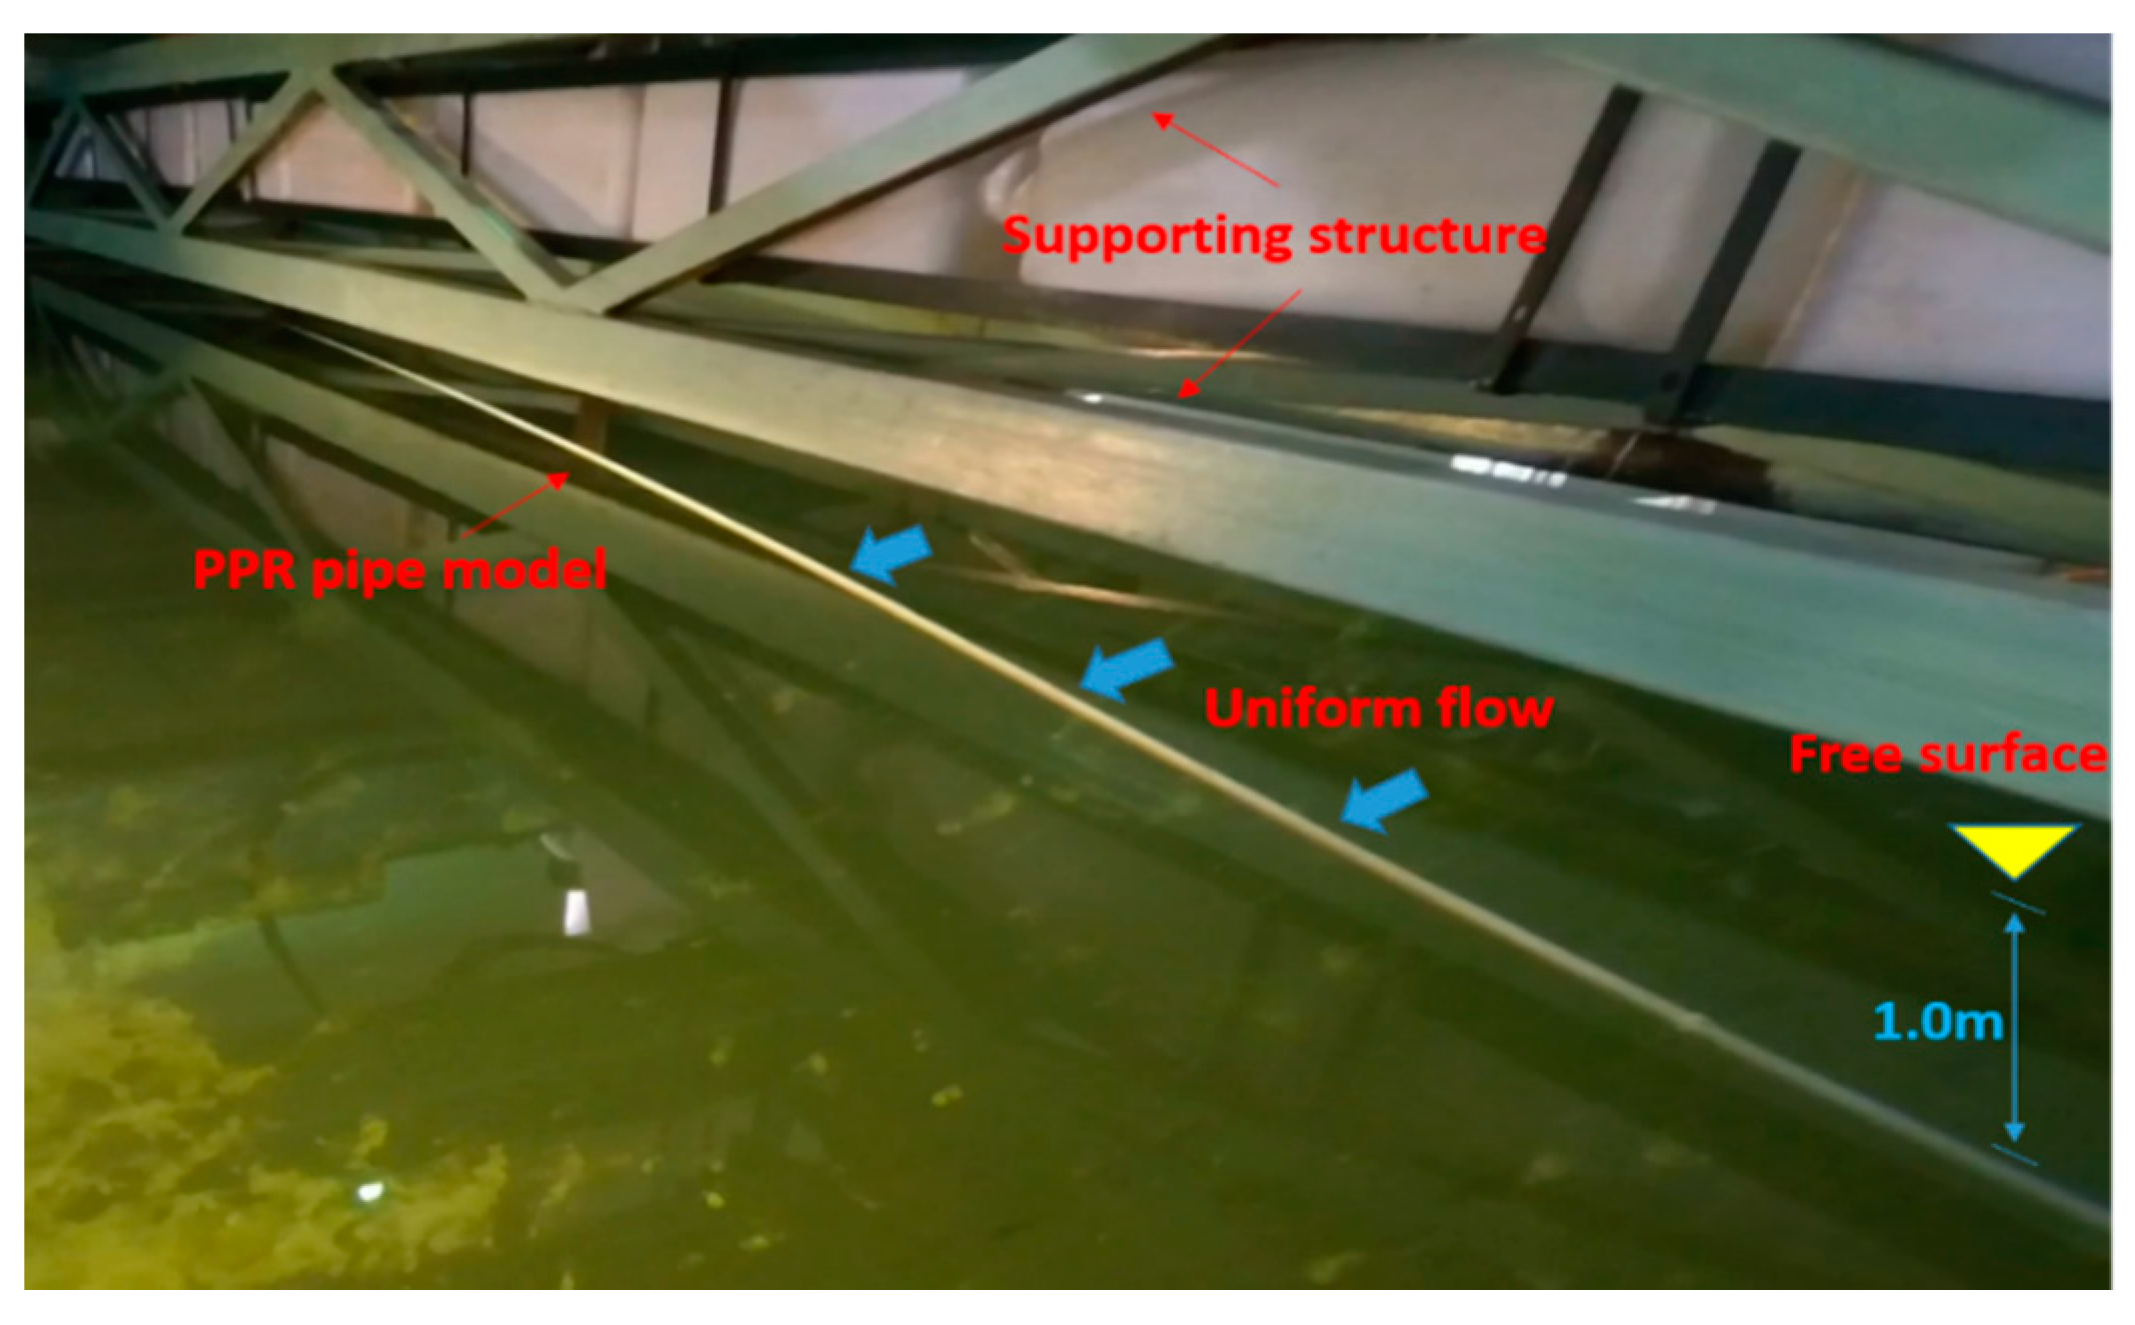
The horizontal supporting structure refers to the truss structure that mounted on the moving carriage. To avoid the free-surface effect, the pipe model was submerged 1.0 m below the still water level. The scheme of the experimental installation is shown in
Figure 4. The towing velocity of the carriage ranged from 0.1–1.0 m/s with an increment of 0.05 m/s, yielding a maximum Reynolds number of 2.2 × 10
4. A sampling frequency of 100 Hz was adopted. It was in accordance with the Nyquist–Shannon sampling theorem, so the discrete strain signals were able to reflect the whole information of a continuous signal. Nearly 40 runs were performed in the experiment. Each run lasted for a duration of 50 s. Two consecutive runs were brought to at least 15 min halt to calm down the disturbing water.
3. Data Analysis
This paper was concerned with the CF displacement response of the pipe model, while the measured signals were the structural strains at positions G1–G7. Therefore, a reconstruction algorithm based on the model analysis technique was adopted. It was originally proposed by Lie and Kaasen [
27] and subsequently applied in the experimental works of [
16,
17,
21,
22,
23,
25,
26,
27,
28].
In the linear regime, the CF displacement of a flexible pipe
y(
z,
t) can be written as the sum of the products of a series of mode shapes and their corresponding modal weights:
where
t is the time,
z is the coordinate along the pipe axis,
n is the mode number,
wn (
t) is the modal weight, and
φn (
z) is the mode shape.
For a simply supported pipe as shown in
Figure 2,
φn (
z) has the following form:
where
L is the pipe length.
The curvature of a flexible pipe
κ(
z,t) is defined as:
Also,
κ(
z,t) can be calculated by:
where
ɛ(z,
t) is the strain of the pipe and
R is the outer radius of the pipe. Hence:
Substituting Equation (1) into Equation (5), we have:
By solving Equation (6) using the strain signals measured at positions G1–G7, the unknown modal weights
wn (
t) can be obtained. Note that since seven measurement positions are set, the infinite expansion on the right hand side of Equation (6) is truncated after the first seven terms. That is to say,
n = 1, 2, …, 7. The truncation error of Equation (6) is negligible, because as shown in
Figure 5 and
Figure 6 VIV responses of orders higher than three can hardly be observed. After obtaining
wn (
t), the CF displacement of at any positions along the pipe axis can be calculated by using Equation (1). The interested reader is referred to the works of Trim, et al. [
16], Chaplin, et al. [
17], and Lie and Kaasen [
27] for more details about the modal analysis technique.
Two points need to be mentioned before applying the above approach for displacement reconstruction. One is that the CR strains measured by strain gages are composed of two parts: the tensile strain due to the axial pretension and the tensile or compressive strains caused by VIV bending. Between them, the latter strains should be used when calculating wn(t). They can be obtained by subtracting the pretension-induced strain measured by the load cell from the composite strains. The other one is that a band pass filtering operation should be taken to remove the undesirable frequencies. Frequencies lower than 1.0 Hz are excluded from the strain signal to eliminate the interference from the carriage and supporting structure. The value is chosen to be less than half of the fundamental vibration frequency of the pipe in water. Meanwhile, frequencies higher than 40.0 Hz are cut off to avoid the 50.0-Hz-noise of alternating current (AC) signal. It is sufficiently large to cover high-order vibration frequencies concerned in this study.
4. Results and Discussion
In this section, the CF VIV features of the flexible pipe of a critical mass ratio is investigated by sequentially analyzing the strain, displacement, and fluid force.
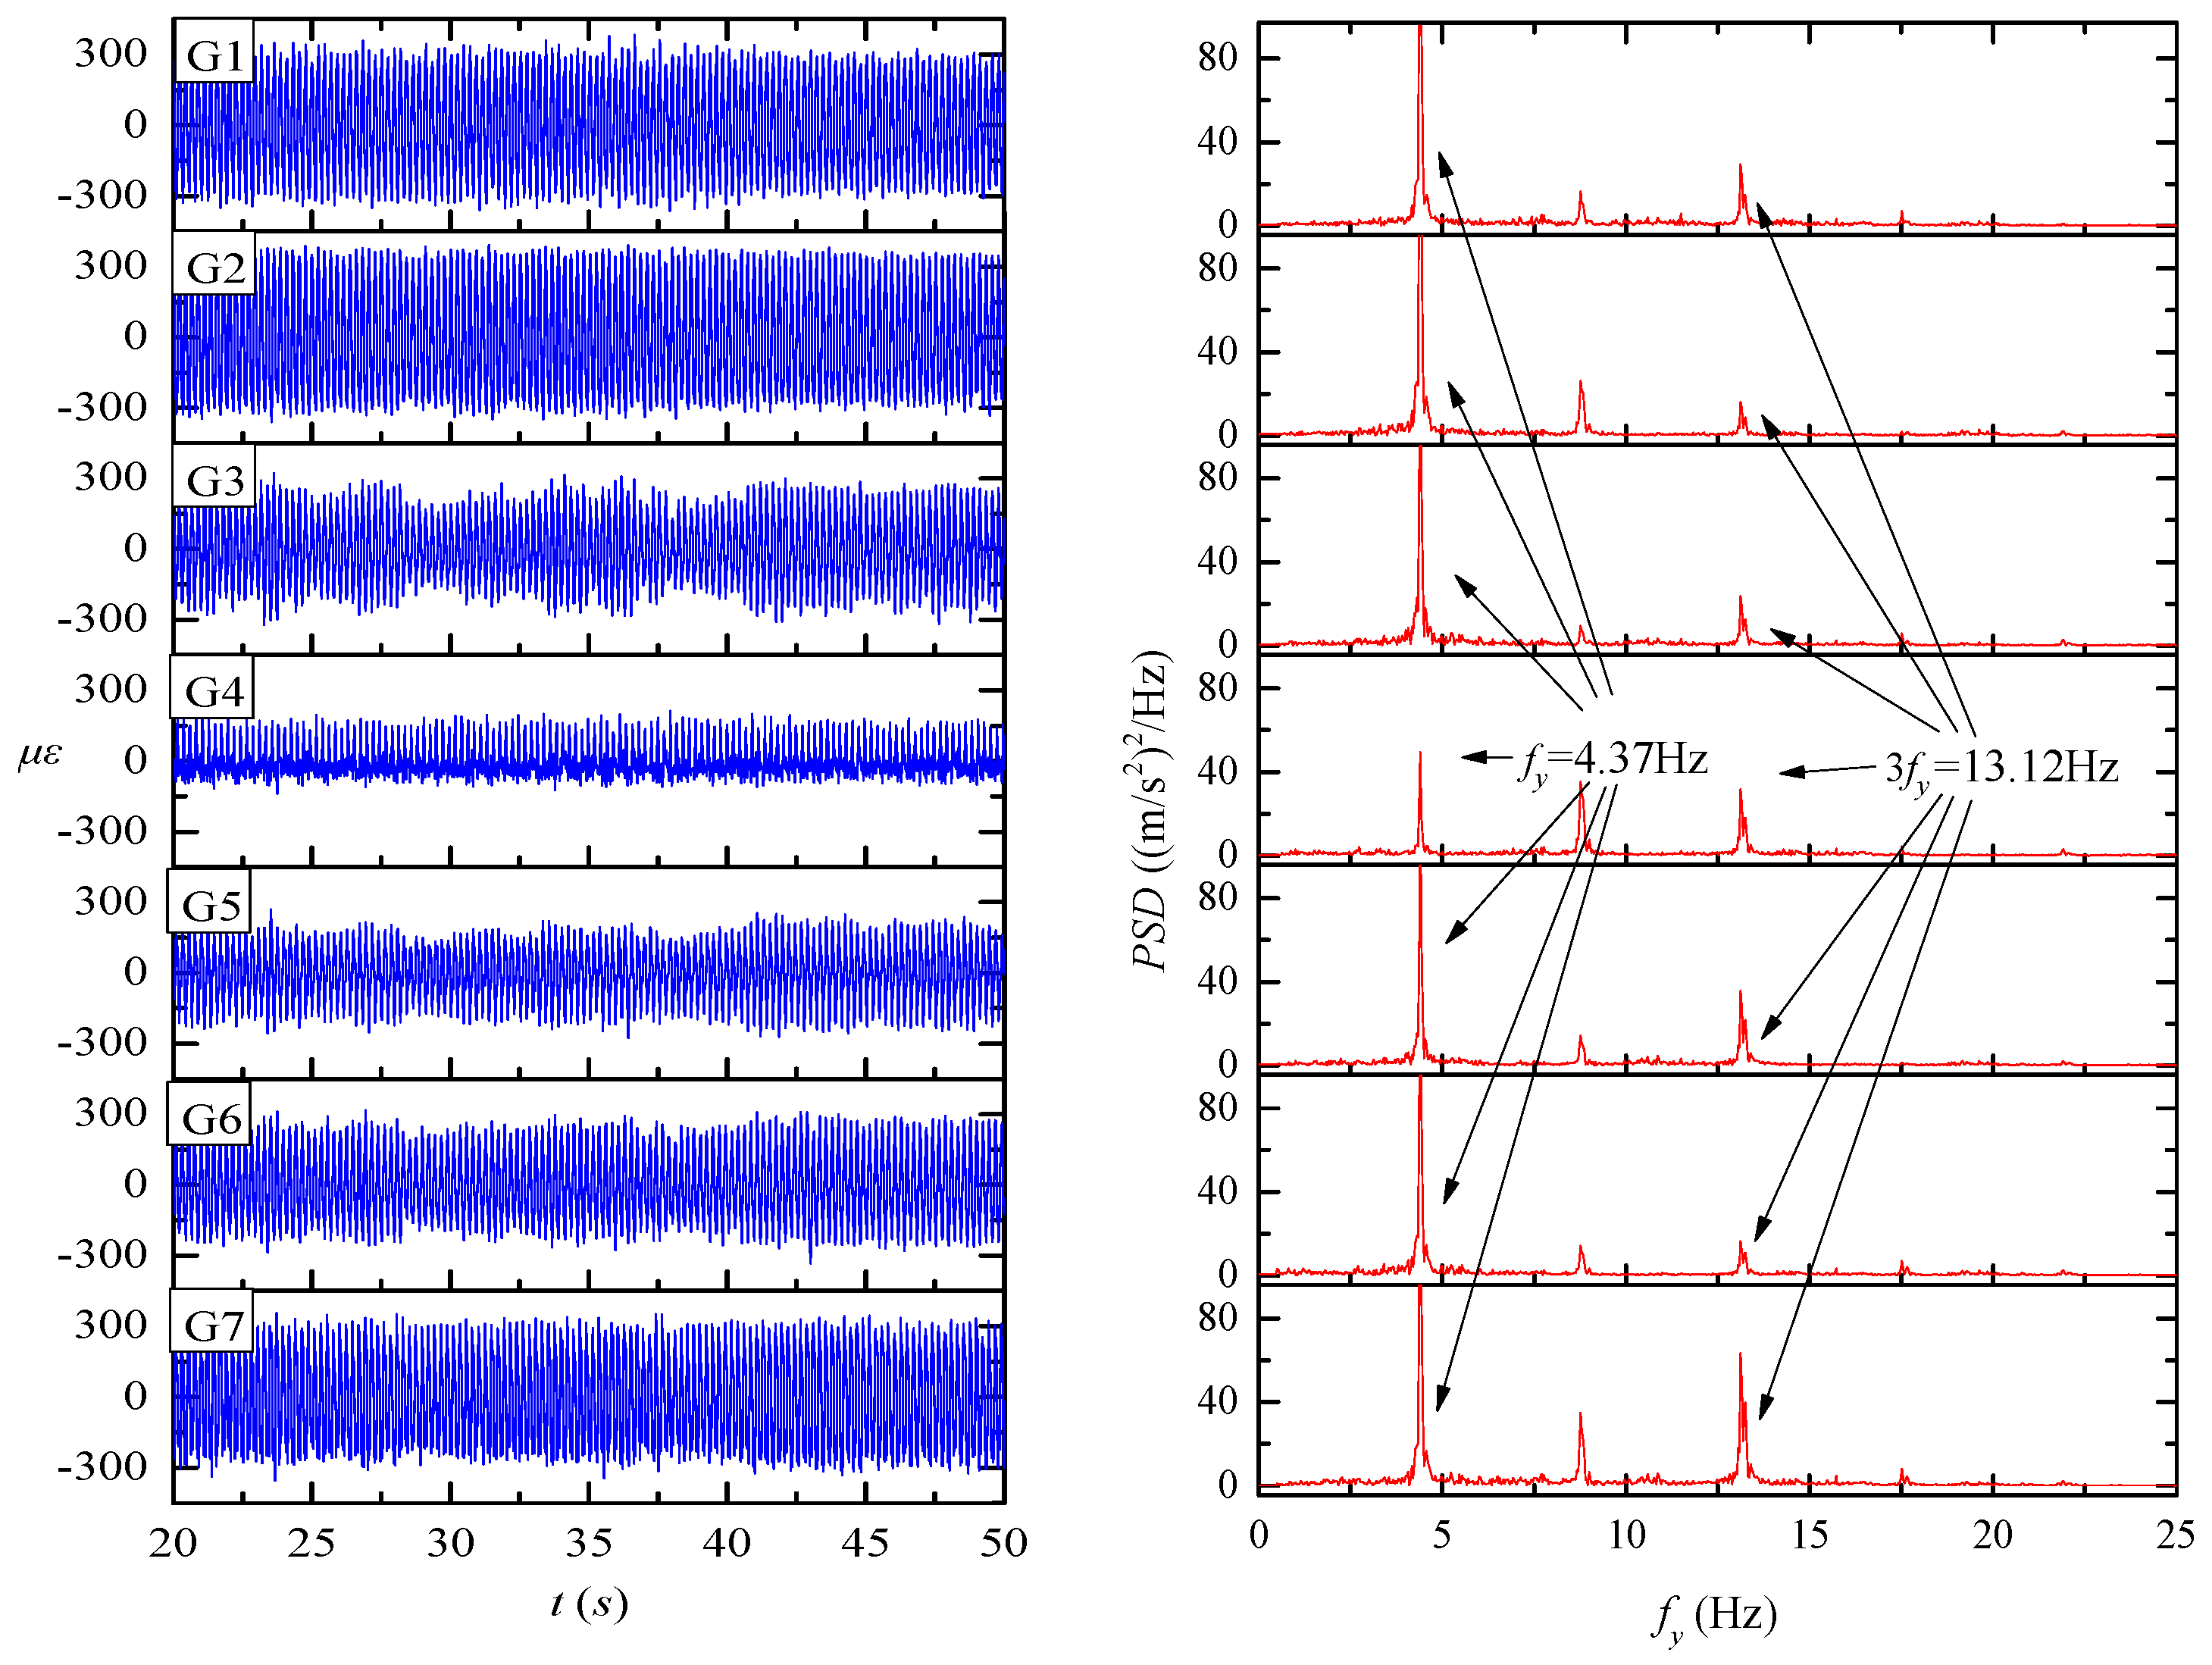
Figure 5 gives an example of time-varying strains and corresponding response frequencies in the case of towing velocity
U = 0.55 m/s and axial tension
T = 200 N. The left panel exhibits strain signals measured at positions G1–G7 within
t = 20–50 s. It is inferred that those positions where strain amplitudes are large are close to the antinodes of dominant modes. Conversely, those positions with small strain amplitudes are near the mode nodes. The right panel displays the frequency spectra of strains calculated using the Fast Fourier Transform (FFT) technique. Although the strain amplitude varies with measurement positions, the response frequencies are almost identical. It is also found that the CF strain response spectra are dominated by one or two strong frequencies and accompanied by a series of weak frequencies. It is known that the odd-order harmonics, such as 3
fy ≈ 13.12 Hz, are generally related to the CF VIV. In this case, the even-order harmonics, such as 2
fy, can also be observed in the CF vibration. A similar result was presented by Song, et al. [
21], who experimentally studied the VIV response of a long flexible riser pipe with a low mass ratio of 1.0. We infer that the even-order CF VIV is induced by the IL VIV response via those strain gages that could not strictly aligned with the pipe. Specifically, the CF VIV is dominated by odd-order harmonics while the IL vibration is dominated by even-order ones. The strain gages were manually pasted to the pipe targeting at an identical direction with the pipe axis. Unfortunately, this is difficult to be realized. Thus, the micro angle between the strain gage and pipe axis transmits the even-order IL harmonics to the CF results.
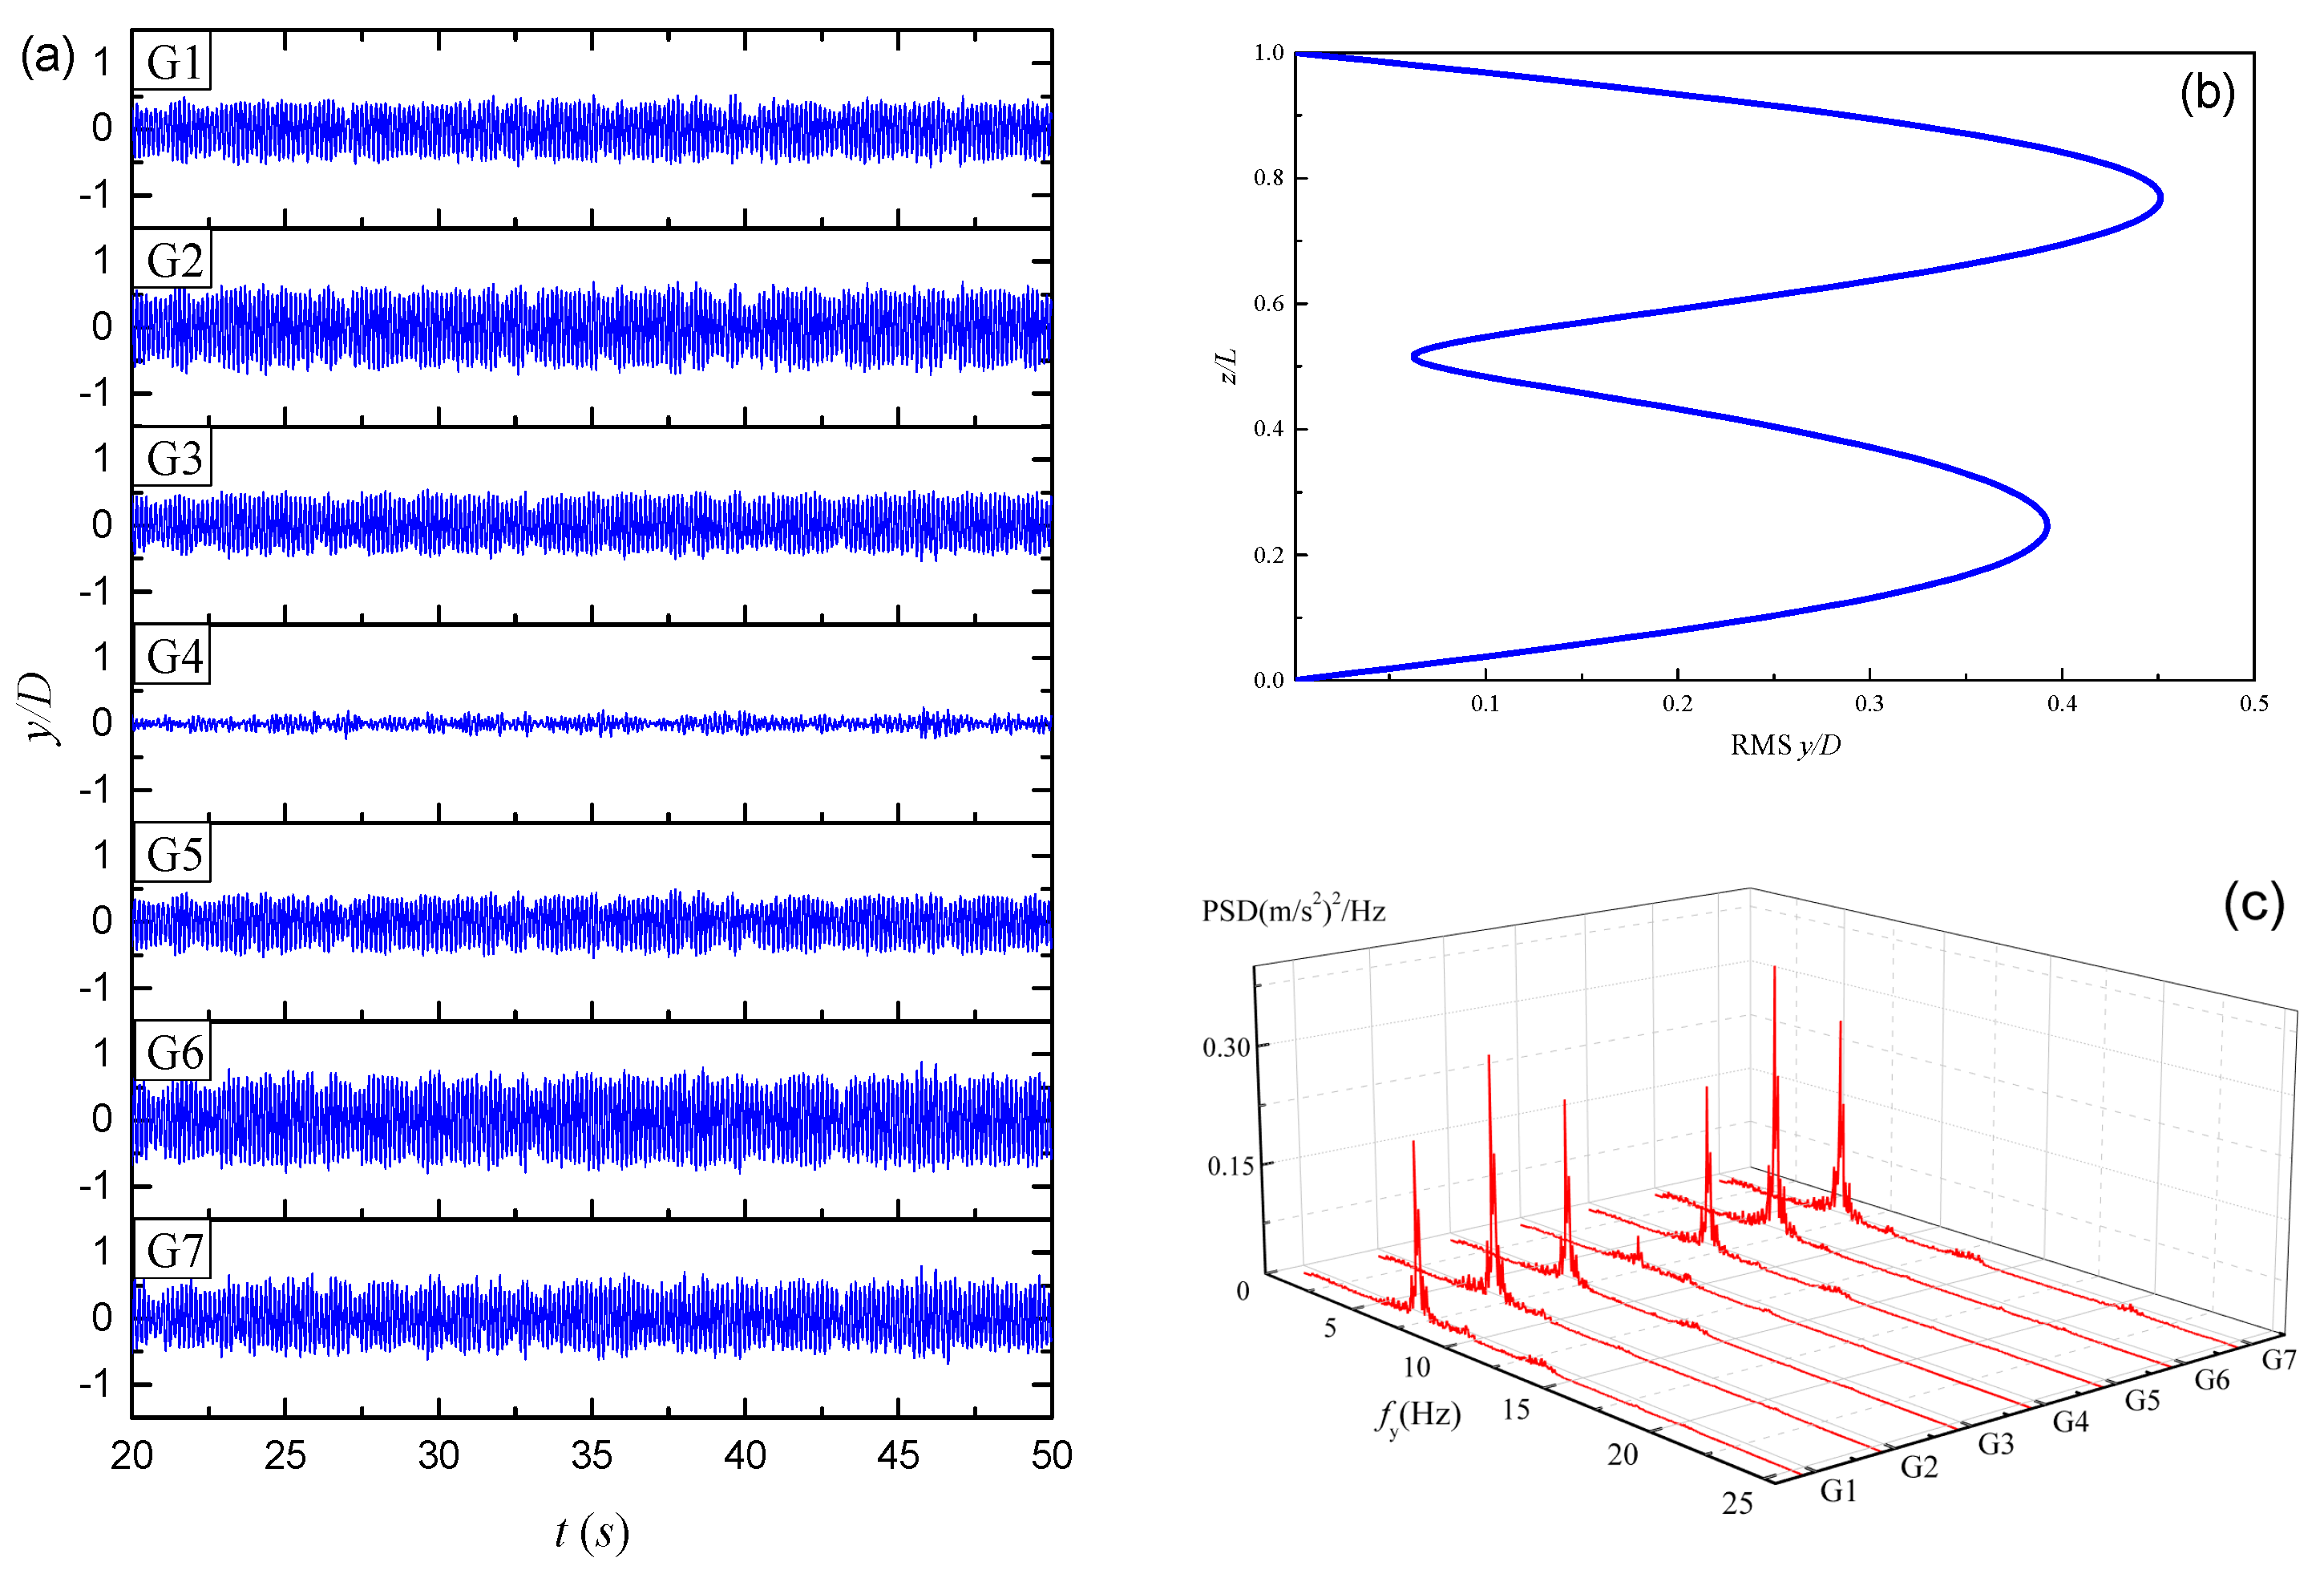
Figure 6a shows the typical CF VIV displacements at positions G1–G7 when
U = 0.75 m/s and
T = 300 N. The response displacements are obtained based on the reconstruction algorithm introduced in
Section 3. It can be seen that the maximum displacement amplitude occurs at positions G2 and G6 and the minimum one appears at position G4. The maximum displacement amplitude is nearly 0.60
D.
Figure 6b gives the root-mean-square (RMS) of dimensionless displacements along the pipe axis. Obviously, the VIV response is affected most by the 2-order mode and the maximum CF RMS displacement is up to 0.45
D. In
Figure 6c, the dominant frequency is 6.50 Hz, which is corresponding to the second-order mode. Moreover, only one strong frequency peak is observed with
U = 0.75 m/s and
T = 300 N. This trend of displacement response is consistent with that of a flexible cylinder with relatively high mass ratio undergoing VIV [
21,
26,
28].
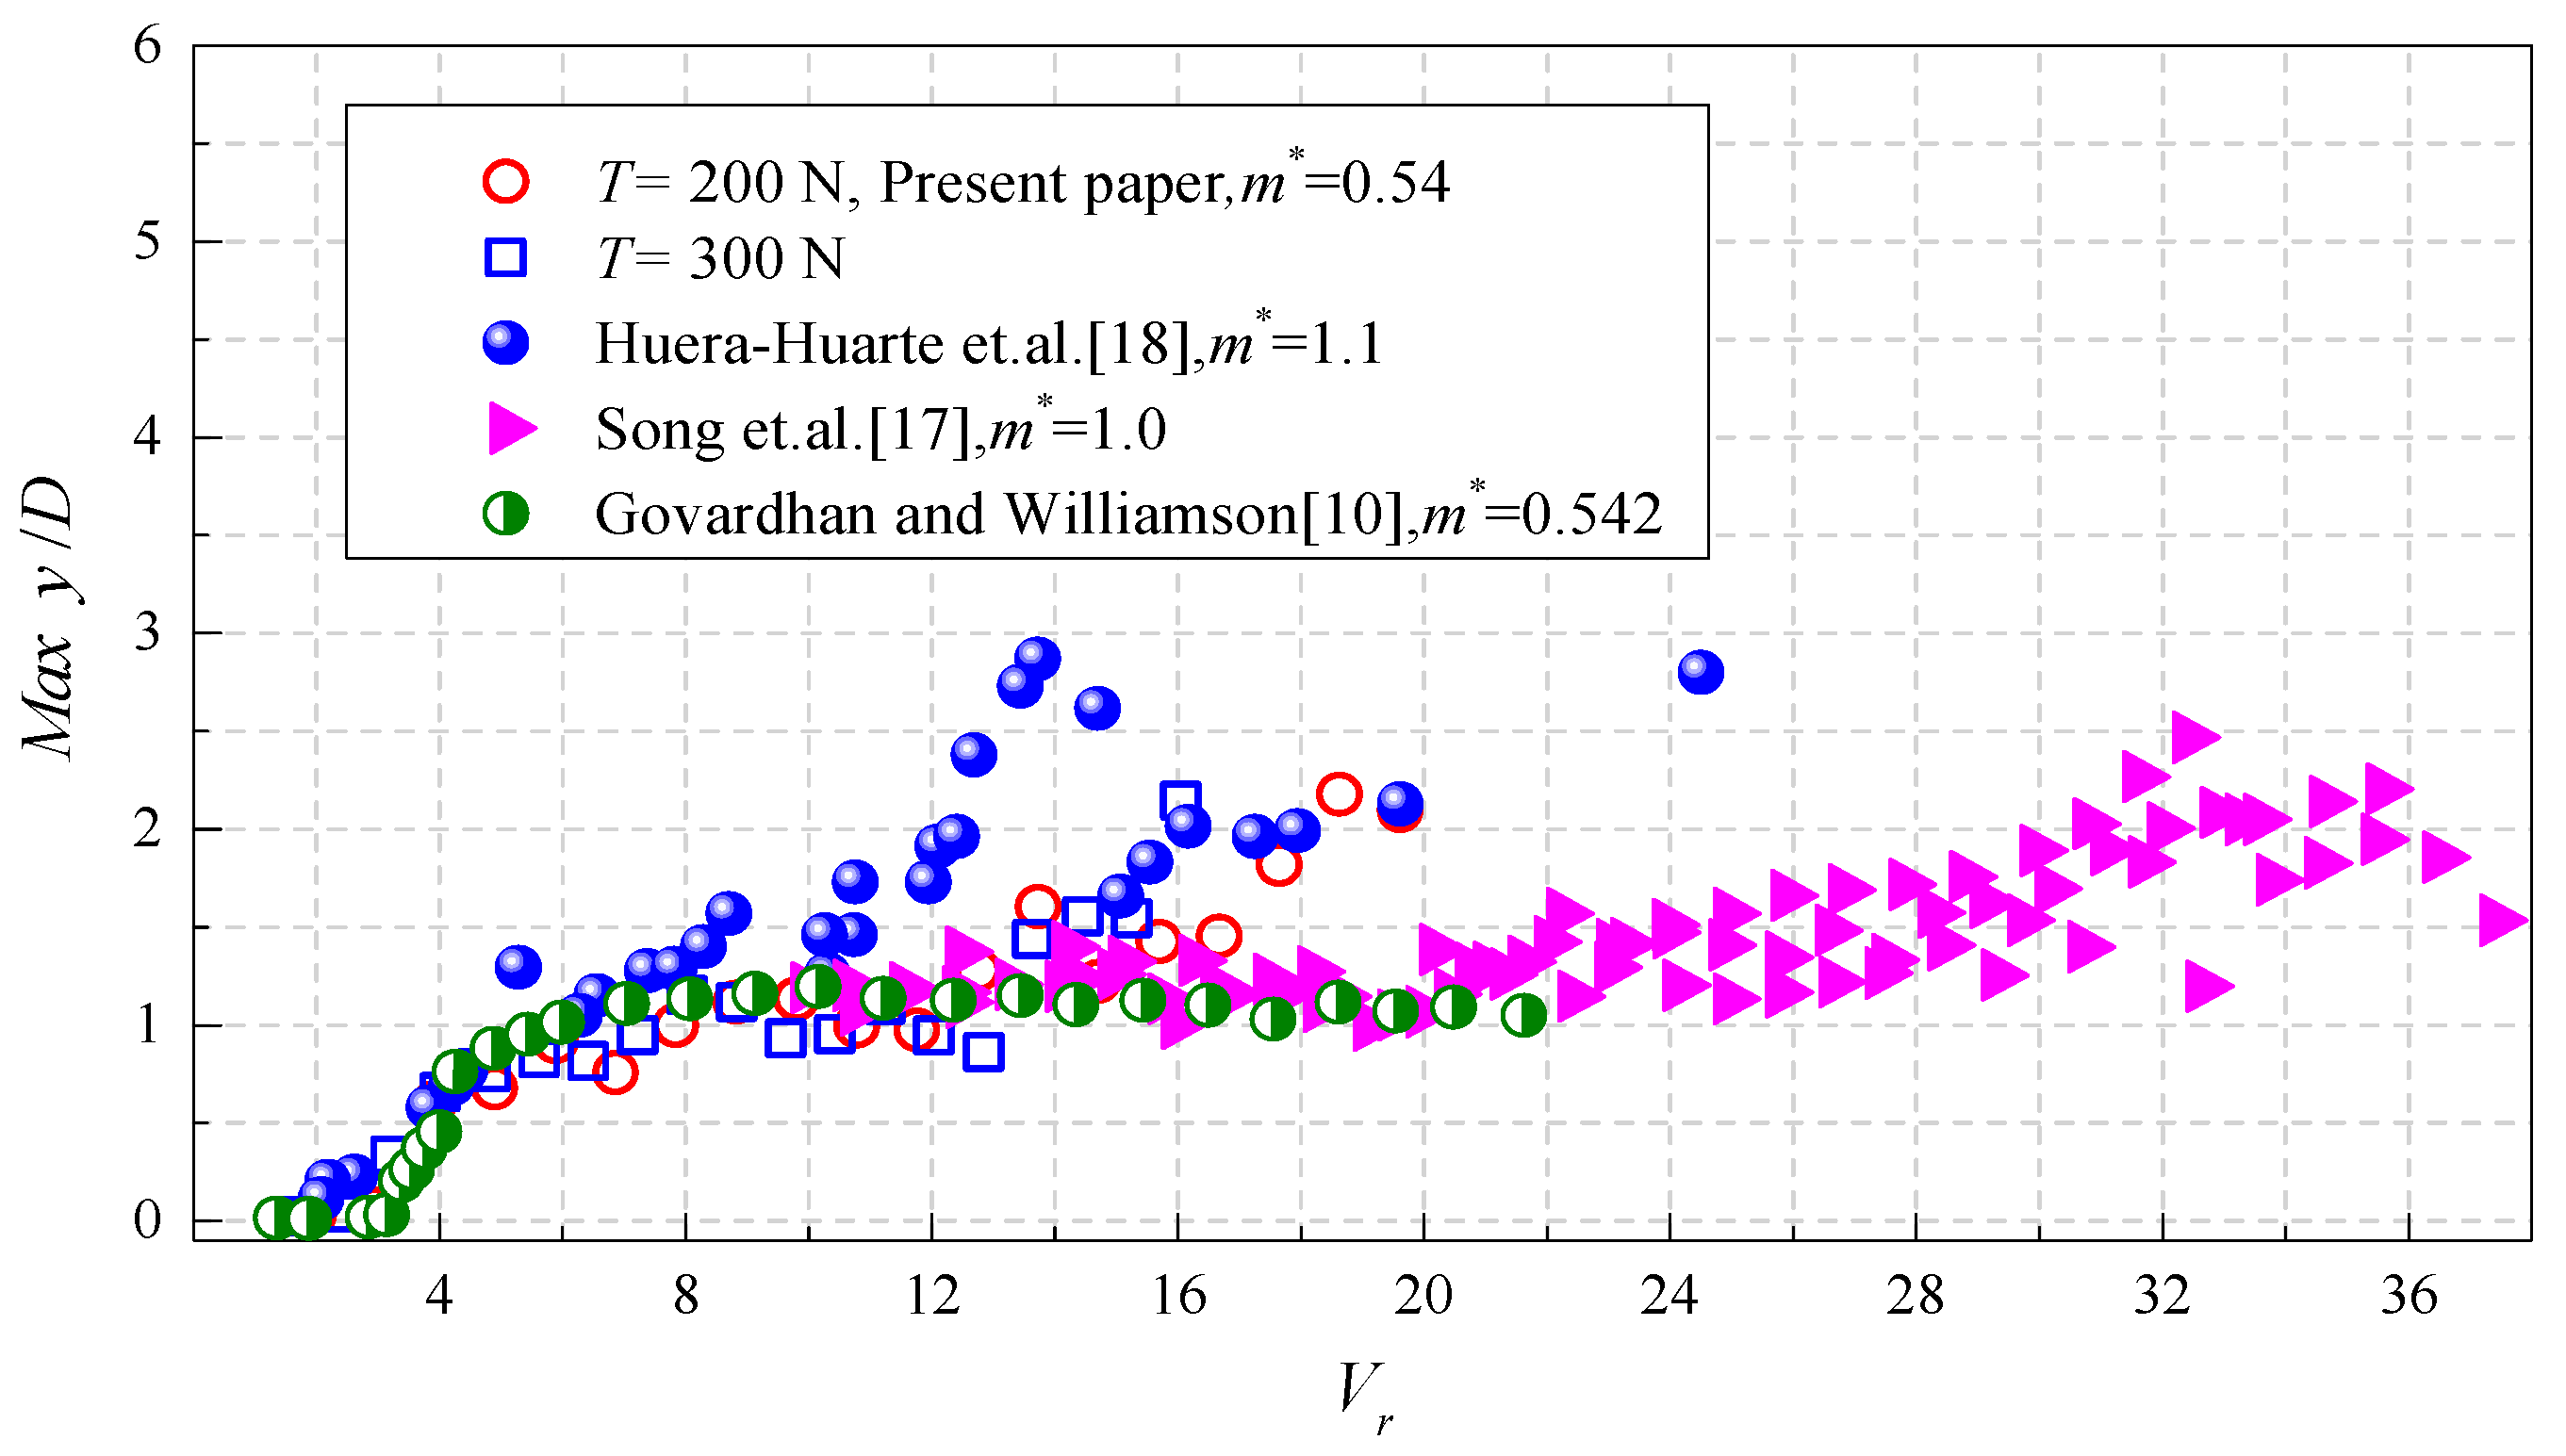
Figure 7 plots the maximum CF displacement against the reduced velocity
Vr =
U/
f1D (where
f1 is the fundamental frequency of the pipe model in water). Meanwhile, the experimental results of Song, et al. [
21] and Huera-Huarte, et al. [
22] for flexible cylinders with low mass ratio and that of Govardhan and Williamson [
14] for an elastically-mounted rigid cylinder with the critical mass ratio are compared. It can be seen that a slightly altered pre-tension (
T = 200 N and 300 N) does not make much difference in the maximum CF displacement. The present CF response amplitude has a maximum value of 2.18
D at
Vr = 18.63. With a larger mass ratio
m* = 1.0, the maximum CF displacement in the work of Song, et al. [
21] increases to approximately 2.5
D. Although the mass ratio is close to that of Song, et al. [
21], the maximum CF displacement of Huera-Huarte, et al.’s [
22] experiment can even reach up to 2.9
D. The discrepancy is originated from the different current conditions as well as the unequal damping ratio. As for the elastically-mounted rigid cylinder with
m* = 0.542 [
14], the amplitude peak value is only 1.2
D.
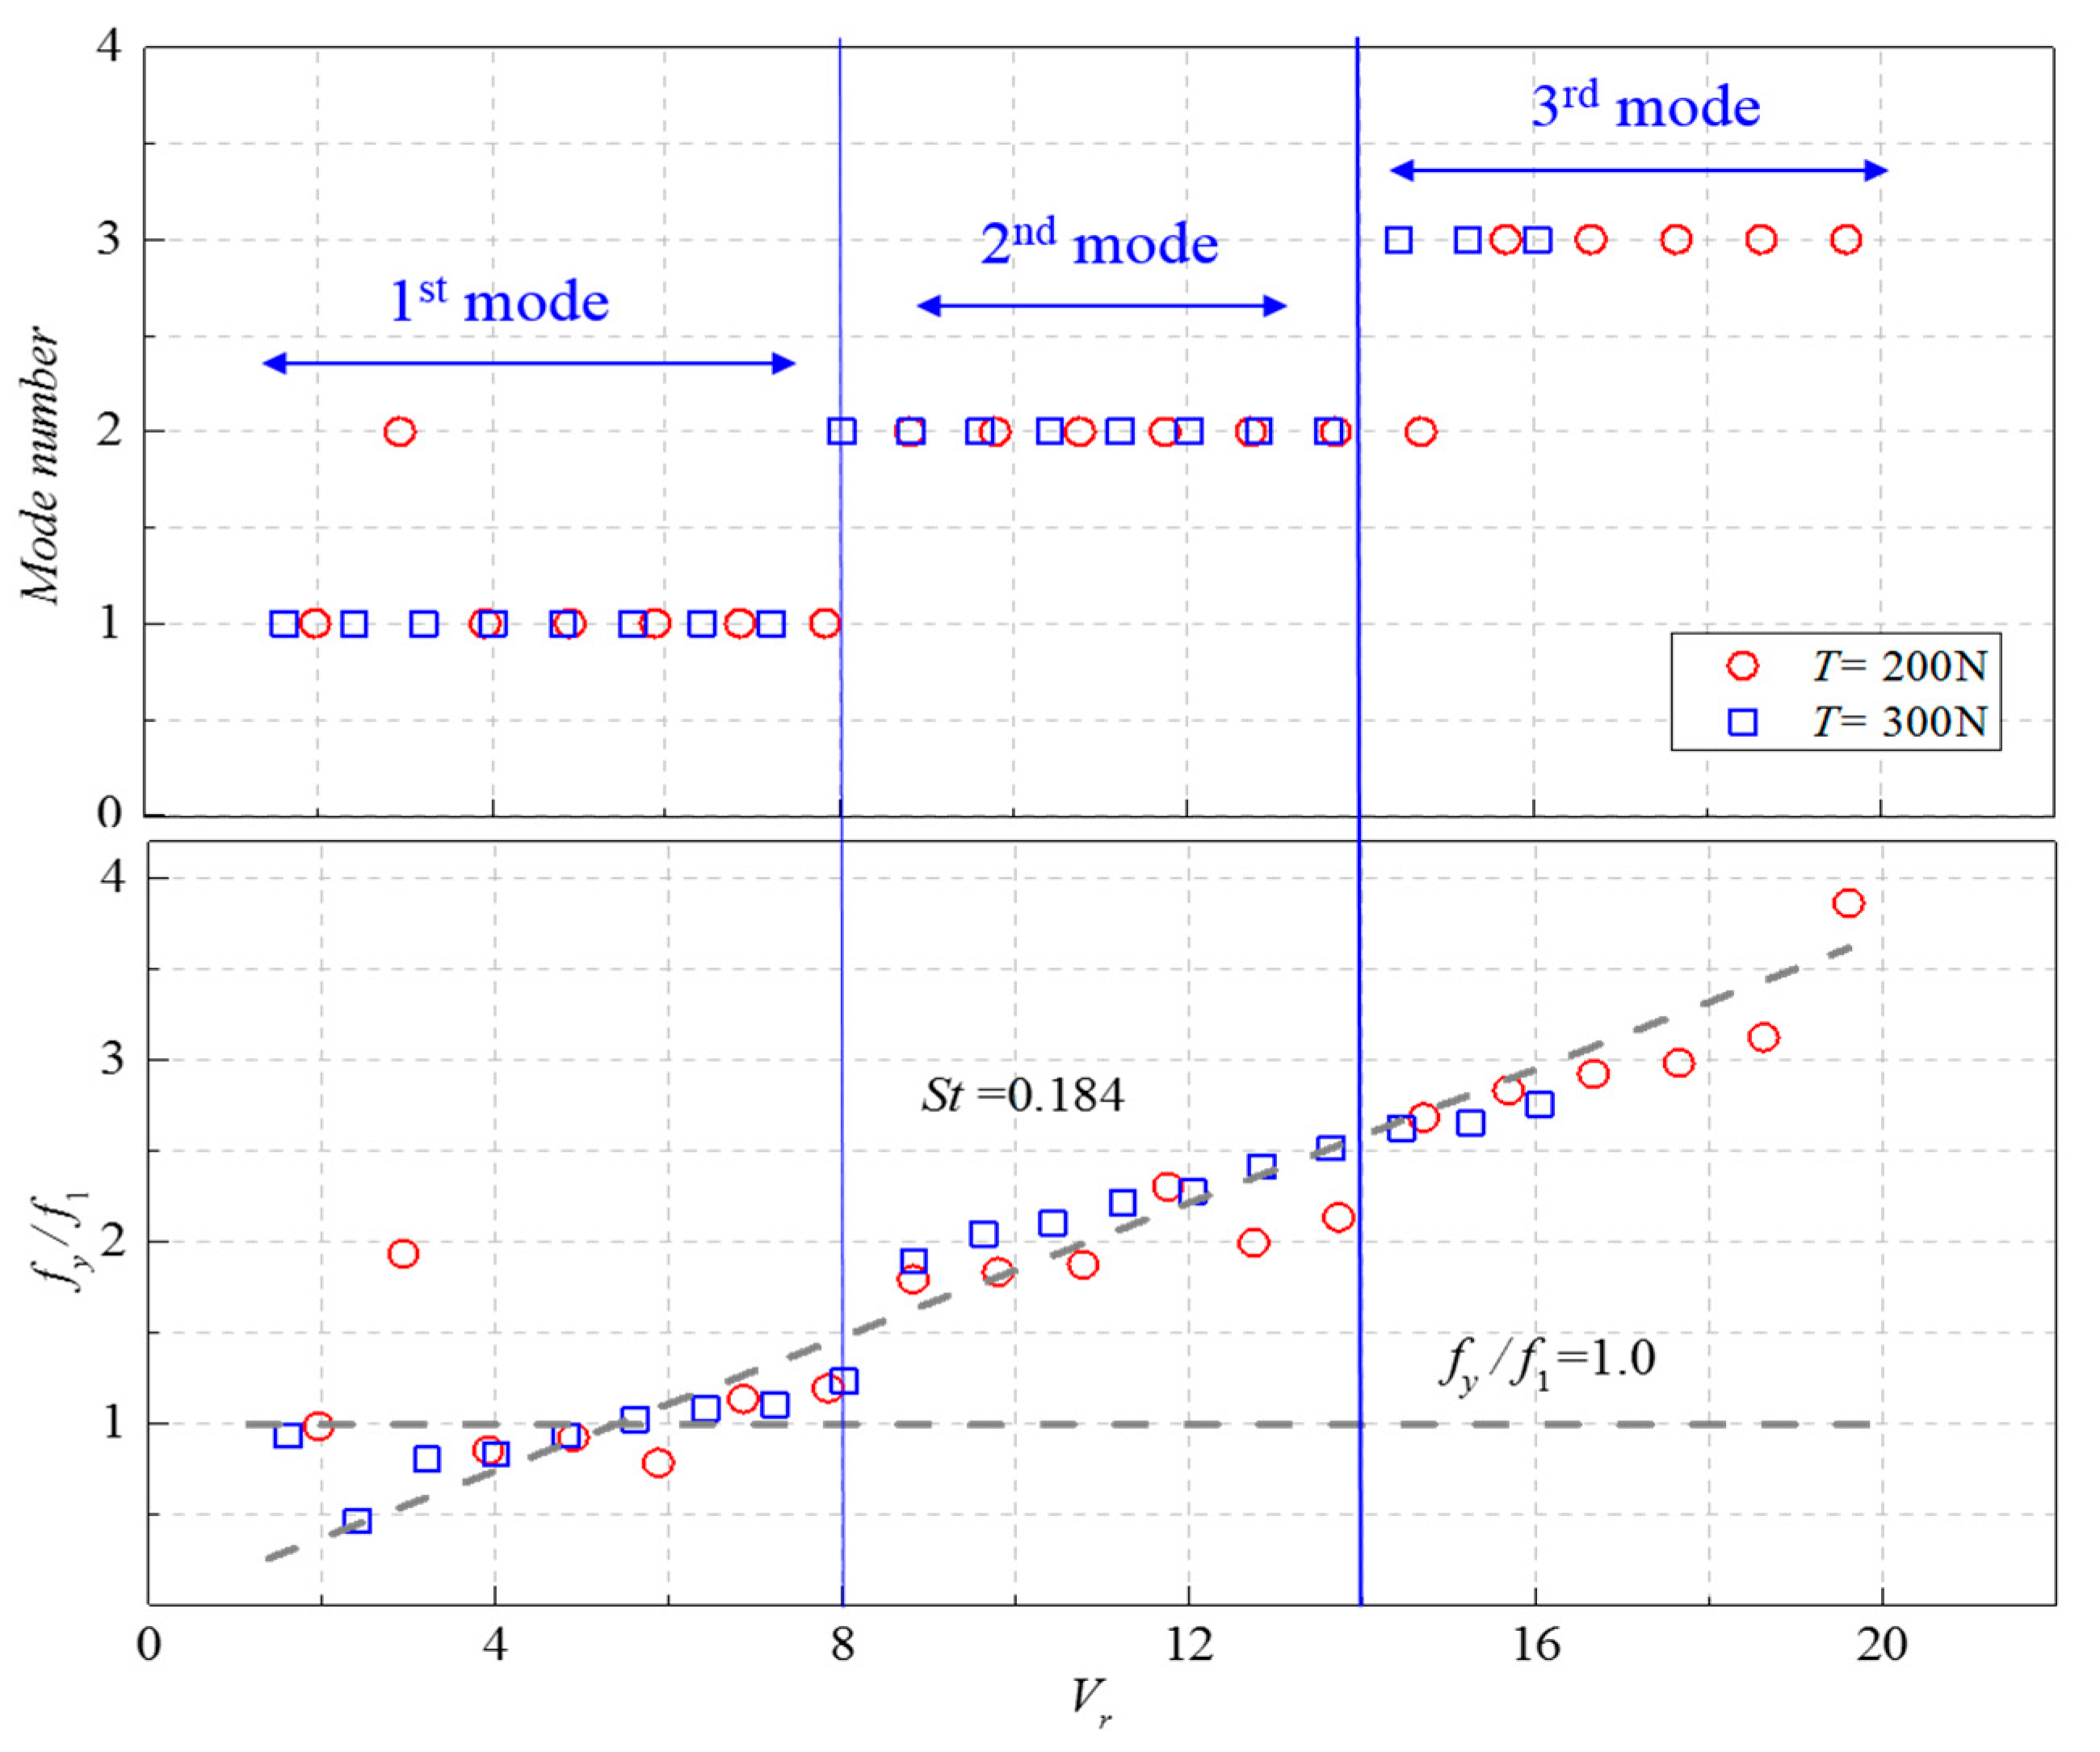
Figure 8 gives the CF dominant mode and dimensionless dominant frequency
fy/
f1 against the reduced velocity
Vr. The dominant mode refers to the order of natural frequency
fn excited by
fy. It increases with
Vr and is within the range of 1-order to 3-order. When
Vr < 8, the CF VIV response is dominated by 1st mode. An exception occurs at
Vr ≈ 3, where the second mode is observed. The flexible pipe in the experiment has two degrees of freedom. At low flow velocity, the CF vibration is stabilized at first mode while the IL vibration mode varies between first-order and second-order. Since the CF displacement amplitude is comparatively small then that in the IL direction, and inevitably there is micro direction error when manually pasting a strain gage to the pipe, the measured CF vibration mode is more or less affected by the high-order IF vibration. As
Vr ranging from 8 to 14, the 2nd mode is excited. When
Vr > 14, the third mode dominates the VIV response. The bottom panel of
Figure 8 revels that
fy increases monotonically with
Vr. This trend can be well fitted by a linear regression. Using the least square method, the slope of the fitting line (i.e., the Strouhal number
St =
fsD/
U, where
fs is the vortex-shedding frequency that is nearly the same as
fy in the lock-in region) is found to be 0.184.
A finite element technique proposed by Huera-Huarte, et al. [
29] was applied to calculate the mean drag coefficient of the flexible pipe. It has been extensively used and proved effective in the VIV studies not limited to the works of [
20,
22,
30,
31].
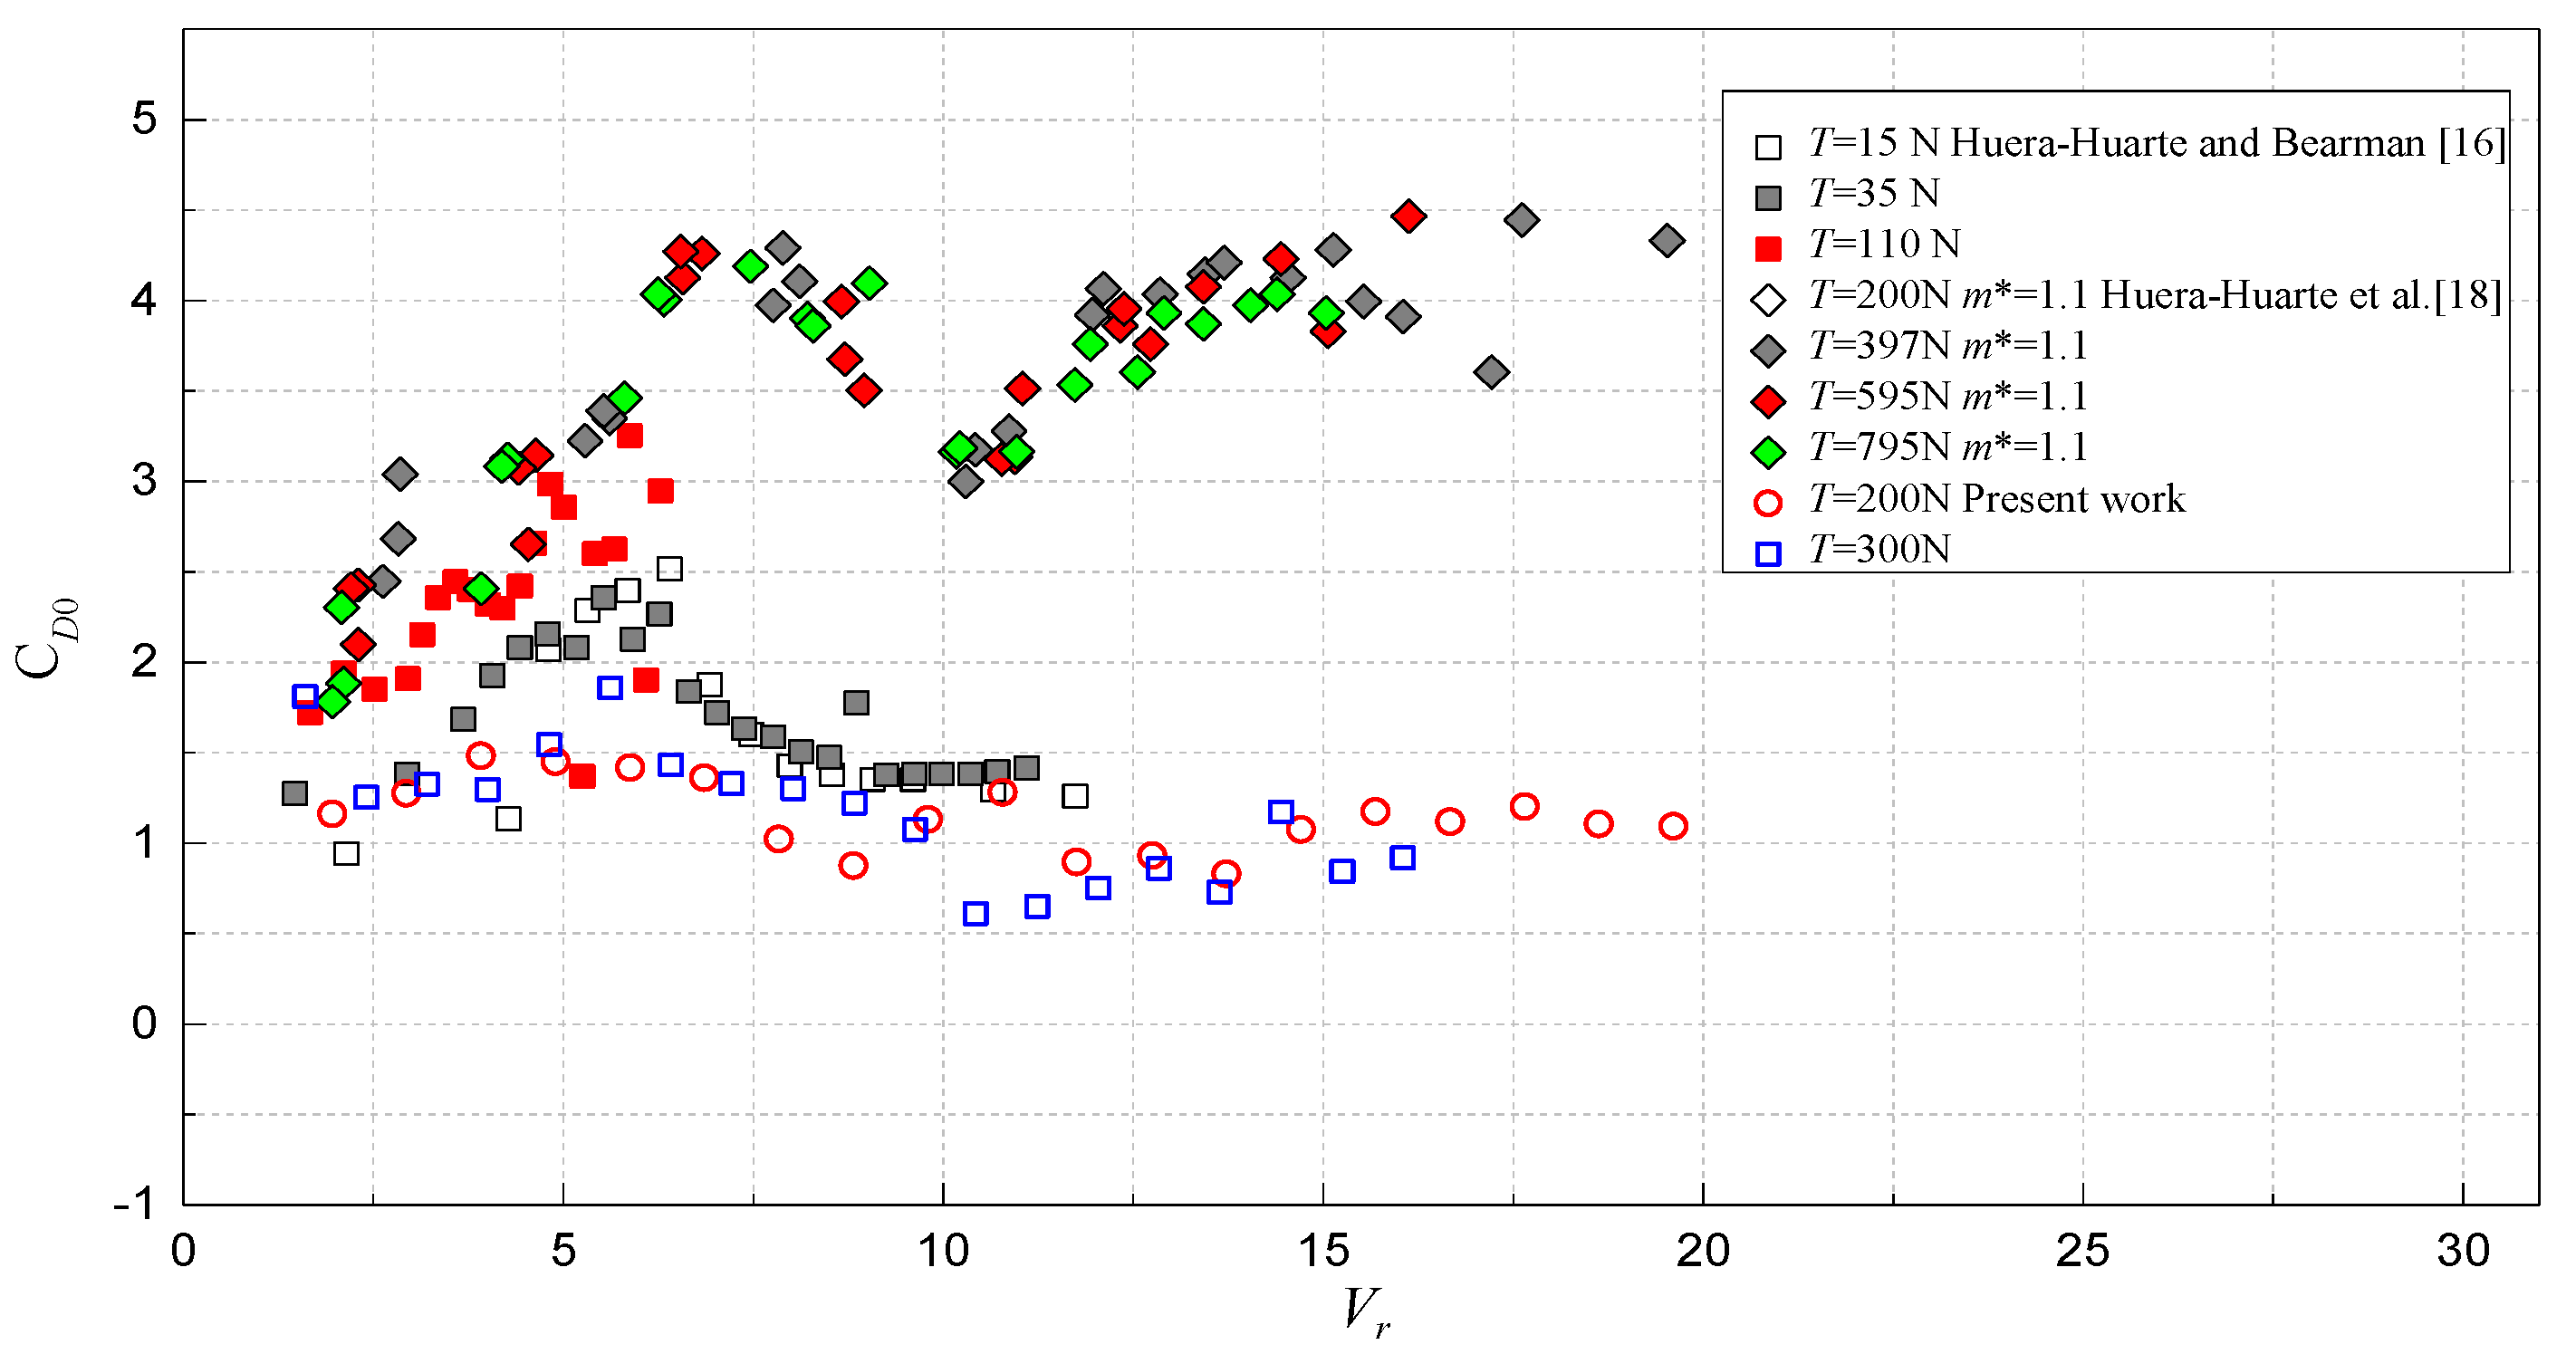
Figure 9 shows the variation of mean drag coefficient
CD0 with the reduced velocity
Vr. Some typical results of VIV experiments on flexible cylinders with low mass ratios [
20,
22] are also plotted in the figure for comparison. It is observed Huera-Huarte and Bearman [
20]’s experimental result has the same trend as that of Huera-Huarte and Bearman [
22].
CD0 in the work of Huera-Huarte and Bearman [
20] increases from 1.4 to 3.3 with the increase of
Vr from 0 to 5.5. Then, as
Vr exceeds 5.5 and continues to increase,
CD0 decreases from 3.3 to 1.4 gradually. While the maximum
CD0 in Huera-Huarte, et al. [
22] can approach to 4.5. For the present work, the peak value of
CD0 is nearly 2.0. Furthermore, the present result is not as scattered as that of Huera-Huarte, et al. [
22]. The discrepancy might be attributed to the different axial tensions employed in the two experiments.
Under the current experimental techniques, it is still challenging to measure the hydrodynamic forces exerted on a flexible pipe undergoing VIV without interfering with the flow field. However, the hydrodynamic forces can be obtained with the help of the inverse analysis method. The flexible pipe is simplified as a tensioned Euler-Bernoulli beam model. Then, the following equation for CF vibration can be established [
29]:
In the above equation,
Fy (
z,
t) is the total fluid force in the CF direction [
31]:
where
is the RMS value of the response velocity
.
CL and
Ca denote the lift force coefficient and added mass coefficient, respectively. They can be calculated using the following equations [
31]:
λ1–
λ5 can be obtained according to following expressions:
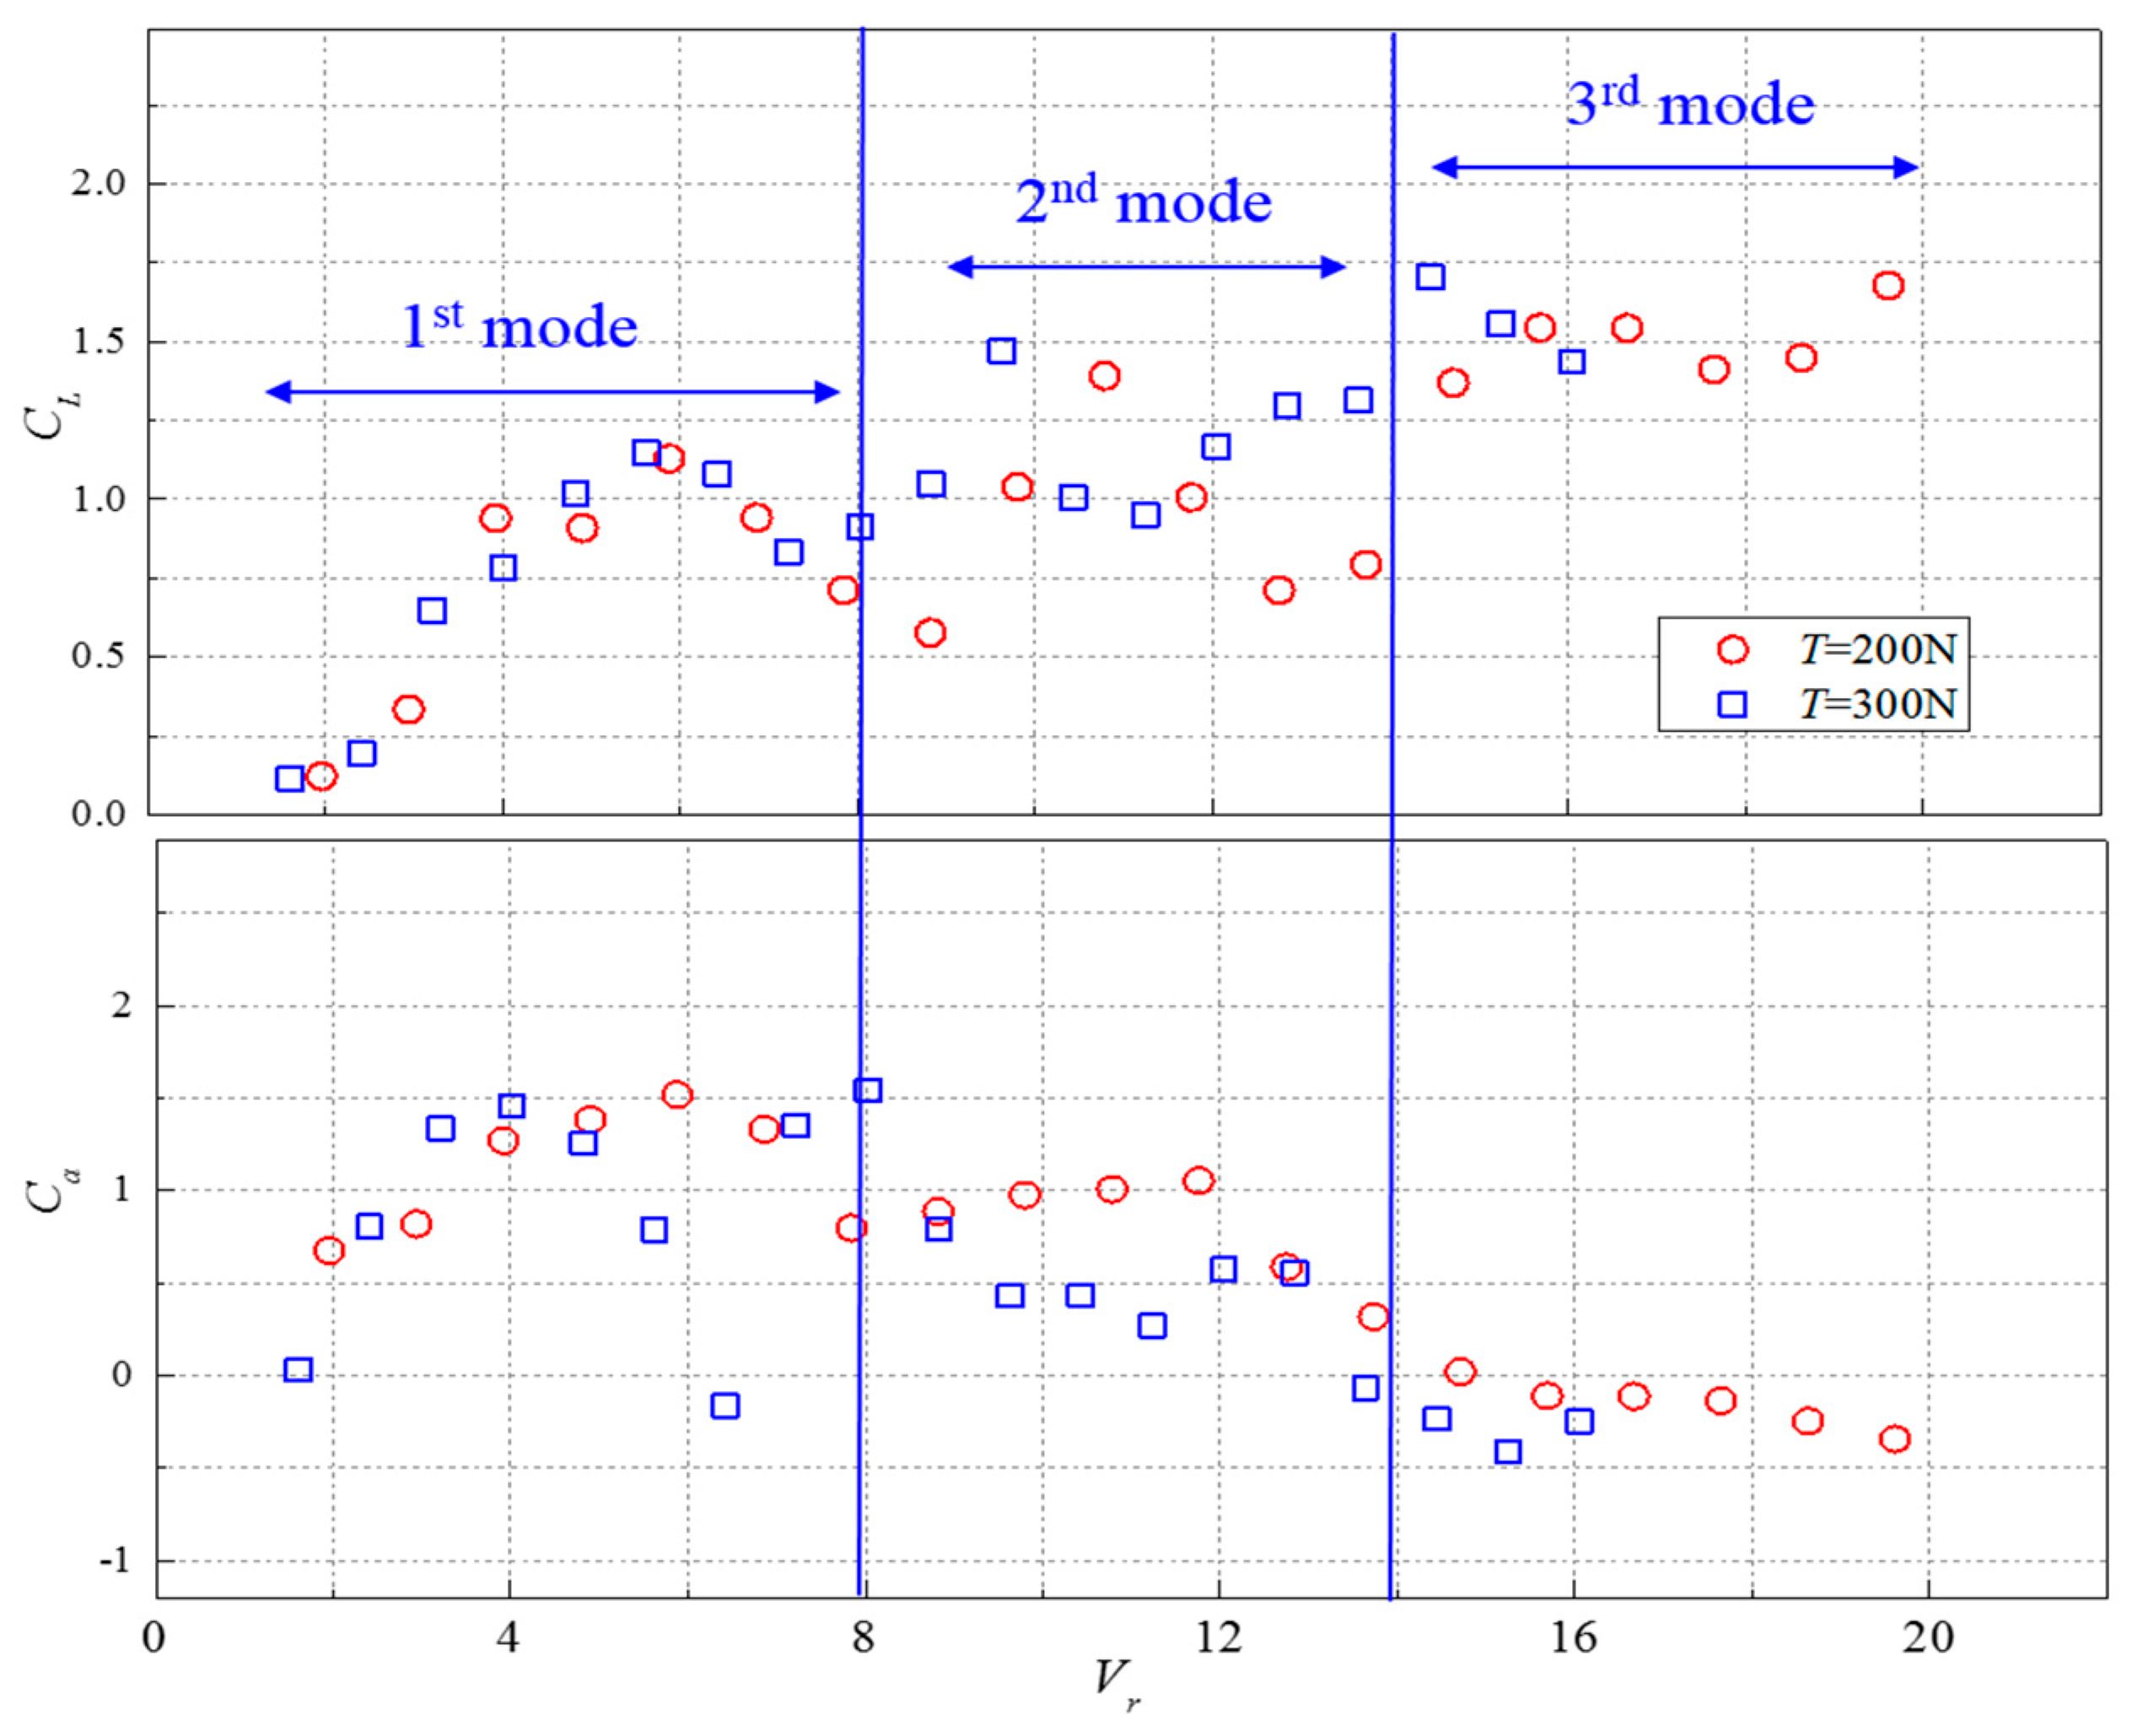
Figure 10 gives the variations of lift force coefficient
CL and added mass coefficient
Ca of the flexible pipe against the reduced velocity
Vr. It is observed that
CL under two axial tension cases (
T = 200 N and 300 N) are nearly the same when
Vr is smaller than 4.0. Moreover, in the 1st mode and 3rd mode lock-in regions, axial tension
T also makes little influence on
CL. Different situations happen in the 2nd mode lock-in region, where a larger axial tension
T = 300 N leads to an overall larger
CL. The maximum
CL covering the whole range of
Vr is approximate 1.70. The corresponding
Vr and
T are 14.45 and 300, respectively. As for
Ca, it goes up with the increase of
Vr so long as CF VIV does not occur. Then it turns to decrease with the increase of
Vr once lock-in appears at approximately
Vr = 4.0 (as shown in
Figure 8). The minimum
Ca covering the whole range of
Vr is about −0.41. The corresponding
Vr and
T are 15.25 and 300, respectively. This above trend can also be observed in the VIV experiment of Vikestad, et al. [
32] where a lightly damped elastically-mounted rigid cylinder undergoing uniform flow was concerned.


