1. Introduction
Using the technology readiness level (TRL) scale as a lens it becomes clear that SONAR-based simulation is underdeveloped and has not yet reached its full potential in the marine domain. TRL comprises a framework to benchmark progressive stages of technology maturity from proof of concept (stages 1–3) through to controlled validation (stages 4–5) and real-world demonstration in the context of actual operations or exercises (stages 6–9). As a measurement process, it has been utilised across disciplines [
1,
2]. This paper applies the process to SONAR simulation and evidences that an innovative interdisciplinary approach to TRL is required to remove barriers that have prevented the state of the art from maturing beyond laboratory validation (stages 1–4). This is a key contribution to the literature and practice because the underdeveloped potential of the early-stage laboratory work can unlock improvements in research platforms and personnel capacity building as well as facilitate significant cost savings for the industry by reducing SONAR-based survey costs. The paper contributes to an enhanced understanding of what is required for the maturation of early-stage technology (both in the marine sector and across other sectors).
By way of introduction to the domain explored here, SONAR-based hydrography enables mapping, inspection, and monitoring of the underwater natural and built environment. It underpins global shipping, telecommunications, marine renewable energy, port and harbour management, and environmental protection. Emerging underwater sensing technologies are the product of extensive interdisciplinary technology transfer, leveraging advancements from artificial intelligence [
3], machine vision [
4], and parallel processing [
5]. Modern hydrography is a specialised service relying on highly skilled personnel to operate complex survey systems. As technology capabilities mature, more challenging use-situations become feasible and shortcomings in operational efficiency are magnified. Tightening tolerances, miniaturisation, and improved precision have reduced the margin for error. The industry is driven to improve productivity while simultaneously meeting stakeholder expectations for enhanced data quality and richer metadata. Achieving these metrics requires skilled personnel with proficiency in calibrating, optimising, and diagnosing survey performance across a wide range of operational scenarios. Training these highly skilled personnel is, therefore, key to leveraging the future success of the industry [
6].
Pre-survey mobilisation activities, such as integration and calibration of equipment, can consume days of expensive ship-time before routine operations commence. Deficiencies in the preparatory workflow manifest as costly operational inefficiencies by eating into the survey data-collection phase and degrading overall productivity and data quality. Simulation is proven in many industries, such as airline pilot training, to unlock cost-effective virtualisation of pre-field tasks directed at optimising in-the-field performance [
7]. However, there is sparse evidence of survey simulation being utilised in this role in hydrography. While the SONAR simulation prior art reports many contributions of laboratory validated technical advancements, the discipline has not matured to widespread utilisation and its impact in improving business intelligence, decision making, and operational efficiency is poor. New discourse is required with an interdisciplinary approach to fill a clear gap in the research on extending the usability and usefulness of existing TRL 4 prototypes such that they can be demonstrated in real-world operational environments, i.e., TRL 7–8.
Figure 1 identifies the three key phases in the simulator development in terms of extending functional and non-functional attributes, the interdisciplinary domain contributions leveraged to meet acceptance criteria at each phase, each mapped to the conventional definition of technology readiness levels.
The narrative of the paper draws on barriers faced and lessons learned as part of an exercise of technology transfer from conceptualisation to demonstration in sonar simulation. The authors are drawn from both academia and industry practice and the examples given in this paper mirror this cross-sectoral approach to the TRL stages. Ultimately, new technology must be demonstrated in real-world operations before market adoption/replication can occur and reaching stages 7 and 8 of TRL remains elusive to many of those seeking to ensure real-life application of emerging technology. This paper helps those seeking to achieve this by setting out a method that maps the barriers faced at each TRL to finding the interdisciplinary solutions that already exist to address those gaps.
1.1. Article Contributions
This paper contributes an interdisciplinary research method that bridges the gap between TRL 4 and TRL 7 in the SONAR simulation prior art. It is the first work to report a real-time survey-scale simulator for hydrographic multibeam and sidescan SONAR. It is the first work to demonstrate underwater SONAR simulation in hydrography training.
1.2. Article Structure
The next section reviews the prior art literature.
Section 3 maps the simulator specification of the technology readiness level scale.
Section 4 focuses on the functional objectives and software architecture required to produce a real-time survey-scale simulation platform and reports the case study demonstration of the simulator as a hydrographic personal training platform.
Section 5 provides summary discussion and recommendations.
Section 6 presents the conclusions and briefly outlines the roadmap for proposed future work.
2. Previous Work
The reported approaches to SONAR simulation either numerically integrate the governing wave equation to yield a global solution to the acoustic imaging process [
8], or alternatively, they decompose the simulation into a modular set of mathematical models, each of which solves a well-defined and bounded portion of the overall problem [
9]. Mathematical models exist to simulate all pertinent aspects of the physical processes encapsulated by the SONAR equation: propagation, losses, noise, scattering, directivity, and image formation [
10].
2.1. Seminal Approaches
Four seminal contributions to the simulation literature are identified. Bell’s research was the first to integrate computer graphics methods such as ray tracing with acoustic propagation and scattering [
9,
11]. Using Snell’s law to model refraction in a horizontally stratified medium and Jackson’s model to calculate seabed scattering from seafloor geometry synthesised using fractal techniques, the resulting imagery accurately reproduces multiple sidescan SONAR artefacts. Elston’s model applies pseudospectral time-domain techniques to solve the wave equation and verifies the resulting imagery using histogram analysis of real and simulator-generated imagery of homogenous and sediment rippled seabeds [
8]. Riordan’s model, an earlier version of the work presented in this paper, integrates multi-resolution adaptive meshing techniques from computer graphics with Bell’s ray-traced model to achieve real-time simulation [
12,
13]. A more recent contribution by Cerqueira uses the OpenGL GLSL render pipeline to leverage graphic card parallel-compute shader cores to accelerate 3D visibility testing performance [
14].
2.2. Shortcomings
Each model has shortcomings related to performance. Bell’s model is not scalable; as the number of rays and scenario sizes approach typical imaging configurations, the performance throughput drops off exponentially. Elston’s PSTD approach, while an order of magnitude improvement on finite-difference time-domain (FDTD) methods, is numerically intensive; requiring simulation grid spacing of two nodes per wavelength, it is not suitable for applications requiring real-time responses over survey scale distances. Alternative GPU enabled PSTD implementations also do not meet real-time [
15] but have benefit when applied to short-range ultrasonic modelling or near-field transducer beamforming investigations [
16]. Early iterations of this work achieved real-time in comparison to Bell’s model when benchmarked on off-the-shelf PC hardware but are limited to 2D ray tracing (i.e., infinitesimally narrow acrosstrack beam patterns) and restricted scenario sizes. Cerqueira’s model adapts the OpenGL GLSL compute pipeline but is inherently restricted by the non-physical render framework used in computer graphics, which does not support modelling of non-linear propagation, global shadowing, and multi-path scattering.
The solutions in the prior art are inherently limited as they approach computational bottlenecks by sacrificing the realism of the scenario and simplifying the sensor model. The divergence between the capabilities of SONAR simulation and end-use requirements is furthered by the rapid pace of advancements in transducer resolution and data bandwidth. While improvements to simulator performance are essential, renewed focus on interface designs and usability attributes is required to benefit non-expert users. The next section discusses technology readiness levels as a framework to benchmark simulator maturity in the context of hydrography survey training.
3. Technology Readiness Levels
Technology Development Phases
The literature presents a plethora of project management and technology transfer patterns to scale user adoption of innovations [
17]. Bridging the gap between a research proof of concept and its adoption in practice is predicated on satisfying a wide range of user value propositions. The expectation is that innovations will realise a measurable return on investment, delivered through improvements in productivity, quality, and safety, amongst other benefits. Verification and validation acceptance criteria are translated into a technical specification to meet key performance indicators. Design decisions in the technical domain are driven by requirements analysis in the use domain. This translation process relies on interdisciplinary stakeholder input to articulate user stories and priorities and provide early feedback on conceptual designs. Technologies mature as their sub-systems are progressively validated, integrated, and demonstrated in the real world.
The US Department of Defence, NASA, European Space Agency, European Commission, and oil and gas industry all use discipline-specific yet conceptually similar technology readiness level scales to define system maturity [
18]. TRL scales were originally derived from a set of hardware requirements. Newer initiatives focused on software and human readiness produce similar mappings. In general, the requirement to involve qualified technical experts to ensure correct operation reduces at each level. This is particularly pertinent in the case of personnel capacity building where the student and trainee end users are by definition non-qualified.
Figure 1 distinguishes three key development phases in advancing the simulator TRL and maps the required simulator attributes to the enabling interdisciplinary knowledge bases. The sections that follow describe the requirements analysis, design, and implementation to progress through the sequence of phases. They focus on the acoustic models, computational methods used to achieve real-time high-fidelity performance, and the software engineering methods utilised to integrate the system of sub-systems into a usable theatre-level survey simulator.
4. Method
The simulator is a system of integrated SONAR, environment, and vehicle sub-system simulators. The next section describes the virtual environment construction, and its interaction with the acoustic propagation and scattering models, as well as the vehicle navigation simulator.
4.1. Realistic Simulation—TRL 3 Proof of Concept
The simulator scenarios are constructed in layers following the approach used by geographic information systems. The bounding seabed and water surface layers are augmented with geometry layers of static natural objects and CAD models of built environment assets. Dynamic layers, such as divers, fish, and other vehicles, are supported with programmable behaviours.
4.1.1. Seabed Surface Layer
SONAR simulation must replicate the acoustic response that would be generated by the real SONAR in the equivalent real-world situation. Different SONAR instruments will produce different representations of the same underwater reality and the ability to discriminate their response profiles enables pre-field decision-making such as equipment selection. Simulator scenarios are detailed at the level of resolution required to replicate the resolution of the modelled SONAR. Resolution is governed by the incident pulse length for continuous wave pulses and bandwidth for phase-modulated pulses, and is characterised as the closest spacing between two objects that can be delimited in the generated imagery. This work focuses on simulating continuous wave instruments in the 100 kHz–1 MHz frequency range. Chirp or broadband instruments are outside the scope.
SONAR imaging is a lossy compression process. Acoustic returns from an ensonified field of scatterers are quantised by analogue to digital conversion and sampling at the transducer head. The bottom-detect algorithm unifies sequences of samples into individual beams. During chart production, the point cloud of bottom samples is voxel gridded and further decimated. While the cell size, uncertainty, and confidence level are dictated by the Minimum Standards for Hydrographic Surveys [
19], typically at least nine hits per cell are unified. The workflow is irreversible, and it produces macro-roughness surface models without the micro-roughness detail required to simulate acoustic scattering in the ensonified field. Thus, seabed models generated from SONAR data cannot be used directly and an interpolation process is required to generate synthetic geometry representative of the lost detail and upsample the processed macro-roughness terrain model.
Multifractal interpolation methods are established as realistic methods for both creating virtual terrains [
20] and classifying real-world terrains [
21]. Many synthesis algorithms exist. While computer graphics toolsets for creating 3D models and assets, such as Blender, can generate immersive terrain environments, graphics rendering workflows are not usually suitable for generating SONAR simulation scenarios. Rendering engines typically rely on combinations of normal mapping and procedural synthesis to achieve the appearance of surface micro detail. Its light signature is generated late in the shader pipeline by texture mapping fine-grain normal perturbations onto low-resolution mesh geometry without actually creating additional geometry. While procedural synthesis generates synthetic geometry at runtime, the detail is typically stochastic and discarded when it is no longer within the view frustum. For simulation repeatability, the seabed properties must not change between runs. Deterministic and persistent data are required to ground truth and benchmark trainee data-interpretation. Our work uses World Machine [
22] for feature synthesis in combination with Fourier synthesis as it enables heterogeneous features such as sediment ripples, has repeatable boundaries to enable tiling, and the compute layout supports GPGPU implementation.
Figure 2 shows examples of seabed terrain models generated from both real and synthetic macro shape guides.
The seabed data-interpolation workflow is as follow:
Surface models generated from real-world multibeam survey are used as the macro shape guide.
Multiple layers of multi-fractal micro-detail are generated to encode diverse geologic features.
The multi-fractal layers are blended into the macro shape layer and the distribution of features is controlled by a spatial weighting mask to reflect the underlying shape guide topography.
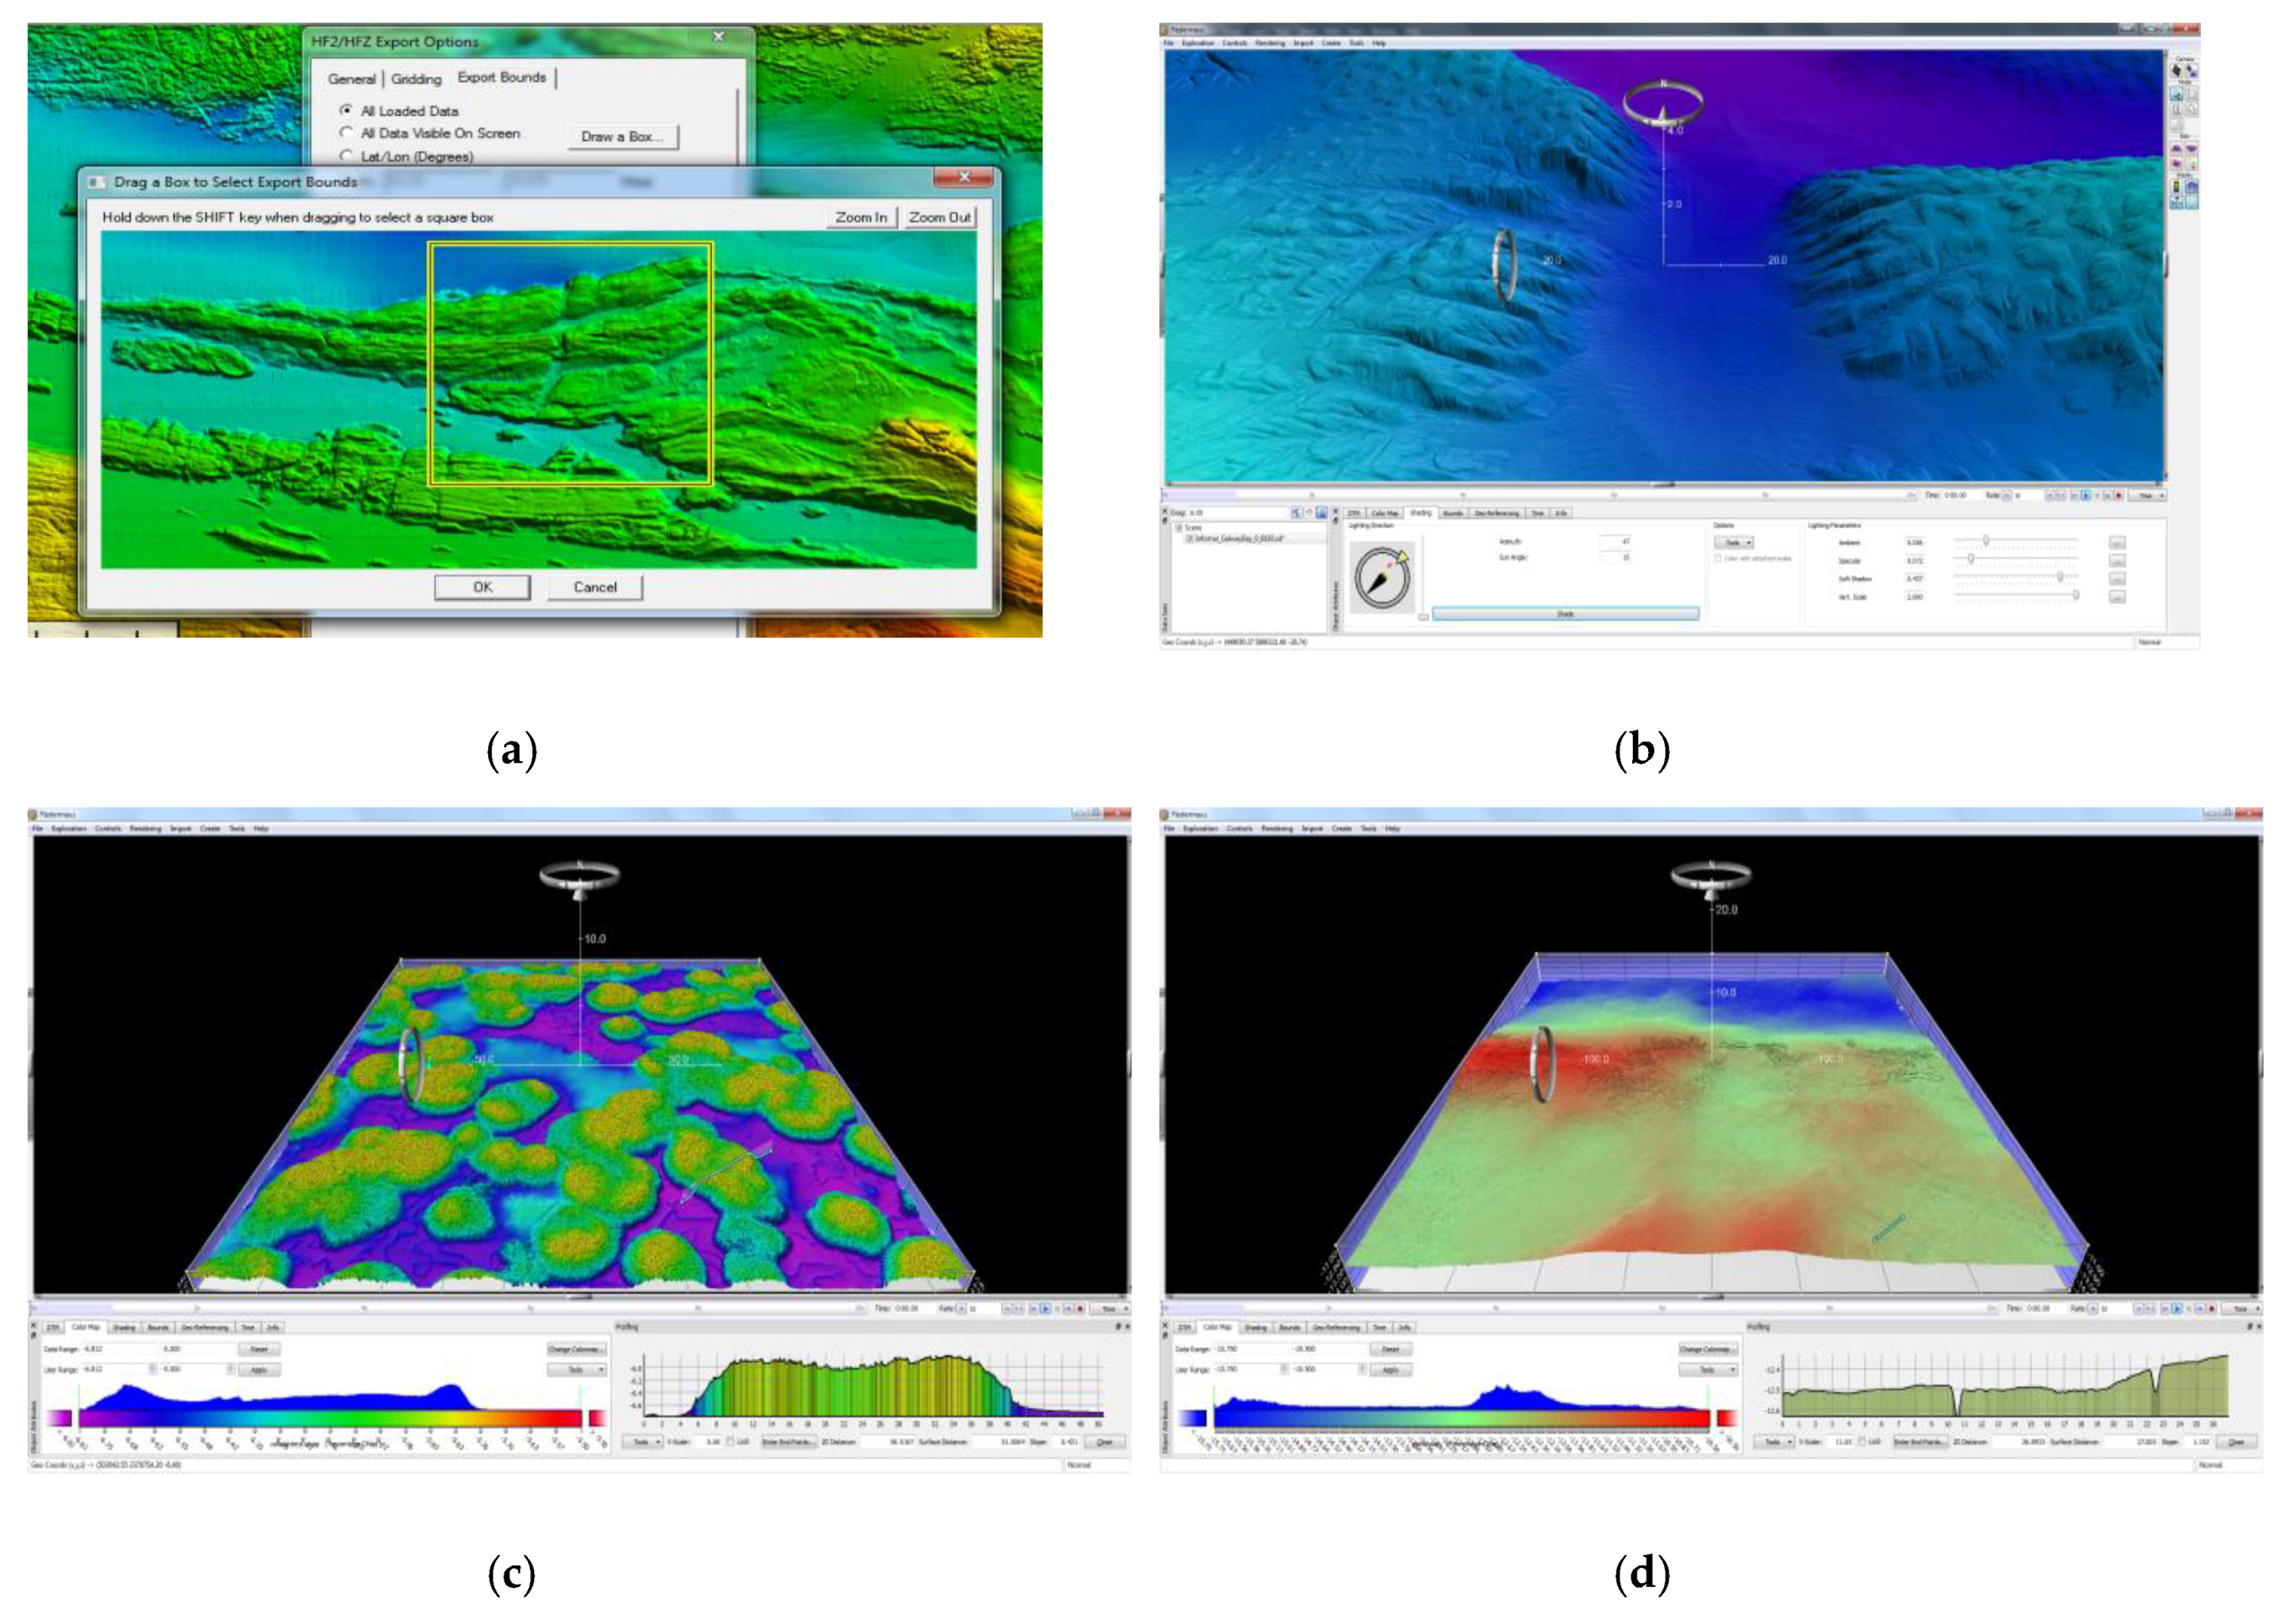
Interoperability of datasets with legacy software enables ground-truth cross-referencing and data analysis in standard workflows. Simulator runlines can be generated in conventional survey software or in the bespoke simulator mission editor and the generated sidescan and multibeam data can be imported into custom viewers as well as industry packages such as Hypack and Caris HIPS/SIPS to facilitate standard processing. The images in
Figure 3 illustrate this in practice.
4.1.2. Water Surface Layer
Shallow-water sidescan and forward-looking imaging SONAR, and to a lesser extent multibeam SONAR, are affected by direct and multi-path returns from the water surface. The artefact appears in the data as a dynamic water texture superimposed on a static image of the true seabed, and with a second delayed echo of the seabed in the case of multi-path. Water surface modelling is a popular GPGPU showcase as its “embarrassingly parallel” nature yields impressive performance benchmark results while generating picturesque scenery. This visualisation with the addition of a vessel CAD model and navigation overlay produces an effective survey-vessel information display. Virtual operations can be contextualised using replicas of the end users vessels, instruments, and physical test sites. Similar to the seabed layer construction, the water surface model is implemented using fast Fourier transform. It is based on empirical Philips spectrum data [
23] and as the FFT boundaries are repeatable, the global water surface is comprised of a locally instanced tile, which is replicated throughout the SONAR field of view. During simulation of a ping, the water surface is embodied as a polygonal mesh and consumed by the acoustic ray tracer.
4.1.3. Vessel Simulator
A survey vehicle simulator was developed to position and orient the SONAR in the virtual environment and subsequently extended to generate the motion profiles and positional estimation data characteristic of unmanned and ship survey platforms and payload navigation systems. The navigation simulator outputs time-stamped six degrees of freedom pose measurements to enable post-processing geo-correction and reconstruction of the generated SONAR data. These data are streamed to a vehicle autopilot simulator that encapsulates survey, inspection, and surveillance modes of operation. The input interface provides functionality to set the mission commands and vehicle manoeuvrability characteristics. Vehicle and sensor response models relevant to SONAR mapping, such as platform motion disturbance and error modelling of position estimation, are implemented. More specialised vehicle control models incorporating hydrodynamic behaviour, controller tuning, propulsion systems, are represented as abstract classes so that these behaviours can be implemented in the future. Three modes of vehicle navigation and guidance are supported.
- (1)
Missions can follow navigation data embedded in a previously recorded SONAR dataset.
- (2)
The autopilot can traverse a specified mission circuit of runlines, waypoints, and commands.
- (3)
The simulator can synchronise to navigation streams provided by external network sources.
In operating modes requiring vessel autopilot functionality, the vessel simulator is initialised at runtime with information loaded from the input XML mission. This script contains the vehicle configuration, which specifies the vehicle manoeuvrability (turning radius, velocities, and accelerations) and per-axis motion perturbation profile (frequencies, amplitudes, and roughness). The sensor specification contains their lever arms, quality parameters, and communication protocols. The mission is defined as a vehicle circuit with by a series of multi-waypoint runlines for survey operations or a sequence of waypoints with associated actions in the case of intervention applications.
The vehicle path following behaviour is implemented using a state machine pattern that activates different low-level vessel controllers (heading, speed) and updates setpoints as the mission progresses. The state machine is initialised with a vessel heading and stationary position. The vehicle accelerates to a maximum velocity and proceeds to the next waypoint with a motion profile governed by the SUVAT kinematics equations and user-specified acceleration and velocity thresholds specified in a mission XML script. Upon approach to a waypoint, the vehicle can pass through on a specified heading (survey mode) or come to a stop if, for example, station-keeping behaviour is required (inspection/surveillance/monitoring mode). Vehicle steering behaviour is based on its turning circle. Stopping distances and turn rates are automatically calculated.
Two significant contributors to the survey error budget are installation measurement errors in the relative body-fixed mounting location of navigation and SONAR sensors on the vehicle, and deviations and drift in the accuracy of runtime GPS and INS world-fixed pose estimations. The vehicle simulator supports investigation of vehicle stability, payload mounting accuracy, and navigation system errors on the SONAR data quality. Motion disturbance perturbations are injected into the vehicle dynamics as jittered periodic oscillations with superimposed noise components. Noise is generated by fractional Brownian motion random walk and biased to ensure that the vehicle maintains a rhythm about its central axes. The vehicle mounting location and orientation of payload SONAR and navigation sensors are specified with both actual and measured values. The actual pose is used in the calculation of SONAR and navigation data, while the measured values are used in the recorded data to produce installation error artefacts. The navigation system simulator contains models to estimate the quality factor of the individual navigation sensors such as GPS and the Inertial Navigation System. INS error sources such as noise and bias are injected into the accelerometer and gyroscope sub-system measurements and a Runge Kutta integration generate the characteristic INS drift. The navigation and autopilot systems use the estimated positional data while the SONAR simulator uses the actual data.
4.1.4. SONAR Simulator
The SONAR simulator is fundamentally a ray tracer and ray-triangle intersection tester repurposed to evaluate the SONAR equation and account for source directivity, propagation, transmission losses, and reverberation and scattering. The ping transmission-reception cycle models the transmit pulse as a volume of rays that propagate through the water medium until they either reach a maximum range threshold or intersect a mesh polygon. To model occlusion and shadowing, all polygons must be intersection tested to determine the closest intersection point in case of multiple hits. Rays are segmented along horizontal and vertical boundaries in the sound speed profile of the water column and refraction at these discrete boundaries is modelled using Snell’s law. Formulaic transmission losses due to spreading and attenuation are calculated based on time of flight. The transducer directivity pattern is frequency dependent, with beamwidth inversely proportional to the frequency and array length. Each ray’s source and receive intensity is weighted according to its launch and return angle at the transducer face to model the distribution of energy across the main beam and side lobes. The ray density within the propagation volume is adjusted such that all triangles within the ensonified mesh footprint are hit. Valid ray-triangle intersections trigger a texture lookup to determine the hit sediment type. The angle of intersection between the ray and the triangle normal is used to index the pre-calculated array of Jackson’s backscatter values. The calculated phase, intensity, and time of flight return from each ray is aggregated into beam sample bins. For sidescan and forward-looking SONAR, the time-amplitude data are returned, while for multibeam the bottom detect algorithm consumes the time-amplitude and time-phase couplets to calculate the per-beam seabed return near nadir and oblique angle, respectively.
Figure 4 shows examples of Forward Looking SONAR data generated by the simulator when imaging a quay wall and port scene. The composite time vs intensity scan imagery encodes the highlighting and shadowing characteristic of the complex seabed and wall geometry, with superimposed returns from the dynamic water surface.
As simulator scenarios are constructed to a level of detail commensurate with the resolution of the modelled SONAR and with a span sufficient for replicating survey scale operations, they result in billion-point geometry models. Ray tracing these models at a density of tens of thousands of rays per beam is not possible in real-time on current hardware solutions without multiple software layers of data reduction and compute optimisation. Our approach to this problem adapts candidate solutions in related domains to the bespoke requirements of SONAR simulation. Advancements first proven in flight simulation, video gaming, and photo-realistic rendering are integrated into the simulator architecture to deliver performance step changes in underwater SONAR simulation. The following sections describe the design and implementation of these accelerations including GPU parallel ray tracing, view-dependent level of detail, and spatial data paging.
4.2. High-Performance Simulation—TRL 4–5 Laboratory Validation
To accelerate the propagation and scatting models, the interaction between the emitted acoustic pulse and the underwater medium is implemented as a set of GPU ray tracing and ray-mesh intersection test kernels. The simulator ping rate performance is primarily determined by the amount of geometry that must be processed by the ray tracer due to the single instruction multiple data GPU compute layout. The objective of the CPU software architecture memory and data flow control routines is to reduce the amount of mesh data on the GPU at each ping to just the subset of scenario geometry that is visible to the SONAR. This is a compute challenge common to application domains such as video gaming, CAD visualisation, and scientific data rendering and points to computer graphics as a candidate solution space.
4.2.1. Analogous Paradigms—Computer Graphics and SONAR Simulation
Computer graphics has been the main contributor of software algorithms for identifying and culling non-visible geometric data [
24]. The objective is to maintain interactive video game frame rates without sacrificing visual realism by minimising the amount of geometry data that enters the vertex shader stage of the render pipeline. View frustum, back face, and occlusion culling methods detect and remove geometry that is outside the camera field of view, oriented away from the camera, and hidden behind closer objects respectively. To accelerate the detection process, fast query tree structures such as binary space partitioning, bounding volume hierarchies, and quad-trees are utilised. A compute-intensive pre-processing stage packages scenario geometry into multi-resolution representations. These hierarchies can be efficiently interrogated at runtime to identify visible geometry. Geometry that is not visible is coarsened to a low-resolution approximation to minimise its polygon count, while the visible (akin to ensonified in acoustics) geometry is preserved at the highest level of detail. The runtime processing overhead is minimised by the smooth motion of the camera, which has the effect that the majority of polygons visible in the current frame will also be visible in the next frame. Likewise, the ensonified SONAR footprint is a small subset of the overall scenario and the adaptive low/high adaptive meshing process only occurs at the boundaries of this footprint to minimise the CPU computational overhead. Newly ensonified geometry is restored to high resolution while geometry exiting the footprint is coarsened. The total number of polygons for GPU processing (ray tracing) is thus reduced to just ensonified regions plus a small count of low-resolution polygons outside the SONAR beam pattern. In this respect, SONAR simulation is analogous to high-frequency underwater acoustics.
There is a high ping-to-ping coherence of ensonified scatters due to high ping rates.
The SONAR beam pattern field-of-view is representative of a camera view frustum.
Acoustic ray tracers are conceptually similar to optical ray tracers except that acoustic propagation is affected by refraction.
Exploiting these parallels, this work adapts view-dependent level of detail (VDLOD) progressive mesh (PM) methods, first reported in [
25] to accelerate flight simulator terrain rendering. The specific embodiment of VDLOD that is used is described in [
26] with a source code implementation available in OpenMesh [
27]. The pertinent detail is summarised here in the context of SONAR simulation and the reader is referred to the prior literature for a more comprehensive elaboration. On a modern server or PC build, the available RAM capacity is sufficient to maintain a copy of the complete survey-scale scenario in system memory. This enables fast CPU access to mesh geometry data once the initial out-of-core paging from HDD to RAM has completed. However, in certain simulator use cases, it is desirable to minimise RAM and well as GPU memory occupancy. Artificial intelligence testing often requires large batches of short simulation missions and the overhead of retrieving the full scenario from file at each start-up initialisation adds significant time and cost when accumulated across many thousands of runs. Therefore one data reduction process is used to control the geometry paging from disk storage to system RAM, while another controls the geometry paging from system RAM to GPU memory.
The scenario mesh data is segmented into discrete objects and terrain tiles. The corner vertices of each object and tile bounding box are used to construct low-resolution paging meshes. These paging meshes are queried at runtime to determine if the object or tile within each bounding box is visible to the SONAR. If a bounding box vertex passes the visibility test then the corresponding object or tile mesh geometry is paged to memory. The disk storage to system RAM paging mesh controls the amount of scenario geometry data retrieved from file at the first and every subsequent ping. A buffer area surrounding the SONAR mesh footprint is included as tolerance to compensate for bandwidth and latency delays involved in SDD to RAM data bus transfers. The system RAM to GPU paging includes a smaller buffer area as the GPU bus bandwidth is typically higher. While it is desirable to reduce the GPU memory occupancy, it is essential to prevent occurrences of null ping returns from instances where newly visible geometry is not available to the ray tracer in GPU memory immediately after the SONAR pose is updated. Both paging tasks are executed as CPU threads.
4.2.2. View-Dependent Level of Detail (VDLOD)—Pre-processing
The pre-processing stage simplifies the scenario meshes by an iterative decimation routine to produce a sequence of multi-resolution meshes at progressively lower resolution. At each iteration, an edge between two vertices is selected and the vertices are unified. This merges the two edge adjacent polygons and edges incident on the original vertices are re-joined to the new vertex to restore the mesh connectivity. The edge selection process follows a priority queue that is sorted from head to tail in order of the increasing surface fit error introduced by each candidate edge collapse with respect to the original mesh. At each iteration, the edge at the head of the queue is selected for collapse. The edge collapse operations encode a parent-children relationship between the vertices in the original high-resolution mesh and the final coarse representation as a vertex hierarchy tree. As edge collapse transformations are invertible, an arbitrary triangle mesh can be represented as the simplified mesh together with the sequence of vertex split (opposite operation of an edge collapse) operations required for reconstructing the original high-resolution mesh. Once the vertex hierarchy is created, the leaf node vertices are traversed and the radius of the sphere enclosing each vertex’s one-ring neighbourhood is calculated. The bounding sphere of the interior (non-leaf node) vertices is defined as the sphere enclosing the region of the mesh constructed by all its leaf node descendants. This mapping of multi-resolution vertices to bounding spheres enables an efficient runtime test to determine whether pieces of scenario geometry are visible to the SONAR beam frustum.
4.2.3. View-Dependent Level of Detail (VDLOD)—Runtime
To modify the runtime mesh for a ping response, the world-space bounding planes of the SONAR beam frustum are updated according to the position, orientation, and range of the SONAR. The bounding sphere of each vertex in the multi-resolution mesh is tested to determine if it lies completely outside this frustum. If the signed-distances from the vertex to the frustum planes are all greater than the radius of its bounding sphere, then the vertex is determined to reside outside the SONAR beam pattern. In this instance, an edge collapse is attempted to remove and coarsen this piece of geometry from the ray-tracing pipeline. As they are not visible to the SONAR (multi-path can be accommodated by incorporating additional frustums to enclose the specular reflection volume), the collapsed vertices are removed from the multi-resolution mesh and iteratively replaced with their ancestor nodes. The edge collapse process terminates when it reaches a stage where an edge collapse would result in a leaf node vertex being removed from the ensonified swathe. If the sphere-frustum visibility test passes, then that vertex is determined to reside inside the SONAR beam pattern. If the vertex is not a leaf node, then it is replaced by its two descendants. The descendants are visibility tested against the frustum and visible descendants are iteratively replaced with their two descendants through a recursive sequence of vertex split transforms. The vertex split process terminates when all ensonified leaf nodes are present in the multi-resolution mesh. The final multi-resolution set of polygons is then sent to the ray-tracing engine. The work of the ray tracer is thus dedicated to the set of visible high-resolution geometry, with minimal overhead required to process the far smaller set of invisible low-resolution polygons.
The data paging is designed to minimise I/O bound loading times. The simulator is deployed with RAID 0 SSDs, which store scenario maps in spatially segmented tiles to enable multi-threaded read operations across all available SSD channels. Heightfield data are stored as lossless compression PNG files with position and scaling information stored separately. The mesh horizontal structure is generated at runtime using the regular grid of pixel locations to recover the xy coordinates. To support efficient RAM to GPU data transfer, mesh data is converted from 64-bit double into 32-bit floats by applying a false origin to map the southwest corner to the origin of a local coordinate frame. The ‘w’ homogenous coordinate of the seabed geometry ‘xyzw’ floats is bit encoded with the sediment classification identifier to optimise the storage of vertex attributes.
Some vision-based 3D mesh reduction methods do not translate into the acoustic paradigm. Graphical methods replace far away polygons within the view frustum with lower resolution approximations if their screen space representation covers less than a pixel or falls within a defined projection error. These methods employ, for example, quadratic error metrics to fit a mean plane through neighbourhoods of points and then simplify the regions identified to be least affected by a reduction in vertex count. The ranking is based on visual appearance metrics, i.e., smooth regions are deemed less sensitive to vertex reduction and are identified by the cumulative projection distance of vertices to the fitting plane. The greater the cumulative distance the rougher the surface region. This approach does not accurately correspond with an acoustic response profile as, for example, across track resolution typically improves at range due to spherical spreading and narrowing of the transmit pulse resulting in finer feature delimiting capability.
4.2.4. Parallel Ray Tracing
The intersection testing computation is numerically intensive and the product of the number of rays and the number of polygons to be checked. It is inherently parallel as each ray-triangle intersection test is independent. While the majority of transistors on a CPU are dedicated to pipelining and branching of program flows, on GPU cores they are dedicated to mathematical operations. GPU kernels are optimised for SIMD compute flows that do not involve much branching. GPU methods, operating at the hardware/software interface incorporate branches of Computer Engineering to contextualise GPU dedicated data format support, stream processing, memory architecture and compute methods.
Similar to the paging visibility tests, the GPU ray trace is hierarchical. The first stage ray traces the bounding boxes of the objects and mesh tiles in GPU memory. It is not guaranteed that every tile or object will be visible as (a) the RAM to GPU paging frustum is larger than the actual SONAR frustum and (b) some objects may be occluded by other objects in cluttered or dynamic scenes. Bounding boxes that return a hit, i.e., are determined to be visible, are then ray-traced with the full complement of rays within the ensonified volume. For each ray with a successful hit, two values are returned, the range and target strength. Rays are assigned into beams and the resulting time series is then sampled and binned. For multibeam modelling a bottom detection algorithm is used to detect either the amplitude peak for beams near nadir or the phase cross over for oblique rays.
4.3. Usable Simulation—TRL 6 Software Integration
The contributions to computational underwater acoustics presented in the previous section describe the accelerated sub-systems required to unlock high-performance SONAR simulation. These acoustic embodiments of parallel compute and graph theory from applied Computer Science and Computer Engineering have been adapted for generating real-time high-resolution sidescan, multibeam, and forward-looking SONAR data. Real-time ray tracing of survey-scale environments integrates scalable parallelisation with sophisticated hierarchical data flow management. This requires a high-performance integration architecture dedicated to load balancing, sub-system communications, task synchronisation, granularity, and I/O scheduling. Without careful integration design, the performance gains achieved in individual sub-systems will be choked by parallelism inhibitors and data flow bottlenecks such as limited bus transfer bandwidth, forced serialisation of operations, data dependencies, and latency. Such requirements can be met by using established systematic practices from software engineering to build usable, reliable, and maintainable production software [
28]. Developers of high-performance SONAR simulation software must be cognisant of these design philosophies and adhere to a common set of rules. The following sections describe the structural architecture of the simulator, which is shown in abstracted form in
Figure 5.
4.3.1. Simulator N-Tier Structure
Real-world SONAR interconnects often conceptually adhere to an n-tier architecture pattern of networked distributed layers of specific purpose sub-systems. Typically consisting of three tiers, the data acquisition software serves as the presentation tier, the transducer control module implements the logic tier, and the wet end transducer can be considered a database tier. The presentation tier visualises the acquired data and enables the operator to change settings. The logic tier converts user commands into transducer configuration information and sends data requests to the transducer head in the database tier. The transducer queries the operating environment (conceptual database) by emitting an acoustic ping and sends the received data to the logic tier for beamforming and subsequent relay to the presentation layer for onscreen rendering. The n-tier pattern is popular in enterprise level client-server applications as it provides a solution to scalability, security, fault tolerance, reusability, and maintainability requirements. The simulator is implemented as a three-tier network distributed system such that the client-interface presentation tier is on the user’s computer, while the logic and database tiers can reside on a remote server.
At runtime initialisation the simulator presentation tier loads the XML mission script. The presentation tier is implemented as a model-view-controller pattern. The model part converts the mission script into a sequence of commands, which are sent as update requests to the mission state machine in the logic tier.
The state machine on the logic tier processes the update requests and signals the vehicle simulator to generate position and orientation for the next navigation and SONAR clock ticks. The generated six degrees of freedom SONAR pose information is sent to the database tier to trigger a ping response from the SONAR simulation engine.
The database tier is split into CPU, GPU, and storage components. The CPU code performs the adaptive meshing and scenario paging using the SONAR pose information as the visibility query. It updates the GPU memory and the GPU kernel code then ray traces the visible spatial data and returns the response to the acoustic query to the logic tier. The logic tier has a database abstraction layer which converts simulated ping data into a SONAR protocol and communicates it to the presentation layer for display and logging.
The presentation and logic layers are linked via a TCP/IP network connection, which enables multiple remote viewers and data acquisition systems to be interfaced. The logic and database layers can be linked via inter-process communication with support for separation to different physical locations on the network. In practice, multi-CPU multi-GPU server instances with high-speed RAID SSD storage has met end use requirements.
4.3.2. Simulator Thread Model
The CPU and GPU scenario data management is implemented as a producer-consumer thread model with shared access to a memory buffer. The CPU producer thread queries the spatial paging vertex hierarchy to determine which mesh tiles are visible to the SONAR-based on its current position and orientation. For each visible tile not already loaded, a worker thread is launched to retrieve the mesh geometry. Thread pools are used to recycle resources thus avoiding expensive acquisition and release of resources. The tile data are deposited in the shared memory buffer along with a list of tiles no longer visible. The CPU consumer thread loads the tile data to the GPU memory along with supporting information such as the tile bounding boxes. It releases tiles that are no longer visible to free up GPU memory. Mutex synchronisation locks are used to control access to the producer-consumer shared memory buffer.
The vehicle and SONAR simulators run in dedicated threads synchronised by an internal simulator clock. The vehicle simulator executes the equivalent of one ping ahead of the SONAR simulator and is typically set to output attitude updates at 50–100Hz and position updates at 1–10Hz. Navigation updates are at fixed time intervals and asynchronous with the SONAR ping timestamps. The sub-system simulators and data paging tasks are executed as dedicated CPU worker threads. The GPU ray tracing code is executed as core kernel threads. As the application code was built using the QT framework it extensively uses signals and slots, an observer communication pattern.
4.3.3. Simulator Object-Oriented Design
The simulator is designed as an object-oriented system of integrated sub-systems. Tasks are divided by assignment of related responsibility into highly cohesive modules. For example, vehicle simulator functionality is decoupled from SONAR simulator functionality by implementing separate sub-system modules. Their behaviours are encapsulated, and module communication and data flow are performed through rigid interfaces. The object-oriented division of simulator responsibilities serves to decouple their development. It also removes the responsibility from the main programme flow to execute and synchronise all simulator operations.
The simulator sub-systems comprise hierarchies of specific purpose sub-systems, for example, the vehicle simulator comprises sub-simulators of motion disturbance, navigation instruments, and autopilot functionality. In turn the navigation instruments have their own subsystems, for example, the inertial navigation system simulator has sub-simulators of accelerometers and gyroscopes to model noise, bias, and perform numerical integration of errors to reproduce drift in positional estimation.
Inheritance is used to implement customisations. For example, different SONAR types such as multibeam, sidescan, and forward-looking are implemented by overriding and extending the functionality of a base SONAR class. To enable future expansion of functionality, abstract classes are incorporated, which are initially incomplete and missing implementation that can later be inherited and customised. For each module (or object), encapsulation hides the implementation and abstraction generalises the interface package common code into libraries.
4.4. Hydrographic Personnel Training—TRL 7 Demonstration
4.4.1. Industry Context
There are c. 55 International Hydrography Organisation accredited training programmes [
29]. The geographic distribution of academies correlates strongly with the locations of offshore oil rigs, major ports, and epicentres of naval expenditure. The employability prospects for skilled hydrographers are often volatile, driven by turbulent geo-political and economic conditions in these sectors. For example, oil and gas (O&G) prices halving between June 2014 and March 2015 triggered widespread divestment from subsea hydrocarbon exploration and reduced overall sector employment by 40% [
30]. However, the impact on hydrography has been partially mitigated by growth opportunities in nearshore construction, security, and renewable energy. For example, with offshore wind energy (OWE) installation rates forecast for 2019 and 2020, the OECD has predicted that OWE will grow to 8% of the ocean economy by 2030 with €200 billion of value [
31]. Diversification of revenue streams, coupled with resurgent oil prices, has hydrography growth forecasts on an upward trajectory. However, as the sector is recovering from a severe contraction, sustainable personnel capacity building is required to meet renewed demand for qualified surveyors.
The absence of a cost-effective model for hydrography training is at the forefront of threats to industry growth. Due to deficiencies in training infrastructure, conventional delivery solutions for continuous professional development, contractor onboarding, and graduate induction are expensive, non-scalable, and limited in scope. On-ship training, essential for reinforcing practical competency, incurs the excessive costs of survey ship operations ranging from €5,000 per day for shallow-water to upwards of €50,000 for deep-ocean survey [
32]. The scalability of on-ship behaviour-induced learning is inherently limited by the one-to-one allocation of onboard survey systems to students. Demonstration based training based, with multiple trainees observing and experienced surveyor, inherits the shortcomings of traditional didactic classroom instruction. Given the situation-dependent nature of training scenarios, it is also not always feasible to deliver a wide scope of exercises from a centralised training base. Experiential learning is widely established as the most effective delivery mode for reinforcing knowledge, critical thinking, and decision-making skills [
33]. New approaches to improve the cost-effectiveness of experiential hydrography training are required.
4.4.2. Simulator Objectives
Following the approach of airline pilot training, and motivated by the severe cost of mistakes during safety-critical manoeuvres involving large assets, the maritime sector has adopted simulation to virtualise task-based training in marine vehicle operations [
34]. Mistakes that occur during SONAR survey training are not critical as the hydrography workflow is decoupled from operations on the bridge. However, ship-time spent addressing fundamental gaps in student knowledge adds expensive inefficiencies to the overall training budget. The role of simulation in hydrography is primarily to virtualise pre-ship experiential learning such that students can learn by doing and make mistakes without the overhead of ship-time costs. By providing a safe and risk-free environment to explore operational boundaries and investigate cause-and-effect relationships, students can repeat task-based process and procedures until they are proficient. Instructors can schedule on demand formative competency assessments without having to interleave with higher priority ship operations, while students have similar flexibility in scheduling their self-learning. Focusing on productivity, scalability, and diversity, three key simulator requirements are identified.
Preparatory simulator-based training should optimise the productivity of on-ship training. Trainees should arrive on ship already familiar with the interfaces and behaviours of the onboard survey systems and proficient in their configuration, operation, and fault diagnosis.
The scalable solution should support decentralised blended learning to facilitate employee schedules built around the work, travel, and remote access patterns of industry role profiles.
The scope of potential learning outcomes should reflect the broad spectrum of skills and use scenarios that define modern hydrography.
4.4.3. Project Delivery Framework
The simulator usability requirements to support hydrography training were initially elaborated during two separate desk study projects commissioned by the Irish Marine Institute and the Geological Survey of Ireland under the INFOMAR research programme in 2011 and 2016. A series of stakeholder requirements analysis and mapping exercises were conducted this period. The subsequent demonstrator implementation and user validation testing were conducted under tender with the General Commission for Survey, Jeddah, Saudi Arabia, where it is used to support their teaching delivery on multibeam SONAR. At the time, GCS served as an International Hydrographic Organisation accredited training academy delivering Category A and B courses as well as seismic, bathymetry, and seabed imaging survey services.
The GCS case study utilised the Dynamic Systems Development Method to manage the project delivery. The timelines and cost of the installation were fixed in the tender contract. The DSDM approach facilitated end-user involvement in shaping the solution and enabled the design process to track dynamic requirements and ensure user satisfaction. User stories from GCS instructors and students informed the needs elicitation and ensured that accreditation standards were baked into the solution design. These needs were ranked using MoSCoW analysis (
Table 1) to define the scope of delivery and associated milestone acceptance criteria. The priority requirements were mapped to simulator features, which significantly focused on extending the simulator usability. Stakeholder and user satisfaction was measured by qualitative research methodology employing in situ observation and direct feedback from 15 students during evaluation of sample exercises. Through active learning and participative group discussion, opportunities for pedagogical innovation were captured and where simulator features could be readily repurposed these were trialled through rapid prototyping.
4.4.4. Results
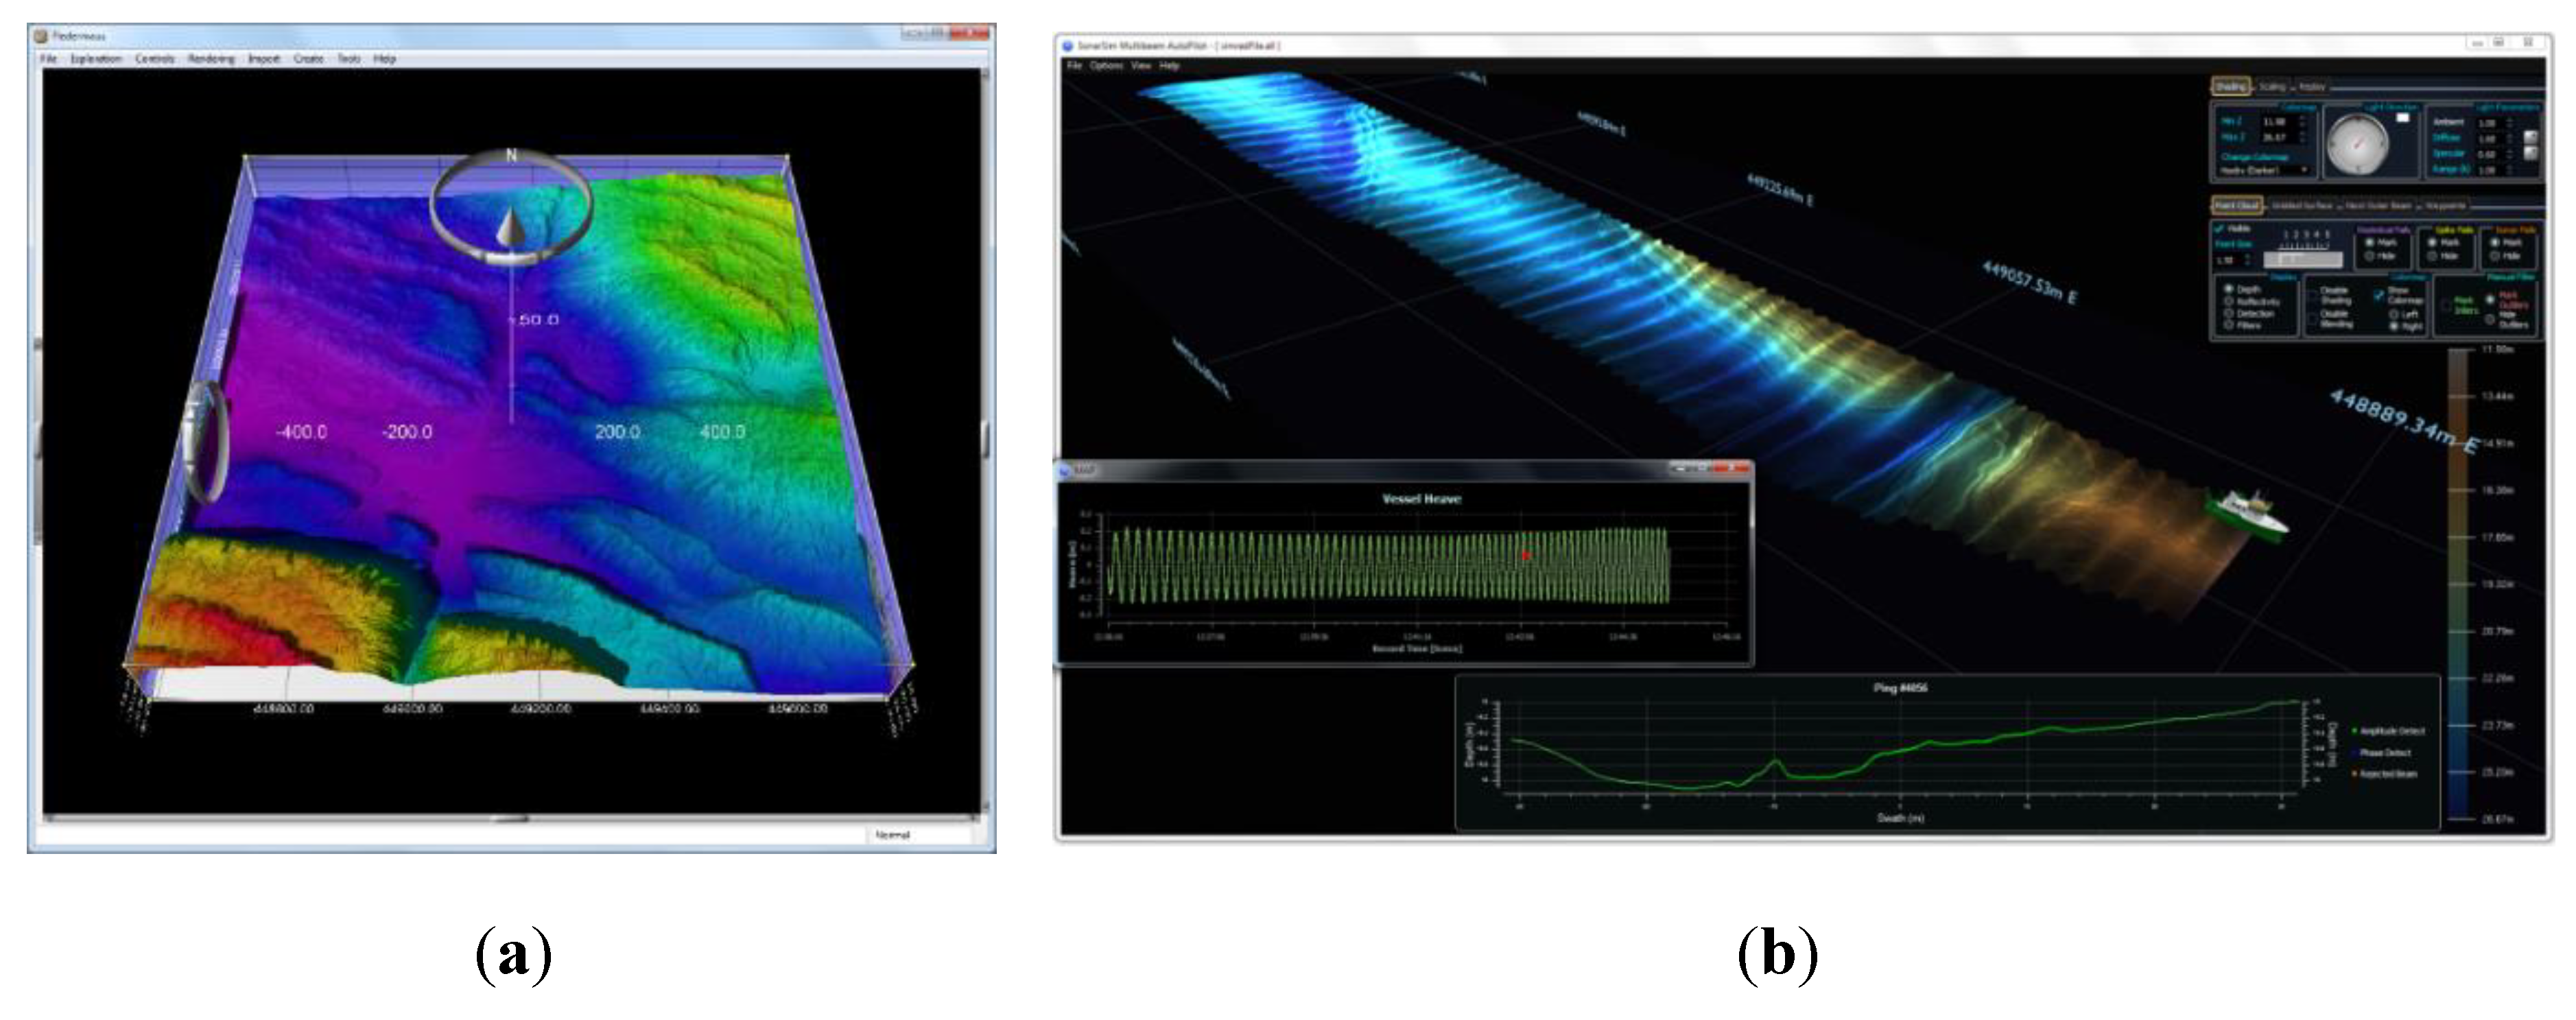
The simulator fine-grain parameter control combined with its repeatable response enables unique training functionality. The environment, acoustic, and navigation models are deterministic and governed by parameters accessible through the mission XML script. Individual parameters can be modified in isolation, or collections of parameters modified in combination to investigate the effect of different setting permutations. Datasets can be generated that are identical, apart from the varying signature of the parameters under investigation, which can be varied across their full range of expected values over the course of many simulation runs. This provides a persistent backdrop against which to highlight the resulting changes in the return signal. While it is designed to cultivate trainee proficiency at SONAR data interpretation, the capability to modify a subset of parameters across multiple simulator executions underpins training on survey planning. For example, the Common Dataset contains surface models generated by different SONAR and accompanying raw navigation and SONAR data files. This provides the opportunity to use the simulator to evaluate and compare how different instrument parameters settings affect survey quality [
35], as shown in practice in
Figure 6. Mission planning and simulator autopilot functionality enable adaptive lawnmower style multibeam and sidescan runline surveys to be simulated from which survey metrics such as total time, data redundancy, and ultimately survey cost can be accurately predicted. This functionality also enables replication of pre-mobilisation integration and system testing [
36,
37].
The simulator streams and records data in formats compatible with industry standard hydrographic software. Using XTF and EM formats for sidescan and multibeam logging enabled interoperability with all target packages, including successful trials with MB-System, QPS Qinsy, Caris HIPS/SIPS, Hypack, Kongsberg SIS, and EIVA NaviSuite. To simplify the simulator configuration process, predefined scripts encapsulating the properties of common SONAR instrument models were generated. A suite of GUI widgets was developed to enable students to create and monitor custom missions without the requirement to edit scripts, as shown in
Figure 7.
The real-world data signature of system faults and configuration issues, as well as features of interest, are often masked by a multitude of interacting physical processes encoded in the return signal. The simulator makes it possible to simplify the complexity of the acoustic process by removing unwanted artefacts and distortions from the image formation process, such as platform motion-disturbance and non-uniform beam directivity. An example sidescan SONAR tutorial scenario involves repeating the same survey line under identical conditions while stepping the transmit pulse through progressively longer durations. The signal response across the full-scale deflection of pulse values reveals the gradual decrease in acrosstrack imaging. To improve usability, instructors can generate unsupervised batches of datasets from a sequence of XML scripts. This type of dataset collection is not typical of real-world surveys. As a result, off-the-shelf software packages for SONAR data processing are not designed to cycle-through and present multiple datasets from the same runline. This work developed a custom suite of post-simulation SONAR visualisation and analysis software tools. These enable students and instructors to animate through the cause and effect relationship and explore the image generation process.
As the simulator encapsulates the mechanics of a video game, it provides opportunities to gamify training exercises. A basic example exercise required students to plan a runline to achieve a 10% coverage overlap with the boundary of a previously surveyed area. The existing coverage ran down a slope, so the learning objective was to account for the increasing swath width as the vessel travelled into deep waters. Students were ranked according to how closely their calculated multi-waypoint runline achieved consistent 10% overlap using 3D surface matching. Introducing a competitive element energised the learning environment and helped improve engagement. Exercise sequences are designed to increase in complexity until the challenge culminates in a typical survey procedure. For example, basic runline planning evolves into a full survey planning exercise requiring multi-faceted consideration of equipment selection, estimated time and cost budgeting, and prediction of data quality.
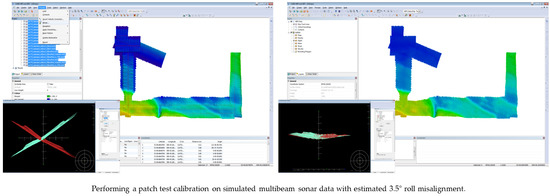
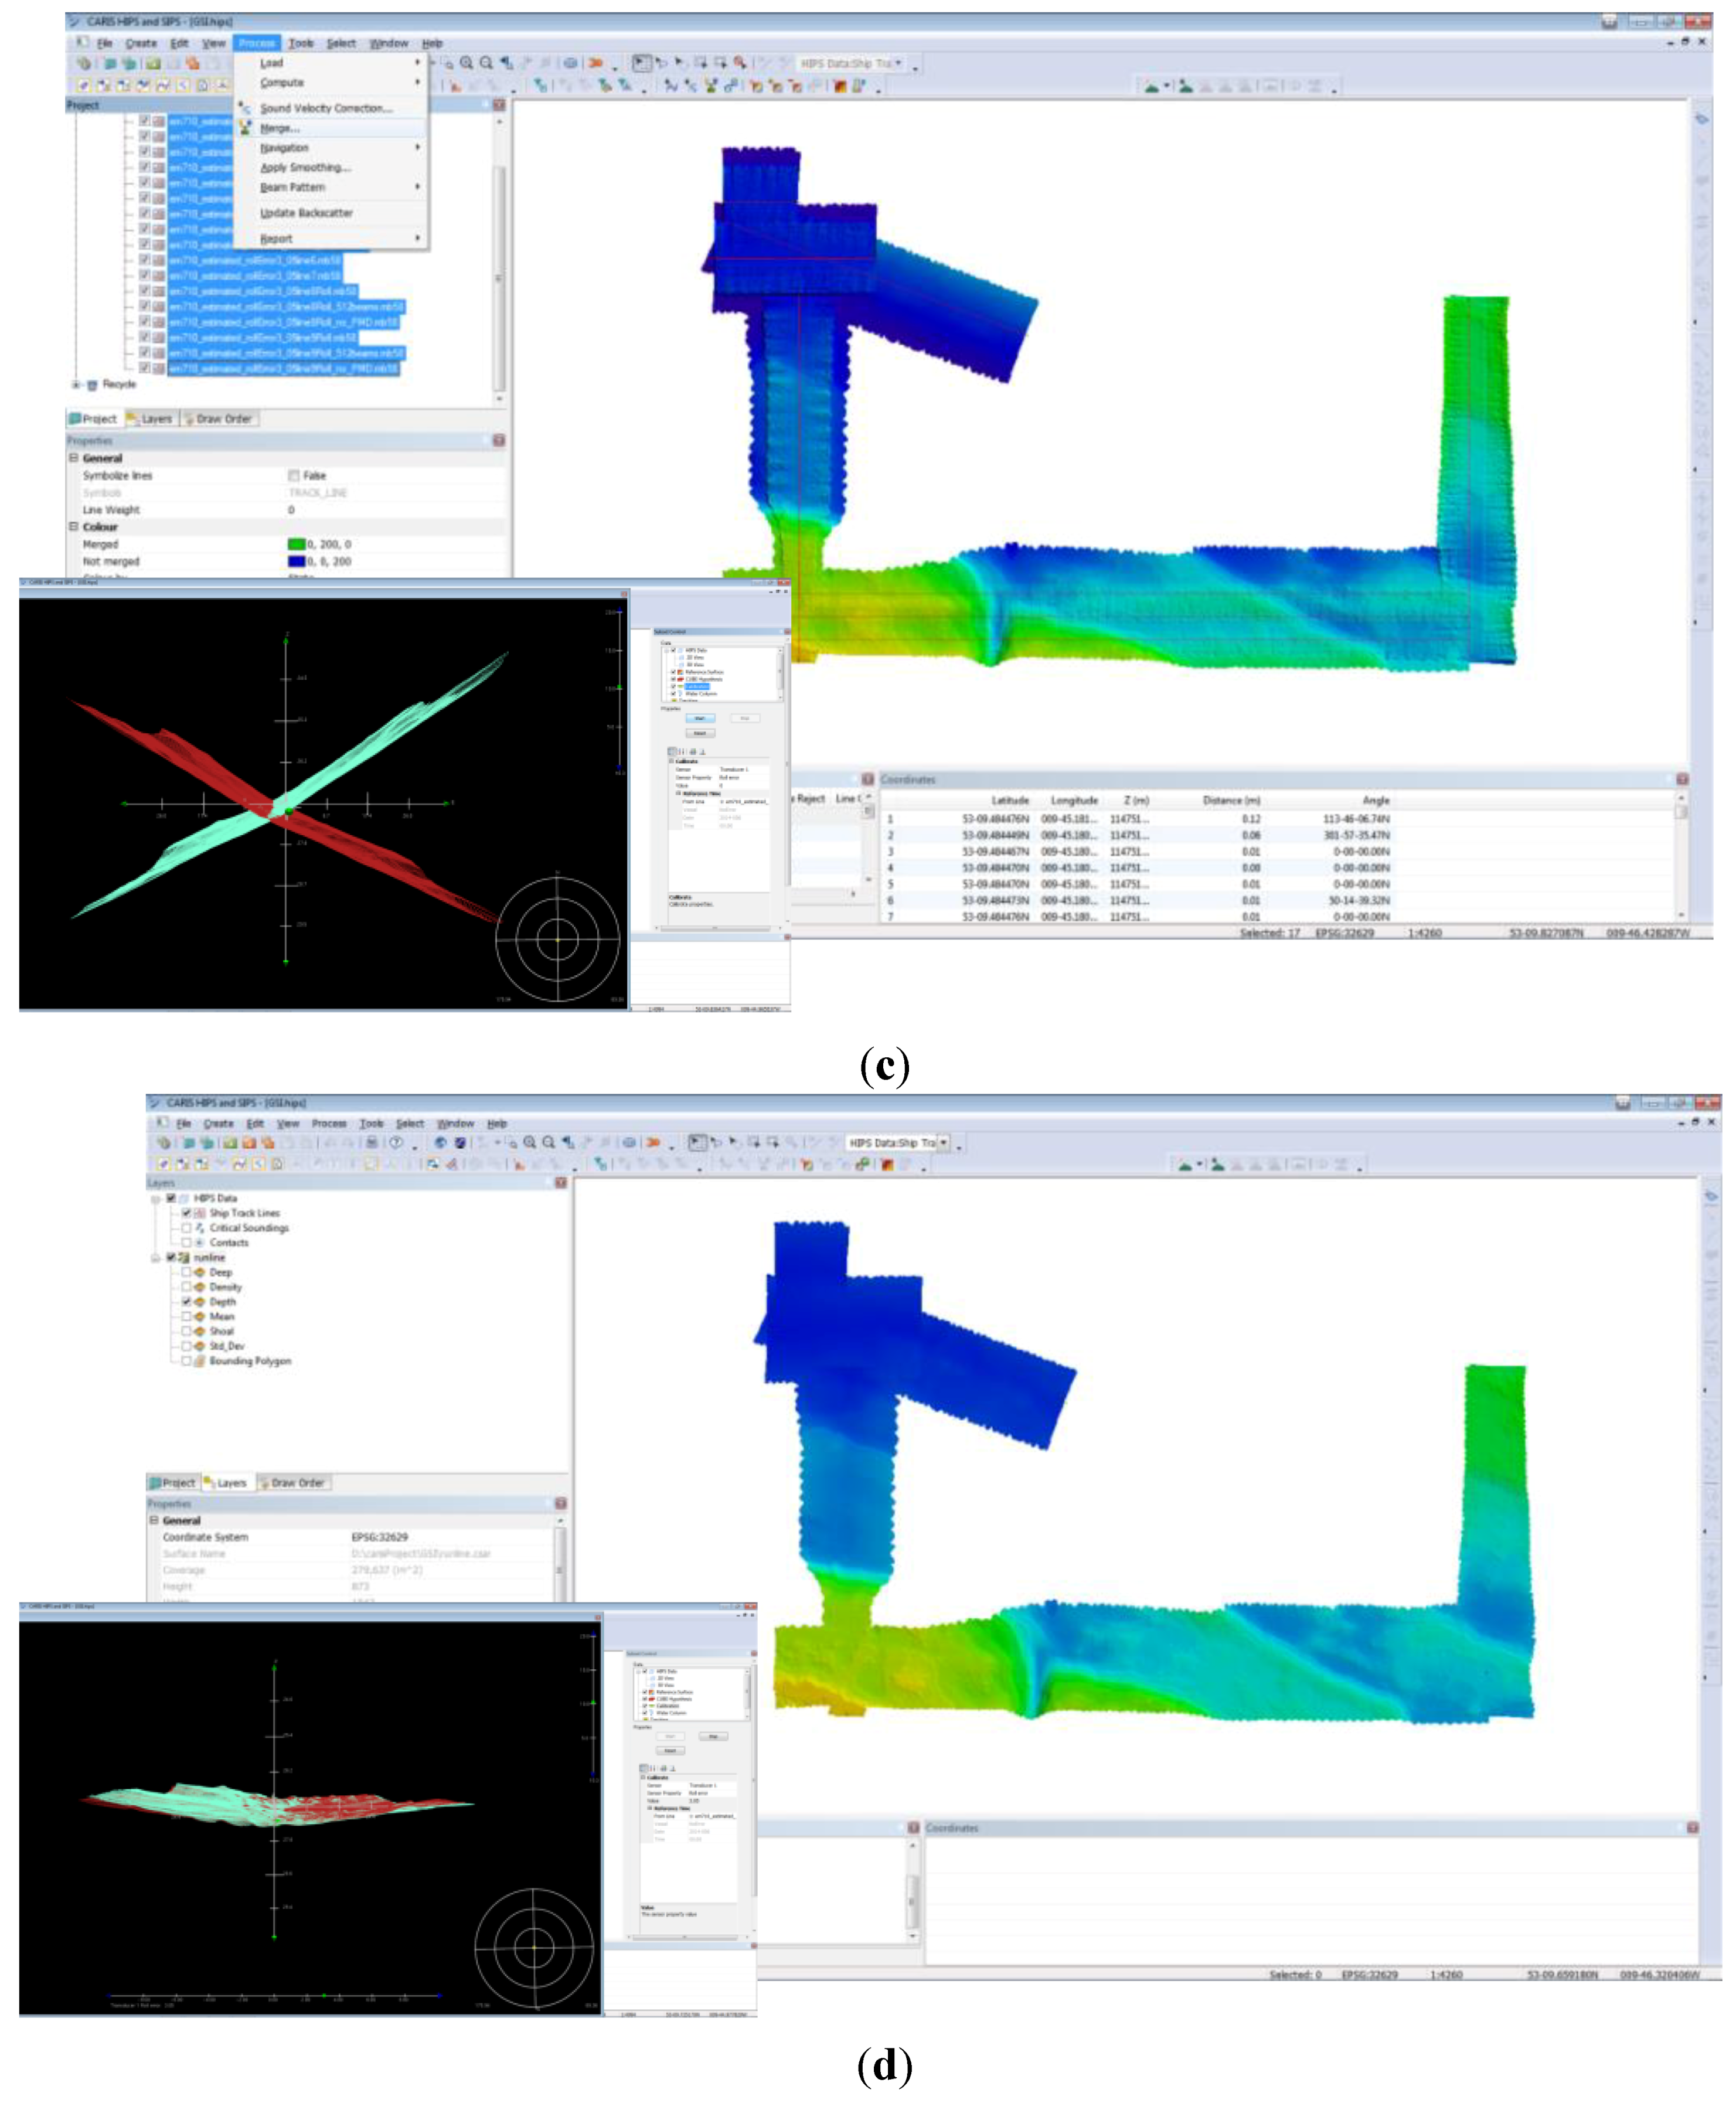
Other advanced exercises enable the instructor to generate SONAR datasets containing errors unknown to the student. The student’s task is to identify the signature of the error artefact in the data, quantify the error, apply corrective action, and validate the result. For example, the XML scripts enable specification of the actual and estimated lever arms and orientation alignments between the navigation system and SONAR mounting. The estimated values include measurement errors, which must be resolved using a patch calibration test. By generating data with the SONAR out of roll alignment with the navigation system, as shown in
Figure 8 for example, the students learning experience is to complete the patch and performance test workflow to verify and correct the misalignment. This challenge is particularly beneficial since it requires the student to interact with all parts of the acquisition and processing software workflow to complete the task.
5. Discussion
The simulator that can generate a breadth and depth of training datasets, which if not impossible to acquire in the real-world, would cost at least two orders of magnitude more in survey costs than generating using a cloud compute service. Real-world datasets demonstrating routine and corner-case survey problems are not readily available, as erroneous data with the signature and artefacts of system faults and operator mistakes are not published in the national archive repositories. This limits available exemplars for demonstrating SONAR fault diagnosis, quality control, and error correction. The developed simulator solves this problem and will generate datasets in real-time (c. 10 pings/sec) on NVidia Tesla P100 and later (e.g., V100) configuration servers. Using a cloud deployment, multiple distributed instances can be created for performance scaling. For example, the equivalent of five days survey data can be generated in six hours using 20 Amazon EC2 P3 instances with an indicative cloud service cost of €320. The equivalent real-world survey time would cost over €30,000 for shallow coastal zone operations. However, the cost of generating bespoke simulated data is significantly lower than generating bespoke simulator features, scenarios, and learning content.
To meet all the specific needs of the diverse field of stakeholders would require significant customisation. It is essential to maximise the relevance of the scope of requirements. In February 2017, SonarSim and University of Limerick hosted a roundtable stakeholder meeting to assess requirements for hydrographic education, training, and capacity building in Ireland. The event involved leading national organisations in a requirements development exercise. Various user stories were elaborated to contextualise the domain-specific training needs of each organisation. It also provided a forum for sharing market intelligence to assess the potential for replication and scaling of proposed solutions. Reflecting the diverse spread of multi-sectoral use cases, representatives from the Geological Survey or Ireland, Irish Marine Institute, the Irish Navy, Shannon Foynes Port Company, Enterprise Ireland, and private sector companies elicited training needs spanning domains such as national charting, geoscience, port and harbour management, defence and security, archaeology, and offshore energy. Each organisation has distinct data requirements stemming from their different spheres of responsibility. Consequently, their survey modes of operation couple different SONAR types to a variety of different ship, ASV, AUV, and ROV platforms, with mission profiles covering a wide range of deep, coastal zone, and inshore scenarios. From a training perspective, they cover an exceeding wide scope of specialised requirements, emphasising the need for a common training standard to meet multiple ends. The IHO standards of competence for hydrographic surveyors provides this common framework of learning outcomes and should be used for guiding simulator design decisions to maximise training relevance.
The economic feasibility of training is also dependent on the delivery channel. Generation of e-learning material is expensive relative to its delivery. Typical industry metrics are 100–200 hours of ADDIE (analysis, design, development, implementation, and evaluation) per hour of ready online learning content. Generation of specialised simulator-based learning content will extend the ADDIE cost model if source code modification or custom scenario development is required. It is essential that the priority subset of learning requirements are identified and verified before committing development resources. Engaging hydrographic educators as stakeholders early in this process ensures that simulator development is directed at topics in the curriculum where students struggle to understand the existing material or where formative and summative assessments can be improved. Collaboration between high tech innovators and established learning providers, such as accredited academies and universities, provides a pedagogical framework to map the technical capability of simulation to enhanced teaching methods, learning outcomes, and standardised assessments and evaluations. Modern hydrography programmes will adhere to a structured lesson plans supported by learning resources curated through a virtual learning environment (VLE). Practical exercises underpinned by simulator-generated datasets can be shrink-wrapped and added to the VLE to augment existing learning material and assessments. This approach facilitates seamless integration into existing learning schedules with the added benefit of providing extended opportunities for student self-learning and self-assessment. By providing access to the actual simulator via a cloud service, the learning can be transformed into an on-demand experience.
6. Conclusions
This paper has presented the development of real-time survey-scale underwater SONAR simulation and demonstrated its use in a real-world hydrography training environment. The development was conducted over three phases mapped to milestones of advancement on the technology readiness level scale from TRL 3–TRL 7. As the technology matured, the design process sourced knowledge from branches of disciplines such as physics, computer science, software engineering, hydrography, pedagogy, and project management. This work approached the interdisciplinary knowledge gap, between prototype and demonstrator, through participation in multi-partner collaborative research projects as a vehicle to access and engage stakeholders. Our objective is to highlight the research methodology required to transfer SONAR simulation from laboratory innovation into a high impact platform technology. The research demonstrated the use of SONAR simulation in hydrography personnel training as a pathway to impact.
Planned future research is focused on qualitative research to measure the impact of the simulator resulting from its use as a training platform and research testbed. Early-stage explorations are underway with partners University of Limerick, Ireland and Memorial University, Canada to quantify the efficiency benefit to survey operations. Ongoing research in SonarSim involves repurposing the simulator to demonstrate ship anti-grounding in the RoboVaaS project with partners Hamburg Port Authority and Fraunhofer Centre for Marine Logistics [
38]. The simulator also serves as a testbed for research focused on training diver-detection neural networks and automation of survey planning.
The development roadmap is directed, funding permitting, towards two initiatives. It would be beneficial to translate the GPGPU code base from CUDA into a language such as SYCL, to support vendor-neutral portability across heterogeneous and mobile devices and make the load balancing adaptive to the execution context. The authors are investigating open sourcing the simulator code base to facilitate this migration. Secondly, as broadband chirp transducers are displacing narrow band pulsed transducers, SONAR simulation models must keep pace. The problem domain points towards wave equation solutions, but these are numerically intensive. However, they may also be approached using 3D level of detail techniques, such as adaptively refining the propagation grid as the pulse traverses the medium. A hybrid model incorporating ray tracing, adaptive meshing, and pseudospectral time-domain methods, all underpinned by dynamic GPGPU scalability, promises to unlock general-purpose real-time acoustic modelling.
Author Contributions
J.R.; writing—draft preparation, F.F, D.T., and G.D..; writing—review and editing, J.R. and F.F. conceptualisation, funding acquisition, project administration, and research and development, J.R., F.F., D.T., G.D. and M.R. requirements analysis, verification, and validation.
Funding
This research work was funded by SonarSim Ltd. SonarSim received part funding support for this work from the European Commission (FP7 project #242112 Security Upgrade for PORTs, H2020 project #663947 Sonar INtegrated Advanced NavigatioN), Irish Marine Institute (H2020 ERA-NET Cofund MarTERA project RoboVaaS), and Geological Survey of Ireland (INFOMAR projects INF-11-21-FLA, INF-11-25-RIO, sc_033_02). SonarSim secured commercial research funding, with for example, the General Commission for Survey, Jeddah, Kingdom of Saudi Arabia and University of Limerick, Ireland procuring the simulator software under tenders in 2015 and 2017 respectively.
Conflicts of Interest
The authors declare no conflict of interest. The funders had no role in the design of the study; in the collection, analyses, or interpretation of data; in the writing of the manuscript, or in the decision to publish the results.
References
- Rybicka, J.; Tiwari, A.; Leeke, G.A. Technology readiness level assessment of composites recycling technologies. J. Clean. Prod. 2016, 112, 1001–1012. [Google Scholar] [CrossRef] [Green Version]
- Nakamura, H.; Kajikawa, Y.; Suzuki, S. Multi-level perspectives with technology readiness measures for aviation innovation. Sustain. Sci. 2013, 8, 87–101. [Google Scholar] [CrossRef]
- Foster, B. Advancing Hydrographic Data Processing Through Machine Learning. In Proceedings of the Shallow Survey 2018, St John’s, NL, Canada, 1–3 October 2018. [Google Scholar]
- Rossi, M.; Trslić, P.; Sivčev, S.; Riordan, J.; Toal, D.; Dooly, G. Real-Time Underwater StereoFusion. Sensors 2018, 18, 3936. [Google Scholar] [CrossRef] [PubMed]
- Calder, B.R. Parallel variable-resolution bathymetric estimation with static load balancing. Comput. Geosci. 2019, 123, 73–82. [Google Scholar] [CrossRef]
- International Hydrographic Organization. IHO Capacity Building Strategy; IHO: Monaco, 2014. [Google Scholar]
- Socha, V.; Socha, L.; Szabo, S.; Hána, K.; Gazda, J.; Kimličková, M.; Vajdová, I.; Madoran, A.; Hanakova, L.; Němec, V.; et al. Training of Pilots Using Flight Simulator and Its Impact on Piloting Precision; Kaunas University of Technology: Juodkrante, Lithuania, 2016. [Google Scholar]
- Elston, G.R.; Bell, J.M. Pseudospectral time-domain modeling of non-Rayleigh reverberation: Synthesis and statistical analysis of a sidescan sonar image of sand ripples. IEEE J. Ocean. Eng. 2004, 29, 317–329. [Google Scholar] [CrossRef]
- Bell, J. A Model for the Simulation of Sidescan Sonar. Ph.D. Thesis, Heriot-Watt University, Edinburgh, UK, 1995. [Google Scholar]
- Etter, P.C. Underwater Acoustic Modeling and Simulation, Fifth Edition; CRC Press, Taylor & Francis Group: Boca Raton, FL, USA, 2018. [Google Scholar]
- Bell, J.M.; Linnett, L.M. Simulation and analysis of synthetic sidescan sonar images. IEE Proc. Radar Sonar Navig. 1997, 144, 219–226. [Google Scholar] [CrossRef]
- Riordan, J. Performance Optimised Reverberation Modelling for Real-Time Synthesis of Sidescan Sonar Imagery. Ph.D. Thesis, University of Limerick, Limerick, Ireland, 2006. [Google Scholar]
- Riordan, J.; Omerdic, E.; Toal, D. Implementation and application of a real-time sidescan sonar simulator. In Proceedings of the Europe Oceans 2005, Brest, France, 20–23 June 2005; Volume 982, pp. 981–986. [Google Scholar]
- Cerqueira, R.; Trocoli, T.; Neves, G.; Joyeux, S.; Albiez, J.; Oliveira, L. A novel GPU-based sonar simulator for real-time applications. Comput. Graph. 2017, 68, 66–76. [Google Scholar] [CrossRef]
- Hornikx, M.; Krijnen, T.; van Harten, L. openPSTD: The open source pseudospectral time-domain method for acoustic propagation. Comput. Phys. Commun. 2016, 203, 298–308. [Google Scholar] [CrossRef]
- Verweij, M.D.; Treeby, B.E.; Demi, L. Simulation of Ultrasound Fields in Comprehensive Biomedical Physics Volume 2: X-Ray and Ultrasound Imaging; Elsevier: Oxford, UK, 2014; Volume 2. [Google Scholar]
- Moore, G.A. Crossing the Chasm, 3rd Edition: Marketing and Selling Disruptive Products to Mainstream Customers; HarperBusiness: New York, NY, USA, 2014. [Google Scholar]
- Sadin, S.R.; Povinelli, F.P.; Rosen, R. The NASA Technology push towards Future Space Mission Systems; Pergamon: Oxford, UK, 1989; Volume 20, pp. 73–77. [Google Scholar]
- International Hydrographic Organization. S-44 Standards for Hydrographic Surveys; International Hydrographic Bureau: Monaco, China, 2008. [Google Scholar]
- Zhang, H.; Qu, D.; Hou, Y.; Gao, F.; Huang, F. Synthetic Modeling Method for Large Scale Terrain Based on Hydrology. IEEE Access 2016, 4, 6238–6249. [Google Scholar] [CrossRef]
- Wilson, M.F.J.; O’Connell, B.; Brown, C.; Guinan, J.C.; Grehan, A.J. Multiscale Terrain Analysis of Multibeam Bathymetry Data for Habitat Mapping on the Continental Slope. Mar. Geod. 2007, 30, 3–35. [Google Scholar] [CrossRef] [Green Version]
- World Machine Software. Available online: http://www.world-machine.com/ (accessed on 2 March 2019).
- Tessendorf, J. Simulating Ocean Water. SIGGRAPH 2001, 1, 5. [Google Scholar]
- Akenine-Moller, T.; Haines, E.; Hoffman, N.; Pesce, A.; Iwanicki, M.; Hillaire, S. Real-Time Rendering, 4th ed.; A K Peters/CRC Press: New York, NY, USA, 2018. [Google Scholar]
- Hoppe, H. View-dependent refinement of progressive meshes. In Proceedings of the 24th Annual Conference on Computer Graphics and Interactive Techniques, Los Angeles, CA, USA, 3–8 August 1997; pp. 189–198. [Google Scholar]
- Kim, J.; Lee, S. Truly selective refinement of progressive meshes. In Proceedings of the Graphics Interface 2001, Ottawa, ON, Canada, 7–9 June 2001; pp. 101–110. [Google Scholar]
- Botsch, M.; Steinberg, S.; Bischoff, S.; Kobbelt, L. OpenMesh: A Generic and Efficient Polygon Mesh Data Structure. In Proceedings of the OpenSG Symposium, Darmstadt, Germany, 20–22 November 2002. [Google Scholar]
- Gamma, E.; Helm, R.; Johnson, R.; Vlissides, J. Design Patterns: Elements of Reusable Object-Oriented Software; Addison-Wesley: Reading, MA, USA, 1994. [Google Scholar]
- FIG/IHO/ICA International Board on Standards of Competence for Hydrographic Surveyors and Nautical Cartographers (IBSC)—LIST OF RECOGNIZED HYDROGRAPHY PROGRAMMES. Available online: https://www.iho.int/mtg_docs/com_wg/AB/AB_Misc/Recognized_Programmes.pdf (accessed on 2 March 2019).
- Oil & Ga UK. Workforce Report 2018; Oil & Gas UK: Aberdeen, UK, 2018. [Google Scholar]
- OECD. The Ocean Economy in 2030; OECD: Paris, France, 2016. [Google Scholar] [CrossRef]
- PricewaterhouseCoopers. INFOMAR External Evaluation. 2013. Available online: http://www.infomar.ie/documents/2013_PwC_Infomar_Evaluation_Final.pdf (accessed on 2 March 2019).
- Maudsley, G.; Strivens, J. Promoting professional knowledge, experiential learning and critical thinking for medical students. Med. Educ. 2000, 34, 535–544. [Google Scholar] [CrossRef] [PubMed]
- Sellberg, C. Simulators in bridge operations training and assessment: A systematic review and qualitative synthesis. WMU J. Marit. Aff. 2017, 16, 247–263. [Google Scholar] [CrossRef]
- Riordan, J.; Flannery, F. Integration of Multibeam Beam Steering and Vessel Dynamic Positioning to Minimise the Duration of Shallow Water Surveys. In Proceedings of the Shallow Survey—The 7th International Conference on High Resolution Surveys in Shallow Water, Plymouth, UK, 14–18 September 2015. [Google Scholar]
- Riordan, J.; Flannery, F. Real-Time Simulation for Hydrographic Training. J. Ocean Technol. 2011, 6, 11. [Google Scholar]
- Riordan, J.; Flannery, F. Outside the Matrix: Simulation in the Real World. J. Ocean Technol. 2016, 11, 9. [Google Scholar]
- RoboVaaS—Robotic Vessels as-a-Service. Available online: https://www.martera.eu/projects/robovaas (accessed on 2 March 2019).
© 2019 by the authors. Licensee MDPI, Basel, Switzerland. This article is an open access article distributed under the terms and conditions of the Creative Commons Attribution (CC BY) license (http://creativecommons.org/licenses/by/4.0/).


