Article

Mesoscale Morphological Changes of Nearshore Sand Banks since the Early 19th Century, and Their Influence on Coastal Dynamics, Northern France

by
Alexa Latapy
1,*,
Arnaud Héquette
1,
Nicolas Pouvreau
2,
Nicolas Weber
2 and
Jean-Baptiste Robin-Chanteloup
3
1
Laboratoire d’Océanologie et de Géosciences, University Littoral Côte d’Opale, Univ. Lille, CNRS, UMR 8187, LOG, 62930 Wimereux, France
2
Shom, 13 Rue du Châtellier CS92803, 29228 Brest CEDEX 02, France
3
Littoral Environnement et Sociétés, UMR 7266 LIENSS, CNRS - Université de La Rochelle, 2 rue Olympe de Gouges, 17000 La Rochelle, France
*
Author to whom correspondence should be addressed.
J. Mar. Sci. Eng. 2019, 7(3), 73; https://doi.org/10.3390/jmse7030073
Submission received: 13 February 2019 / Revised: 14 March 2019 / Accepted: 16 March 2019 / Published: 20 March 2019
(This article belongs to the Special Issue Large-scale Coastal Behavior)

Abstract

:
Tidal sand banks are common along the coast of northern France facing the North Sea, where they form linear shore-parallel or slightly oblique sand bodies from shallow coastal areas to depths of tens of meters. Hydrographic surveys have been carried out since the 1830s for mapping the seabed of the coastal zone. An analysis of the bathymetry evolution shows significant morphological changes have occurred across the shoreface since the early 19th century, largely due to cross-shore and longshore sand bank migration. Our results show that nearshore sand banks mainly migrated onshore and gained sediment, especially during the 20th century; acting as temporary sediment sinks, which can in turn serve as sand sources for providing sediment to the coast. Alongshore, the migration and elongation of sand banks can be related to tidal asymmetry that is mostly directed to the east-north-east in the region. Shore-perpendicular movement can likely be explained by the action of shore-normal storm-waves in the nearshore zone after their refraction over shallow offshore sand banks. A seaward displacement of sand banks was also observed. This may be related to the combined action of waves and tidal currents which can induce erosion on one side of the bank, decreasing its width, and eventually leading to its seaward migration. Our observations point out that some nearshore sand banks respond to the action of currents and waves, and interact between each other via feedback morphodynamic processes induced by sand bank morphological changes. The substantial morphologic changes that affected the nearshore zone of northern France during the last centuries probably had large impacts on coastal hydrodynamics and associated shoreline evolution.

1. Introduction

Different types of tidal sand banks are present in a wide range of water depths from the outer continental shelves to the shallow coastal environments, and several theories have been proposed to explain their origin and maintenance. Tidal flows, as well as storm-generated shear stress, but also the post-glacial rise in sea level, have all been called upon as mechanisms that are responsible for the formation of sand banks [1,2,3,4,5,6,7,8]. Tidal sand ridges are a characteristic feature of tide-dominated continental shelves, with large available sand volumes. Their generation requires a source of mobile sediment, either from the local seabed or from coastal erosion, and their morphology results from an equilibrium between tidal current dynamics, seafloor morphology, and sediment supply [9].
Elongate tidal banks abound in the southern North Sea [2,5,10,11,12,13] (Figure 1 inset) and may be either active or moribund. Active sandbanks are generally formed at water depths shallower than 30–50 m, where tidal currents are strong, exceeding 0.5 m·s−1 [14], and may migrate in response to present hydrodynamic processes [9,15,16]. Moribund sand banks are generally present in deeper waters where the current regime is too weak to cause active sediment movement, or in low-energy shallow water areas [9,17].
In recent years, there has been an increasing degree of interest in the dynamics of the North Sea sand banks, notably because they represent a source of marine aggregate (sand and gravel) [18,19] that will likely experience increasing extraction in the near future, due to a growing demand of aggregate material for construction purposes [20]. In addition, coastal erosion is widespread along the coasts of the North Sea [21,22,23], which also augments the demand for suitable mineral material for coastal defense schemes such as beach nourishment [24,25]. In this context, numerous studies have been conducted in the North Sea for a better understanding of the sedimentology and stratigraphy of the tidal sand banks of the region [26,27,28,29]. Numerical modelling was also carried out to predict the medium to long-term morphological evolution of the tidal sand banks of the North Sea region [10,30,31,32,33]. Numerous studies on sand bank dynamics have analyzed the interactions between sand bank morphology, hydrodynamic processes and sediment transport. Relatively few studies though have been conducted nearshore to evaluate the effect of shallow sand banks on coastal hydrodynamics and associated sediment transport [34,35,36]. Long-term morphodynamic behavior have been investigated in the UK coastal zone using historical charts over a 150 year-long period [16,37,38], whereas in the coastal zone of northern France, the available dataset is more restricted (less than 150 km2) and/or limited to the last few decades. Nevertheless, hydrographic surveys were made to map the seabed of the coastal zone since the beginning of the 19th century. These covered an area from the Belgian border to the Dover Strait down to the 30 to 40 m water depths, which enables the examination of the nearly-continuous bathymetry evolution over two centuries on large spatial scales (more than 370 km2).
In Northern France, anthropogenic impacts on coastal morphology are significant, with the notable extension of the Dunkirk and Calais harbors during the second half of the 20th century [39]. In order to better understand the large-scale evolution of this area, which is exposed to strong hydrodynamic forcing, this study aimed to analyze the evolution of the nearshore morphology between the Belgian border and the Dover Strait (Figure 1) and to assess the potential impacts of changes in sand bank morphology and position on coastal dynamics. Particular focus was made on three particular areas where bathymetry data was available since the 1830s: two shallow coastal areas (Dunkirk and Calais) and one sand bank located 10 km offshore (Occidental Dyck). The morphological evolution and migration of nearshore and offshore sand banks was characterized and quantified over historical time periods, based on the analysis of old hydrographic field sheets and recent digital bathymetry data. This paper not only documents the migration of nearshore sand banks off the coast of northern France since the early 19th century, but also aimed at analyzing the relationship between sand bank morphometric evolution and volume change. An attempt was also made to connect the observed sand bank evolution with forcing hydrodynamics, particularly the tidal currents and the wave-climate.

2. Regional Setting

2.1. Morphological and Sedimentological Characteristics

The North Sea coast of France generally consists of wide, gently sloping, sandy barred beaches [40]. Sand banks are particularly widespread in this area, where they form linear shore-parallel or slightly oblique sand bodies about 10–30 km long and 1–3 km wide (Figure 1). These banks belong to the Flemish Banks [1] and generally occur as groups of banks from shallow coastal areas near beaches to depths of several tens of meters [41,42,43]. The ridges display an asymmetry: the southern flanks (i.e. landward), are generally steeper than the northern (i.e., seaward), due to the net wave and current-induced transport. Sediment distribution is controlled by the bathymetry, with fine to coarse sand in the interbank channels, while the shallower sectors of the banks and upper shoreface generally consist of better sorted fine to medium sand [44,45].
Near Calais are both the Riden de Calais (Figure 1), a 11.5 km long, linear sandbank located at a distance of 3–5 km from the coast, with an orientation of 10° with respect to the coastline, and the Riden de la Rade (Figure 1), which is closer to the shore and extends over 13 km alongshore, almost parallel to the shoreline. These two banks have a shared origin at the western end, forming a V-shaped sediment body with an angle of 20°.
The Dyck bank is a 60 km long offshore sand bank, located 10 km off the coast and divided between the Occidental Dyck, the Central Dyck, and the Oriental Dyck. The Occidental and Central Dycks are almost parallel to the shoreline, with a height reaching 25 m above the surrounding sea floor and a crest lying at depths of about −10 m. The oldest hydrographic field sheets cover only the western part of the bank (i.e., the Occidental Dyck). Therefore, the results presented here have only been obtained for this part of this bank, and for the sake of clarity, the Occidental Dyck is simply called the Dyck bank in the paper.
Finally, from Gravelines to the Belgium border, the shoreface and nearshore zones are characterized by the presence of several sand banks that belong to the Dunkirk’s banks. These banks are 8 to 32 km long, 1.5 to 3 km wide, and up to 15–20 m high and their crest may be exposed at low spring tide (e.g., the Hills and Smal banks). In this paper, we will focus on four shallow sand banks: the Snouw, Braek, Smal, and Hills banks (Figure 1).

2.2. Tide

The tidal regime in this area is semi-diurnal and macrotidal, with a tidal range increasing from the north-east to the south-west (the mean spring tidal range is approximately 5.4 m at Dunkirk and 6.5 m at Calais [46]). Tidal currents are alternating in the coastal zone, flowing almost parallel to the shoreline and oriented toward the east-northeast during flood, and toward the west-southwest during ebb (Figure 2a,b). Due to a large tidal range, tidal currents are strong, reaching a maximum near-surface velocity of 1.5 m·s−1 during ebb and 1.8 m·s−1 during flood [47]. Current velocity generally diminishes eastward, due to the decreasing tidal amplitude in the same direction (Figure 2a,b). Flood current velocities exceed those of the ebb in various sectors of the coastal zone (Figure 2b), resulting in a flood-dominated asymmetry that is responsible for a net regional sediment transport to the east-northeast [48]. Locally, numerous sand banks can modify the bottom circulation and result in opposite transport directions on both sides of the banks (Figure 3) [11,42].

2.3. Waves

The offshore wave regime is dominated by waves from the southwest to the west, originating from the English Channel, followed by waves from the northwest to northeast, generated in the North Sea (Figure 2c) [49,50]. The modal offshore significant wave height is approximately 0.6 m, with wave periods typically ranging from 4 to 8 s, but the maximum wave height may episodically exceed 4 m, with periods of 9 to 10 s during major storms [51]. Wave heights are significantly lower at the coast, due to significant shoaling and energy dissipation over the shallow offshore sand banks, resulting in wave heights that hardly exceed 1 m in the intertidal zone, even during storms [52,53].

3. Methodology

The morphological evolution of the sand banks and the adjoining seafloor was studied using hydrographic field sheets from the Shom (French hydrographic service), spanning from the early 19th century to the beginning of the 21st century (Table 1). Most of the original hydrographic field sheets were printed paper documents, consequently, the first step was to make an inventory of those available and to digitize them, which was done with the ScanBathy software [54]. Then, a conversion into the present-day geodesic system was performed, with the positioning accuracy being controlled by using fixed landmark (e.g. lighthouse, church or tower). Bathymetric data consisted of depth soundings that were obtained along a series of transect, using a sounding line (SL).
Along the survey transects, the intervals between the depth soundings ranged from about 250 m for the oldest surveys (1836) to less than 50 m after 1894 (Table 1). The distance between the survey transects was around 500 m in 1836, between 250 and 130 m until the mid-20th century, and less than 100 m since 1950 (Table 1). Single channel echo-sounders (ES) were used in the second half of the 20th century, but more recently, bathymetric data has been obtained with multibeam echo-sounder systems (MES).
These changes in measuring techniques are not only responsible for the differences in the density of depth soundings (Table 1), but also in the measurement accuracy. In this work, we consider a maximum vertical error (MVE) based on the error range of the instrument (Zerr), the error due to the inaccuracy in ship positioning (XYerr) and the digitalization error (Digiterr). For example, for the 1879 survey’s, the ship positioning error (XYerr) is ±15 m and the ScanBathy software enables the digitization of depth soundings with a horizontal error of ±4 m (Digiterr). Considering a maximum seabed slope of 3%, the mean horizontal error (MHE) results in a vertical error of 0.9 m. Adding this value to the Zerr of 1 m (line sounding) results in a total vertical error for the 1879 survey of ±1.9 m (MVE).
An interpolation of the z-value was calculated to obtain a Digital Model Elevation (DEM) consisting of a grid of 50 m resolution (except for the 1861 surveys whose grid spacing of 200 m corresponded to the mean initial data sampling). The 1836 depth soundings were not interpolated, due to the low survey density, but they were used to extract the cross-shore and long-shore profiles.
The krigging method was used to perform the interpolation, because it was proven to be one of the most appropriate approaches for spatially heterogeneous data [55,56,57,58]. Variograms were calculated for each dataset, and they are used to make the interpolation. In addition, to check the reliability of the conversion and interpolation processes, comparisons of the water depths on different dates (1879, 1910–1911 and 1974–1976 surveys) over rocky areas—considered as stable over time—were carefully examined (Figure 4 right). Results obtained on submarine rocky outcrops located in the westernmost part of the study area (Figure 4 left) indicated a maximal vertical range of 1.6 m for the coastward outcrop and of 1.1 m for the seaward one, which validates the computed error margins of the earlier surveys.
The shoreface evolution was analyzed through the generation of differential bathymetric maps (changes in water depth between two successive surveys). Individuals errors can be propagated into the differential bathymetric maps, using the method developed by Brasington et al. [59,60] (Equation (1)):
δ d i f f = ( M V E 1 ) 2 + ( M V E 2 ) 2
where δdiff is the propagated error in the differential bathymetric map, and MVE1 and MVE2 are the individual errors in the DEM, as calculated in Table 1. Depending on the dates of the water depth measurements, δdiff ranges from 0.7 m to 2.7 m. For each of the differential maps, only the bed level changes higher than δdiff are supposed to be significant, and these were used for the calculation of changes in water depths and associated volume changes due to erosion or sediment accumulation. It must be noted, however, that additional vertical errors may be induced by the presence of migrating sand waves on the sand banks, which can be responsible for some random elevation variations. Nevertheless, the influence of the apparent water depth variations caused by these migrating sediment bodies on computed sediment volume changes was probably moderate, due to the relatively small dimensions of these bedforms (less than 1 m high and 200 m long), compared to those of the sand banks (generally 10–20 m high and 5–10 km long).
Cross-shore and longshore bathymetric profiles (corresponding the sounding lines of the oldest surveys) were selected for identifying areas that were submitted for either erosion or accretion, and for analyzing shoreface evolution, particularly sand bank migration. The lateral extent of the longshore transects along the sand banks were variable, depending on the sand bank length at the time of the survey. Cross-shore profiles extended from the coast (i.e., from the shoreward-most sounding point) to the channel located seaward of the bank (except for the Dyck bank, located further offshore, which is flanked by two interbank channels). In order to examine in detail the morphological evolution of these sediment bodies, the height and width of the sand banks was calculated from each of the cross-shore profiles. The shoreward or seaward movement of the bank crests, and the changes in bank width were also calculated on each bathymetric profile. In addition, variations in sediment volumes between each survey were computed in the four studied areas from the differential bathymetric maps, using the same spatial extent. Volume changes were then compared to sand bank migration, to determine the gain or loss of sediments.

4. Results

4.1. Regional Evolution

Bathymetric difference maps show a significant variability of seabed through the years. Based on the oldest and most recent bathymetric data available, three sectors are characterized by a strong evolution, where different patterns could be observed (Figure 5):
  • The Calais nearshore area, where the Riden de la Rade is characterized by a net seabed accretion, which is associated with an erosion of the channel located between the bank and the beach.
  • The offshore area between Calais and Gravelines, where the Dyck bank experienced a lowering of its seaward side, whereas the landward side of the bank recorded a vertical accretion of 20 m during this period, due to a shift in position.
  • The coastal zone around Dunkirk shows spatially variable morphological evolutions. Locally, a vertical accretion of more than 20 m was measured, accompanied by a lowering of the sea bed of 20 m in other areas.
A detailed description of the morphological evolution of these three areas is given thereafter by analyzing the bathymetric maps and profiles, to quantify the evolution of the sand banks and the adjoining seafloor. To complete these observations, volume changes and morphometric evolution of the sand banks were computed, in order to gain insights into the morphodynamic of these prominent sediment bodies.

4.2. Offshore Area: The Dyck Bank

The Dyck bank (Figure 1) is the most offshore sand bank analyzed in this paper. A seabed lowering near a sand bank may not necessarily be due to sea floor erosion, but it may indicate the incidence of bathymetry changes, caused by sand bank mobility. The differential bathymetric map (Figure 5) reveals a linear lowering of the seafloor of more than 10 m, even exceeding 15 m locally, on the seaward side of the Dyck bank. Conversely, sediment accumulation by up to more than 10 m was observed on the shore-facing side of the bank, which can be explained by an onshore movement of the sand bank since 1861.
Cross-shore profiles (Figure 6) show that the western and eastern parts of the Dyck migrated over 500 m landward from 1861 to the 1990s, (profiles D, F, G). Contrariwise, the central part (profile E) remained relatively stable, with no significant sand bank movement. Most of the Dyck bank displayed an asymmetry in cross-sectional morphology, with the steeper side of the bank being located on its landward side, except in the central part (cf., profile E), where the sand bank is symmetrical.

4.3. Dunkirk

Analyses of nearshore sand bank evolution in front of the Dunkirk harbor (Figure 1) indicate that these banks were affected by a long-shore, as well as a cross-shore displacement for almost two centuries.
During the 19th century, the Hills bank was characterized by a progressive lengthening of its bank, particularly towards the southwest (Figure 7, Profile O). The Hills bank, initially 4 km long, had almost doubled in length and reached 7 km long by 1962. During the 20th century, the sand bank started to migrate about 700 m to the northeast. This longshore displacement is associated with a progressive onshore movement of 400 m (Profiles M, N), with migration rates of up to 5.5 m·yr−1 during the 1894–1962 time period. The last bathymetric survey in this area was carried out in 2006, and covered the eastern part of the Hills bank. These measurements (profile N) show that the eastern part of the bank continued to migrate onshore and towards the northeast over the last few decades.
Nowadays, the Hills bank is connected to the Smal bank at its western end, which was initially not the case (Figure 1 and Figure 7). The differential map of bathymetry changes between 1836 and 1962 (Figure 5) shows an eastward displacement of the Smal bank. On the shoreward side of the bank, sediment accumulation of up to more than 20 m thick occurred, which resulted in a 2 km shoreward migration of the bank (profile L). This onshore movement was accompanied by a transformation of the Smal bank morphology (Figure 7a–c) through time. Mapping of the seabed morphology changes revealed that a segment of an offshore sand bank, the Breedt bank, detached from the initial bank, moved onshore, and merged with the historic Smal bank (Figure 7a–c). Nowadays, the Smal bank is higher, wider, and closer to the shoreline, compared to its former configuration in the 19th century (profile L).
The Braek and the Snouw banks were the westernmost banks of the Dunkirk banks, and they are separated from the shoreline by a navigation channel. As with other sand banks off Dunkirk, the Braek and the Snouw underwent progressive longshore migration. Since 1836, the eastern part of the Braek bank moved more than 1.5 km to the northeast (Figure 8, profile P). For the Snouw bank (Figure 8, profile Q), the main displacement occurred during the 19th century, with a northeast migration of 1 km; during the 20th century, the position of the bank remained relatively stable, but the latest survey (dating from 2000) shows a substantial lowering of the bank crest. Cross-shore profiles revealed more complex morphological changes.
The eastern part of the Braek moved progressively offshore (Figure 8, Profile K). During the same period, a widening of the eastern and central parts of the bank occurred, which particularly affected the seaward-facing flank of the bank (Profile K). The evolution of the western part of the Break was characterized by onshore displacement accompanied by a lowering and a decrease in size of its crest (Figure 8, Profile J).
The eastern part of the Snouw bank is separated from the Braek bank by a channel, and it is the most offshore sand bank visible in the Profile J. The eastern Snouw bank exhibits alternating onshore and offshore movements, depending on the period considered (Figure 8, Profile J). The central and western segments of the Snouw bank (Figure 8, profile H, I) showed only minor movements in comparison with the other banks, but different patterns can be identified. The crest of the bank was closer to the shoreline, and it remained stable during the oldest survey period (1836–1861), then seaward migration occurred until 1879 (Figure 8, Profile H, I) and from the end of the 19th century onward, the Snouw bank experienced a 200 m onshore migration.
Sand bank migration resulted in some areas in a landward/seaward displacement of channels depending on the sand bank evolution trend. The seaward displacement of the Braek bank, for example, induced an offshore migration of the channel between the Braek and the Smal banks (Figure 8, Profile K); conversely, the Hills bank movement resulted in an onshore movement of the coastal channel and a seabed lowering of the foreshore landward of the bank (Figure 7, Profile M, N).

4.4. Calais

The seabed morphology seaward of Calais harbor changed considerably during the study period, which was largely due to significant variations in the morphology and position of nearshore sand banks such as the Riden de la Rade (Figure 9). Since 1861, an elongation of this sediment body was clearly visible on bathymetric maps (Figure 9a–c). A longshore growth to the east-northeast and to the west-southwest was responsible for a growth of an 8 km-long bank to a 15 km-long sediment body (Figure 9, Profile R). The lengthening of the bank was accompanied by an elevation of the crest (Figure 5) with a vertical sediment gain of 7 to 9 m. The analysis of cross-shore profiles confirms this vertical accretion and reveals an increase in the width of the Riden de la Rade (Figure 9, Profiles A, B and C). Profile C highlights also a coastward migration of 1 km of the bank from the time of the first hydrographic charts in 1861.
Three main steps of evolution of the Riden de la Rade are clearly discernible:
  • From 1861–1911, the period of the oldest bathymetric surveys, the Riden de la Rade was hardly visible (Figure 9a); it started to develop significantly at the end of the 19th century as revealed by cross-shore profiles (Profiles A, B and C) that clearly shows an increase of both width and height throughout this time period.
  • During the 1911–1983 period, the Riden de la Rade gradually migrated onshore, with a maximum displacement of up to 800 m. A maximum degree of movement took place in the central part of the Riden de la Rade (Profile B), which resulted in a curved morphology of the sand bank at the end of the 1970s (Figure 9c). In the western part of the Calais harbor, the foreshore was affected by a strong lowering of the seabed (Figure 5). This can be attributed to the shoreward movement of the bank that was responsible for the onshore displacement of the channel between the coast and the bank (Profile B). Based on the position of the lowest low-water spring level, it can be estimated that the channel migration led to a shoreface retreat of 200 m. The easternmost part of the bank experienced a vertical growth, and continued its landward migration (Profile C).
  • Between 1983 and 2009, the distal parts of the Riden de la Rade continued to migrate onshore. The westernmost part moved about 400 m shoreward and underwent a reduction of its width (Profile A). The easternmost part of the bank progressively merged to the shore, creating a wide and gently sloping foreshore that gradually widened to about 500 m during the 20th century (Profile C). In contrast, central segments of the Riden de la Rade revealed a 500 m seaward movement (Profile B), resulting in a general linearization of the sand bank from the start of the 1980s.
Comparatively, the evolution of the Riden de Calais was more moderate (Figure 9). Nevertheless, an elongation of the bank of more than 1 km towards the northeast, accompanied by a 400 m width-reduction of the bank, was measured during a period of about 150 years (Profiles B and C). The differential map (Figure 5) shows that the vertical changes in the interbank area were less than 2.4 m, which is within the vertical margin of error, and for this reason, was considered to be relatively stable over the study period.

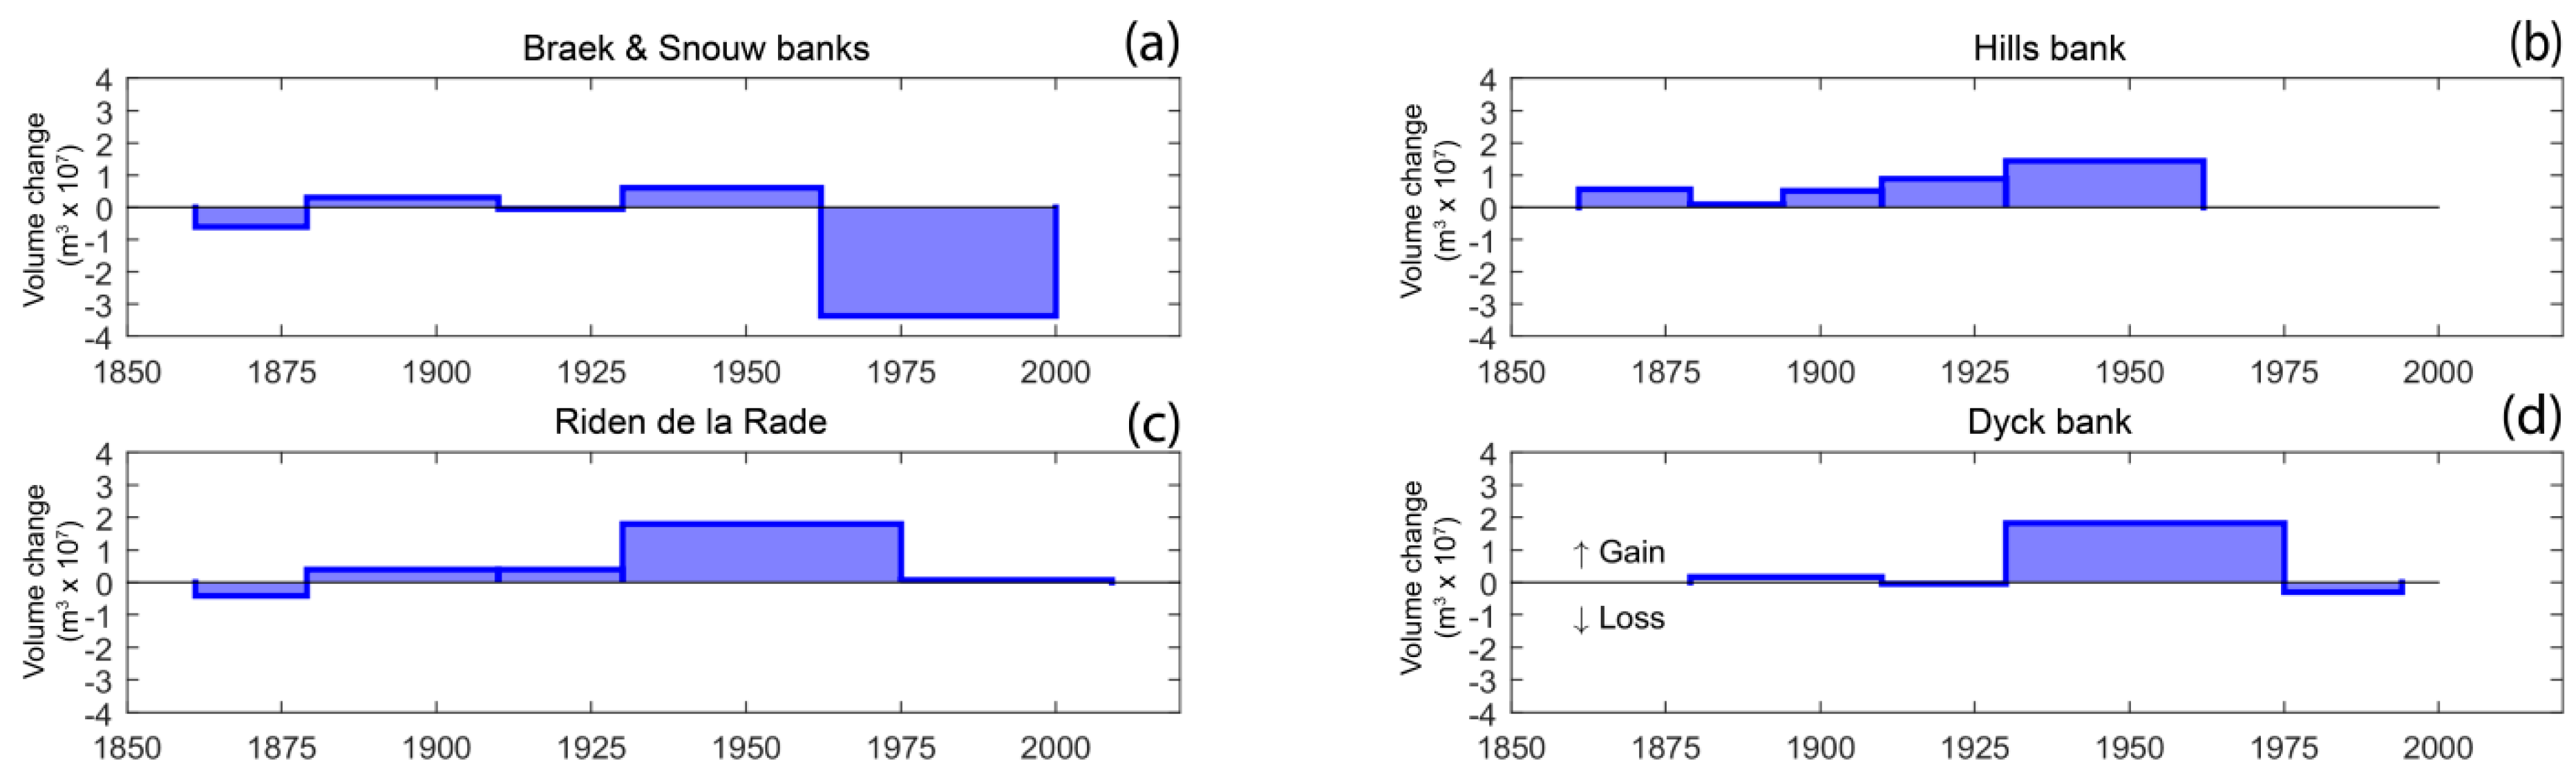
4.5. Morphometric and Volume Change

The first part of this work allowed us to examine the morphological evolution of the coastal zone of Northern France, which was strongly controlled by sand banks that migrated in cross-shore, as well as in longshore directions. To complete these observations, the volume change calculations of each sand bank were carried out, to assess the patterns of sand bank morphodynamic. Heights and widths of sand banks at different dates were also computed as indicators of morphometric changes.
Volume change of the Hills, Braek and Snouw, Dyck banks, and of the Riden de la Rade, were computed between successive surveys (Figure 10). As previously explained, the Riden de la Rade experienced growth during the 20th century. Volume change computations show that the bank underwent sediment accumulation since the end of the 19th century, and maximum accumulation was recorded between 1930 and 1975, with a gain of +1.79 × 10⁷ m3 (Figure 10c). The Hills bank also showed an overall positive volume change since the 19th century, with a minimum accumulation of 8.37 × 10⁵ m3 between 1879 and 1894, and an increase in sediment volume reaching +1.45 × 10⁷ m3 between 1930 and 1962 (Figure 10b). These results clearly show that the Riden de la Rade and the Hills banks acted as sediment sinks during the 20th century.
The evolution of the Braek, Snouw, and Dyck banks was more complex. The volume changes of the Braek and Snouw banks were computed together, due to their proximity, and the possible interactions between them both. These two sand banks underwent sediment accumulation during the 1879–1910 and 1930–1962 time periods, which did not exceed +0.59 × 10⁷ m3 (Figure 10a). In total, the sediment budget was negative, with a massive amount sediment loss between 1962 and 2000, of approximately −3.36 × 10⁷ m3 (Figure 10a). The Dyck bank also shows a contrasted evolution, alternating between positive and negative sediment volume variations over the study period, with only one significant accumulation phase between 1930 and 1975, with a gain of +1.82 × 10⁷ m3 (Figure 10d).
Analyses of volume change highlighted that the Hills and the Riden de la Rade sand banks had a positive sediment budget from the late 19th century, whereas the Braek, the Snouw, and the Dyck banks are characterized by a more complex degree of evolution, with alternating periods of accretion and erosion. In order to investigate possible relationships between the volume change and the morphometric sand bank evolution, and the height/width ratios of sand banks were computed and compared with bank volume changes. Figure 11 presents the variations in height/width ratio for each transect of the Dyck bank and the Riden de la Rade, and their volume changes over time.
For these two sand banks, when the height/width ratio increases at one transect, it generally increases at the others (Figure 11a,b), pointing out that the morphological evolution of these sediment bodies was uniform at the sand bank spatial scale. For the Riden de la Rade, the height/width ratios increased from 1910 onward, and nearly doubled at the end of the 20th century, which was consistent with the vertical growth of the bank and the overall positive sediment budget observed during the 20th century (Figure 11d). More recently, height/width ratios tended to decrease, due to a widening of the bank atits central and eastern parts (Figure 9e,f). However, in the case of the Dyck bank, height/width ratios, remained relatively stable over time, except for 1974, when the ratio values decreased (Figure 11a) after a period of important sediment accumulation (Figure 11c), revealing that the bank developed and mostly gained sediment through lateral growth, rather than vertical accretion. These two examples highlight that modes of sand bank growth could radically, differ depending on bank morphology and distance from the coast.
Height/width ratio is a good indicator of sand bank morphometric evolution, but in order to investigate how these parameters are related with each other, measurements were taken of samples of cross-bank transects for every year available (Figure 12a). Figure 12a shows that for these nearshore sand banks, there was a fairly good relationship between bank width and bank height, with the bank crest tending to increase with the bank width, but mostly for sand banks (or sand bank sections) with widths <2 km. For banks wider than about 2 km, the increase in bank height with width was no longer observed, with the maximum bank heights hardly exceeding 15 m, regardless of the bank width.
Figure 12b,c show the change in time of both the heights and the widths of the Braek and the Snouw sand banks. The relationship between bank width and height is statistically significant for both banks, but especially for the Break bank (R2 = 0.91). The Break bank evolution also highlights that both the height and the width increased with time. This is consistent with our previous observations based on cross-shore profiles, which showed the lateral and vertical development of this bank occurred since the early 19th century (Figure 8, Profile K). For the Snouw bank, the temporal evolution was more complex, with an increase of both the height and width at its easternmost part, but a decrease in its width at its westernmost part, while its height remained relatively stable. This may be related to the longshore migration of this bank towards the northeast.
Having noted that bank width and height generally show a good correlation between each other, we attempted to evaluate the possible changes in bank morphology with bank migration. To do so, the annual rate of change in the width of several sand banks (∆ width/year) was plotted against the rate of change of the bank crest position (∆ crest/year), as measured on individual transects. Figure 13b displays the results obtained for the three nearshore banks (Riden de la Rade, Hills and Smal banks), and Figure 13a for a sand bank located further offshore (Dyck bank). The Braek and Snouw banks were not considered in this analysis, due to their minor cross-shore movements in comparison to the other banks.
The outer points in Figure 13b concern the Riden de la Rade and are the result of the recent formation of this bank, which has experienced the greatest morphological evolution. Results obtained for this shallow bank near Calais clearly show that the landward migration of the bank is predominantly associated with an increase in bank width and that the opposite occurs (decrease in width) when a seaward displacement is observed. Although the rates of crest movement were more limited for the Hills and Smal banks, a similar relationship was visible between the bank crest displacement and the changes in bank width. In the case of the Dyck bank, the crest of the bank mainly moved shoreward, but the width of the bank either increased or decreased independently of the direction of crest movement (Figure 13a). When considering only the three nearshore banks, the rate of bank crest displacement showed a very strong correlation with the variation in bank width (a linear regression coefficient of determination R2 of 0.95, statistically significant to the 2σ confidence level, i.e., 95%), with an onshore movement being generally accompanied by a widening of the bank, and a seaward displacement being mostly characterized by a decrease in bank width (Figure 13b). According to these results, coastal sand banks seem to have a similar behavior, tending to grow laterally when migrating onshore, whereas their width generally decrease when a seaward shift in position occurs. Based on the observed evolution of the Dyck bank, banks that are located further offshore display more variable morphological responses to hydrodynamic forcings.

5. Discussion

The digitization of almost two centuries of historic hydrographic field sheets has allowed us to reconstruct the seabed evolution of Northern France’s coastal. The complexity of this coastal zone is the result of the presence of many sand banks and their response to the action of currents and waves. In addition, this complexity arises from the interaction between individual sand banks via morphodynamic processes induced by morphological changes. Several previous studies focusing on the evolution of the Flemish sand banks in the North Sea have noted that the sand bank configurations recorded on hydrographic charts issued after 1800 differed only slightly from their present-day shape [1,61,62]. From these observations, it was generally concluded that the Flemish banks underwent only minor changes during the last centuries. In the present study, a reconstructed historical dataset spanning almost two centuries over an extensive area (370 km2) was carried out. This data enabled us to confirm that the general orientation and morphology of these sand banks effectively remained relatively constant at a regional scale, however, some distinctive changes were observed. The construction of DEMs from the historical hydrographic charts revealed sand bank mobilities that resulted in longshore and cross-shore migrations which exceeded 1 km in some areas. Our results also suggest that sand bank evolution (i.e., changes in morphology, volume, and location) appears to be related to the position and distance (or water depth) of the sand banks relative to the coastline. Changes in sand bank shape and volume can be related to their height/width ratio (Figure 11). The Dyck bank, located 10 km from the shoreline, experienced some changes in width variation during its progressive onshore migration (Figure 5 and Figure 13). However, over almost two centuries, the height/width ratios of the Dyck bank remained relatively constant (Figure 11), indicating a state of morphodynamic equilibrium. This sand bank was characterized by small changes in volume over most time periods, except during substantial sediment accumulation between 1933 to 1975 (Figure 10) that resulted in a change of the shape of the bank, essentially in its width rather than its height (Figure 6). Conversely, in the shallower water depths of the coastal zone, significant vertical accretion of the sand banks was commonly observed, e.g., Hills Bank (Figure 7) and Riden de la Rade (Figure 9), resulting in an increase in the height/width ratios (Figure 11).
Based on the sand bank morphological evolution, variations in the morphometric parameters (height and width, and height/width ratios) were calculated. Interdependence of morphological parameters, such as height or wavelength, have already been studied for sand waves and sand dunes, for which some relationships with water depth or flow velocity, for example, were found [28,63,64,65]. However, only a few studies of those types have been conducted on larger marine sand bodies [66]. The results presented in Figure 12 suggest the existence of a relationship between the heights and widths of sand banks, up to little less than 2 km wide (Figure 12a). This implies that sand banks grow laterally and vertically until they reach a width at which they can only increase in breadth but not in height anymore. Because wave-induced shear stress at the bank’s bottom increases with decreasing water depth, wave action may limit crest elevation during the vertical growth of the bank, which eventually allows the sandbank to develop only laterally in shallow waters.
Some relationship between the changes in the bank width and the bank crest displacement can also be observed (Figure 13), suggesting an interdependence of these two parameters. Although both the seaward and shoreward movement of the bank crest position were documented, the studied sand banks were mainly characterized by an onshore migration, especially in shallow waters. Our measurements also revealed that the landward displacement of the banks tend to be accompanied by an increase in bank width (Figure 13). The calculations of sand banks volume changes confirm this evolution trend, and provide useful information regarding the morphodynamic behavior of these sediment bodies. Most banks were characterized by a positive sediment budget since the end of the 19th century (Figure 10), showing they acted as sediment sinks during the 20th century. On the contrary, the Braek and Snouw banks lost a substantial volume of sediment (>4.5 × 10⁷ m3) during the second half of the 20th century. This loss coincides with large-scale harbor development, particularly the construction of the Dunkirk outer harbor facing the Braek and the Snouw banks. From 1949 to 2000, 10 km2 of land was reclaimed from the sea [67], in addition to regular channel maintenance dredging being carried out, which would presumably have significant impacts on the coastal hydrodynamics and sediment dynamics.
For almost two centuries, most sand banks of the southwestern North Sea showed that they had been affected by longshore migration, the magnitude of sand bank displacement being variable from one bank to another, and for different periods. This longshore migration is in accordance with the results of sediment transport studies carried out in the region, showing that sediment transport is dominated by shore-parallel tidal flows [14,42,68]. Most of the area is dominated by a flood current asymmetry, resulting in residual tidal current direction and sediment transport towards the northeast [48] (Figure 3). In the Dunkirk nearshore zone, the four studied sand banks present a trend of general northeasterly migration. Over nearly two centuries, some of them reached a maximum displacement of more than 1.5 km, corresponding to an average migration rate of 8.8 m·year−1. Over the shoreface, northeasterly tidal currents and dominant waves from west to southwest induce northeasterly-directed sediment transport and favor longshore over cross-shore sediment transport [69]. Ebb currents can be locally dominant, both in terms of speed and duration (Figure 3), and sediment fluxes may consequently be dominated by southwesterly flowing currents and net sediment transport in the same direction. This is notably the case seaward of Calais [48], where the occurrence of westerly to southwesterly and easterly to northeasterly sediment transport may explain the variable patterns of the longshore evolution of the V-shaped sand banks, and the localized erosion of the seaward flank of the Riden de Calais (Figure 5).
The other main trend sand bank movement is a cross-shore migration. As previously mentioned, a general trend of coastward migration was generally observed for the nearshore sand banks, although a trend of seaward movement was also documented during certain periods, especially in the case of the Braek bank (Figure 8). To understand the formation and the evolution of the nearshore sand banks off the coast of northern France, high-resolution seismic reflection surveys were carried out over the Snouw and Braek banks near Dunkirk [49,70] and over the Riden de la Rade seaward of the Calais harbor [71]. The Snouw and the Riden de la Rade present upper reflectors dipping coastward; conversely, the Braek bank reflectors dip seaward. For the Braek and the Riden de la Rade, their internal structures are consistent with their overall movements that have been observed since the end of the 19th century. The cross-shore movements of the Snouw bank were smaller than those for the ones documented for the two other banks, mainly oscillating in position during the 19th century and migrating slightly onshore in the 20th century, but there again, the upper reflectors in the seismic records were consistent with the recorded bank displacements. Therefore, the reconstruction of bank evolution based on historical bathymetry surveys, and the analyses of the internal structure of the banks, using seismic reflection data, both allowing for the conclusion of the landward (or seaward) migration of these banks results from a progressive accretion of sediment on the landward (or seaward) flank of the bank.
One of the mechanisms responsible for sand bank-landward migration is storm waves. In the region, storm waves mainly come from the southwest, originating from the English Channel, or from the north-northeast associated with strong winds blowing over the North Sea [21,51]. In the nearshore zone, however, storm wave directions become more normal to the coast [52], and therefore, more perpendicular to shore-parallel sand banks. Storm-induced onshore transport has been observed and described in detail by Vincent et al. [72], and previously invoked to explain the landward migration of some shoreface banks and shoals by sand overwashing [73,74]. In this way, the widening of some sand banks during landward migration, as shown in Figure 13, could be explained by sand overwashing affecting the crest of the bank, resulting in a progradation of the sand bank towards the coast. Moreover, distinct periods of higher storminess (1956–1962 and 1972–1977) were observed during the second half of the 20th century [21,75], coinciding with large harbor development and coastal planning. This could presumably accentuate the remobilization of sediment and leading to the general landward migration of nearshore sand banks. In addition, numerical modelling suggests the idea that wave activity superimposed on the action of tidal currents might lead to a variation in residual transport direction, and to an inversion of the erosion–deposition pattern on the sand banks [76]. For the Braek bank seaward migration, one hypothesis is that the Smal bank acts as a breakwater: waves first break on it and dissipate much of their energy before arriving at the eastern part of the Braek bank [70]. The widening of the Smal bank over two centuries may have accentuated this effect, and it could explain why the Braek bank, which is mostly influenced by tidal currents, migrated offshore. In this way, seaward migration and the reduction of sand bank width, seen in Figure 13, may be related to the combined action of waves and tidal currents. The possible inversion of the sediment transport direction may lead to progradation in the seaward direction, and the dominance of tidal currents could probably increase erosion on one side of the bank, resulting in a decrease of the width.
Overall, sand bank movements, in particular, onshore and offshore migration, have an influence on both the shoreface, and the shoreline. A general landward shoreline displacement is observed in the westernmost part of Calais, whereas the easternmost segment experiences a strong seaward displacement [36]. The growth and displacement of the Riden de la Rade resulted in a coastward shift of the navigation channel at the west of Calais; leading to a lowering of the shoreface in this area. The water depth in this deeper channel reaches −15 m below Chart Datum, and it could act as a conduit for sediment transported alongshore between the bank and the shoreline by tidal currents. The easternmost part of the Riden de le Rade, welded to the shore, may act as a sediment sink, and as a source from which sediment can be subsequently supplied to the coast [36,77]. In front of the Dunkirk harbor, the onshore movements of the Hills and the Snouw banks could lead to the attachment of some parts of the banks to the adjacent foreshore. The risk of the filling-in the navigation channel may therefore result in an increase of dredging operations. This may result in an unbalanced beach sediment budget that could accentuate coastal erosion in some areas [78].
As shown in previous studies, the initial bank construction is related to transgressive stages of the Holocene sea-level rise [9,79,80,81]. However, this study suggests that these nearshore banks are very recent sedimentary features. As mentioned earlier, the Riden de la Rade developed no more than 150 years ago. In the Dunkirk area, the merging of a shoreface bank to the foreshore during the 17th century has been investigated by Corbau et al. [82]. This suggests that the Dunkirk shoreface may have been affected by considerable morphological variations in recent historical times; over the last two centuries, the Breedt-Smal-Hills banks system evolved conjointly by sediment transfer that resulted in significant morphological changes. The impact of sea-level rise on the recent migration of these sand banks was believed to be minor, because a sea-level rise in the region was estimated to less than 20 cm since the second half of the 20th century [83].
Tidal sand banks occur in a wide range of water depths all around the North Sea (Figure 1, inset). The UK and Belgian coastal zones have been intensively studied by using historical bathymetric charts. These investigations have revealed that off the Belgian coast, offshore sand banks such as the Hinder banks (Figure 1 inset) experienced only relatively small displacements [84], which was confirmed by recent detailed multi-beam imagery [10]. Closer to the shore, the Middelkerke bank and the Kwinte bank (Flemish Banks—Figure 1 inset) have also remained relatively stable over the last decades [85,86,87], suggesting a long-term dynamic equilibrium. Van Lancker et al. [87] also showed that the Belgian coastal sand banks have only been affected by minor landward movements during the last 150 years. But these authors did not consider this landward migration as being significant, due to uncertainties in both position and water depth. On the contrary, the landward migration of nearshore sand banks was particularly common along the North Sea coast of France, where onshore movements are generally significant. Historical bathymetric maps have also been used to analyze the evolution and dynamics of the Norfolk banks, off the East Anglian coast (Figure 1, inset), and revealed major displacements parallel to the coastline [37]. Using a hydrodynamic model and bathymetric charts from 1848 to 2000, Horrillo-Caraballo and Reeve [16] concluded that the observed changes in the morphology of the Norfolk sand bank were strongly linked to the pattern of tidal residual currents.
Seabed evolution is in interaction with hydrodynamic processes, especially through the action of tidal currents and wave-induced currents. Sediment transport results from the combination of both tidal and wave forcing, but our explanations of the observed morphological changes are based on present-day hydrodynamics whereas tidal circulation and wave propagation 200 years ago may have been significantly different than today. In this study, we reconstructed a historic bathymetric map with a large degree of spatial cover, that allowed us to relate large-scale morphological changes. However, there is a need to model tidal currents and wave propagation, based on these reconstructed historical bathymetric maps, in order to compare the hydrodynamics of several different periods with each other. A better insight into the possible changes in the strengths and directions of tidal currents, and in wave propagation, including variations in wave energy, could confirm our hypotheses concerning sand bank morphodynamics, and should lead to a better understanding of the long-term mechanisms that are responsible for coastal zone evolution.

6. Conclusions

This paper presents a large-scale evolution of nearshore and offshore sand bodies located in the macrotidal environment of the southern bight of the North Sea. The study is based on almost two centuries of historical hydrographic field sheets. Our results revealed significant changes in nearshore and offshore morphologies. These bathymetry changes were largely caused by alongshore and cross-shore migration of tidal sand banks. These new data enable relations between morphometric evolution and volume changes to be identified, showing that sand bank behaviors and sediment accumulation are different, depending on their position respective to the shoreline. In the coastal zone, morphometric analyses show interdependence between the heights and widths of sand banks, with relatively small variations in the height/width ratios observed for sand banks up to approximately 2 km wide. For larger sand banks, such a relationship between the crest height and the bank width are no longer observed, as there is no further increase in the bank height with increasing bank width, suggesting that the sand bank can grow vertically up to a size at which they can only develop laterally. This may be due to wave action that may limit the vertical growth of banks in the shallow water depths of the nearshore zone. Our results also highlighted that variations in sand bank width are related to the changes in bank crest position, showing a widening of banks in the case of shoreward migration, and conversely a narrowing in the case of seaward migration.
Bank evolution is controlled both by tidal currents that induce their elongation, and that ensure the maintenance of bank shore-parallel morphologies, and by storm waves that force some part of the banks to migrate landward. However, sand banks may locally experience a seaward migration. It is speculated that wave activity, together with tidal asymmetry, could play an important role in changing the direction of residual sand transport, resulting in an inversion of the erosion–deposition pattern in these areas. A simulation of tidal currents combined with wave-propagation on historical bathymetries could allow us to verify our hypotheses about the secular evolution of these coastal sediment features.

Author Contributions

Conceptualization, A.L., A.H., N.P. and N.W.; Data curation, A.L. and J.-B.R.-C.; Investigation, A.L. and J.-B.R.-C.; Methodology, A.L. and A.H.; Resources, A.L. and J.-B.R.-C.; Software, A.L.; Validation, N.P. and N.W.; Writing—original draft, A.L.; Writing—review & editing, A.H.

Funding

This PhD project was funded by the Université du Littoral Côte d’Opale (ULCO) through a fellowship to A. Latapy. Hydrographic field sheets are stored at Shom’s archives and used in this study, thanks to the hosting agreement Shom—ULCO (n° 133/2016).

Acknowledgments

A part of the digitization and interpolation phase was made by Jean-Baptiste Robin-Chanteloup during his 6-month internship in Shom. The authors thank Thierry Gendrier and Matthieu Bastien for their invaluable assistance in the researching of hydrographic archives and their interpretations, Jonathan Genevier for help with the ScanBathy software, and Yann Ferret for proofreading. We gratefully acknowledge the constructive comments provided by two anonymous reviewers who helped to improve the quality of the manuscript. Thanks are also due to Denis Marin, for his help in the preparation of the figures.

Conflicts of Interest

The authors declare no conflict of interest.

References

  1. Houbolt, J.J.H.C. Recent sediments in the Southern Bight of the North Sea. Geol. Mijnb. 1968, 47, 245–273. [Google Scholar]
  2. Swift, D.J.P. Tidal sand ridges and shoal-retreat massifs. Mar. Geol. 1975, 18, 105–133. [Google Scholar] [CrossRef]
  3. de Swart, H.E.; Yuan, B. Dynamics of offshore tidal sand ridges, a review. Environ. Fluid Mech. 2018, 1–25. [Google Scholar] [CrossRef]
  4. Huthnance, J.M. On one mechanism forming linear sand banks. Estuar. Coast. Shelf Sci. 1982, 14, 79–99. [Google Scholar] [CrossRef]
  5. Pattiaratchi, C.; Collins, M. Mechanisms for linear sandbank formation and maintenance in relation to dynamical oceanographic observations. Prog. Oceanogr. 1987, 19, 117–176. [Google Scholar] [CrossRef]
  6. Calvete, D.; Walgreen, M.; de Swart, H.E.; Falqués, A. A model for sand ridges on the shelf: Effect of tidal and steady currents. J. Geophys. Res. Oceans 2001, 106, 9311–9325. [Google Scholar] [CrossRef] [Green Version]
  7. Schwab, W.C.; Baldwin, W.E.; Denny, J.F.; Hapke, C.J.; Gayes, P.T.; List, J.H.; Warner, J.C. Modification of the Quaternary stratigraphic framework of the inner-continental shelf by Holocene marine transgression: An example offshore of Fire Island, New York. Mar. Geol. 2014, 355, 346–360. [Google Scholar] [CrossRef] [Green Version]
  8. van der Veen, H.H.; Hulscher, S.M.J.H. Predicting the occurrence of sand banks in the North Sea. Ocean Dyn. 2009, 59, 689–696. [Google Scholar] [CrossRef] [Green Version]
  9. Dyer, K.R.; Huntley, D.A. The origin, classification and modelling of sand banks and ridges. Cont. Shelf Res. 1999, 19, 1285–1330. [Google Scholar] [CrossRef]
  10. Deleu, S.; Van Lancker, V.; Van den Eynde, D.; Moerkerke, G. Morphodynamic evolution of the kink of an offshore tidal sandbank: The Westhinder Bank (Southern North Sea). Cont. Shelf Res. 2004, 24, 1587–1610. [Google Scholar] [CrossRef]
  11. Off, T. Rhythmic Linear Sand Bodies Caused by Tidal Currents. AAPG Bull. 1963, 47, 324–341. [Google Scholar]
  12. Caston, V.N.D. Linaer sand banks in the Southern North Sea. Sedimentology 1972, 18, 63–78. [Google Scholar] [CrossRef]
  13. van de Meene, J.W.H.; van Rijn, L.C. The shoreface-connected ridges along the central Dutch coast—Part 1: Field observations. Cont. Shelf Res. 2000, 20, 2295–2323. [Google Scholar] [CrossRef]
  14. Kenyon, N.H.; Belderson, R.H.; Stride, A.H.; Johnson, M.A. Offshore Tidal Sand-Banks as Indicators of Net Sand Transport and as Potential Deposits. In Holocene Marine Sedimentation in the North Sea Basin; Wiley-Blackwell: Hoboken, NJ, USA, 2009; pp. 257–268. ISBN 978-1-4443-0375-9. [Google Scholar]
  15. Bastos, A.C.; Paphitis, D.; Collins, M.B. Short-term dynamics and maintenance processes of headland-associated sandbanks: Shambles Bank, English Channel, UK. Estuar. Coast. Shelf Sci. 2004, 59, 33–47. [Google Scholar] [CrossRef]
  16. Horrillo-Caraballo, J.M.; Reeve, D.E. Morphodynamic behaviour of a nearshore sandbank system: The Great Yarmouth Sandbanks, U.K. Mar. Geol. 2008, 254, 91–106. [Google Scholar] [CrossRef]
  17. Collins, M.B.; Shimwell, S.J.; Gao, S.; Powell, H.; Hewitson, C.; Taylor, J.A. Water and sediment movement in the vicinity of linear sandbanks: The Norfolk Banks, southern North Sea. Mar. Geol. 1995, 123, 125–142. [Google Scholar] [CrossRef]
  18. Van Lancker, V.; Bonne, W.; Velegrakis, A.F.; Collins, M.B. Aggregate extraction from tidal sandbanks: Is dredging with nature an option? Introduction. J. Coast. Res. 2010, 51, 53–61. [Google Scholar]
  19. Velegrakis, A.F.; Ballay, A.; Poulos, S.; Radzevicius, R.; Bellec, V.; Manso, F. European marine aggregates resources: Origins, usage, prospecting and dredging techniques. J. Coast. Res. 2010, 51, 1–15. [Google Scholar]
  20. Bonne, W.M.I. European Marine Sand and Gravel Resources: Evaluation and Environmental Impacts of Extraction—An Introduction. J. Coast. Res. 2010, i–vi. [Google Scholar] [CrossRef]
  21. Chaverot, S.; Héquette, A.; Cohen, O. Changes in storminess and shoreline evolution along the northern coast of france during the second half of the 20 century. Z. Geomorphol. Suppl. Issues 2008, 52, 1–20. [Google Scholar] [CrossRef]
  22. Keijsers, J.G.S.; Poortinga, A.; Riksen, M.J.P.M.; Maroulis, J. Spatio-Temporal Variability in Accretion and Erosion of Coastal Foredunes in the Netherlands: Regional Climate and Local Topography. PLoS ONE 2014, 9, e91115. [Google Scholar] [CrossRef]
  23. Brooks, S.M.; Spencer, T.; Christie, E.K. Storm impacts and shoreline recovery: Mechanisms and controls in the southern North Sea. Geomorphology 2017, 283, 48–60. [Google Scholar] [CrossRef] [Green Version]
  24. Spodar, A.; Héquette, A.; Ruz, M.-H.; Cartier, A.; Grégoire, P.; Sipka, V.; Forain, N. Evolution of a beach nourishment project using dredged sand from navigation channel, Dunkirk, northern France. J. Coast. Conserv. 2018, 22, 457–474. [Google Scholar] [CrossRef]
  25. de Schipper, M.A.; de Vries, S.; Ruessink, G.; de Zeeuw, R.C.; Rutten, J.; van Gelder-Maas, C.; Stive, M.J.F. Initial spreading of a mega feeder nourishment: Observations of the Sand Engine pilot project. Coast. Eng. 2016, 111, 23–38. [Google Scholar] [CrossRef] [Green Version]
  26. Trentesaux, A.; Stolk, A.; Berné, S. Sedimentology and stratigraphy of a tidal sand bank in the southern North Sea. Mar. Geol. 1999, 159, 253–272. [Google Scholar] [CrossRef]
  27. Lanckneus, J. A comparative study of sedimentological parameters of some superficial sediments on the Flemish Banks. In The Quaternary and Tertiary Geology of the Southern Bight, North Sea; Henriet, J.-P., De Moor, G., De Batist, M., Eds.; Belgian Geological Survey: Brussel, Belgium, 1989; pp. 229–241. [Google Scholar]
  28. Berné, S.; Auffret, J.-P.; Walker, P. Internal structure of subtidal sandwaves revealed by high-resolution seismic reflection. Sedimentology 1988, 35, 5–20. [Google Scholar] [CrossRef]
  29. Bellec, V.; Van Lancker, V.; Degrendele, K.; Roche, M.; Le Bot, S. Geo-environmental characterization of the Kwinte Bank. J. Coast. Res. 2010, 63–76. [Google Scholar]
  30. Williams, J.J.; MacDonald, N.J.; O’Connor, B.A.; Pan, S. Offshore sand bank dynamics. J. Mar. Syst. 2000, 24, 153–173. [Google Scholar] [CrossRef]
  31. Pan, S.; MacDonald, N.; Williams, J.; O’Connor, B.A.; Nicholson, J.; Davies, A.M. Modelling the hydrodynamics of offshore sandbanks. Cont. Shelf Res. 2007, 27, 1264–1286. [Google Scholar] [CrossRef]
  32. Briere, C.; Roos, P.C.; Garel, E.; Hulscher, S.J.M.H. Modelling the morphodynamics of the Kwinte Bank, subject to sand extraction. J. Coast. Res. 2010, 51, 117–126. [Google Scholar]
  33. Fairley, I.; Masters, I.; Karunarathna, H. Numerical modelling of storm and surge events on offshore sandbanks. Mar. Geol. 2016, 371, 106–119. [Google Scholar] [CrossRef] [Green Version]
  34. MacDonald, N.J.; O’Connor, B.A. Changes in wave impact on the Flemish coast due to increased mean sea level. J. Mar. Syst. 1996, 7, 133–144. [Google Scholar] [CrossRef]
  35. Héquette, A.; Ruz, M.H.; Maspataud, A.; Sipka, V. Effects of nearshore sand bank and associated channel on beach hydrodynamics: Implications for beach and shoreline evolution. J. Coast. Res. 2009, 56, 59–63. [Google Scholar]
  36. Hequette, A.; Aernouts, D. The influence of nearshore sand bank dynamics on shoreline evolution in a macrotidal coastal environment, Calais, Northern France. Cont. Shelf Res. 2010, 30, 1349–1361. [Google Scholar] [CrossRef]
  37. Bakare, A.-M.; Simons, R.; Morley, J.; Guillas, S. Morphologic evolution of the Great Yarmouth Sandbank and channel system. Coast. Eng. Proc. 2011, 1, 72. [Google Scholar] [CrossRef]
  38. Thomas, T.; Phillips, M.R.; Williams, A.T.; Jenkins, R.E. A multi-century record of linked nearshore and coastal change. Earth Surf. Process. Landf. 2011, 36, 995–1006. [Google Scholar] [CrossRef]
  39. CEREMA. Dynamiques et Évolution du Littoral Synthèse des Connaissances de la Frontière Belge à la Pointe du Hourdel; Fascicule 1; Cerema: Bron, France, 2018; ISBN 978-2-37180-239-1. [Google Scholar]
  40. Reichmüth, B.; Anthony, E.J. The Variability of Ridge and Runnel Beach Morphology: Examples from Northern France. J. Coast. Res. 2002, 36, 612–621. [Google Scholar] [CrossRef]
  41. Anthony, E.J. Long-term marine bedload segregation, and sandy versus gravelly Holocene shorelines in the eastern English Channel. Mar. Geol. 2002, 187, 221–234. [Google Scholar] [CrossRef]
  42. Augris, C.; Clabaut, P.; Vicaire, O. Le domaine marin du Nord-Pas de Calais. Nature, Morphologie et Mobilité des Fonds; IFREMER: Paris, France, 1990. [Google Scholar]
  43. Vicaire, O. Dynamique hydro-sédimentaire en mer du Nord mériodionale (du Cap Blanc-Nez à la frontière Belge); Université des Sciences et Techniques de Lille 1: Villeneuve-d’Ascq, France, 1991. [Google Scholar]
  44. Anthony, E.J.; Héquette, A. The grain-size characterisation of coastal sand from the Somme estuary to Belgium: Sediment sorting processes and mixing in a tide-and storm-dominated setting. Sediment. Geol. 2007, 202, 369–382. [Google Scholar] [CrossRef]
  45. Corbau, C.; Tessier, B.; Chamley, H. Seasonal Evolution of Shoreface and Beach System Morphology in a Macrotidal Environment, Dunkerque Area, Northern France. J. Coast. Res. 1999, 15, 97–110. [Google Scholar]
  46. Annuaire des Marées 2019, Ports de France Métropole, Tome 1. 2017; ISBN 978-2-11-139478-0.
  47. Courants de marée Tidal Streams, Pas de Calais Baie de Somme. 2014; ISBN 978-2-11-128369-5.
  48. Héquette, A.; Hemdane, Y.; Anthony, E.J. Sediment transport under wave and current combined flows on a tide-dominated shoreface, northern coast of France. Mar. Geol. 2008, 249, 226–242. [Google Scholar] [CrossRef]
  49. Corbau, C. Dynamique Sédimentaire en Domaine Macrotidale: Exemple du Littoral du Nord de la France (Dunkerque); Université des Sciences et Technologiques de Lille 1: Villeneuve-d’Ascq, France, 1995. [Google Scholar]
  50. Héquette, A.; Moses, C. SIG BAR. Projet INTERREG IIIA “Beaches At Risk”. 2008. Available online: http://www.unicaen.fr/crec/php/rapport.php?ID=2 (accessed on 20 March 2019).
  51. Ruz, M.H.; Héquette, A.; Maspataud, A. Identifying forcing conditions responsible for foredune erosion on the northern coast of France. J. Coast. Res. 2009, 56, 356–360. [Google Scholar]
  52. Sedrati, M.; Anthony, E.J. Storm-generated morphological change and longshore sand transport in the intertidal zone of a multi-barred macrotidal beach. Mar. Geol. 2007, 244, 209–229. [Google Scholar] [CrossRef]
  53. Héquette, A.; Cartier, A. Theoretical and Observed Breaking Wave Height on a Barred Macrotidal Beach: Implications for the Estimation of Breaker Index on Beaches with Large Tidal Range. J. Coast. Res. 2016, 861–866. [Google Scholar] [CrossRef]
  54. Créach, R.; Bosch, S.; Boutry, L.; Genevier, J.; Claverie, P.; Badez, A. ScanBathy: A New Solution to Digitize Depth Data from Historic Survey Sheets. Available online: https://www.gebco.net/about_us/gebco_symposium/documents/gebco_sd_2016_ts2.pdf (accessed on 20 March 2019).
  55. Cressie, N. The origins of kriging. Math. Geol. 1990, 22, 239–252. [Google Scholar] [CrossRef]
  56. Bertin, X. Morphodynamique Séculaire, Modélisation et Architecture Interne d’un Système Baie-Embouchure Tidale: Le Pertuis de Maumusson et la Baie de Marennes-Oléron. Ph.D. Thesis, Université La Rochelle, La Rochelle, France, 2005. [Google Scholar]
  57. Jabbar, M.; Hénaff, A.; Deschamps, A. Dynamiques et évolutions morpho-sédimentaires de l’avant-plage du secteur littoral de Combrit—Île-Tudy entre le XIXe et le XXIe siècle. Géomorphologie Relief Process. Environ. 2015, 21, 45–56. [Google Scholar] [CrossRef]
  58. Li, D.; Tang, C.; Hou, X.; Zhang, H. Rapid Morphological Changes Caused by Intensive Coastal Development in Longkou Bay, China. J. Coast. Res. 2019. [Google Scholar] [CrossRef]
  59. Wheaton, J.; Brasington, J.; Darby, S.E.; Sear, D. Accounting for uncertainty in DEMs from repeat topographic surveys: Improved sediment budgets. Earth Surf. Process. Landf. 2010, 35, 135–156. [Google Scholar] [CrossRef]
  60. Brasington, J.; Langham, J.; Rumsby, B. Methodological sensitivity of morphometric estimates of coarse fluvial sediment transport. Geomorphology 2003, 53, 299–316. [Google Scholar] [CrossRef]
  61. Van Veen, J. Onderzoekingen in de Hoofden in verband met de gesteldheid der Nederlandsche kust. Ph.D. Thesis, University Van Leiden, Leiden, The Netherlands, 1936. [Google Scholar]
  62. Van Cauwenberghe Relative Sea Level Rise: Further Analyses and Conclusions with Respects to the High Mater, the Mean Sea and the Low Water Levels along the Belgian Coast. Report 37 of the Hydrografische Dienst der Kust 1995. Available online: www.vliz.be/imisdocs/publications/255823.pdf (accessed on 20 March 2019).
  63. Coastal Sand Bars and Related Structures. In Developments in Sedimentology; Allen, J.R.L. (Ed.) Elsevier: Amsterdam, The Netherlands, 1982; Volume 30, Chapter 11; pp. 433–470. ISBN 0070-4571. [Google Scholar]
  64. Allen, J.R.L. Sand waves: A model of origin and internal structure. Sediment. Geol. 1980, 26, 281–328. [Google Scholar] [CrossRef]
  65. Le Bot, S.; Trentesaux, A. Types of internal structure and external morphology of submarine dunes under the influence of tide- and wind-driven processes (Dover Strait, northern France). Mar. Geol. 2004, 211, 143–168. [Google Scholar] [CrossRef]
  66. Yuhi, M.; Matsuyama, M.; Hayakawa, K. Sandbar Migration and Shoreline Change on the Chirihama Coast, Japan. J. Mar. Sci. Eng. 2016, 4, 40. [Google Scholar] [CrossRef]
  67. Bertier, J. Analyse multi-échelle de la morphodynamique d’une plage artificielle, Avant-port Ouest de Dunkerque (Nord de la France). Ph.D. Thesis, Université du Littoral Côte d’Opale, Dunkerque, France, 2009. [Google Scholar]
  68. Beck, C.; Clabaut, P.; Dewez, S.; Vicaire, O.; Chamley, H.; Augris, C.; Hoslin, R.; Caillot, A. Sand bodies and sand transport paths at the English Channel-North Sea border: Morphology, hydrodynamics and radioactive tracing. Oceanol. Acta Spec. Issue 1991. Available online: https://archimer.ifremer.fr/doc/00268/37887/35968.pdf (accessed on 20 March 2019).
  69. Villaret, C.; Davies, A.G. Numerical modelling of littoral sand transport. In Proceedings of the 29th International Conference on Coastal Engineering 2004, Lisbon, Portugal, 19–24 September 2004. [Google Scholar]
  70. Tessier, B.; Corbau, C.; Chamley, H.; Auffret, J.-P. Internal Structure of Shoreface Banks Revealed by High-Resolution Seismic Reflection in a Macrotidal Environment (Dunkerque Area, Northern France). J. Coast. Res. 1999, 15, 593–606. [Google Scholar]
  71. Aernouts, D. Le rôle des changements bathymétriques à l’avant-côte sur l’évolution des littoraux meubles du Cap Gris-Nez à Dunkerque, Côte d’Opale, Nord de la France. Ph.D. Thesis, Université Littoral Côte d’Opale, Dunkerque, France, 2005. [Google Scholar]
  72. Vincent, C.E.; Young, R.A.; Swift, D.J.P. Sediment transport on the Long Island shoreface, North American Atlantic Shelf: Role of waves and currents in shoreface maintenance. Cont. Shelf Res. 1983, 2, 163–181. [Google Scholar] [CrossRef]
  73. Swift, D.J.P.; Holliday, B.; Avignone, N.; Shideler, G. Anatomy of a shore face ridge system, False Cape, Virginia. Mar. Geol. 1972, 12, 59–84. [Google Scholar] [CrossRef]
  74. Shaw, J.; Forbes, D.L. Barriers, barrier platforms, and spillover deposits in St. George’s Bay, Newfoundland: Paraglacial sedimentation on the flanks of a deep coastal basin. Mar. Geol. 1992, 105, 119–140. [Google Scholar] [CrossRef]
  75. Maspataud, A. Impacts des Tempêtes sur la Morphodynamique du Profil Côtier en Milieu Macrotidal. Ph.D. Thesis, Université du Littoral Côte d’Opale, Dunkerque, France, 2011. [Google Scholar]
  76. Giardino, A.; Van den Eynde, D.; Monbaliu, J. Wave effects on the morphodynamic evolution of an offshore sand bank. J. Coast. Res. 2010, 51, 127–140. [Google Scholar]
  77. Anthony, E.J.; Vanhee, S.; Ruz, M.-H. Short-term beach–dune sand budgets on the north sea coast of France: Sand supply from shoreface to dunes, and the role of wind and fetch. Geomorphology 2006, 81, 316–329. [Google Scholar] [CrossRef]
  78. Crapoulet, A.; Héquette, A.; Marin, D.; Levoy, F.; Bretel, P. Variations in the response of the dune coast of northern France to major storms as a function of available beach sediment volume. Earth Surf. Process. Landf. 2017, 42, 1603–1622. [Google Scholar] [CrossRef]
  79. Houthuys, R.; De Moor, G.; Sommé, J. The Shaping of the French-Belgian North Sea Coast Throughout Recent Geology and History; ASCE: Reston, VA, USA, 1993; pp. 27–40. [Google Scholar]
  80. Bourillet, J.-F.; Reynaud, J.; Baltzer, A.; Zaragosi, S. The “Fleuve Manche”: The submarine sedimentary features from the outer shelf to the deep-sea fans. J. Quat. Sci. Publ. Quat. Res. Assoc. 2003, 18, 261–282. [Google Scholar]
  81. Lericolais, G.; Auffret, J.-P.; Bourillet, J.-F. The Quaternary Channel River: Seismic Stratigraphy of Its Palaeo-Valleys and Deeps. J. Quat. Sci. 2003, 18, 245–260. [Google Scholar] [CrossRef]
  82. Corbau, C.; Clabaut, P.; Tessier, B.; Chamley, H. Modifications morphosédimentaires historiques et récentes du domaine côtier Dunkerquois (France). C. R. Acad. Des. Sci. Paris 1993, 316, 1573–1580. [Google Scholar]
  83. Wahl, T.; Haigh, I.D.; Woodworth, P.L.; Albrecht, F.; Dillingh, D.; Jensen, J.; Nicholls, R.J.; Weisse, R.; Wöppelmann, G. Observed mean sea level changes around the North Sea coastline from 1800 to present. Earth-Sci. Rev. 2013, 124, 51–67. [Google Scholar] [CrossRef] [Green Version]
  84. Smith, D.B. Stability of an Offset Kink in the North Hinder Bank. In Tide-Influenced Sedimentary Environments and Facies; Wiley: Hoboken, NJ, USA, 1988; pp. 65–78. [Google Scholar]
  85. Lanckneus, J.; De Moor, G.; De Schaepmeester, G.; De Winne, E.; Meyus, I. Monitoring of a tidal sandbank: Evolution of bedforms, volumetric trends, sedimentological changes. In Proceedings of the 8th Biennal International Symposium on Hydrographical Society, Copenhagen, Denmark, 30 November–3 December 1992. [Google Scholar]
  86. Lanckneus, J.; De Moor, G.; Stolk, A. Environmental setting, morphology and volumetric evolution of the Middelkerke Bank (southern North Sea). Mar. Geol. 1994, 121, 1–21. [Google Scholar] [CrossRef]
  87. Van Lancker, V.; Du Four, I.; Degraer, S.; Fettweis, M.; Francken, F.; Van den Eynde, D.; Devolder, M.; Luyten, P.; Monbaliu, J.; Toorman, E.; et al. QUantification of Erosion/Sedimentation patterns to Trace the natural versus anthropogenic sediment dynamics QUEST4D. 2009. Available online: www.marinebiology.ugent.be/node/26721 (accessed on 20 March 2019).
Figure 1. Location map of the study area, showing the position of the Northern France nearshore sand banks (inset map from [14]). The depth contours are in meters below the lowest astronomical tide level (LAT), and they correspond to the HOMONIM Digital Elevation Model (© Shom).
Jmse 07 00073 g001
Figure 2. Location map of the current meters (Shom) and offshore wave buoy (map projection: Lambert 93); (a,b): Directional distribution of the mean currents recorded in 5 m water depths on the shoreface at Calais and Dunkirk (F0509: from 25 April 1975 to 13 May 1975; F0510: from 5 July 1978 to 19 July 1978) (©Shom); (c): wave rose at the Westhinder buoy (from [24]).
Jmse 07 00073 g002
Figure 3. Offshore tidal sand banks and net sand transport direction in the southern bight of the North Sea (map projection: WGS84) (adapted from the regional study of Augris et al. [42] based on sediment tracing).
Jmse 07 00073 g003
Figure 4. Left: Seabed sediment distribution map of Wissant bay (© Shom), with the location of the cross-shore profile shown in right-hand figure. Right: Superimposition of bathymetric profiles recorded at different periods (1879, 1910–1911, and 1974–1976) over a rocky outcrop.
Jmse 07 00073 g004
Figure 5. Bathymetric differential map of Northern France during the study period (map projection: WGS84). (A): Bathymetry changes between 1861 and 1975; (B): Bathymetry changes between 1861 and 1962. Isobaths from HOMONIM DEM (© Shom).
Jmse 07 00073 g005
Figure 6. Top: Location of the cross-shore and long-shore profiles (map projection: WGS84); the rectangles show the geographic extent of the Dunkirk and Calais nearshores shown in Figure 7, Figure 8 and Figure 9. Bottom: Cross-shore profiles D, E, F, and G along the Dyck bank.
Jmse 07 00073 g006
Figure 7. (ac): Nearshore bathymetry offshore of Dunkirk in 1861, 1894, and 1930–1932 (map projection: Lambert 93). (dg): Bathymetry profile evolution across the Hills and Smal banks between 1836 and 2006. L, M, N are the cross-shore profiles, and O is a longshore profile.
Jmse 07 00073 g007
Figure 8. Bathymetry profiles evolution across the Braek and Snouw banks from 1836 to 2000. (ad) are cross-shore profiles H, I, J, K; (e,f) are longshore profiles P & Q (see Figure 6 for the location of profiles).
Jmse 07 00073 g008
Figure 9. (ac) Nearshore bathymetry offshore of Calais area in 1861, 1910–1911, and 1974–1976 (map projection: Lambert 93). (dg): Bathymetry profiles evolution from 1861 to 2009; A, B and C are cross-shore profiles and R is a longshore profile.
Jmse 07 00073 g009
Figure 10. Sediment volume variation for (a) the Braek and the Snouw bank, (b) the Hills bank, (c) the Riden de la Rade bank, and (d) the Dyck bank.
Jmse 07 00073 g010
Figure 11. Changes in height/width ratio computed on perpendicular transects across (a) the Dyck bank and (b) across the Riden de la Rade (see Figure 6 for location of transects); sediment volume change (erosion/accumulation) of the (c) Dyck bank and of the (d) Riden de la Rade.
Jmse 07 00073 g011
Figure 12. (a): Relationship between the height and width of coastal sand banks; the lower diagrams show the temporal evolution of the width and height of the (b) Braek bank and (c) Snouw bank.
Jmse 07 00073 g012
Figure 13. Relationship between the changes in sand bank width and the cross-shore displacement of bank crest for (a) an offshore bank and (b) the nearshore banks.
Jmse 07 00073 g013
Table 1. Bathymetric surveys used in this study (source: Shom, except for 2000 made by the Dunkirk harbor *, 2006, made by the Belgium Hydrographic Service, and 2009, made by the Calais Harbour ). Abbreviations: MHE: Mean horizontal error; MVE: Maximum vertical error; LS: Line Sounding; ES: Echo Sounder; MES: Multibeam Echo Sounder; RC: Repeating circle; DC: Decca; TR: Toran; TD: Trident.
YearSurvey AreaNumber of Bathymetric SoundingsTransect Distance (m)Sounding Spacing (m)Sounding TechniqueShip PositioningXYerr (m)Digiterr (m)MHE (m)Vertical Propagated Error with a 3% Slope (m)Zerr (m)MVE (m)
1836Dunkirk3304500250LSRC15.04.015.50.911.9
1861Dunkirk-Gravelines-Calais7386250150LSRC15.04.015.50.911.9
1879Dunkirk-Gravelines-Calais51,47125050LSRC15.04.015.50.911.9
1894Dunkirk29,78215040LSRC15.04.015.50.911.9
1910–1911Dunkirk-Gravelines-Calais97,59813030LSRC15.04.015.50.911.9
1929Calais126313030LSRC15.04.015.50.911.9
1930–1932Dunkirk-Gravelines-Calais165,64813030LSRC15.04.015.50.911.9
1962Dunkirk20,19410050ESDC10.04.010.80.70.51.2
1974–1976Gravelines-Calais161,82710050ESDC10.0No digit10.00.60.51.1
1983Calais681510050ESTR5.0No digit5.00.30.50.8
1994Calais123,9125050ESTD5.0No digit5.00.30.50.8
2000 *Dunkirk64,6025050MESGPS3.0No digit3.00.20.30.5
2006 Dunkirk190,8782005MESGPS3.0No digit3.00.20.30.5
2009 Calais9,936,65555MESGPS3.0No digit3.00.20.30.5

