Low-Cost UAV for High-Resolution and Large-Scale Coastal Dune Change Monitoring Using Photogrammetry

 ,
,
Abstract
:
1. Introduction
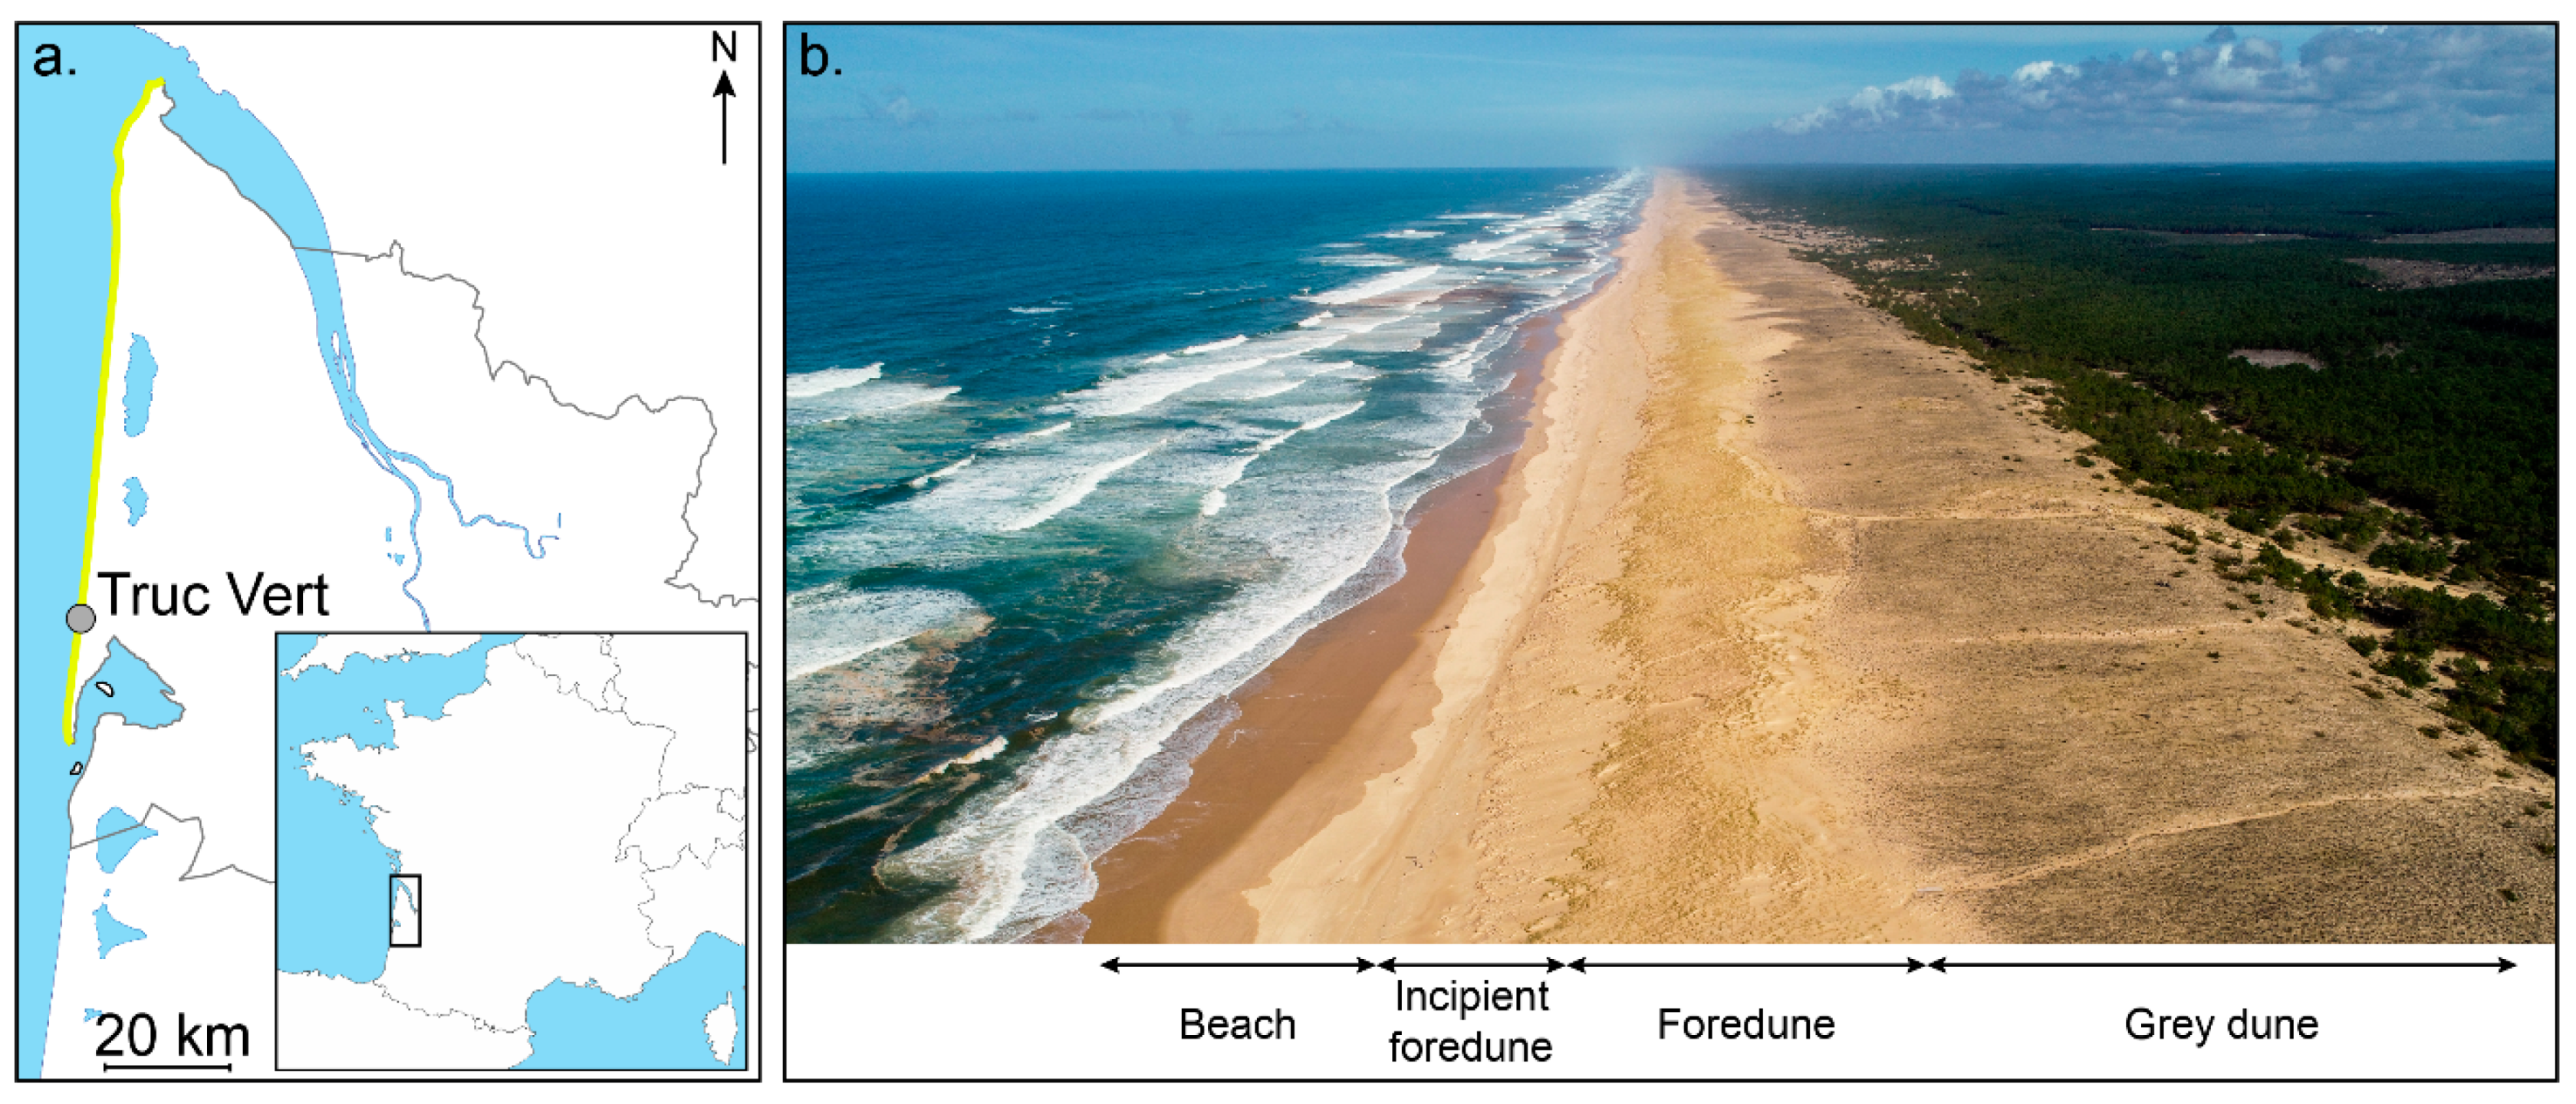
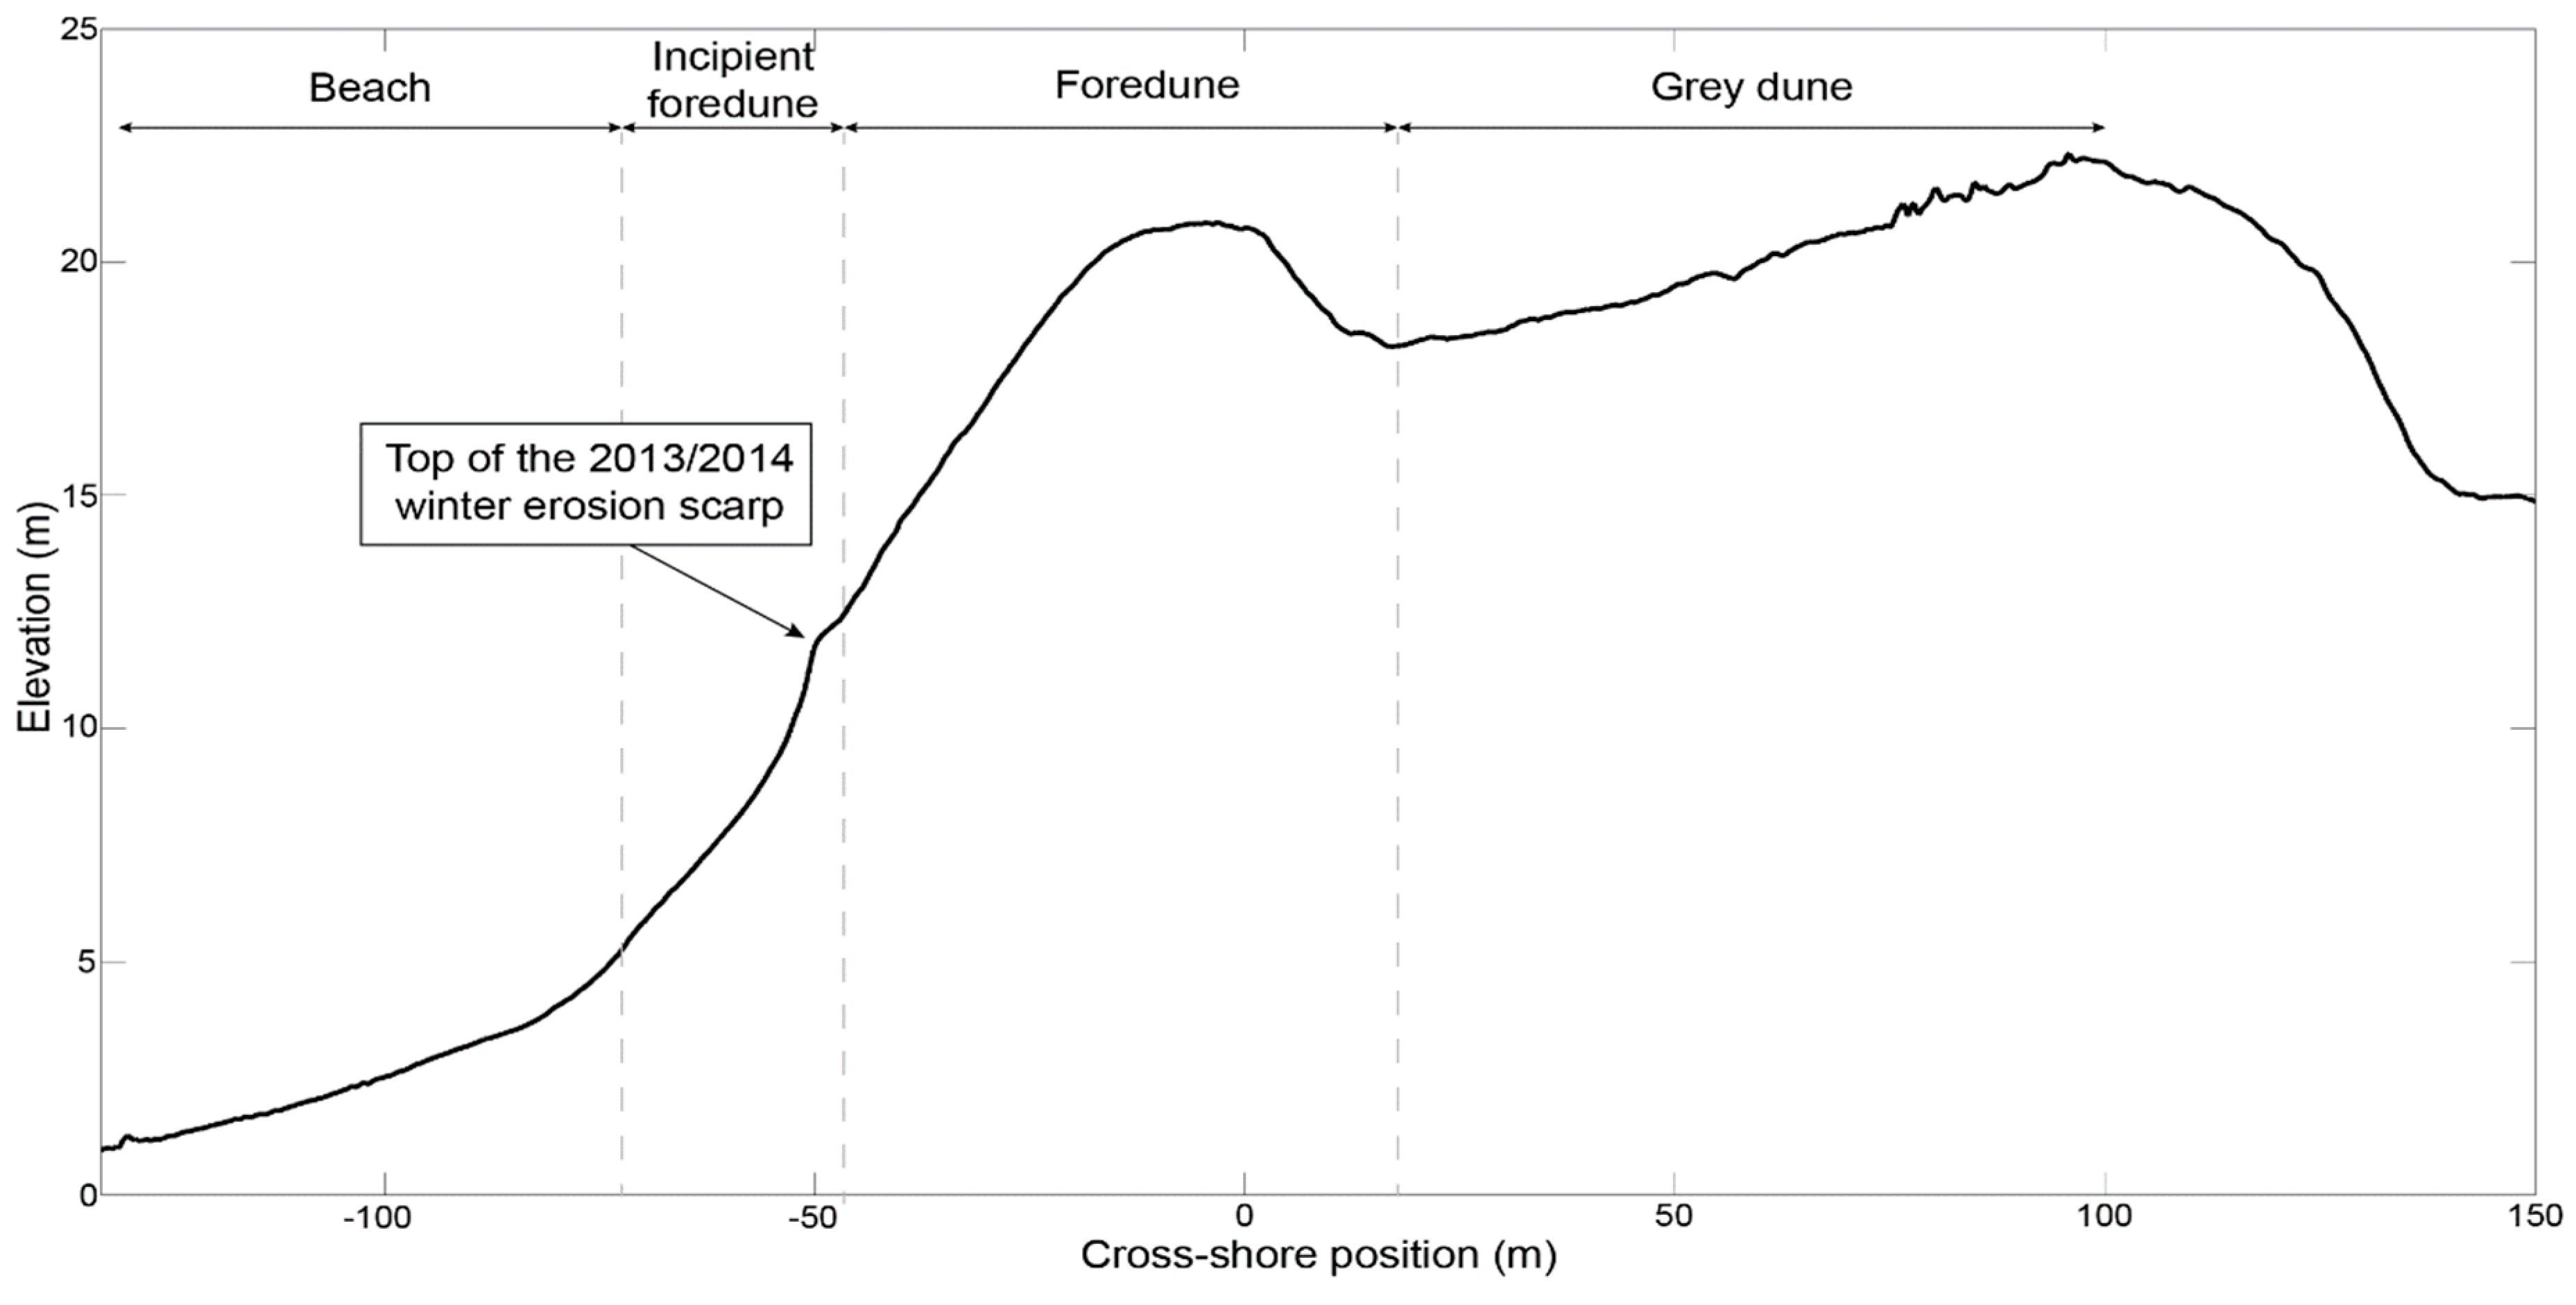
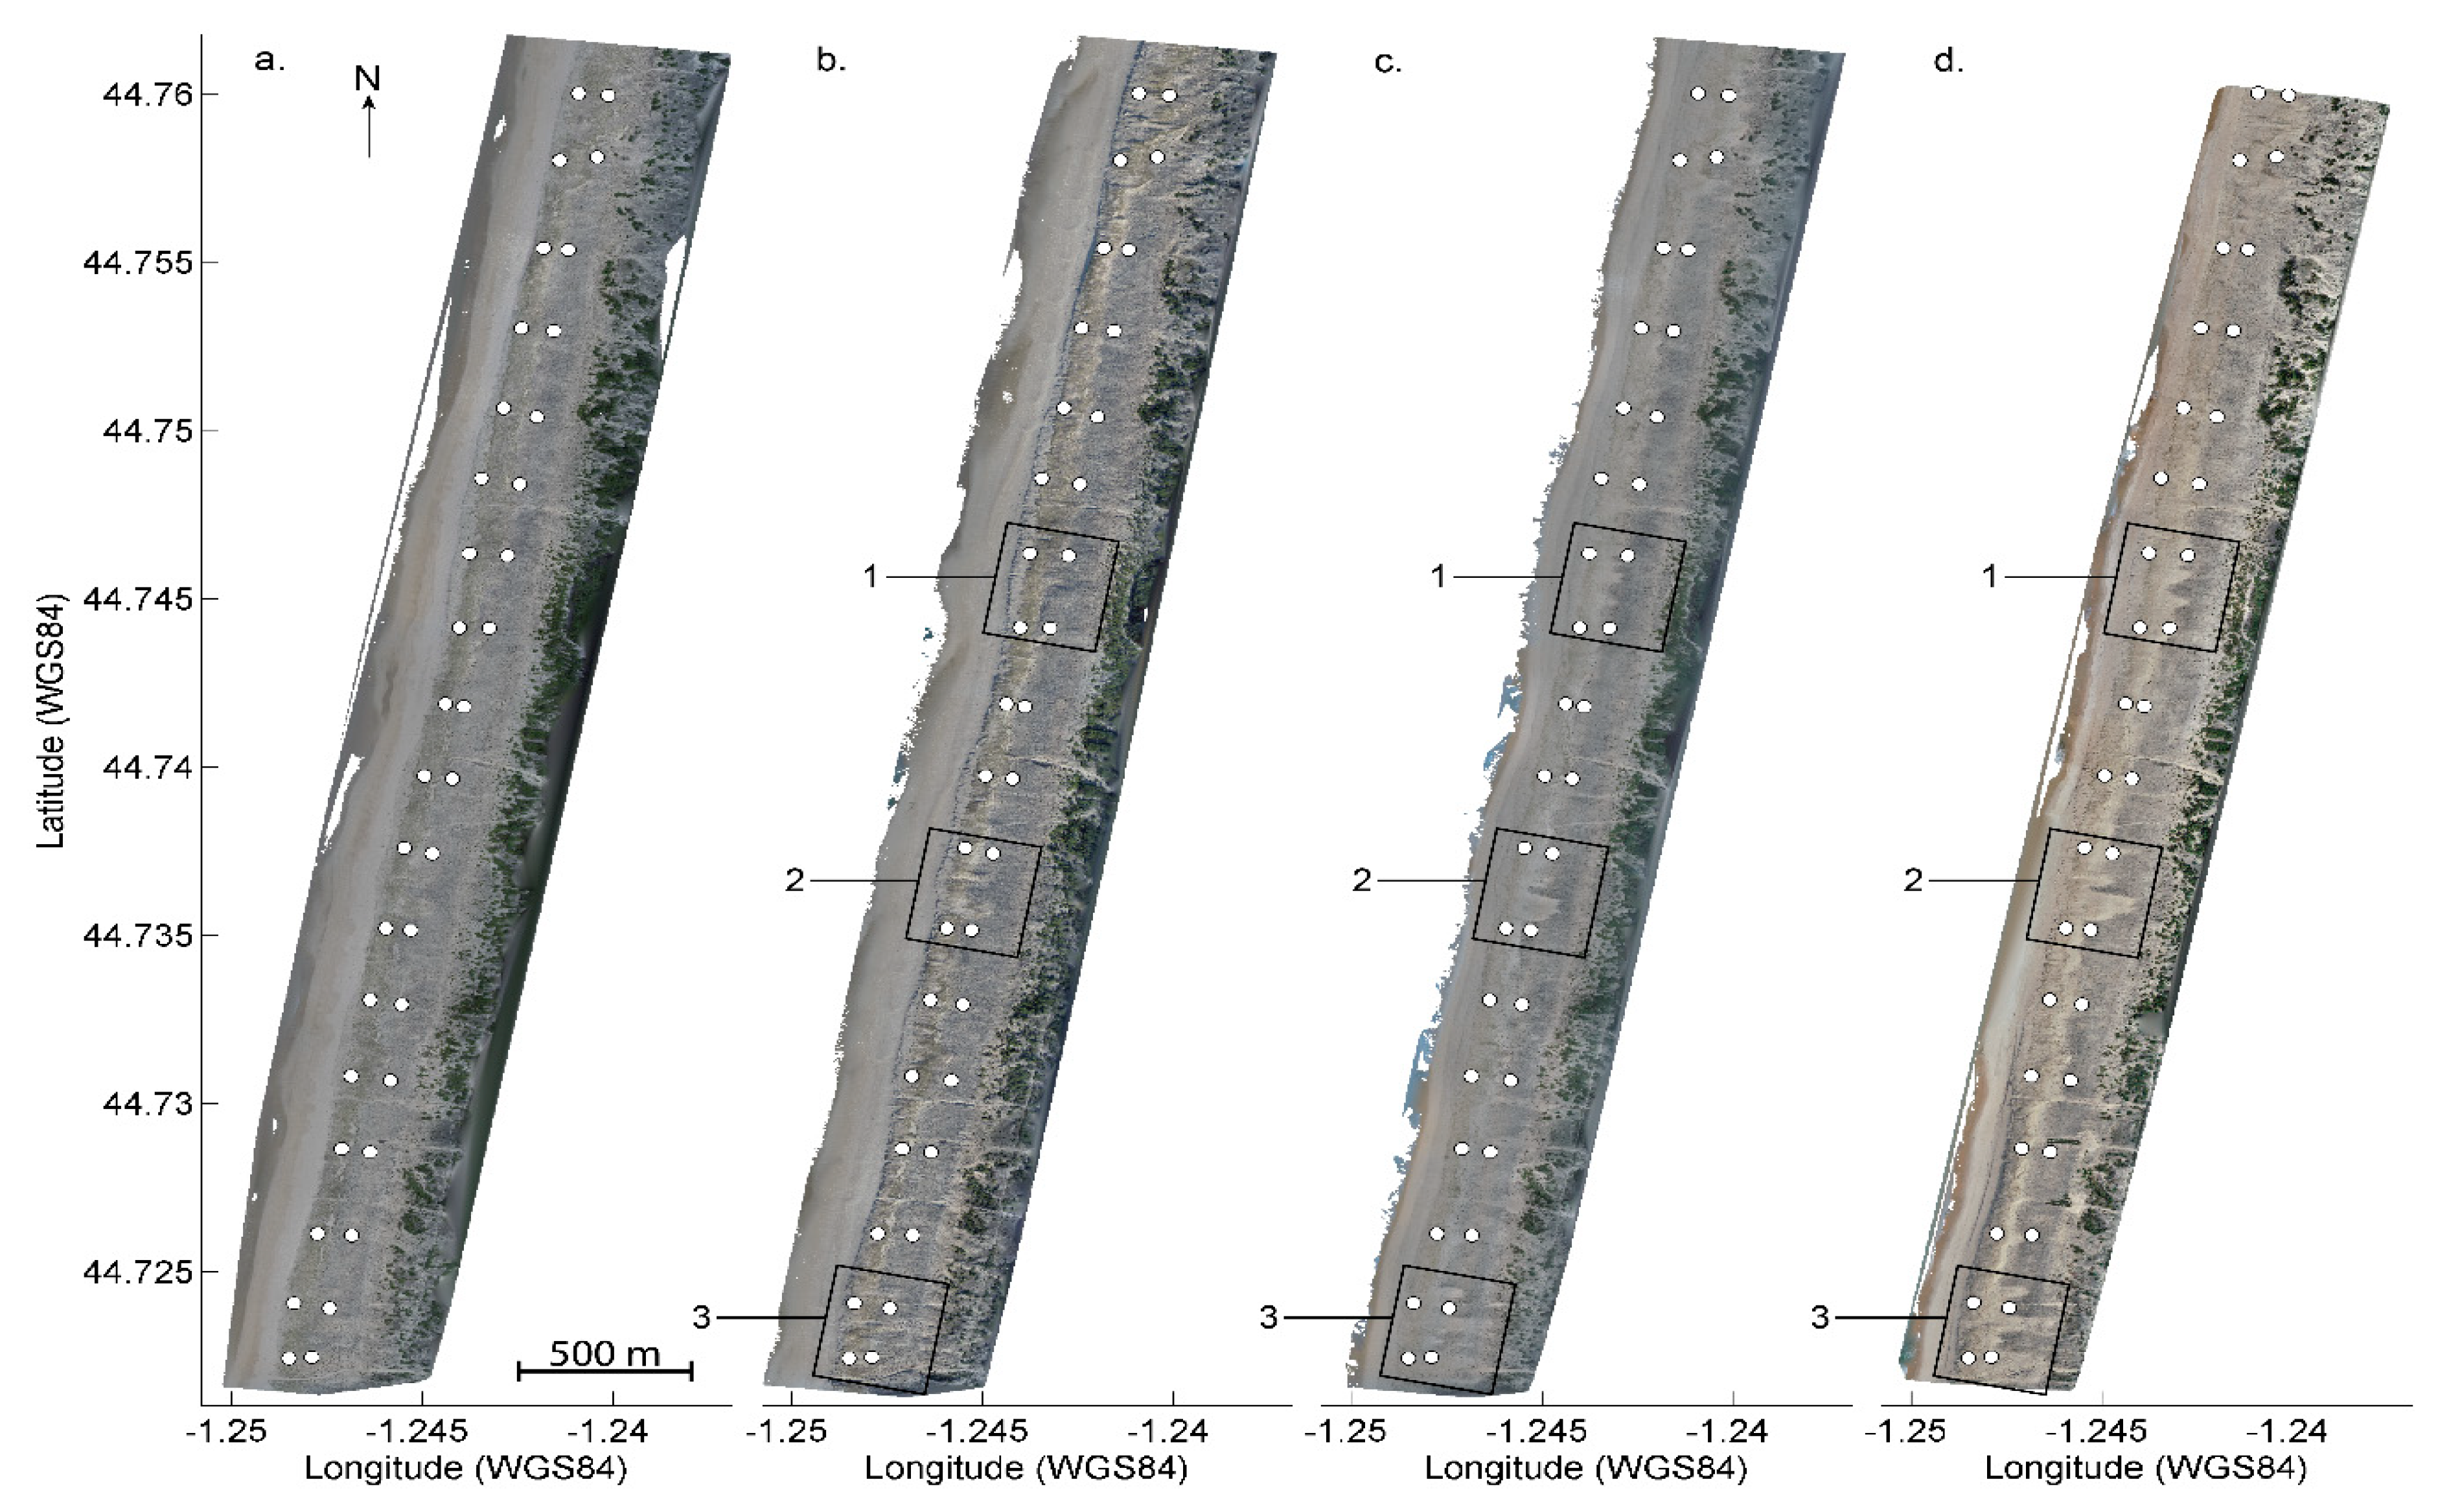
2. Field Site
3. Materials and Methods
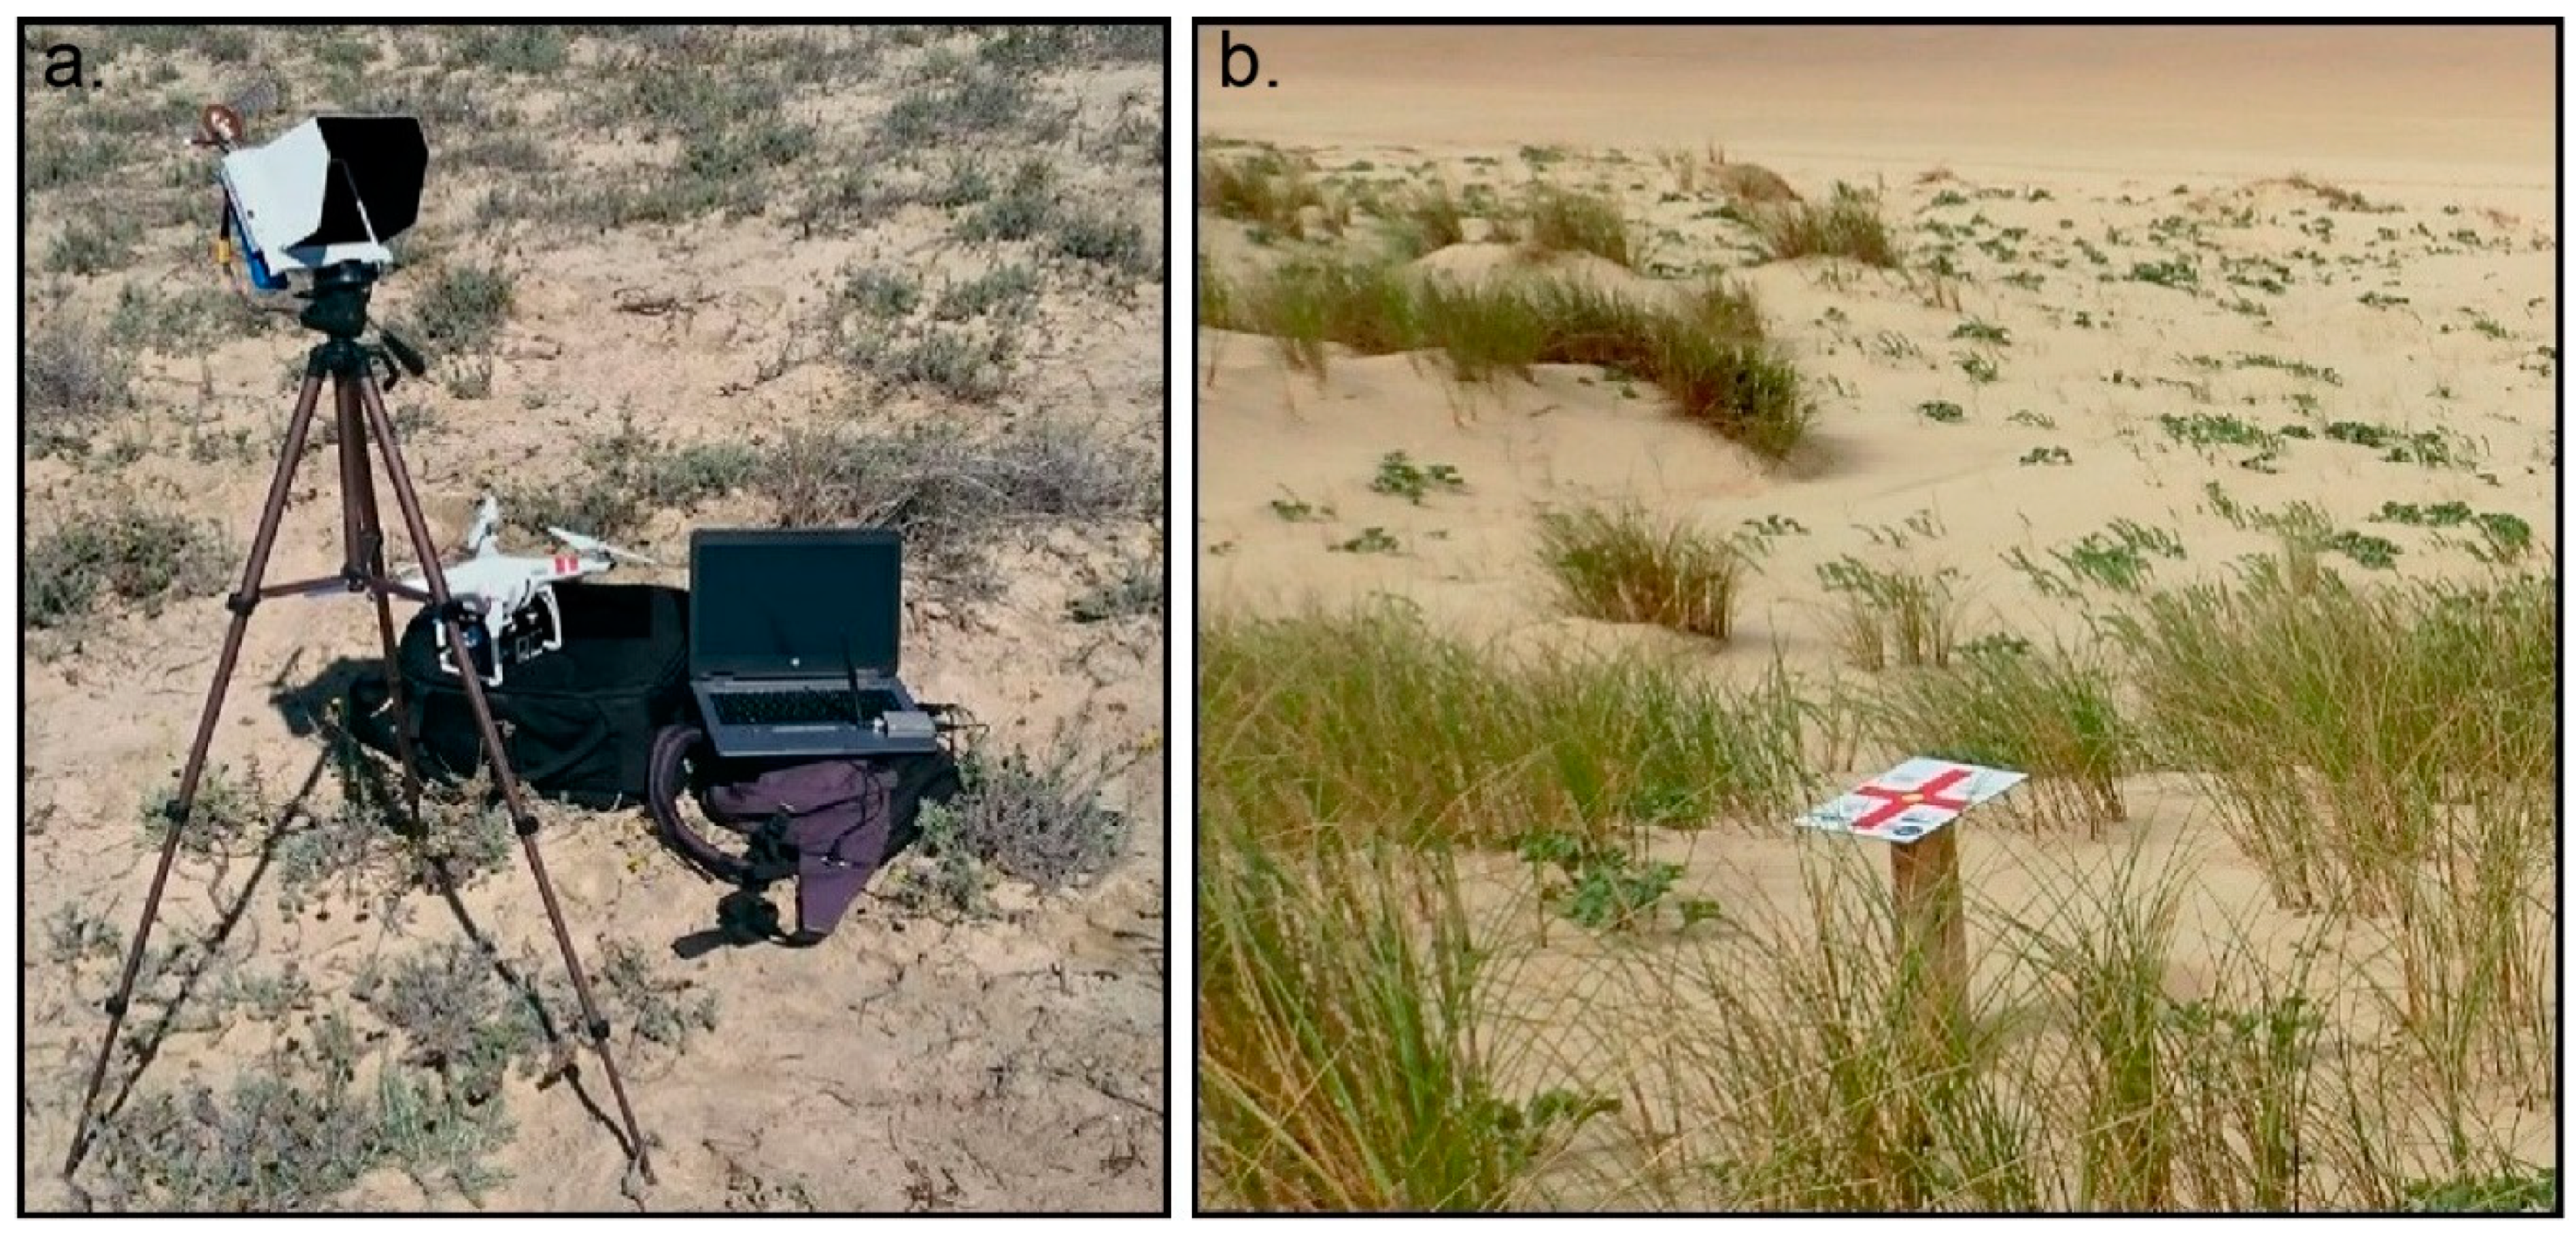
3.1. Low-Cost UAV, Camera and Permanent GCP Implementation
3.2. Photogrammetry
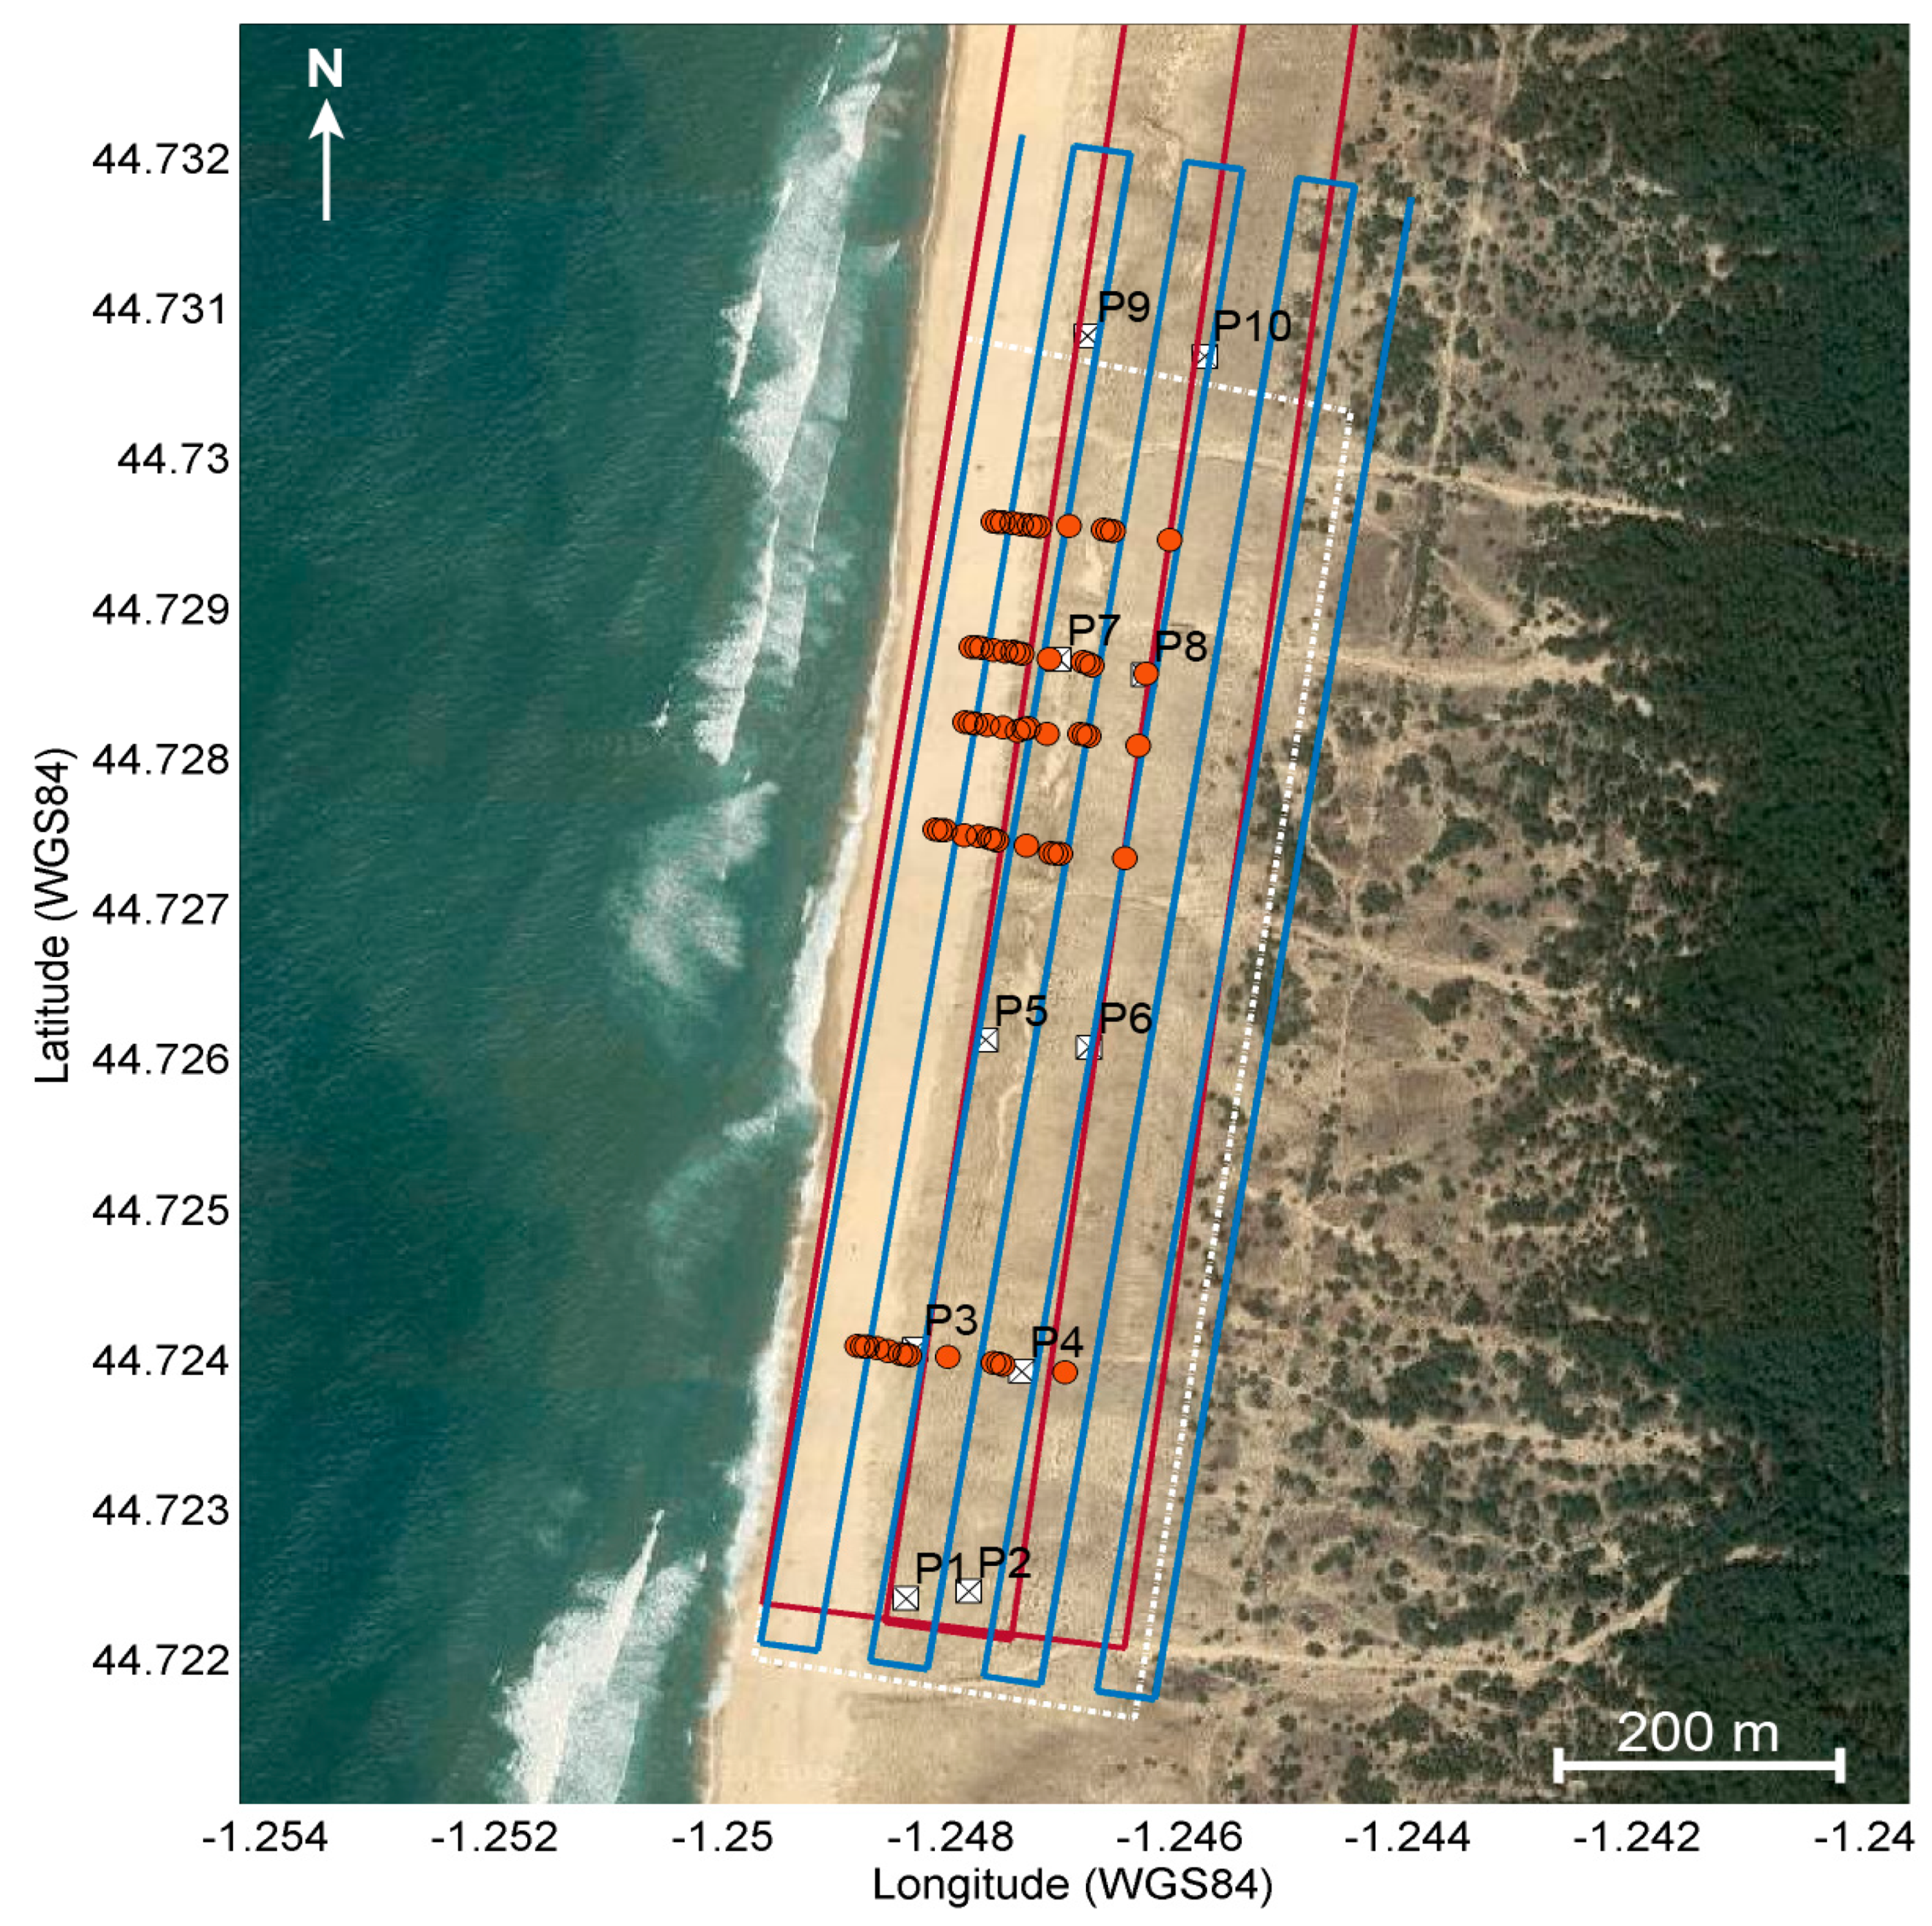
3.3. Validation Experiment Set-Up
4. Results
4.1. Validation Experiment Results
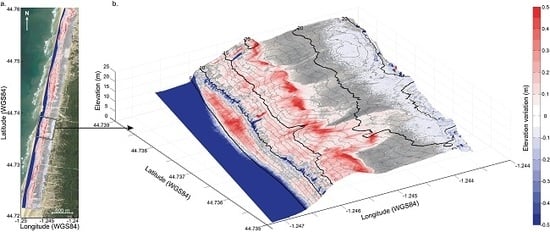
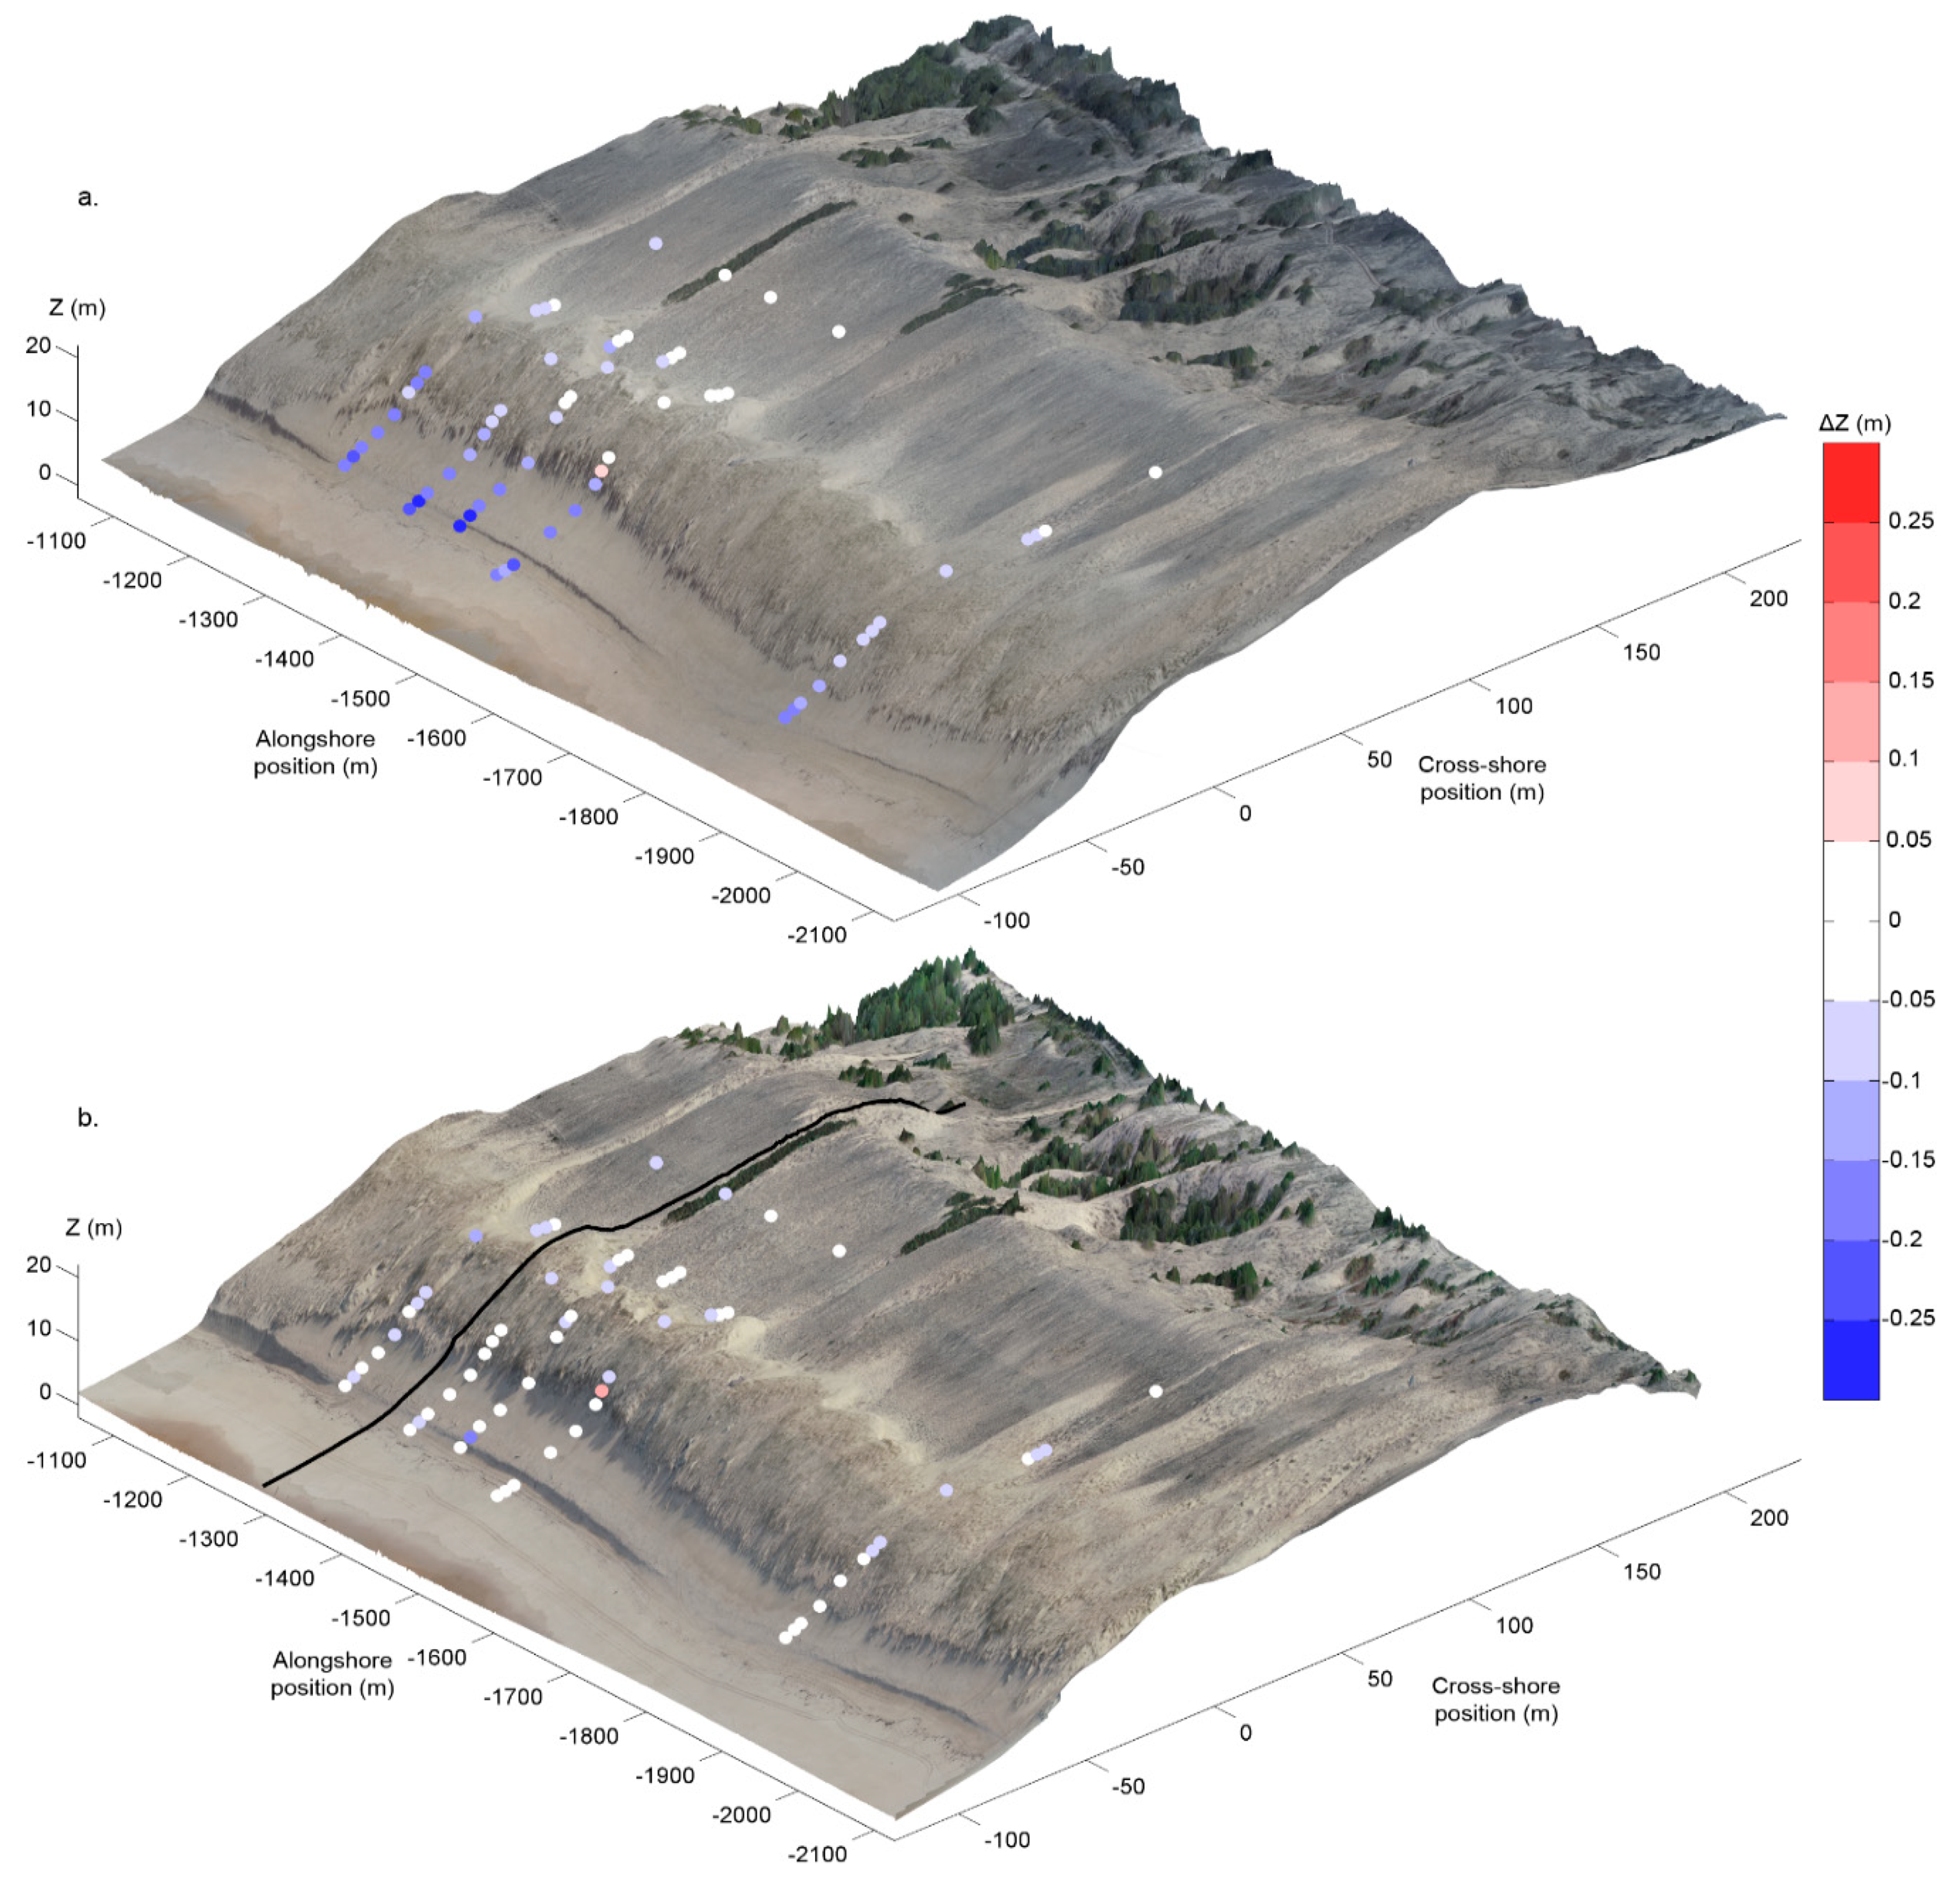
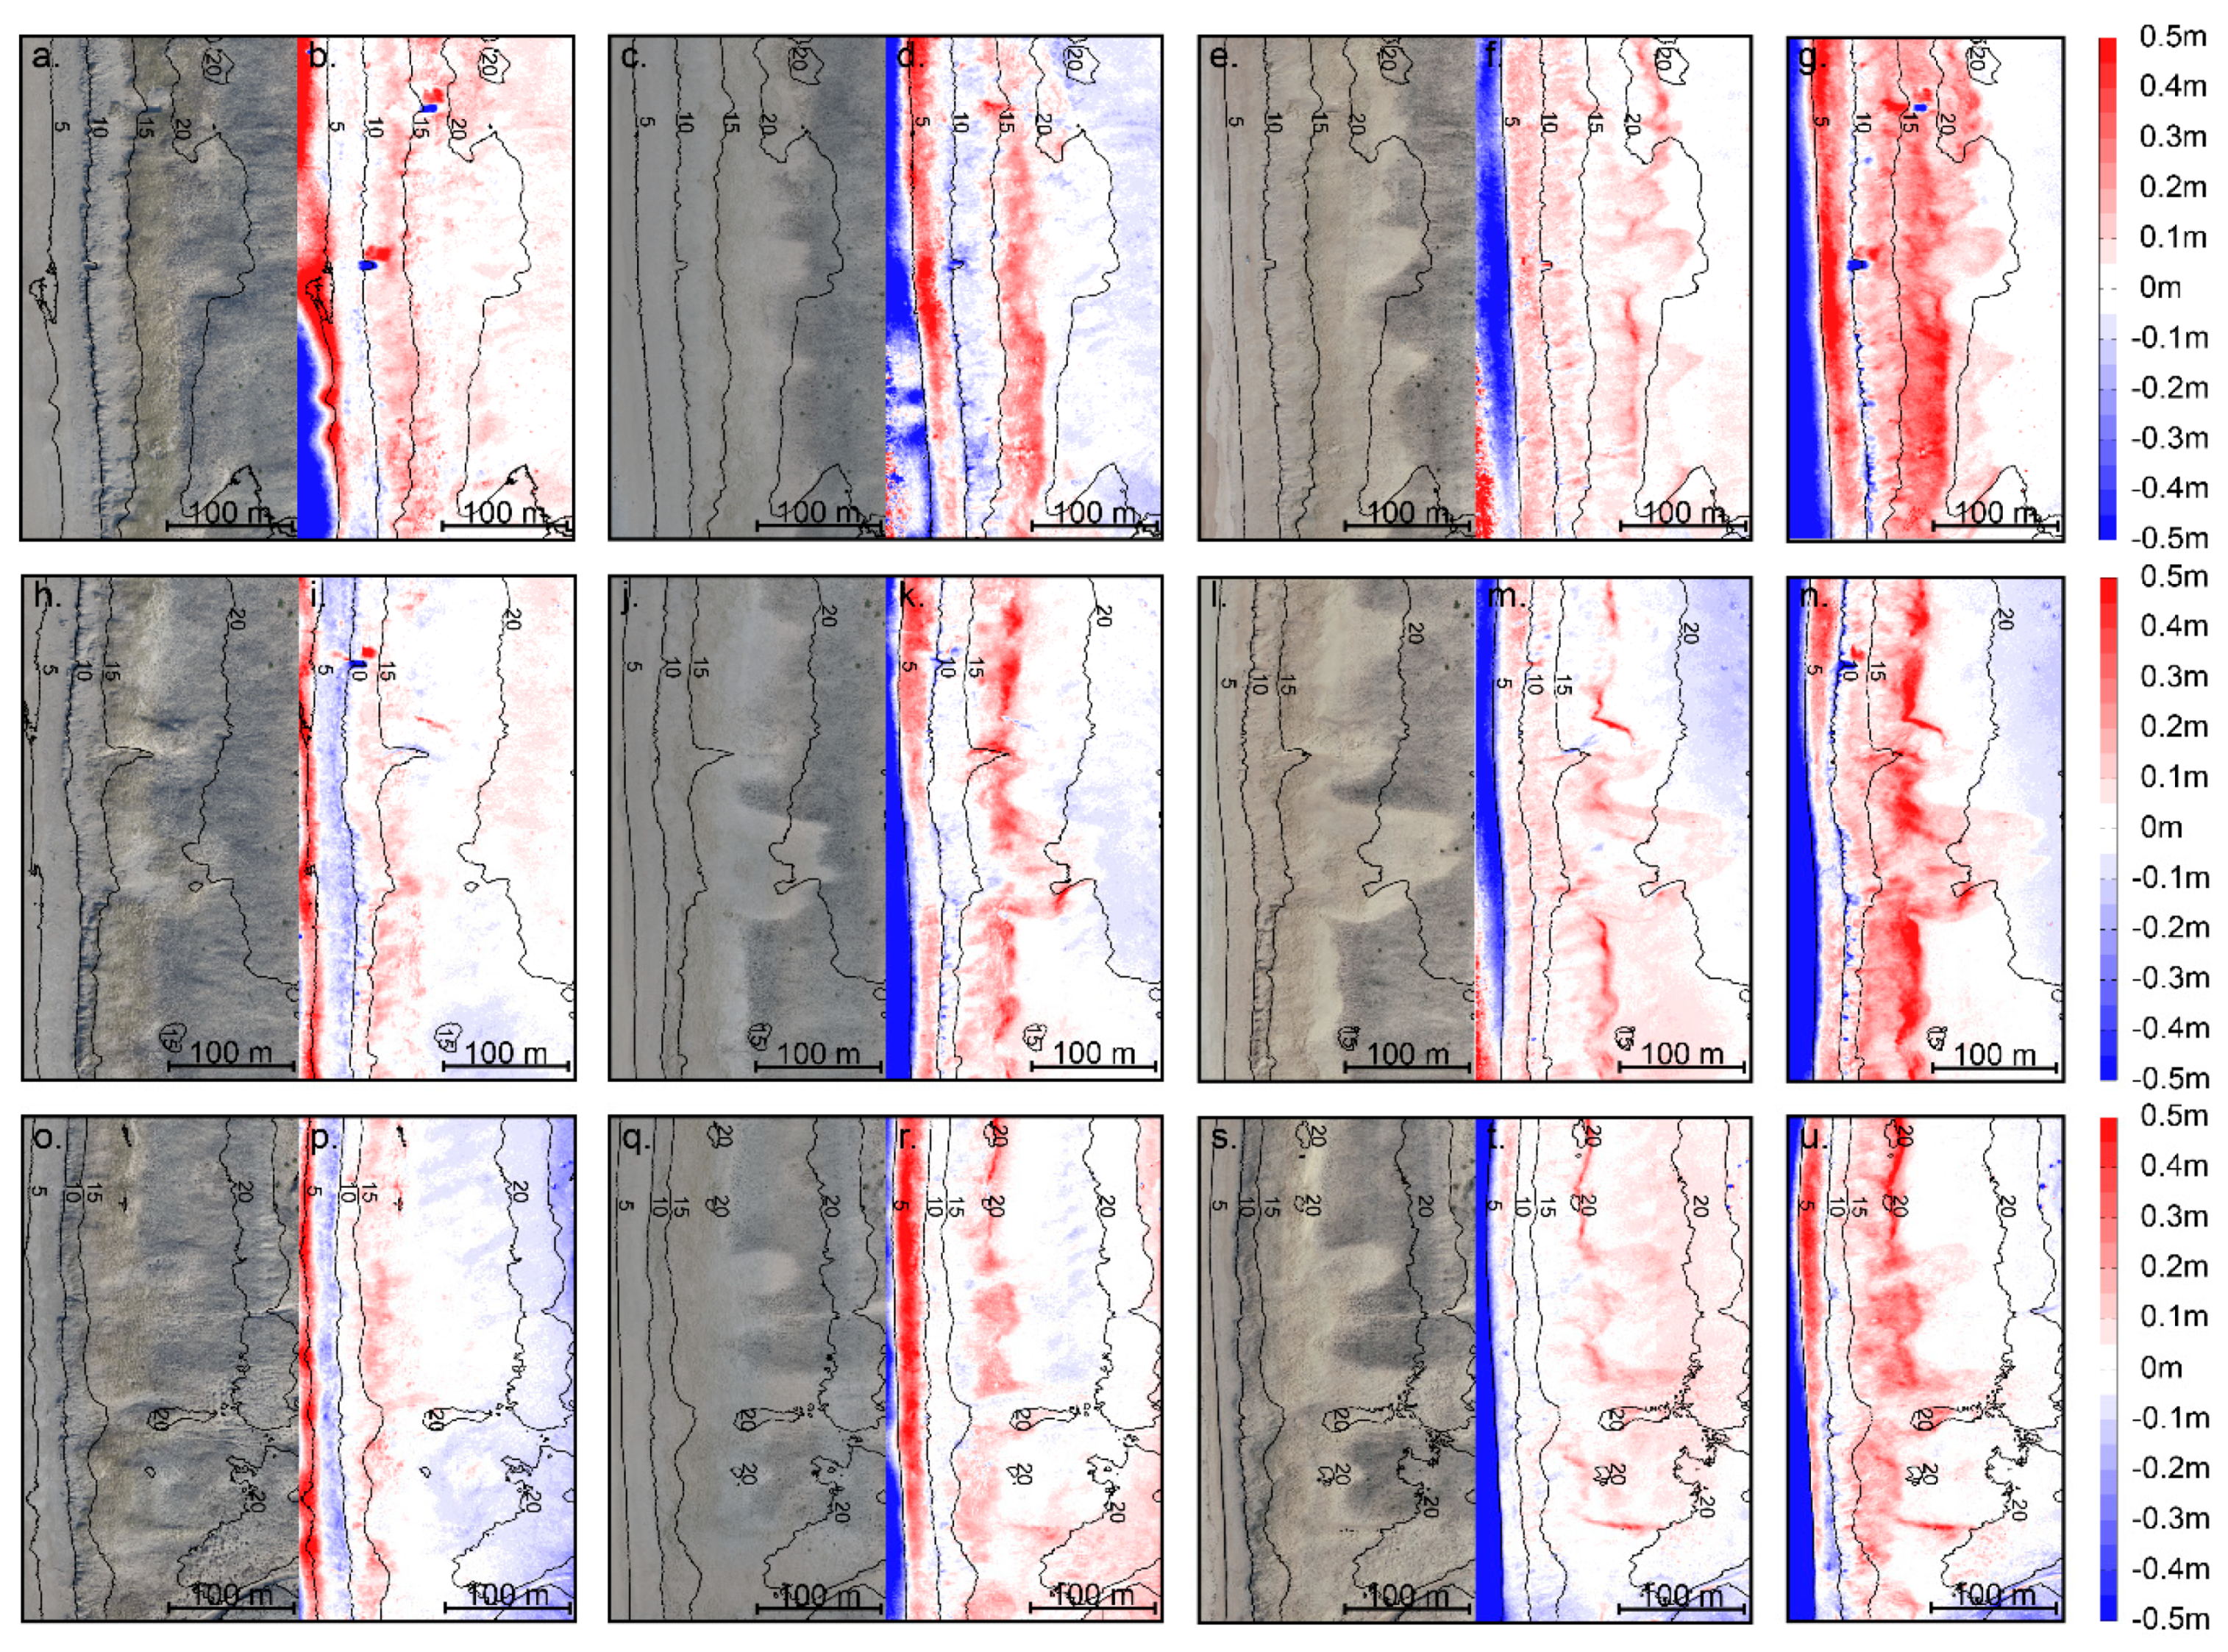
4.2. Large Scale Application to a Rapidly Evolving Coastal Dune
5. Discussion
6. Conclusions
Author Contributions
Funding
Acknowledgments
Conflicts of Interest
References
- Marzolff, I.; Poesen, J. The potential of 3D gully monitoring with GIS using high-resolution aerial photography and a digital photogrammetry system. Geomorphology 2009, 111, 48–60. [Google Scholar] [CrossRef]
- Mancini, F.; Dubbini, M.; Gattelli, M.; Stecchi, F.; Fabbri, S.; Gabbianelli, G. Using unmanned aerial vehicles (UAV) for high-resolution reconstruction of topography: The structure from motion approach on coastal environments. Remote Sens. 2013, 5, 6880–6898. [Google Scholar] [CrossRef]
- Gonçalves, J.A.; Henriques, R. UAV photogrammetry for topographic monitoring of coastal areas. ISPRS J. Photogramm. Remote Sens. 2015, 104, 101–111. [Google Scholar] [CrossRef]
- Brunier, G.; Fleury, J.; Anthony, E.J.; Gardel, A.; Dussouillez, P. Close-range airborne Structure-from-Motion Photogrammetry for high-resolution beach morphometric surveys: Examples from an embayed rotating beach. Geomorphology 2016, 261, 76–88. [Google Scholar] [CrossRef]
- Turner, I.L.; Harley, M.D.; Drummond, C.D. UAVs for coastal surveying. Coast. Eng. 2016, 114, 19–24. [Google Scholar] [CrossRef]
- Guisado-Pintado, E.; Jackson, D.W.T.; Rogers, D. 3D mapping efficacy of a drone and terrestrial laser scanner over a temperate beach-dune zone. Geomorphology 2019, 328, 157–172. [Google Scholar] [CrossRef]
- Long, N.; Millescamps, B.; Guillot, B.; Pouget, F.; Bertin, X. Monitoring the topography of a dynamic tidal inlet using UAV imagery. Remote Sens. 2016, 8, 387. [Google Scholar] [CrossRef]
- Mancini, F.; Castagnetti, C.; Rossi, P.; Dubbini, M.; Fazio, N.L.; Perrotti, M.; Lollino, P. An Integrated Procedure to Assess the Stability of Coastal Rocky Cliffs: From UAV Close-Range Photogrammetry to Geomechanical Finite Element Modeling. Remote Sens. 2017, 9, 1235. [Google Scholar] [CrossRef]
- Rüdiger, J.; Tirpitz, J.-L.; de Moor, J.M.; Bobrowski, N.; Gutmann, A.; Liuzzo, M.; Ibarra, M.; Hoffmann, T. Implementation of electrochemical, optical and denuder-based sensors and sampling techniques on UAV for volcanic gas measurements: Examples from Masaya, Turrialba and Stromboli volcanoes. Atmos. Meas. Tech. 2018, 11, 2441–2457. [Google Scholar] [CrossRef]
- Smith, M.W.; Vericat, D. From experimental plots to experimental landscapes: Topography, erosion and deposition in sub-humid badlands from Structure-from-Motion photogrammetry. Earth Surf. Process. Landf. 2015, 40, 1656–1671. [Google Scholar] [CrossRef]
- Westoby, M.J.; Brasington, J.; Glasser, N.F.; Hambrey, M.J.; Reynolds, J.M. ‘Structure- from-motion’ photogrammetry a low-cost, effective tool for geoscience applications. Geomorphology 2012, 179, 300–314. [Google Scholar] [CrossRef]
- Stive, M.J.F.; Aarninkhof, S.G.J.; Hamm, L.; Hanson, H.; Larson, M.; Wijnberg, K.M.; Nicholls, R.J.; Capobianco, M. Variability of shore and shoreline evolution. Coast. Eng. 2002, 47, 211–235. [Google Scholar] [CrossRef]
- Perko, R.; Raggam, H.; Gutjahr, K.; Schardt, M. Assessment of the mapping potential of Pleiades stereo and triplet data. In Proceedings of the ISPRS Conference on ISPRS Annals of the Photogrammetry, Remote Sensing and Spatial Information Sciences, Zurich, Switzerland, 5–7 September 2014; Volume II-3, pp. 103–109. [Google Scholar]
- Donker, J.; Van Maarseveenand, M.; Ruessink, G. Spatio-temporal variations in foredune dynamics determined with Mobile Laser Scanning. J. Mar. Sci. Eng. 2018, 6, 126. [Google Scholar] [CrossRef]
- Le Mauff, B.; Juigner, M.; Ba, A.; Marc, R.; Launeau, P.; Fattal, P. Coastal monitoring solutions of the geomorphological response of beach-dune systems using multi-temporal LiDAR datasets (Vendée coast, France). Geomorphology 2018, 304, 121–140. [Google Scholar] [CrossRef]
- Ruessink, B.; Arens, S.; Kuipers, M.; Donker, J. Coastal dune dynamics in response to excavated foredune notches. Aeolian Res. 2018, 31, 3–17. [Google Scholar] [CrossRef]
- Eisemann, E.R.; Wallace, D.J.; Buijsman, M.C.; Pierce, T. Response of a vulnerable barrier island to multi-year storm impacts: LiDAR-data-inferred morphodynamic changes on Ship Island, Mississippi, USA. Geomorphology 2018, 313, 58–71. [Google Scholar] [CrossRef]
- Letortu, P.; Jaud, M.; Grandjean, P.; Ammann, J.; Costa, S.; Maquaire, O.; Davidson, R.; Le Dantec, N.; Delacourt, C. Examining high-resolution survey methods for monitoring cliff erosion at an operational scale. GISci. Remote Sens. 2018, 55, 457–476. [Google Scholar] [CrossRef]
- Fabbri, S.; Giambastiani, B.M.S.; Sistilli, F.; Scarelli, F.; Gabbianelli, G. Geomorphological analysis and classification of foredune ridges based on Terrestrial Laser Scanning (TLS) technology. Geomorphology 2017, 295, 436–451. [Google Scholar] [CrossRef]
- Delacourt, C.; Allemand, P.; Jaud, M.; Grandjean, P.; Deschamps, A.; Ammann, J.; Cuq, V.; Suanez, S. DRELIO: An Unmanned Helicopter for Imaging Coastal Areas. J. Coast. Res. 2009, 56, 1489–1493. [Google Scholar]
- Bryson, M.; Johnson-Roberson, M.; Murphy, R.; Bongiorno, D. Kite Aerial Photography for Low-Cost, Ultra-high Spatial Resolution Multi-Spectral Mapping of Intertidal Landscapes. PLoS ONE 2013, 8, e73550. [Google Scholar] [CrossRef] [PubMed]
- Jaud, M.; Grasso, F.; Le Dantec, N.; Verney, R.; Delacourt, C.; Ammann, J.; Deloffre, J.; Grandjean, P. Potential of UAVs for Monitoring Mudflat Morphodynamics (Application to the Seine Estuary, France). ISPRS Int. J. Geo-Inf. 2016, 5, 50. [Google Scholar] [CrossRef]
- Hesp, P.A.; Walker, I.J. Aeolian environments: Coastal dunes. In Treatrise on Geomorphology, Volume 11: Aeolian Geomorphology; Shroder, J., Lancaster, N., Sherman, D.J., Baas, A.C.W., Eds.; Academic Press: San Diego, CA, USA, 2013; pp. 109–133. [Google Scholar]
- Houser, C.; Wernette, P.; Rentschlar, E.; Jones, H.; Hammond, B.; Trimble, S. Post-storm beach and dune recovery: Implications for barrier island resilience. Geomorphology 2015, 234, 54–63. [Google Scholar] [CrossRef]
- Psuty, N.P.; Silveira, T.M. Global climate change: An opportunity for coastal dunes? J. Coast. Conserv. 2010, 14, 153–160. [Google Scholar] [CrossRef]
- Seabloom, E.W.; Ruggiero, P.; Hacker, S.D.; Mull, J.; Zarnetske, P. Invasive grasses, climate change, and exposure to storm-wave overtopping in coastal dune ecosystems. Glob. Chang. Biol. 2013, 19, 824–832. [Google Scholar] [CrossRef] [PubMed]
- Martinez, M.L.; Hesp, P.A.; Gallego-Fernandez, J.B. Coastal dunes: Human impact and need for restoration. In Restoration of Coastal Dunes; Martinez, M.L., Gallego-Fernández, J.B., Hesp, P., Eds.; Springer: Berlin/Heidelberg, Germany, 2013; pp. 1–14. [Google Scholar]
- Nordstrom, K.F. Beaches and Dunes of Developed Coasts; Cambridge University Press: Cambrige, UK, 2000. [Google Scholar]
- Castelle, B.; Marieu, V.; Bujan, S.; Splinter, K.D.; Robinet, A.; Sénéchal, N.; Ferreira, S. Impact of the winter 2013–2014 series of severe Western Europe storms on a double-barred sandy coast: Beach and dune erosion and megacusp embayments. Geomorphology 2015, 238, 135–148. [Google Scholar] [CrossRef]
- Guisado-Pintado, E.; Jackson, D.W.T. Multi-scale variability of storm Ophelia 2017: The importance of synchronised environmental variables in coastal impact. Sci. Total Environ. 2018, 630, 287–301. [Google Scholar] [CrossRef] [PubMed]
- Thornton, E.B.; MacMahan, J.H.; Sallenger, A.H., Jr. Rip currents, mega-cusps, and eroding dunes. Mar. Geol. 2007, 240, 151–167. [Google Scholar] [CrossRef]
- Castelle, B.; Bujan, S.; Ferreira, S.; Dodet, G. Foredune morphological changes and beach recovery from the extreme 2013/2014 winter at a high-energy sandy coast. Mar. Geol. 2017, 385, 41–55. [Google Scholar] [CrossRef]
- Castelle, B.; Guillot, B.; Marieu, V.; Chaumillon, E.; Hanquiez, V.; Bujan, S.; Poppeschi, C. Spatial and temporal patterns of shoreline change of a 280-km long high-energy disrupted sandy coast from 1950 to 2014: SWFrance. Estuar. Coast. Shelf Sci. 2018, 200, 212–223. [Google Scholar] [CrossRef]
- Castelle, B.; Dodet, G.; Masselink, G.; Scott, T. A new climate index controlling winter wave activity along the Atlantic coast of Europe: The West Europe Pressure Anomaly. Geophys. Res. Lett. 2017, 44, 1384–1392. [Google Scholar] [CrossRef]
- Castelle, B.; Dodet, G.; Masselink, G.; Scott, T. Increased winter-mean wave height, variability, and periodicity in the northeast Atlantic over 1949–2017. Geophys. Res. Lett. 2018, 45, 3586–3596. [Google Scholar] [CrossRef]
- Masselink, G.; Castelle, B.; Scott, T.; Dodet, G.; Suanez, S.; Jackson, D.; Floc’h, F. Extreme wave activity during 2013/2014 winter and morphological impacts along the Atlantic coast of Europe. Geophys. Res. Lett. 2016, 43, 2135–2143. [Google Scholar] [CrossRef]
- Short, A.D.; Jackson, D.W.T. Beach morphodynamics. In Treatrise on Geomorphology, Volume 10, Coastal Geomorphology; Shroder, J., Lancaster, N., Sherman, D.J., Baas, A.C.W., Eds.; Academic Press: San Diego, CA, USA, 2013; pp. 106–129. [Google Scholar]
- Hesp, P.A. Foredunes and blowouts: Initiation, geomorphology and dynamics. Geomorphology 2002, 48, 245–268. [Google Scholar] [CrossRef]
- Barrère, P. Dynamics and management of the coastal dunes of the Landes, Gascony, France. In Coastal Dunes: Geomorphology, Ecology and Management for Conservation: Proceedings of the 3rd European Dune Congress Galway, Ireland, 17–21 June 1992; Carter, R.E.A., Ed.; A.A. Balkema: Rotterdam, The Netherlands, 1992; pp. 25–32. [Google Scholar]
- Favennec, J. Principes et évolutions de la gestion dunaire. In Les Rendez-vous Techniques de l’ONF n°17; Office National des Forêts: Paris, France, 2007; pp. 22–30. [Google Scholar]
- Martínez-Carricondo, P.; Agüera-Vega, F.; Carvajal-Ramírez, F.; Mesas-Carrascosa, F.J.; García-Ferrer, A.; Pérez-Porras, F.J. Assessment of UAV-photogrammetric mapping accuracy based on variation of ground control points. Int. J. Appl. Earth Obs. Geoinf. 2018, 72, 1–10. [Google Scholar] [CrossRef]
- Dodet, G.; Castelle, B.; Masselink, G.; Scott, T.; Davidson, M.; Floc’h, F.; Jackson, D.; Suanez, S. Beach recovery from extreme storm activity during the 2013–14 winter along the Atlantic coast of Europe. Earth Surf. Process. Landf. 2019, 44, 393–401. [Google Scholar] [CrossRef]
- Niederheiser, R.; MokroA, M.; Lange, J.; Petschko, H.; Prasicek, G.; Elberink, S. Deriving 3D point clouds from terrestrial photographs—Comparison of different sensors and software. Int. Arch. Photogramm. Remote Sens. Spat. Inf. Sci. ISPRS Arch. 2016, 41, 685–692. [Google Scholar] [CrossRef]
- Fiorillo, F.; Limongiello, M.; Fernández-Palacios, B.J. Testing GoPro for 3D model reconstruction in narrow spaces. Acta IMEKO 2016, 5, 64–70. [Google Scholar] [CrossRef]
- Aguilar, F.; Fernandez, I.; Casanova, J.; Ramos, F.; Aguilar, M.; Blanco, J.; Moreno, J. 3D coastal monitoring from very dense UAV-Based photogrammetric point clouds. Lect. Notes Mech. Eng. 2017, 280, 881–888. [Google Scholar]
- Laporte-Fauret, Q.; Castelle, B.; Michalet, R.; Marieu, V.; Rosebery, D.; Bujan, S.; Guillot, B. Suivis morphologiques et écologiques du système dunaire en réponse à la mise en place expérimentale de brèches: Truc Vert, Nouvelle-Aquitaine. In Proceedings of Journées Nationales Génie Côtier—Génie Civil, 15th La Rochelle ed.; Paralia CFL; A. Delanoë: Nantes, France, 2018; pp. 235–244. [Google Scholar] [CrossRef]
- DJI. Phantom 4 Disclaimer and Safety Guidelines, V1.2; DJI: Shenzhen, China, 2016. [Google Scholar]


| Number of GCP | RMS_Z Error (m) | Bias_Z (m) | ||
|---|---|---|---|---|
| DP2 | DP4P | DP2 | DP4P | |
| 3 | 0.67 | 1.44 | −0.65 | −1.41 |
| 4 | 0.50 | 1.12 | −0.49 | −1.10 |
| 5 | 0.14 | 0.05 | −0.11 | −0.03 |
| 6 | 0.14 | 0.05 | −0.10 | −0.03 |
| 7 | 0.14 | 0.05 | −0.09 | −0.03 |
| 8 | 0.15 | 0.05 | −0.11 | −0.02 |
| 9 | 0.15 | 0.05 | −0.11 | −0.02 |
| 10 | 0.13 | 0.05 | −0.10 | −0.02 |
© 2019 by the authors. Licensee MDPI, Basel, Switzerland. This article is an open access article distributed under the terms and conditions of the Creative Commons Attribution (CC BY) license (http://creativecommons.org/licenses/by/4.0/).
Share and Cite
Laporte-Fauret, Q.; Marieu, V.; Castelle, B.; Michalet, R.; Bujan, S.; Rosebery, D. Low-Cost UAV for High-Resolution and Large-Scale Coastal Dune Change Monitoring Using Photogrammetry. J. Mar. Sci. Eng. 2019, 7, 63. https://doi.org/10.3390/jmse7030063
Laporte-Fauret Q, Marieu V, Castelle B, Michalet R, Bujan S, Rosebery D. Low-Cost UAV for High-Resolution and Large-Scale Coastal Dune Change Monitoring Using Photogrammetry. Journal of Marine Science and Engineering. 2019; 7(3):63. https://doi.org/10.3390/jmse7030063
Chicago/Turabian StyleLaporte-Fauret, Quentin, Vincent Marieu, Bruno Castelle, Richard Michalet, Stéphane Bujan, and David Rosebery. 2019. "Low-Cost UAV for High-Resolution and Large-Scale Coastal Dune Change Monitoring Using Photogrammetry" Journal of Marine Science and Engineering 7, no. 3: 63. https://doi.org/10.3390/jmse7030063