1. Introduction
The development of installations aimed to exploit marine energy has been subjected to an increasing interest in the recent years, since it represents a way to face the growing energy demand, limit the emissions and promote adaptations to climate change [
1,
2,
3,
4,
5,
6]. Furthermore, farms composed of wave energy converters are shown to be effective against erosion and flooding, supporting the protection of the coastal area as demonstrated by Rodrigo-Delgado and Bergillos’ studies [
7,
8,
9,
10].
The ocean can provide a vast amount of energy [
11]. Indeed, the wave energy power is enormous and more reliable than other renewable resources, such as solar and wind energy, due to its density (2–3 kW/m
2) that is greater (wind: 0.4–0.6 kW/m
2; solar: 0.1–0.2 kW/m
2) [
12]. However, the marine technologies, the Wave Energy Converters (WECs) among others, are still at immature stages to be commercialized successfully in the market [
13,
14]. Despite this, more than 1000 WECs have been developed worldwide and more than 140 are patented [
15].
The main obstacle which limits the growth of this energy sector is strictly related to the design reliability and economic feasibility of these installations. To overcome technological barriers and minimize conflict of uses, the European Commision initiative “Oceans of Tomorrow” aimed at the development of multipurpose offshore areas, leading to the three FP7 funded projects: TROPOS [
16], MERMAID [
17] and H2OCEAN [
18]. These projects analyzed the possibility to combine marine renewable energy with aquaculture, maritime transport and leisure activities. The purposes of such multifunctional solutions [
19,
20] are to (i) promote the use of resource diversity (wind, wave and tide), so that the variability of the available power can be reduced [
21]; (ii) develop technical synergies, minimising environmental impacts and obtaining economic benefits [
22]; and (iii) lower the system integration costs and facilitate the licensing issues [
23].
Offshore installations maximize the energy harvesting, but their distance from the shore affects the amount and the costs of energy transfers. Therefore, attractive solutions may be on-shore WECs integrated in coastal or harbor structures. The research on this topic focused on the development of Oscillating Water Column devices (OWC), a.o. the REWEC3 [
24] installed in the Civitavecchia harbor (Italy), the PICO [
25], the LIMPET [
26] and the MUTRIKU [
27] power plants. The need to use a different principle of exploitation and several issues related to some of these installations, such as the acoustic pollution for the MUTRIKU case [
28], brought the attention to the overtopping devices as the Sea-wave Slot-cone Generator [
29], which however was economically unfeasible due to the complex geometry of the reservoir.
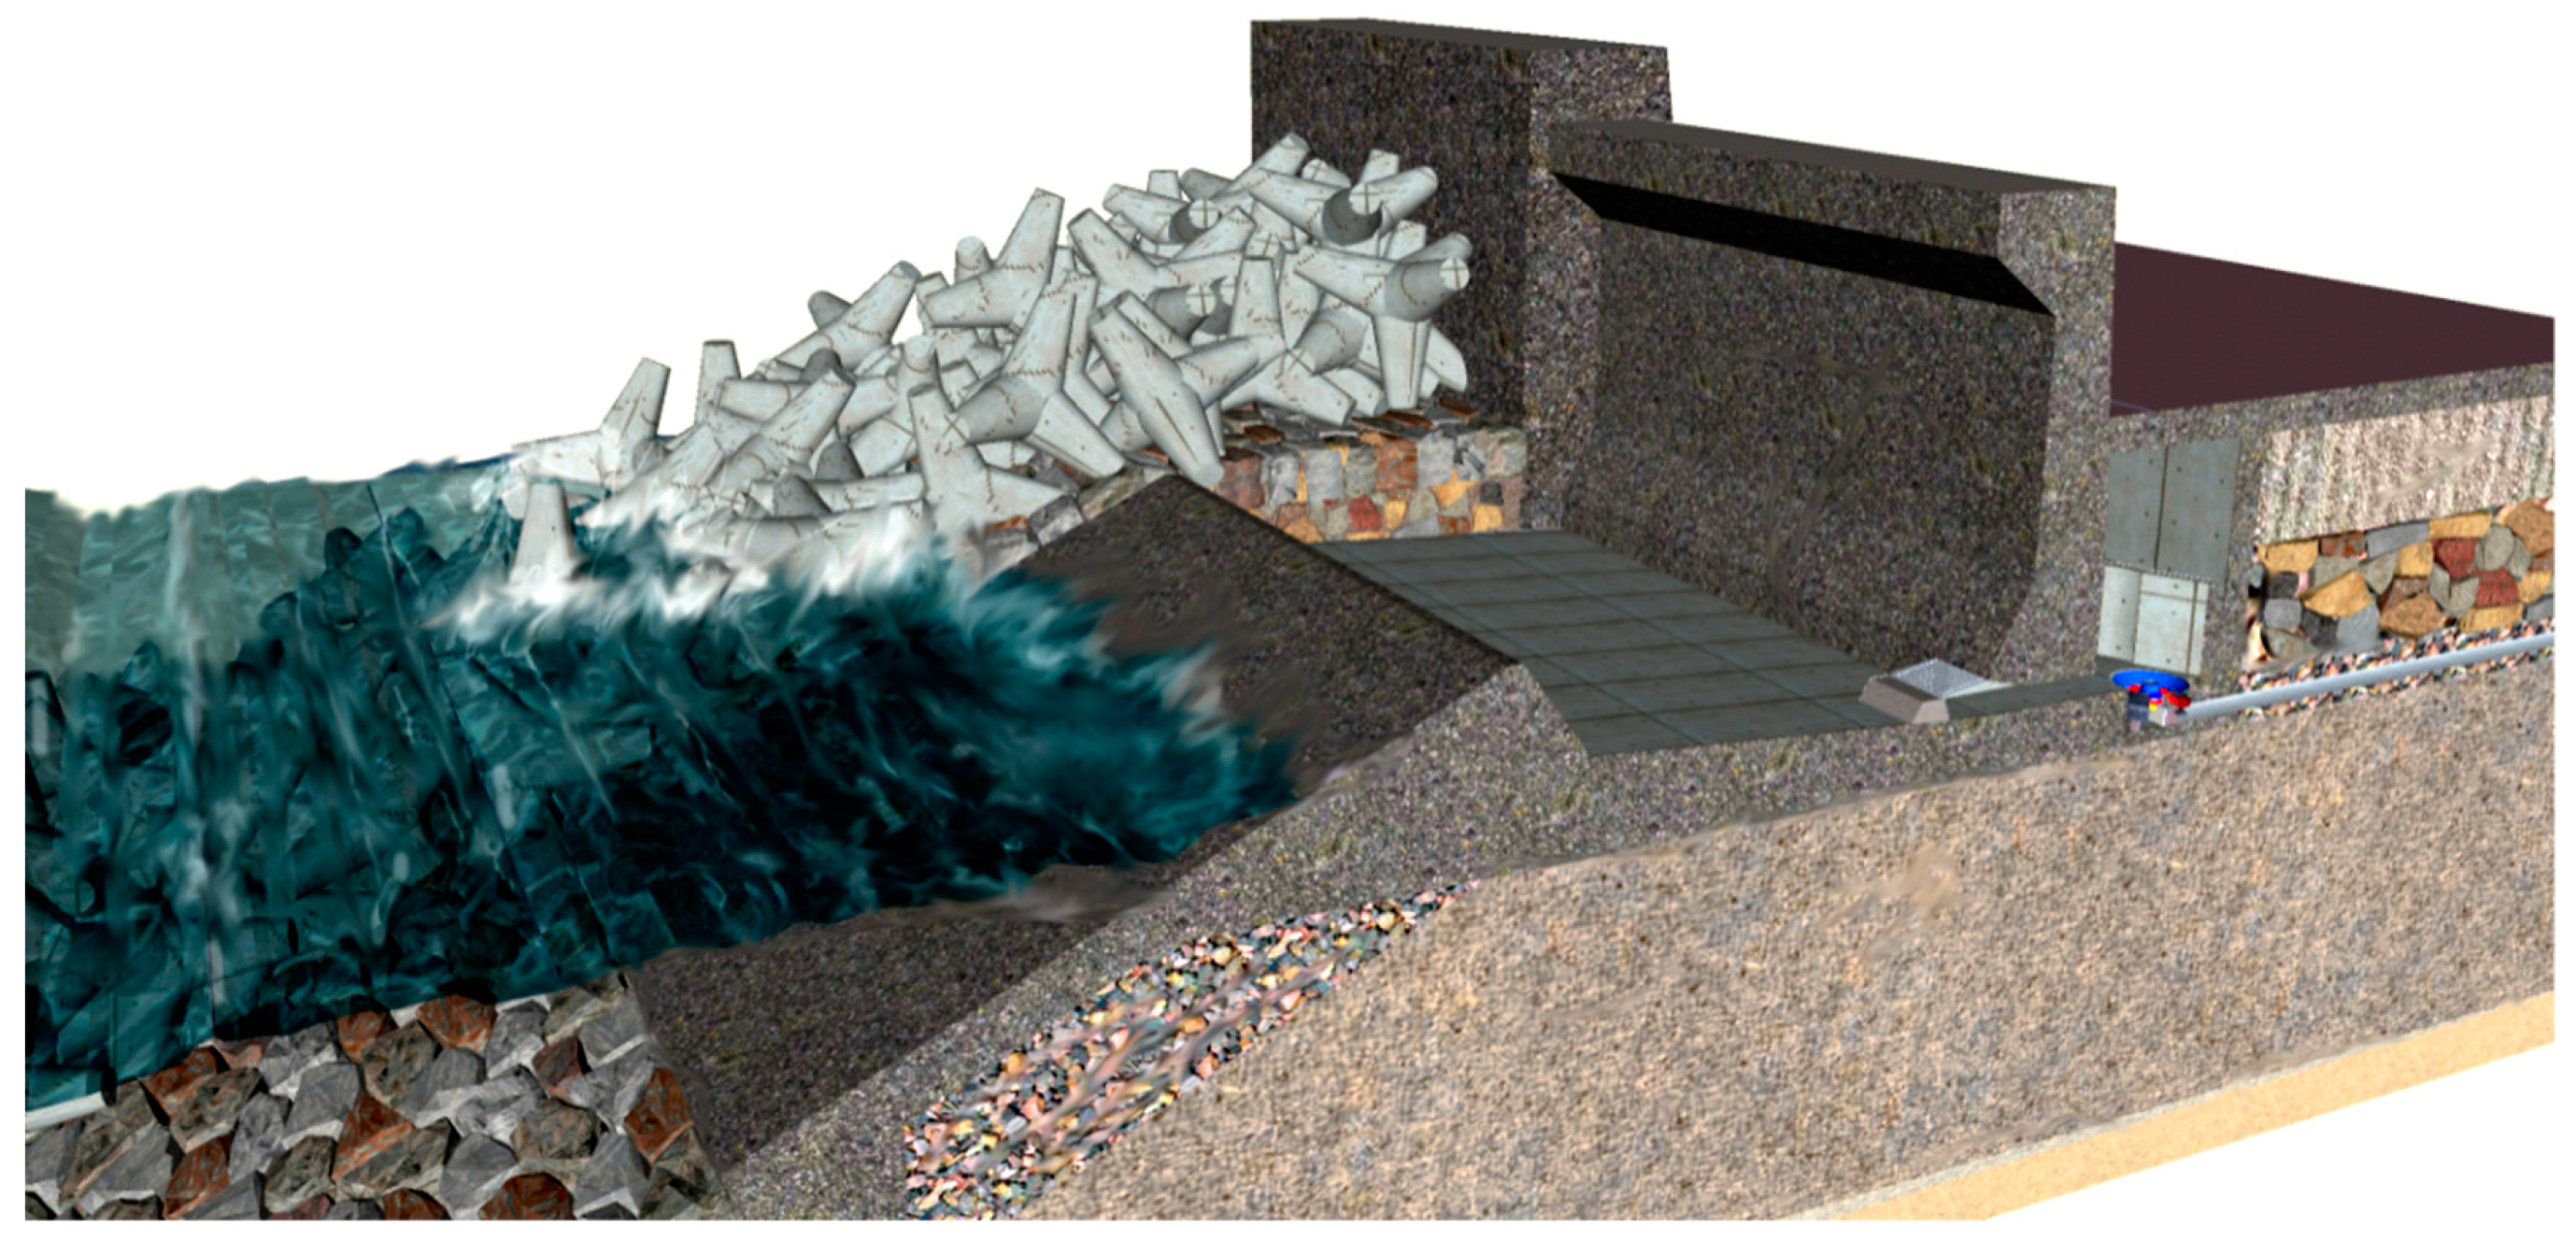
In this context, an innovative solution was developed by the University of Campania “Luigi Vanvitelli”: The Overtopping Breakwater for the Energy Conversion, OBREC hereinafter [
30] (
Figure 1). It is a rubble mound breakwater for harbor protection including a top-front reservoir that captures the overtopped water to produce electricity by using the difference in water levels between the reservoir and the mean sea water level. The energy is then extracted via low head turbines, installed inside the wave chamber located at the rear side of the crown wall.
The OBREC has been studied already during some experimental campaigns [
30,
31,
32] and has been recently installed in the Port of Naples in September 2015 [
33]. The 2 laboratory campaigns were aimed (i) to analyse the device by comparing it with a traditional rubble mound breakwater and (ii) to evaluate its hydraulic and structural performance under ordinary and extreme conditions.
The purpose of this paper is to extend the experimental database, providing a greater understanding of the structure response by analyzing the effects of some fundamental geometrical parameters on the OBREC performance in terms of energy production, structural stability and harbor safety. This assessment has been carried out by means of 2DV numerical modelling, i.e., IH2-VOF. The results of the experimental campaigns have been used to calibrate the model. The original laboratory OBREC cross section has been then modified to perform a sensitivity analysis under ordinary and extreme conditions.
The paper structure is as follows.
Section 2 describes the experimental and numerical set-up, including the wave flume characteristics, the data collection and the results of the calibration.
Section 3 presents the sensitivity analysis performed by varying some geometrical parameters of the OBREC cross section. This analysis is divided into 3 main parts addressing (1) the OBREC hydraulic performance by analyzing the reflection coefficient
Kr and the average overtopping flow inside the reservoir
qreservoir; (2) the structural performance in terms of pressures acting on the device; and (3) the harbor safety by measuring the average overtopping flow at the rear side of the rear wall
qrear.
Section 4 discusses the results obtained with reference to the OBREC pilot plant installed in the port of Naples in 2017. Some conclusions and recommendations on the OBREC design optimizations are drawn in
Section 5.
2. Material and Methods
This section presents the set-up of the numerical model based on the experiments performed by Vicinanza [
30] at Aalborg University in Denmark. The numerical simulations have been carried out by means of the IH-2VOF single phase code, a 2DV Rans-VOF code developed by the University of Cantabria [
34] and already widely adopted for design purposes of the coastal and harbor structures. The OBREC cross section (
Section 2.1), the wave flume and the mesh characteristics (
Section 2.2), the tested wave conditions and the position of the gauges (
Section 2.3), and the results of the model calibration (
Section 2.4) are presented and discussed.
2.1. The Overtopping Breakwater for the Energy Conversion Cross Section
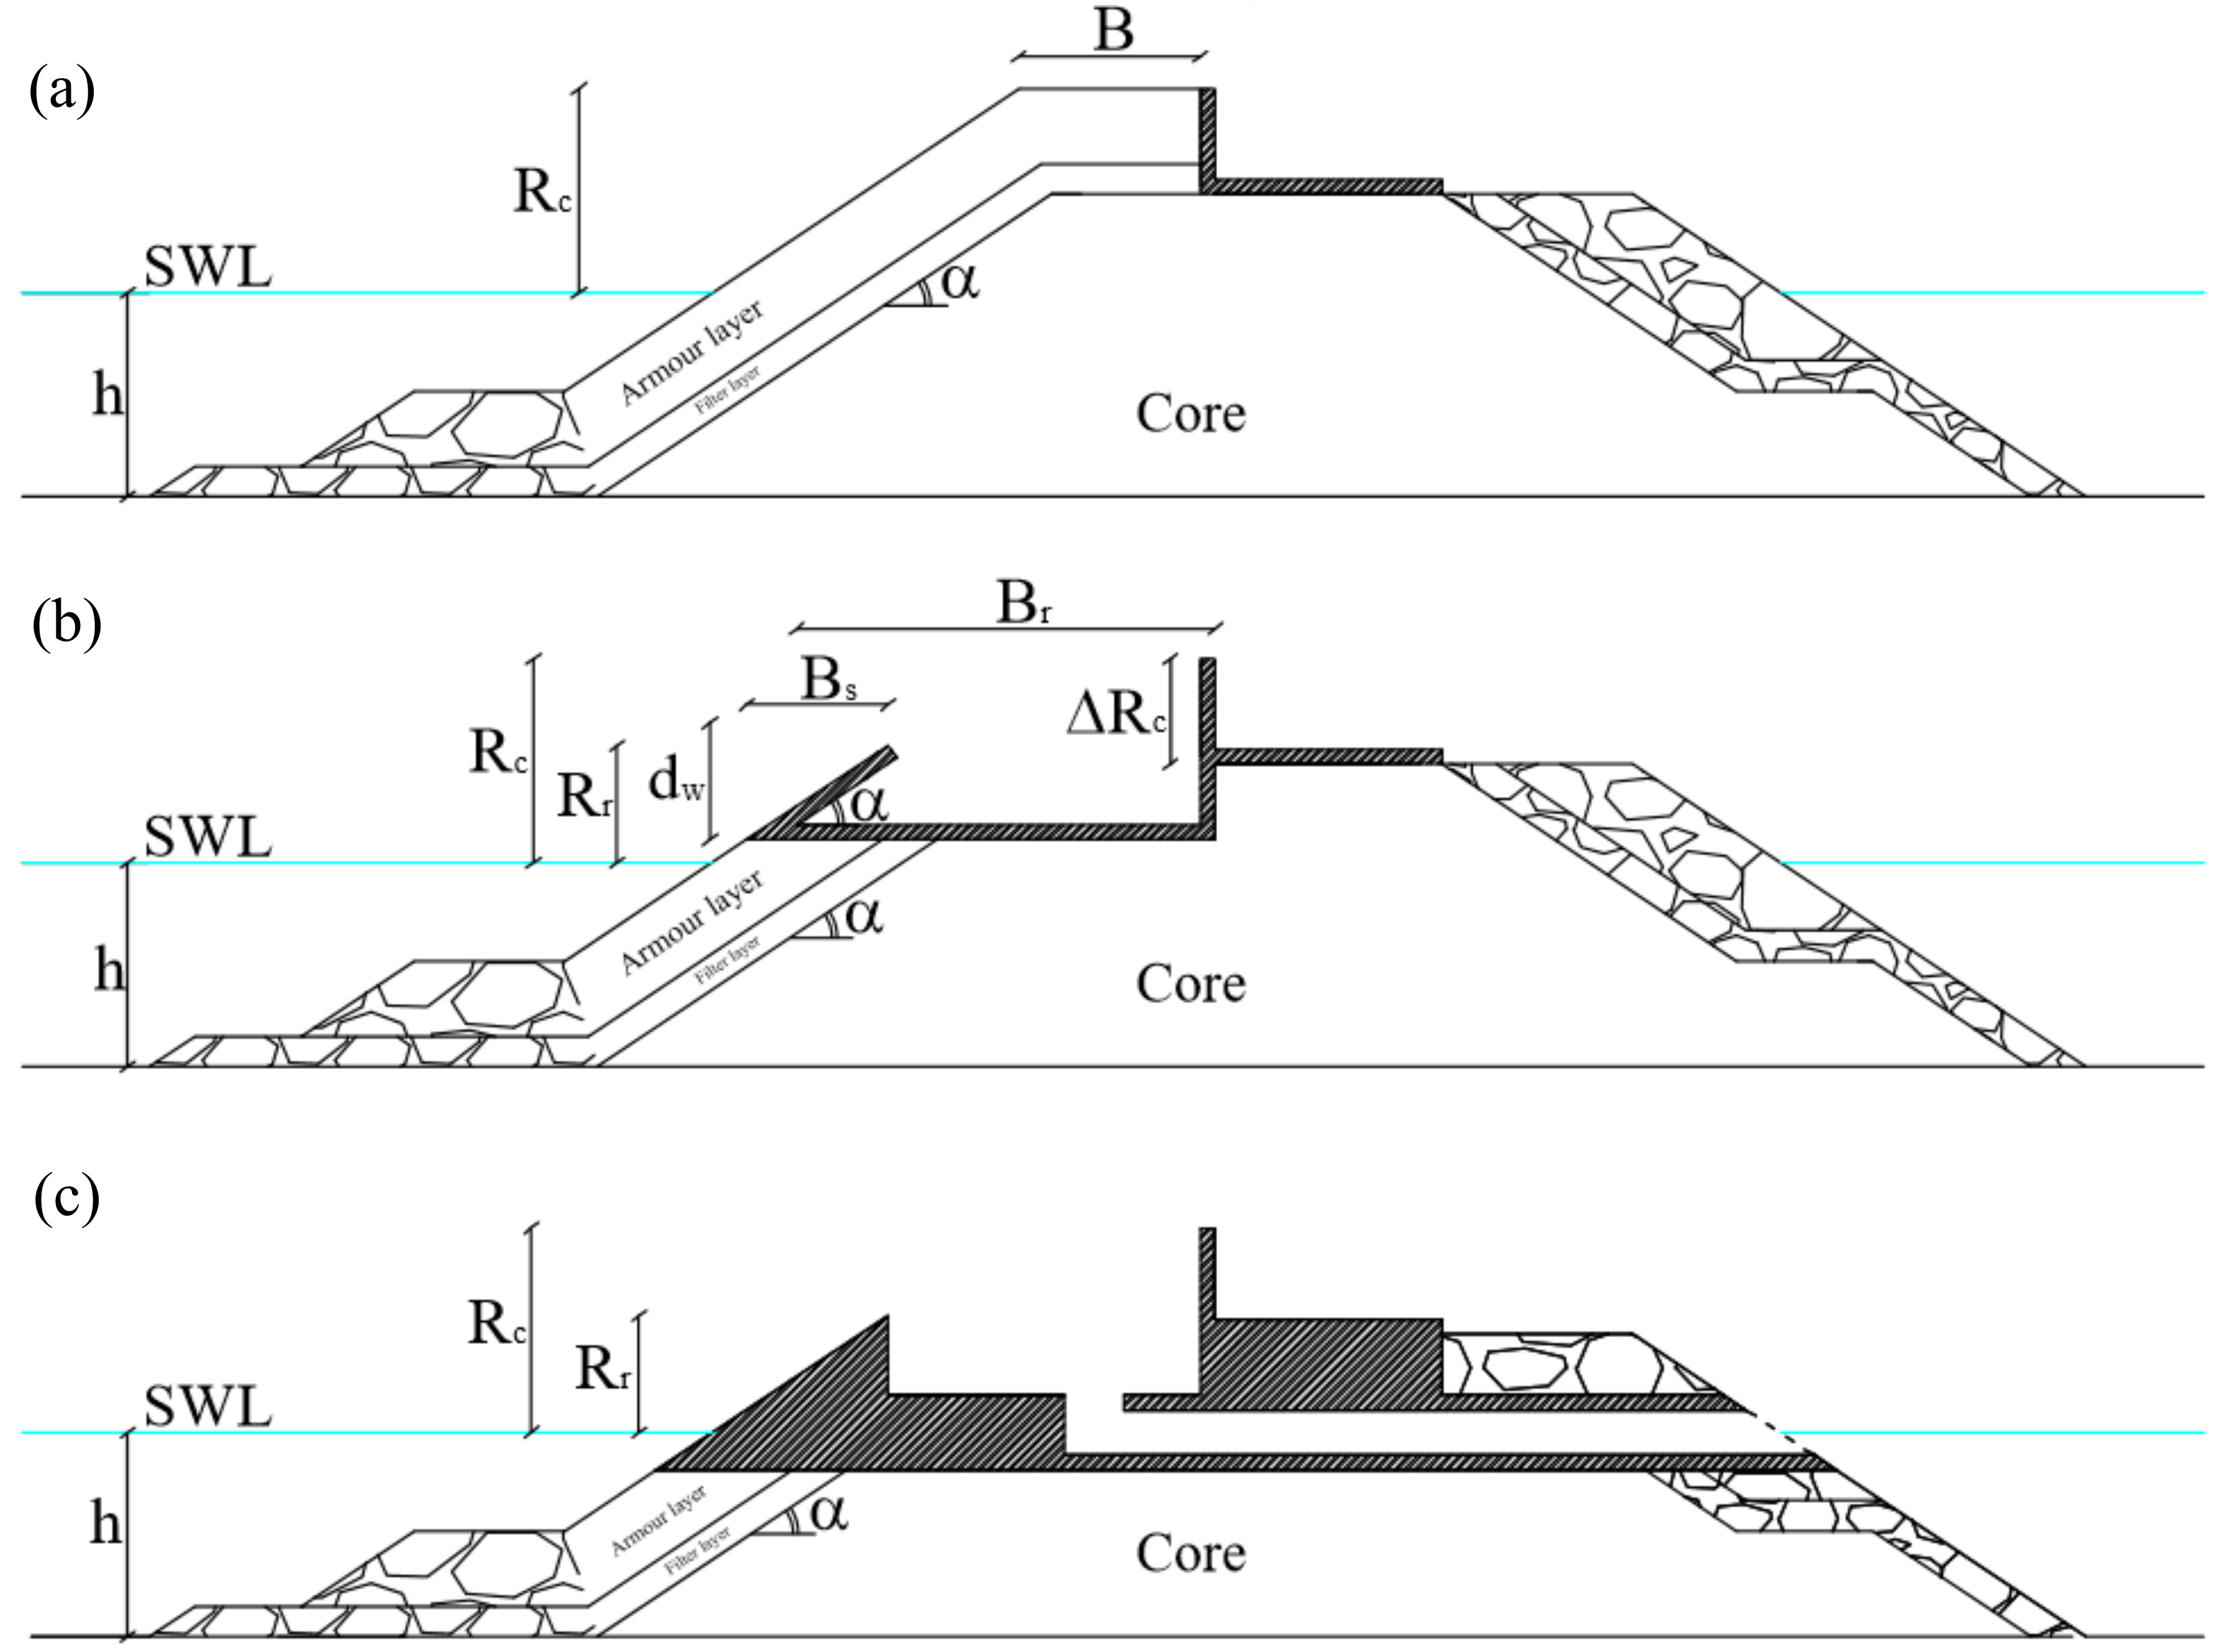
The idea behind the OBREC device implies the modification of a traditional rubble mound breakwater (
Figure 2a), where the crest and the upright section are replaced by a concrete reservoir.
Figure 2b shows the main OBREC geometric parameters, where
Br is the reservoir width,
Bs the horizontal extension of the sloping plate, α its inclination (equals to 34° in the physical model),
dw is the height of the sloping plate and
Rr and
Rc are the freeboard crests (with respect to the mean sea water level) of the sloping plate and of the rear wall, respectively.
The 2012 campaign involved the testing of two configurations of the OBREC cross section, characterized by a different height of the sloping plate: dw,low = 2.25 m and dw,high = 3.75 m at prototype scale. In this paper, the numerical model is calibrated considering only the dw,high configuration.
To guarantee the numerical stability of the simulations and the correct representation of the physical processes, the cross section in the numerical model was slightly modified as follows.
During the experiments, the water was pumped out from the reservoir by means of external pipes, which were insufficient to avoid the saturation of the reservoir during the extreme tests (see
Section 2.3). The numerical cross section was modified by including an internal pipe from the reservoir bottom to the structure inshore slope to allow the water to freely flow into the reservoir and the testing of the potential energy production during operating conditions.
The thickness of the OBREC slab foundation was slightly increased (see
Figure 2c) to avoid numerical instabilities induced by the limited thickness of the impermeable layer over the permeable structure in the run-up/down area, i.e., in an area characterized by very frequent changes of wet/dry conditions.
The differences between the experimental and the numerical cross sections affect the reflection phenomenon because in the latter case, the thickness of the impermeable part has been increased. However, this does not affect the overtopping phenomenon as shown by the results of the calibration, i.e.,
Section 2.4.
The breakwater used during the experiments, in which OBREC has been introduced, is composed of a rock armour, a filter layer and a core. The average size of the rocks are
Dn50 = 40 mm for the armour layer,
Dn50 = 20 mm for the filter layer and
Dn50 = 2 mm for the core. In the numerical model, the aforementioned porous layers are characterized by several parameters as the porosity itself
n, the added mass coefficient
cA, the linear
α and non-linear
β friction coefficients. These last two parameters describe respectively the laminar and the turbulent flow properties in between the stones by means of the Forchheimer equation [
35], defined as
where
In Equations (1)–(3),
uf is the porous flow velocity averaged over the total sample area (grains),
g the gravitational acceleration and
υ the fluid kinematic viscosity. In Equation (1), the third term on the right-hand side is usually small and therefore neglected. The
β coefficient has been set equal to 1000, while
α was set to 1.1, 1.0 and 0.8 for the armour, the filter and the core layers, respectively. These values have been defined based on the literature [
36,
37,
38].
The model calibration has been performed by varying the porosity values and by keeping constant all the other parameters (see
Section 2.4) to optimize the representation of the hydraulic performance of the device.
2.2. Wave Conditions and Measurements
The 2012 experimental campaign involved 48 tests under normal and extreme conditions. The irregular wave series have been generated based on the three JONSWAP spectrum parameters: the wave height Hm0, the peak frequency fp and the so-called peak enhancement factor γ (3.3 in all the tests). The wave series considered at least 1000 waves.
The numerical simulations have been carried out by defining
Hm0, γ, the spectral wave period
Tm−1,0, the water depth in the generation area
h and the duration of the simulation t. The simulation program was divided into two test series, “normal” (representing poor and mild wave climate) and “extreme” (representative of a severe storm condition).
Table 1 contains the characteristics of both the normal and extreme wave conditions. Each numerical test considers at least 500 waves, which are sufficient to perform a statistical wave overtopping analysis as demonstrated by Romano [
39].
All the normal wave conditions—except for the one characterized by the smallest wave height Hm0 (0.077 m)—are characterized by the same Hm0 but different spectral wave periods Tm−1,0. Therefore, the tests chosen allowed the analysis of the hydraulic performance according to the wave steepness so.
Several wave gauges (WGs) have been installed inside the numerical channel to evaluate
the reflection coefficient Kr, in normal conditions;
the average overtopping discharge inside the reservoir qreservoir, in normal conditions;
the pressures p acting on the structure, under extreme conditions;
the average overtopping discharge at the rear side of the crown wall qrear, under extreme conditions.
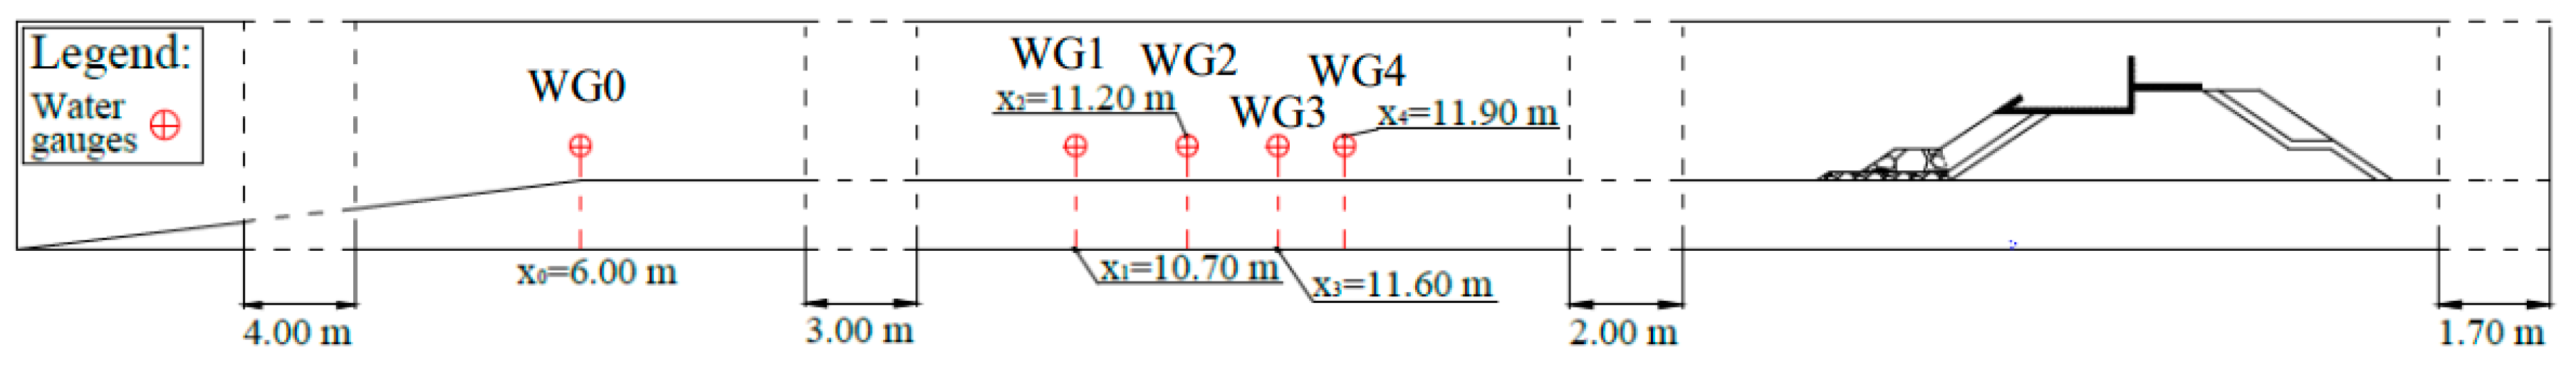
A 3-point method [
40] has been applied to derive the reflection coefficient
Kr, by using WG1, WG2 and WG3 in
Figure 3, located in front of the structure. The offshore wave gauge, WG0, has been used to measure the generated wave height.
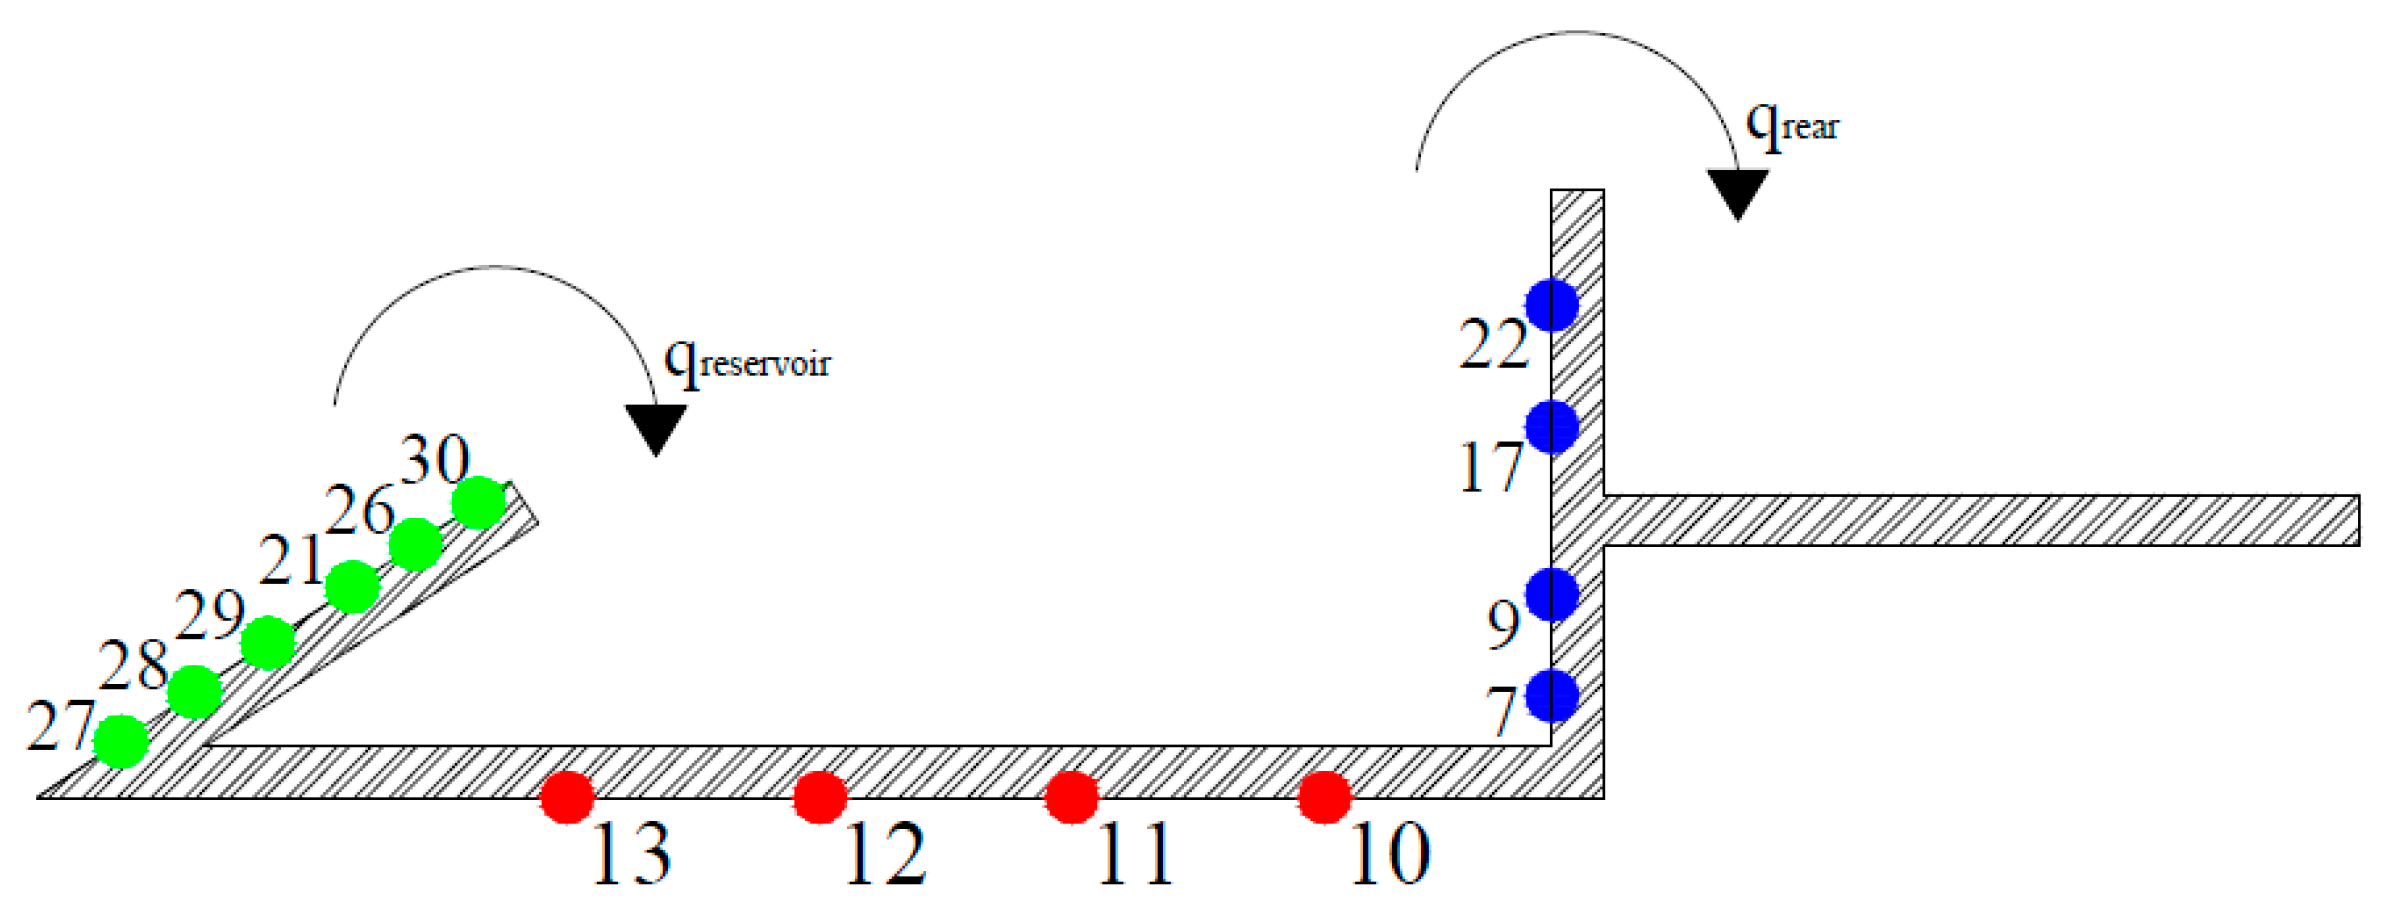
The numerical pressure transducers have been placed along the structure in the same position as in the laboratory experiments (
Figure 4). The sensors 13, 12, 11 and 10, during the experiments, have been used to evaluate the uplift pressures, while in the numerical simulations, also the downward ones.
The average overtopping discharges at the rear side of the OBREC (
qrear) was determined in the lab by using a ramp to guide the overtopping wave volumes into a box. A depth gauge was installed in the box to measure the overtopping discharge and to control the pump to empty the box at a given threshold level. Similarly, the overtopping discharge in the front reservoir (
qreservoir) was measured using depth gauges, which controlled several pumps. The 2-D model has been provided with a pipe to let the overtopping water flows towards the inshore edge, and two WGs were placed on the top of the sloping plate and at the rear side of the rear wall to estimate respectively the values of
qreservoir and
qrear (
Figure 4). The overtopping discharges have been derived by integrating (along the vertical) cell by cell the horizontal velocity component multiplied by the cell height (i.e., z direction).
2.3. Numerical Wave Flume and Mesh
The wave flume has been reproduced in the numerical model at the model scale. The flume is 20 m long with a 1:20 slope for the first 6 m that is followed by a horizontal bottom. Such a foreshore has been introduced to guarantee the wave generation in intermediate water depths.
The mesh for the numerical domain has been divided into three zones along the flume (in the x direction) and one along the vertical (in the z direction). The extension and the resolution of these zones depend on the position of the structure. The characteristics of the computational grid have been defined to ensure a good compromise between the accuracy of the results and the computational cost. The first zone corresponds to the wave generation and transformation along the foreshore, while the third one is inshore the structure. They are 16.05 and 2.51 m long, respectively, and both of them have been provided with a grading mesh more refined close to the structure, with a minimum cell size of 1 cm. The central zone, 1.44 m long, consider the run-up/down area over the structure, where the run-up/down and the overtopping occurs. Therefore, it has been provided with a regular grid, according to the tested wave characteristics, with a minimum cell size of 1 × 1 cm, avoiding discontinuities along the computational grid.
2.4. Calibration of the 2-D Numerical Model
Following Palma [
41], the calibration of the 2-D numerical model has been performed considering, at the same time, the representation of
Kr and
qreservoir under normal conditions. This procedure implied the variation of the porosity
n assigned to the layers of the breakwater, under the same wave attack.
Table 2 reports the values assigned to each layer together with the comparison between the experimental
qres,exp and the numerical
qres,num discharge flows. The final
n has been defined according to the best agreement, i.e., configuration 2 in
Table 2.
The 2-D numerical model has been tested then under all the normal wave conditions, already presented in
Table 1, to determine
Kr,
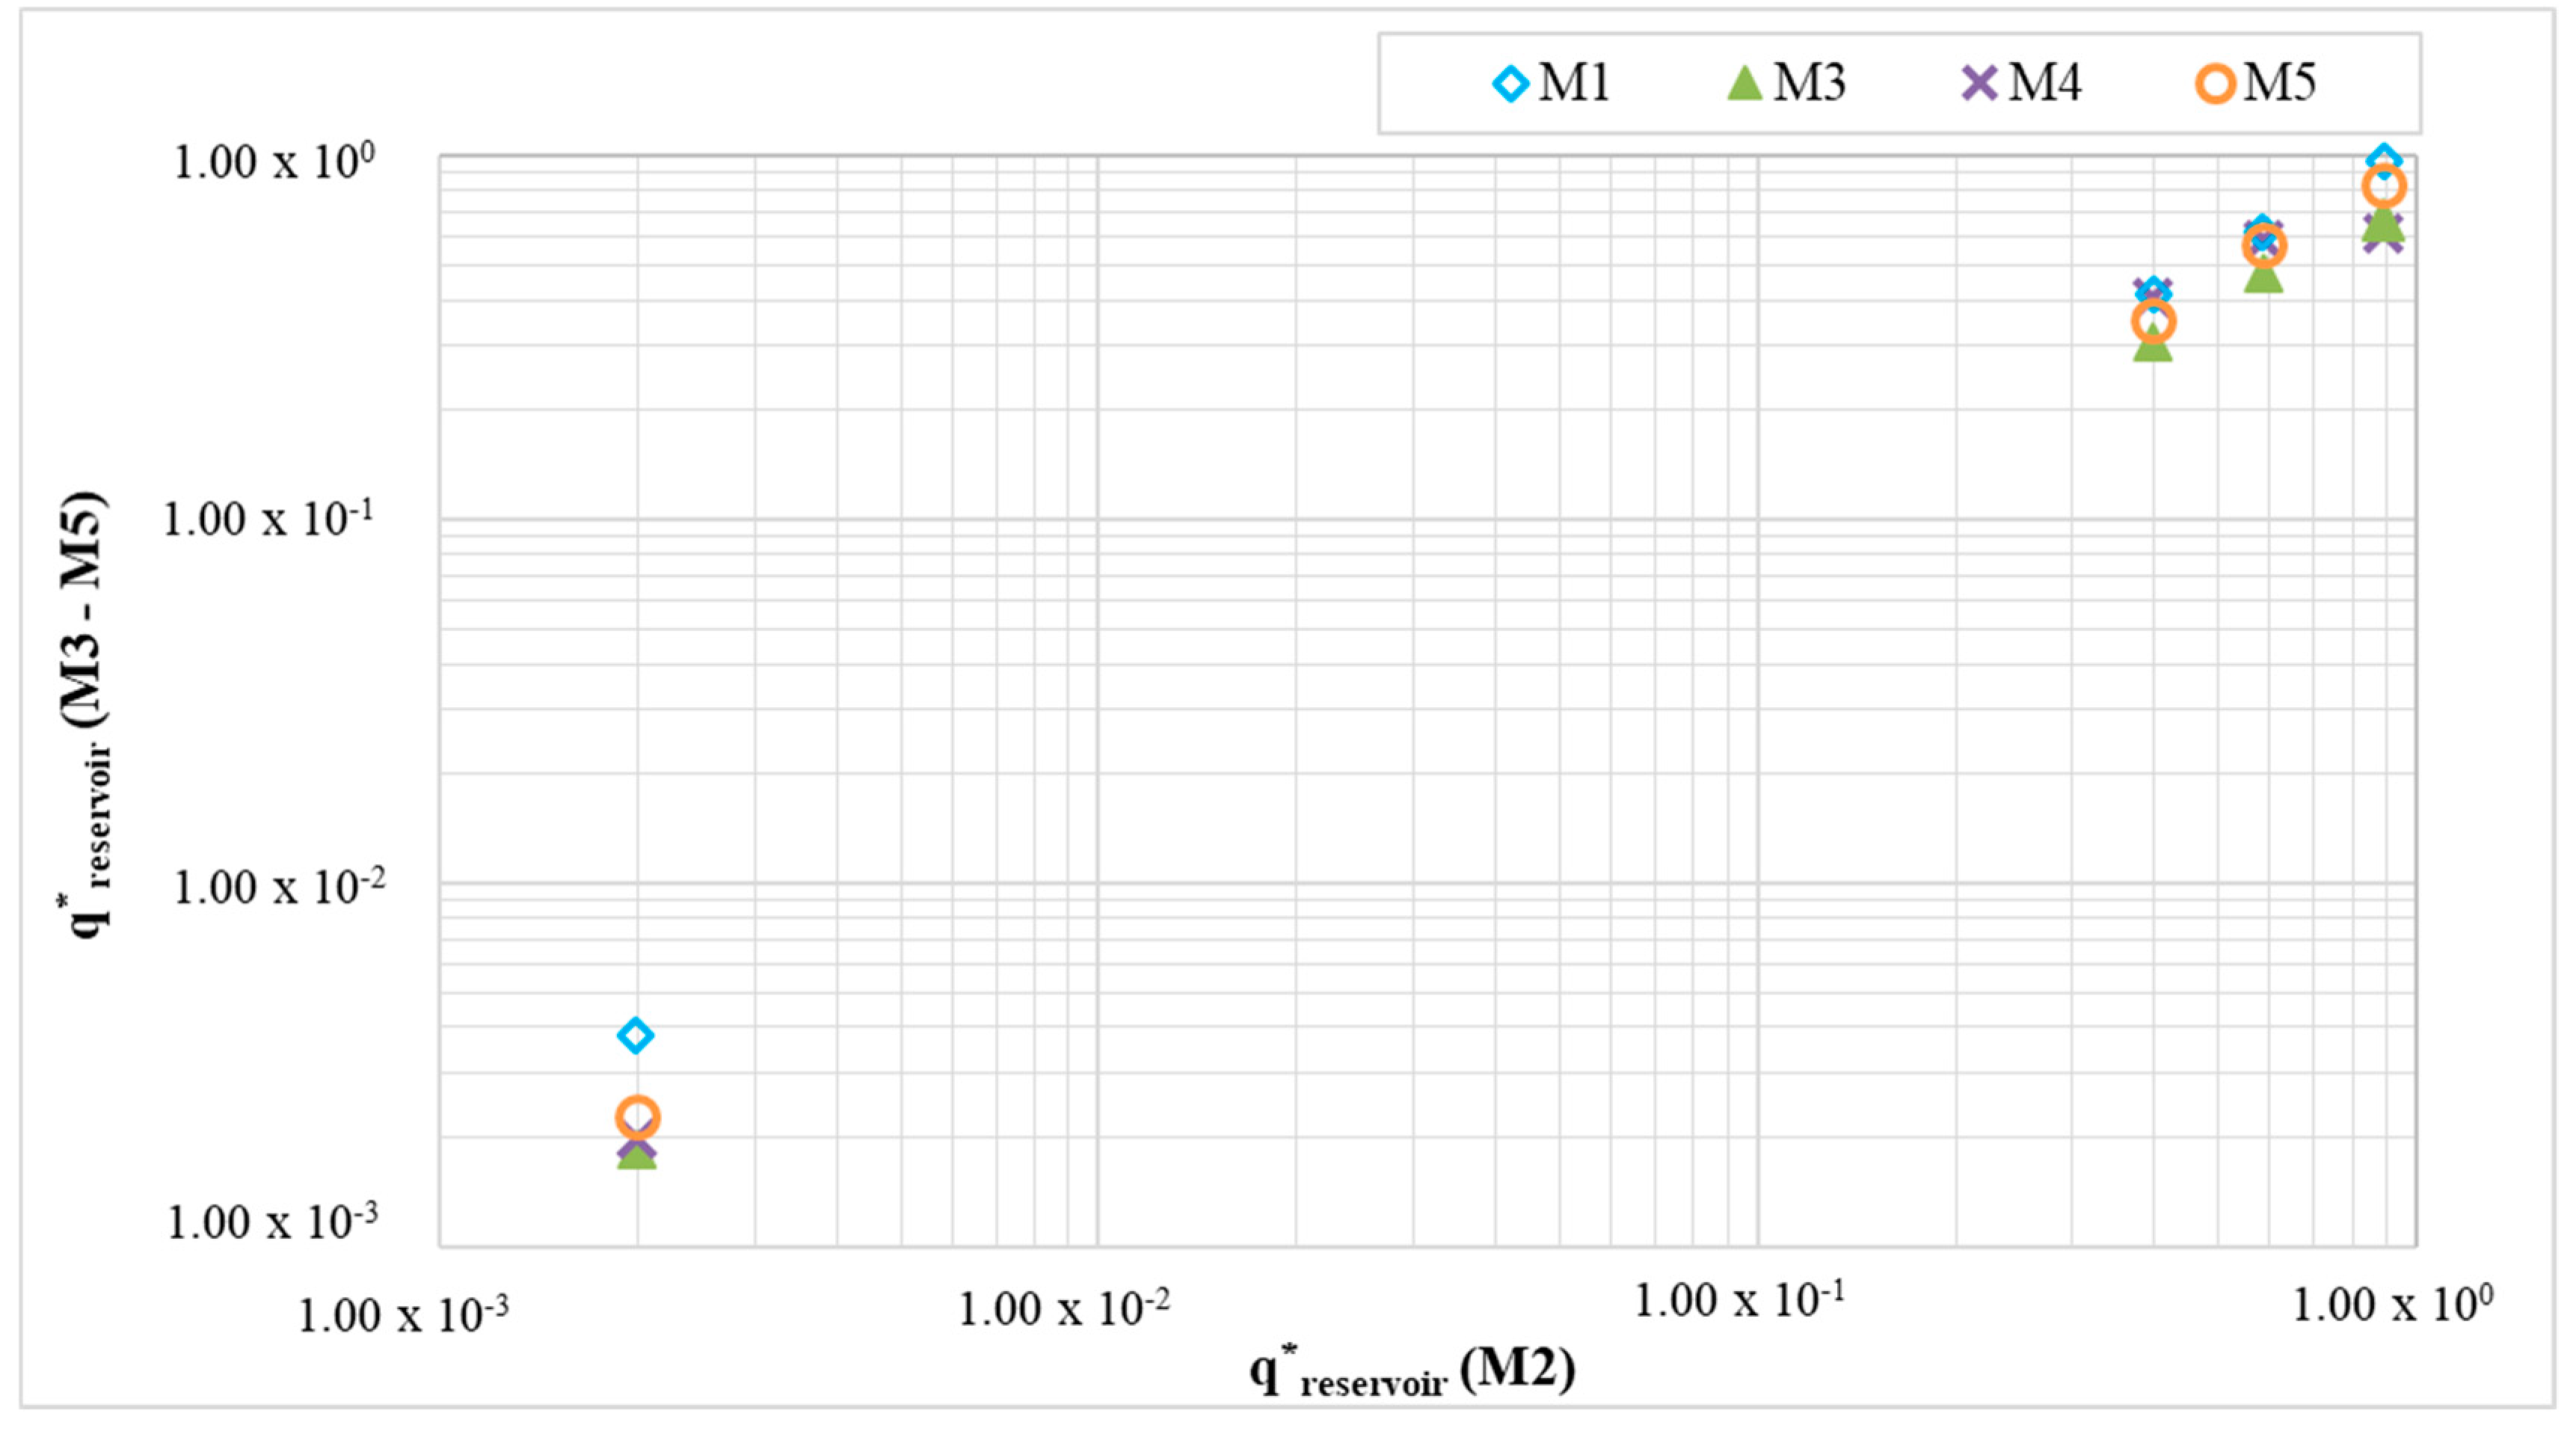
qreservoir and therefore the reliability of the numerical model. In order to compare the numerical
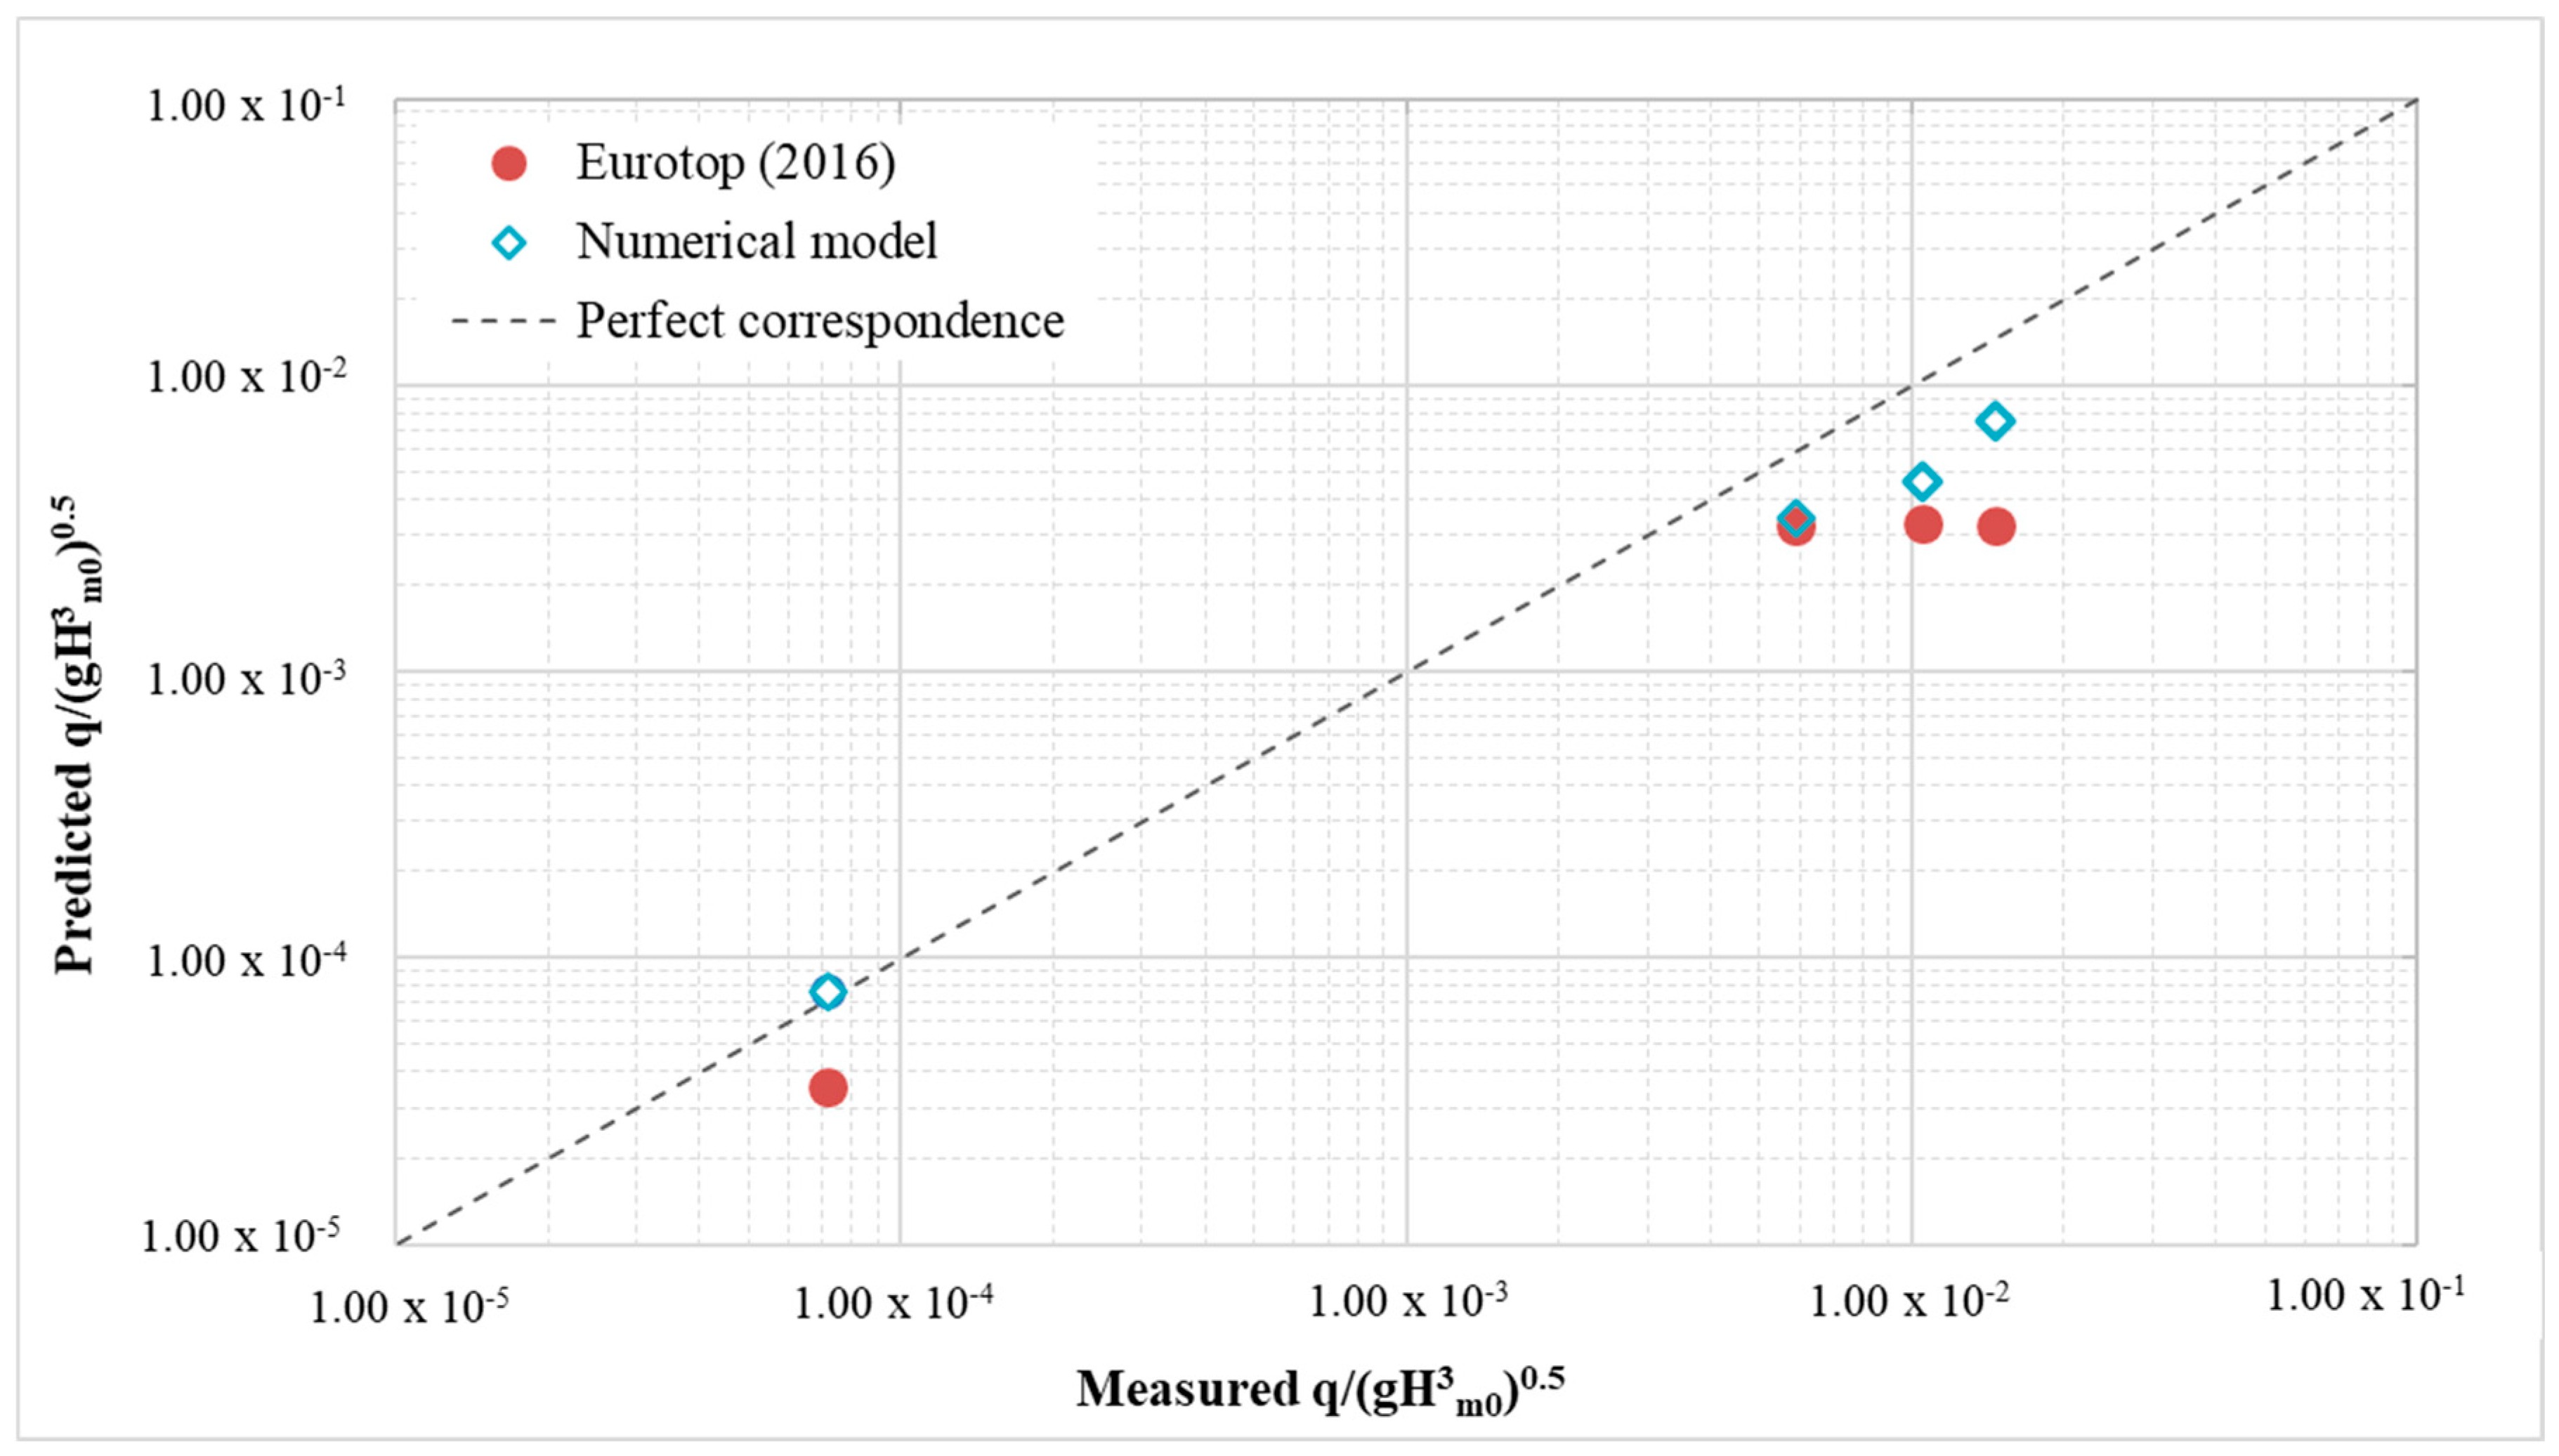
qreservoir with the experimental values and the theoretical formulations, they have been non-dimensionalised. Furthermore, by following the definition proposed by Ahrens and Heimbaugh (1986, Equation (4)) [
42], it has been possible to take into account the difference between the wave spectra generated in the lab and in the numerical wave channel, thanks to the presence of the significant wave height
Hm0 in Equation (4). The theoretical formulae considered to evaluate the overtopping discharge are reported in Equations (5) and (6) and correspond to those adopted in the EurOtop 2016 [
43] to assess the same phenomenon on the slopes such as dikes, levees and embankments.
with a maximum of
In Equations (5) and (6), αoff is the offshore slope angle, while γb is the berm influence factor, γf is the roughness influence factor, γβ is the oblique wave action influence factor, γν is the influence factor for a vertical wall, ξm−1,0 is the breaker parameter and Rr is the freeboard crest of the sloping plate.
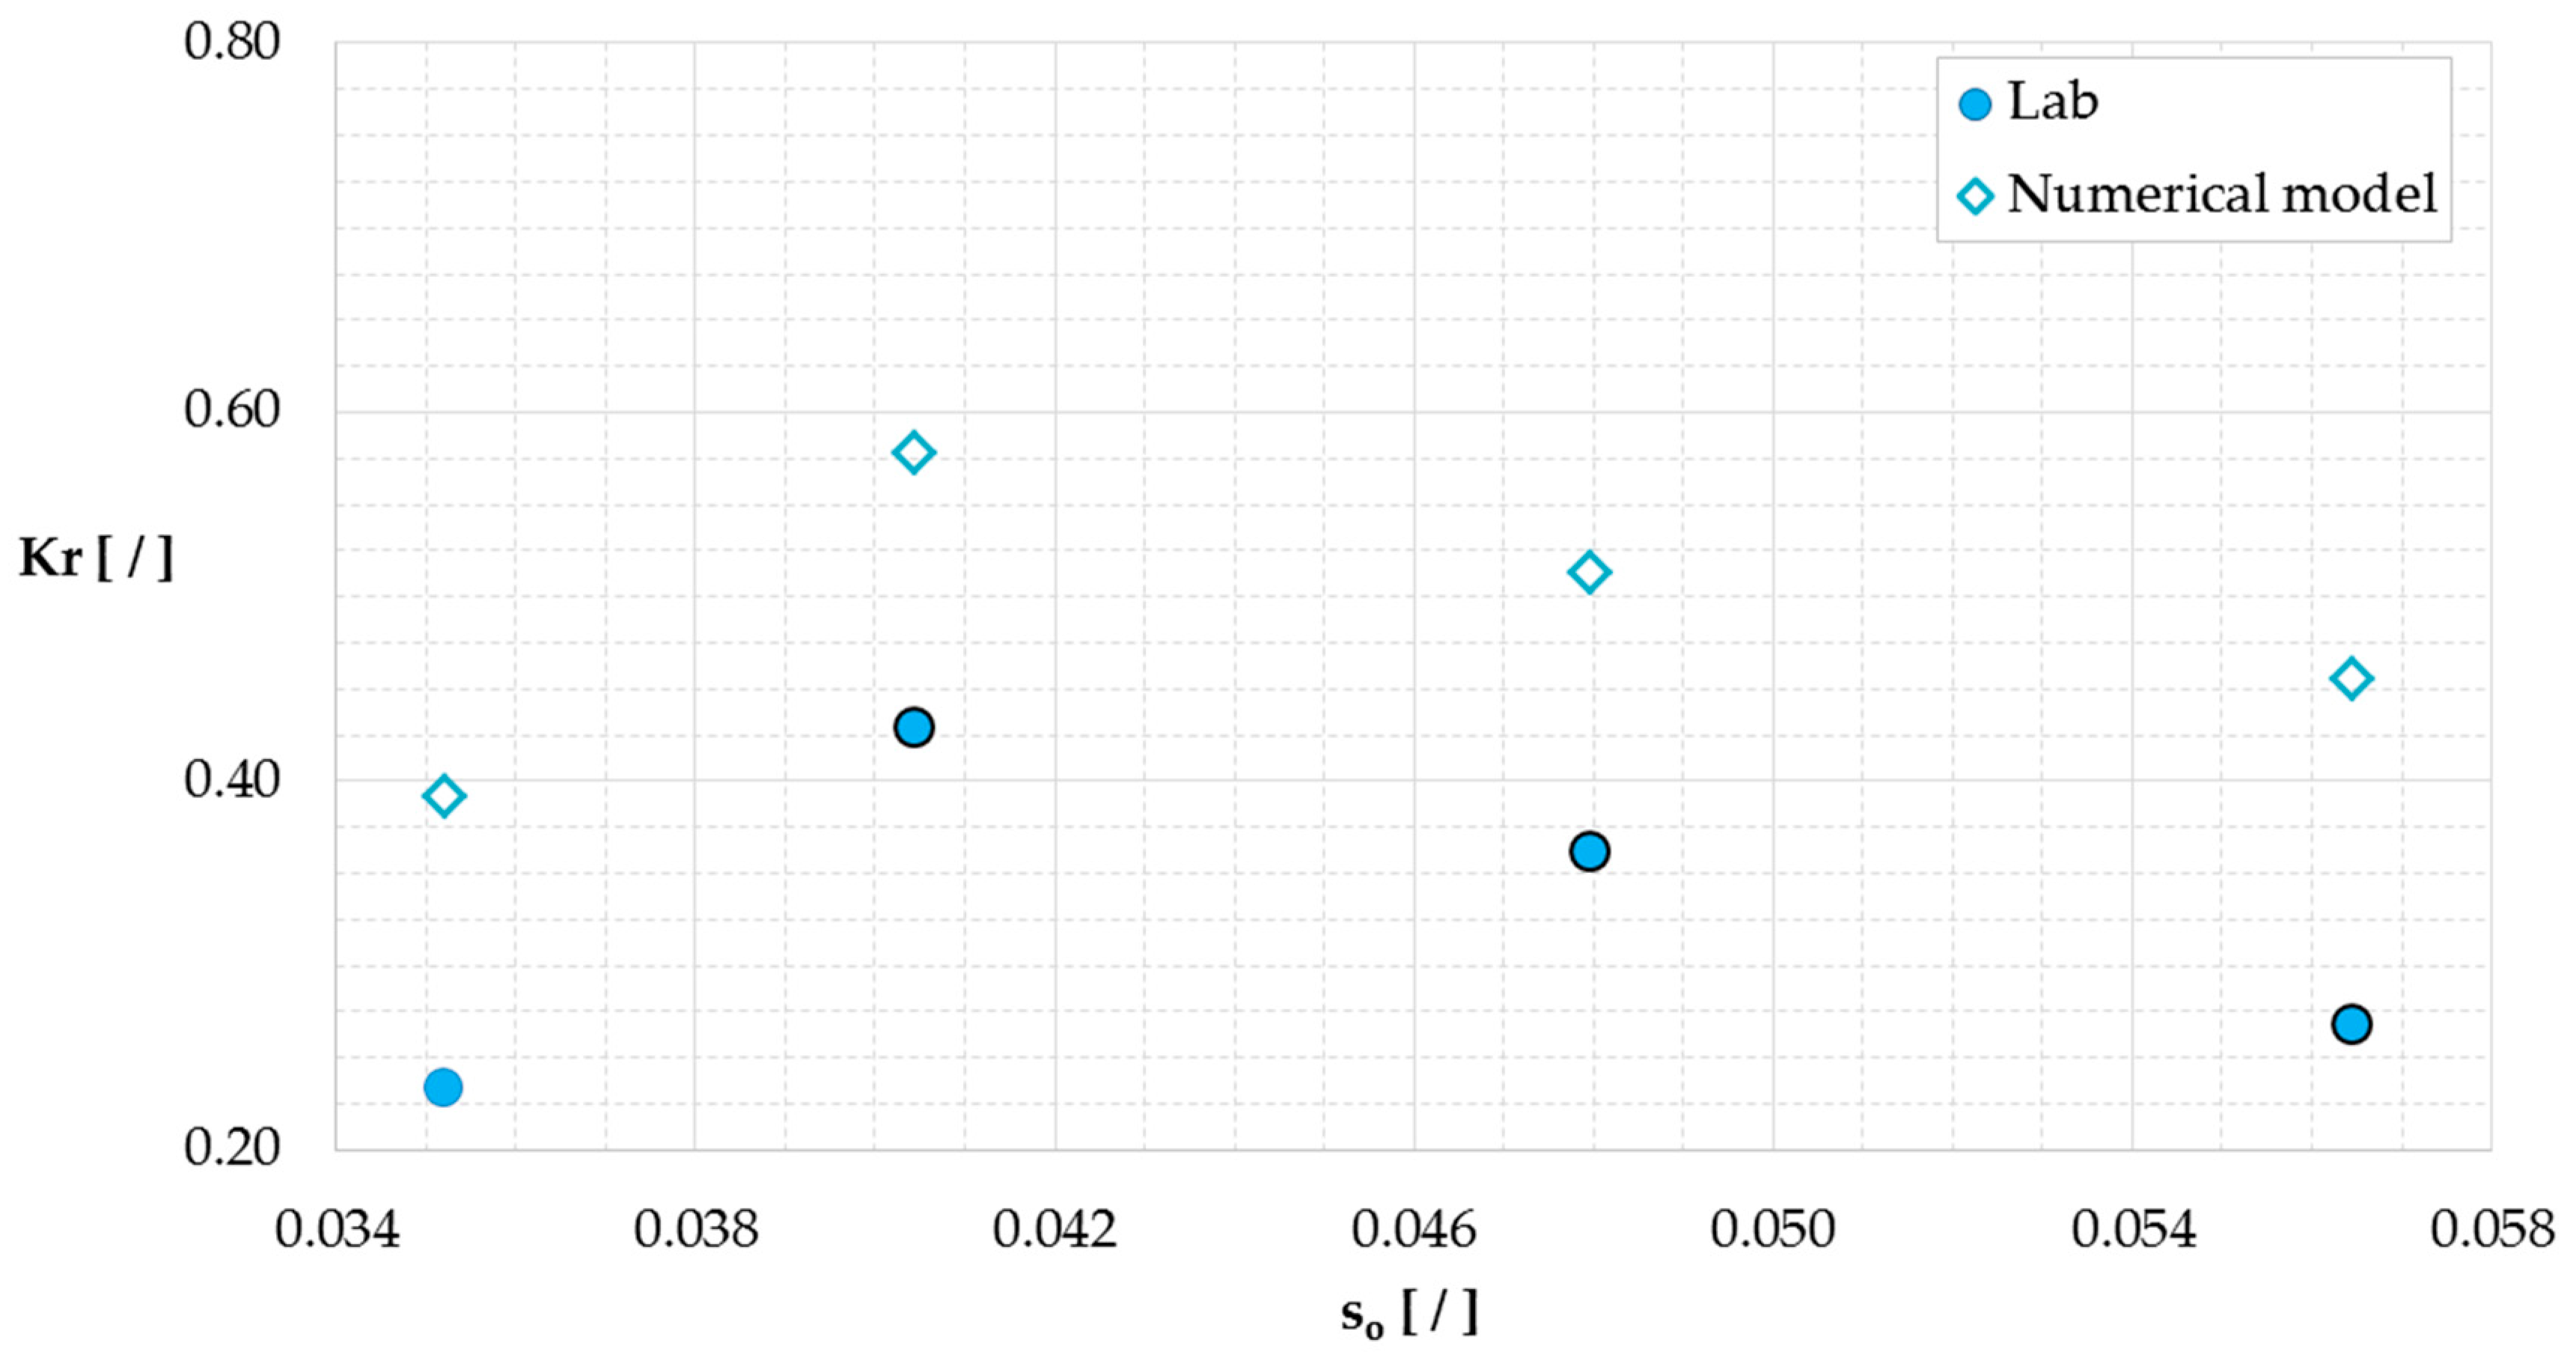
Figure 5 shows that the numerical model slightly and systematically overestimates the reflection coefficients. The deviation is on average equal to 15%, and it increases with the increasing of
so. The reason can be addressed to the slight modification occurred in modelling the cross section for the numerical analysis, concerning the thickness of the impermeable part as described in
Section 2.1. (
Figure 2b,c). However, such modification has no implication in the representation of the discharge flows inside the reservoir, i.e.,
qreservoir. In fact,
Figure 6 shows that the numerical
q*reservoir gives a better estimation of the laboratory results. This is confirmed by the performed statistical analysis. Indeed, the difference among the experimental, the numerical and the theoretical values obtained are statistically computed by means of 2 parameters, describing the error made, i.e., the root mean square error (RMSE) and the Willmott index (WI) [
44], defined in Equations (7) and (8), respectively. The quantity “
y” represents the dimensionless discharge rate, defined in Equation (4). The subscripts “
s” stands for the experimental data, while “
mod” for the numerical and the theoretical ones are according to the analysis performed. Therefore, “
ӯs” is the mean of the experimental discharge flows. A good representation of the experimental data is characterized by a RMSE value close to 0 and WI values close to 1. Indeed, the numerical RMSE and WI are equal to 0.005 and 0.75, while the theoretical ones to 0.007 and 0.59, respectively.
The difference between the experiments and the formulae was expected, as the formulae are essentially based on traditional structures and the calibration of the roughness factor is insufficient to allow greater accuracy [
30].
2.5. Tested Configurations
A sensitivity analysis has been carried out by using five different geometries which differ from the original one by changing one geometric parameter at once. The aim is to propose a design for the OBREC that maximizes the device exploitability, while obtaining the best compromise among energy production, harbor safety and easy installation. Specifically, the selected parameters were the reservoir width
Br and the shape of the sloping plate (its inclination
a), while the sloping plate freeboard
Rr and its longitudinal dimension of
Bs have been kept constant.
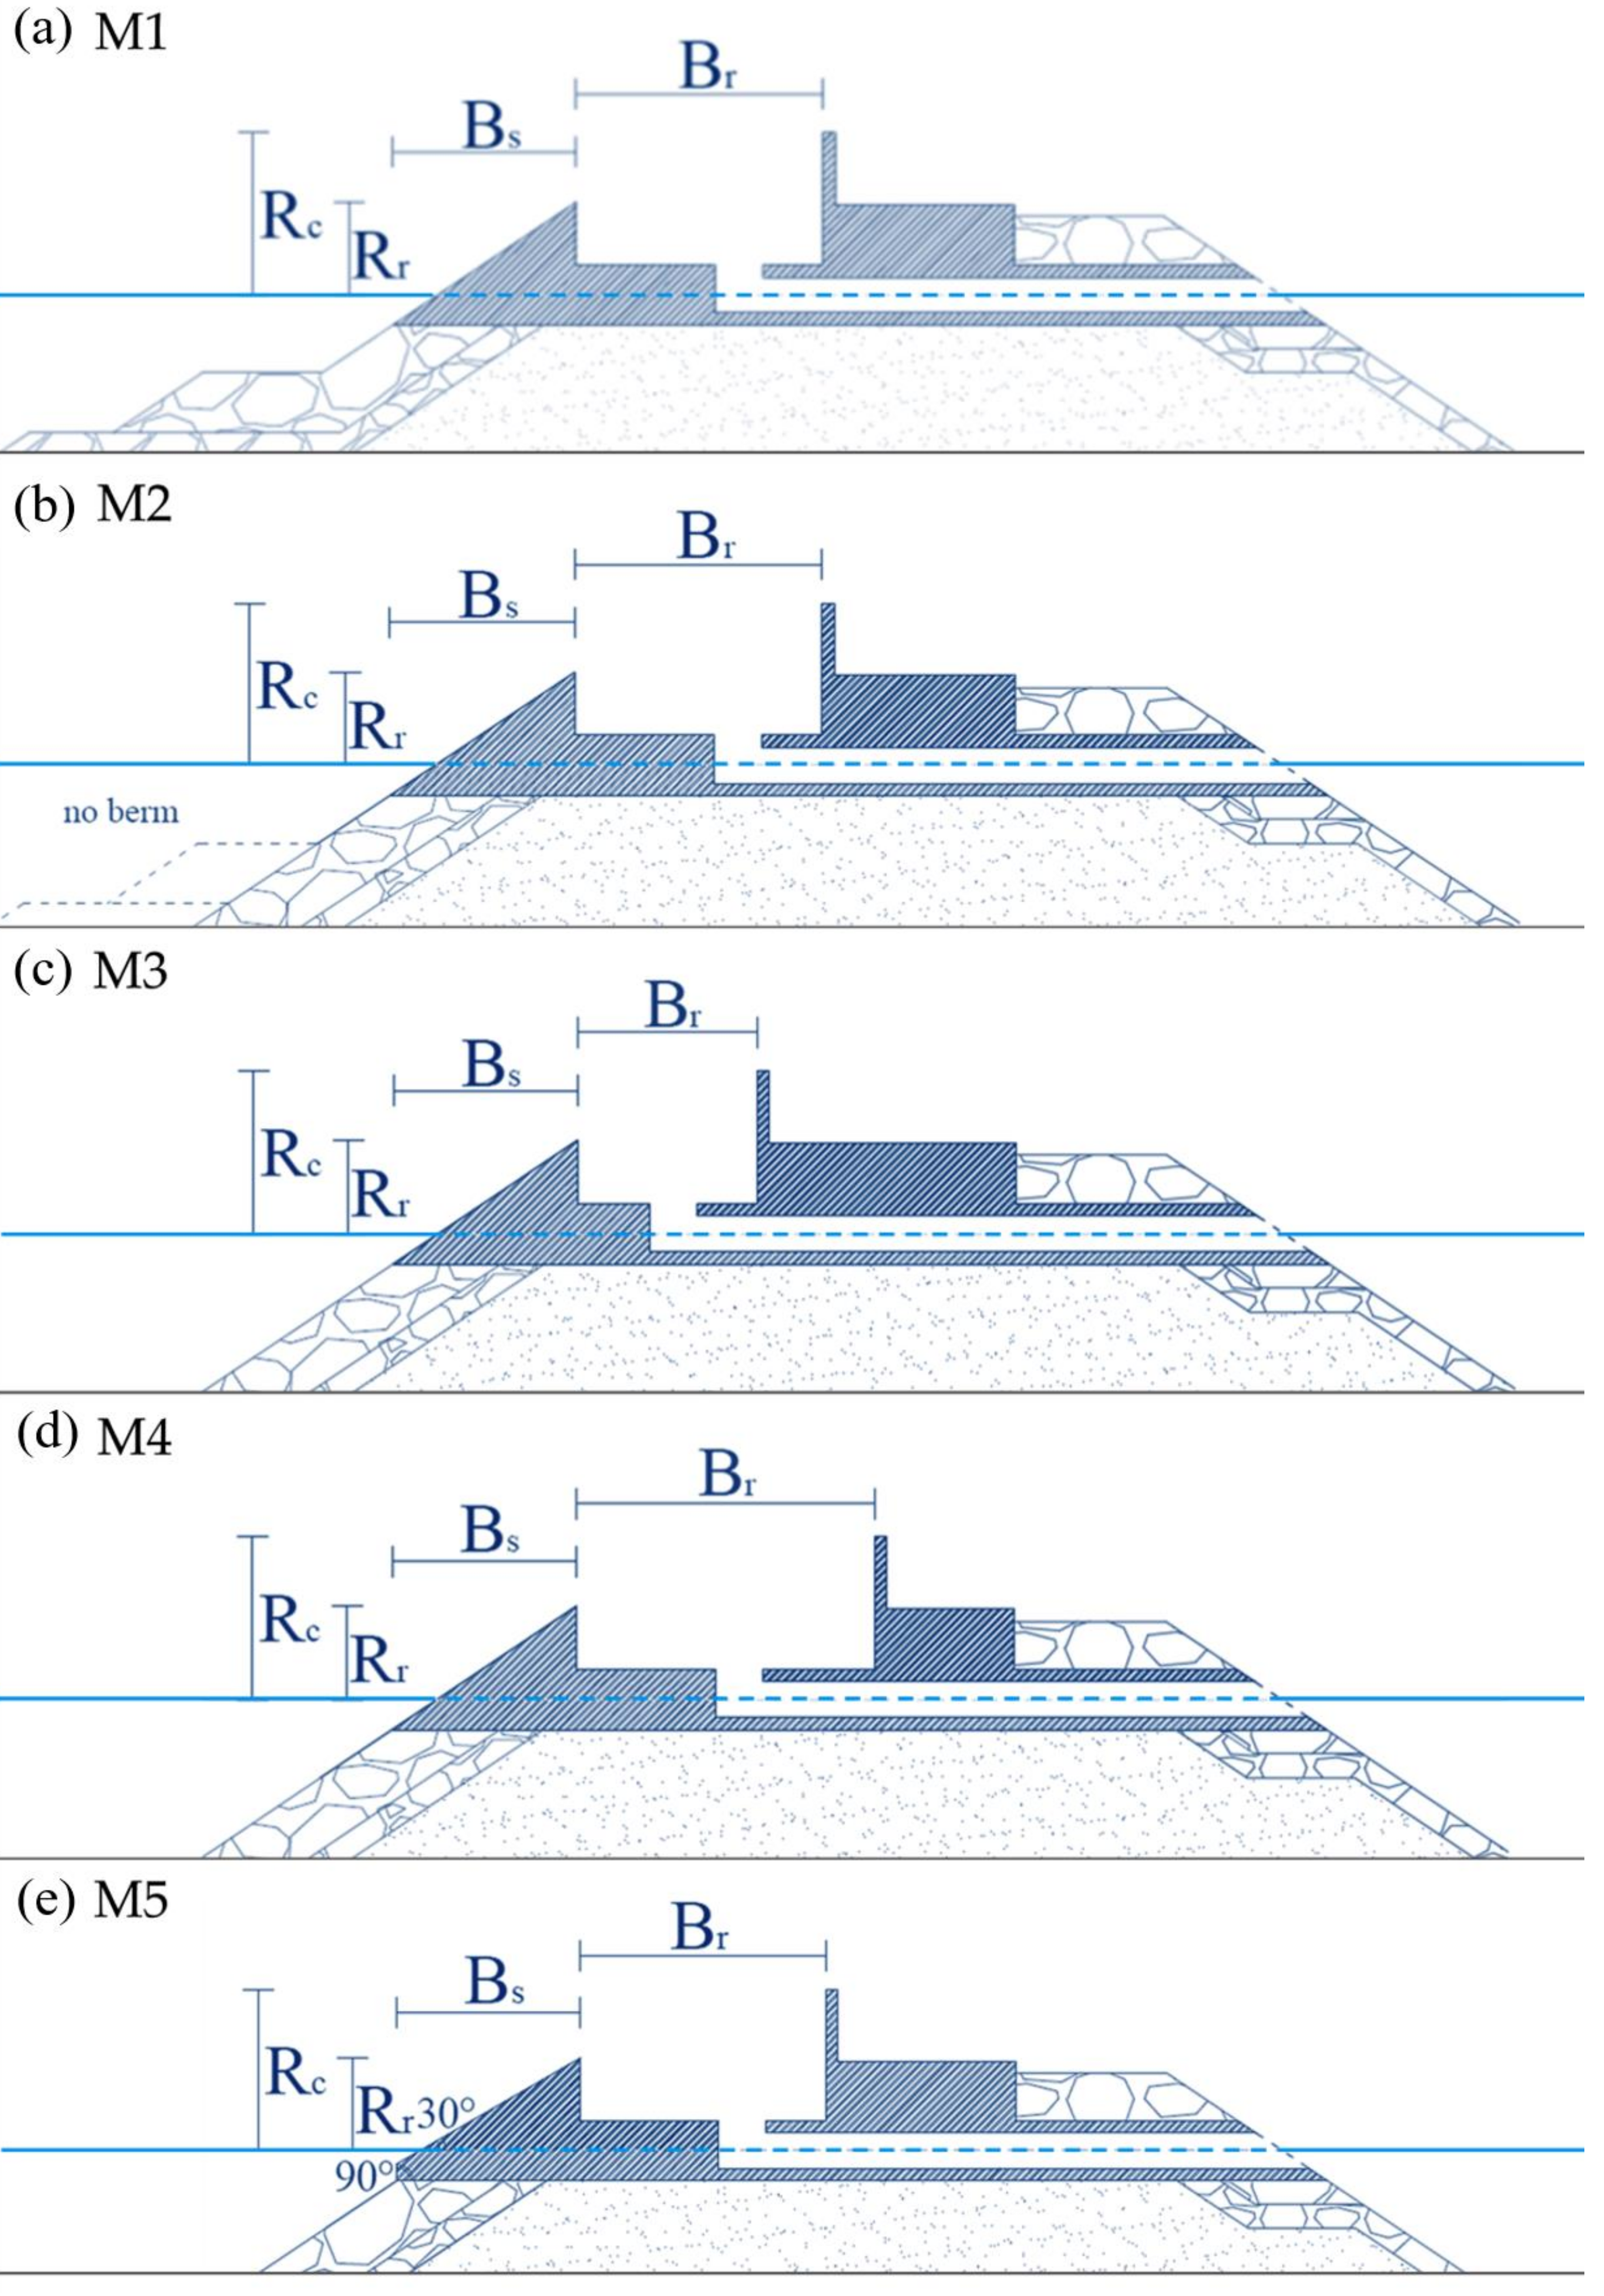
Figure 7 shows all the tested configurations (named M1–M5), which the main parameters of are synthesized in
Table 3.
M1 reproduces the 2012 laboratory configuration, as shown in
Figure 2c. The differences between the laboratory and the numerical models have been already discussed in the previous section. This configuration represents a benchmark case in which it is possible to analyze the relevance of the berm in the wave-structure interactions. As a matter of fact, M2 corresponds to M1 except for the presence of this element (see
Figure 7a,b).
To analyze properly all the parameters related to the OBREC device, M2 has been chosen as the reference configuration. The compatibility of this kind of installations in breakwaters, not provided with a berm, has been already analyzed during the second laboratory campaign, Iuppa [
31]. Therefore, the other selected OBREC cross sections differ from M2 only for a geometric parameter at once, allowing the assessment of the effects of a specific element on the hydraulic and structural performances.
The configurations M3 and M4 have been selected to analyse the change in the reservoir width Br. The two cross sections imply a variation of Br of 25% with respect to the benchmark case. The aim of this analysis is to assess its relevance in the saturation of the reservoir, the maximization of the energy production, the limitation of the pressures along the crown wall and the values of qrear.
The configuration M5 (
Figure 7e) differs in the shape of the sloping plate. This section has been designed according to the results obtained from the research aimed to optimize the WECs profile. Kofoed [
45] proved that the adoption of a 30° inclined slope angle improves the hydraulic performance in terms of overtopping discharge. This result has been then validated by Nam [
46]. Such authors considered also a double inclination for the ramp shape, with the submerged part having a vertical orientation, demonstrating its positive effects in increasing the run-up.
3. Results
This section shows the results from numerical simulations using the calibrated IH2VOF model.
Section 3.1 focuses on the description of the hydraulic performance in normal conditions. Instead, the effect of geometric changes and on the loads and harbor safety in extreme conditions are reported in
Section 3.2 and
Section 3.3, respectively. The results obtained in terms of
Kr,
qreservoir,
qrear and pressures are used to improve the design of the device, by providing some general guidelines according to the analysis of the wave–structure interactions.
3.1. Effects of Geometric Changes on the Hydraulic Performance
The hydraulic performance of the OBREC device are here analyzed in terms of Kr and non-dimensional overtopping at the rear of the structure, q*reservoir, under normal conditions.
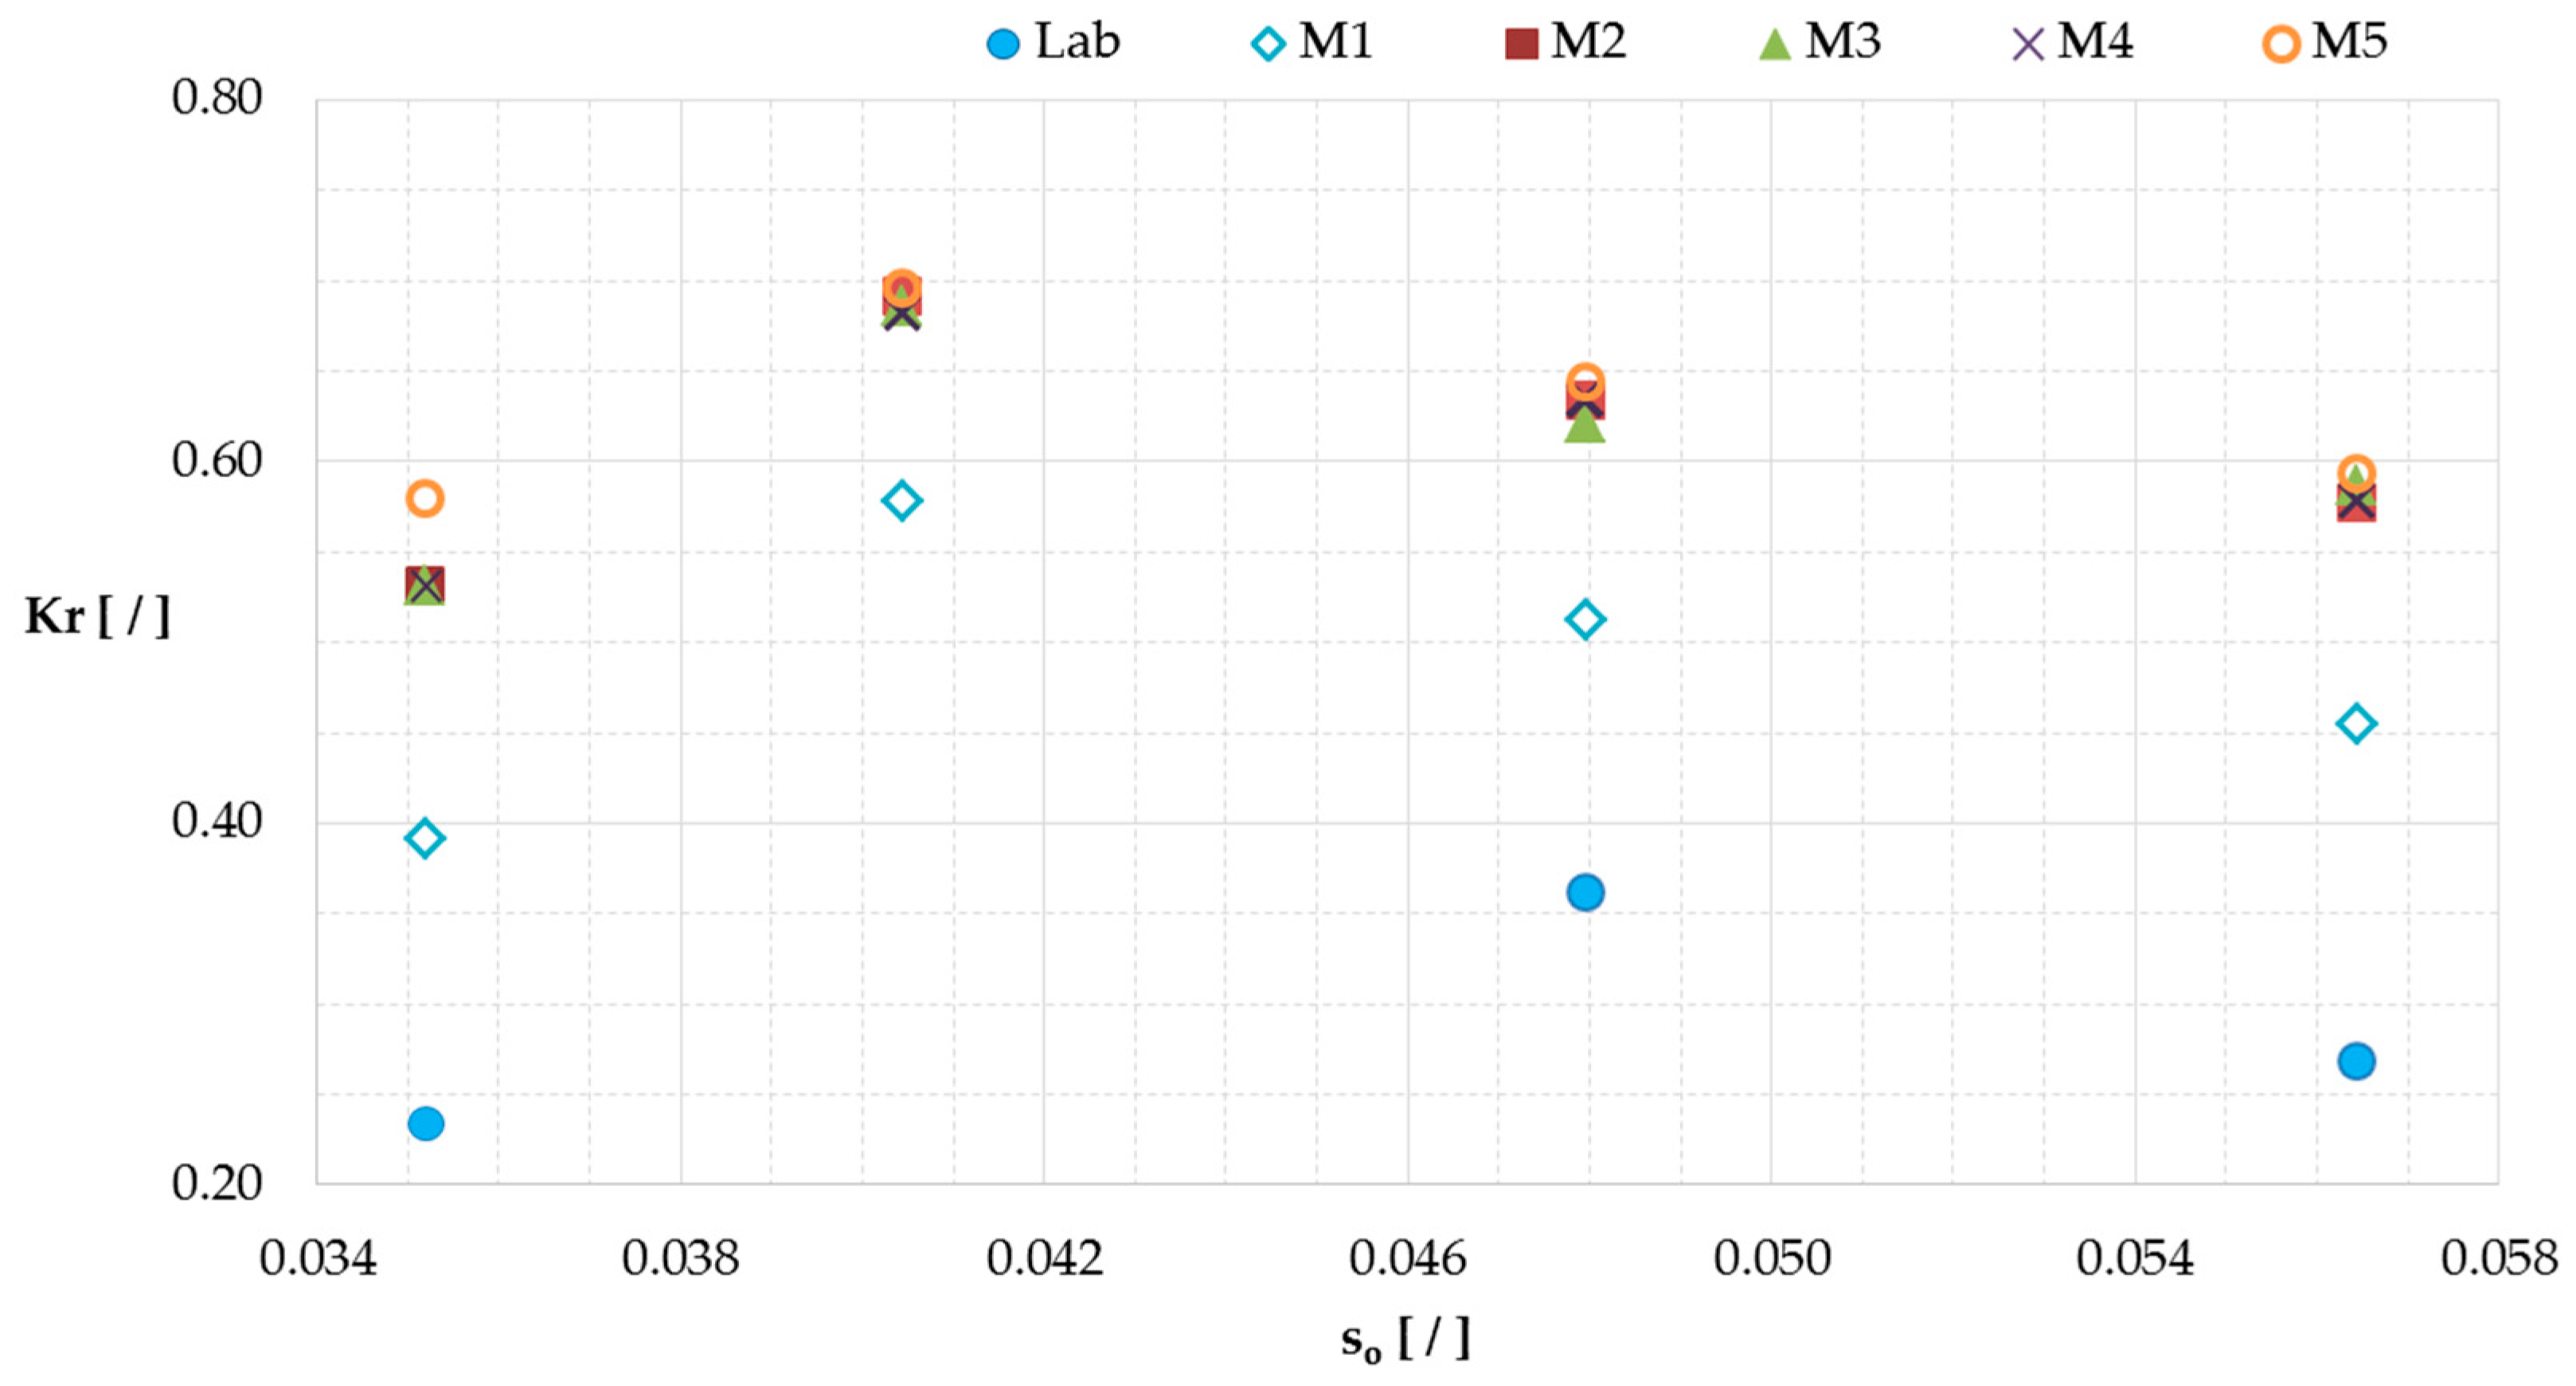
Figure 8 shows the values of
Kr versus the steepness
so for all the configurations, under normal conditions. The laboratory results (already shown in
Figure 5) is respected. The configuration M2 leads to greater values with respect to M1. This result was expected considering the work of Zanuttigh [
47], who demonstrated that structures characterized by a submerged berm lead to a smaller
Kr than those with a straight slope validated also by the study performed by Formentin [
48]. The design of a toe protection in case of an OBREC installation in a breakwater without berm should be taken into account.
The width of the reservoir Br does not significantly affect the wave reflection as it can be derived from the similar values of Kr for M2, M3 and M4. The value of Br can therefore be selected based on the maximization of the energy production and on the minimization of the costs, while adapting the overall dimension of the device to the spatial constraints posed by the installation in existing breakwaters.
The shape of the sloping plate, instead, affects significantly the reflection phenomenon. The offshore angle of the ramp influences the wave run-up, while the position of the change of the inclination with respect to the sea water level affects the dissipation induced by wave breaking. The configuration M5 shows similar results to M2, except for the first wave condition characterized by the smallest Hm0. As a matter of fact, the presence of a vertical element in the ramp shape has a greater influence on the smallest wave height. Therefore, it is important to consider the response of the structure with respect to the wave condition characterized by the greatest frequency in a typical wave climate.
In
Figure 9 the values of
q*reservoir for M1–M5 are compared with the results related to M2. The absence of the berm does not change the values of
q*reservoir with respect to M1, at least for the tests characterized by the greatest discharge rates and so the greater wave heights. Therefore, the higher reflection does not change in a significant way the potential power production.
The slightly lower values of q*reservoir for M3 suggest that the reservoir is under-dimensioned. The greater reservoir size of M4 does not lead to a real improvement of the discharge rate. Therefore, it can be concluded that this parameter does not affect significantly the hydraulic performance of the device. Therefore, its design in existing breakwaters has to be focused on the height and the shape of the sloping plate that directly influence the overtopping phenomenon. The dynamic inside the reservoir is more connected to the position of the pipes, which lead the water to flow towards the turbines.
The configuration M5 shows the same result of M2. Therefore, the introduction of a vertical submerged part could be considered to generalize the OBREC cross section, without compromising its hydraulic performance.
3.2. Effects of Geometric Changes on the Structure Loads
The assessment of the loads across the structure has been performed by using numerical pressure transducers, placed in the same position as the experimental ones (
Figure 4) to perform a consistent analysis. The results discussed in this section are related to the extreme conditions reported in
Table 1. However, the modified geometry required some adaptation for a few cases. The configuration M3 includes 3 sensors along the reservoir due to the reduced value of
Br. In M5 the sensors related to the sloping plate were shifted along the orthogonal direction that links the original inclination to the new ones.
The pressures are analyzed in terms of
p250, which corresponds to the non-exceedance level of about 99.7%.
Table 4 reports the values related to the sloping plate, the crown wall and the bottom part of the reservoir (uplift pressures).
The sample frequency adopted in the numerical model is lower than the laboratory one to minimize the computational effort without compromising the accuracy of the results. A higher sample frequency in the numerical modelling would be required in case the model could reproduce the compressibility of the air, which usually leads to the highest impulsive peaks not so easy to be recorded. Therefore, the numerical results may underestimate the pressures acting on the elements exposed to wave breaking and to the water jet, such as the highest part of the sloping plate and the crown wall.
The configuration M1 reproduces well the experimental values along the sloping plate, with a small underestimation related to the upper part. The configurations M2–M5 show values of p250 similar to M1.
The pressures related to the crown wall are very similar for all the configurations. The trend of the physical model is respected, but the discrepancy between the numerical and the experimental results increases from the bottom to the top of the crown wall. Only in the M4 case, all the discharge flows down in the wider reservoir, leading to an unstressed wall even in extreme conditions. This behavior was found to be in agreement with the calculated pressure and physical model measurements on a 1.66 scale of a different overtopping device, named SSG (Seawave Slot-cone Generators) [
49]. The authors attributed these differences to the absence of air in the numerical model. Therefore, some pressure peaks reduction (especially in the higher part of the crown wall) when compared to the physical model test could be experienced.
The uplift pressures are well-estimated, leading also to cautious values. This result is very useful considering that the uplift pressures represent the destabilizing force, which play a key role in the overall stability of the breakwaters top element [
50].
As anticipated in
Section 2.2, the numerical model allows to obtain also the downward pressures where no direct comparison with the experimental data is possible. The statistical values of p
250 are reported in
Table 5. All the configurations show results very similar to each other, being the inshore corner, i.e. corresponding to the gauge 10
in (see
Figure 4), the most stressed part of the reservoir. This is not completely true for the configurations M4 and M5 due to the size of
Br and to the lower number of overtopping waves, respectively.
3.3. Harbor Safety
The harbor safety has been evaluated in terms of
qrear, i.e., the average overtopping discharge at the rear side of the crown wall, in extreme conditions (see
Table 1).
For these numerical simulations, the reservoir has been closed to analyze the worst functioning condition, i.e., when the pipe is not capable of draining all the water that overtops the sloping plate.
In the 2012 experimental campaign, for the same wave condition, the values of
qrear measured for the OBREC case (
Figure 2b) were higher compared to a traditional rubble mound breakwater with similar overall dimensions (
Figure 2a) [
30]. Therefore, a parapet (nose) has been introduced on the top of the crown wall to increase the safety level of the area inshore the structure. The role of the parapet is to redirect the up-rushing waves back into the front reservoir and towards the sea.
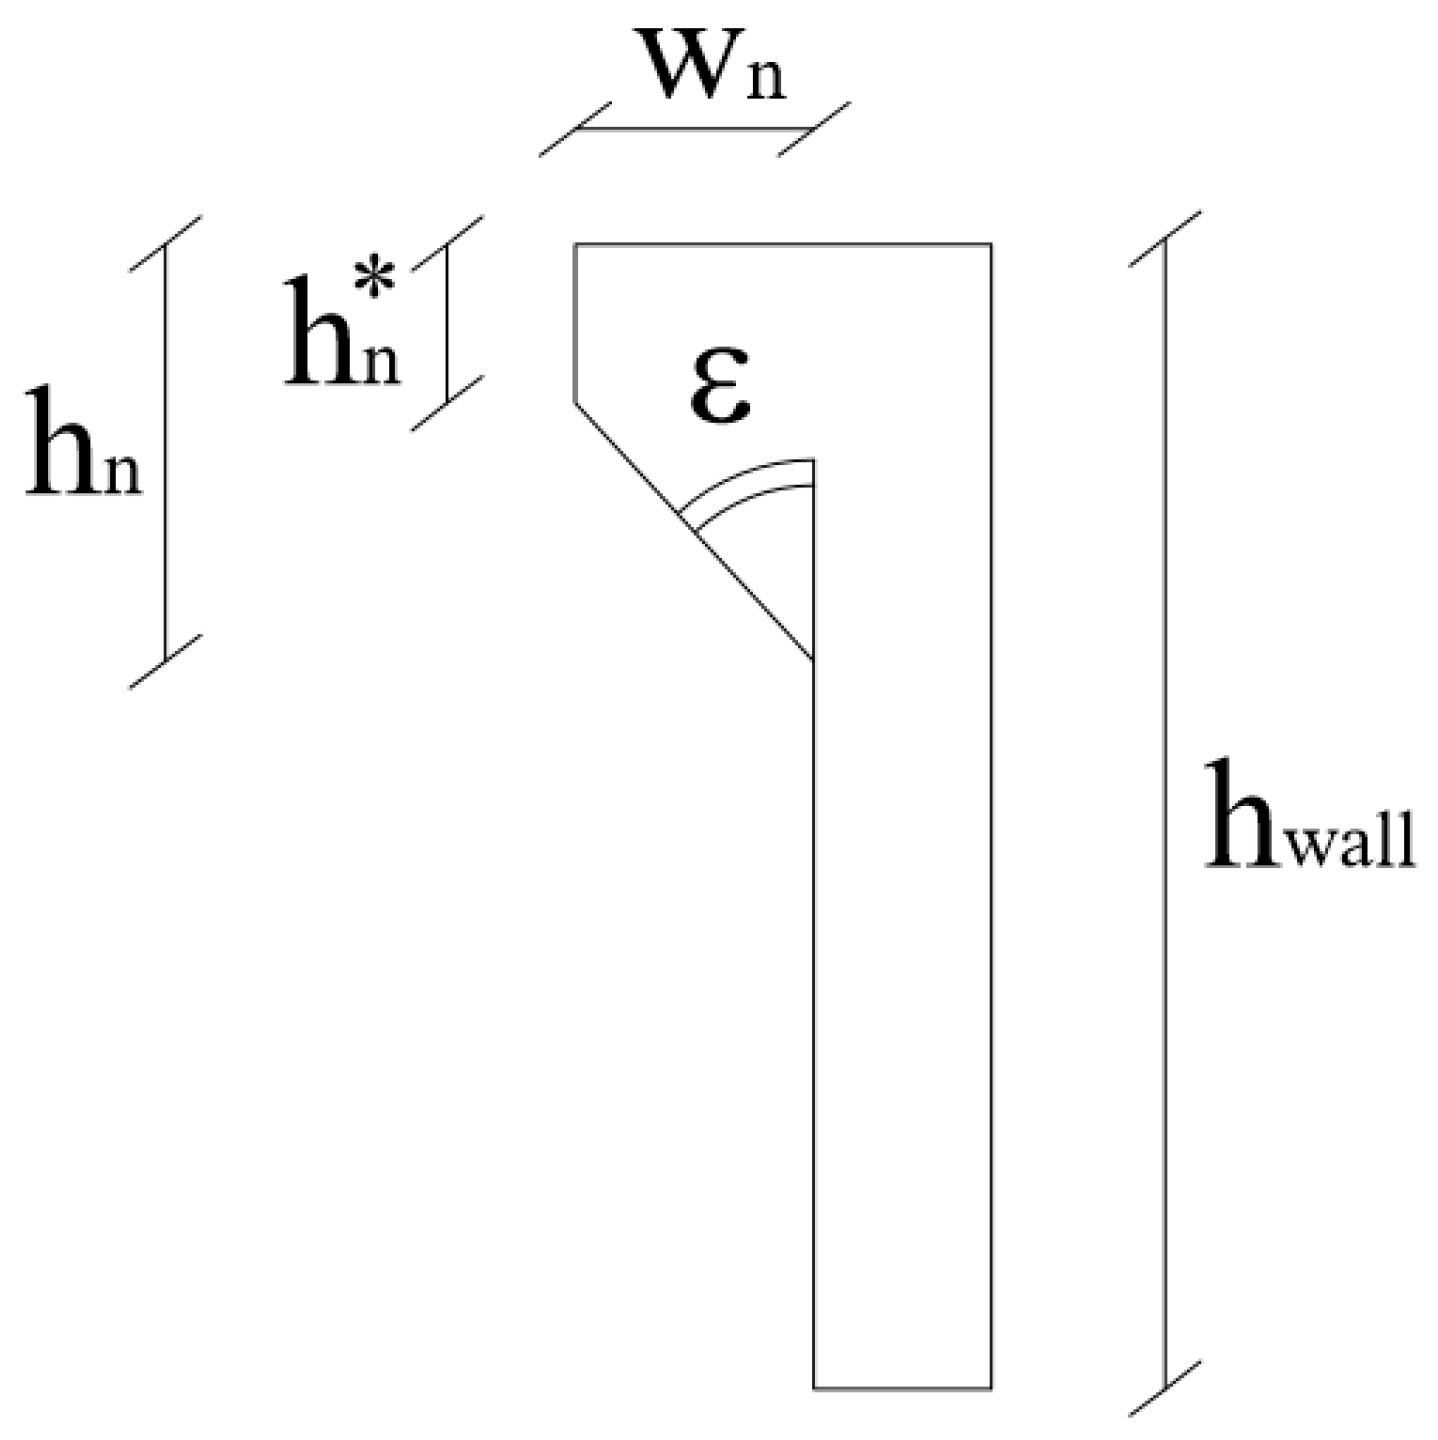
In this study case, the parapet has been designed according to the work performed by Van Doorslaer [
51], who investigated the effects of some geometrical parameters on
qrear, such as the crown wall height
hwall, the extension of the nose
hn and the inclination of the parapet
ε (
Figure 10).
The larger the angle
ε, the higher the wave reflection inside the reservoir is, resulting in smaller values of
qrear. The optimal range for
ε was found between 30° and 45°, which combines a good reduction of
qrear and a limited increase of the pressures on the wall in correspondence to the parapet, i.e., WG22, as shown in
Table 6 and
Table 7. Although the value of
ε is the dominant geometric variable,
qrear also decreases with increasing
hn (
Figure 10). The best reduction was achieved for
λ =
hn/
hwall ≥ 0.3. Based on these literature results, 2 parapet configurations have been considered, i.e.,
ε = 30° and 45° and a fixed value of
λ = 0.3. The resulting thickness of the nose
wn is equal to 0.027 m and 0.046 m for
ε = 30° and 45°, respectively.
Table 6 reports the results of
qrear for the OBREC sections with and without the parapet. In the case of the straight crown wall, the greater the reservoir width the lower the overtopping at the rear side of the structure was. The presence of the nose reduces the values of
qrear by 34% and by 41%, on average, for
ε = 30° and 45°, respectively. For both inclinations, the configuration M3 shows the maximum reduction, i.e., 70% and 80% for
ε = 30° and
ε = 45°, respectively. Therefore, the inclusion of the nose leads to a safe harbor area even in case of a constrained reservoir width.
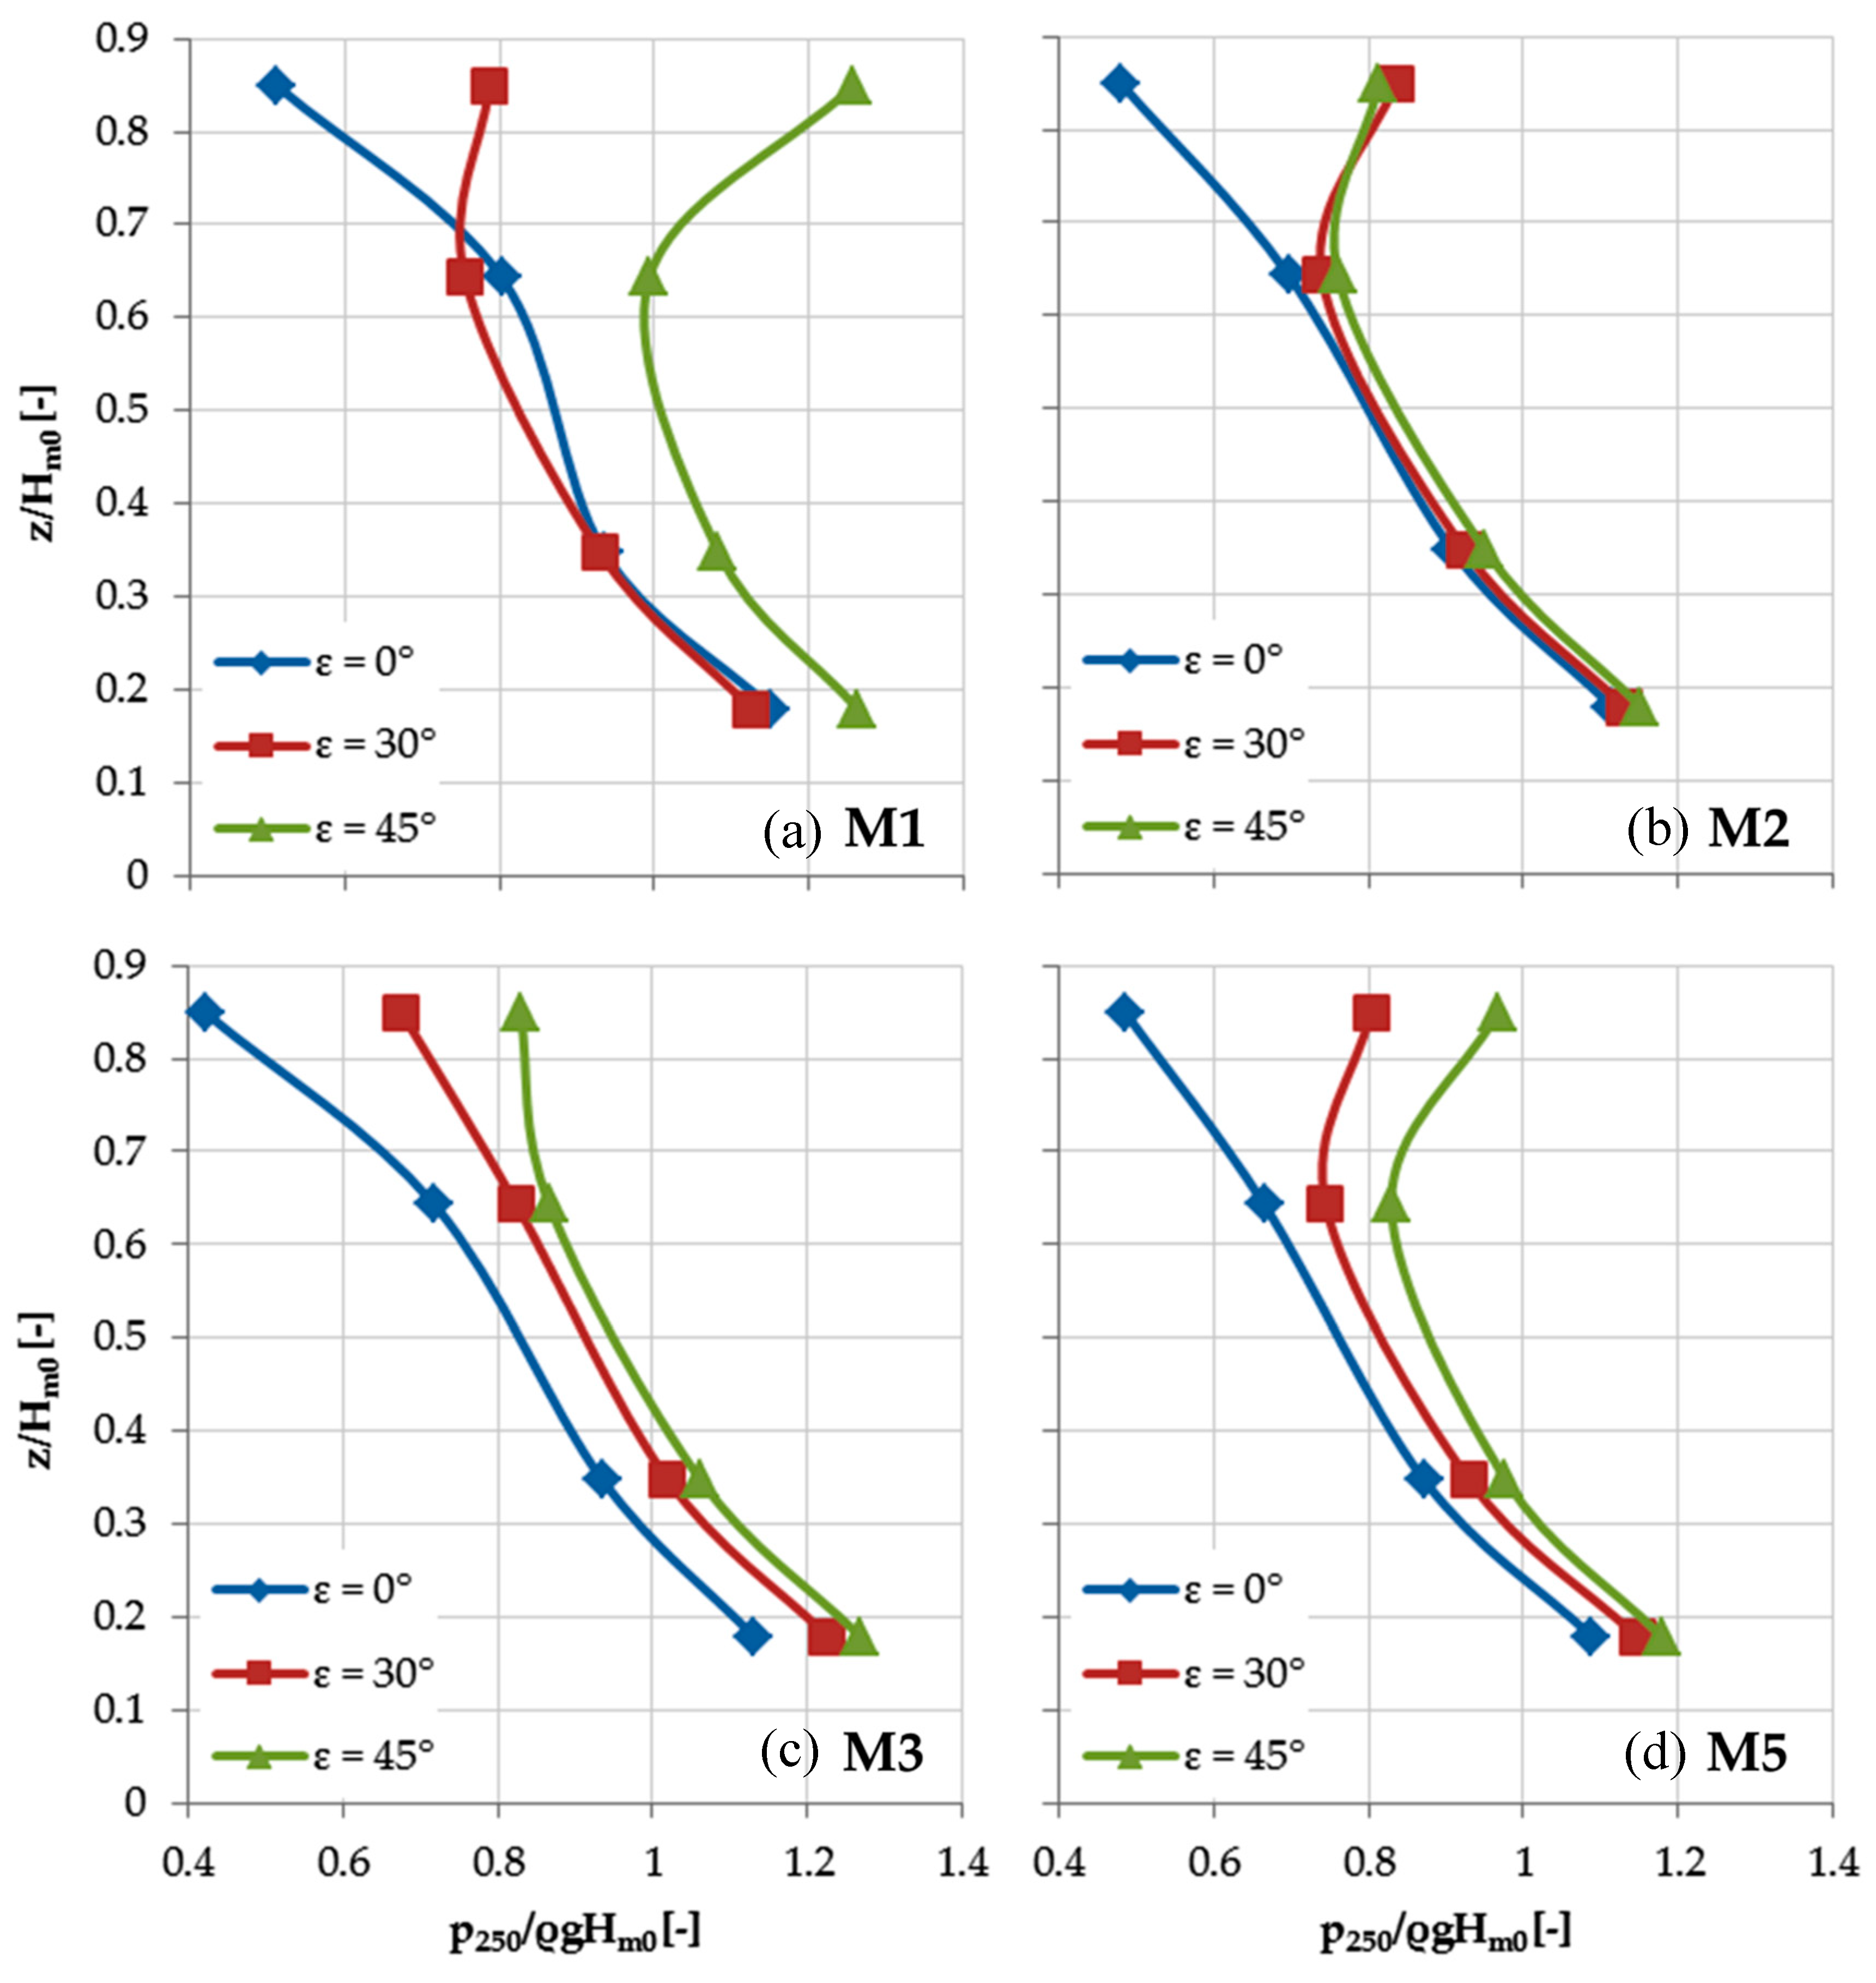
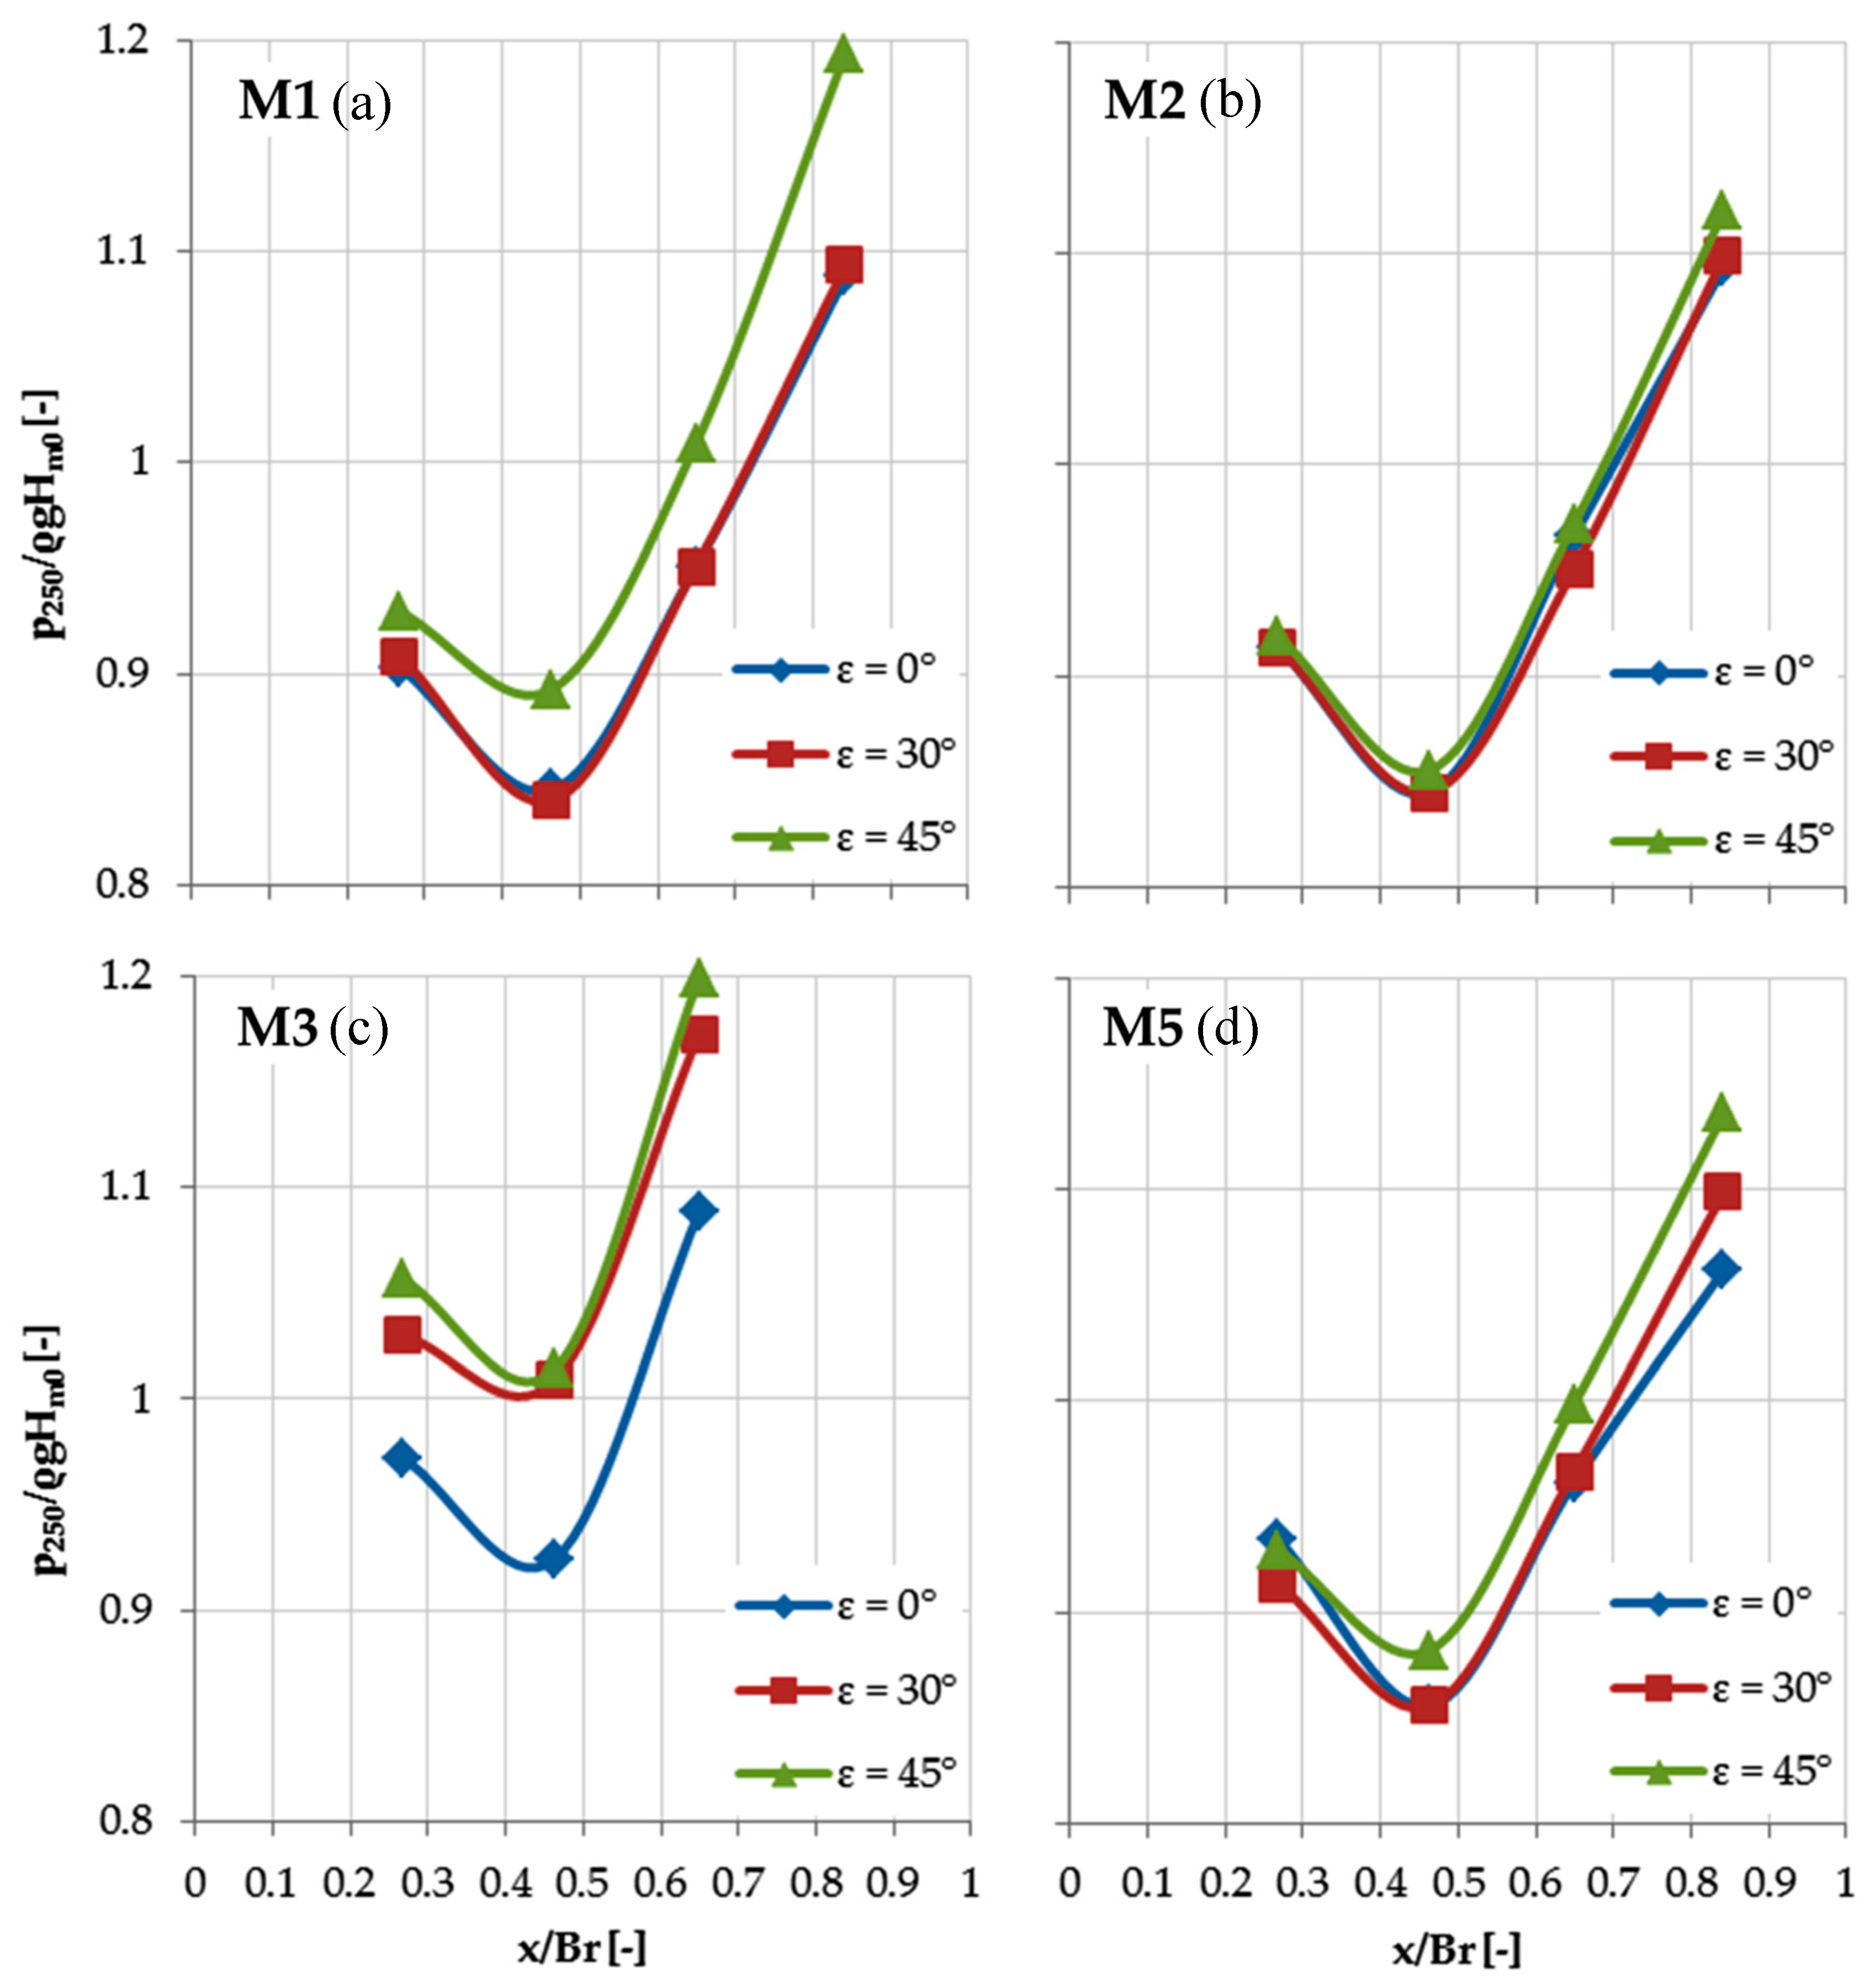
Table 7 shows the values of
p250 inside the reservoir and along the crown wall to understand the effects, in terms of pressures, of the presence of the nose. Due to the absence of overtopping at the rear side of the structure, the configuration M4 was not analyzed. The results of non-dimensional pressures acting on the crown wall and inside the reservoir are graphically represented in
Figure 11 and
Figure 12, respectively. In order to provide general results, the relative positions of the pressure transducer have been considered non-dimensionalised. In particular, in
Figure 11, the vertical distances from the bottom (z) rather than the wave height (
Hm0) are shown. In
Figure 12, the relative abscissa (x) of pressure transducers from the seaward border of the reservoir has been non-dimensionalised with respect to the reservoir width (
Br).
The presence of the parapet leads to higher pressures on the crown wall, which increase with the increasing of ε. The downward pressures are almost constant for all the configurations due to the load dampening caused by the presence of the water inside the reservoir, which is always saturated. Only for M3, the computed statistical values are slightly higher due to the reduced value of Br.
Therefore, the OBREC design has to consider the introduction of a parapet to reduce the overtopping at the rear side of the structure. The best configuration which optimizes the values of qrear implied the parapet be inclined at 45° without increasing the pressures. The other geometric parameters, i.e., the berm and the reservoir width, do not affect qrear and p250.
4. Discussion of the Results with Reference to the Prototype Installation
The test campaigns performed during 2012 and 2014 were aimed to understand the general behavior of the OBREC device and the relevance of its elements on the hydraulic and structural performances. However, to establish the fraction of extractable resource and safety performance, more detailed considerations were required. In principle, there is not “the best” OBREC cross section that may be used everywhere. It is expected that, depending on the selected site characteristics, some shape of the sloping plate could be more efficiently used than others. In any case, the selection of the optimal OBREC configuration is a complex matter which cannot be done in a brief overview. For a site-specific installation, in fact, the design considerations have to be tuned based on the operating (normal) and extreme wave climate at the site. The design has to also account for the spatial constraints due to the harbor layout and the configuration of the existing breakwaters.
The main result observed from the numerical simulations here reported that the enhancement of q*reservoir could increase the values of qrear. In particular, assuming that the water jets follow the tangent of the ramp crest, which works as a deflector, the greater the hydraulic performances of the frontal sloping ramp, the greater the value of up-rushing water driven directly on the upper part of the crown wall is. This means a potential higher overtopping discharge at the rear of the structure and a higher pressure on the parapet.
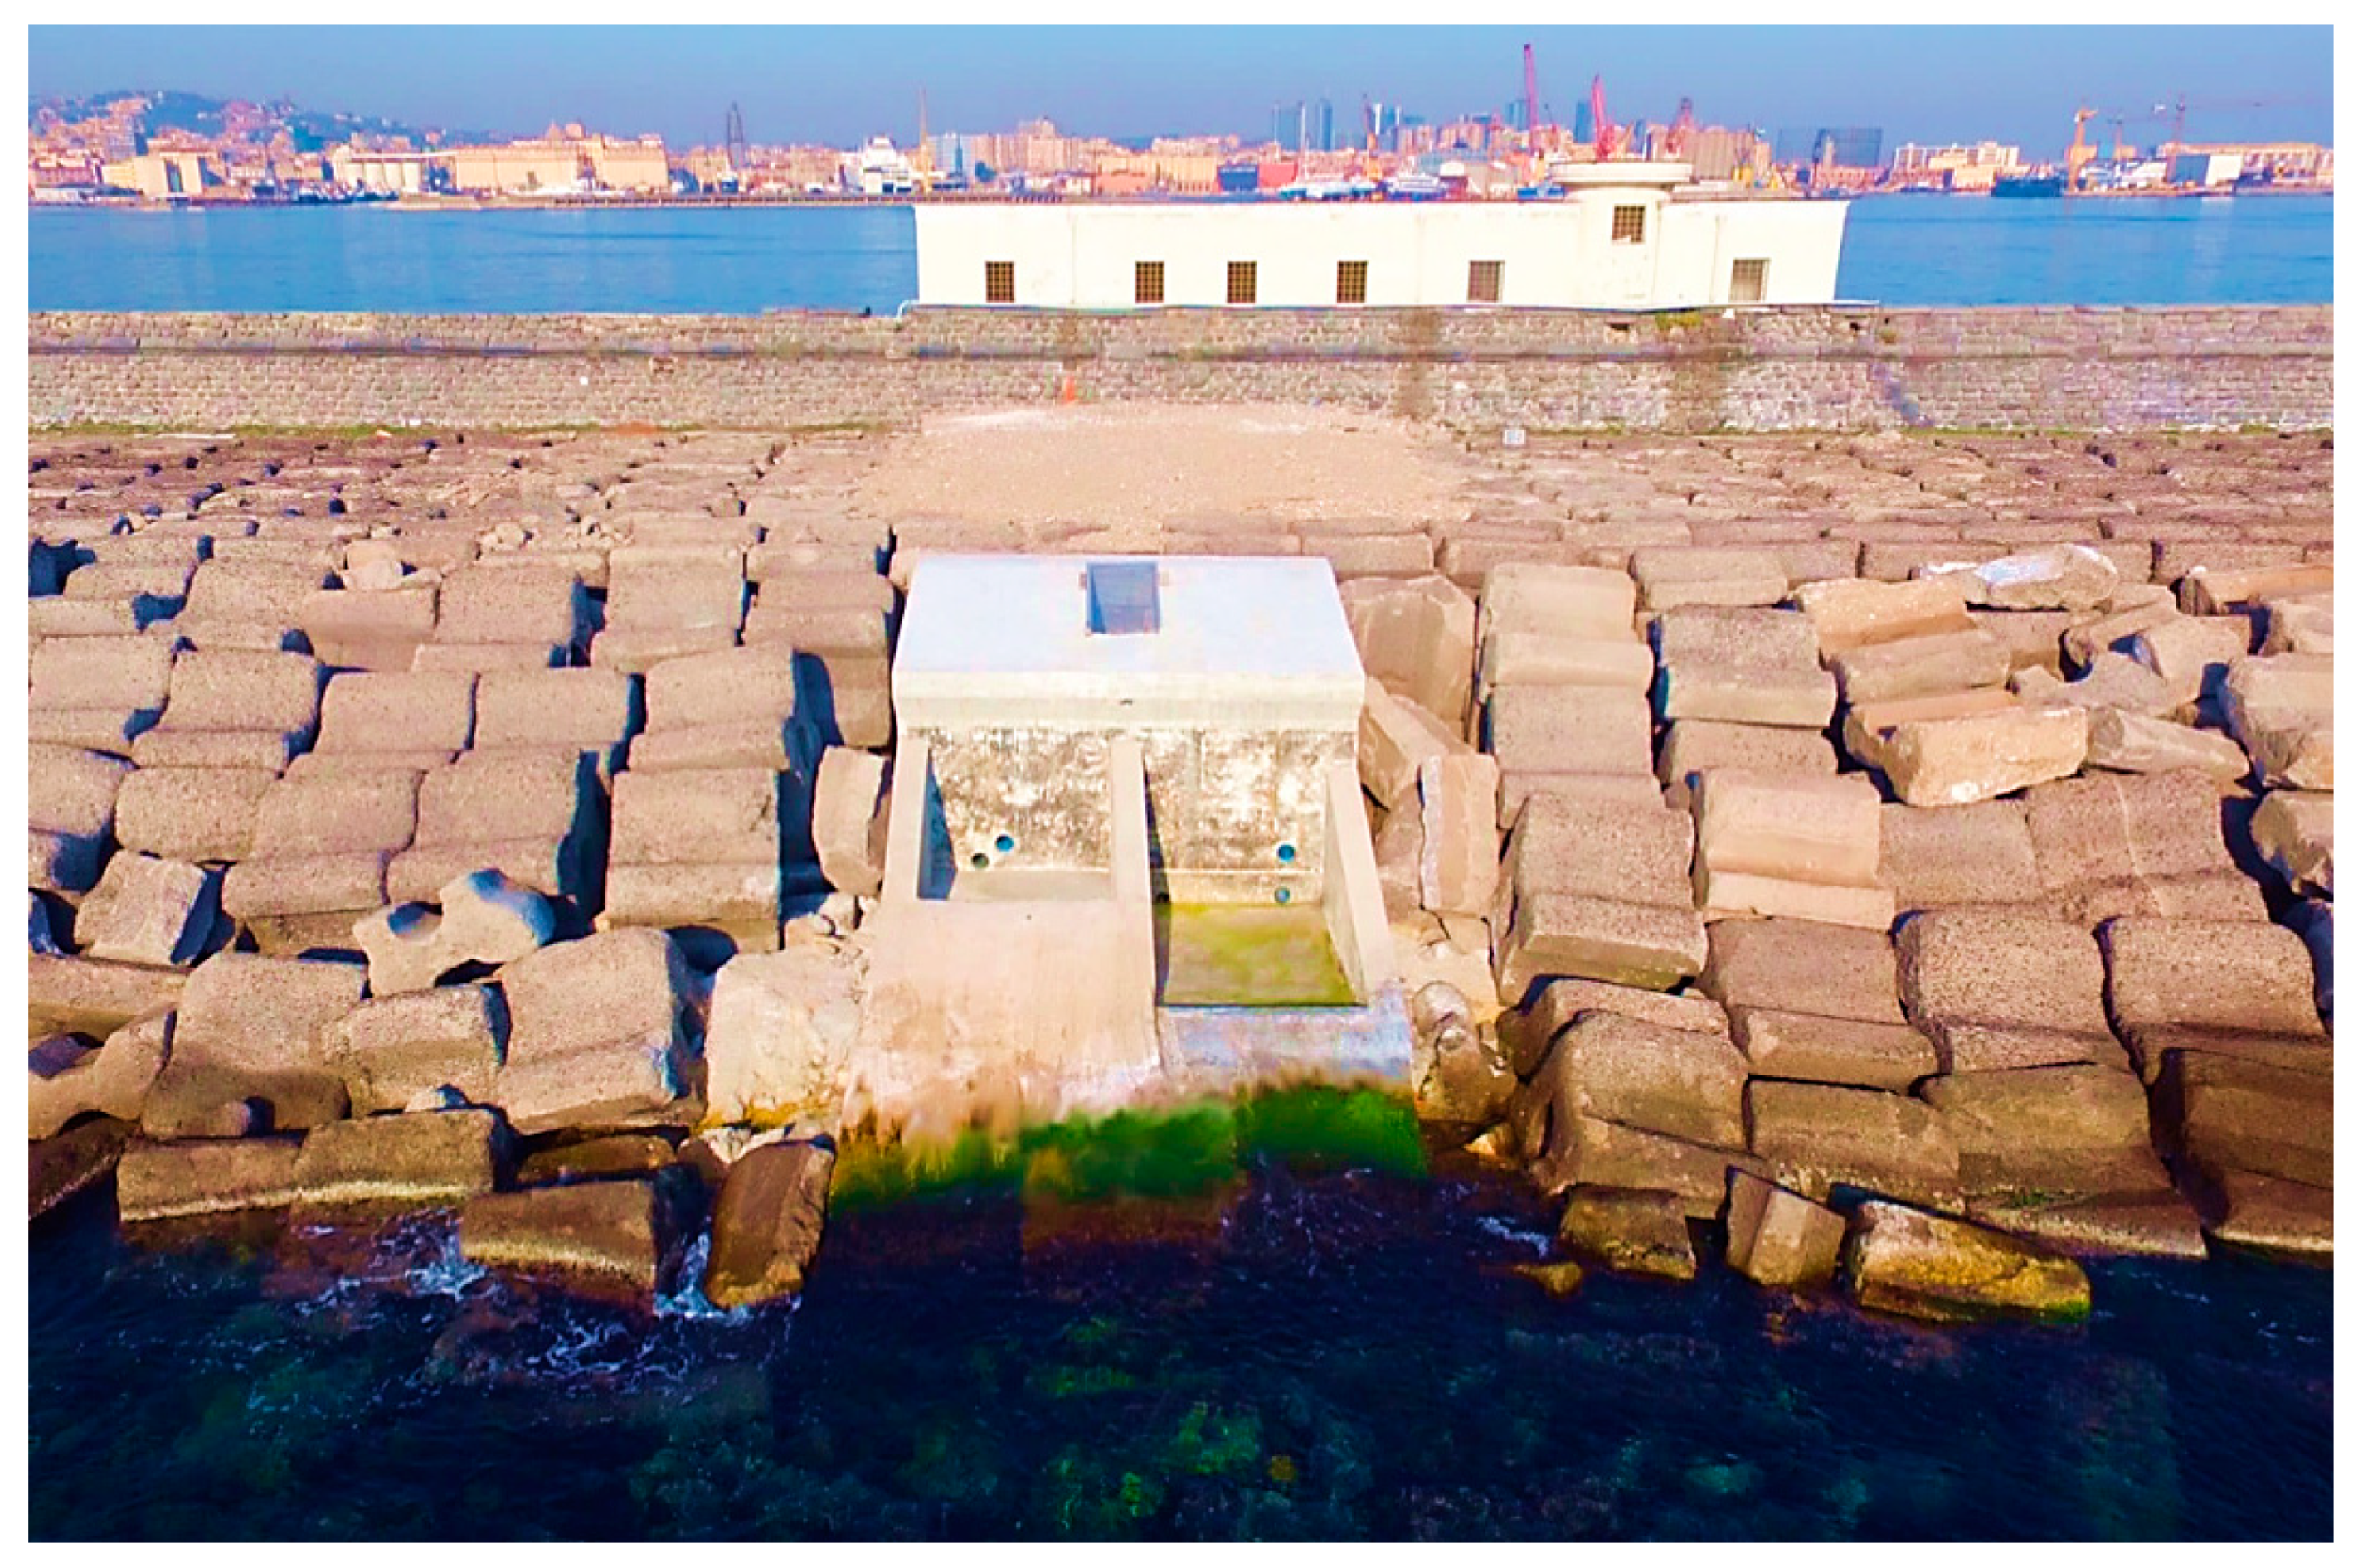
Looking to the tested configurations, one of the best compromises is represented by the double shaped sloping plate (configuration M5). This kind of cross section does not affect significantly the wave overtopping inside the reservoir and is able to reduce the overtopping at the rear of the structure and also if a crown wall without a nose is considered. Then, not so high values of wave loading are measured. Furthermore, the idea behind M5 is to define a more general cross section, which can be easily placed on top of existing breakwaters independently from its off-shore slope. Therefore, the double plates configuration was considered for the first OBREC pilot plant (
Figure 13). The prototype was installed in the San Vincenzo breakwater, located in the port of Naples [
52].
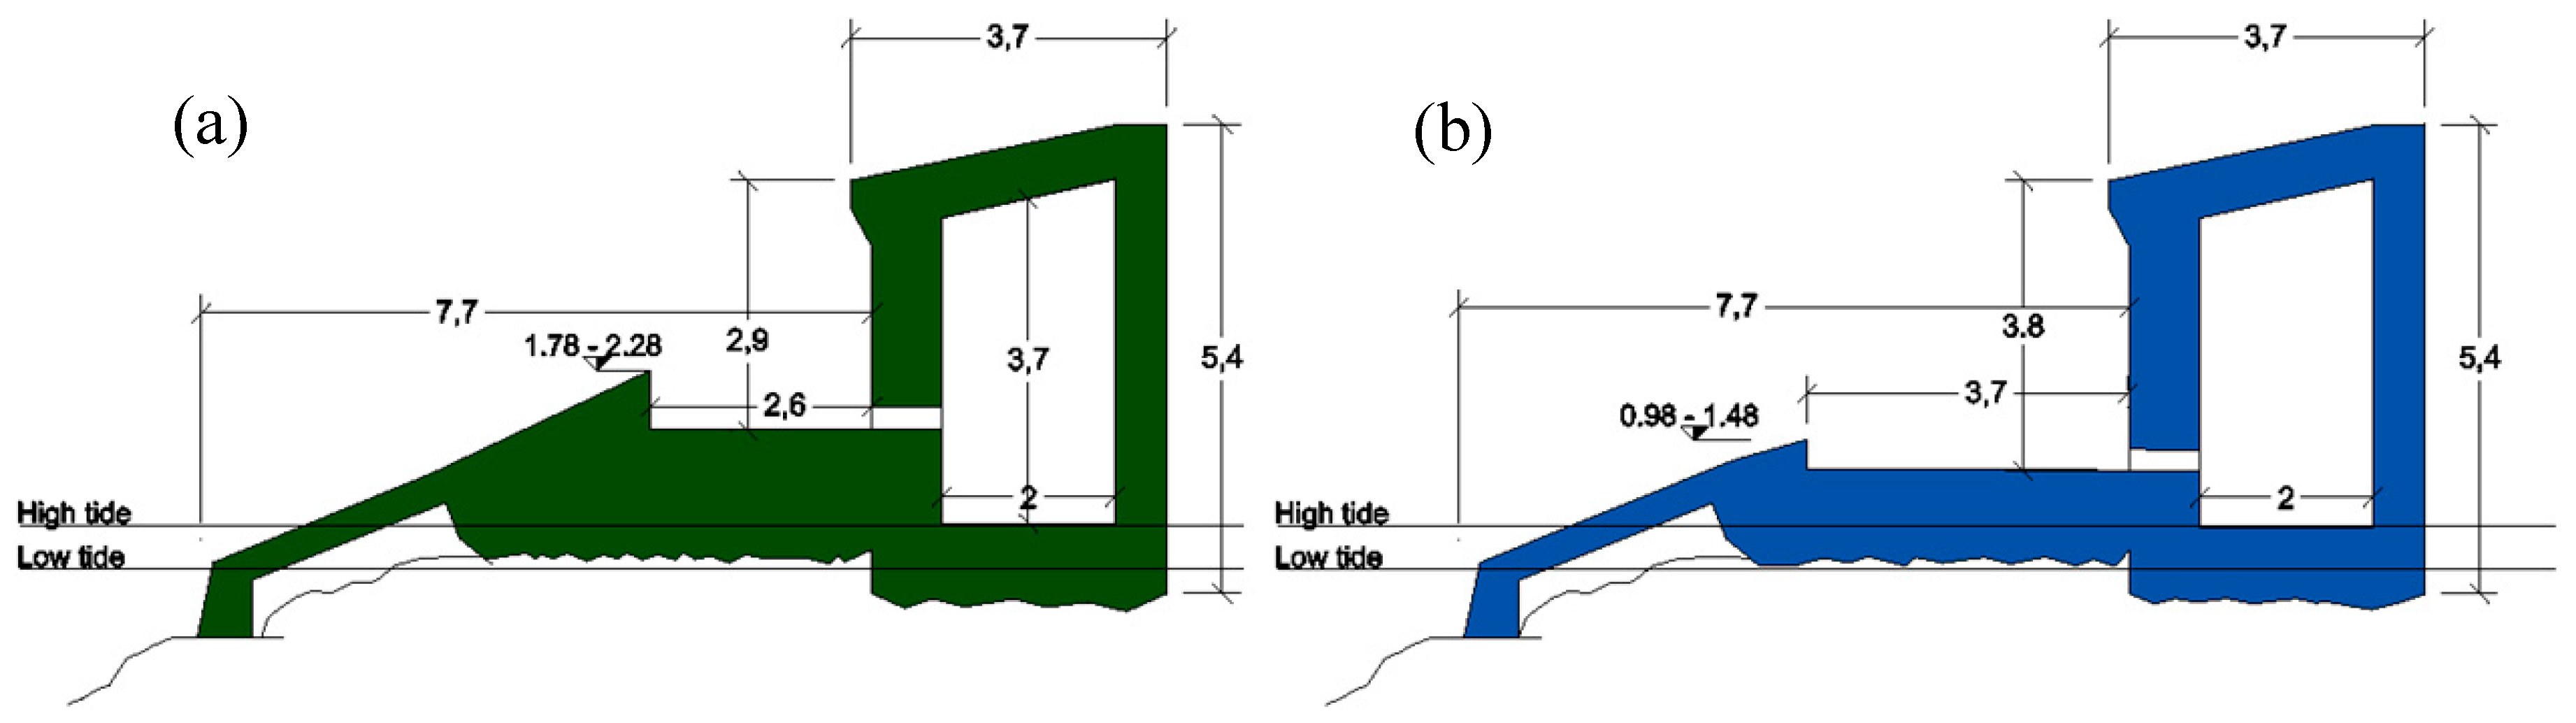
The prototype cross section includes two configurations, i.e., NW-LAB (Natural Waves LABoratory) and RS-LAB (Real Scale LABoratory) shown in
Figure 14.
They are characterized by the same longitudinal dimension, having in common the rear wall and the room for the turbines (
Figure 14). This leads to the main geometric differences in the frontal part of the device. Indeed, they differ mainly in the height of the sloping plate
Rr, and to meet the same spatial constraints, they have different dimensions of the reservoir width
Br. The two values of
Rr have been selected according to the analysis of the typical wave climate of the site and to take into account the different turbine technologies, working with a different nominal head. The intention is not only to provide results for the sea climate at the study site but also to gather useful data easily exportable for more energetic sites. According to the analysis of the typical wave climate, the selected values of
Rr for NW-LAB and RS-LAB are 1.2 m and 2.0 m respectively (values referred to the mean tide level). The corresponding values of the reservoir width are 2.6 m and 3.7 m. The lower value of
Rr was selected according to the mean run-up of the most frequent wave (i.e., H
s = 0.8 m). The upper value of
Rr was intended to capture the higher power generated by the higher waves. Its definition, however, followed a different approach. If one look at the maximum value of the power was multiplied by the wave frequency of occurrence (
F), the prevalent wave height is associated to
Hm0 = 2.2 m,
Tp = 6.8 s. In this case, however, the yearly average frequency of occurrence is too low (
F = 1.4%) corresponding to just five days per year. Therefore, considering that the lowest nominal hydraulic head of the greatest low head Kaplan turbine [
53] is 1.5 m, a ramp crest of about 2 m (1.78÷2.28 m for low- and high-water levels respectively) has been selected. This value can guarantee an average of about 30 equivalent working days per year of the RS-LAB (the name Real Scale, hence, indicates the site-specific considerations made for that ramp crest).
Figure 14 shows, separately, the actual 2D OBREC cross sections, resulting from some modifications on the original project presented in Contestabile [
33]. It is possible to recognize some geometrical details derived from the results obtained from the experiments and the numerical simulations here presented. For instance, the submerged quasi-vertical part of the ramp has been introduced to improve the ramp resistance to bending and to fatigue. Furthermore, the interlocking between the rocks of the armour layer and the device is also enhanced.
As shown in
Figure 12, the smaller reservoir is associated to the higher sloping plate and vice versa. In the first case, the number of overtopped waves is lower and can be handled by a reduced dimension of
Br. The wider reservoir is more appropriate for the lower sloping plate, which is overtopped more frequently. The sensitivity of this parameter with respect to the hydraulic and structural performance, as it has been demonstrated during the experimental and numerical analysis, can be neglected. Therefore, the selection of
Br can be done after the design of
Rr.
To guarantee the harbor safety at the inshore area of the structure, a parapet has been placed on the crown wall. The effectiveness of this element increases as the dimension of the reservoir width decreases, ensuring an adequate safety level for both the configurations.
Differently from the laboratory and the numerical models, the prototype cross sections (
Figure 14) are provided with a wave chamber where a new set of turbines is going to be installed to produce electricity. The bottom elevation of the chamber maximizes its difference with respect to the sea water level. The chamber is linked with the reservoirs by means of holes (
Figure 14) and five pipes (
Figure 14). The lowest hole along the wall aims to collect as much water as possible, maximizing the energy exploitation. The position and the size of the holes and the pipes have not been yet investigated due to the limitations of testing in 2-D conditions. For this reason, a 3-D investigation, capable of reproducing the dynamics between the reservoir and the wave chamber, is needed. The 3-D numerical modelling of the OBREC pilot plant, which is composed by the two configurations here analysed, could improve the representation of the discharge rates. The realistic representation of the pipes can be the key to defining the design criteria to maximize the energy production.
5. Conclusions
The general aim of this paper was to assess the relevance of some geometrical elements of the OBREC cross section in the hydraulic and structural performances. For this purpose, a 2-D numerical model of the OBREC device was calibrated in order
The elements examined during the sensitivity analysis were
(a) the presence of the berm;
(b) the shape of the sloping plate and the introduction of a parapet on the rear wall; and
(c) the reservoir width.
The inclusion of the berm does not change significantly the qreservoir or the pressure distribution along the structure. However, it slightly increases Kr as expected, suggesting the design of a toe protection.
The investigation of a double inclination in the ramp shape was aimed to generalize the OBREC cross section. However, the analysis performed showed that the position of the inclination change is more sensitive than the values of the slope angles. Therefore, it is suggested to locate the slope change point under the still water level in order to minimize the energy losses due to the wave breaking. The benefits of the double-shaped frontal ramp are emphasized considering the effective sloping ramp configuration of the OBREC full scale prototype. In fact, for the OBREC installation above an existing breakwater, the use of prefabricated structures is strongly recommended. In such conditions, a single slope plate is quite difficult to build due to construction requirements. Therefore, the prefabricated ramps cross section can be conveniently constituted by two elements:
1. an auxiliary submerged part with a subvertical face (aimed to improve the ramp resistance to bending and to fatigue) and
2. an emerged plate with the slope angle designed to improve the overtopping of a specific range of wave amplitude and wave frequency.
The reservoir width does not significantly affect the values of Kr and p250, except for the wider reservoir that leads to an unstressed rear wall. Therefore, Br can be selected after the design of the sloping plate, which appeared to be the most sensitive element.
To ensure the harbor safety of the inshore area of the structure, 2 parapets configurations have been analyzed. In extreme conditions, the parapet inclined of 30° reduces the values of qrear by 34%, while the one inclined at 45° was reduced by 41%, on average. The maximum reduction has been measured for the configuration characterized by the smallest reservoir width, i.e., 70% and 80% for ε = 30° and ε = 45°, respectively. Therefore, the inclusion of the inclined parapet leads to a safer harbor area even in case of constrained values of Br. The best results have been obtained for the parapet inclined of 45°, which optimizes the values of qrear without increasing the pressures.


 ,
, 


