Article

The Role of Latent Heat Flux in Tropical Cyclogenesis over the Western North Pacific: Comparison of Developing versus Non-Developing Disturbances

1
Key Laboratory of Meteorological Disaster of Ministry of Education, and Joint International Research Laboratory on Climate and Environment Change, and Collaborative Innovation Center on Forecast and Evaluation of Meteorological Disasters, Nanjing University of Information Science and Technology, Nanjing 210044, China
2
International Pacific Research Center, and Department of Atmospheric Sciences, University of Hawaii at Manoa, Honolulu, HI 96822, USA
3
Guangxi Meteorological Observatory, Nanning 530022, China
*
Author to whom correspondence should be addressed.
J. Mar. Sci. Eng. 2019, 7(2), 28; https://doi.org/10.3390/jmse7020028
Submission received: 25 December 2018 / Revised: 19 January 2019 / Accepted: 23 January 2019 / Published: 28 January 2019

Abstract

:
The possible role of air–sea latent heat flux (LHF) in tropical cyclone (TC) genesis over the western North Pacific (WNP) is investigated using state-of-the-art satellite and analysis datasets. The authors conducted composite analyses of several meteorological variables after identifying developing and non-developing tropical disturbances from June to October of the period 2000 to 2009. Compared to the non-developing disturbances, increased LHF underlying the developing disturbances enhances boundary–layer specific humidity. The secondary circulation then transports more boundary–layer moisture inward and upward and, thus, induces a stronger moist core in the middle troposphere. Accordingly, the air in the core region ascends following a warmer moist adiabat than that in the environment and results in a stronger upper-level warm core, which is associated with a stronger near-surface tangential wind based on the thermal wind balance. This enlarges the magnitude and negative radial gradient of LHF and, thereby, further increases boundary–layer specific humidity. A tropical depression forms when the near-surface tangential wind increases to a certain extent as a result of the continuing positive feedback between near-surface wind and LHF. The results suggest an important role of wind-driven LHF in TC genesis over the WNP.

1. Introduction

Although numerical weather prediction models have been significantly improved over the past few decades, forecasting tropical cyclone (TC) genesis is still an operational challenge. TC genesis remains one of the least understood phenomena in dynamic meteorology due to relative lack of in situ observations of pre-genesis systems compared to mature TCs and diverse theories for the involved fundamental physical processes [1,2,3].
Tropical disturbances over the ocean are the precursors of TCs, and a small portion of them evolve into TCs [4]. Tropical disturbances that develop into TCs are called developing disturbances while all others are called non-developing disturbances. The favorable environmental conditions for TC genesis generally contain warm ocean waters of above 26.5 °C, convective instability, moist mid-tropospheric air, weak vertical wind shear, a pre-existing low-level disturbance, and a location of at least a few degrees off the equator [5,6]. Previous studies compared various features of developing and non-developing disturbances. Developing systems were associated with significantly stronger low-level relative vorticity, upper-level divergence and vertical motion, weaker vertical wind shear, and more import of relative angular momentum [7,8]. Lee [9,10] further attributed stronger lower-level cyclonic circulation of developing systems to larger inward eddy vorticity fluxes associated with stronger surrounding large-scale circulation, such as monsoon trough, low-level trades and wind surges. In addition to the above large-scale environment, Chan and Kwok [11] also identified the roles of upper-level troughs (the Tropical Upper-Tropospheric Trough or westerly trough) in TC genesis. Through the comparison of various factors, dynamic factors, such as low-level vorticity and horizontal shear of zonal wind, were shown to be more important in TC genesis over the western North Pacific (WNP) and South China Sea [12,13] while thermodynamic variables, such as lower and middle tropospheric moisture and sea surface temperature (SST), were more important in TC genesis over the North Atlantic [14].
Recent studies have utilized satellite, radar, or dropsonde data. Compared to non-developing disturbances, developing disturbances were found to be associated with higher latent heat release [15], lower saturation deficiency in middle troposphere [16], progressive middle-level moistening in the inner-core region [16,17], low-level convergence and cyclonic vorticity and high total precipitable water [18], deeper convection [19,20], larger rainfall area [21], development of upper-level warm core [22,23,24] yet lower convective available potential energy [22]. TC genesis was also suggested to result from the combined contribution by different precipitation types associated with shallow cumulus, mid-level convection, and deep convection [25].
Theoretically, air–sea latent heat flux (LHF) is the primary energy source fueling TC development, e.g., [26,27]. Emanuel [27] proposed the famous wind-induced surface heat exchange (WISHE, also known as the wind-evaporation feedback) theory for TC development. Although local evaporation only contributes a small fraction of the total condensation in a simulated TC [28], Murthy and Boos [29] showed that surface enthalpy fluxes and their negative radial gradients were necessary for TC spinup using idealized simulations. A few studies have shown the crucial role of LHF in TC intensification using observation data, e.g., [30,31,32,33,34,35,36]. However, as none of the observational studies have examined the role of LHF in TC genesis, it is, therefore, of great interest to compare LHF as well as several related dynamic and thermodynamic variables associated with developing and non-developing tropical disturbances over the WNP based on state-of-the-art satellite and analysis datasets. The remainder of the paper is organized as follows. Section 2 describes the data and methods. Composite results are presented in Section 3. Conclusions and discussion are given in Section 4.

2. Data and Methods

2.1. Data

TC best track data are obtained from the Joint Typhoon Warning Center (JTWC). The dataset provides 6-hourly estimates of TC locations and 1-min maximum sustained wind speeds over the WNP starting from the tropical disturbance stage.
Ocean surface vector winds are acquired from the Cross-Calibrated Multi-Platform (CCMP) version 2 (V2) dataset [37] produced by the Remote Sensing Systems (RSS). It is a 6-hourly and 0.25-degree product combined using a variational analysis method [38]. Data sources include version-7 RSS radiometer wind speeds from the Advanced Microwave Scanning Radiometer for Earth Observing System (AMSR-E), the Special Sensor Microwave/Imager (SSM/I), the Tropical Rainfall Measuring Mission’s Microwave Imager (TMI), and the WindSat, version-7 RSS scatterometer wind vectors from the Quick Scatterometer (QuikSCAT) and the Advanced Scatterometer (ASCAT), moored buoy wind data, and the European Center for Medium-Range Weather Forecasts (ECMWF) ReAnalysis Interim (ERA-Interim) wind fields. CCMP version 1.1 product [37] was found to underestimate high winds (>17 m s−1) under TC conditions [39]; however, CCMP V2 product is much improved at high winds [37]. In addition, our focus is the tropical disturbance/depression stage with winds weaker than 17 m s−1, CCMP V2 dataset is, therefore, appropriate for this study.
Daily LHF and associated bulk variables are obtained from the IFREMER (The Institut Français de Recherche pour l’Exploitation de la Mer) v3 (IFREMER3) satellite-based product at a 0.25-degree resolution [40]. LHF is computed using the COARE 3.0 bulk aerodynamic algorithm [41].
L H F = ρ a L v C E U ( Q s Q a ) ,
where ρa is air density, Lυ is latent heat of vaporization, CE is turbulent exchange coefficient for latent heat, U is wind speed at 10 m, Qs is 98% of saturation specific humidity at the SST accounting for salinity effect, and Qa is specific humidity at 10 m. The input bulk variables U is from the QuikSCAT winds, SST is from the Reynolds daily Optically Interpolated (OI) SST, and Qa is estimated from the SSM/I brightness temperatures. In the tropics, the bias and root-mean-square error of LHF are 2 and 31 W m−2, respectively [40].
Daily mean specific humidity, temperature, and three-dimensional wind fields are derived using the National Centers for Environmental Prediction (NCEP) Final (FNL) analysis at the resolutions of 1.0° and 6 h [42]. The FNL data is chosen in this study because it is the most commonly used dataset for synoptic-scale TC studies, e.g., [34,43]. It has been shown to outperform the other modern reanalyses/analyses, such as the NCEP Climate Forecast System Reanalysis (CFSR), the Modern-Era Retrospective analysis for Research and Applications, version 2 (MERRA-2) and the Japanese 55-year Reanalysis (JRA-55), in representing structure and intensity of a hurricane case [44]. FNL may well represent tropical disturbances/depressions due to assimilation of numerous observational data including scatterometer/radiometer winds from QuikSCAT, ASCAT, WindSat, and SSM/I [45], although it underestimates high winds (>17 m s−1) under TC conditions [43].
Our study period is June to October of 2000–2009, during which all the above-mentioned four datasets were available.

2.2. Methods

Similar to [12,14], two groups of tropical disturbances over the tropical WNP (130–180° E, 5–25° N), i.e., developing and non-developing disturbances, are identified using daily mean CCMP 10-m vector winds and the derived relative vorticity. This study area is chosen to avoid the influence of topography and in consideration of enough Coriolis force for the development of tropical disturbances. Four aspects are different from [12,14]. First, the 3 to 8-day band-pass filter is not used before the identification, because our concern is the variables that may play roles in TC genesis regardless of the time scales. Second, given the cyclonic circulation center and the location of maximum relative vorticity do not always overlap [46], the disturbance center is defined as the cyclonic circulation center where exists a wind minimum surrounded by a cyclonic circulation, as wind is an important variable to be analyzed. Third, we designate day 0 of non-developing disturbances as the time they have the maximum 10-m relative vorticity, to unravel what happens before day 0 to inhibit the development. Fourth, the threshold of maximum 10-m relative vorticity for excluding weak non-developing disturbances is different from [12,14]; it is obtained with sensitivity tests to make the intensity of non-developers at day −3 be similar to that of developers.
The identification of developing disturbances is straightforward. Based on the best-track data, we designate day 0 as the genesis day when a TC is first assigned as a tropical depression by the JTWC and one day after genesis (day +1) is also identified. The disturbances are then subjectively traced backward three days before genesis (i.e., day −1, −2, and −3). The disturbance center at the TC genesis day or the previously identified disturbance center is used as the first guess [46]. A radius of 1000 km is used to search the disturbance center on the previous day, given the displacement velocity of less than 10° longitude per day for tropical disturbances [47]. In case there are multiple circulation centers for weak precursors, the circulation center closest to the maximum 10-m relative vorticity is selected.
The identification of non-developing disturbances requires three criteria: (1) the radius of the cyclonic circulation ≥400 km; (2) the maximum 10-m relative vorticity ≥3 × 10⁻⁵ s−1, and (3) the fulfillment of the first two criteria for at least three consecutive days. Short-lived and weak disturbances are, therefore, omitted. The radius of a cyclonic circulation is defined as the outermost radius where the 10-m winds of the four grid points to the east, south, west, and north of its center are cyclonic (i.e., unorth <0 & usouth >0 & veast >0 & vwest <0). As with the identification of developing disturbances, we use a maximum displacement velocity of 1000 km per day to ensure that the centers of a single disturbance are followed during its lifespan. We designate day 0 as the time of the lifetime maximum intensity for non-developing disturbances.
During our study period, 75 developing disturbances are identified and 45 non-developing disturbances. Their tracks are indicated in Figure 1. There are some straight-moving disturbances follow westward paths, which are not rare for tropical disturbances. The smaller number of non-developing disturbances than developers is because lots of weak or short-lived non-developing disturbances are intentionally excluded to make sure two groups of disturbances have similar initial intensity for fair comparison. Figure 2 shows the time series of intensity for the developing and non-developing disturbances, which is defined as the mean 10-m relative vorticity within 2° from the center. The different numbers of samples during the five days are due to different lifespans of the disturbances. Both groups of disturbances have similar intensity at day −3 and −2 without significant differences. The developing group intensifies progressively from day −3 to day +1, while the non-developing group intensifies until day 0 and then decays. The difference in intensity between the two groups becomes significant from day −1 to day +1, indicating that some physical processes for the non-developing (developing) disturbances hinder (favor) the TC genesis since day −1. Figure 3 shows the time series of magnitude of 850 to 200-hPa vertical wind shear averaged within 200 to 800 km from the center, which is the most commonly used area for shear calculation, e.g., [33,34,43]. Shear averaged within other areas shows similar results. The shear is calculated after removing the vortex following [48]. The non-developing disturbances are associated with similar shear to the developers at day −3 and day −2. After that, the developing disturbances have larger shear than the non-developers, and their difference is significant only at day +1. It is suggested that wind shear is not a key variable determining whether the tropical disturbances develop, consistent with [12].
LHF, as well as several dynamic and thermodynamic variables in 16° × 16° boxes around the disturbance center, are then composited to ascertain the differences between the developing and non-developing disturbances and understand the critical physical processes responsible for TC genesis. Composites are performed at day −3, −2, −1, 0 and +1 for both groups of disturbances.

3. Results

3.1. LHF and Bulk Variables

Composite LHF is shown in Figure 4. For the developing disturbances, LHF increases markedly during the five-day period (Figure 4a–e). Compared to the non-developers, the developing disturbances (Figure 4f–j) are associated with comparable LHF within a radius of 4° but significantly higher LHF outside a radius of 5° from day −3 to day –2, and have significantly higher LHF at all radii within 8° from day −1 to day +1 (Figure 4k). This suggests that LHF plays important roles in TC genesis; its significant role first occurs in the outer region and then intrudes into the inner region. The maxima of radial mean LHF associated with the developing disturbances are located at three degrees from the center from day −1 to day +1, closer to the center than the earlier stages of their evolution (Figure 4k). The developing disturbances apparently show the larger negative radial gradients in LHF between the radius of maximum LHF and the outer region than the non-developers (Figure 4k,l), consistent with [29] which showed the importance of the negative radial gradients in enthalpy flux for TC spinup using idealized simulations. Rapidly intensifying TCs are also associated with a sharper radial gradient in LHF compared to non-rapidly intensifying TCs [33].
Since LHF is proportional to SST and surface wind speed, e.g., [33,34], both of them are then analyzed. Figure 5 shows the composite SST from IFREMER3. SST shows a slight decrease from day –3 to day +1 for the developing disturbances (Figure 5a–e). This is different from the increasing tendency of LHF during the five-day period (Figure 4a–e). The non-developing disturbances are associated with slightly higher SST than the developing disturbances from day −1 and day +1 (Figure 5k,l), possibly because developing disturbances gradually move to the higher latitudes (not shown) and attain more heat from the ocean via higher LHF (Figure 4). However, their differences in SST are insignificant during the five-day period (Figure 5k). Note that SSTs underlying the developing and non-developing disturbances are much higher than the necessary condition of 26.5 °C for TC genesis [5,6]. This suggests that SST does not play a crucial role in higher LHF associated with the developing disturbances compared to the non-developers.
Figure 6 indicates the composites of 10-m wind speed from IFREMER3. The CCMP 10-m wind speed is also composited and shows very similar pattern (not shown). Similar to LHF (Figure 4), 10-m wind speed of the developing disturbances increase markedly (Figure 6a–e), while the changes in wind speed of the non-developers are rather small during the five-day period (Figure 6f–j). Compared to the non-developers, the developing disturbances have comparable winds within a radius of 3° (4°) but significantly stronger winds outside a radius of 4° (5°) at day −3 (−2), and have significantly stronger winds at all radii within 8° from day −1 to day +1 (Figure 6k,l). Radial mean wind speed (Figure 6k,l) also shows a similar distribution to LHF (Figure 4k,l); the radius of maximum wind shrinks as TC genesis proceeds (Figure 6k) while the radius of maximum wind barely changes for the non-developers (Figure 6l). The results suggest the critical role of winds in determining magnitude and pattern of LHF underlying two groups of disturbances. The effect of winds takes place in the outer region two to three days before TC genesis and then extends to the inner region when the disturbances strengthen. As shown in Figure 7, the stronger surface winds initially in the outer region of the developing disturbances are likely associated with the confluence zone of a monsoon trough (Figure 7a–e), while the non-developers seem to move away from the monsoon trough and the monsoon trough gets weaker during the five-day period (Figure 7f–j). This is consistent with the findings that monsoon trough is favorable for TC genesis, e.g., [46,49,50,51,52,53,54,55,56]. The results suggest that the wind-evaporation feedback (i.e., WISHE) is likely an important pathway of TC genesis. This is different from a more crucial role of SST than 10-m winds in determining high LHF underlying rapidly intensifying TCs [33,34].

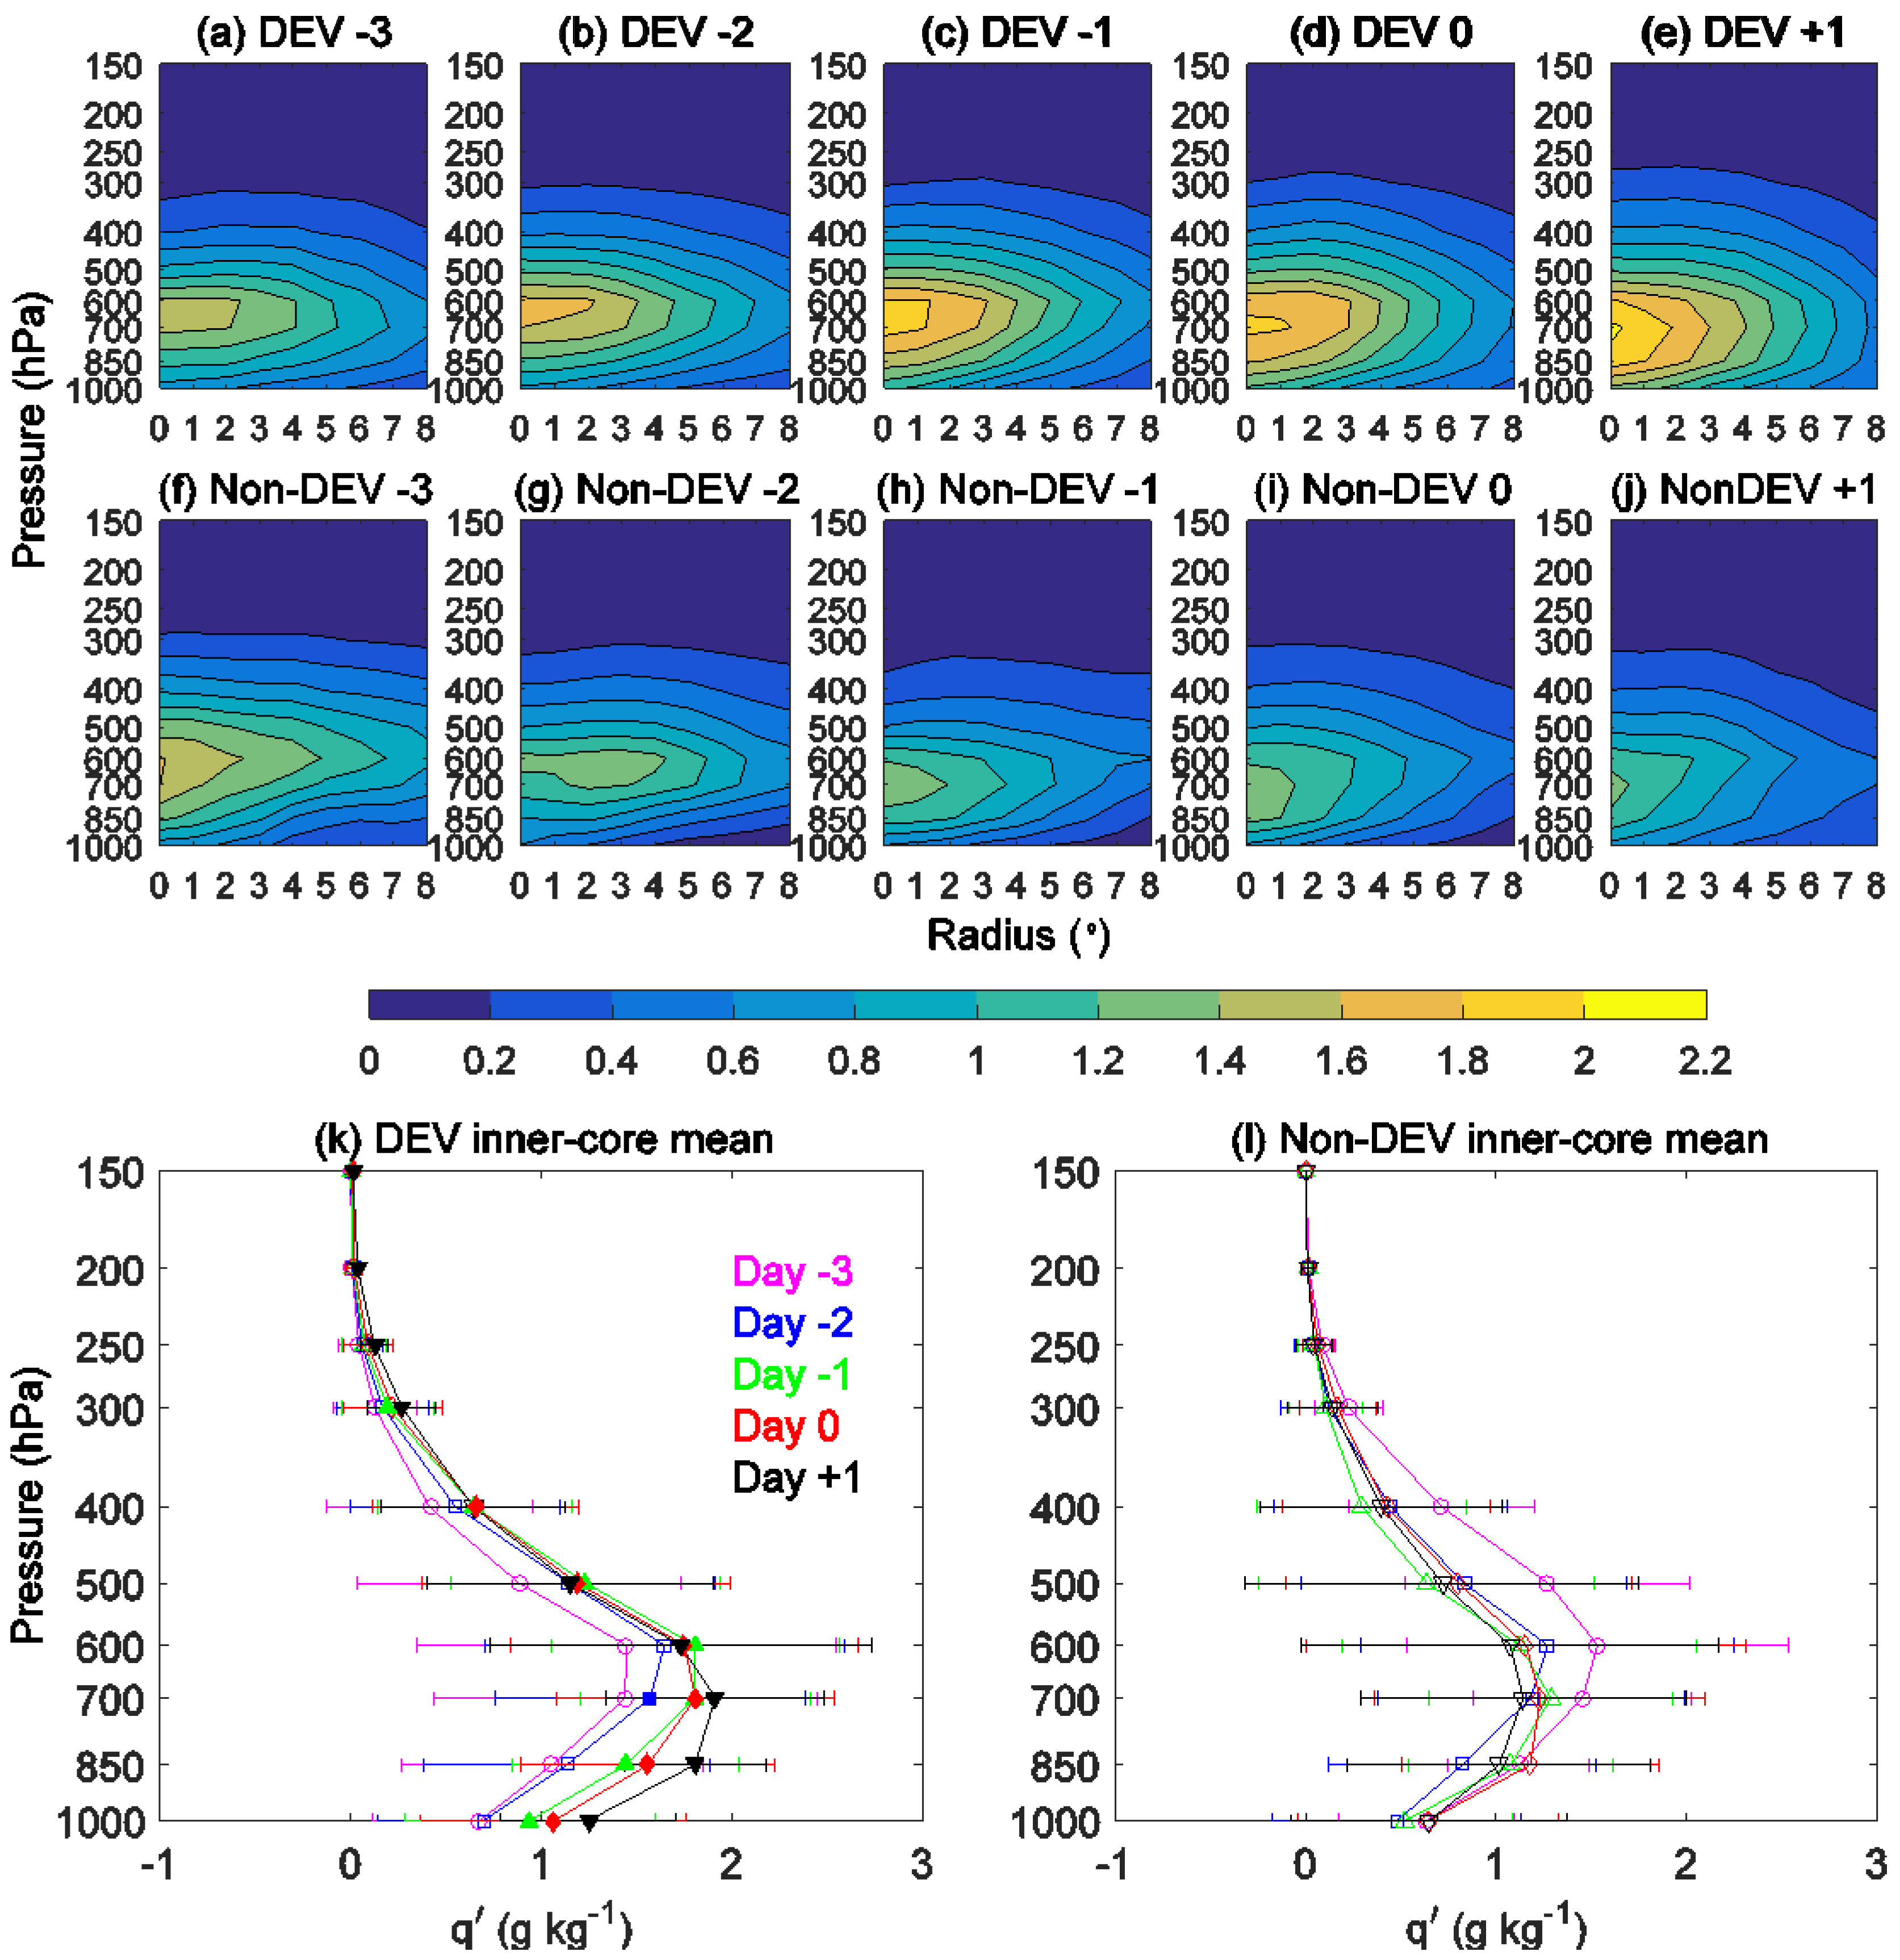
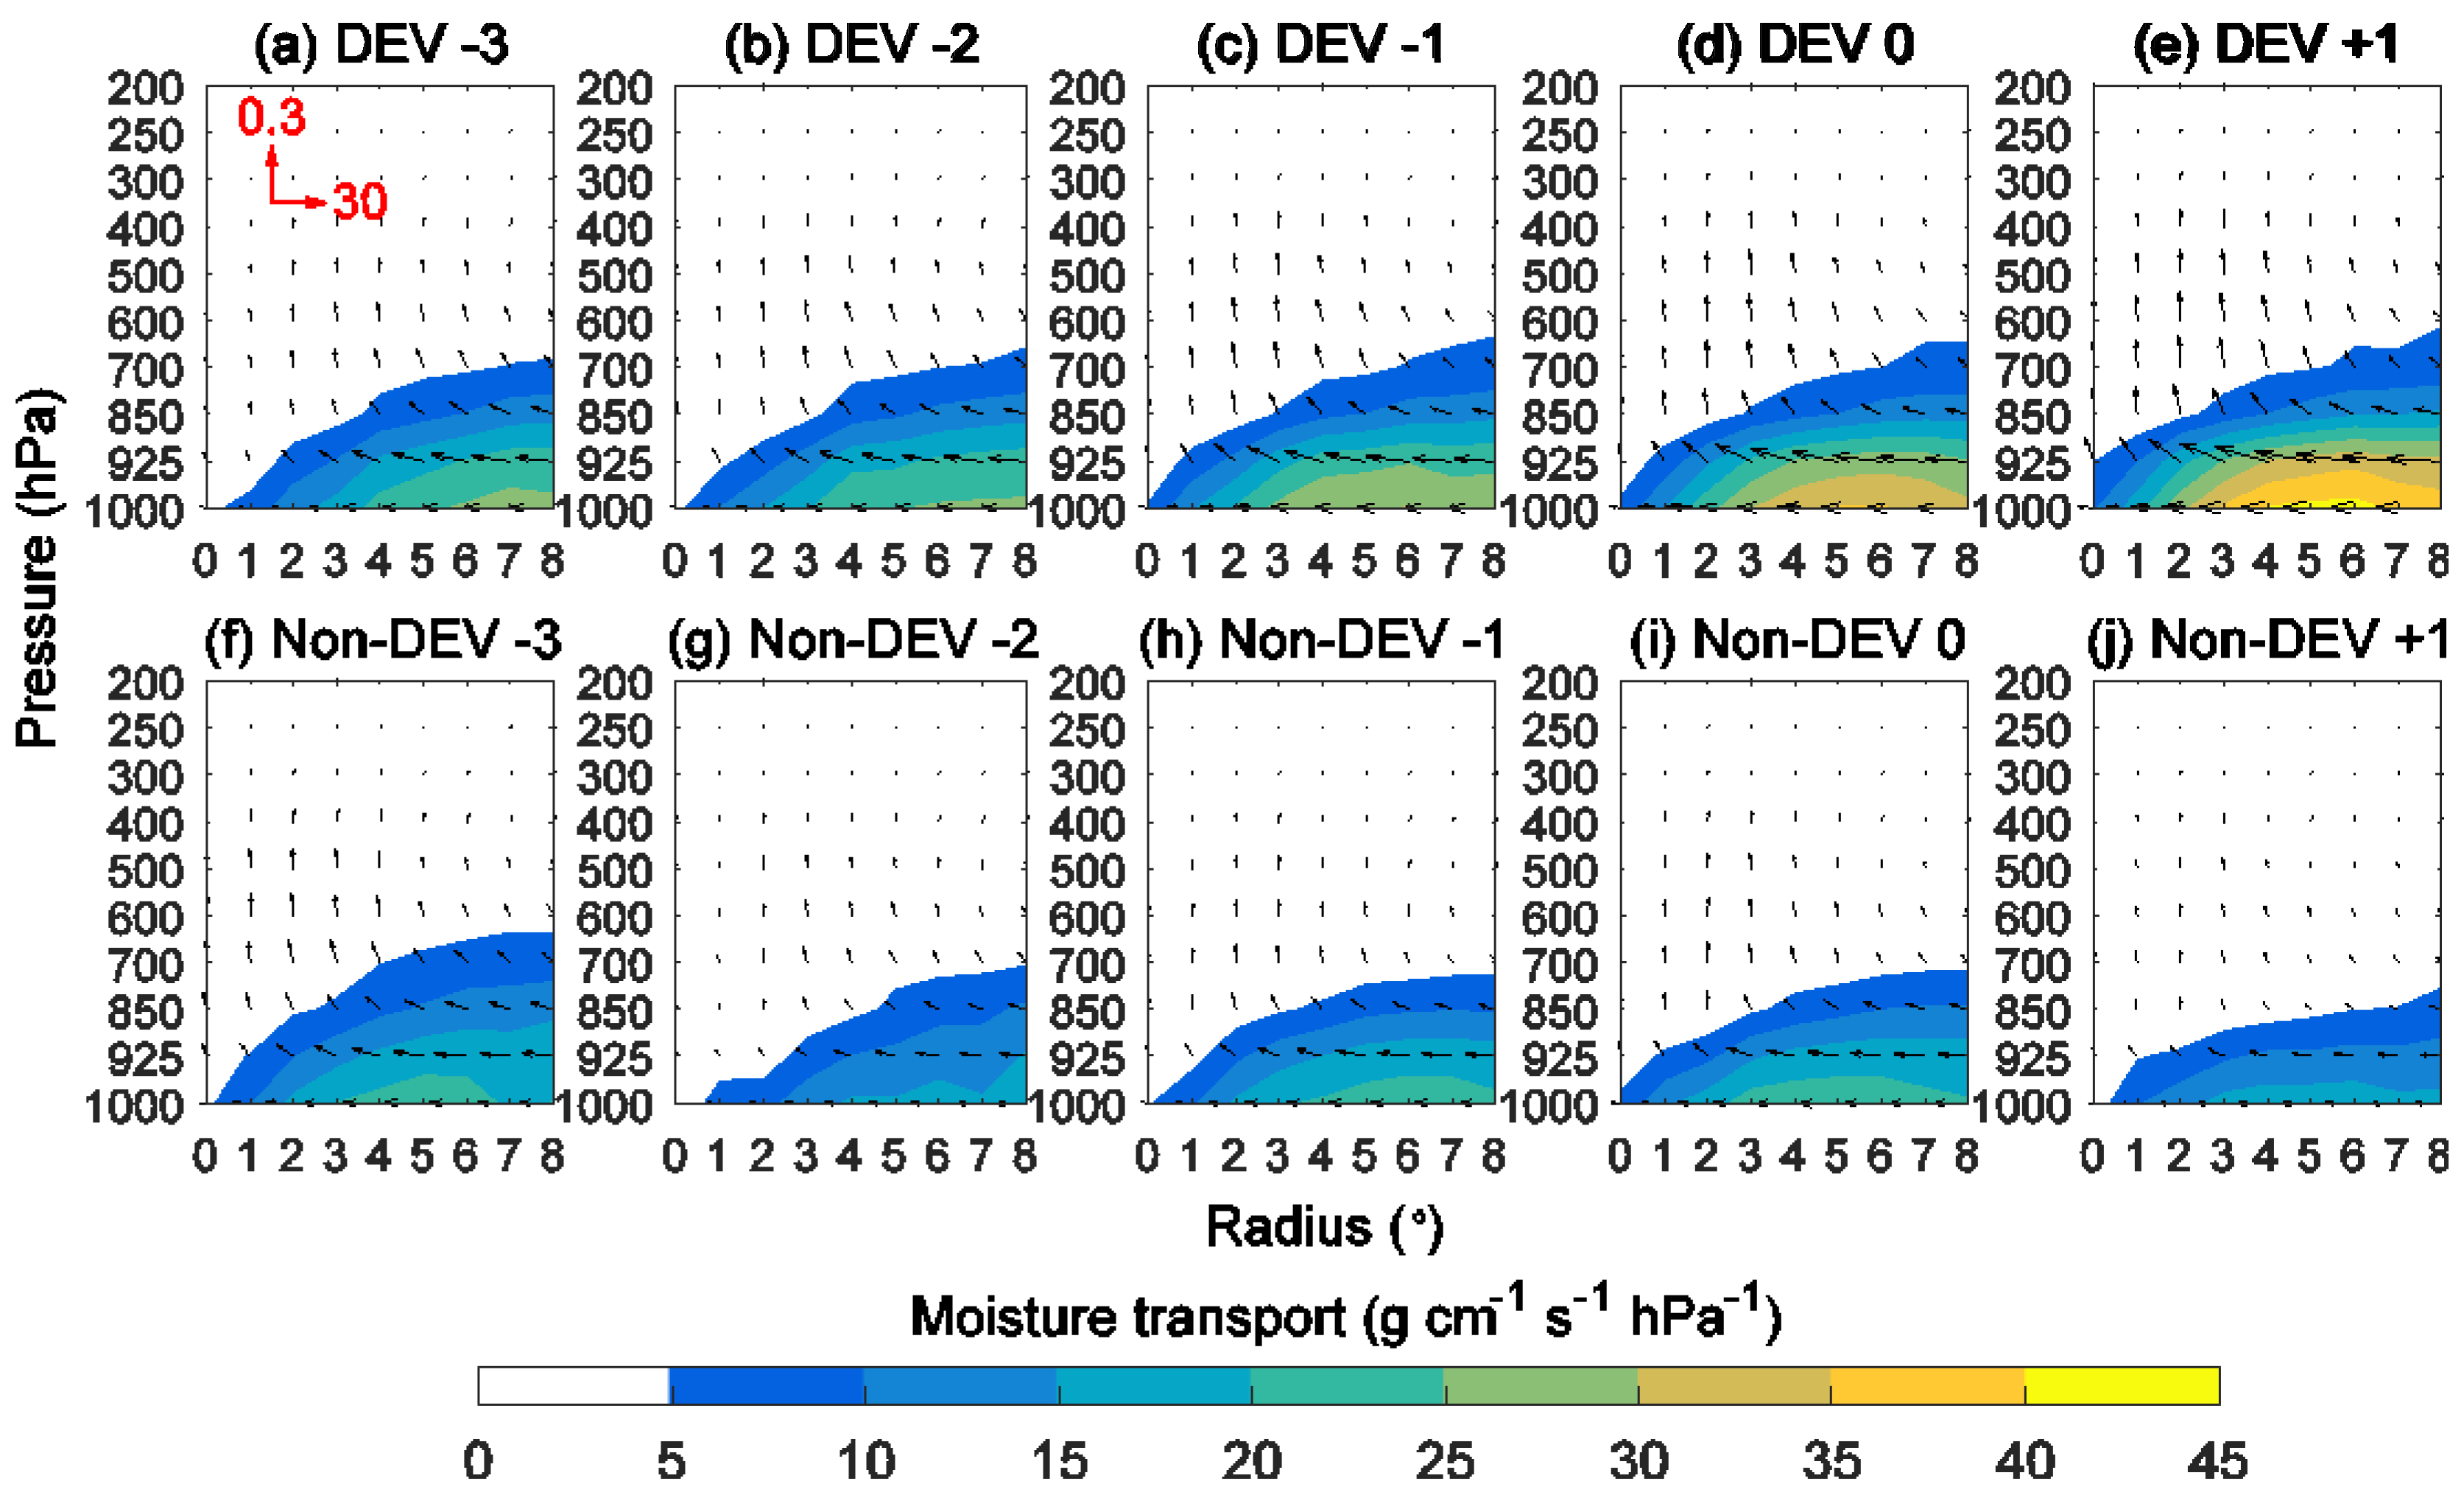
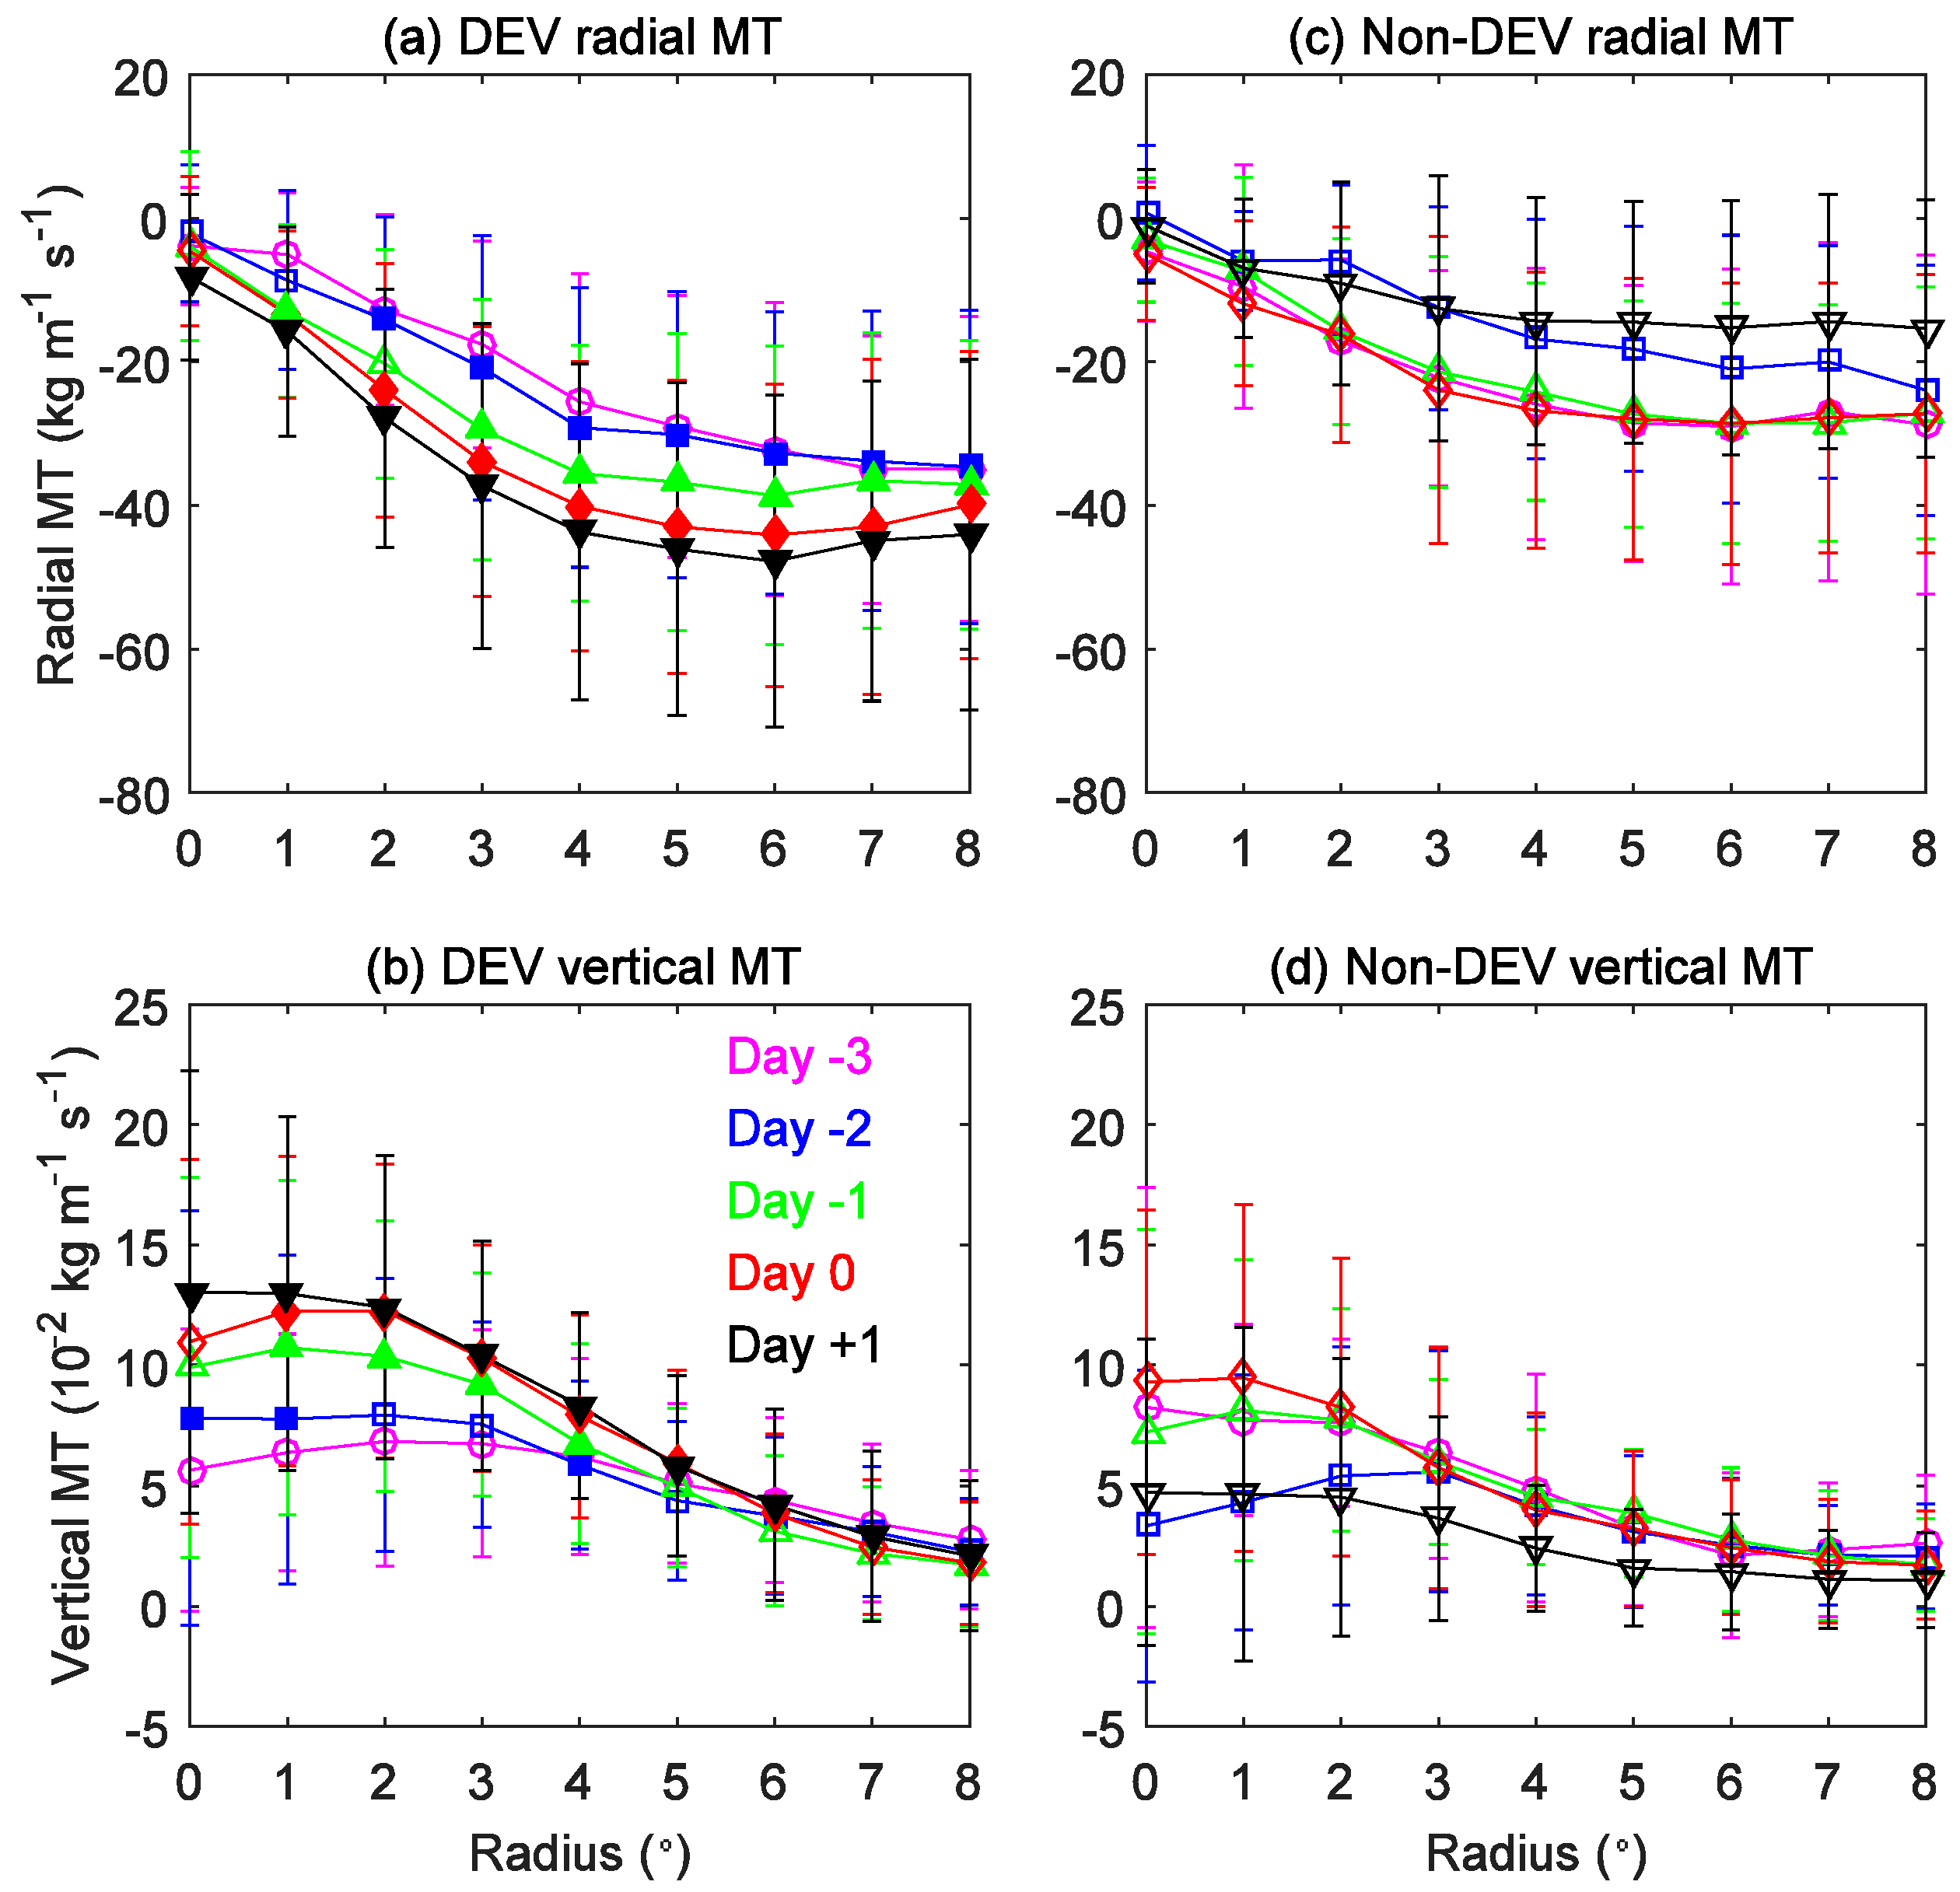
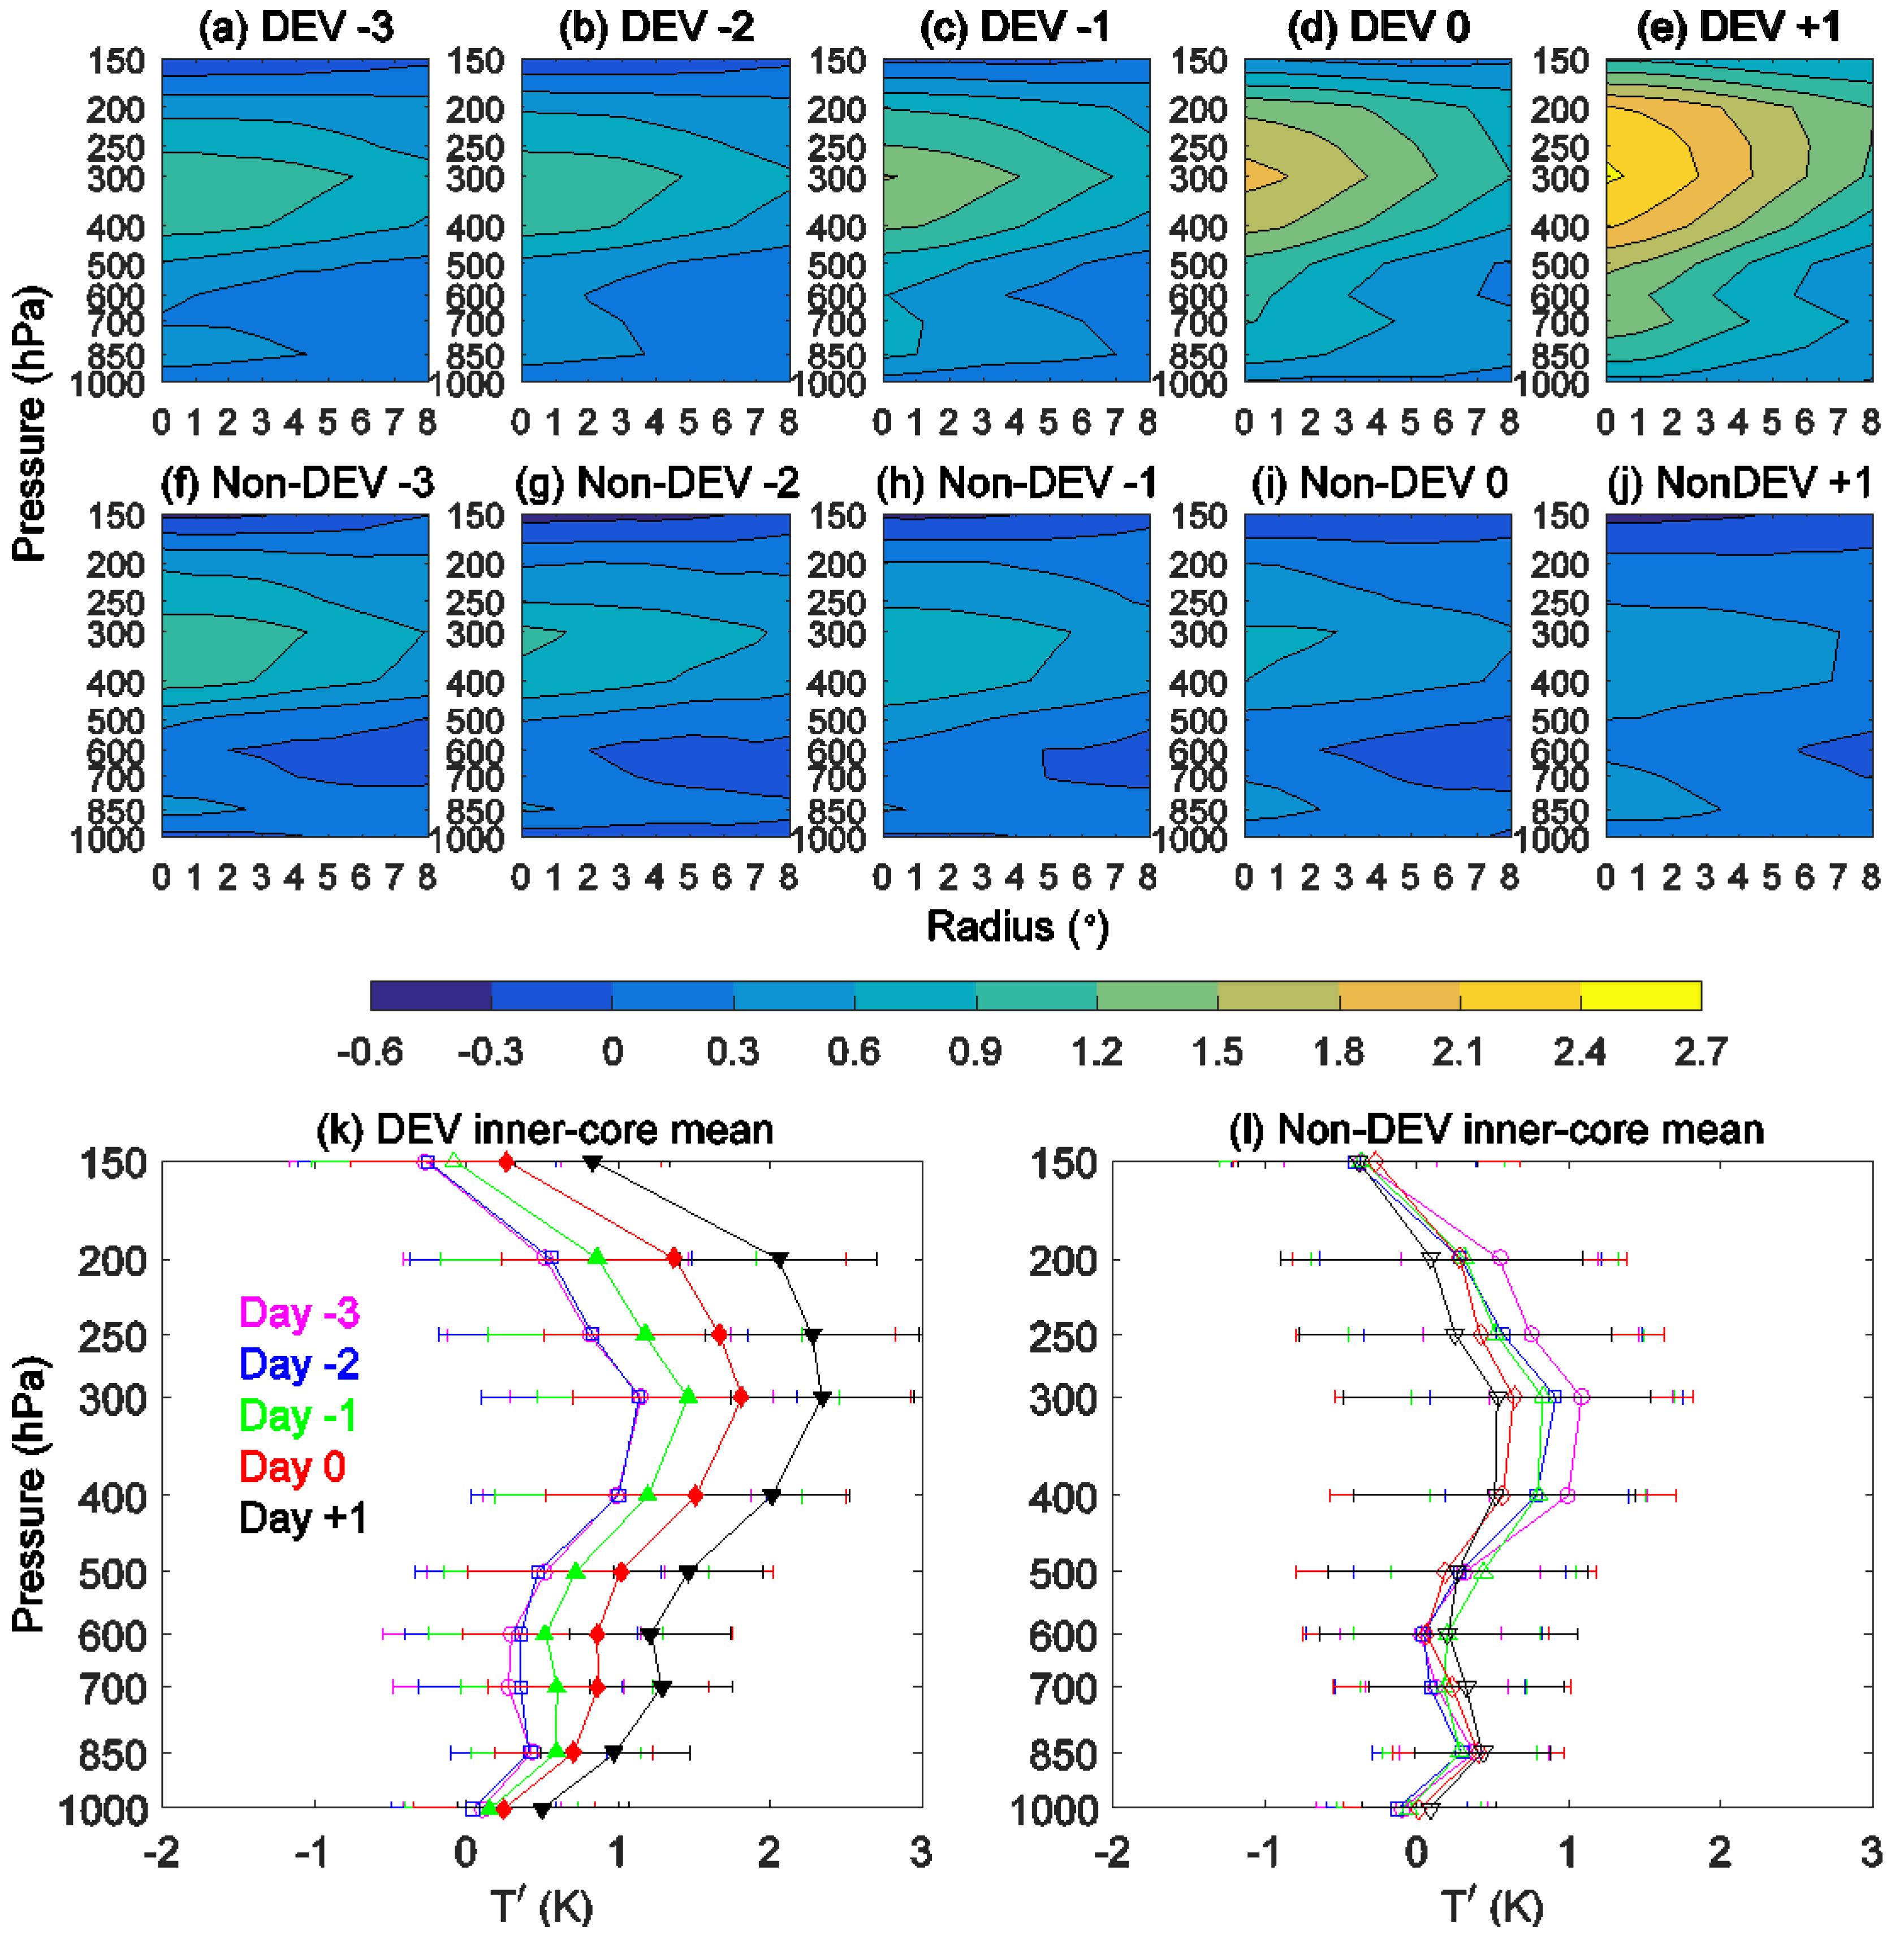
3.2. Thermodynamic and Dynamic Profiles

To confirm the role of the wind-evaporation feedback in TC genesis, the profiles of several related meteorological variables are further examined. Because the values of specific humidity and temperature are in wide ranges throughout the troposphere, we composite their anomalies, which are obtained by subtracting the mean soundings over the tropical WNP, to better illustrate the differences between two groups of disturbances. The mean soundings of temperature and specific humidity (not shown) are calculated over the region (130°–180° E, 0°–25° N) during our study period using the FNL data. Figure 8 indicates the composite radius–height cross sections of azimuthal-mean specific humidity anomalies and their inner-core (within 2°) mean profiles. Both groups of disturbances exhibit the moist cores, consistent with the moist cores of TCs from satellite observations, e.g., [33]. Specific humidity anomalies for both groups maximize in the middle troposphere (i.e., 700–600 hPa). The moist core generally becomes stronger as the developing disturbances evolve from day −3 to day +1 (Figure 8a–e) while the moist core of non-developers shows a sharp decrease from day −3 to day −2 and then never recovers (Figure 8f–j). The moist cores of the developing disturbances are significantly stronger than those of the non-developers from day −2 to day +1 (Figure 8k,l). This suggests the important role of inner-core mid-level moistening in TC genesis, which is in line with previous studies [16,17,23,57,58]. In addition, the developing disturbances are always associated with moister boundary layer in the outer region than the non-developers during the five-day period.
The inner-core mid-level moistening for the developing disturbances can result from the increasing inward and upward moisture transports by the secondary circulation (Figure 9a–e and Figure 10a,b). The relative magnitudes of boundary-layer specific humidity (Figure 8k) are consistent with those of LHF (Figure 4k) during the five-day period despite of different locations of their radial maxima, indicating that higher boundary-layer specific humidity approaching genesis is likely attributed to the inward and upward transports of larger oceanic evaporation (i.e., LHF) by the secondary circulation (Figure 10a,b). Variations of LHF (Figure 4l) and moisture transports (Figure 9f–j and Figure 10c,d) are also in line with the change in specific humidity (Figure 8l) for the non-developers.
The composite profiles of temperature anomalies and wind fields are shown in Figure 11 and Figure 12, respectively. Both groups of disturbances have the maximum warm cores at 300 hPa (Figure 11), consistent with the theoretical calculation of Emanuel [27]. The upper-level warm cores of the developing and non-developing disturbances at day −3 have comparable strength of approximately 1 K (Figure 11a,f) with no significant difference (Figure 11k,l). The warm core of developing disturbances then keeps strengthening and reach the strength of approximately 2 K at day 0 and approximately 2.5 K at day +1 (Figure 11b–e). The upper-level warm-core strength of the non-developing disturbances gradually weakens during the five-day period although their lower-level warm core slightly strengthens since day 0 (Figure 11f–j). Furthermore, the warm cores of the developing disturbances are significantly stronger than those of the non-developing disturbances from day −1 to day +1 (Figure 11k,l). Based on the thermal wind balance, e.g., [27,59], the strengthening of the warm core is associated with an increase in the maximum tangential wind at the top of the boundary layer (Figure 12a–e). Turbulent mixing processes in the boundary layer, e.g., [60], further transfer this wind increase to the surface (Figure 12a–e) and leads to TC genesis. The strengthening of the upper-level warm core for the developing disturbances is consistent with [22,23,24] and resembles the WISHE paradigm described by Dolling and Barnes [61] in their Figure 10. That is, the air in the core region ascends (Figure 12) along a warmer moist adiabat compared to that in the environment (due to the existence of a moist core as shown in Figure 8), leading to the maximum warm core in the upper troposphere (Figure 11).

4. Conclusions and Discussion

We investigate the effects of LHF in TC genesis over the WNP using state-of-the-art satellite and analysis datasets at the first attempt. Developing and non-developing tropical disturbances over the WNP were identified. Composite analyses of several variables show that LHF plays an important role in the development of tropical disturbances into tropical depressions (i.e., TC genesis), although local evaporation is shown to only account for a small fraction of the total condensation in the TC genesis process [28]. Compared to the non-developing disturbances, the developing disturbances of similar initial intensity are associated with stronger winds in the outer environment at three to two days before genesis. This leads to an increase in LHF and, thus, an increase in boundary–layer specific humidity therein. Larger inward and upward moisture transports associated with the secondary circulation result in a stronger middle-level moist core at two days before genesis. Air in the core region rises along a warmer moist adiabat than that in the environment, giving rise to a stronger upper-level warm core at two to one day before genesis. The stronger warm core is associated with a stronger surface tangential wind based on the thermal wind balance. This enlarges the magnitude and negative radial gradient of LHF and, therefore, further increases the boundary-layer specific humidity both in the inner region and outer environment. TC genesis eventually occurs as the positive feedback between surface wind and LHF continues. In general, our observational results agree with the WISHE theory [27] and the modelling work by Murthy and Boos [29].
Our observational finding on the role of surface winds in enhancing LHF and, thus, favoring WNP TC genesis is worthy to be verified using numerical simulations. Larger moisture transports associated with the stronger secondary circulation and higher LHF for the developing disturbances imply that the positive feedback between primary circulation, secondary circulation, and LHF is important for TC genesis, as suggested by Fritz and Wang [28]. Their relative importance warrants further thorough investigation. Besides the role of boundary–layer processes considered in this study, other factors, such as dry-air intrusion, large-scale subsidence, suppressing deep convection, etc., may also contribute to the weakening of moist core for the non-developing disturbances and, thus, hinder TC genesis. Future works are needed to distinguish their roles in TC genesis using numerical experiments.

Author Contributions

Conceptualization, S.G.; Methodology, S.G. and T.L.; Formal analysis and investigation, S.G., S.J., Y.W., T.L., S.Z. and X.S.; Writing—original draft, S.G.; Writing—review and editing, S.G., T.L. and X.S.

Funding

This research was funded by the National Natural Science Foundation of China (41575078, 41630423, 41530427), the China National 973 Project (2015CB453200), the U.S. Naval Research Laboratory (N00173-16-1-G906), and the Priority Academic Program Development of Jiangsu Higher Education Institutions (PAPD).

Acknowledgments

Discussions with Xuyang Ge were appreciated. The JTWC TC best-track data are available at http://www.metoc.navy.mil/jtwc/jtwc.html?best-tracks. The CCMP V2 vector wind analyses are produced by the Remote Sensing Systems, data are available at http://www.remss.com/measurements/ccmp/. The IFREMER3 product is provided by the IFREMER at ftp://ftp.ifremer.fr/ifremer/cersat/products/gridded/flux-merged/v3/. The NCEP FNL analysis is provided by the National Center for Atmospheric Research at http://rda.ucar.edu/datasets/ds083.2. In this paper, the datasets were processed and the figures were plotted using version R2016a of MATLAB manufactured by The MathWorks, Inc. at Natick, MA, USA.

Conflicts of Interest

The authors declare no conflict of interest. The funders had no role in the design of the study; in the collection, analyses, or interpretation of data; in the writing of the manuscript, or in the decision to publish the results.

References

  1. Tory, K.J.; Frank, W.M. Tropical cyclone formation. In Global Perspectives on Tropical Cyclones, from Science to Mitigation; Chan, J.C.L., Kepert, J.D., Eds.; World Scientific: Singapore, 2010; pp. 55–92. [Google Scholar]
  2. Li, T. Synoptic and climatic aspects of tropical cyclogenesis in western North Pacific. In Cyclones: Formation, Triggers and Control; Oouchi, K., Fudeyasu, H., Eds.; Nova Science Publishers Inc.: Hauppauge, NY, USA, 2012; pp. 61–94. [Google Scholar]
  3. Montgomery, M.T. Recent advances in tropical cyclogenesis. In Advanced Numerical Modeling and Data Assimilation Techniques for Tropical Cyclone Prediction; Mohanty, U.C., Gopalakrishnan, S.G., Eds.; Springer: Dordrecht, The Netherlands, 2016; pp. 561–587. [Google Scholar]
  4. Hennon, C.C.; Papin, P.P.; Zarzar, C.M.; Michael, J.R.; Caudill, J.A.; Douglas, C.R.; Groetsema, W.C.; Lacy, J.H.; Maye, Z.D.; Reid, J.L.; et al. Tropical cloud cluster climatology, variability, and genesis productivity. J. Clim. 2013, 26, 3046–3066. [Google Scholar] [CrossRef]
  5. Gray, W.M. Global view of the origin of tropical disturbances and storms. Mon. Weather Rev. 1968, 96, 669–700. [Google Scholar] [CrossRef]
  6. Gray, W.M. The formation of tropical cyclones. Meteorol. Atmos. Phys. 1998, 67, 37–69. [Google Scholar] [CrossRef]
  7. McBride, J.L. Observational analysis of tropical cyclone formation. Part III: Budget analysis. J. Atmos. Sci. 1981, 38, 1152–1166. [Google Scholar] [CrossRef]
  8. McBride, J.L.; Zehr, R. Observational analysis of tropical cyclone formation. Part II: Comparison of non-developing versus developing systems. J. Atmos. Sci. 1981, 38, 1132–1151. [Google Scholar] [CrossRef]
  9. Lee, C.-S. Observational analysis of tropical cyclogenesis in the western North Pacific. Part I: Structural evolutions of cloud clusters. J. Atmos. Sci. 1989, 46, 2580–2598. [Google Scholar] [CrossRef]
  10. Lee, C.-S. Observational analysis of tropical cyclogenesis in the western North Pacific. Part II: Budget analysis. J. Atmos. Sci. 1989, 46, 2599–2616. [Google Scholar] [CrossRef]
  11. Chan, J.C.L.; Kwok, R.H.F. Tropical cyclone genesis in a global numerical weather prediction model. Mon. Weather Rev. 1999, 127, 611–624. [Google Scholar] [CrossRef]
  12. Fu, B.; Peng, M.S.; Li, T.; Stevens, D.E. Developing versus nondeveloping disturbances for tropical cyclone formation. Part II: Western North Pacific. Mon. Weather Rev. 2012, 140, 1067–1080. [Google Scholar] [CrossRef]
  13. Guo, Z.; Li, W.; Wang, L.; Liu, H. Comparison of developing and non-developing tropical disturbances over the South China Sea. J. Trop. Oceanogr. 2015, 34, 36–47, (In Chinese with English abstract). [Google Scholar] [CrossRef]
  14. Peng, M.S.; Fu, B.; Li, T.; Stevens, D.E. Developing versus nondeveloping disturbances for tropical cyclone formation. Part I: North Atlantic. Mon. Weather Rev. 2012, 140, 1047–1066. [Google Scholar] [CrossRef]
  15. Wang, L.; Lau, K.-H.; Zhang, Q.-H.; Fung, C.-H. Observation of non-developing and developing tropical disturbances over the South China Sea using SSM/I satellite. Geophys. Res. Lett. 2008, 35, L10802. [Google Scholar] [CrossRef]
  16. Smith, R.K.; Montgomery, M.T. Observations of the convective environment in developing and non-developing tropical disturbances. Q. J. R. Meteorol. Soc. 2012, 138, 1721–1739. [Google Scholar] [CrossRef] [Green Version]
  17. Wang, Z. Thermodynamic aspects of tropical cyclone formation. J. Atmos. Sci. 2012, 69, 2433–2451. [Google Scholar] [CrossRef]
  18. Kerns, B.W.; Chen, S.S. Cloud clusters and tropical cyclogenesis: Developing and nondeveloping systems and their large-scale environment. Mon. Weather Rev. 2013, 141, 192–210. [Google Scholar] [CrossRef]
  19. Park, M.-S.; Elsberry, R.L. Latent heating and cooling rates in developing and nondeveloping tropical disturbances during TCS-08: TRMM PR and ELDORA retrievals. J. Atmos. Sci. 2013, 70, 15–35. [Google Scholar] [CrossRef]
  20. Chang, M.; Ho, C.-H.; Park, M.-S.; Kim, J.; Ahn, M.-H. Multiday evolution of convective bursts during western North Pacific tropical cyclone development and nondevelopment using geostationary satellite measurements. J. Geophys. Res.-Atmos. 2017, 122, 1635–1649. [Google Scholar] [CrossRef]
  21. Zawislak, J.; Zipser, E.J. A multisatellite investigation of the convective properties of developing and nondeveloping tropical disturbances. Mon. Weather Rev. 2014, 142, 4624–4645. [Google Scholar] [CrossRef]
  22. Komaromi, W.A. An investigation of composite dropsonde profiles for developing and nondeveloping tropical waves during the 2010 PREDICT field campaign. J. Atmos. Sci. 2013, 70, 542–558. [Google Scholar] [CrossRef]
  23. Zawislak, J.; Zipser, E.J. Analysis of the thermodynamic properties of developing and nondeveloping tropical disturbances using a comprehensive dropsonde dataset. Mon. Weather Rev. 2014, 142, 1250–1264. [Google Scholar] [CrossRef]
  24. Gao, S.; Chen, B.; Li, T.; Wu, N.; Deng, W. AIRS-observed warm core structures of tropical cyclones over the western North Pacific. Dynam. Atmos. Oceans 2017, 77, 100–106. [Google Scholar] [CrossRef]
  25. Fritz, C.; Wang, Z.; Nesbitt, S.W.; Dunkerton, T.J. Vertical structure and contribution of different types of precipitation during Atlantic tropical cyclone formation as revealed by TRMM PR. Geophys. Res. Lett. 2016, 43, 894–901. [Google Scholar] [CrossRef]
  26. Ooyama, K.V. Numerical simulation of the life cycle of tropical cyclones. J. Atmos. Sci. 1969, 26, 3–40. [Google Scholar] [CrossRef]
  27. Emanuel, K.A. An air-sea interaction theory for tropical cyclones. Part I: Steady state maintenance. J. Atmos. Sci. 1986, 43, 585–604. [Google Scholar] [CrossRef]
  28. Fritz, C.; Wang, Z. Water vapor budget in a developing tropical cyclone and its implication for tropical cyclone formation. J. Atmos. Sci. 2014, 71, 4321–4332. [Google Scholar] [CrossRef]
  29. Murthy, V.S.; Boos, W.R. Role of surface enthalpy fluxes in idealized simulations of tropical depression spinup. J. Atmos. Sci. 2018, 75, 1811–1831. [Google Scholar] [CrossRef]
  30. Lin, I.-I.; Chen, C.-H.; Pun, I.-F.; Liu, W.T.; Wu, C.-C. Warm ocean anomaly, air sea fluxes, and the rapid intensification of tropical cyclone Nargis (2008). Geophys. Res. Lett. 2009, 36, L03817. [Google Scholar] [CrossRef]
  31. Lin, I.-I.; Pun, I.-F.; Lien, C.-C. “Category-6” supertyphoon Haiyan in global warming hiatus: Contribution from subsurface ocean warming. Geophys. Res. Lett. 2014, 41, 8547–8553. [Google Scholar] [CrossRef] [Green Version]
  32. Gao, S.; Chiu, L.S. Surface latent heat flux and rainfall associated with rapidly intensifying tropical cyclones over the western North Pacific. Int. J. Remote Sens. 2010, 31, 4699–4710. [Google Scholar] [CrossRef]
  33. Gao, S.; Zhai, S.; Chiu, L.S.; Xia, D. Satellite air-sea enthalpy flux and intensity change of tropical cyclones over the western North Pacific. J. Appl. Meteorol. Climatol. 2016, 55, 425–444. [Google Scholar] [CrossRef]
  34. Gao, S.; Zhai, S.; Chen, B.; Li, T. Water budget and intensity change of tropical cyclones over the western North Pacific. Mon. Weather Rev. 2017, 145, 3009–3023. [Google Scholar] [CrossRef]
  35. Jaimes, B.; Shay, L.K.; Uhlhorn, E.W. Enthalpy and momentum fluxes during Hurricane Earl relative to underlying ocean features. Mon. Weather Rev. 2015, 143, 111–131. [Google Scholar] [CrossRef]
  36. Zhang, J.; Liu, P.; Zhang, F.; Song, Q. CloudNet: Ground-based cloud classification with deep convolutional neural network. Geophys. Res. Lett. 2018, 45, 8665–8672. [Google Scholar] [CrossRef]
  37. Wentz, F.J.; Scott, J.; Hoffman, R.; Leidner, M.; Atlas, R.; Ardizzone, J. Remote Sensing Systems Cross-Calibrated Multi-Platform (CCMP) 6-Hourly Ocean Vector Wind Analysis Product on 0.25 Deg Grid, Version 2.0. Remote Sensing Systems, Santa Rosa, CA, USA. Available online: www.remss.com/measurements/ccmp (accessed on 10 May 2016).
  38. Atlas, R.; Hoffman, R.N.; Ardizzone, J.; Leidner, S.M.; Jusem, J.C.; Smith, D.K.; Gombos, D. A cross-calibrated, multiplatform ocean surface wind velocity product for meteorological and oceanographic applications. Bull. Amer. Meteorol. Soc. 2011, 92, 157–174. [Google Scholar] [CrossRef]
  39. Buchanan, S.; Misra, V.; Bhardwaj, A. Integrated kinetic energy of Atlantic tropical cyclones in a global ocean surface wind analysis. Int. J. Climatol. 2018, 38, 2651–2661. [Google Scholar] [CrossRef]
  40. Bentamy, A.; Grodsky, S.A.; Katsaros, K.; Mestas-Nuez, A.M.; Blanke, B.; Desbiolles, F. Improvement in air-sea flux estimates derived from satellite observations. Int. J. Remote Sens. 2013, 34, 5243–5261. [Google Scholar] [CrossRef]
  41. Fairall, C.W.; Bradley, E.F.; Hare, J.E.; Grachev, A.A.; Edson, J.B. Bulk parameterization of air-sea fluxes: Updates and verification for the COARE algorithm. J. Clim. 2003, 16, 571–591. [Google Scholar] [CrossRef]
  42. NOAA/NCEP. NCEP FNL Operational Model Global Tropospheric Analyses, Continuing from July 1999 (Updated Daily). NCAR Computational and Information Systems Laboratory Research Data Archive. Available online: https://doi.org/10.5065/D6M043C6 (accessed on 28 April 2014).
  43. Gao, S.; Zhai, S.; Li, T.; Chen, Z. On the asymmetric distribution of shear-relative typhoon rainfall. Meteorol. Atmos. Phys. 2018, 130, 11–22. [Google Scholar] [CrossRef]
  44. Gao, S.; Wang, D.; Hong, H.; Wu, N.; Li, T. Evaluation of warm-core structure in reanalysis and satellite data sets using HS3 dropsonde observations: A case study of Hurricane Edouard (2014). J. Geophys. Res.-Atmos. 2018, 123, 6713–6731. [Google Scholar] [CrossRef]
  45. NOAA/NCEP. Satellite Historical Documentation. Available online: http://www.emc.ncep.noaa.gov/mmb/data_processing/Satellite_Historical_Documentation.htm (accessed on 4 October 2018).
  46. Zong, H.; Wu, L. Synoptic-scale influences on tropical cyclone formation within the western North Pacific monsoon trough. Mon. Weather Rev. 2015, 143, 3421–3433. [Google Scholar] [CrossRef]
  47. Kerns, B.; Greene, K.; Zipser, E. Four years of tropical ERA-40 vorticity maxima tracks. Part I: Climatology and vertical vorticity structure. Mon. Weather Rev. 2008, 136, 4301–4319. [Google Scholar] [CrossRef]
  48. Kurihara, Y.; Bender, M.A.; Ross, R.J. An initialization scheme of hurricane models by vortex specification. Mon. Weather Rev. 1993, 121, 2030–2045. [Google Scholar] [CrossRef]
  49. Lander, M.A. Description of a monsoon gyre and its effects on the tropical cyclones in the western North Pacific during August 1991. Weather Forecast. 1994, 9, 640–654. [Google Scholar] [CrossRef]
  50. Wu, L.; Wen, Z.; Huang, R.; Wu, R. Possible linkage between the monsoon trough variability and the tropical cyclone activity over the western North Pacific. Mon. Weather Rev. 2012, 140, 140–150. [Google Scholar] [CrossRef]
  51. Yoshida, R.; Ishikawa, H. Environmental factors contributing to tropical cyclone genesis over the western North Pacific. Mon. Weather Rev. 2013, 141, 451–467. [Google Scholar] [CrossRef]
  52. Cao, X.; Li, T.; Peng, M.; Chen, W.; Chen, G. Effects of the monsoon trough intraseasonal oscillation on tropical cyclogenesis over the western North Pacific. J. Atmos. Sci. 2014, 71, 4639–4660. [Google Scholar] [CrossRef]
  53. Cao, X.; Li, T.; Peng, M.; Chen, W.; Chen, G. Effects of monsoon trough interannual variation on tropical cyclogenesis over the western North Pacific. Geophys. Res. Lett. 2014, 41, 4332–4339. [Google Scholar] [CrossRef] [Green Version]
  54. Feng, T.; Chen, G.; Huang, R.; Shen, X. Large-scale circulation patterns favorable to tropical cyclogenesis over the western North Pacific and associated barotropic energy conversions. Int. J. Climatol. 2014, 34, 216–227. [Google Scholar] [CrossRef]
  55. Zong, H.; Wu, L. Re-examination of tropical cyclone formation in monsoon troughs over the western North Pacific. Adv. Atmos. Sci. 2015, 32, 924–934. [Google Scholar] [CrossRef]
  56. Guo, B.; Ge, X. Monsoon trough influences on multiple tropical cyclone events in the western North Pacific. Atmos. Sci. Lett. 2018, 19, e851. [Google Scholar] [CrossRef]
  57. Fritz, C.; Wang, Z. A numerical study of the impacts of dry air on tropical cyclone formation: A development case and a nondevelopment case. J. Atmos. Sci. 2013, 70, 91–111. [Google Scholar] [CrossRef]
  58. Wang, Z.; Hankes, I. Characteristics of tropical easterly wave pouches during tropical cyclone formation. Mon. Weather Rev. 2014, 142, 626–633. [Google Scholar] [CrossRef]
  59. Schubert, W.H.; Rozoff, C.M.; Vigh, J.L.; McNoldy, B.D.; Kossin, J.P. On the distribution of subsidence in the hurricane eye. Q. J. R. Meteorol. Soc. 2007, 133, 595–605. [Google Scholar] [CrossRef] [Green Version]
  60. Beljaars, A. NUMERICAL MODELS|Parameterization of Physical Processes: Turbulence and Mixing. In Encyclopedia of Atmospheric Sciences, 2nd ed.; North, G.R., Pyle, J., Zhang, F., Eds.; Academic Press: New York, NY, USA, 2015; pp. 200–211. [Google Scholar]
  61. Dolling, K.; Barnes, G.M. Warm core formation in Tropical Storm Humberto (2001). Mon. Weather Rev. 2012, 140, 1177–1190. [Google Scholar] [CrossRef]
Figure 1. Tracks of developing (red) and non-developing (blue) disturbances from June to October of 2000 to 2009.
Jmse 07 00028 g001
Figure 2. Composite time series of intensity for the developing and non-developing disturbances from Day −3 to Day +1. The bars denote standard deviations. The filled markers represent significant differences at the 0.05 level between the developing and non-developing disturbances at same day based on Student’s t-test. The red (blue) numbers are number of samples for the developing (non-developing) disturbances.
Jmse 07 00028 g002
Figure 3. Same as Figure 2, but for vertical wind shear (m s−1).
Jmse 07 00028 g003
Figure 4. Composite latent heat flux (LHF) (W m−2) for the developing disturbances at (a) Day −3, (b) Day −2, (c) Day −1, (d) Day 0, and (e) Day +1, and for the non-developing disturbances at (f) Day −3, (g) Day −2, (h) Day −1, (i) Day 0, and (j) Day +1, and radial means for the (k) developing and (l) non-developing disturbances. The red pentagrams denote the disturbance centers. The bars in (k,l) denote standard deviations. The filled markers in (k) represent significant differences at the 0.05 level between the developing and non-developing disturbances at the same day based on Student’s t-test.
Jmse 07 00028 g004
Figure 5. As in Figure 4, but for The Institut Français de Recherche pour l’Exploitation de la Mer v3 sea surface temperature (IFREMER3 SST) (°C).
Jmse 07 00028 g005
Figure 6. As in Figure 4, but for IFREMER3 10-m wind speed (m s−1).
Jmse 07 00028 g006
Figure 7. Composite 850-hPa wind fields (vector, m s−1) and wind speeds (shading, m s−1) for developing disturbances at (a) Day −3, (b) Day −2, (c) Day −1, and (d) Day 0, and (e) Day +1, and for non-developing tropical disturbances at (f) Day −3, (g) Day −2, (h) Day −1, (i) Day 0, and (j) Day +1. The red pentagrams denote the disturbance centers.
Jmse 07 00028 g007aJmse 07 00028 g007b
Figure 8. Composite radius–height cross sections of azimuthal-mean specific humidity anomalies (g kg−1) for the developing disturbances at (a) Day −3, (b) Day −2, (c) Day −1, (d) Day 0, and (e) Day +1, and for the non-developing tropical disturbances at (f) Day −3, (g) Day −2, (h) Day −1, (i) Day 0, and (j) Day +1, and inner-core (within 2°) mean profiles for the (k) developing and (k) non-developing disturbances. The bars in (k,l) denote standard deviations. The filled markers in (k) represent significant differences at the 0.05 level between the developing and non-developing at the same day based on Student’s t-test.
Jmse 07 00028 g008
Figure 9. Composite radial profiles of moisture transport q   V (vector) and its magnitude q V r 2 + w 2 (shading) (g cm−1 s−1 hPa−1) for developing tropical disturbances at (a) Day −3, (b) Day −2, (c) Day −1, (d) Day 0, and (e) Day +1, and for non-developing tropical disturbances at (f) Day −3, (g) Day −2, (h) Day −1, (i) Day 0, and (j) Day +1.
Jmse 07 00028 g009
Figure 10. 1000−850 hPa vertically integrated (a) radial moisture transport 1 g 850 1000 q V r d p (kg m−1 s−1) and (b) vertical moisture transport 1 g 850 1000 q w d p (10−2 kg m−1 s−1) for the developing disturbances as well as (c) radial and moisture transport 1 g 850 1000 q V r d p (kg m−1 s−1) and (d) vertical moisture transport 1 g 850 1000 q w d p (10−2 kg m−1 s−1) for the non-developing disturbances. The bars denote standard deviations. The filled markers in (a) and (b) represent significant differences at the 0.05 level between the developing and non-developing disturbances at the same day based on Student’s t-test.
Jmse 07 00028 g010
Figure 11. As in Figure 8, but for temperature anomalies (K).
Jmse 07 00028 g011
Figure 12. Composite radial profiles of radial wind and vertical velocity (vector, m s−1) and tangential wind (shading, m s−1) for developing disturbances at (a) Day −3, (b) Day −2, (c) Day −1, and (d) Day 0, and (e) Day +1, and for non-developing tropical disturbances at (f) Day −3, (g) Day −2, (h) Day −1, (i) Day 0, and (j) Day +1.
Jmse 07 00028 g012

