Article

Numerical Investigation on Vortex-Induced Vibration Suppression of a Circular Cylinder with Axial-Slats

1
School of Marine Science and Technology, Northwestern Polytechnical University, Xi’an 710072, China
2
Key Laboratory for Unmanned Underwater Vehicle, Northwestern Polytechnical University, Xi’an 710072, China
*
Authors to whom correspondence should be addressed.
J. Mar. Sci. Eng. 2019, 7(12), 454; https://doi.org/10.3390/jmse7120454
Submission received: 15 October 2019 / Revised: 14 November 2019 / Accepted: 20 November 2019 / Published: 11 December 2019

Abstract

:
The vortex-induced vibration (VIV) suppression of a circular cylinder with the axial-slats is numerically investigated using the computational fluid dynamics (CFD) method for Reynolds number range of 8.0 × 10³–5.6 × 10⁴. The two-dimensional unsteady Reynolds averaged Navier–Stokes (RANS) equations and Shear-Stress-Transport (SST) turbulence model are used to calculate the flow around the cylinder in ANSYS Fluent. The Newmark-β method is used to evaluate structural dynamics. The amplitude response, frequency response and vortex pattern are discussed. The suppression effect of the axial-slats is the best when the gap ratio is 0.10 and the coverage ratio is 30%. Based on the VIV response, the whole VIV response region is divided into four regions (Region I, Region II, Region III and Region IV). The frequency ratio of isolated cylinder jumps between region II and region III. However, the frequency ratio jumps between region I and region II for a cylinder with the axial-slats. The axial-slats destroy the original vortex and make the vortex easier to separate. The online amplitude ratio is almost completely suppressed, and the cross-flow amplitude ratio is significantly suppressed.

1. Introduction

The vortex-induced vibration (VIV) of a cylindrical structure is a typical fluid structure interaction (FSI) phenomenon that is practical for many engineering applications such as a marine riser, bridge, oil pipeline and tall building [1]. As the fluid flows past the structure, vortex streets are observed behind the structure, which provides a hydrodynamic force and causes the periodic vibration [2]. When the frequency of vortex shedding is close to the natural frequency of the structure, a large-amplitude motion is observed, called “lock-in” or vortex synchronization [3]. In particular, “lock-in” can have more serious consequences for a low mass-damping system, which is one of the important factors in fatigue failure and structure instability [4]. Due to many practical issues associated with VIV, VIV has attracted more and more attention, which has inspired the development of various methods on VIV suppression [5]. A large number of experimental and numerical studies have been conducted on VIV suppression.
Based on previous study [6], the methods of VIV suppression are divided into active control and passive control. Is there an external energy input to distinguish between the two methods? The active control requires external energy input. Some typical examples of active control are plasma actuation [7], feed control method [8], suction and blowing [9], body rotation [10] and Lorentz force [11]. Passive control is simpler to put into practice than active control. Gao et al. [12] numerically investigated the effect of different surface roughness on VIV suppression, and results showed that the amplitude response decreased and drag coefficient decreased as the roughness increases. Zhu and Yao [13] presented a method of VIV suppression using small control rods, and results showed that the suppression effect was the best when the number of control rods was 9. The suppression effect of traveling wave wall (TWW) on VIV was studied numerically by Xu et al. [14], and a small vortex shedding was observed. A circular cylinder attached with helical strakes on VIV suppression was numerically investigated [15], and it could be found that helical strake could change vibration frequency and suppress the vortex shedding. Huera-Huarte [16] investigated the suppression effect of wire meshes on VIV, and the maximum amplitude response could be reduced by 95%. Lou et al. [17] experimentally investigated the suppression effect of splitter plates, and it was found that the length ratio of splitter plate was an important factor on VIV suppression. Zheng and Wang [18] investigated the suppression effect of different shaped fairing devices on VIV. There are many researches on axial-rods [19,20,21], but there are few researches on axial-slats.
In this study, the VIV response of a circular cylinder with the axial-slats is numerically investigated using the computational fluid dynamics (CFD) method for Reynolds number range of 8.0 × 10³ < Re < 5.6 × 10⁴. The two-dimensional unsteady Reynolds averaged Navier–Stokes (RANS) equations in conjunction with the SST k-ω turbulence model are used to calculate the flow around the cylinder. The Newmark-β method is used to evaluate the structural dynamics. The physical model is established in Section 2, and the numerical model is established in Section 3. In Section 3, the numerical model is verified by experimental results. The effect of axial-slats on VIV suppression is discussed in Section 4. Some conclusions are presented in Section 5.

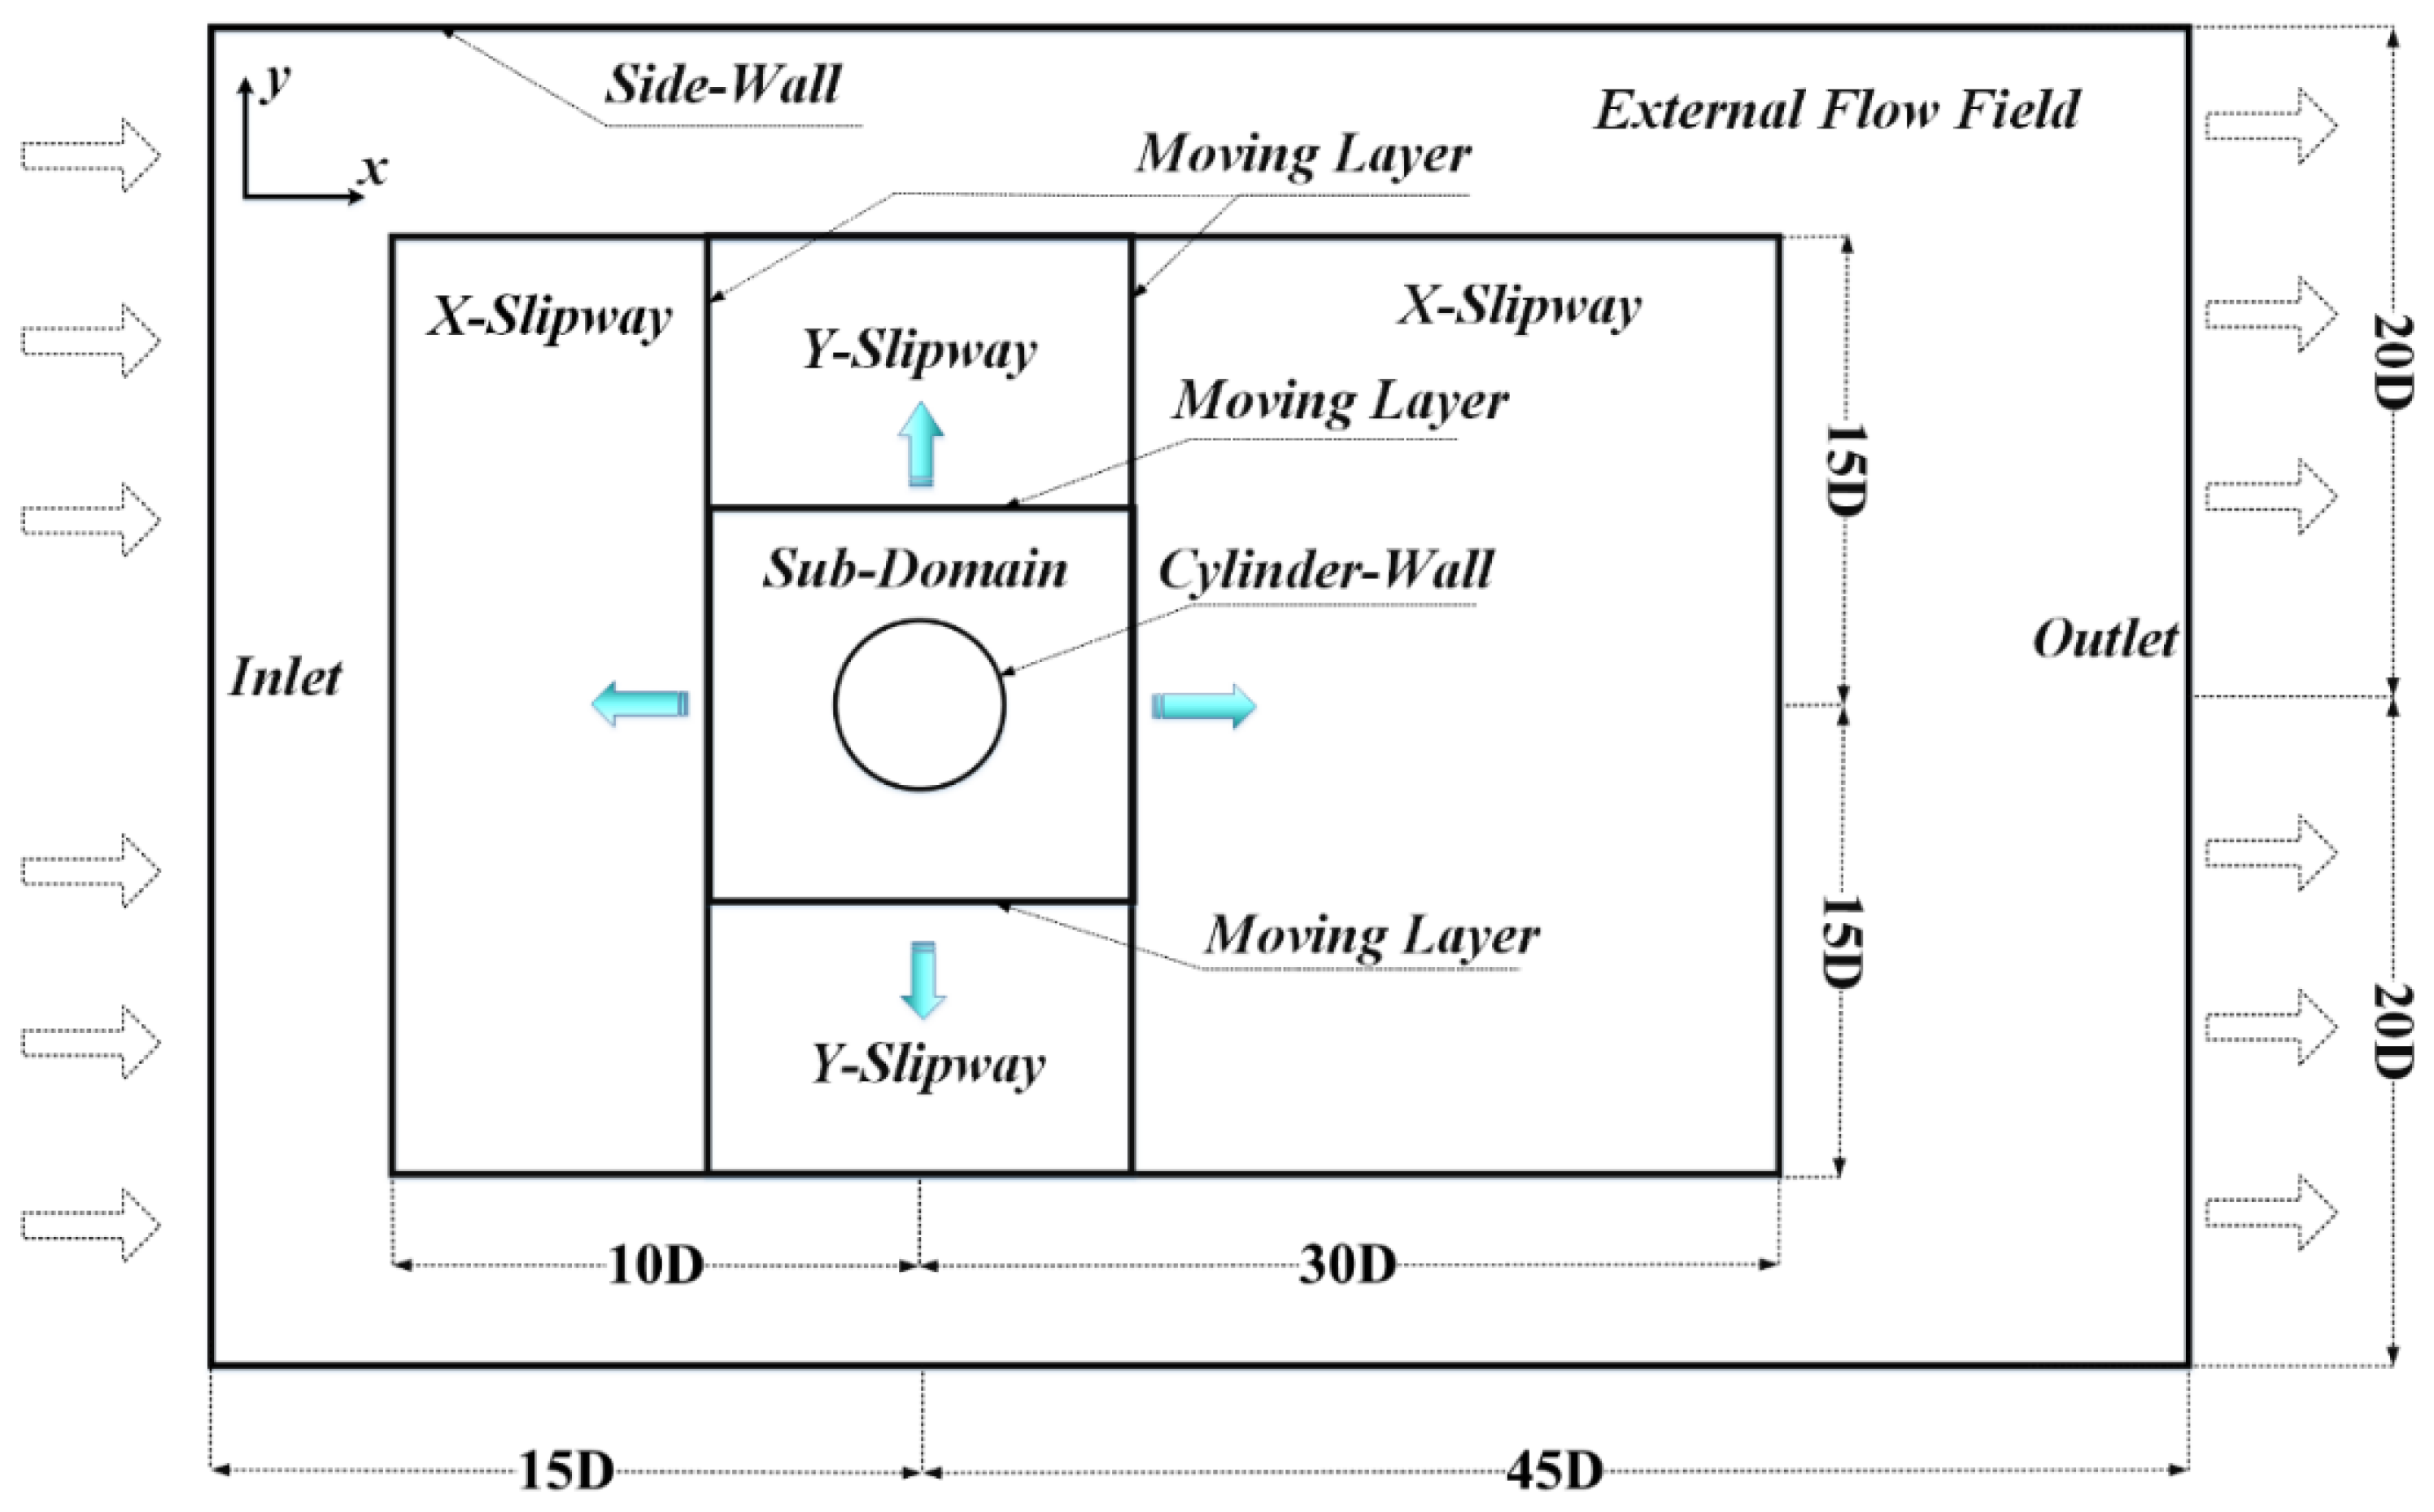
2. Problem Description

The two degrees of freedom (2-DOF) VIV system consists of a circular cylinder, two springs and two dampers, as shown in Figure 1a [1]. The VIV response of streamwise vibration and transverse vibration are all considered, and the cylinder is free to vibrate in the x-direction and the y-direction. The vibration suppression device is the axial-slats having an omnidirectional suppression effect, and thus the rotation response is not shown in this study. C is the system damping, and K is the spring stiffness. Ax and Ay are the displacements in the x-direction and the y-direction. D is the diameter of the cylinder. The distribution of the axial-slats is symmetrical to the x-axis, and there is always one above the cylinder and one below the cylinder. Figure 1b is the schematic diagram of a circular cylinder with axial-slats, where θ is the coverage angle of an axial-slat, b is the width of the axial-slats, G is the spacing between the main cylinder and the axial-slats and N is the number of axial-slats. According to the previous studies [6,22], the width is set to b = 0.02D, and the coverage angle of an axial-slat (N = 1) is set to θ = 0.025∙2π. The axial slats are attached to the cylinder and vibrate with the cylinder.
The main parameters of the VIV system are the same in all cases, as shown in Table 1. The purpose of this paper was to investigate the effect of coverage ratio, gap ratio and Reynolds number on VIV suppression. The coverage ratio of the axial-slats (ε) is defined as the ratio of the sum of the coverage angles of some axial-slats (the number of axial-slats is N) to the coverage angle of the main circular cylinder (2π), ranging from 0.10 (N = 4) to 0.80 (N = 32). The gap ratio is defined as the ratio of the distance (G) between the main cylinder and the axial-slats to the diameter of the main cylinder (D), ranging from 0.05 to 0.50. The coverage ratio (ε) and gap ratio (δ) are defined as follows:
ε = θ 2 π · N
δ = G D

3. Computational Method

3.1. Numerical Approach

Since the fluid flow is incompressible, unsteady and viscous, the governing equations in the entire domain are two-dimensionally unsteady Reynolds averaged Navier–Stokes (RANS) equations, including mass conservation equation and momentum conservation equation, as follows [5,13,19,23]:
ρ t + ρ u ¯ i x i = 0 ,
ρ u ¯ i t + ρ u i u j ¯ x j = p ¯ x i + μ 2 u ¯ i ρ u i u j ¯ x j ,
where ρ u i u j ¯ is the Reynolds stress, expressed as [5,13,19,23]:
ρ u i u j ¯ = μ t ( u i x j + u j x i ) 2 3 ρ k t δ i j ,
where p is the pressure and ρ is water density. δij is Kronecker delta function and μ and μt are dynamic viscosity and turbulent viscosity. i and j represent the directions of components, xi is Cartesian coordinate in i direction, u i is the instantaneous velocity component, u i is the fluctuation velocity component and u ¯ i and u i ¯ represent the time-averaged values of u i and u i . kt is the turbulent energy [19]. The turbulent viscosity μt can be obtained by [5,13,19,23,24]:
μ t = ρ k t ω ,
where ω is the specific dissipation rate.
The RANS equations are commonly solved with the assistance of two-equation turbulence models in solving practical problems. Since the direct numerical simulation (DNS) will spend a lot of time solving the RANS equations [13]. The SST K-ω (a two-equation turbulence model) turbulence model shows a great performance in simulating the flow around the structure [1,5,13,19,23]. Therefore, SST k-ω turbulence model is adopted to close the RANS equations, which has the kinetic energy (kt) and the specific dissipation rate (ω), expressed as [5,13,19,23,24]:
( ρ k t ) t + ( ρ k t u i ) x i = x j [ ( μ + μ t σ k ) k t x j ] + p k β * ρ ω k t ,
( ρ ω ) t + ( ρ ω u i ) x i = x j [ ( μ + μ t σ ω ) ω x j ] + p ω β ρ ω 2 + 2 ρ ( 1 F ) ω σ ω , 2 k t x j ω x j ,
in which,
p k = min ( p k ,   10 β * ρ ω k t ) ,
p k = 2 μ t S i j · S i j 2 3 ρ k t u i x j δ i j ,
p ω = γ ( 2 ρ S i j · S i j 2 3 ρ k t u i x j δ i j ) ,
S i j = 1 2 ( u i x j + u j x i ) ,
where p k and p k are the effective rate and the production rate of turbulent kinetic energy. p ω is the production rate of specific turbulent dissipation rate. S i j is the mean rate of deformation component. σ k , σ ω , β and γ are the model coefficients evaluated by [5,13,19,23,24]:
φ = φ 1 F + φ 2 ( 1 F )
where the subscript 1 or 2 of ϕ is related to the SST k-ω model, and F is a blending function [13]. The constants in this model are given as σk = 1.176, σk,2 = 1.0, σω = 2.0, σω,2 = 1.168, β1 = 0.075, β2 = 0.0828, β = 0.09, γ1 = 0.5532 and γ2 = 0.4404 [5,13,19,23,24].
The VIV response of the system is triggered by the fluctuating hydrodynamic forces. The hydrodynamic forces include drag force ( F x ( t ) ) and lift force ( F y ( t ) ). A simple mathematical model of 2-DOF VIV system is modeled. The classical mass-spring-damper oscillatory model is used to describe 2-DOF VIV response. The equations of motion are modeled as [24]:
m · x ¨ + C · x ˙ + K · x = F x ( t ) ,
m · y ¨ + C · y ˙ + K · y = F y ( t ) ,
in which
m = m * · D 2 4 · π · ρ · L ,
M = m + m a d d ,
m a d d = C A · D 2 4 · π · ρ · L ,
C = 2 · K · M · ξ ,
f n = 2 π · K M ,
where M is the total mass of system; mosc is the mass of the structure and madd is the added mass. x, x ˙ and x ¨ are the displacement, velocity and acceleration of the cylinder in x-direction; while y, y ˙ and y ¨ represent the same quantities associated with the transverse motion. Fx is the drag force and Fy is the lift force. CA is the added mass coefficient (CA = 1 for the cylinder [1,19]). fn is the natural frequency of the cylinder in water and ξ is the damping ratio. L is the length of cylinder (L = 1 m). K is the spring stiffness of system. C is the system damping. ρ is the water density.
The new position of cylinder is updated by solving the Equations (14) and (15). The Newmark-β method is used to solve the Equations (14) and (15). The Newmark-β method is an implicit time integration method [25]. The linear acceleration assumption is amended in the Newmark-β method. At the time t+t, the parameters α and β are introduced in the expression of velocity and displacement. Two basic equations are obtained [1]:
u t + Δ t = u t + u ˙ t · Δ t + [ ( 1 2 β ) · u ¨ t + β · u ¨ t + Δ t ] · Δ t 2 .
u ˙ t + Δ t = u ˙ t + [ ( 1 α ) · u ¨ t + α · u ¨ t + Δ t ] · Δ t .
According to Equations (21) and (22), u ¨ t + Δ t and u ˙ t + Δ t can be expressed as:
u ¨ t + Δ t = 1 β · Δ t 2 ( u t + Δ t u t ) 1 β · Δ t u ˙ t ( 1 2 β 1 ) · u ¨ t .
u ˙ t + Δ t = α β · Δ t ( u t + Δ t u t ) + ( 1 α β ) · u ˙ t ( α 2 β 1 ) · Δ t · u ¨ t .
At the time t + ∆t, considering Equations (14) and (15), unknown items u can represent x or y:
M · u ¨ t + Δ t + C · u ˙ t + Δ t + K · u t + Δ t = F f l u i d ( t ) t + Δ t
Based on the previous study [23], the values of α and β are 0.5 and 0.25. Finally, Equation (25) is simplified as:
[ K ¯ ] · u t + Δ t = [ F ¯ ] ,
where ∆t is the time step; [ K ¯ ] = K + 1 β · Δ t 2 · M + α β · Δ t C   and   [ F ¯ ] = F f l u i d ( t ) t + Δ t + [ 1 β Δ t 2 · u t + 1 β Δ t · u ˙ t + ( 1 2 β 1 ) · u ¨ t ] · M + [ α β Δ t · u t + ( α β 1 ) · u ˙ t + ( α 2 β 1 ) · Δ t · u ¨ t ] · C .
The above method is achieved by embedding user-defined functions (UDFs, programmed in C language) into the popular finite-volume code ANSYS FLUENT. Firstly, the fluctuating hydrodynamic forces are calculated by solving 2D-RANS equations in conjunction with the SST k-ω turbulence model. The total hydrodynamic force is the integration of the total stress (the pressure and the viscous stress) around the cylinder and the slats. Based on the forces, the displacement, velocity and acceleration at time t + ∆t are solved in UDFs. Finally, the mesh is updated based on the displacement of the motion. The process of VIV response is realized by the above method, and the process of the numerical simulation is shown in Figure 2 [1].

3.2. Computational Mesh and Mesh Dependence Check

The diagram of computational domain is shown in Figure 3 [1]. The entire computational domain is divided into four regions, including Sub-Domain, Y-Slipway, X-Slipway and External Flow Field. Since the amplitude of motion may be high, the lengths of the computational domain in the x-direction and y-direction are 60D and 40D in all cases. The entire domain includes four kinds of boundaries, which are inlet, outlet, side-wall and cylinder-wall. The Sub-Domain is 6D × 6D, the Y-slipway is 6D (the streamwise direction) × 30D (the transverse direction) and the X-slipway is 40D (the streamwise direction) × 30D (the transverse direction). The center of the cylinder (the original point) is 15D away from the upstream boundary (inlet), and the upstream boundary is imposed with a velocity inlet condition, where u = u (the streamwise direction) and v = 0 (the transverse direction). The center of the cylinder is 35D away from the downstream boundary (outlet), and the downstream boundary is an outlet condition with ∂u/∂x = 0 and ∂v/∂x = 0. The two lateral boundaries (side-wall) are 20D away from the x-axis, and the lateral boundary is the symmetry condition with ∂u/∂y = 0 and v = 0.
The moving boundary is described by an arbitrary Lagrangian–Eulerian (ALE) scheme [13,19], which makes the computational mesh around the structure moving along with the VIV system. The layer method of dynamic mesh is applied for updating grid. Moving layers are located at the top and the bottom of the sub-domain for solving the vibration response of cylinder in y-direction. Moving layers are also located at the left and the right of Y-slipway for solving the vibration response of cylinder in the x-direction. The interfaces are adopted to connect the different mesh regions. The sub-domain and cylinder-wall move up and down together. The sub-domain, Y-slipway, X-slipway and external flow field are tessellated with different shapes of meshes. The Y-slipway, X-slipway and external flow field are meshed with quadrilateral grids. The sub-domain is meshed with triangular grids. The boundary layer meshes around the cylinder are quadrilateral grids to improve the accuracy on resolving the flow around the structure. The layers of boundary layer mesh are 15 and the growth ratio of boundary-layer mesh is 1.15. The height of the first layer is determined by y+, which is expressed as [19]:
y + = 0.172 Δ y D R e 0.9 ,
where ∆y is height of the first-layer mesh and Re is the Reynolds number. Based on the previous research [19], y+ is less than 1. In each calculation step, the convergent criteria defined as the residual in the control volume for each parameter is smaller than 10−5 [19].
The density of the mesh can affect the prediction accuracy of the numerical model. The minimum edge of the axial-slats requires at least 10 cells to improve the resolution of the structure. The number of meshes is increased by increasing the number of cell nodes along the edge of the structure. Finally, the grid independence verification was conducted using different grid densities, including 30,000 (M1), 60,000 (M2), 90,000 (M3), 120000(M4) and 150,000 (M5). As shown in Table 2, the percentages in brackets were changes in the ratios of Ay/D and f/fn relative to the corresponding values for the former grid. When the mesh resolution was refined from M4 to M5, the differences of Ay/D and fy/fn were reduced to 0.05% and 0.04%. The difference between the two meshes of M4 and M5 was less than 0.1%, and the mesh of M5 could be used [19]. Therefore, the number of meshes in the simulation was set to about 150000. The mesh (M5) is shown in Figure 4 when ε = 60% and δ = 0.15 D. The non-dimensional time-step (U∙t/D, U is flow velocity) was set as 0.001 to keep the Courant–Friedrichs–Lewy (CFL) number being less than 1 [19].

3.3. Numerical Model Validation

Before the numerical simulation is carried out, the prediction accuracy of numerical model must be verified by the experimental results [23] and other CFD results [12,24]. The main parameters are presented in Table 1. The VIV response of a cylinder is numerically simulated in the range of 2 < Ur (reduced velocity, Ur = U f n · D ) < 14, as shown in Figure 5. The frequency of vibration is calculated by fast Fourier transform (FFT) of the displacement.
Based on the amplitude and frequency response, the VIV response region is divided into three branches, including the initial branch (I), the upper branch (U) and the lower branch (L) [23]. The “super upper” branch was presented in the experiment of Jauvtis and Williamson [23]. There is a jump from the upper branch to the lower branch, and the jump usually takes place at 6 < Ur < 8 in Jauvtis and Williamson’ experiment [23]. The jump takes place at Ur ≈ 7.0 in the present model, which is similar to Kang’s study [24]. The Reynolds number range may cause the above differences. The Reynolds number was fixed at 5000 in the simulation of Gao et al. [12], and Ur was changed by changing the natural frequency of the cylinder (fn) [12]. However, the “super upper” branch could not be observed in the simulation of Gao et al. [12]. The Reynolds number range in the present model (8.0 × 10³ ≤ Re ≤ 5.6 × 10⁴) is close to that (5.8 × 10³ ≤ Re ≤ 4.08 × 10⁴ and 1.305 × 10³ ≤ Re ≤ 9.18 × 10⁴) in the simulation of Kang et al. [24]. Ur was changed by changing the flow velocity (U). The numerical results are in excellent agreement with Kang’s data, despite that some differences remain. The trend of VIV response is the same as that of Jauvtis and Williamson’s experiment (1.16 × 10³ ≤ Re ≤ 6.39 × 10³) [23]. Therefore, the numerical model is acceptable.

4. Results and Discussions

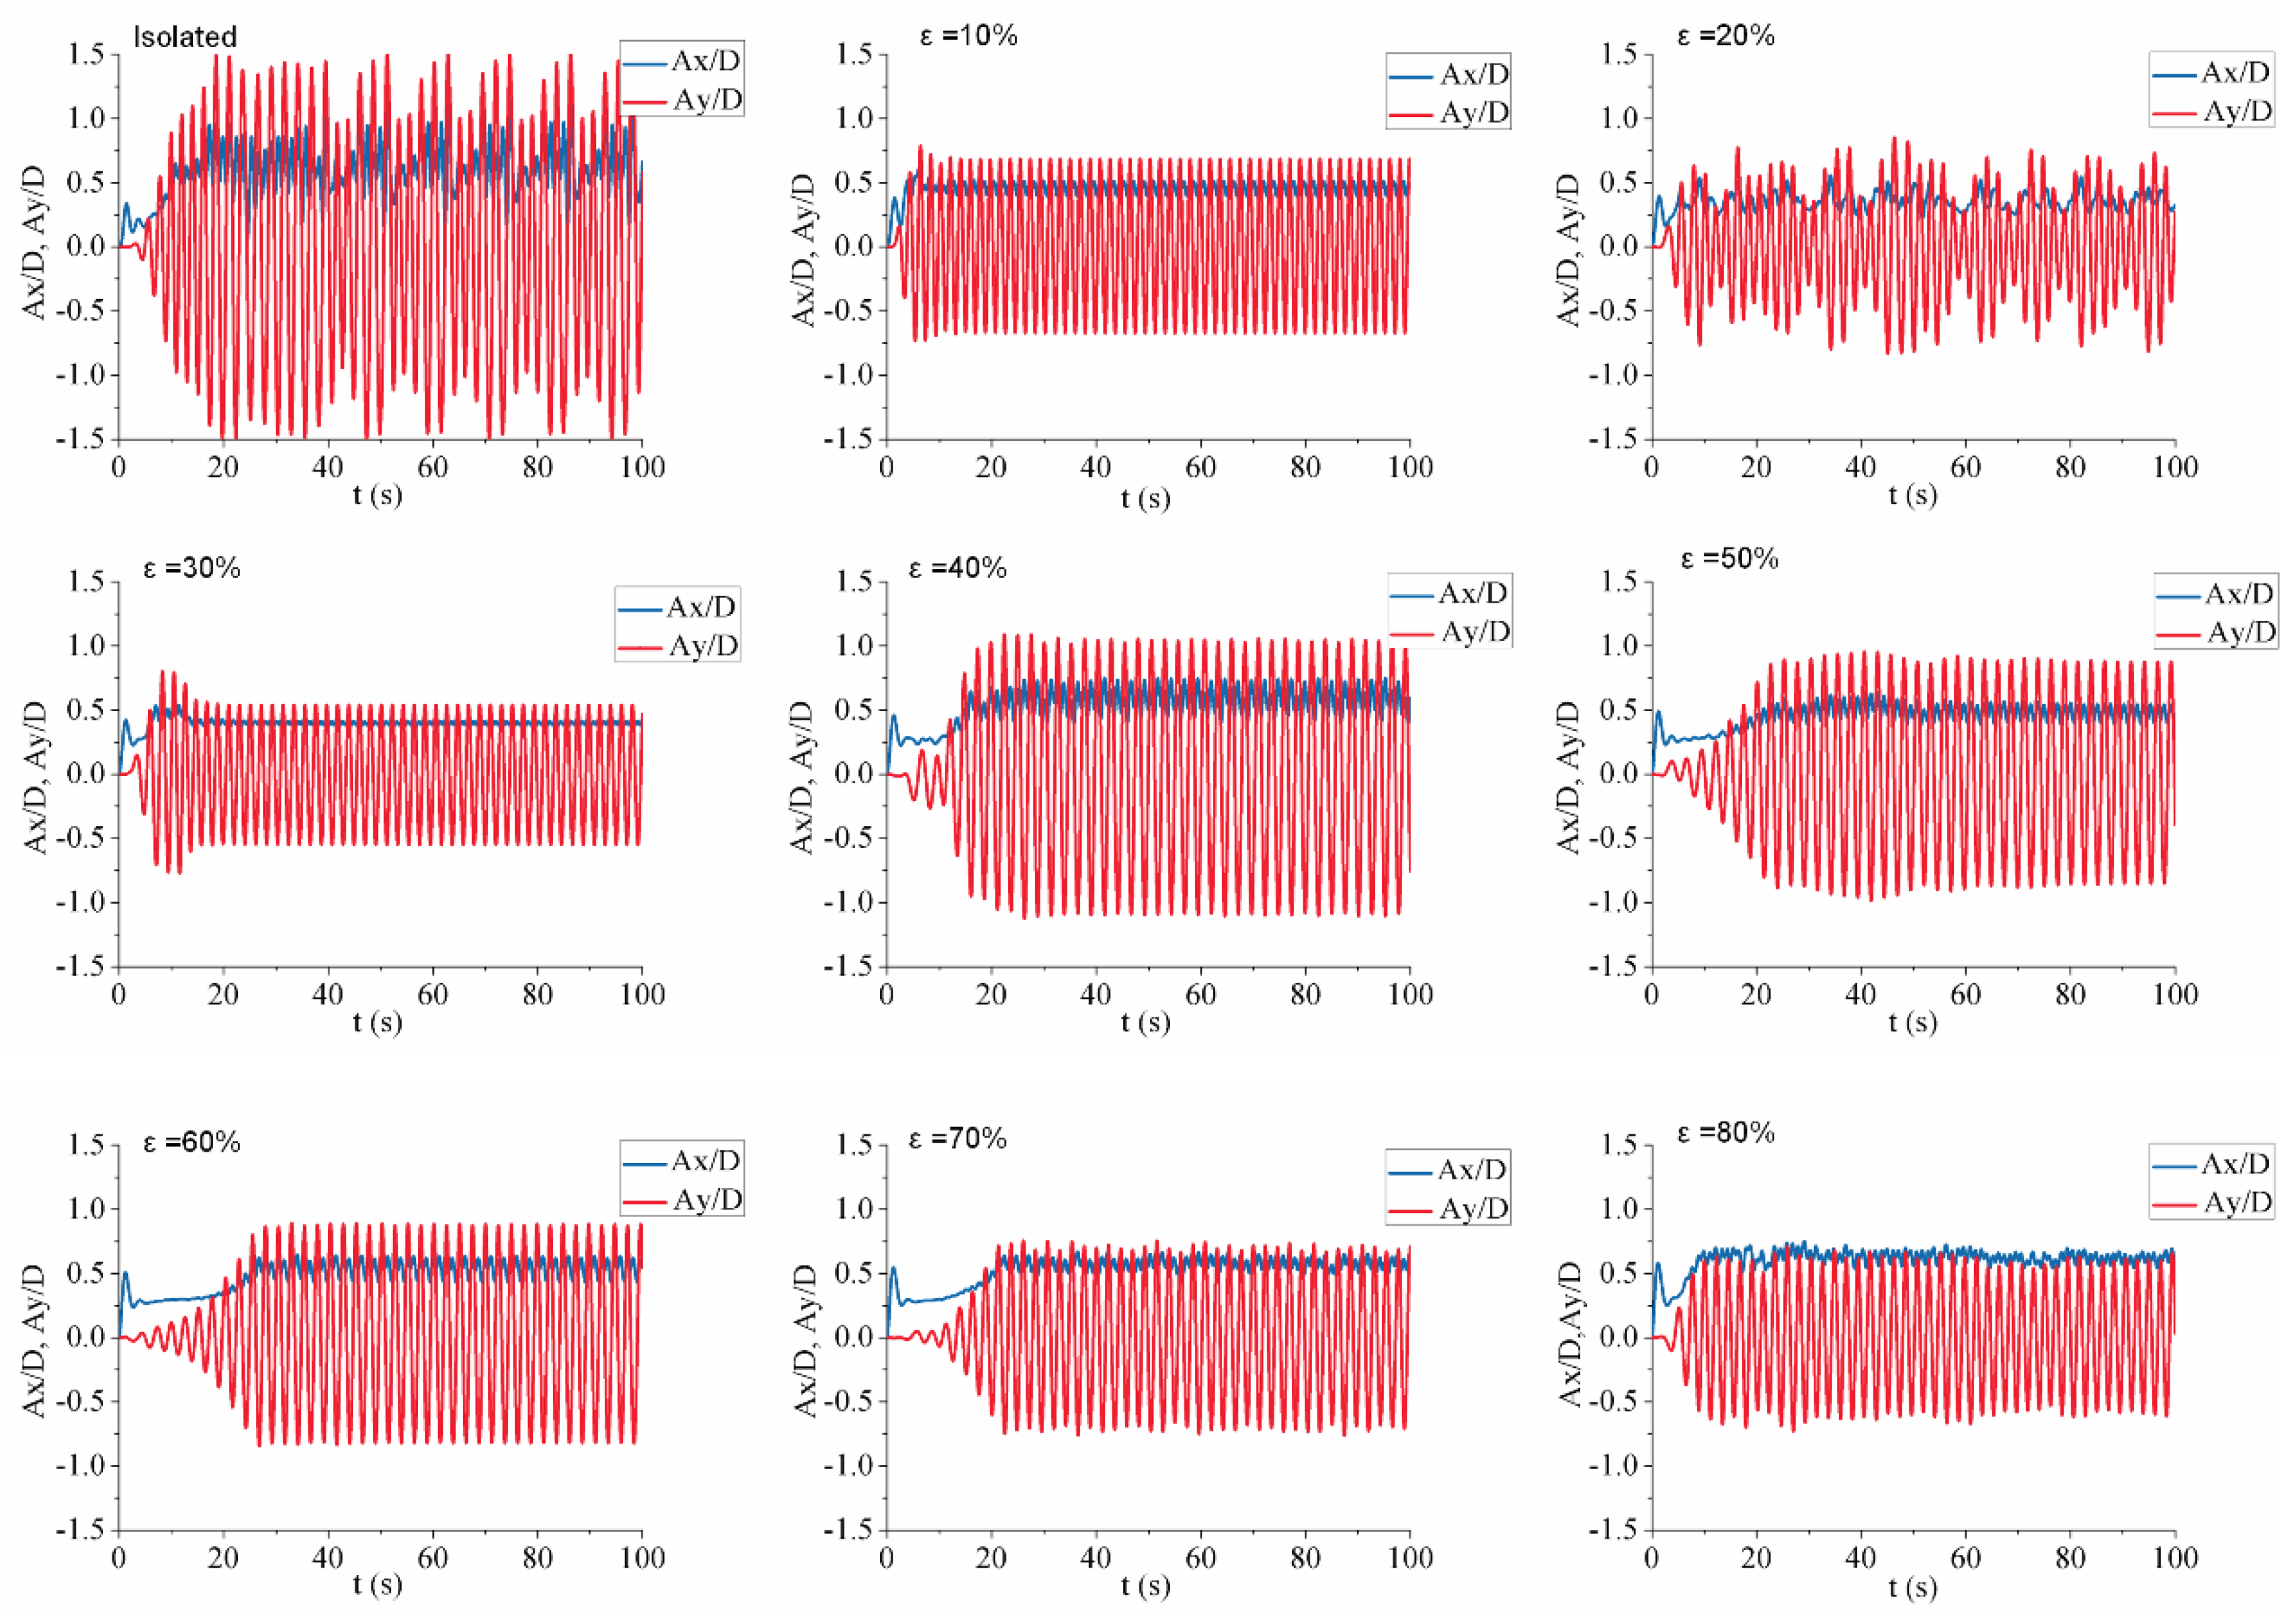
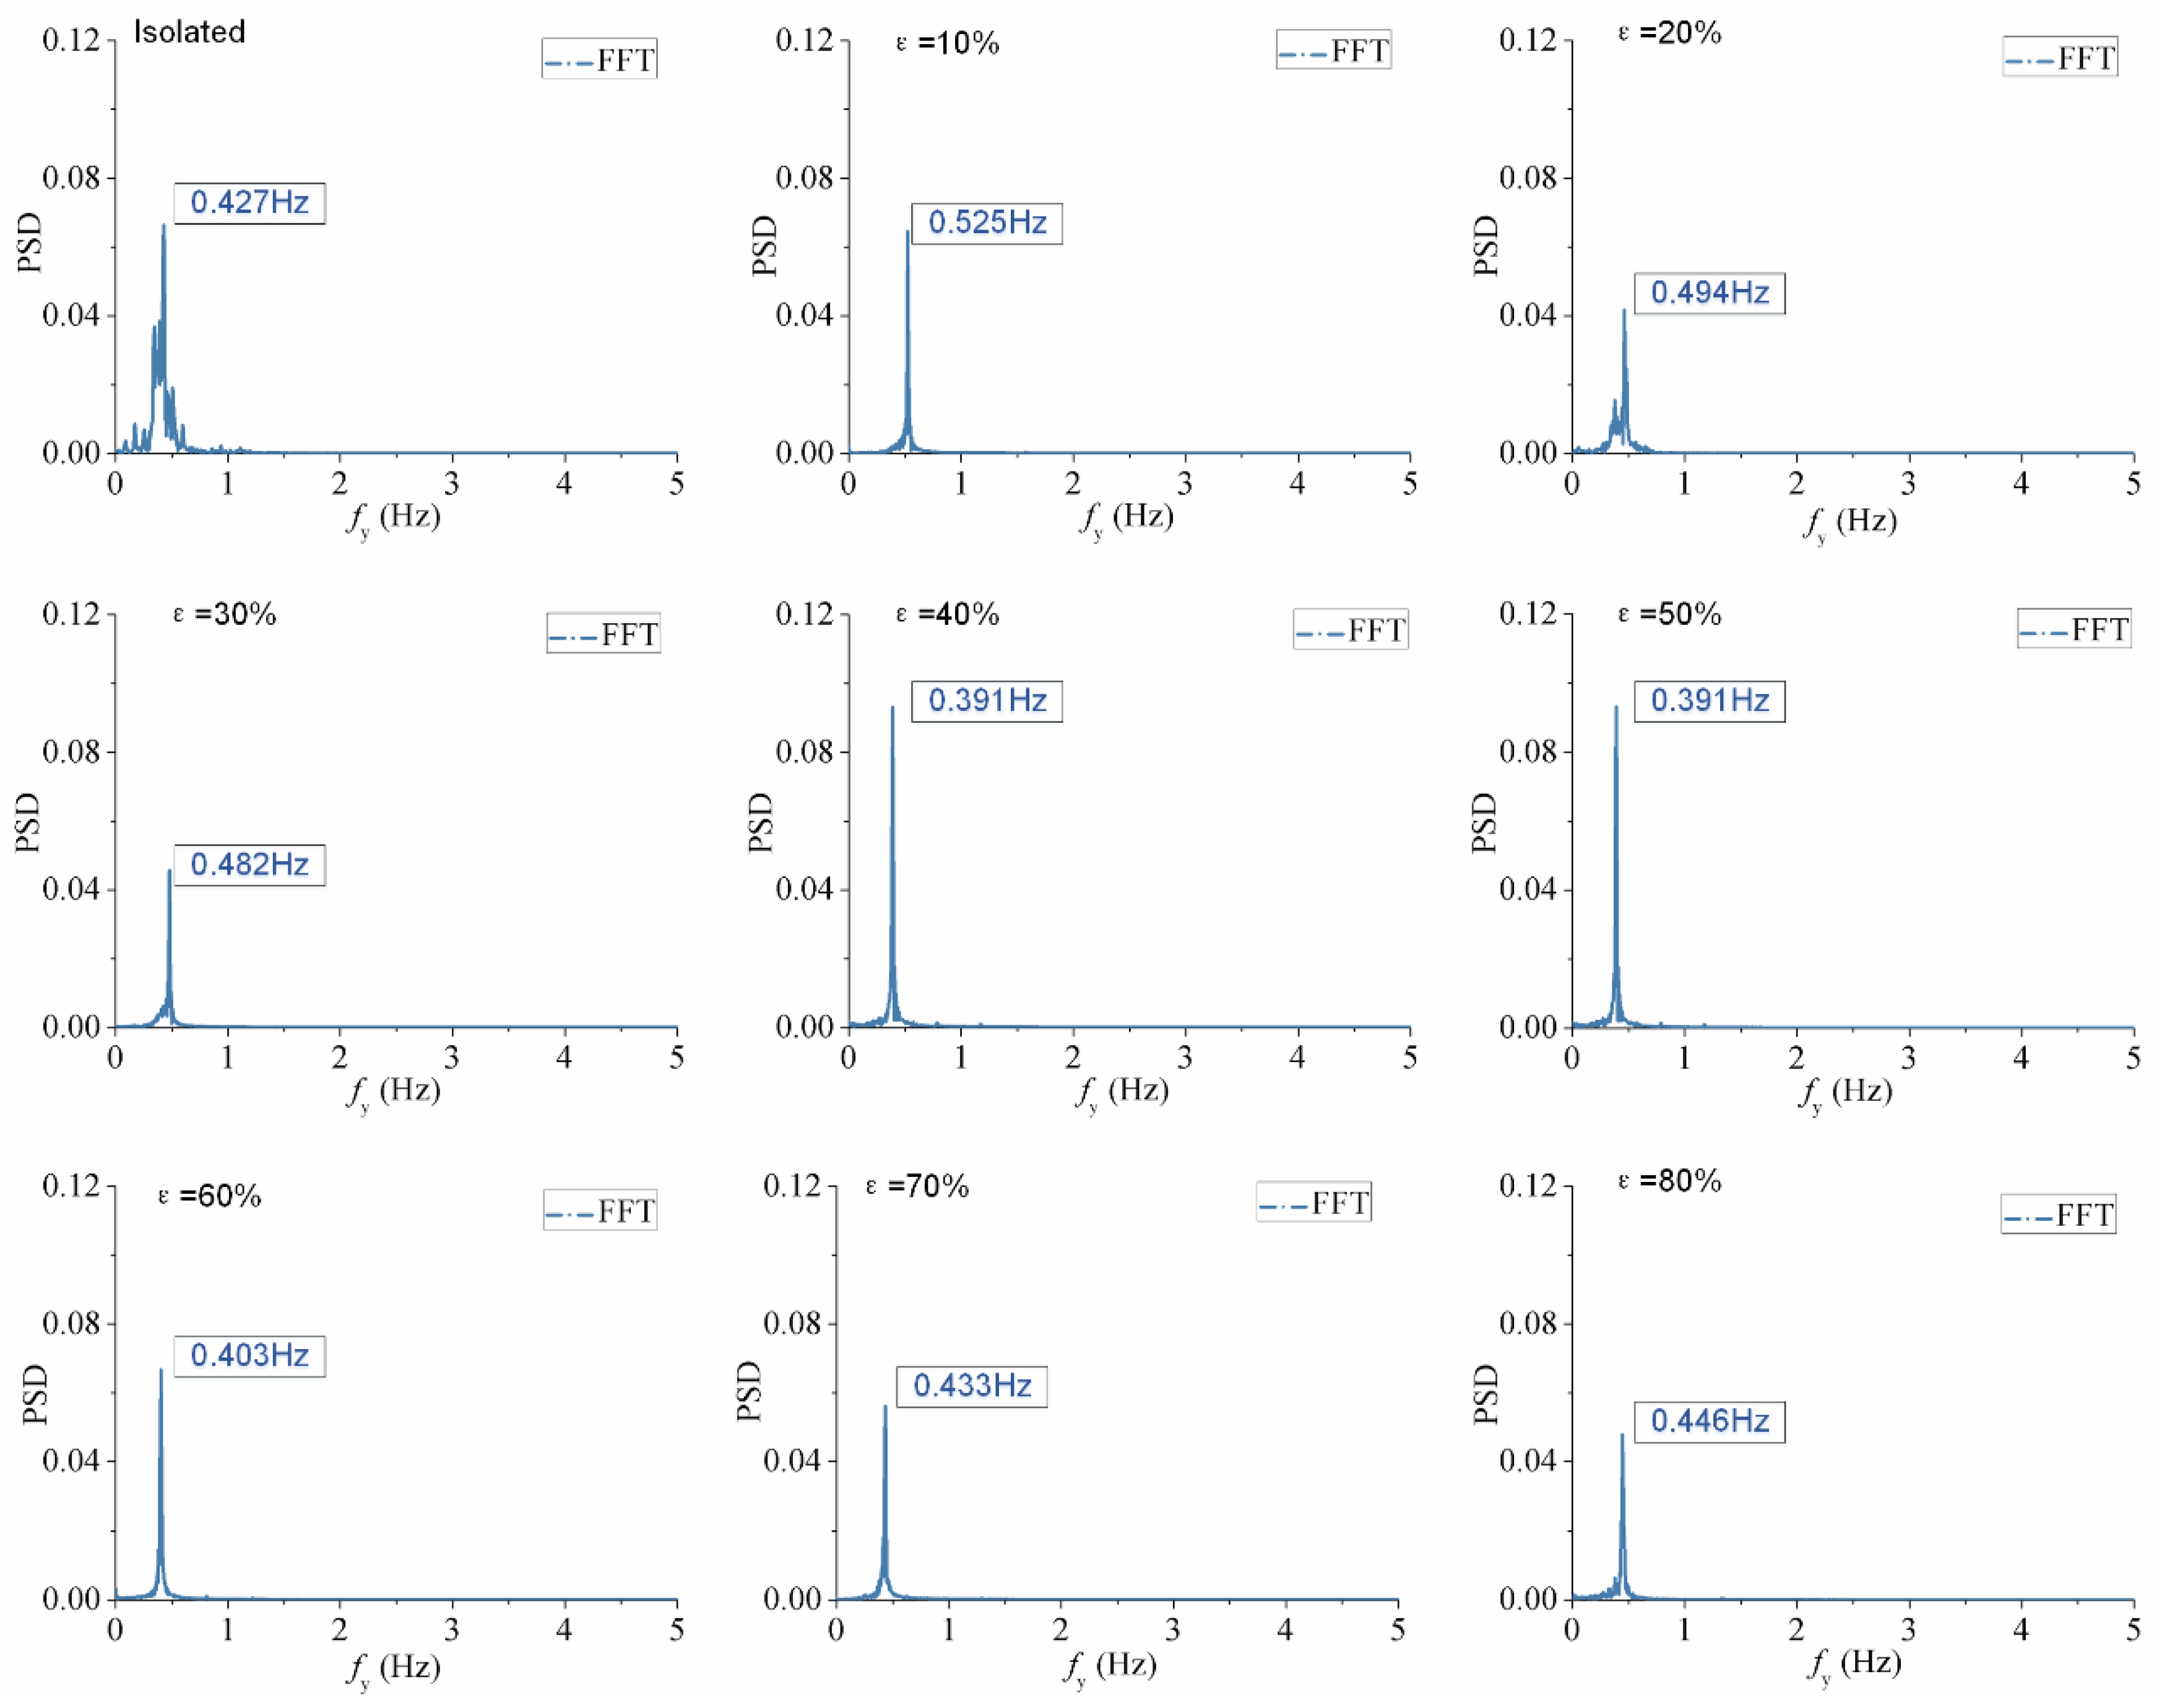
4.1. Effect of Coverage Ratio

In order to verify the practicality of axial-slats on VIV suppression under the most severe conditions, the Reynolds number was fixed at 2.8 × 10⁴ (Ur = 7.0), which is in the locked region where a large-amplitude motion occurs. The coverage ratio (ε) is variable, and the gap ratio is fixed at 0.15.
The time histories of amplitude responses of a circular cylinder with different coverage ratios of axial-slats (Re = 2.8 × 10⁴ and δ = 0.15) are shown in Figure 6. For isolated cylinder, the cross-flow amplitude ratio was close to 1.5, which is also found in the experiments by Jauvtis and Williamson [24] and is called “super upper” branch. Due to the effect of the axial-slats, the in-line amplitude ratios were effectively suppressed. Especially for ε = 30%, the amplitude ratio was close to 0. As coverage ratio increased, the suppression effect was different. Especially for ε = 30%, the amplitude ratio was close to 0.5, which was about 66.7% lower than that of the isolated cylinder.
The frequency ratios of a circular cylinder with different coverage ratios of axial-slats (Re = 2.8 ×10⁴ and δ = 0.15) are shown in Figure 7. PSD is the power spectral density of the signal. When ε = 10%, the vibration frequency is the maximum value. Then the vibration frequency shows a downward trend. When ε = 40% and ε = 50%, the vibration frequency was the minimum value (fy = 0.391 Hz), which was close to the natural frequency of the isolated cylinder (fn = 0.4 Hz). The cross-flow amplitude ratio was close to 1.0 for ε = 40%, which was about 33.3% lower than that of the isolated cylinder. The different coverage ratios of axial-slats result in different effects on the frequency of vortex shedding. When ε = 40% and ε = 50%, the frequency of vortex shedding approached the natural frequency of the structure and resonance phenomenon occurs. When ε ≥ 50%, the vibration frequency gradually increased.
The vorticity contours of a circular cylinder with different coverage ratios of axial-slats (Re = 2.8 × 10⁴ and δ = 0.15) are shown in Figure 8. The unit of vorticity intensity is 1/s or s1. For an isolated cylinder, a typical 2T mode (2T mode means that three vortices shed per half cycle) is observed, which was also observed in the experiments by Jauvtis and Williamson [23]. The vortex pattern was changed due to the existence of axial-slats. The vortex pattern was unstable for ε = 40%, and the 2S mode (2S mode means that two single vortices shed per cycle) was observed in the wake region near the structure. However, the 2S mode gradually changed to the P + S mode in the wake region away from the structure (P + S mode means that three vortices shed per cycle) because the axial-slats destroyed the vortex street. When the coverage ratios of axial-slats were different, the levels of damage of the vortex streets were different. The vortex street was destroyed, which was helpful to suppress structural vibration. For ε = 10%, a typical 2P mode (2P mode means that two vortex pairs are formed per cycle) was observed.

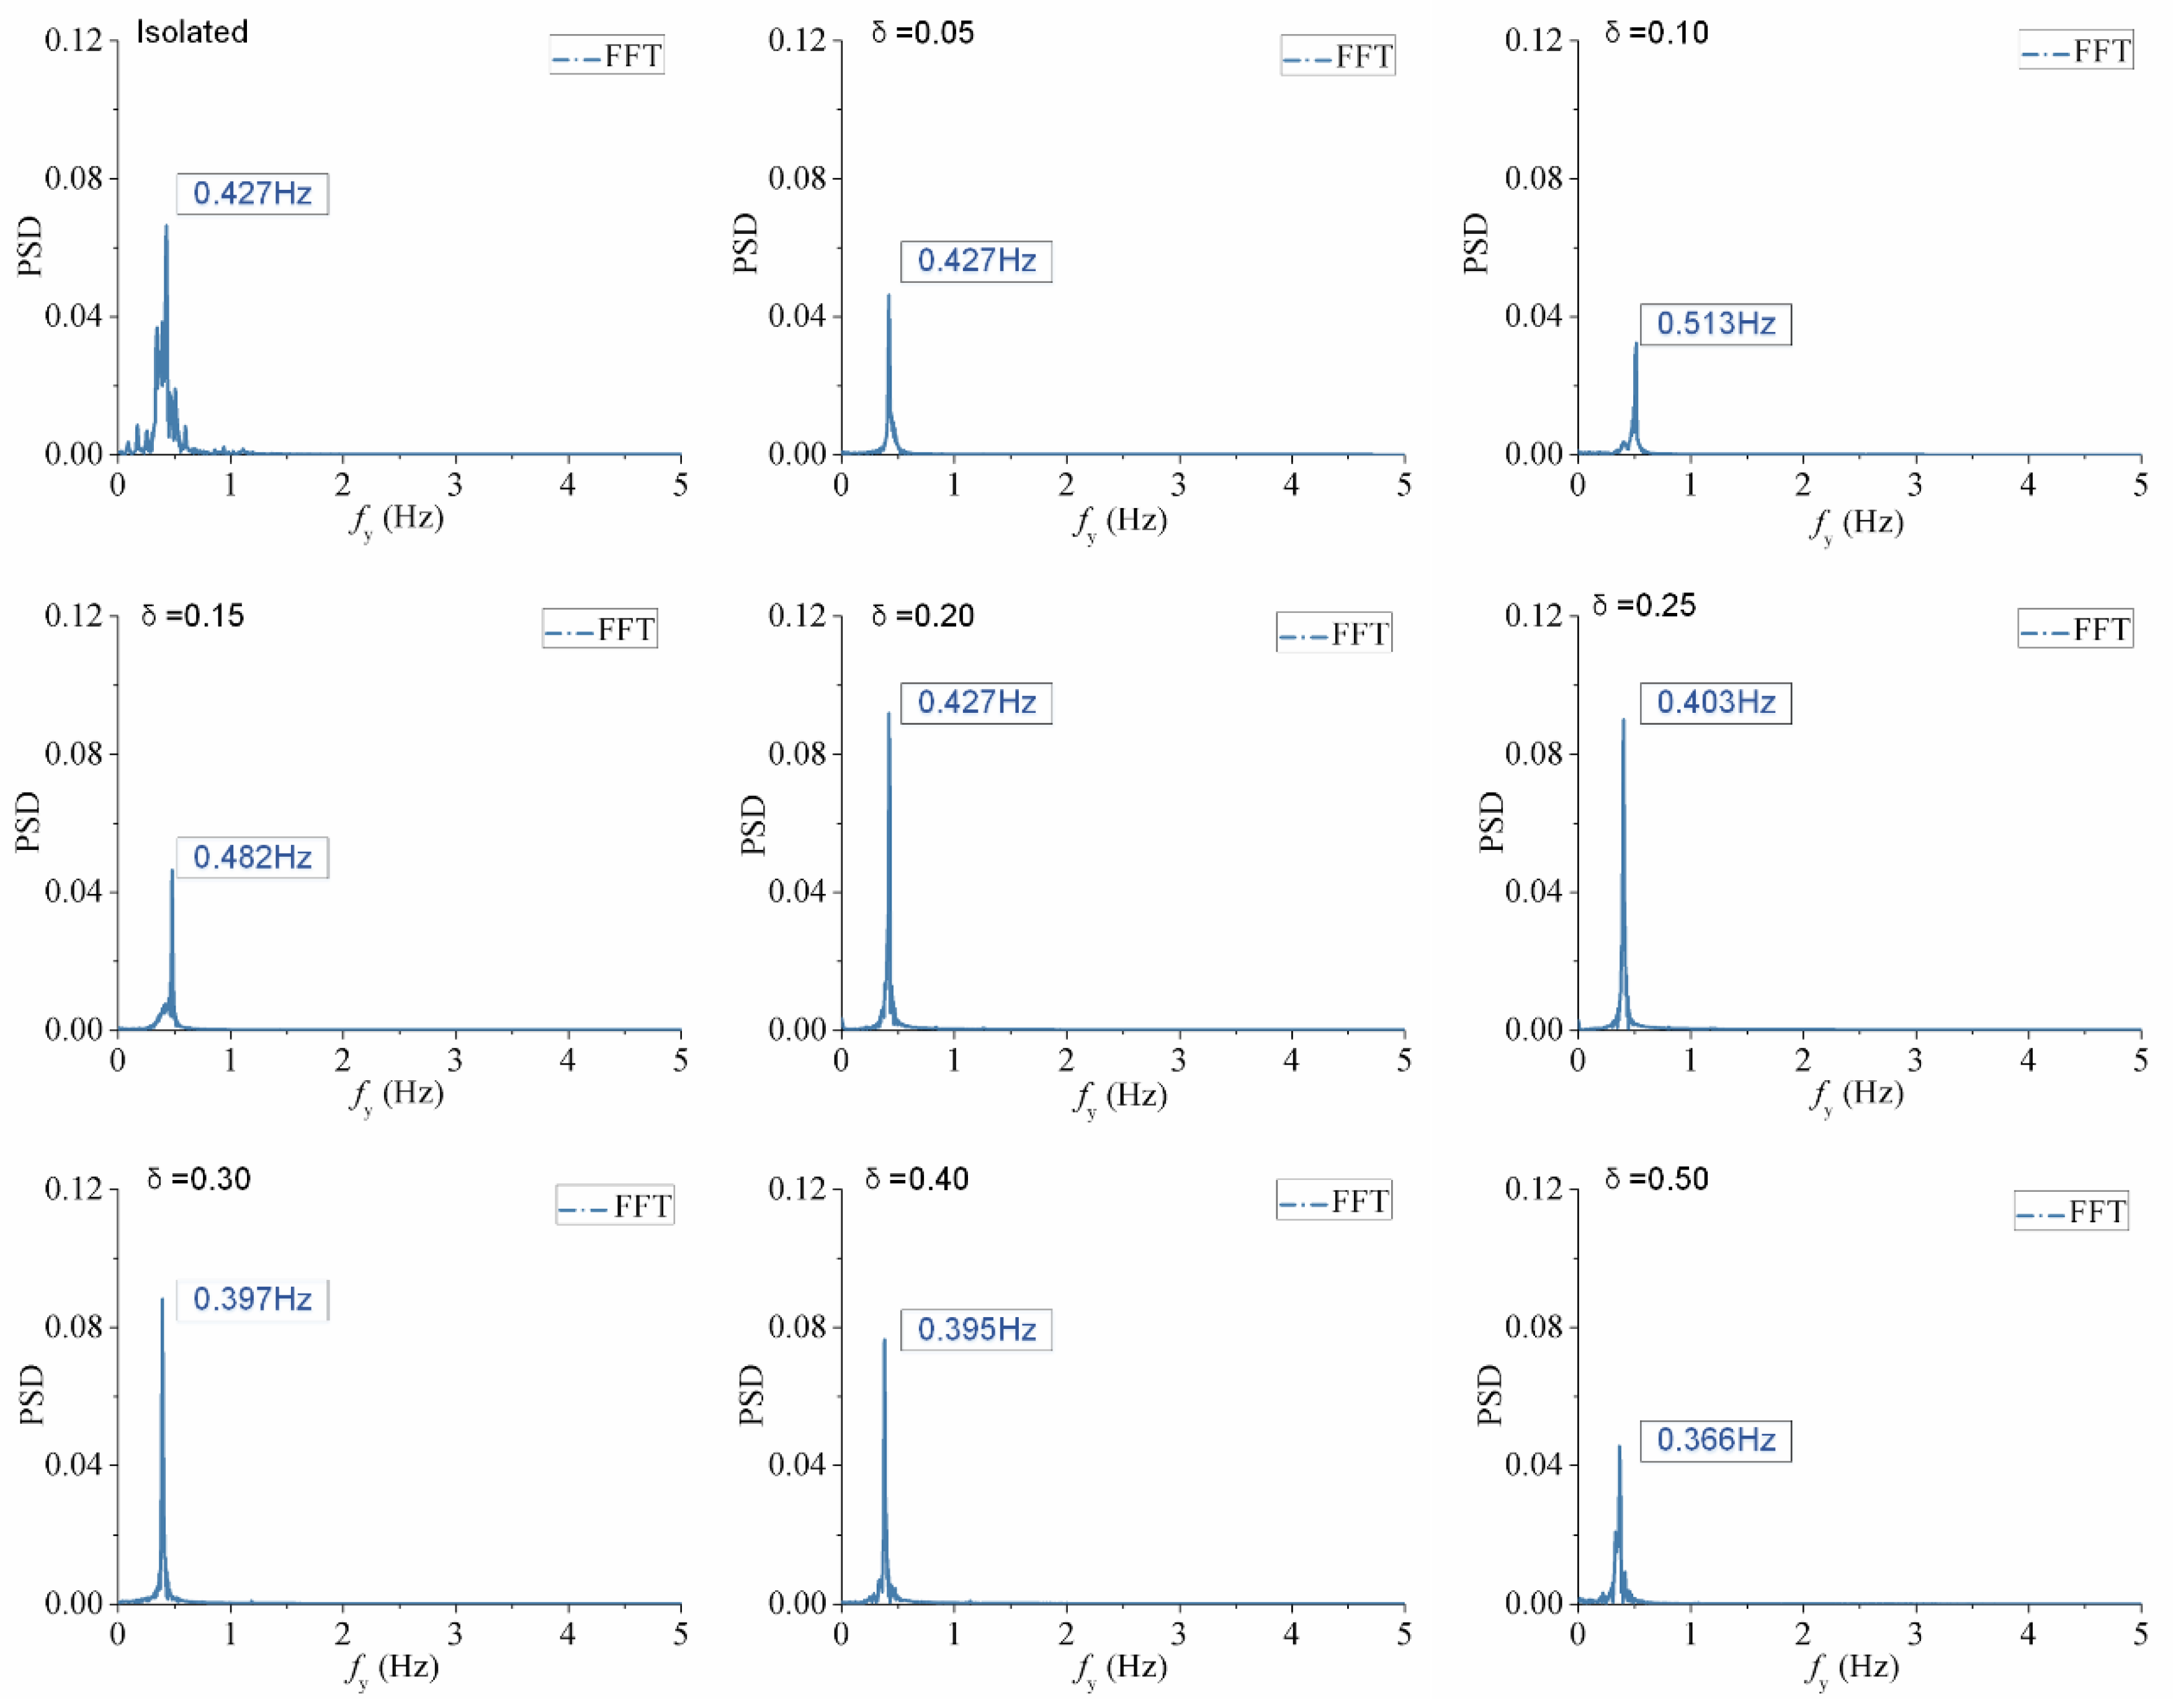
4.2. Effect of the Gap Ratio

In order to verify the practicality of axial-slats on VIV suppression under the most severe conditions, the Reynolds number was fixed at 2.8 × 10⁴ (Ur = 7.0), which was in the locked region where a large-amplitude motion occurred. The gap ratio (δ) was variable, and the coverage ratio (ε) was fixed at 30% because the suppression effect was the best in Section 4.1.
The time histories of amplitude responses of a circular cylinder with different gap ratios of axial-slats (Re = 2.8 × 10⁴ and ε = 30%) are shown in Figure 9. Due to the effect of the axial-slats, the in-line amplitude responses were effectively suppressed. Especially for δ = 0.05, δ = 0.10 and δ = 0.15, the in-line amplitude ratios were close to 0. When δ > 0.15, the suppression effect was weakened. For δ = 0.05, δ = 0.10 and δ = 0.15, the cross-flow amplitude ratios were close to 0.5. The cross-flow amplitude ratio was about 0.45 for δ = 0.10. The cross-flow frequency responses of a circular cylinder with different gap ratios of axial-slats (Re = 2.8 ×10⁴ and ε = 30%) are shown in Figure 10. When δ = 0.10, the vibration frequency was the maximum value, which was 0.513 Hz. The vibration frequency began to decrease when δ > 0.10. When δ = 0.25 and δ = 0.30, the vibration frequency was close to the natural frequency of isolated cylinder (fn = 0.4 Hz) and the suppression effect was weakened.
The vorticity contours of a circular cylinder with different gap ratios of axial-slats (Re = 2.8 ×10⁴ and ε = 30%) are shown in Figure 11. For an isolated cylinder, a typical 2T mode (2T mode means that three vortices shed per half cycle) was observed. The axial-slats changed the patterns of vortex shedding. The vortex pattern was unstable when δ = 0.40 and δ = 0.50. The 2S mode (2S mode means that two single vortices shed per cycle) was observed in the wake region near the structure for 0.05 ≤ δ ≤ 0.30. However, the 2S mode gradually changed to the P + S mode in the wake region away from the structure (P + S mode means that three vortices shed per cycle), because the axial-slats destroyed the vortex street. Although the gap ratios of axial-slats were different, the changes of vortex patterns were similar. The effects on vortex patterns using different coverage ratios of axial-slats were different from that using different gap ratios of axial-slats.

4.3. Reynolds Number and Drag coefficient

Based on Section 4.1 and Section 4.2, the suppression effect was the best for δ = 0.10, ε = 30%. However, the above analysis was only under the most demanding conditions (Re = 2.8 × 10⁴). Are the axial-slats practical in the all VIV response regions? Whether the axial-slats can increase the drag coefficient of the cylinder is also a concern.
Figure 12 shows comparisons of VIV responses of isolated cylinder and cylinder with axial-slats (δ = 0.10, ε = 30%). Based on the VIV response, the whole VIV response region was divided into four regions.
In region I, the reduced velocity range was 1–4. The cross-flow amplitude ratio was less than 0.3. The amplitude ratio and frequency ratio increased gradually. Since the amplitude ratio of cylinder with axial-slats in region I was very low and the vibration was irregular, vibration frequency was not monitored. The comparisons of VIV responses of isolated cylinder and cylinder with axial-slats (δ = 0.10, ε = 30%) at Ur = 4.0 (Re = 1.6 × 10⁴) are shown in Figure 13. The cross-flow amplitude of isolated cylinder was less than 0.04 m (Ay/D = 0.4) at Ur = 4.0 and it was only less than 0.006 m (Ay/D = 0.06) for a cylinder with axial-slats (δ = 0.10, ε = 30%), which decreased by about 85%. A typical 2S mode was observed for the isolated cylinder and the cylinder with axial-slats. The fluctuation trend of hydrodynamic force was consistent with that of amplitude for isolated cylinder and the cylinder with axial-slats. The hydrodynamic force was less than 4 N for isolated cylinder at Ur = 4.0, and the hydrodynamic force was less than 0.6 N for the cylinder with the axial-slats at Ur = 4.0.
In region II, the reduced velocity range was 4.5–7.0. The cross-flow amplitude ratio was less than 1.5. The amplitude ratio and frequency ratio increased rapidly. The comparisons of VIV responses of isolated cylinder and cylinder with axial-slats (δ = 0.10, ε = 30%) at Ur = 7.0 (Re = 2.8 × 10⁴) are shown in Figure 14. The cross-flow amplitude of isolated cylinder was close to 0.15 m (Ay/D = 1.5) at Ur = 7.0 and it was only 0.045 m (Ay/D = 0.45) for the cylinder with axial-slats (δ = 0.10, ε = 30%), which decreased by about 70%. A typical 2T mode was observed for the isolated cylinder and a 2S mode was observed for the cylinder with axial-slats. However, the 2S mode was changed to the P + S mode in far wake region, which indicates that the axial-slats destroyed the original vortex street and made the vortex easy to separate. The fluctuation trend of hydrodynamic force was consistent with that of amplitude for isolated cylinder. However, there was a phase difference of fluctuation between the hydrodynamic force and the amplitude for the cylinder with axial-slats. The hydrodynamic force was less than 16 N for the isolated cylinder at Ur = 7.0, and the hydrodynamic force was less than 3.0 N for the cylinder with axial-slats at Ur = 7.0.
In region III, the reduced velocity range was 7.5–11.0. The amplitude ratio and frequency ratio were stable. The amplitude ratio was stable at about 0.9 for isolated cylinder and it was only about 0.4 for the cylinder with axial-slats (δ = 0.10, ε = 30%). The frequency ratio jumped between region II and region III for the isolated cylinder. However, the frequency ratio of the cylinder with axial-slats jumped between region I and region II. The comparisons of VIV responses of the isolated cylinder and cylinder with axial-slats (δ = 0.10, ε = 30%) at Ur = 10.0 (Re = 4.0 × 10⁴) are shown in Figure 15. The cross-flow amplitude of isolated cylinder was 0.09 m (Ay/D = 0.9) at Ur = 10.0 and it was only 0.045 m (Ay/D = 0.45) for the cylinder with axial-slats (δ = 0.10, ε = 30%), which decreased by about 50%. A typical 2P mode was observed for the isolated cylinder and the vortex pattern of the cylinder with axial-slats in region III was similar to that in region II. The hydrodynamic force was less than 4 N for the isolated cylinder at Ur = 10.0. The fluctuation of hydrodynamic force was very intense and the peak value range of hydrodynamic force was 0.5–4.5 N. The hydrodynamic force of the isolated cylinder was less than that of the cylinder with axial-slats at Ur = 10.0. Based on Figure 11, the vibration frequency began to decrease slowly at Ur = 10.0, and the reason of severe fluctuation might be the occurrence of “lock-in” phenomenon [26]. When the frequency of vortex shedding was close to the natural frequency of the cylinder, the fluctuation of amplitude response was more serious.
In region IV, the reduced velocity range was 11.5–14.0. The cross-flow amplitude ratio decreased rapidly. Since the amplitude ratio of the cylinder with axial-slats in region IV was very low, vibration frequency was not monitored. The comparisons of VIV responses of the isolated cylinder and the cylinder with axial-slats (δ = 0.10, ε = 30%) at Ur = 13.0 (Re = 5.2 × 10⁴) are shown in Figure 16. The cross-flow amplitude of the isolated cylinder was about 0.045 m (Ay/D = 0.45) at Ur = 13.0 and it was only less than 0.002 m (Ay/D = 0.02) for the cylinder with axial-slats (δ = 0.10, ε = 30%), which decreased by about 96%. A typical 2P mode was observed for the isolated cylinder and a typical 2S mode was observed for the cylinder with axial-slats. There was a phase difference of fluctuation between the hydrodynamic force and the amplitude for isolated cylinder and the cylinder with axial-slats. The hydrodynamic force was less than 4 N for isolated cylinder at Ur = 13.0, and the hydrodynamic force was less than 1.0 N for the cylinder with axial-slats at Ur = 13.0.
Figure 17 shows the mean drag coefficients versus reduced velocity of the isolated cylinder and the cylinder with axial-slats (δ = 0.10, ε = 30%). The mean drag coefficient was unstable in region I for the isolated cylinder. The mean drag coefficient shows an upward trend in region II, and the maximum value was about 3.0 at Ur = 7. The mean drag coefficient was nearly three times greater than that of a stationary cylinder when Ur = 7.0, and the phenomenon was also observed in the experiments by Jauvtis and Williamson [23]. The mean drag coefficient reached a maximum value at Ur = 7.0 for isolated cylinder, however it was only at Ur = 5.0 for the cylinder with axial-slats. The mean drag coefficient decreased gradually for isolated cylinder and the cylinder with axial-slats in region III. The mean drag coefficient continued to decrease for isolated cylinder in region IV. However, it was at a fixed value (Cd = 1.1) for the cylinder with axial-slats, which was also observed in Zdravkovich’s experiments [6]. The mean drag coefficient of the cylinder with axial-slats was higher than that of isolated cylinder when Ur ≥12 (Re ≥ 4.8 × 10⁴).

5. Conclusions

The vortex-induced vibration of a circular cylinder with axial-slats was numerically investigated. The Reynolds number range of simulation was 0.8 × 10⁴ < Re < 5.6 × 10⁴ and the range of reduce velocity was 2 ≤ Ur ≤ 14. The effect of axial-slats on VIV suppression was evaluated in detail. Based on the above research, the following conclusions could be obtained:
(1)
The coverage ratio (ε) of axial-slats was variable. The in-line amplitude response was effectively suppressed using axial-slats. Especially for ε = 30%, the in-line amplitude ratio was close to 0, and the cross-flow amplitude ratio was close to 0.5, which decreased by about 66.7% compared with that of isolated cylinder. The damage degree of vortex pattern was different, which indicates that the axial-slats at certain locations have a great influence on vortex shedding. However, the suppression effect using axial-slats at some locations could be ineffective. Some ineffective axial-slats could be appropriately reduced to reduce the cost of axial-slats in engineering practice.
(2)
The gap ratio (δ) of axial-slats was variable. Although the gap ratios of axial-slats were different, the damage degrees of vortex pattern were similar. When 0.05 ≤ δ ≤ 0.15, the axial-slats were obviously helpful to suppress VIV. When δ ≥ 0.20, the vibration frequency was in the “lock-in” range of isolated cylinder (fy/fn ≈ 1.0) and the suppression effect was weakened.
(3)
Based on the VIV response, the whole VIV response region was divided into four regions. In region II and region III, the 2S mode was changed to the P + S mode in the far wake region, which shows that the axial-slats destroyed the original vortex street and made the vortex easy to separate. The frequency ratio jumped between region II and region III for the isolated cylinder. However, the frequency ratio jumped between region I and region II for the cylinder with axial-slats.
In this paper, the effect of the axial-slats on VIV suppression was studied using numerical method. Further experimental studies were needed in the future. At the same time, it is necessary to study how to reduce the cost of the axial-slats in engineering practice. The axial-slat is a passive vibration control device, which can be used in ocean engineering and wind engineering. Especially, it can be applied to the vibration control of cylindrical or tubular structures.

Author Contributions

Software, W.W.; validation, W.W.; investigation, W.W.; writing—original draft preparation, W.W.; writing—review and editing, T.Z.; visualization, W.T.; project administration, Z.M.

Acknowledgments

This research is supported by the National Science Foundation of China (Grant No.51179159, Grant No.10672136, Grant No.61572404 and Grant No.51509205).

Conflicts of Interest

The authors declare no conflict of interest.

References

  1. Wang, W.; Song, B.; Mao, Z.; Tian, W.; Zhang, T. Numerical investigation on VIV suppression of marine riser with triangle groove strips attached on its surface. Int. J. Nav. Archit. Ocean Eng. 2019, 11, 875–882. [Google Scholar] [CrossRef]
  2. Nikoo, H.M.; Bi, K.; Hao, H. Effectiveness of using pipe-in-pipe (PIP) concept to reduce vortex-induced vibrations (VIV): Three-dimensional two-way FSI analysis. Ocean Eng. 2018, 148, 263–276. [Google Scholar] [CrossRef]
  3. Ding, W.J.; Sun, H.; Xu, W.H.; Bernitsas, M.M. Numerical investigation on interactive FIO of two-tandem cylinders for hydrokinetic energy harnessing. Ocean Eng. 2019, 187, 106215. [Google Scholar] [CrossRef]
  4. Dorogi, D.; Baranyi, L. Numerical simulation of a freely vibrating circular cylinder with different natural frequencies. Ocean Eng. 2018, 158, 196–207. [Google Scholar] [CrossRef] [Green Version]
  5. Kang, Z.; Zhang, C.; Ma, G.; Ni, W.C. A numerical investigation of two-degree-of-freedom VIV of a circular cylinder using the modified turbulence model. Ocean Eng. 2018, 155, 211–226. [Google Scholar] [CrossRef]
  6. Zdravkovich, M.M. Review and classification of various aerodynamic and hydrodynamic means for suppressing vortex shedding. J. Wind Eng. Ind. Aerodyn. 1981, 7, 145–189. [Google Scholar] [CrossRef]
  7. Sung, Y.; Kim, W.; Mungal, M.G.; Cappelli, M.A. Aerodynamic modification of flow over bluff objects by plasma actuation. Exp. Fluids 2006, 41, 479–486. [Google Scholar] [CrossRef]
  8. Carini, M.; Pralits, J.O.; Luchini, P. Feedback control of vortex shedding using a full-order optimal compensator. J. Fluids Struct. 2015, 53, 15–25. [Google Scholar] [CrossRef]
  9. Li, Z.; Navon, I.M.; Hussaini, M.Y.; Le Dimet, F.X. Optimal control of cylinder wakes via suction and blowing. Comput. Fluids 2003, 32, 149–171. [Google Scholar] [CrossRef]
  10. Chan, A.S.; Dewey, P.A.; Jameson, A.; Liang, C.; Smits, A.J. Vortex suppression and drag reduction in the wake of counter-rotating cylinders. J. Fluid Mech. 2011, 679, 343–382. [Google Scholar] [CrossRef] [Green Version]
  11. Weier, T.; Gerbeth, G. Control of separated flows by time periodic Lorentz forces. Eur. J. Mech. B Fluids 2004, 23, 835–849. [Google Scholar] [CrossRef]
  12. Gao, Y.; Zong, Z.; Zou, L.; Takagi, S.; Jiang, Z. Numerical simulation of vortex-induced vibration of a circular cylinder with different surface roughness. Mar. Struct. 2018, 57, 165–179. [Google Scholar] [CrossRef]
  13. Zhu, H.J.; Yao, J. Numerical evaluation of passive control of VIV by small control rods. Appl. Ocean Res. 2015, 51, 93–116. [Google Scholar] [CrossRef]
  14. Xu, F.; Chen, W.L.; Xiao, Y.Q.; Li, H.; Ou, J.P. Numerical study on the suppression of the vortex-induced vibration of an elastically mounted cylinder by a traveling wave wall. J. Fluids Struct. 2014, 44, 145–165. [Google Scholar] [CrossRef]
  15. Sui, J.; Wang, J.S.; Liang, S.P.; Tian, Q.L. VIV suppression for a large mass-damping cylinder attached with helical strakes. J. Fluids Struct. 2016, 62, 125–146. [Google Scholar] [CrossRef]
  16. Huera-Huarte, F.J. Suppression of vortex-induced vibration in low mass-damping circular cylinders using wire meshes. Mar. Struct. 2017, 55, 200–213. [Google Scholar] [CrossRef]
  17. Lou, M.; Chen, Z.; Chen, P. Experimental investigation of the suppression of vortex induced vibration of two interfering risers with splitter plates. J. Nat. Gas Sci. Eng. 2016, 35, 736–752. [Google Scholar] [CrossRef]
  18. Zheng, H.X.; Wang, J.S. Galloping oscillation of a circular cylinder firmly combined with different shaped fairing devices. J. Fluids Struct. 2018, 77, 182–195. [Google Scholar] [CrossRef]
  19. Zhu, H.J.; Gao, Y. Vortex-induced vibration suppression of a main circular cylinder with two rotating control rods in its near wake: Effect of the rotation direction. J. Fluids Struct. 2017, 74, 469–491. [Google Scholar] [CrossRef]
  20. Shaafi, K.; Vengadesan, S. Wall proximity effects on the effectiveness of upstream control rod. J. Fluids Struct. 2014, 49, 112–134. [Google Scholar] [CrossRef]
  21. Wu, H.; Sun, D.P.; Lu, L.; Teng, B.; Tang, G.Q.; Song, J.N. Experimental investigation on the suppression of vortex-induced vibration of long flexible riser by multiple control rods. J. Fluids Struct. 2012, 30, 115–132. [Google Scholar] [CrossRef]
  22. Wong, H.Y.; Kokkalis, A. A comparative study of three aerodynamic devices for suppressing vortex-induced oscillation. J. Wind Eng. Ind. Aerodyn. 1982, 10, 21–29. [Google Scholar] [CrossRef]
  23. Jauvtis, N.; Williamson, C.H.K. The effect of two degrees of freedom on vortex-induced vibration at low mass and damping. J. Fluid Mech. 2004, 509, 23–62. [Google Scholar] [CrossRef]
  24. Zhuang, K.; Cheng, Z.; Rui, C.; Gang, M. A numerical investigation of the effects of Reynolds number on vortex-induced vibration of the cylinders with different mass ratios and frequency ratios. Int. J. Nav. Archit. Ocean Eng. 2019, 11, 835–850. [Google Scholar]
  25. Dappolonia, E.; Newmark, N.M. A method for the solution of the restrained cylinder under compression. J. Appl. Mech. Trans. ASME 1951, 18, 326. [Google Scholar]
  26. Ding, W.J.; Wang, K.Y.; Mao, Z.Y.; Cao, H. Layout optimization of an inertial energy harvester for miniature underwater mooring platforms. Mar. Struct. 2020, 69, 102681. [Google Scholar] [CrossRef]
Figure 1. (a) The 2-degrees of freedom (DOF) vortex-induced vibration (VIV) system and (b) a main cylinder with axial-slats (N = 4).
Jmse 07 00454 g001
Figure 2. The process of the numerical simulation
Jmse 07 00454 g002
Figure 3. The computational domain.
Jmse 07 00454 g003
Figure 4. Mesh (M5, ε = 60% and δ = 0.15 D): (a) mesh structure; (b) mesh around the cylinder and (c) the boundary layer mesh.
Jmse 07 00454 g004
Figure 5. Numerical model validation: (a) comparisons of amplitude responses and (b) comparisons of frequency responses.
Jmse 07 00454 g005
Figure 6. The time histories of amplitude responses of a circular cylinder with different coverage ratios of axial-slats (Re = 2.8 × 10⁴ and δ = 0.15).
Jmse 07 00454 g006
Figure 7. The frequencies responses in cross-flow of a circular cylinder with different coverage ratio of axial-slats (Re = 2.8 × 10⁴ and δ = 0.15).
Jmse 07 00454 g007
Figure 8. The vorticity contours of a circular cylinder with a different coverage ratio of axial-slats at Re = 2.8 × 10⁴ and δ = 0.15.
Jmse 07 00454 g008
Figure 9. The time histories of amplitude responses of a circular cylinder with different gap ratio of axial-slats (Re = 2.8 × 10⁴ and ε = 30%).
Jmse 07 00454 g009
Figure 10. The cross-flow frequency responses of a circular cylinder with different gap ratios of axial-slats (Re = 2.8 × 10⁴ and ε = 30%).
Jmse 07 00454 g010
Figure 11. The vorticity contours of a circular cylinder with different gap ratios of axial-slats at Re = 2.8 × 10⁴ and ε = 30%.
Jmse 07 00454 g011
Figure 12. Comparisons of VIV responses of isolated cylinder and cylinder with axial-slats (δ = 0.10, ε = 30%).
Jmse 07 00454 g012
Figure 13. The comparisons of VIV responses of isolated cylinder and cylinder with axial-slats (δ = 0.10, ε = 30%) at Ur = 4.0 (Re = 1.6 × 10⁴).
Jmse 07 00454 g013
Figure 14. The comparisons of VIV responses of isolated cylinder and cylinder with axial-slats (δ = 0.10, ε = 30%) at Ur = 7.0 (Re = 2.8 × 10⁴).
Jmse 07 00454 g014
Figure 15. The comparisons of VIV responses of isolated cylinder and cylinder with axial-slats (δ = 0.10, ε = 30%) at Ur = 10.0 (Re = 4.0 × 10⁴).
Jmse 07 00454 g015
Figure 16. The comparisons of VIV responses of isolated cylinder and cylinder with axial-slats (δ = 0.10, ε = 30%) at Ur = 13.0 (Re = 5.2 × 10⁴).
Jmse 07 00454 g016
Figure 17. Mean drag coefficient versus reduced velocity of isolated cylinder and cylinder with axial-slats (δ = 0.10, ε = 30%).
Jmse 07 00454 g017
Table 1. The main parameters of the VIV system.
DescriptionSymbolValue
Mass-ratiom*2.6
Damping-ratioξ0.002
Spring stiffnessK (N·m)178.6
Natural frequency in waterfn (Hz)0.4
Cylindrical diameterD (m)0.1
Water densityρ (kg/m3)1000
Water kinematic viscosityυ (m2/s)1.0 × 10−6
Table 2. Mesh dependence check.
MeshElementsAy/Df/fn
M1300000.86001.2238
M2600000.8686(10.00%)1.2418 (1.47%)
M3900000.8742 (0.64%)1.2488 (0.56%)
M41200000.8765 (0.26%)1.2508 (0.16%)
M51500000.8769 (0.05%)1.2513 (0.04%)

