Article

Fuzzy Logic-Based Decision-Making Method for Ultra-Large Ship Berthing Using Pilotage Data

1
Intelligent Transport Systems Research Centre (ITSC), Wuhan University of Technology, Wuhan 430063, China
2
Rizhao Port Pilot Station, Rizhao 276800, China
3
Department of Logistics and Maritime Studies, Hong Kong Polytechnic University, Kowloon, Hong Kong
4
Graduate School of Logistics, Incheon National University, Incheon 406-772, Republic of Korea
*
Author to whom correspondence should be addressed.
J. Mar. Sci. Eng. 2024, 12(5), 717; https://doi.org/10.3390/jmse12050717
Submission received: 9 March 2024 / Revised: 18 April 2024 / Accepted: 24 April 2024 / Published: 26 April 2024

Abstract

:
As seafarers are involved in Maritime Autonomous Surface Ships (MASS), except for those in the fourth level of autonomy, the decision making of autonomous berthing should be carried out and be understood by human beings. This paper proposes a fuzzy logic-based human-like decision-making method for ultra-large ship berthing, which considers locations, ship particulars and the natural environment, and these factors are treated as the input variables. The IF–THEN rules are then established after the fuzzification of the input variables and are used for fuzzy inference to derive the decision of ship handling. It can be implemented in the decision-making system for safe navigation or be included in the process of autonomous berthing. The pilotage data are collected with nautical instruments and a distance measurement system during the berthing process, which are used to validate the proposed model and calculate the speed and turn errors. The overall and individual error of the decision-making model is in a reasonable and small range, which indicates that the model has good accuracy. The results of this research offer theoretical and practical insights into the development of a human-like decision-making method for autonomous navigation in port waters and maritime safety management in the shipping industry. The model can be further applied to develop a more widely applicable decision-making system for autonomous navigation in confined waters.

1. Introduction

With the development of artificial intelligence, intelligent ships have developed rapidly in recent years. In Norway, the Norwegian University of Science and Technology (NTNU) has completed operational trial sailings of the urban autonomous passenger ferry with the functions of a remotely control ship and autonomous navigation in 2022 [1]. Another intelligent ship in Norway, Oslo Fjord, is designed to sail completely unmanned and will contribute to lower transportation costs [2]. In Denmark, the tug Nellie Bly, using a system developed by Sea Machines Robotics of Boston, has completed the world’s first 1000 nautical mile autonomous voyage with the use of computer vision and autonomous technology to circumnavigate Denmark and gather essential data on waterways in 2021 [3]. In Japan, a coastal ferry completed the test of fully autonomous ship navigation systems in northern Kyushu in 2021, with autonomous port berthing and unberthing [4]. Rolls-Royce is expanding its ship automation systems with new products, which offer different levels of intelligent crew support, autonomous navigation, and remote command capabilities.
According to the International Regulations for Preventing Collision at Sea (COLREGS), when sailing from departure to destination, a ship’s journey may be underway, at anchor, made fast to the shore, or aground. As running aground is a type of accident, many studies have been carried out to prevent such an accident, and autonomous navigation is a type of solution. Therefore, many studies focused on the automation of the other three statuses including navigation, anchoring, and mooring. For ship anchoring, Yue et al. [5] proposed a two-stage ship detection network capable of generating anchors. Gao and Makino [6] analyzed the situations of anchored ships based on historical ship navigation data and discussed ship evacuations offshore during stormy weather. For ship mooring, Villa-Caro et al. [7] illustrated that mooring systems face more challenging conditions in terms of waves, wind, and drift currents and emphasized the need for equipment evolution to align with new port devices. For autonomous navigation, Lyu and Yin [8] and Ozturk et al. [9] introduced a real-time and deterministic path planning method for autonomous ships navigating in complex and dynamic environments. Liu et al. [10] and Wang et al. [11] developed an intelligent decision-making model based on human thinking patterns, COLREGs, and seamanship, considering collision risk, rule compliance, yaw angle, and drift distance. Hahn et al. [12] proposed methods to enhance the level of automation in ship handling, particularly focusing on conventional vessels during maneuvering operations towards autonomous operations.
Ship berthing is a common scenario, and numerous studies have investigated autonomous berthing [13,14,15]. Previous studies can be broadly categorized into ship motion control and decision making for ship berthing [16,17]. In ship motion control, some studies utilize berthing data to develop simulation modules based on neural networks [18,19,20]. Maki et al. [21] and Miyauchi et al. [22] employed the covariance matrix adaptation evolution strategy, which emulates biological evolution principles to tackle continuous optimization problems during the berthing process. Shimizu et al. [23] utilized machine learning techniques, including reinforcement learning and supervised learning, to develop a berthing model that accounts for port geometries and wind disturbances. Wang et al. [24] proposed a precise piloting and berthing method utilizing an LSTM-based trajectory prediction model and an MPC-based trajectory tracking algorithm. In decision-making during the berthing process, Nguyen and Im [25] developed a model that considers ship position, course, and speed to control the ship, aiding in determining ship handling decisions during berthing.
In previous studies, the majority utilized simulation data from ship motion models for verification [26,27], rarely incorporating real pilotage data or considering human thoughts. Nonetheless, even the most accurate model’s prediction of a ship’s behavior still deviates from reality [28]. As per the International Maritime Organization (IMO) definition of Maritime Autonomous Surface Ships (MASS), seafarers are involved in a ship’s navigation up to the third level of autonomy. Hence, the decision-making model should be based on human reasoning and comprehensible to humans [29].
This research establishes a fuzzy logic-based decision-making model for ultra-large ship berthing by analyzing the berthing scenario, defining interfering factors, and utilizing fuzzy numbers provided by domain experts to determine human turning and speed decisions. Using the SEAiq Pilot software 5.0.11, real pilotage data including distance, ship speed, and ship course can be collected. Subsequently, the Delphi method [30,31] was utilized for comprehensively determining the fuzzy numbers of different linguistic terms combined with varying weights of each domain expert. Finally, the fuzzy logic-based decision-making model integrates location, ship, and environmental factors to determine rudder and telegraph decisions in real time during the berthing process [32].
The paper is structured as follows. Section 2 introduces the three-layer berthing decision-making model based on fuzzy logic. It analyzes the berthing condition to identify the influencing factors including location, ship particulars, and natural environment. Section 3 presents a case study of ultra-large ship berthing at Rizhao Port. This study validates the decision-making model using real ship pilotage data and quantifies both individual and overall errors. The conclusions are provided in Section 4.

2. Methodology for Decision-Making Model

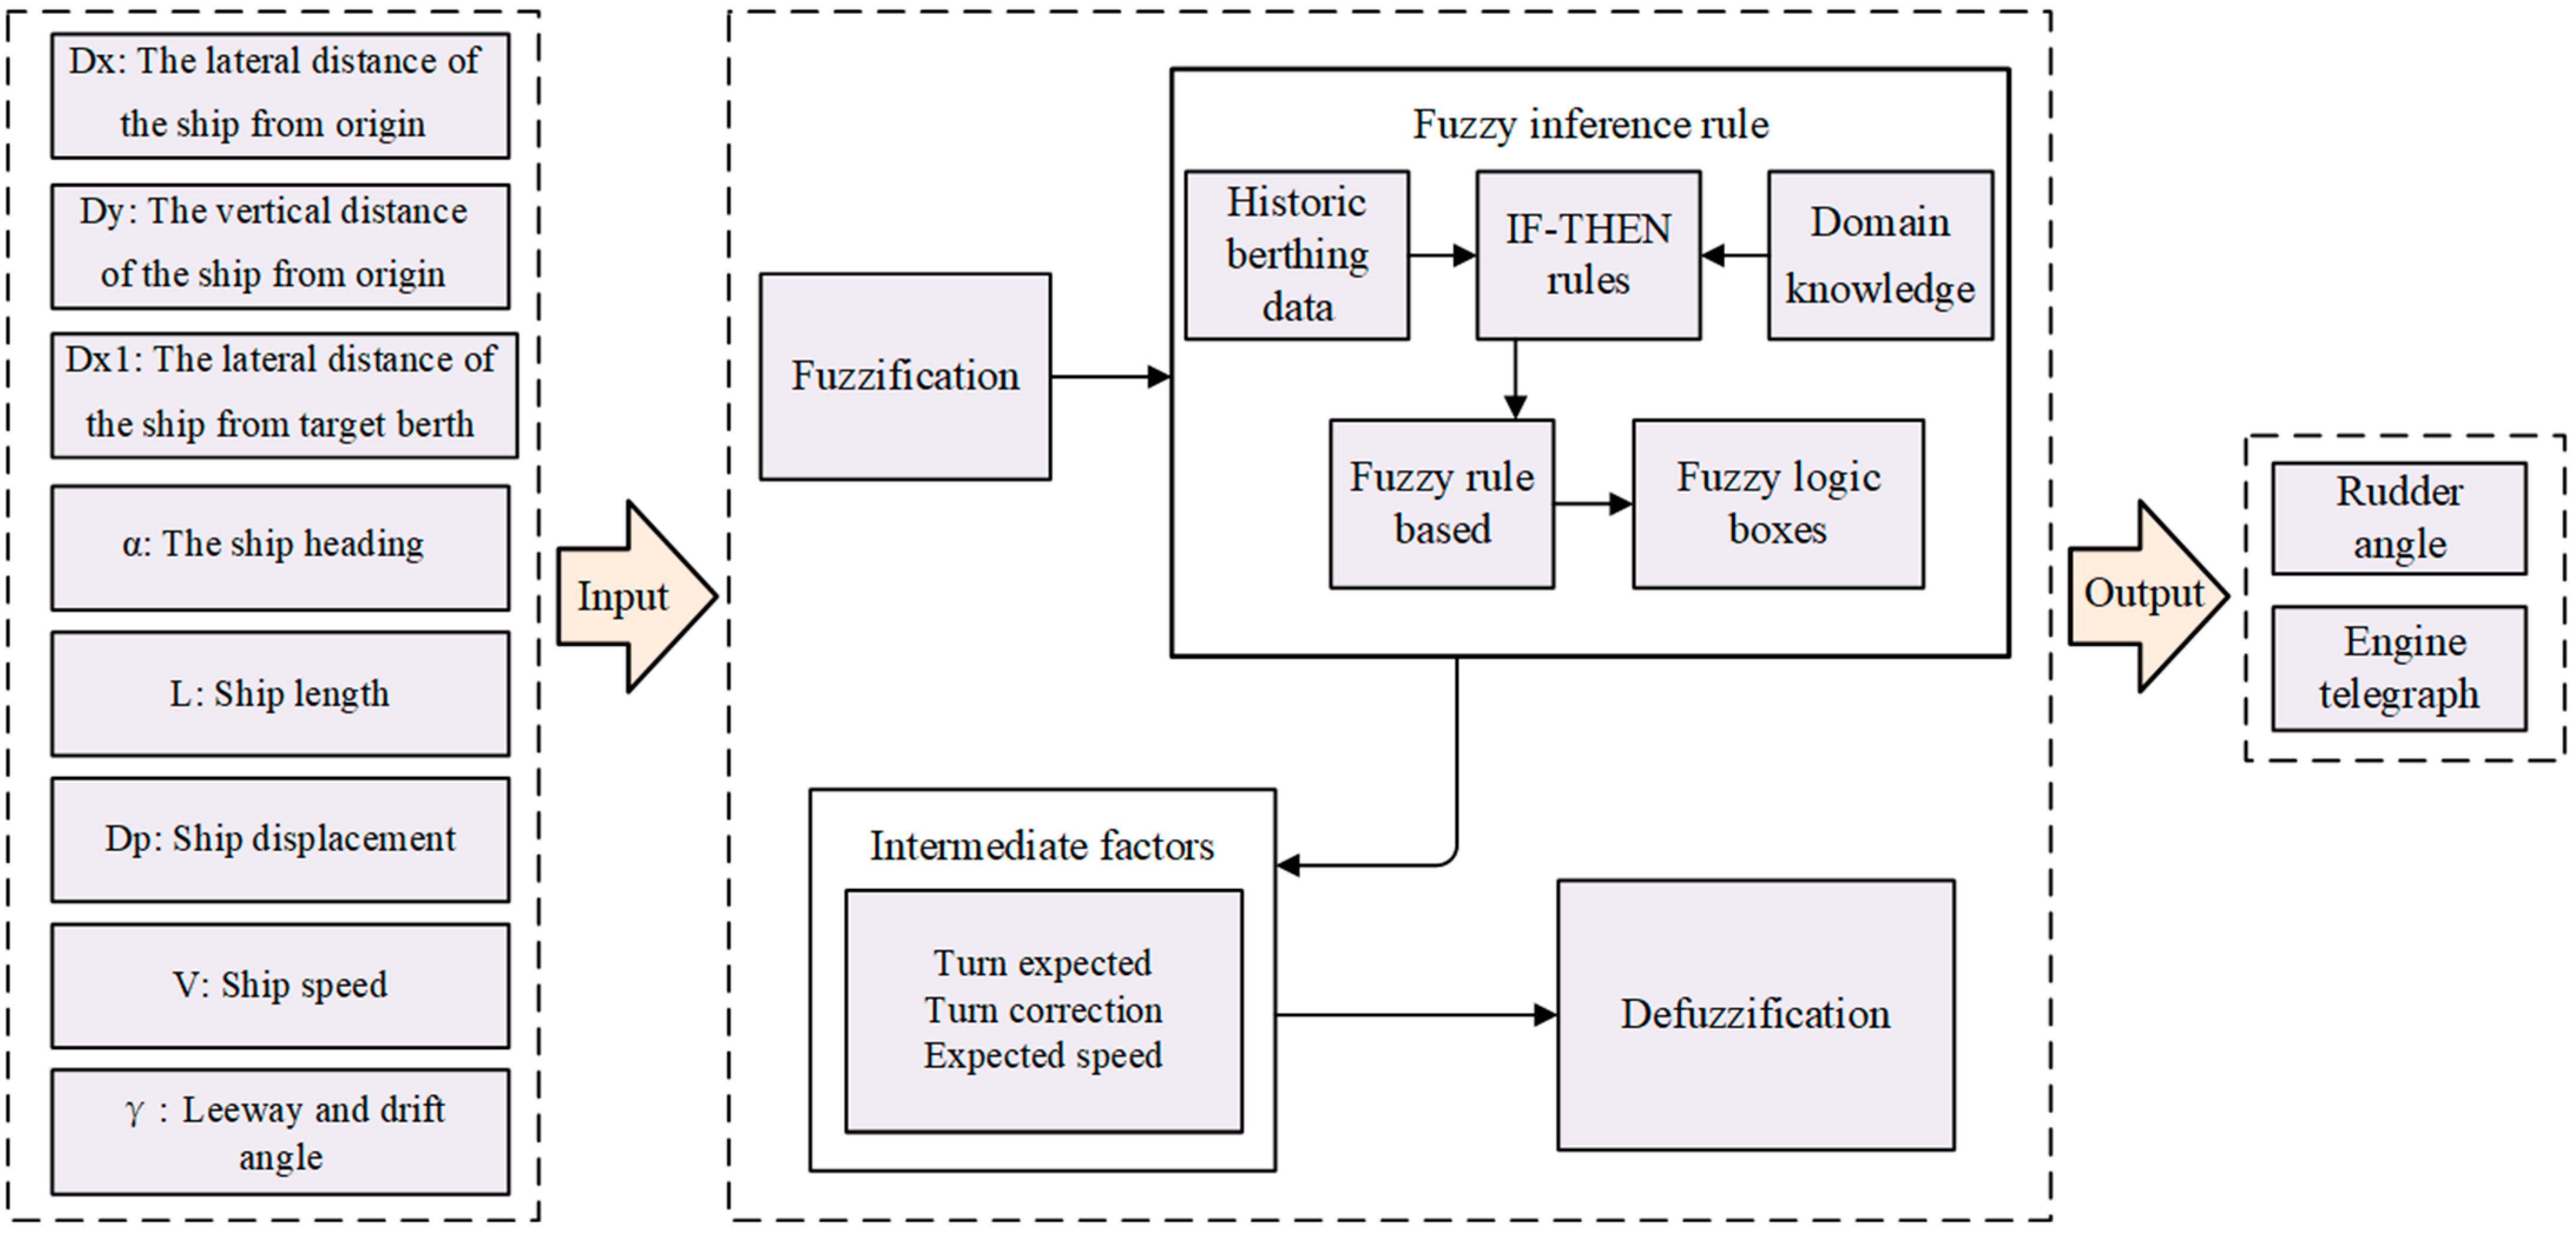
2.1. Establish the Fuzzy Logic-Based Decision-Making Model

In 1965, Zadeh [33] introduced the concept of a fuzzy subset within a set. In 1973, Kauffmann [34] proposed the concept of fuzzy graphs and developed their structure. Since then, the theory of fuzzy sets has emerged as a vibrant area of research across various disciplines, encompassing uncertainty management [35], social sciences, and financial analysis [36]. At present, fuzzy logic is widely used in risk analysis [37,38,39,40,41] and decision making [42,43,44] for maritime transportation. This method utilizes a degree of truth to express vagueness and uncertain variables, which is especially useful for the decision making of ship berthing because the berthing process is influence by multiple factors [31], and the quantification of these factors are often uncertain, imprecise, or vague. Moreover, the advantage of this method is to combine pilotage data and expert experience when establishing the decision-making model, which is the same with the decision-making process of the pilot.
Establishing a decision-making model often involves several steps in the fuzzy inference system: the fuzzification of input factors, the establishment of fuzzy rules and a fuzzy inference engine, and the defuzzification of outputs. Figure 1 illustrates the established three-layer framework of the fuzzy inference system for ship berthing, comprising the input layer, fuzzy inference layer, and output layer.
The first layer comprises the input layer. The input factors can be divided into two categories, which are location factors and environment factors. The rationale for selecting these factors will be provided in Section 2.2. It involves fuzzifying the input factors using linguistic variables and then conducting the inference process by applying established rules derived from the pilotage data and experts’ knowledge. The third layer consists of the output layer, where the decision-making results regarding turn and speed are defuzzified to obtain crisp values. Note that the heading and ship speed are influenced by the engine telegraph and rudder angle. Consequently, the decision model is divided into two parts: the turn decision model and the speed decision model. The framework of the decision model is shown in Figure 2.

2.2. Identify the Influencing Factors by Analyzing Ship Berthing Condition

The berthing process can be divided into three stages. There are many berths alongside the wharf, and the target berth may not the first berth. To simplify the modeling process, we define the edge of the wharf as the origin of the coordinate system. The X-coordinate represents the distance along the front line of the wharf, while the Y-coordinate represents the vertical distance from the origin. A typical ship berthing condition is shown in Figure 3, and it can be seen that the decision making for ship berthing is influenced by multiple factors, which can be divided into two categories.
One category is location factors, including Dx, Dy, and Dx1. The location factors are determined by the real-time position of the ship, which can be derived under a distance measurement system [45]. For different berths, the values of Dx and Dy can be adjusted based on the relative position between the ship and the berth.
(1)
Dx: The lateral distance of the ship from the origin. The ship should not be close to the wharf because a short distance will cause collisions between the ship and the wharf. If the value of Dx is large, the time to start turning should be earlier, and the helm order should be larger than usual to avoid the danger of colliding.
(2)
Dy: The vertical distance between the ship and the origin. When the ship approaches the berth, the ship should adjust its position and speed. Dy is a key parameter to determine the timing for adjusting the position and speed. If the value of Dy is large, the time to start turning should be later than usual, and the helm order should change smoothly to improve the safety of ship berthing.
(3)
Dx1: The lateral distance of the ship from the target berth. This factor determines the timing of berthing. If the value of Dx1 is large, the ship speed should decrease slowly during the berthing process to improve the efficiency and economy of ships and ports.
The other category is environment and ship factors, including α, ship speed, ship displacement, ship length, and leeway and drift angle [46,47,48].
(1)
α: The ship heading (under the established coordinate system). α determines whether the ship has enough space to adjust to a suitable berthing position. During the berthing process, α is changed by a change in the ship’s position, and the pilot should adjust the angle according to the actual situation. Traditionally, α is a large angle, even close to a right angle, before turning, and it will be gradually decreased owing to the adjusting of the pilot, and finally, it will be close to the front line of the wharf. This factor and location factors should be considered to determine the helm orders and time to start turning. If the ship approaches the berth and α is still large, a large rudder angle should be ordered to adjust the ship course to a reasonable range.
(2)
V: Ship speed. The ship speed of berthing is relatively low compared to navigation. During the berthing process, if the speed is high, there will be little time to adjust the ship heading. If the speed is slow, it will be difficult for the ship to maintain the rudder efficiency. Ship speed is determined by the engine telegraph, which reflects the effect of the speed decision obtained by the proposed model. It is a significant indicator for assessing the decision-making model.
(3)
Dp and L: Ship displacement and ship length. The size of the ship influences the maneuverability of the ship. Traditionally, the turning indices of small-sized ships are larger than those of large-sized ships, which indicates that the turning circle of small-sized ships is smaller than that of large-sized ships. Note that this paper focuses on ultra-large ships, which is less influenced by the wind and current compared with small-sized ships. The established decision-making model may be different from small-sized ships.
(4)
Leeway and drift angle. This is an angle between the course over ground and the true course caused by the wind and current. The wind and waves are major constrains during the berthing process, which are reflected by the leeway and drift angle in the fuzzy logic framework of the decision-making model.

2.3. Fuzzify the Influencing Factors for Decision Making of Ship Berthing

By assigning a value between 0 and 1 for each element of discourse, fuzzy logic can address the problems of inaccurate and uncertain data. The assigned value is called a membership degree and determines the extent to which a given element belongs to the fuzzy set.
Triangular membership functions are introduced for the fuzzification of the location and environment factors. This is because the turning and speed decisions exhibit linear changes relative to position variations. By adjusting the three parameters (i.e., lower bound (a), peak (b), and upper bound (c)) of the triangular membership function (as shown in Figure 4), fuzzy rules can be established for narrower water areas, thereby enhancing the accuracy of the decision-making model. For ultra-large ships, the displacement varies over a wide range. Hence, trapezoidal membership functions are employed to fuzzify the ship’s displacement, owing to their flexibility and capability to model a broader array of shapes and distributions compared to alternative membership functions. The triangular and trapezoidal membership functions are represented as Equations (1) and (2), respectively.
μ t r i a n g u l a r X = 0 x < a ( x a ) / ( b a ) a x b ( c x ) / ( c b ) b x c 0 c < x
μ t r a p e z o i d a l X = 0 x < a ( x a ) / ( b a ) a x b 1 b x c ( x d ) / ( c b ) c x d 0 d < x
Before fuzzifying the input factors, the number of linguistic variables should be determined. If there are too many linguistic variables, it is difficult to quantify each individual linguistic term. If there are too few linguistic variables, it is difficult to distinguish adjacent linguistic terms. In this paper, 2–9 linguistic variables are used to describe the input factors.
(1)
Input factors for decision-making model
There are six input factors, which are location, the ship heading, ship speed, ship displacement, and leeway and drift angle.
Location factors. According to the pilotage data and the berthing experience of the pilot [49,50], the location factors are divided into 4–6 fuzzy linguistic variables: opposite–far, opposite–close, very close, close, normal, and far. Based on the berthing data, the lateral distance of the ship from the origin Dx ∈ (1000, 1400) and the vertical distance of the ship from the origin Dy ∈ (400, 600) when ship starts to turn in the berthing process can be determined. Its value is mainly associated with the size of the ship. The larger the ship, the earlier the start time of the turning. Therefore, in order to establish a generic decision-making model considering the size of the ship, the initial data Dx, Dy, and Dx1 are processed as in Equation (3).
D x r e l = D x L D y r e l = D y L D x a b s = D x 1 L
When the lateral distance of the ship from the origin is 4–5 times the ship length, the vertical distance is 1.5–2.5 times the ship length, and the lateral distance from the target berth is 5–6 times the ship length, the ship starts to turn. Therefore, defining D x r e l ∈ (4, 5) as far, D y r e l ∈ (1.5, 2.5) as far, and D x a b s ∈ (5, 6) as far.
The ship heading (under the established coordinate system). By analyzing the ship berthing condition, α is defined between −15 and 100 degrees. In this paper, six linguistic values, which are opposite–small, very small, small, middle, large, and very large, are introduced for fuzzification. In the process of ship berthing, α changes from large to small under the operation of the pilot. At the beginning of the ship turning, α is a large angle around 80–90 degrees, and at the end of the berthing, α is a small angle close to zero degrees. Therefore, we define α ∈ (80, 90) as very large and α ∈ (−15, 20) as very small.
Ship speed. The ship speed is defined between 0 and 6 kn, which considers the speed of navigation in the approach channel [51,52]. In this paper, five linguistic values, which are very slow, slow, normal, fast, and very fast, are introduced for fuzzification. Traditionally, the rudder effect of a ship with a high speed is greater than a ship with a low speed. However, the high speed will make the control of the ship difficult and pose a threat to the berthing safety. According to the data of real pilotage in the berthing process, the ship speed is around 5–6 kn at the beginning of the turning and gradually decreases to less than 0.5 kn when the ship is in position for berthing. Therefore, we define V ∈ (5, 6) as very fast and V ∈ (0, 1) as very slow.
Ship displacement. The ship displacement is defined between 1 × 10⁵ and 3.5 × 10⁵ tons, and only two linguistic values, which are large and very large, are introduced for fuzzification. For the two linguistic values, we use the trapezoidal membership function for fuzzification. By analyzing the decisions of ships with different displacements in the berthing process, the results obtained by the pilot are not very different. Therefore, the category of ship size is considered using simplified method and will not be further discussed.
Leeway and drift angle. The leeway and drift angle is defined between −5 and 5 degrees and nine triangular linguistic values, which are opposite–very large, opposite–large, opposite–normal, opposite–small, very small, small, normal, large, and very large, are introduced for fuzzification. The influence of the wind and current determines the leeway and drift angle, which has a certain impact on ship handling [53].
The value of the linguistic variables of the input factors in this paper is shown in Table 1.
(2)
Intermediate factors for decision-making model
Turn correction. The turn correction is determined by ship displacement, ship length, and leeway and drift angle, which considers the turn from the perspective of the ship and environment factors. Turn correction is defined between −1 and 1, and nine triangular linguistic values, which are opposite–most, opposite–more, opposite–normal, opposite–little, no need, little, normal, more, and most, are introduced for fuzzification. Note that nine linguistic values represent different degrees of correction, expressed by most, more, normal, etc. The membership function of the linguistic value of turn correction is expressed as X, the number of linguistic variables is i, and the output is ∈ (a, b). This process can be expressed as follows:
X = X 1 X 2 X 3 X i = x 11 x 12 x 13 x 21 x 22 x 23 x 31 x 32 x 33 x i 1 x i 2 x i 3
where (xi1, xi2, xi3) is the value of linguistic variable Xi, and it is defined in Equation (5).
x i 2 = x i + 1 1 d = b a i 1 x i 3 x i 2 = x i 2 x i 1 = d x 11 = a d x i 3 = a d
Turn expected. The turn expected is determined by Dx, Dy, Dx1 and α , which considers the turn from the perspective of location factors. The turn expected is defined between −1 and 1, and seven linguistic values, which are opposite–most, opposite–normal, opposite–little, no need, little, normal, and most, are introduced for fuzzification. In practice, the helm order of the pilot is often a multiple of five. For example, if a large angle of turning is required, the helm order of hard a starboard or starboard twenty will be used, and if a small angle of turning is required to adjust the heading slightly, the helm order of starboard five or port five will be used. Therefore, in order to carry out a human-like decision-making process for ship berthing, the unique trapezoidal linguistic variable is determined and is introduced in Figure 5.
The difference between ship speed and expected speed. The speed difference is defined within the range of −5 to 5 kn, and five linguistic values, which are opposite–very different, opposite–similar, same, similar, and very different, are introduced for fuzzification. Trapezoidal membership functions are introduced for the linguistic values of opposite–very different, opposite–similar, similar, and very different, while triangular membership functions are introduced for the linguistic value of same.
Expected speed. The expected speed is determined by Dx, Dy, Dx1, and ship displacement, which considers the speed from the perspective of the location and environment factors. The expected speed is defined between 0 and 6 kn, and five triangular linguistic values, very slow, slow, normal, fast, and very fast, are used for fuzzification. The expected speed reflects whether the ship speed in different positions is reasonable. The value of the linguistic variables of the intermediate factors in this paper is shown in Table 2.
(3)
Output factors for decision-making model
Turn assessment. The turn assessment is determined by the turn expected and turn correction, which considers the helm orders from the perspective of the location and environment factors. The turn expected is defined between −30 and 30, and seven linguistic values, which are opposite–most, opposite–normal, opposite–little, no need, little, normal, and most, are introduced for fuzzification.
Speed assessment. The speed assessment is determined by the expected speed, speed difference, and ship speed, which considers the telegraph orders from the perspective of the location and environment factors. The speed assessment is defined between −4 and 4, and nine linguistic values, which are opposite–most, opposite–more, opposite–normal, opposite–little, no need, little, normal, more, and most, are introduced for fuzzification.
The value of the linguistic variables of the output factors in this paper is shown in Table 3.
(4)
Fuzzy membership functions of the linguistic terms established
The decision-making model for ship berthing is developed from the viewpoint of ship operators. Thus, employing fuzzy numbers is preferable for capturing human thought processes in decision making. Nevertheless, experts’ expertise and information are inherently uncertain or vague. Therefore, we utilize fuzzy numbers provided by domain experts and pilots while considering the relative importance weights of each expert to optimize our model. To obtain a reasonable outcome from the proposed model, three domain experts and one pilot are invited to provide judgments on the linguistic terms. Their backgrounds are detailed as follows:
Pilot 1: An experienced pilot working at Rizhao Port for over ten years;
Expert 2: An experienced captain with over ten years of sailing experience;
Expert 3: A professor specializing in maritime safety research for over 15 years, particularly focusing on autonomous berthing;
Expert 4: An officer responsible for port safety management at the China Maritime Safety Administration.
Linguistic terms can be represented as triangular fuzzy numbers based on the domain experts’ knowledge using the Delphi method. Assuming there are n experts, each expert (i = 1, …, n) is assigned a relative weight θ i , where i = 1 n θ i = 1 and θ i > 0 (i = 1, …, n). The linguistic term for a specific variable, according to the experts’ judgment, is represented as x i = ( a i , b i , c i ) ; thus, the triangular fuzzy number A = (a, b, c) corresponding to the fuzzy linguistic term for the variable can be defined using Equations (6)–(8). The process of deriving fuzzy numbers for the D x r e l parameter is presented in Table 4. Likewise, fuzzy numbers for other parameters can be derived.
a = i = 1 n θ i a i
b = i = 1 n θ i b i
c = i = 1 n θ i c i

2.4. Establish the Fuzzy Rule-Based Pilotage Data and Experts’ Knowledge

The fuzzy rule base is a crucial component of the fuzzy inference system. Following the fuzzification of the influencing factors, fuzzy logic boxes are constructed for turn and speed decisions. This paper introduces the multiple-input and single-output fuzzy logic box. If there are too many input variables, developing the fuzzy rule base becomes challenging. Hence, this paper considers fewer than four input variables. Specifically, four fuzzy logic boxes are established, representing ship position, environmental effects, ship speed, and speed change. The fuzzy rules are determined based the pilotage data and domain knowledge. First, the rules of ship handling can be summarized by analyzing the helm order and telegraph order of the pilot and the ship trajectory data during the berthing process. Second, as there are around 400 (i.e., two input variables with five linguistic terms and two input variables with four linguistic terms) rules for each fuzzy logic box, it is very hard to invite the experts to make judgments on all the fuzzy rules using the IF–THEN scheme. In this paper, three experts and one pilot are invited to give principles on determining the fuzzy rules. As shown in Figure 6, 13 typical positions are selected during the berthing process to establish the fuzzy rules of location factors, and the established fuzzy rules are shown in Table 5. Note that D x r e l < 0 , D y r e l > 0 and D x a b s < D x r e l will not occur in the actual berthing process and V − Ve cannot be opposite–very different when the ship speed is fast or very fast.
During the berthing process, the ship should keep a safe distance from the wharf, and the changes in α and V should be reasonable. Specifically, when the D y r e l is very close, the pilot should take a large angle to the port side. Moreover, the rudder angle should not be small at the beginning of ship turning, and α should be small even parallel to the front line of wharf at the end of the berthing process. When D x r e l is very close, D y r e l should greater than twice the length of the ship to keep a safe distance from the wharf. To establish the fuzzy rules of decision-making model, the principle of establishing the fuzzy rules is shown in Table 6. Taking the location factors as an example, if the value of D x r e l , D y r e l and D x a b s is unchanged and the value of the α is changed sharply at the same time, a large rudder angle will be required, and the turn expected will be high. Similarly, all the other fuzzy rules can be obtained.
Following the establishment of the fuzzy rules, the surface figures illustrating the fuzzy reasoning rules are depicted in Figure 7. Specifically, Figure 7a illustrates the fuzzy reasoning rules for the location, Figure 7b illustrates those for the environment and ship parameters, and Figure 7c illustrates the rules for the expected speed.

2.5. Defuzzify the Outputs

After the derivation of the output (expressed by linguistic terms), the final results should be defuzzified. The process for defuzzification is to convert the fuzzy output into the crisp value of helm orders and telegraph orders. Three widely used techniques for defuzzification include the center of gravity, mean of maximum, and height methods. First, the center of gravity method calculates the center of gravity or centroid of the fuzzy set’s membership function to determine the crisp output value. Second, the mean of maximum method identifies the maximum membership value within the fuzzy set and computes the mean of the input values corresponding to this maximum membership. Third, the height method selects the input value at which the membership function reaches its peak height. As the center of gravity method considers the total output distribution, this paper adopts it to obtain comprehensive results for helm and telegraph orders.

3. Application of the Proposed Model for Ultra-Large Ship Berthing

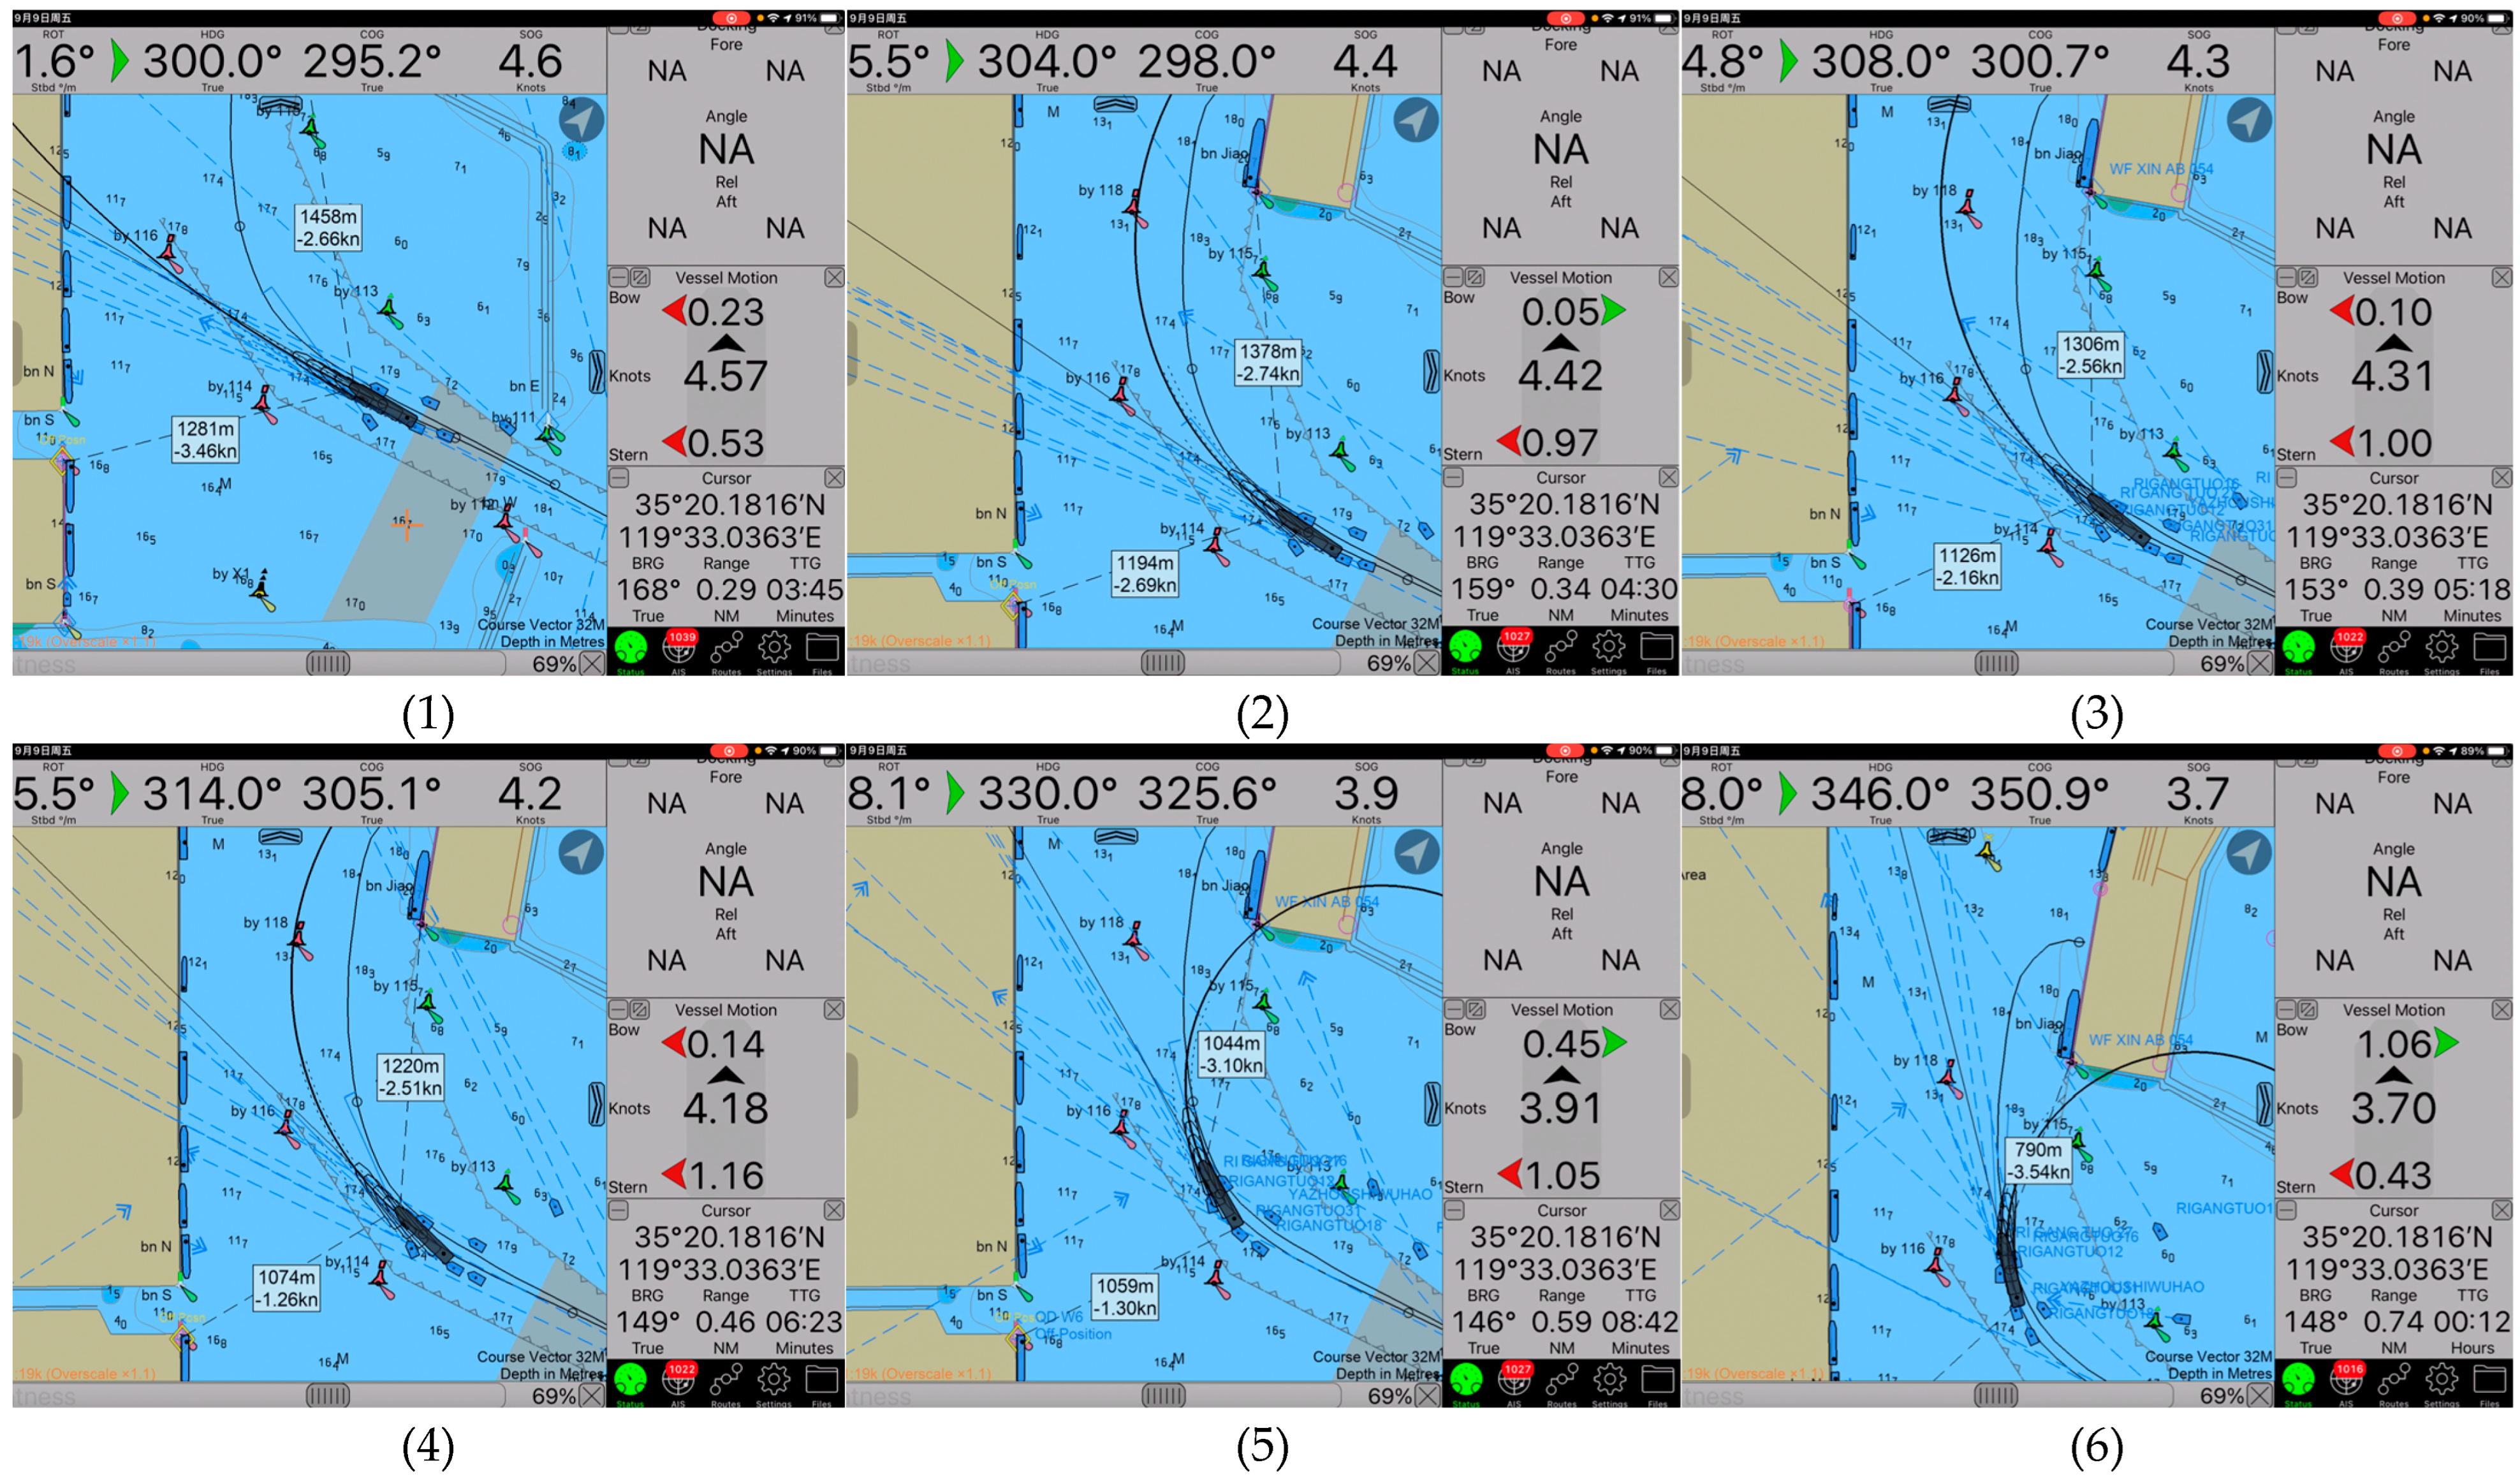
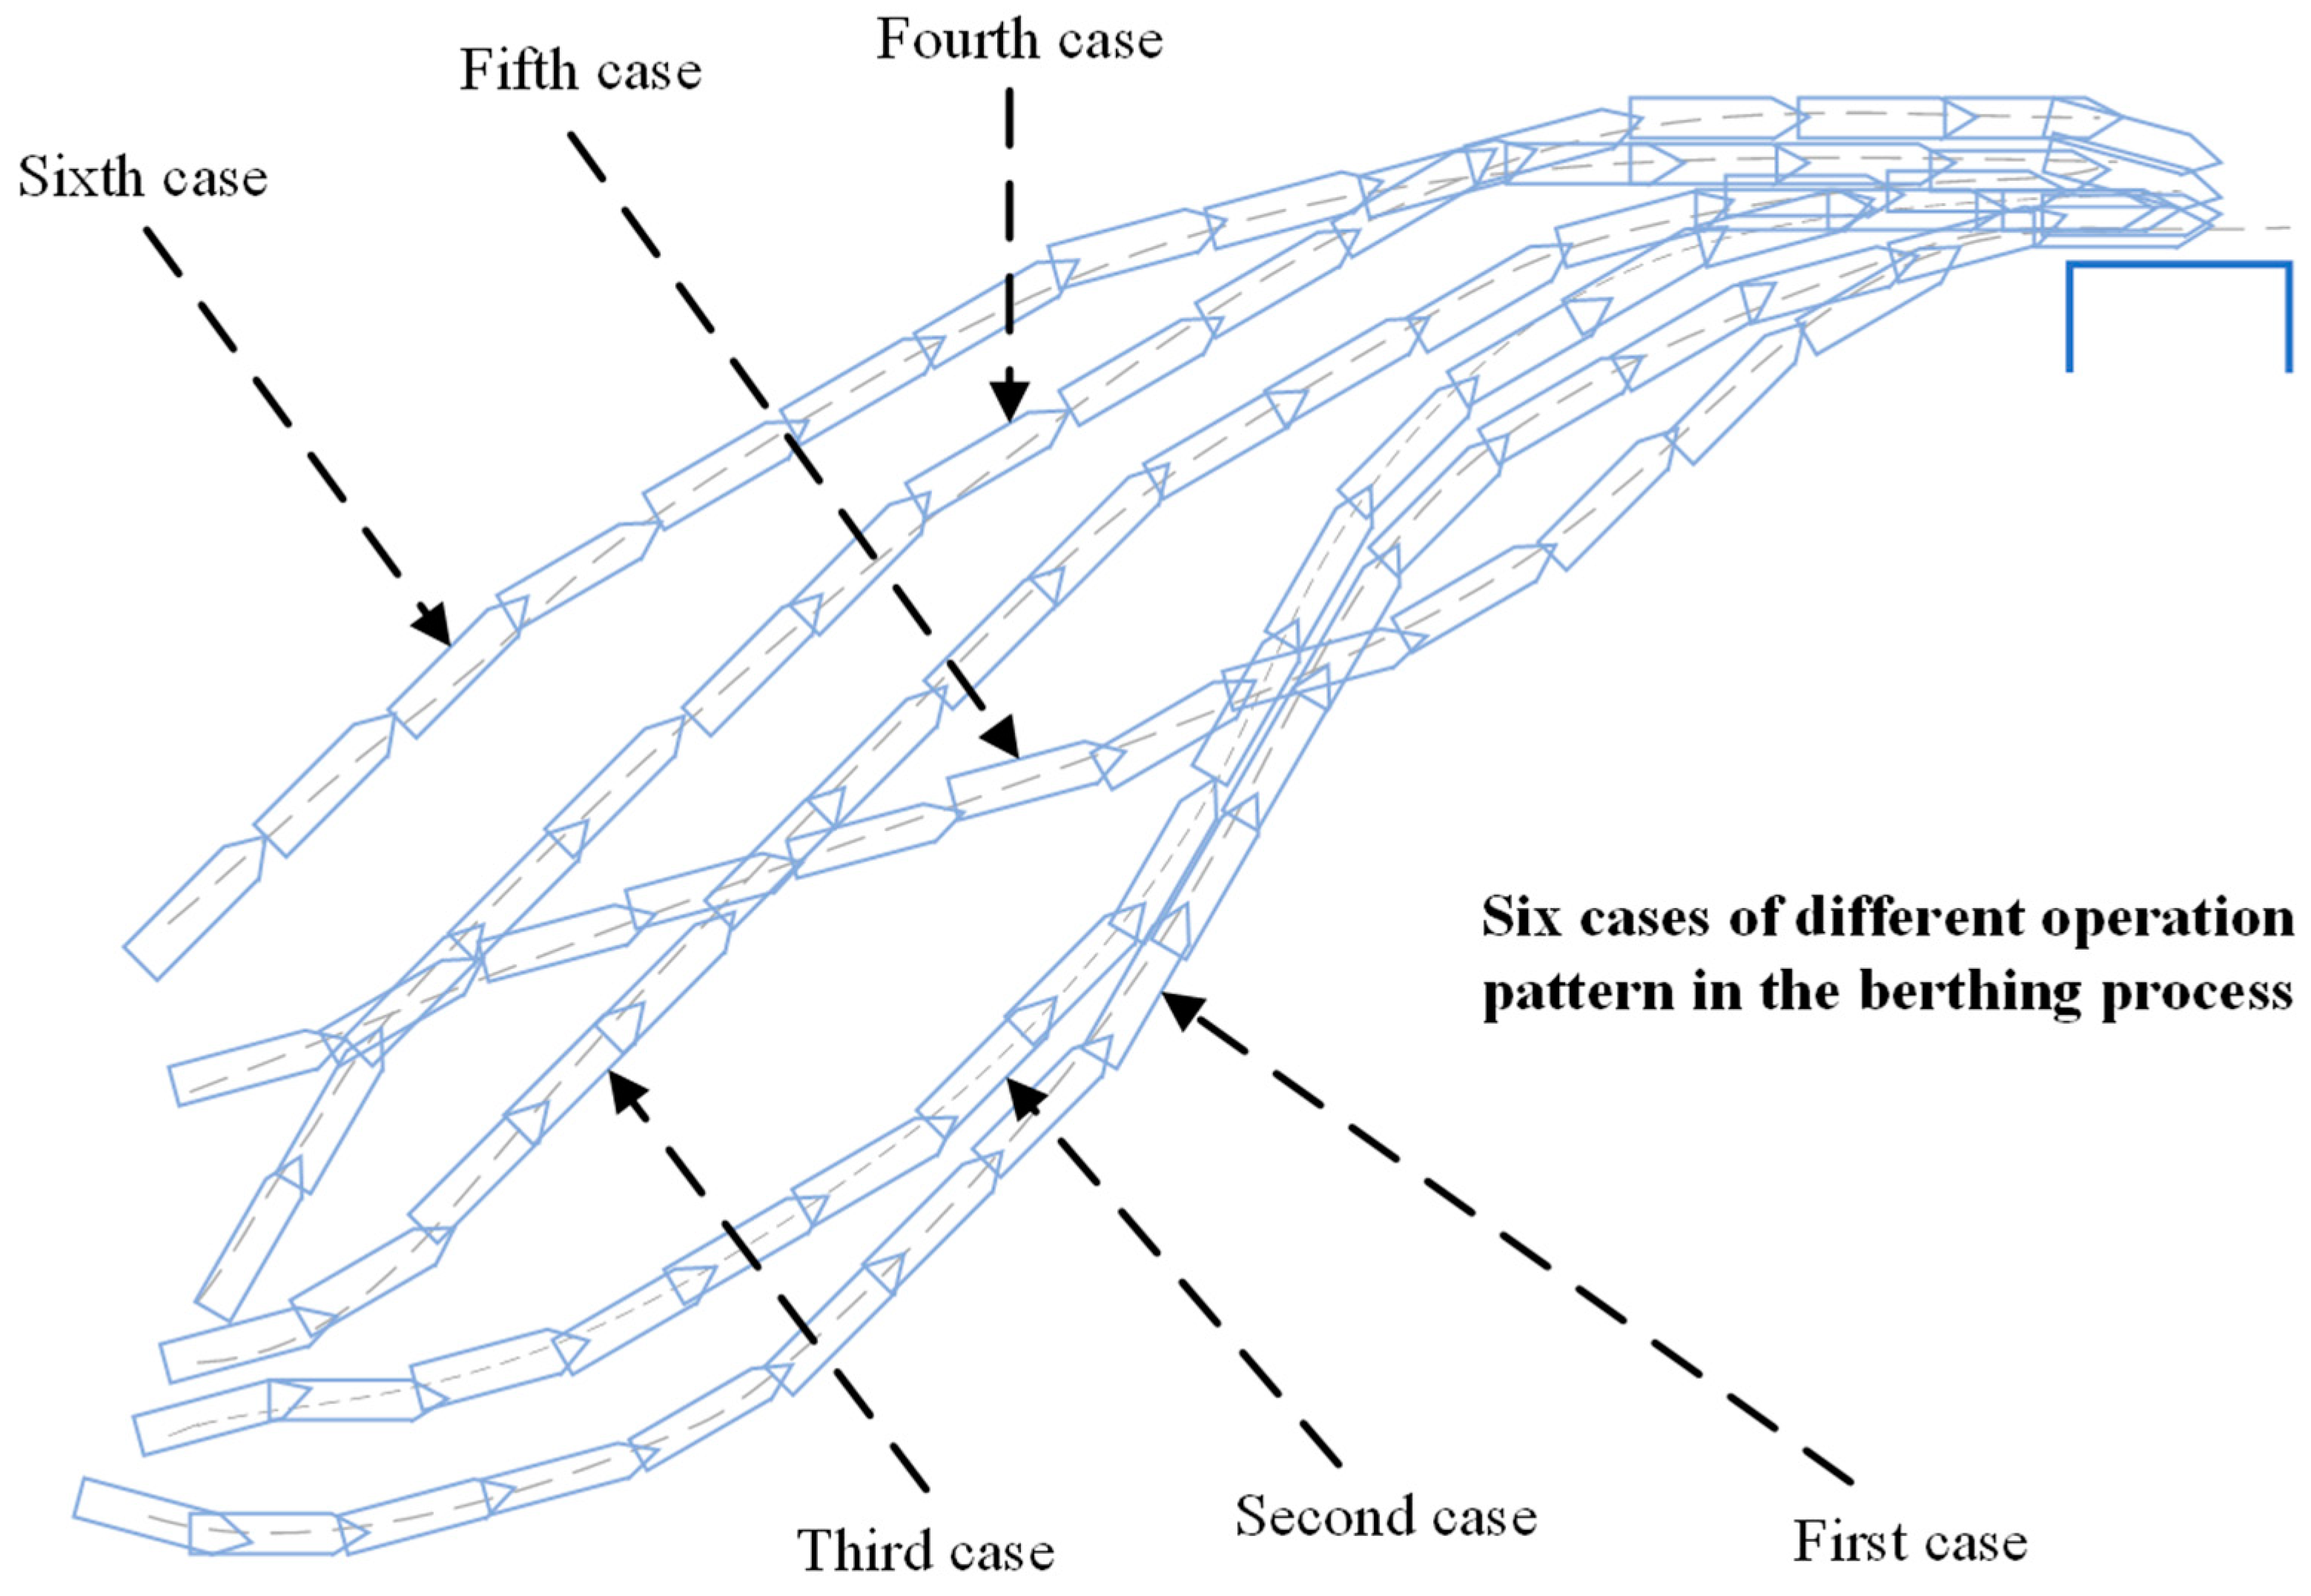
3.1. Derive the Pilotage Data in Real Ship Berthing Process

Towards the end of 2021, the Rizhao Port had 28 production berths and 11 berths above 10 thousand tons, and the cargo handling capacity achieved 41.32 million tons. The ship used for verification was the Panamanian ship named MV BAO FU, with a length of 329.95 m, a breadth of 57 m, and a displacement of 277,400 tons.
The nine waypoints were selected with the interval 1–3 min between adjacent waypoints during the berthing process, where the helm order or telegraph order of the pilot to control the ship were collected. The ship speed decreased from 5.3 kn to 0.2 kn when the ship approached the target berth, which is shown in Figure 8. The ship finally berthed safely, and the detailed information for this process is shown in Table 7.

3.2. Derive the Decision-Making Results

The collected data from the ship berthing process allows us to determine both the distance between the ship bow and the origin and the angle between the front line and bearing line of the wharf. The value of Dx can be calculated using the formula D x = d i s t a n c e × cos ( a n g l e ) , while D x r e l can be calculated using Equation (3). Similarly, the location factors include D y r e l , D x a b s , and the environment, and ship factors include the ship heading, leeway and drift angle, and ship speed, which can be obtained are given in Table 7.
After establishing the membership function of the location, environment and ship factors, the linguistic values for the fuzzy sets of each fuzzy logic box in this scenario can be determined. Since the ship displacement remains constant throughout the berthing process, the linguistic values remain unchanged. This can be described as follows. For a ship with a displacement of 277,400 tons, it can be fuzzified as (large, 0.68; small, 0.32). Unlike the ship factors, the location and environment factors undergo changes throughout the berthing process. Consequently, the membership of this fuzzy set adjusts accordingly, and the resulting fuzzy sets are presented in Table 8. Note that a few input factors are used twice in different fuzzy logic boxes ( D x r e l , D y r e l , D x a b s ), and the same type of factor may have different linguistic values in different fuzzy logic boxes. Further, the intermediate variables include turn expected, turn correction, and expected speed, which are the outputs of four fuzzy logic boxes. The output variables of the intermediate variables are also fuzzified by using the standard triangular or trapezoidal membership function, and the linguistic values are given in Table 2. After defuzzifying the intermediate factors, the final crisp value of helm orders and the engine telegraph can be obtained. Figure 9 illustrates the process of determining turning and speed decisions, using the first waypoint as an example. All outputs of the decision-making model are presented in Table 9, where Treal denotes the actual rudder angle controlled by the pilot.

3.3. The Error Analysis-Based Decision-Making Results

In the berthing process, the ship turning is influenced by human factors [54]. The difference in the start time of turning makes the helm orders different. As shown in Figure 6, if the initial ship position is #1 and the rudder angle is large, the berthing trajectory can be #1 #4 #7 #11, and the pilot should ease the helm in time and adjust the heading in the berthing process; on the contrary, if the rudder angle is small at the beginning, the berthing trajectory can be #1 #4 #10 #12, and a large rudder angle is required to make the ship berth safely.
The error is analyzed from the partial and overall perspective, which not only compares the difference between the decision-making results and pilotage data of each waypoint but also analyses the overall error. The error of each waypoint is used as a reference for the time to adjust the heading and speed, and the overall error is used as an important indicator for assessing the decision-making results. The specific method can be implemented as follows:
ε i t = T r e a l i T a s s i
As shown in Equation (9), T r e a l i and T a s s i are the pilotage data and the outputs obtained by the decision-making model of each point for ship turning, respectively. The ε i t is the error value of each point, and the ε t ¯ is the average value of ε i t . The overall error should reflect the turning cumulant in the whole process, which can be converted into the accumulated turning angle of the berthing process. The overall error cannot be an instantaneous value but is an integration of the difference in Treal and Tass to the time. The ε t ¯ and the overall error ε a l l t can be calculated by Equations (10) and (11).
ε t ¯ = ε i t i
ε a l l t = ( T r e a l i T a s s i ) × ( t i m e i + 1 t i m e i ) T r e a l i × ( t i m e i + 1 t i m e i )
For the speed decision part, the expected speed can be deduced under the influence of the location and other environment factors at the same position. Even the trajectory of the ship during the berthing process is different. The ship should berth with a low speed when close to the shore. Therefore, to simplify the process of error analysis, the influence of the operations by different pilots on speed is not considered, and the specific steps are as follows:
ε i s = V i V i e ε s ¯ = ε i s i ε a l l s = V i V i e V i
The comparison between the output obtained by the model and the pilotage data is shown in Figure 10. It can be seen from the figure that the maximum error of the speed decision is lower than 0.85 kn, and the average error value is 0.368 kn, which is relatively small compared to the ship speed of sailing in the approach channel. However, in the turn decision-making part, the outputs of the decision-making model of some waypoints are different from the pilotage data. This is because the error of individual waypoints is greatly influenced by human factors. Note the helm order of 4–6 waypoints, which are hard a starboard, midship, and port ten. The operation of hard a starboard at the fourth waypoint makes the rudder angle change sharply, which exceeds the expected rudder angle. Then, in order to ease the helm, the sixth waypoint carries out the operation of port ten. To make the ship turning obvious and easy to be observed by the pilot, turning a large angle at the beginning of berthing and operating an opposite rudder angle during the berthing process are often carried out. However, this operation of the pilot can be improved by conducting further analysis. This is because the ship turning should be gradual and smooth, and the skipping rudder angle will reduce the maneuverability of the ship and make the ship control difficult. Traditionally, the rudder angle obtained by the model gradually changes from large to small in the berthing process, which indicates the decision-making model complies with the ship handling rules than human operation. Comparing the two results, the operations of the rudder angle is slightly different, but the accumulated turning angle is similar to the value obtained via Equation (11). This verifies that the same result can be obtained by different turning operations. Therefore, the overall error analysis method is used to assess the turn decision-making model. The different types of error values are shown in Table 10.
As shown in Table 10, the average value of the individual error of the turn decision is 5.61, and the overall error is 2.28%, which indicates the turn error of a single turn is less than 6 degrees, and the accumulated turning angle error during the berthing process is less than 3 degrees. The average individual error of the speed decision is 0.368 kn, and the overall error is 9.61%. The overall error of the decision-making model is less than 10%, which indicates that the ship berthing operation based on the decision-making model is suitable for the actual ship berthing process.

3.4. The Influence of Turn and Speed Error

As the pilots may have different preferences in ship handling, the decisions of different pilots will be different even in the same conditions. Moreover, if the berthing conditions (e.g., location and environment) are different, the decisions will also be different. According to the pilotage data of berthing, the diagrammatic sketch of six typical scenarios for berthing is shown in Figure 11. However, the ship can berth safely in these different berthing process. Therefore, this section will further analyse the turn and speed error between the proposed model and pilotage data.
The overall turn error, which has a greater effect on the berthing safety than individual error, is much more significant in the berthing process of MV BAO FU ships. It can be seen from Figure 11 that the fifth berthing trajectory has overlaps with the first, second, third, and fourth berthing trajectory. Even if the ship location is the same, the turn decision of each berthing case is different. However, the ships finally berth safely with different decisions, which indicates the berthing process is dynamic, and the pilot will reasonably adjust the ship position, speed, and heading according to the navigational environment. Further analysis shows that the accumulated turning angle of different operation patterns is very similar during the berthing process, which is a significant parameter that influences the berthing process and determines the berthing safety. As shown in Figure 12, the orange rectangular area represents the turning angle in each period, and the summation of the orange rectangular area represents the accumulated turning angle during the berthing process.
For speed errors, the high speed poses a threat to the berthing safety, and the low speed influences the rudder effect to a certain extent. Traditionally, the difference between the expected speed and ship speed should be small. If the difference between the expected speed and ship speed is in a reasonable and small range, it will have little impact on the berthing safety. In Table 9, Sass reflects the demand for speed change and is close to zero in eight waypoints, and only two waypoints need a slight speed change (i.e., −1).

4. Conclusions

With the development of modern science and technology, the improvement of autonomous navigation has been technically feasible. Nevertheless, the autonomy of ultra-large ships in confined waters remains limited. Furthermore, while the ship motion model based on hydrodynamic parameters has been widely utilized in existing research, it often lacks actual operational data. The primary contribution of this paper is to propose a human-like decision-making model for autonomous berthing. This model can be utilized in subsequent studies on human-like autonomous berthing algorithms, achieved through the identification of influencing factors via berthing scenario analysis and the utilization of fuzzy numbers provided by domain experts and pilots.
This paper establishes a fuzzy inference system comprising a three-layer framework, consisting of the input layer, fuzzy inference layer, and output layer. The decision-making model is divided into two parts: decision-making for turning and decision-making for speed. Moreover, the ship berthing condition is analyzed by considering factors such as the distance from the shore, ship displacement, and the leeway and drift angle. Following the analysis of the ship berthing condition, location and environmental parameters are obtained for fuzzification. Fuzzy number functions are then utilized to incorporate expert knowledge and pilotage data into the optimization process of the decision-making model, which realizes the establishment of the decision-making model based on human thoughts.
Furthermore, pilotage data are used for the first time to validate the proposed model and calculate speed and turning errors. Optimizing the decision-making model based on pilotage data enhances its relevance to real-world shipping scenarios and bridges the gap between behaviors predicted by ship motion models and actual ship behaviors. From the results of error analysis, the average individual error for turning decisions is 5.61 degrees, with an overall error of 2.28%. The average individual error for speed decisions is 0.368 kn, with an overall error of 9.61%. Both the overall and individual errors of the decision-making model fall within a reasonable and small range, indicating its high accuracy.
Overall, this research proposes a decision-making model for ultra-large ship berthing based on fuzzy logic and human thoughts. The proposed model is further optimized based on pilotage data collected during real ship berthing processes and expert knowledge. This optimization aims to enhance the rationality, accuracy, and generalizability of the model, thereby improving the quality and human aspect of turning and speed decisions. The results of this research offer theoretical and practical insights into the development of a human-like decision-making method for autonomous navigation in port waters and maritime safety management in the shipping industry. The model can be further applied to develop a more widely applicable decision-making system for autonomous navigation in confined waters. In further research, we will collect additional pilotage data to further explore optimization methods for the decision-making model. Additionally, it is essential to integrate the characteristics and advantages of pilot data with those of ship motion models to develop revolutionary products surpassing the current state of the art.

Author Contributions

Methodology, Y.L.; Investigation, T.-L.Y. and G.-T.Y.; Data curation, G.S. All authors have read and agreed to the published version of the manuscript.

Funding

The research presented in this paper was sponsored by a grant from the National Natural Science Foundation of China (Grant No. 52071248 and 51809206), Hubei Natural Science Foundation (Grant No. 2021CFB312), and Fundamental Research Funds for the Central Universities (WUT:2021-JL-002).

Institutional Review Board Statement

Not applicable.

Informed Consent Statement

Not applicable.

Data Availability Statement

Data is contained within the article.

Conflicts of Interest

The authors declare no conflicts of interest.

References

  1. Helgesen, O.K.; Thyri, E.H.; Brekke, E.F.; Stahl, A.; Breivik, M. Experimental validation of camera-based maritime collision avoidance for autonomous urban passenger ferries. Model. Identif. Control 2023, 44, 55–68. [Google Scholar] [CrossRef]
  2. O’Born, R.; Brattebo, H.; Iversen OM, K.; Miliutenko, S.; Potting, J. Quantifying energy demand and greenhouse gas emissions of road infrastructure projects: An LCA case study of the Oslo fjord crossing in Norway. Eur. J. Transp. Infrastruct. Res. 2016, 16, 445–466. [Google Scholar] [CrossRef]
  3. Scholler FE, T.; Nalpantidis, L.; Blanke, M. Buoy Light Pattern Classification for Autonomous Ship Navigation Using Recurrent Neural Networks. IEEE Trans. Intell. Transp. Syst. 2022, 23, 9455–9465. [Google Scholar] [CrossRef]
  4. Nomura, Y.; Yamamoto, S.; Hashimoto, T. Study of 3D measurement of ships using dense stereo vision: Towards application in automatic berthing systems. J. Mar. Sci. Technol. 2021, 26, 573–581. [Google Scholar] [CrossRef]
  5. Yue, T.; Zhang, Y.; Liu, P.; Xu, Y.; Yu, C. A Generating-Anchor Network for Small Ship Detection in SAR Images. IEEE J. Sel. Top. Appl. Earth Obs. Remote Sens. 2022, 15, 7665–7676. [Google Scholar] [CrossRef]
  6. Gao, X.; Makino, H. Analysis of anchoring ships around coastal industrial complex in a natural disaster. J. Loss Prev. Process Ind. 2017, 50, 355–363. [Google Scholar] [CrossRef]
  7. Villa-Caro, R.; Carral, J.C.; Fraguela, J.A.; Lopez, M.; Carral, L. A review of ship mooring systems. Brodogradnja 2018, 69, 123–149. [Google Scholar] [CrossRef]
  8. Lyu, H.; Yin, Y. COLREGS-Constrained Real-time Path Planning for Autonomous Ships Using Modified Artificial Potential Fields. J. Navig. 2019, 72, 588–608. [Google Scholar] [CrossRef]
  9. Ozturk, U.; Akdag, M.; Ayabakan, T. A review of path planning algorithms in maritime autonomous surface ships: Navigation safety perspective. Ocean Eng. 2022, 251, 111010. [Google Scholar] [CrossRef]
  10. Liu, J.; Zhang, J.; Yan, X.; Soares, C.G. Multi-ship collision avoidance decision-making and coordination mechanism in Mixed Navigation Scenarios. Ocean Eng. 2022, 257, 111666. [Google Scholar] [CrossRef]
  11. Wang, S.; Zhang, Y.; Li, L. A collision avoidance decision-making system for autonomous ship based on modified velocity obstacle method. Ocean Eng. 2020, 215, 107910. [Google Scholar]
  12. Hahn, T.; Damerius, R.; Rethfeldt, C.; Schubert, A.U.; Kurowski, M.; Jeinsch, T. Automated maneuvering using model-based control as key to autonomous shipping. At-Automatisierungstechnik 2022, 70, 456–468. [Google Scholar] [CrossRef]
  13. Baek, S.; Woo, J. Model Reference Adaptive Control-Based Autonomous Berthing of an Unmanned Surface Vehicle under Environmental Disturbance. Machines 2022, 10, 244. [Google Scholar] [CrossRef]
  14. Han, S.; Wang, Y.; Wang, L.; He, H. Automatic berthing for an underactuated unmanned surface vehicle: A real-time motion planning approach. Ocean Eng. 2021, 235, 109352. [Google Scholar] [CrossRef]
  15. Van Suong, N. Investigation on a Novl Support System for Automatic Ship Berthing in Marine Practice. J. Mar. Sci. Eng. 2019, 7, 114. [Google Scholar]
  16. Han, S.; Wang, L.; Wang, Y. A potential field-based trajectory planning and tracking approach for automatic berthing and COLREGs-compliant collision avoidance. Ocean Eng. 2022, 266, 112877. [Google Scholar] [CrossRef]
  17. Miyauchi, Y.; Sawada, R.; Akimoto, Y.; Umeda, N.; Maki, A. Optimization on planning of trajectory and control of autonomous berthing and unberthing for the realistic port geometry. Ocean Eng. 2022, 245, 110390. [Google Scholar] [CrossRef]
  18. Im, N.-K.; Van-Suong, N. Artificial neural network controller for automatic ship berthing using head-up coordinate system. Int. J. Nav. Archit. Ocean Eng. 2018, 10, 235–249. [Google Scholar] [CrossRef]
  19. Nguyen, V.-S.; Do, V.-C.; Im, N.-K. Development of Automatic Ship Berthing System Using Artificial Neural Network and Distance Measurement System. Int. J. Fuzzy Log. Intell. Syst. 2018, 18, 41–49. [Google Scholar] [CrossRef]
  20. Zhang, Q.; Zhu, G.; Hu, X.; Yang, R. Adaptive neural network auto-berthing control of marine ships. Ocean Eng. 2019, 177, 40–48. [Google Scholar] [CrossRef]
  21. Maki, A.; Akimoto, Y.; Umeda, N. Application of optimal control theory based on the evolution strategy (CMA-ES) to automatic berthing (part: 2). J. Mar. Sci. Technol. 2021, 26, 835–845. [Google Scholar] [CrossRef]
  22. Miyauchi, Y.; Maki, A.; Umeda, N.; Rachman, D.M.; Akimoto, Y. System parameter exploration of ship maneuvering model for automatic docking/berthing using CMA-ES. J. Mar. Sci. Technol. 2022, 27, 1065–1083. [Google Scholar] [CrossRef]
  23. Shimizu, S.; Nishihara, K.; Miyauchi, Y.; Wakita, K.; Suyama, R.; Maki, A.; Shirakawa, S. Automatic berthing using supervised learning and reinforcement learning. Ocean Eng. 2022, 265, 112553. [Google Scholar] [CrossRef]
  24. Wang, S.; Sun, Z.; Yuan, Q.; Sun, Z.; Wu, Z.; Hsieh, T.-H. Autonomous piloting and berthing based on Long Short Time Memory neural networks and nonlinear model predictive control algorithm. Ocean Eng. 2022, 264, 112269. [Google Scholar] [CrossRef]
  25. Nguyen, V.-S.; Im, N. Automatic Ship Berthing Based on Fuzzy Logic. Int. J. Fuzzy Log. Intell. Syst. 2019, 19, 163–171. [Google Scholar] [CrossRef]
  26. Meng, Y.; Zhang, X.; Zhu, J. Parameter identification of ship motion mathematical model based on full-scale trial data. Int. J. Nav. Archit. Ocean Eng. 2022, 14, 100437. [Google Scholar] [CrossRef]
  27. Zhang, L.; Feng, X.; Wang, L.; Gong, B.; Ai, J. A hybrid ship-motion prediction model based on CNN–MRNN and IADPSO. Ocean Eng. 2024, 299, 117428. [Google Scholar] [CrossRef]
  28. Wei, Y.; Chen, Z.; Zhao, C.; Chen, X.; He, J.; Zhang, C. A three-stage multi-objective heterogeneous integrated model with decomposition-reconstruction mechanism and adaptive segmentation error correction method for ship motion multi-step prediction. Adv. Eng. Inform. 2023, 56, 101954. [Google Scholar] [CrossRef]
  29. Li, Y.; Peng, Y.; Zheng, J. Intelligent ship collision avoidance model integrating human thinking experience. Ocean Eng. 2023, 286, 115510. [Google Scholar] [CrossRef]
  30. Ishikawa, A.; Amagasa, M.; Shiga, T.; Tomizawa, G.; Tatsuta, R.; Mieno, H. The max-min Delphi method and fuzzy Delphi method via fuzzy integration. Fuzzy Sets Syst. 1993, 55, 241–253. [Google Scholar] [CrossRef]
  31. Xue, J.; Van Gelder PH AJ, M.; Reniers, G.; Papadimitriou, E.; Wu, C. Multi-attribute decision-making method for prioritizing maritime traffic safety influencing factors of autonomous ships’ maneuvering decisions using grey and fuzzy theories. Saf. Sci. 2019, 120, 323–340. [Google Scholar] [CrossRef]
  32. Zhang, K.; Huang, L.; He, Y.; Wang, B.; Chen, J.; Tian, Y.; Zhao, X. A real-time multi-ship collision avoidance decision-making system for autonomous ships considering ship motion uncertainty. Ocean Eng. 2023, 278, 114205. [Google Scholar] [CrossRef]
  33. Zadeh, L.A. Fuzzy sets. Inf. Control 1965, 8, 338–353. [Google Scholar] [CrossRef]
  34. Kauffman, A. Introduction a la Theorie des Sous-Emsembles Flous; Masson et Cie Editeurs: Paris, France, 1973. [Google Scholar]
  35. Gil-Aluja, J. Uncertainty in Business Management. In Fuzzy Sets in the Management of Uncertainty; Studies in Fuzziness and Soft Computing; Springer: Berlin/Heidelberg, Germany, 2004; Volume 145, pp. 11–49. [Google Scholar]
  36. Gil-Lafuente, A.M. Financial Analysis by Means of Ratios. In Fuzzy Logic in Financial Analysis; Studies in Fuzziness and Soft Computing; Springer: Berlin/Heidelberg, Germany, 2005; Volume 175, pp. 95–116. [Google Scholar]
  37. Khan, R.U.; Yin, J.; Mustafa, F.S.; Anning, N. Risk assessment for berthing of hazardous cargo vessels using Bayesian networks. Ocean Coast. Manag. 2021, 210, 105673. [Google Scholar] [CrossRef]
  38. Kuzu, A.C.; Akyuz, E.; Arslan, O. Application of Fuzzy Fault Tree Analysis (FFTA) to maritime industry: A risk analysing of ship mooring operation. Ocean Eng. 2019, 179, 128–134. [Google Scholar] [CrossRef]
  39. Sokukcu, M.; Sakar, C. Risk analysis of collision accidents during underway STS berthing maneuver through integrating fault tree analysis (FTA) into Bayesian network (BN). Appl. Ocean Res. 2022, 126, 103290. [Google Scholar] [CrossRef]
  40. Wu, B.; Yip, T.L.; Yan, X.P.; Soares, C.G. Fuzzy logic based approach for ship-bridge collision alert system. Ocean Eng. 2019, 187, 106152. [Google Scholar] [CrossRef]
  41. Zhao, C.; Yip, T.L.; Wu, B.; Lyu, J. Use of fuzzy fault tree analysis and Bayesian network for occurrence likelihood estimation of navigational accidents in the Qinzhou Port. Ocean Eng. 2022, 263, 112381. [Google Scholar] [CrossRef]
  42. Wu, B.; Cheng, T.; Yip, T.L.; Wang, Y. Fuzzy logic based dynamic decision-making system for intelligent navigation strategy within inland traffic separation schemes. Ocean Eng. 2020, 197, 106909. [Google Scholar] [CrossRef]
  43. Wu, B.; Yip, T.L.; Xie, L.; Wang, Y. A fuzzy-MADM based approach for site selection of offshore wind farm in busy waterways in China. Ocean Eng. 2018, 168, 121–132. [Google Scholar] [CrossRef]
  44. Xue, J.; Chen, Z.J.; Papadimitriou, E.; Wu, C.Z.; Van Gelder, P. Influence of environmental factors on human-like decision-making for intelligent ship. Ocean Eng. 2019, 186, 106060. [Google Scholar] [CrossRef]
  45. Kawai, H.; Sakamoto, J.; Kim, Y.-B.; Choi, Y. Distance Measurement System Based on Image Sensors for Automatic Berthing of Ships. In Proceedings of the International Conference on Control, Automation and Systems (ICCAS 2010), Gyeonggi, Republic of Korea, 27–30 October 2010; pp. 201–204. [Google Scholar]
  46. Liu, C.; Mao, Q.; Chu, X.; Xie, S. An Improved A-Star Algorithm Considering Water Current, Traffic Separation and Berthing for Vessel Path Planning. Appl. Sci. 2019, 9, 1057. [Google Scholar] [CrossRef]
  47. Maki, A.; Maruyama, Y.; Dostal, L.; Sakai, M.; Sawada, R.; Sasa, K.; Umeda, N. Practical method for evaluating wind influence on autonomous ship operations. J. Mar. Sci. Technol. 2022, 27, 1302–1313. [Google Scholar] [CrossRef]
  48. Piao, Z.; Guo, C.; Sun, S. Research into the Automatic Berthing of Underactuated Unmanned Ships under Wind Loads Based on Experiment and Numerical Analysis. J. Mar. Sci. Eng. 2019, 7, 300. [Google Scholar] [CrossRef]
  49. Chen, C.; Li, Y. Ship Berthing Information Extraction System Using Three-Dimensional Light Detection and Ranging Data. J. Mar. Sci. Eng. 2021, 9, 747. [Google Scholar] [CrossRef]
  50. Xiong, Y.; Yu, J.; Tu, Y.; Pan, L.; Zhu, Q.; Mou, J. Research on data driven adaptive berthing method and technology. Ocean Eng. 2021, 222, 108620. [Google Scholar] [CrossRef]
  51. Lee, H.-T.; Lee, J.-S.; Son, W.-J.; Cho, I.-S. Development of Machine Learning Strategy for Predicting the Risk Range of Ship’s Berthing Velocity. J. Mar. Sci. Eng. 2020, 8, 376. [Google Scholar] [CrossRef]
  52. Roubos, A.; Groenewegen, L.; Peters, D.J. Berthing velocity of large seagoing vessels in the port of Rotterdam. Mar. Struct. 2017, 51, 202–219. [Google Scholar] [CrossRef]
  53. Zhou, Y.; Daamen, W.; Vellinga, T.; Hoogendoorn, S.P. Impacts of wind and current on ship behavior in ports and waterways: A quantitative analysis based on AIS data. Ocean Eng. 2020, 213, 107774. [Google Scholar] [CrossRef]
  54. Hou, L.-X.; Liu, R.; Liu, H.-C.; Jiang, S. Two decades on human reliability analysis: A bibliometric analysis and literature review. Ann. Nucl. Energy 2021, 151, 107969. [Google Scholar] [CrossRef]
Figure 1. Fuzzy inference system.
Jmse 12 00717 g001
Figure 2. The framework of decision-making model for ultra-large ship berthing.
Jmse 12 00717 g002
Figure 3. The analysis for ship berthing condition.
Jmse 12 00717 g003
Figure 4. Triangular and trapezoidal membership functions. (a) Triangular membership function. (b) Trapezoidal membership function.
Jmse 12 00717 g004
Figure 5. Trapezoidal linguistic variable with a large trapezoidal waist slope.
Jmse 12 00717 g005
Figure 6. Typical positions in the berthing process.
Jmse 12 00717 g006
Figure 7. Surface figure of fuzzy rules. (a) Location; (b) environment and ship; (c) expected speed.
Jmse 12 00717 g007
Figure 8. The waypoints selected in the berthing process.
Jmse 12 00717 g008aJmse 12 00717 g008b
Figure 9. The flowchart for determining turning and speed decision.
Jmse 12 00717 g009
Figure 10. The results of model comparing the pilotage data. (a) The comparison of turn decision; (b) the comparison of speed decision; (c) the 3D figure of the comparison between proposed model and reality.
Jmse 12 00717 g010
Figure 11. The case of different operation patterns in the berthing process.
Jmse 12 00717 g011
Figure 12. The accumulated turning angle comparing the proposed model and pilotage data. (a) Accumulated turning angle of proposed model. (b) Accumulated turning angle of pilotage data.
Jmse 12 00717 g012
Table 1. The value of linguistic variables of input factors.
InputsFuzzified Values
D x r e l o–far
(−6,−2,−1)
o–close
(−2,−1,0)
very close
(−1,0,2)
close
(0,2,4)
normal
(2,4,6)
\\\\
D y r e l o–far
(−3,−2,−1)
o–close
(−2,−1,0)
very close
(−1,0,1)
close
(0,1,1.78)
normal
(1,1.78,2.14)
far
(1.78,2.14,3)
\\\
D x a b s very close
(−1,0,2)
close
(0,2,4)
normal
(2,4,6)
far
(4,6,8)
\\\\\
α o–small
(−30,−15,0)
very small
(−15,0,20)
small
(0,20,45)
middle
(20,45,70)
large
(45,70,100)
very large
(70,100,110)
\\\
Vvery slow
(0,0,1)
slow
(0,1,3.2)
normal
(1,3.2,4.8)
fast
(3.2,4.8,6)
very fast
(4.8,6,7)
\\\\
Dp (× 105)large
(−1,0,1,3.5)
very large
(1,3.5,5,6)
\\\\\\\
γ o–very large
(−6,−5,−3.75)
o–large
(−5,−3.75,−2.5)
o–normal
(−3.75,−2.5,−1.25)
o–small
(−2.5,−1.25,0)
very small
(−1.25,0,1.25)
small
(0,1.25,2.5)
normal
(1.25,2.5,3.75)
large
(2.5,3.75,5)
very large
(3.75,5,6)
Table 2. The value of the linguistic variables of intermediate factors.
IntermediatesFuzzified Values
Tco–most
(−1.25,−1,−0.75)
o–more
(−1,−0.75,−0.5)
o–normal
(−0.75,
−0.5,−0.25)
o–little
(−0.5,−0.25,0)
no need
(−0.25,0,0.25)
little
(0,0.25,0.5)
normal
(0.25,0.5,0.75)
more
(0.5,0.75,1)
most
(0.75,1,1.25)
Teo–most
(−1.7,−1.02,
−0.98,−0.97)
o–normal
(−0.69,−0.68,
−0.64,−0.63)
o–little
(−0.36,−0.35,
−0.31,−0.3)
no need
(−0.03,−0.02, 0.02,0.03)
little
(0.3,0.31,
0.35, 0.36)
normal
(0.63,0.64,
0.68, 0.69)
most
(0.97,0.98,1,2)
\\
Vevery slow
(−2.496,0,1)
slow
(0,1,3.2)
normal
(1,3.2,4.8)
fast
(3.2,4.8,6)
very fast
(4.8,6,12)
\\\\
V − Veo–very different
(−5,−4,−3,−2)
o–similar
(−3,−2,−1,0)
same
(−1,0,1)
similar
(0,1,2,3)
very different
(2,3,4,5)
\\\\
Table 3. The value of the linguistic variables of output factors.
OutputsFuzzified Values
Tasso–most
(−51,−30.6,−29.4,−29.1)
o–normal
(−20.7,−20.4,−19.2,−18.9)
o–little
(−10.8,−10.5,
−9.3,−9.0)
no need
(−0.9,−0.6, 0.6,0.9)
little
(9.0,9.3,
10.5, 10.8)
normal
(18.9,19.2,
20.4, 20.7)
most
(29.1,29.4,
30.6,51)
\\
Sasso–most
(−4,−4,−4,−4)
o–more
(−3,−3,−3,−3)
o–normal
(−2,−2,−2,−2)
o–little
(−1,−1,−1,−1)
no need
(0,0,0,0)
little
(1,1,1,1)
normal
(2,2,2,2)
more
(3,3,3,3)
most
(4,4,4,4)
Table 4. Triangular fuzzy numbers of different linguistic terms.
Experts/PilotsWeights (θi)Triangular Fuzzy Numbers of Different Linguistic Terms
O–FarO–CloseVery CloseCloseFar
10.3(−7, −3, −1)(−3, −1, 0)(−1, 0, 3)(0, 2, 4)(1, 4, 5)
20.2(−5, −2, −1)(−2, 0, 1)(−2, −1, 2)(0, 1, 3)(2, 5, 7)
30.3(−6, −1, 0)(−2, −1, 0)(−1, 0, 2)(0, 1, 4)(2, 3, 4)
40.2(−6, −3, −1)(−2, −1, 1)(−2, −1, 2)(0, 2, 3)(2, 6, 7)
Total1(−6, −2, −1)(−2, −1, 0)(−1, 0, 2)(0, 2, 4)(2, 4, 6)
Table 5. Fuzzy rules of typical position factors.
#InputsOutputs
Rules D x r e l D y r e l D x a b s αTe
1normalnormalfarlargemost
2closenormalnormalvery largeo–small
3farclosefarlargemost
4normalclosefarlargemost
5closeclosenormalvery largenormal
6farvery closefarmiddlenormal
7normalvery closefarsmalllittle
8closevery closenormalsmalllittle
9o–closevery closeclosesmalllittle
10normalo–farfarsmallnormal
11very closeo–closeclosevery smallno need
12very closeo–farclosevery smallnormal
13very closeo–farcloseo–smallno need
Table 6. The principle of establishing fuzzy rule.
Variable inputs D x r e l
Fixed inputs D y r e l : very close D x a b s : farα: large
Valueo–faro–closevery closeclosefar\
Outputsnormalnormallittlenormalmost\
Variable inputs D y r e l
Fixed inputs D x r e l : normal D x a b s : farα: large
Valueo–faro–closevery closeclosenormalfar
Outputsmostmostmostmorenormallittle
Variable inputs D x a b s
Fixed inputs D x r e l : very close D y r e l : o–closeα: middle
Valuevery closeclosenormalfar\\
Outputsmostmorenormalnormal\\
Variable inputsα
Fixed inputs D x r e l : normal D y r e l : close D x a b s : far
Valueo–smallvery smallsmallnormallargevery large
Outputso–mosto–moreo–littlelittlemoremost
Table 7. Initial data of ship berthing.
NumberTimeDxDy D x 1 αγV
153′36″1273.8702.91973.484.8−4.84.57
254′33″1247.4580.81947.082.4−5.04.42
355′24″1211.1488.41910.780.2−5.04.31
456′26″1168.2336.61871.175.0−5.04.18
558′23″1036.2145.21735.856.04.53.91
61:00′50″792.00.01491.629.64.93.70
71:02′38″594.0−92.41293.622.05.03.59
81:04′19″409.2−148.51108.820.05.03.60
91:07′48″0.0−273.9699.622.03.33.70
101:12′23″−435.6−330.0264.010.45.02.29
Table 8. Fuzzy sets of ship berthing condition.
Number D x r e l D y r e l D x a b s αγVVeV − VeDp
1(normal, 0.93;
close, 0.07)
(far, 0.99;
normal, 0.01)
(far, 0.99;
normal, 0.01)
(large, 0.50;
very large,
0.50)
(o–very large, 0.84; o–large, 0.16)(fast, 0.86;
normal,
0.14)
(very fast,
0.44; fast,
0.56)
(o–similar,
0.76; same,
0.24)
(very large, 0.68;
large, 0.32)
2(normal, 0.89;
close, 0.11)
(normal, 0.98;
close, 0.02)
(far, 0.95;
normal, 0.05)
(large, 0.41;
very large,
0.59)
(o–very large, 1.00)(fast, 0.76;
normal,
0.24)
(fast, 0.75;
normal,
0.25)
(similar,
0.02; same,
0.98)
3(normal, 0.83;
close, 0.17)
(normal, 0.38;
close, 0.62)
(far, 0.90;
normal, 0.10)
(large, 0.34;
very large,
0.66)
(o–very large, 1.00)(fast, 0.69;
normal,
0.31)
(fast, 0.63;
normal,
0.37)
(similar,
0.09; same,
0.91)
4(normal, 0.77;
close, 0.23)
(normal, 0.02;
close, 0.98)
(far, 0.83;
normal, 0.17)
(large, 0.16;
very large,
0.84)
(o–very large, 1.00)(fast, 0.61;
normal,
0.39)
(fast, 0.50;
normal,
0.50)
(similar,
0.18; same,
0.82)
5(normal, 0.51;
close, 0.49)
(close, 0.44;
very close,
0.56)
(far, 0.63;
normal, 0.37)
(middle, 0.56;
large, 0.44)
(very large,
0.6;
large, 0.4)
(fast, 0.45;
normal,
0.55)
(fast, 0.31;
normal,
0.69)
(similar,
0.21; same,
0.79)
6(normal, 0.20;
close, 0.80)
(very close,
1.00)
(far, 0.26;
normal, 0.74)
(small, 0.62;
middle, 0.38)
(very large,
0.92;
large, 0.08)
(fast, 0.31;
normal,
0.69)
(fast, 0.12;
normal,
0.88)
(similar,
0.30; same,
0.70)
7(close, 0.90;
very close,
0.1)
(very close,
0.72; o–close,
0.28)
(normal, 0.96;
close, 0.04)
(small, 0.99;
middle, 0.01)
(very large,
1.00)
(fast, 0.24;
normal,
0.76)
(fast, 0.04;
normal,
0.96)
(similar,
0.32; same,
0.68)
8(close, 0.62;
very close,
0.38)
(very close,
0.55; o–close,
0.45)
(normal, 0.68;
close, 0.32)
(small, 1.0)(very large,
1.00)
(fast, 0.24;
normal,
0.76)
(normal,
0.87; slow,
0.13)
(similar,
0.68; same,
0.32)
9(very close,
1.00)
(very close,
0.17; o–close,
0.83)
(normal, 0.06;
close, 0.94)
(small, 0.99;
middle, 0.01)
(large, 0.64;
normal,
0.36)
(fast, 0.31;
normal,
0.69)
(normal,
0.84; slow,
0.16)
(similar,
0.85; same,
0.15)
10(o–close, 0.68;
o–far, 0.32)
(o–close,
1.00)
(close, 0.4;
very close,
0.6)
(very small,
0.49; small,
0.51)
(very large,
1.00)
(normal, 0.58;
slow, 0.42)
(normal,
0.46; slow,
0.54)
(similar,
0.27; same,
0.73)
Table 9. The outputs of decision-making model.
NumberTrealVTeTcTassVeSass
130.04.570.8210.84824.75.330.0
210.04.420.3870.91513.24.400.0
320.04.310.4880.91515.94.220.0
430.04.180.8030.91324.44.000.0
50.03.910.458−0.79610.03.700.0
6−10.03.700.097−0.8750.03.400.0
70.03.590.088−0.915−0.43.270.0
810.03.600.014−0.915−2.42.92−1.0
90.03.700.240−0.6534.52.85−1.0
100.02.290.138−0.912−1.02.020.0
Table 10. The results of error analysis.
NumberΔt ε i t ε i s ε t ¯ ε s ¯ ε a l l t ε a l l s
1575.280.765.610.3682.28%9.61%
2533.180.02
3584.080.09
41175.580.18
514710.000.21
610810.000.30
71010.360.32
820912.360.68
92754.530.85
10/0.990.27
Disclaimer/Publisher’s Note: The statements, opinions and data contained in all publications are solely those of the individual author(s) and contributor(s) and not of MDPI and/or the editor(s). MDPI and/or the editor(s) disclaim responsibility for any injury to people or property resulting from any ideas, methods, instructions or products referred to in the content.

