1. Introduction
The offshore floating wind turbine industry is positioned for significant expansion in the forthcoming decades, driven by technological advancements and the increasing global demand for sustainable energy sources. The need for reliable and cost-effective operations of these complex systems highlights the critical role of predictive maintenance and real-time monitoring. This paper introduces and demonstrates the open-source implementation of a predictive digital twin customized explicitly for the operation and maintenance of wind farms in offshore environments.
In the contemporary landscape of digital twin applications, inspiration is drawn from various sectors, including power generation, manufacturing, meteorology, and urban planning. In these fields, digital twins have proven to be indispensable for enhancing operational efficiency and reliability, as highlighted in the work of Tao et al. [
1]. The objective of this endeavor is to adapt and expand upon this conceptual framework within the domain of offshore wind energy.
In recent years, the application of digital twin technology in wind power generation has seen an increase. In particular, Azure and AWS have led the market with their commercial applications of this technology for wind turbines. For example, research presented in [
2] highlights Microsoft Azure’s application of digital twin technology in power generation, with special emphasis on a predictive machine learning model. AWS has developed cloud applications using their product
AWS IoT TwinMaker; in [
3], the online digital twin is coupled with OpenFAST to evaluate the performance of the wind turbines (onshore and offshore). However, in [
3], the concept of a digital twin seems to be related to sensor monitoring through the Grafana dashboard rather than the 3D model, although the 3D capability exists inside the commercial solution. And by closing the area of research to 3D digital twin applications, other types of commercial applications in offshore wind turbines are those implemented using the Unity3D render, e.g., ref. [
4], which involves a wide range of open-source technologies found in the background of this paper.
The research in this paper showcases the possibility of implementing digital twin technology; we specifically focus on 3D virtual representation to monitor structures, integrate predictive maintenance, and assess the life cycle of structures. The research was implemented through an open-source platform available to the public, which is a solution not quite explored in the field. The types of structures of interest here are offshore floating wind turbines, especially those made of composites. The life cycle of the turbines was assessed by means of an innovative real-time hydroelastic model, combined with advanced fatigue techniques for composite materials; this allowed for deriving a suitable remaining useful life that could be of interest in the predictive maintenance field.
2. Background
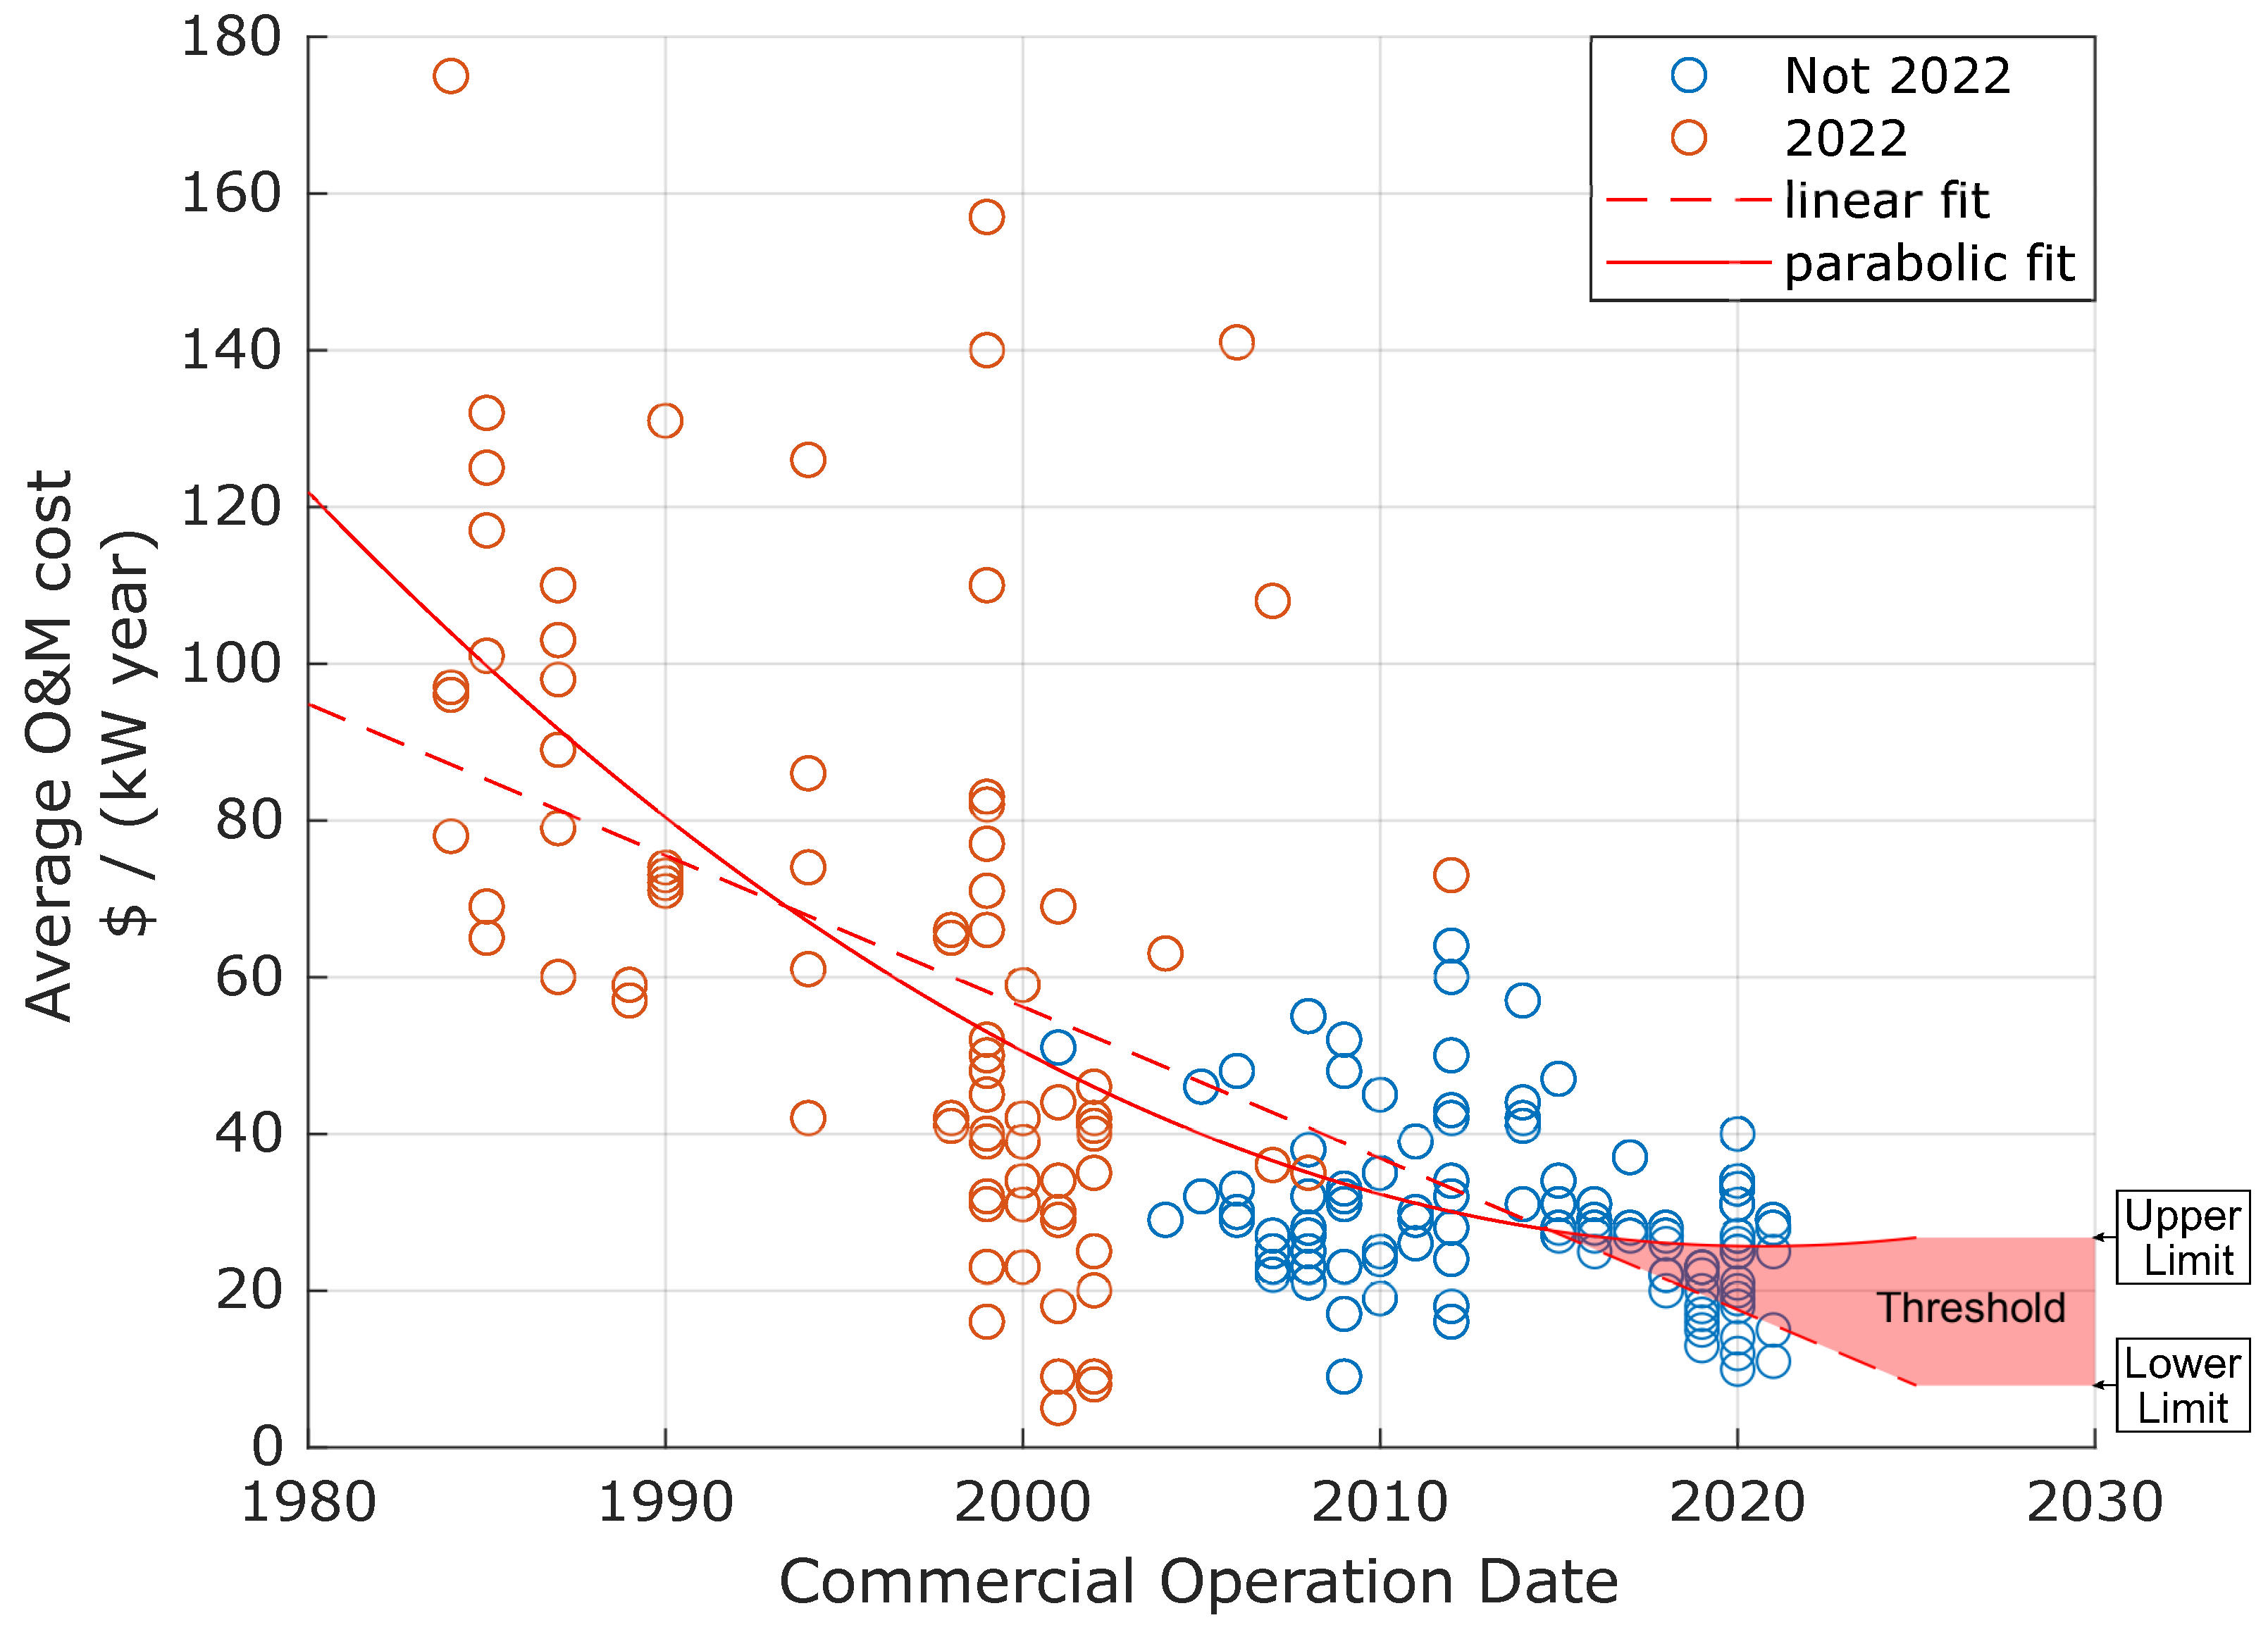
The application of digital twins to the specific field of wind turbine operation and maintenance (O&M) can significantly impact cost reduction. While O&M expenses may not be the primary economic costs, they make a substantial contribution to the overall expenses. Recent surveys on onshore wind turbines have indicated a decreasing trend in the average O&M costs in the last few decades. In
Figure 1, data from the 2022 report on the land-based wind market by Wiser et al. [
5] demonstrate a decline in costs according to the two fitted curves used in the forecast. Based on the current threshold, the most likely scenario is for costs to remain stable or experience a slight increase. A significant decrease seems less likely, especially since the costs theoretically cannot reach zero. Regular updates on information in the coming years will be crucial for a better understanding of the behavior of OPEX costs in such structures.
Therefore, given the current trends, there is limited room for improving efficiency in terms of O&M. This underscores the importance of considering digital twin solutions to obtain high-fidelity models that can be utilized for cost optimization if correctly implemented.
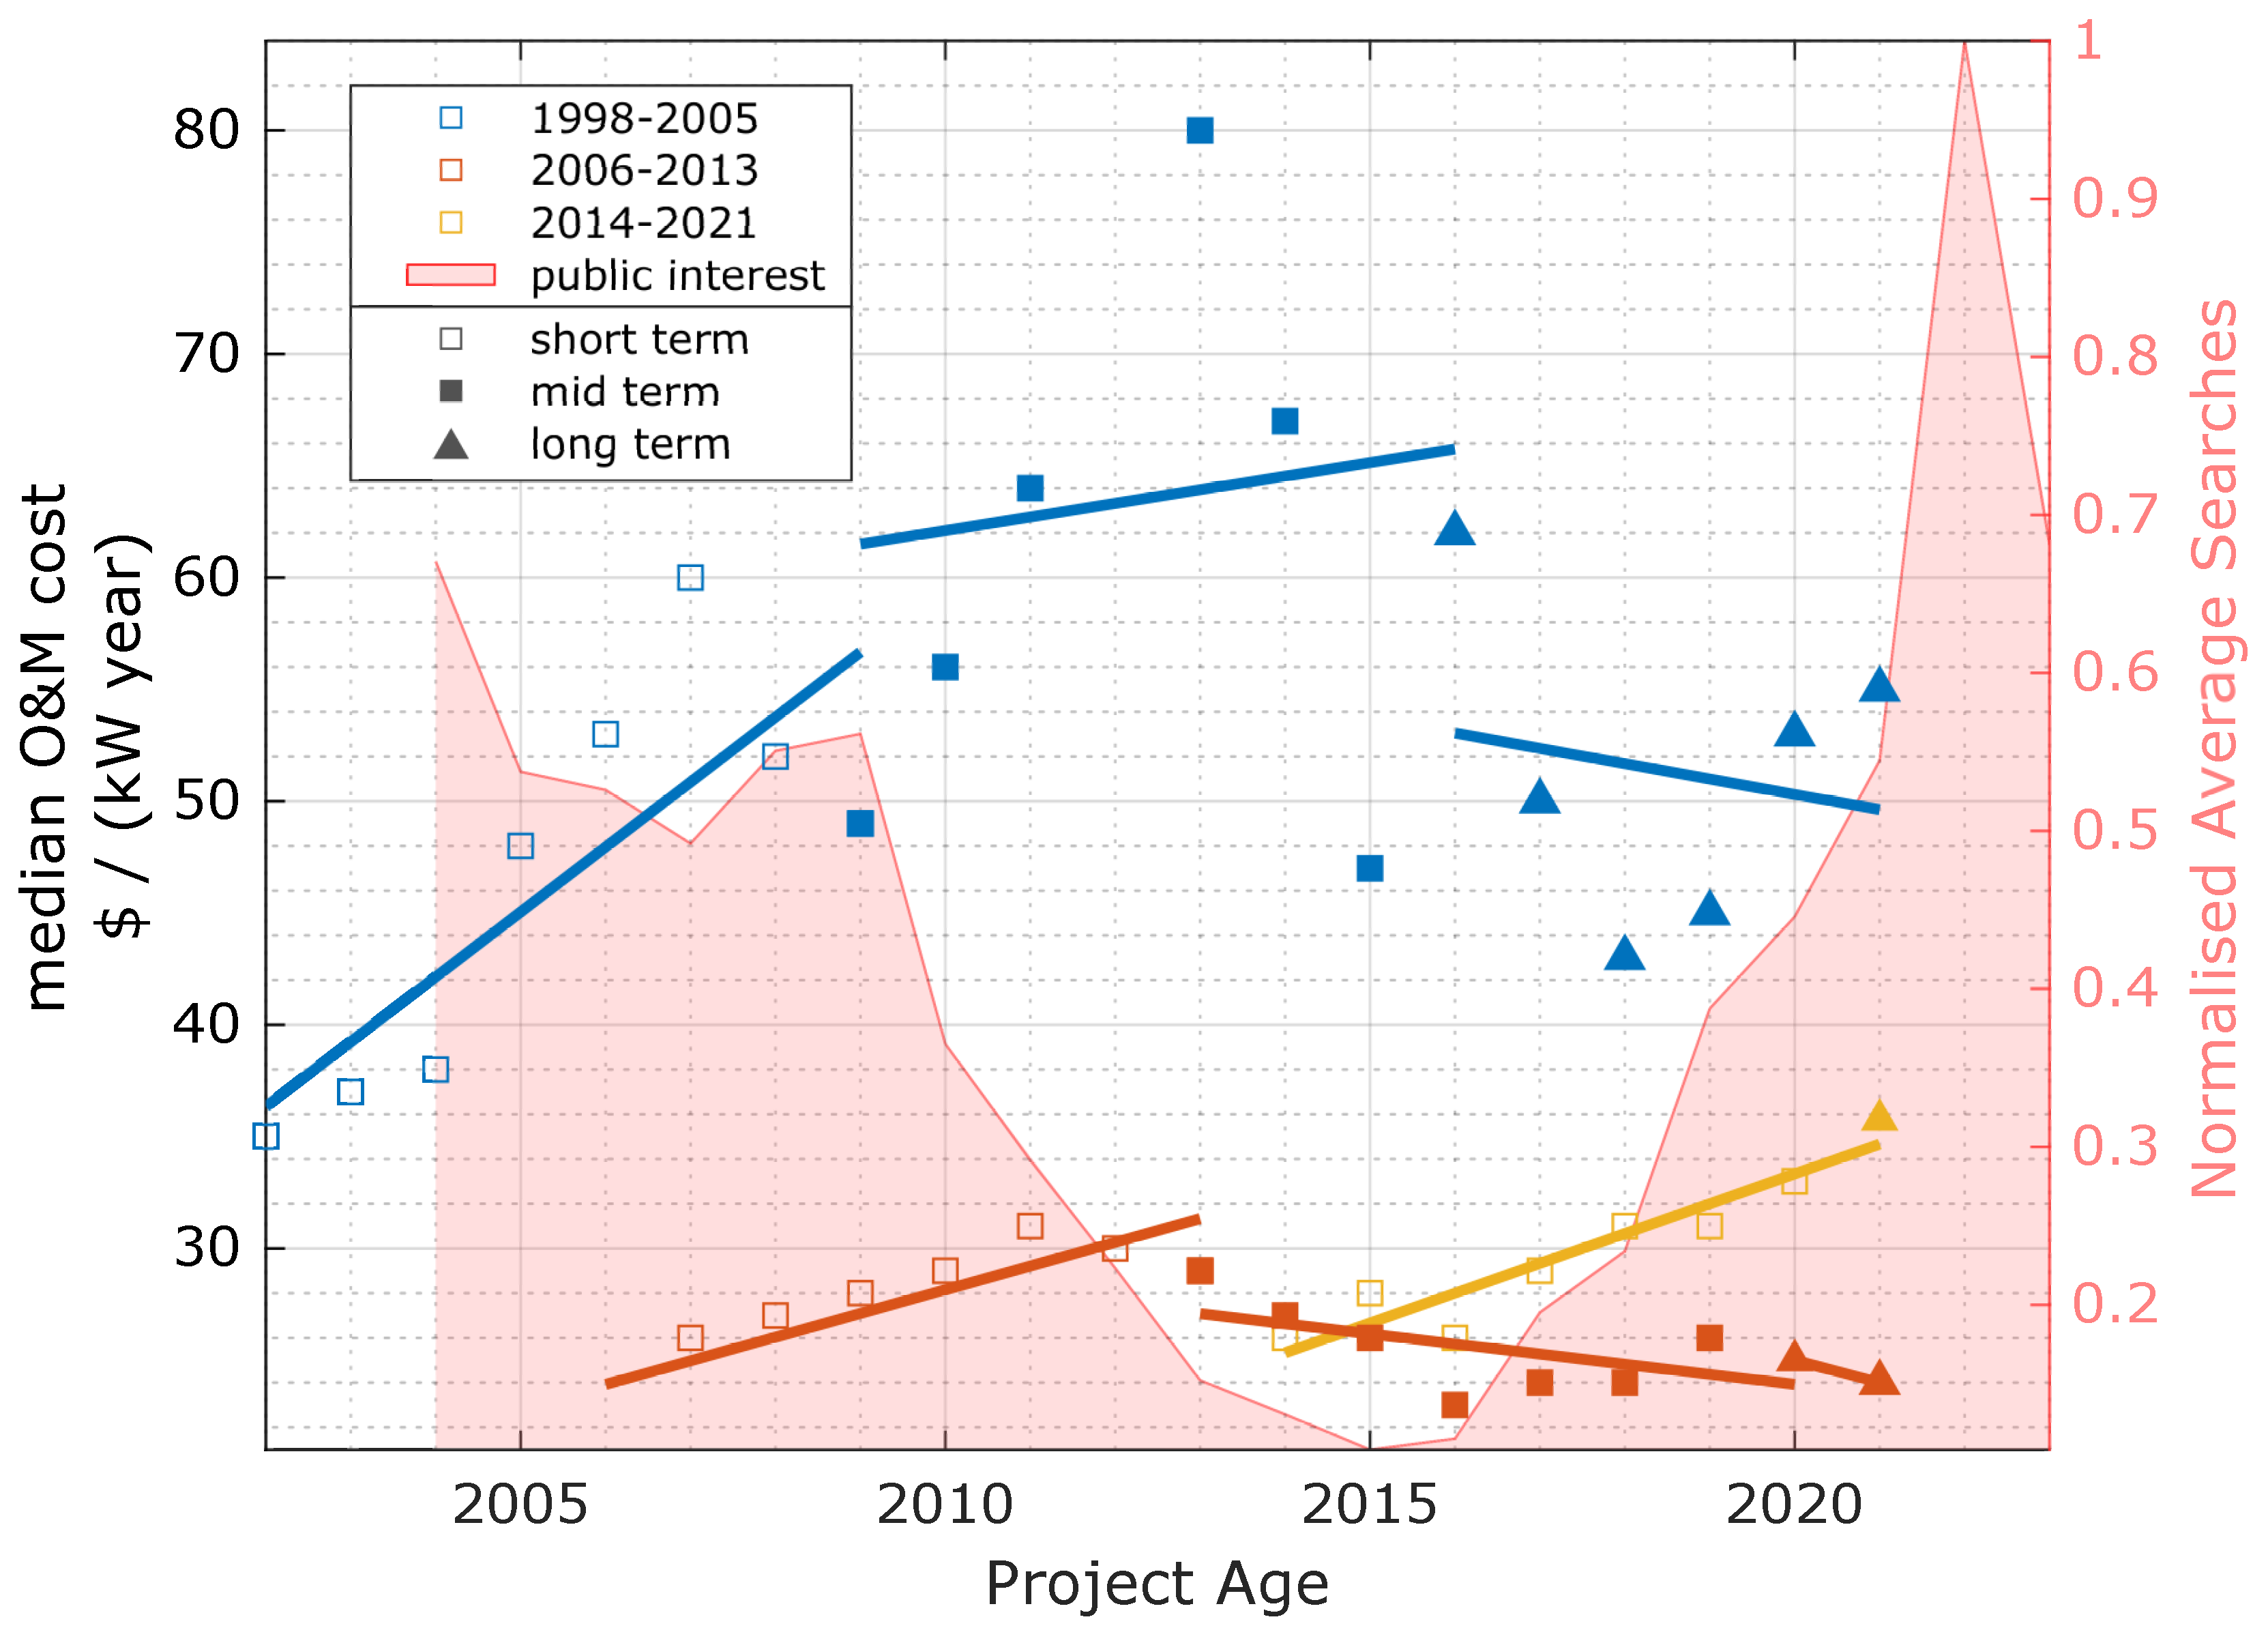
In the same report on onshore wind turbines, insights into the O&M costs per year are provided concerning the age of the project (refer to
Figure 2). The information is organized into three-year ranges based on the commercial operation date. While the exact date is not disclosed, it has been assumed based on the lower bound year of each range.
In
Figure 2, the original data were transformed from the age of the project to an age represented in a date scale. The data were then further subdivided into short, mid, and long-term categories, each covering a range of 7 years. This subdivision mirrors the original classification, which categorized the data into three ranges (1998–2005, 2006–2013, and 2014–2021). This approach is motivated by the desire to gain insight into the different project ages within the lifespan of an onshore wind turbine.
From
Figure 2, it is evident that the median O&M cost is higher for the oldest wind turbines and remains relatively similar for the newest wind turbines. This pattern is consistent with technology trends, where new technologies often entail higher costs, which gradually decrease as the technology matures. The reason for the cost stagnation in the 2014–2021 range compared to the 2006–2013 range may be attributed to two factors. First, it is essential to recognize that costs cannot be reduced indefinitely. Second, the average power generation of the turbines has increased, which is closely correlated with larger sizes and, consequently, increased costs.
The trend displayed in
Figure 2 indicates that the median cost for short-term-aged wind turbines typically follows a positive, monotonically increasing pattern, while the mid-term trend tends to be negative. However, it is worth noting that the 1998–2005 range does not exhibit a decrease in cost.
The long-term trend can either show a mild decrease or appear saturated. The absence of data for the largest onshore wind turbines in terms of mid- and long-term periods leaves room for speculation regarding the potential role of digital twin technology for newer structures. This is why, in
Figure 2, a chart illustrating the number of Google trend searches for the keywords “wind turbine” and “digital twin” is included. The red area represents searches normalized by their historical maximum number. It is evident that interest in this topic has been high in the last decade, which aligns with the construction of new wind turbines. It is also worth noting that, apart from the popularity of digital twin technology in recent years, other factors such as regulatory changes, increased awareness of environmental issues, and market dynamics might have had some impact in the past decades.
Thus, despite the absence of data for the mid- and long-term periods of the 2014–2021 wind turbines, it can be reasonably assumed that the popularization of digital twin technology may have played a significant role in reducing the short-term costs of larger and more powerful wind turbines, compared to the equivalent 2006–2013 curve.
Within the domain of digital twin technology, another important metric is the carbon footprint associated with operation and maintenance, due to its synergistic integration. For example, an environmental review by Arvesen and Hertwich [
6] sought to gain a better understanding of climate change indicators such as energy intensity (EI) and greenhouse gas (GHG) emission intensity as applied to onshore and offshore wind turbines.
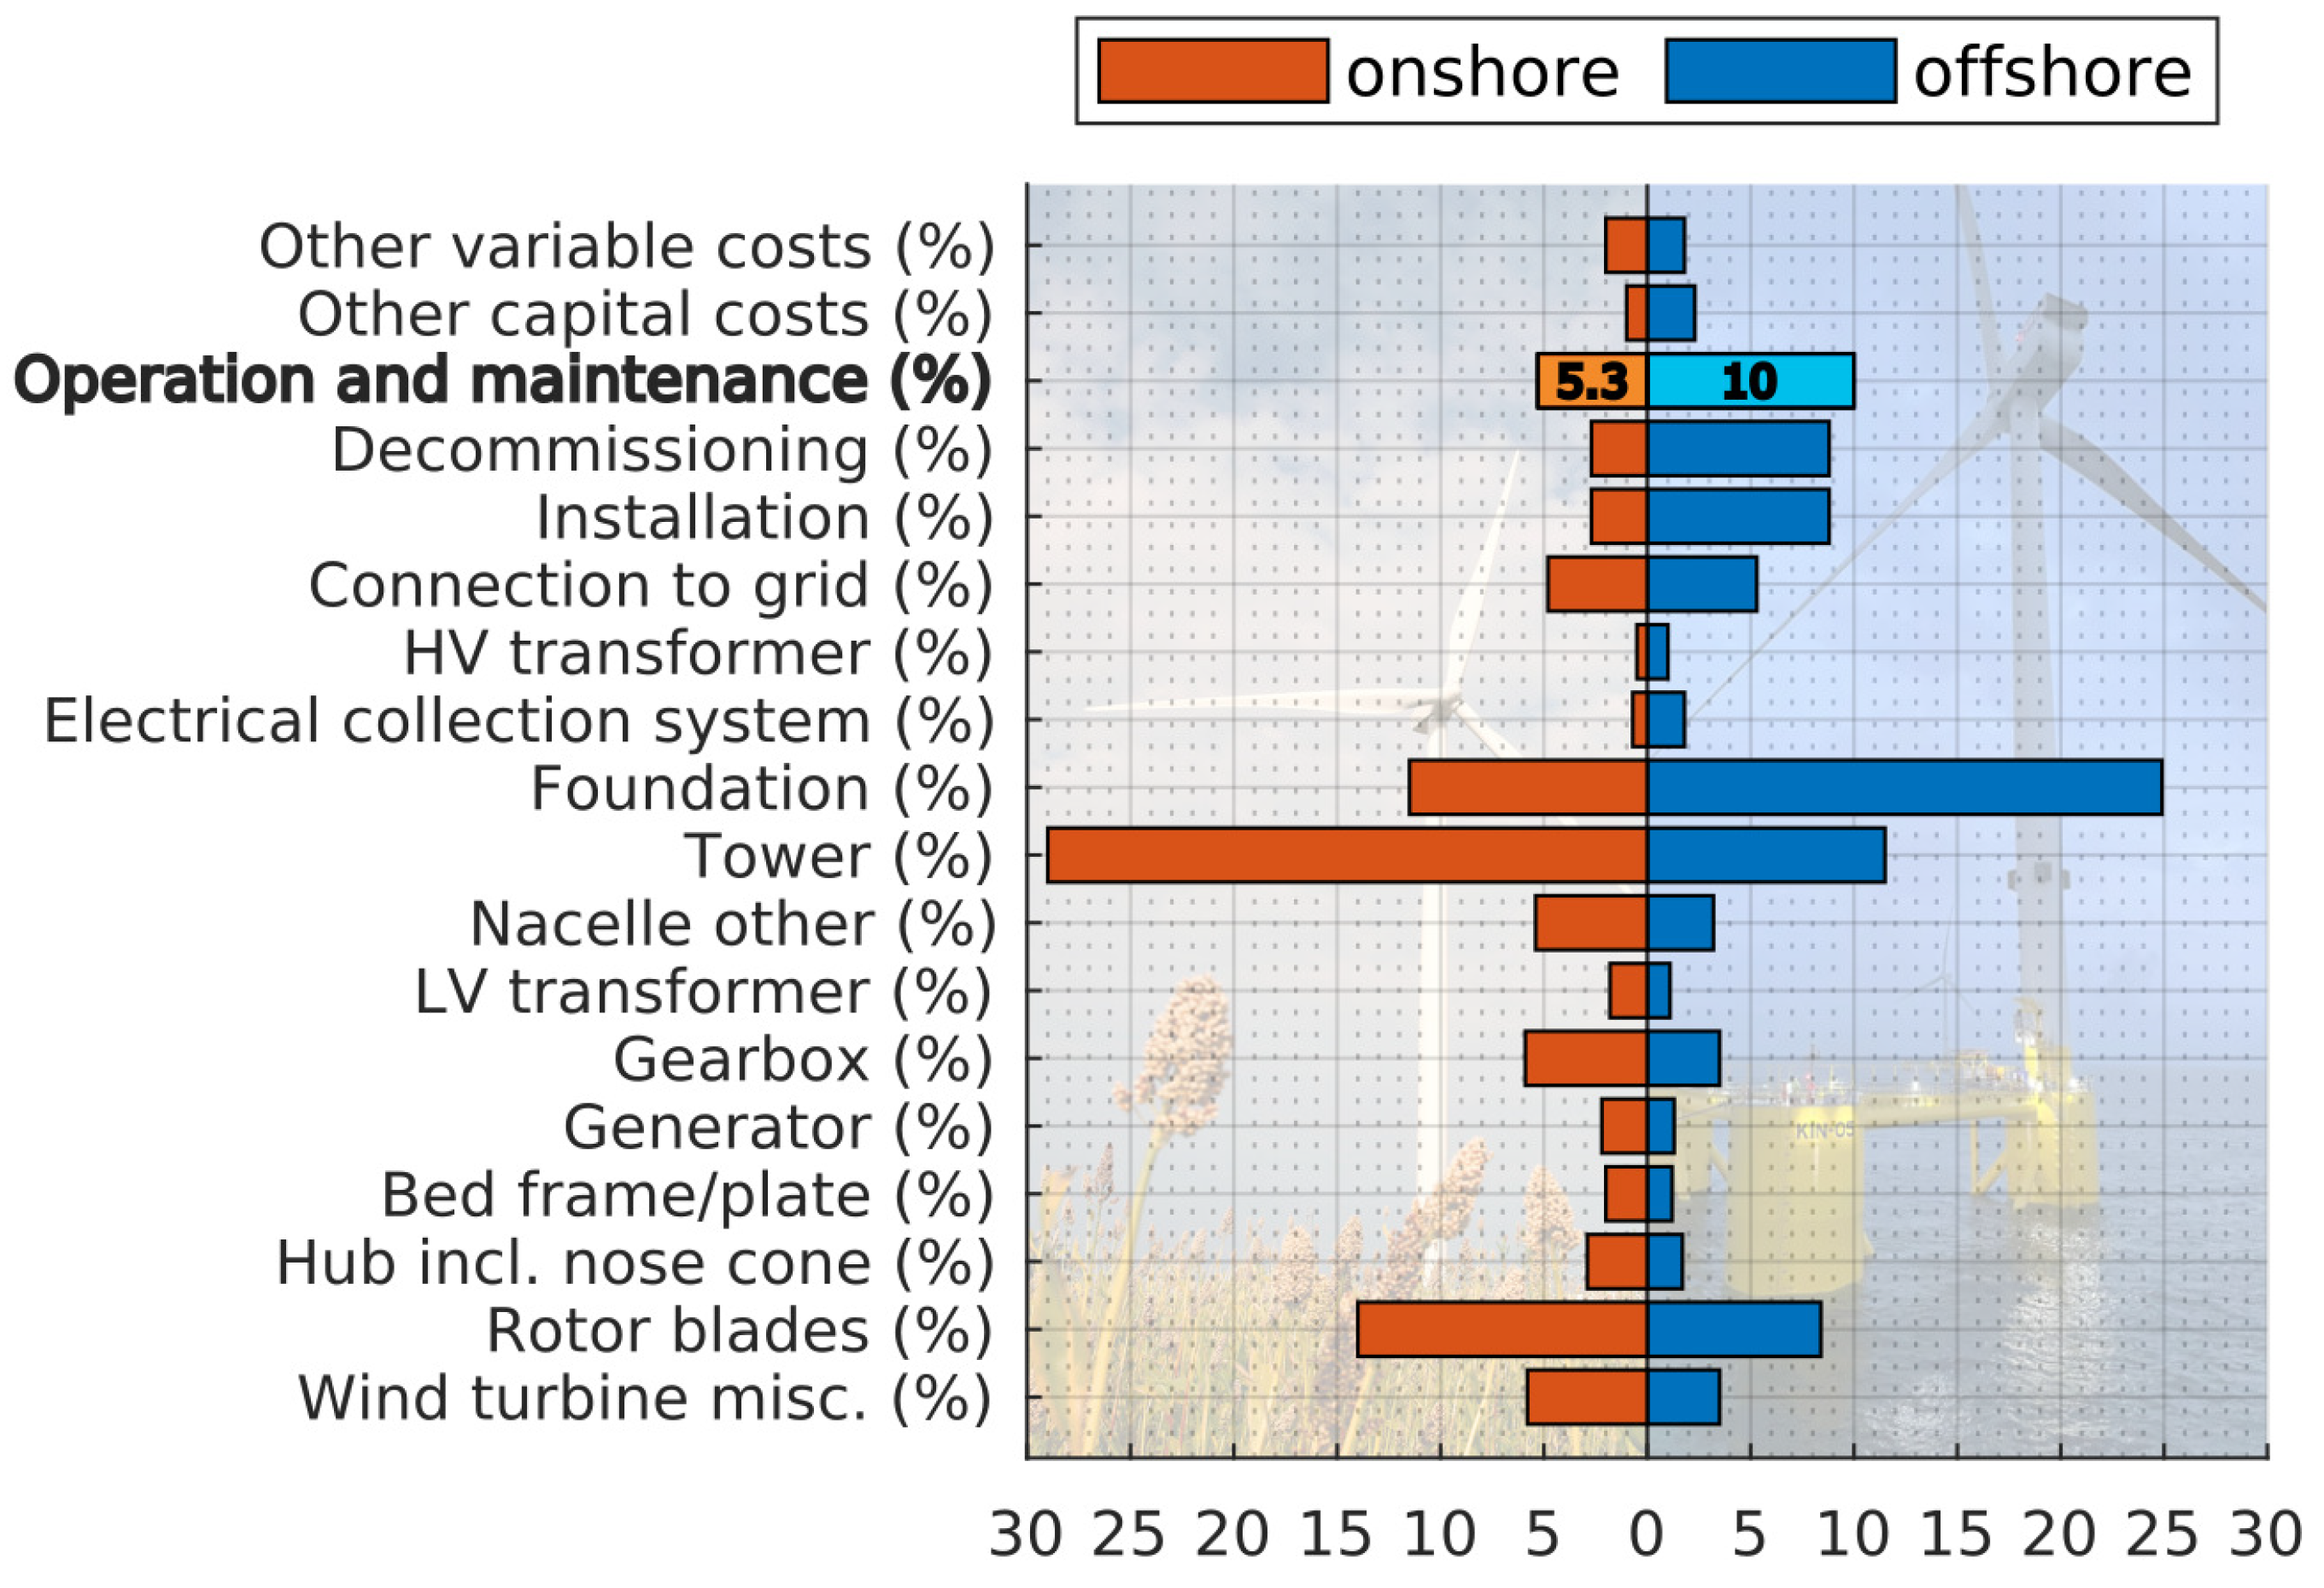
To comprehend the significant differences between onshore and offshore wind turbines, previous research by [
7] highlighted the contributions of various elements to total greenhouse gas emissions (refer to
Figure 3). Focusing on O&M, offshore wind turbines account for a total of 10%, in contrast to 5.3% for onshore wind turbines, which is nearly double. This underscores that having precise control over emissions in tasks related to O&M can potentially contribute to reducing this value.
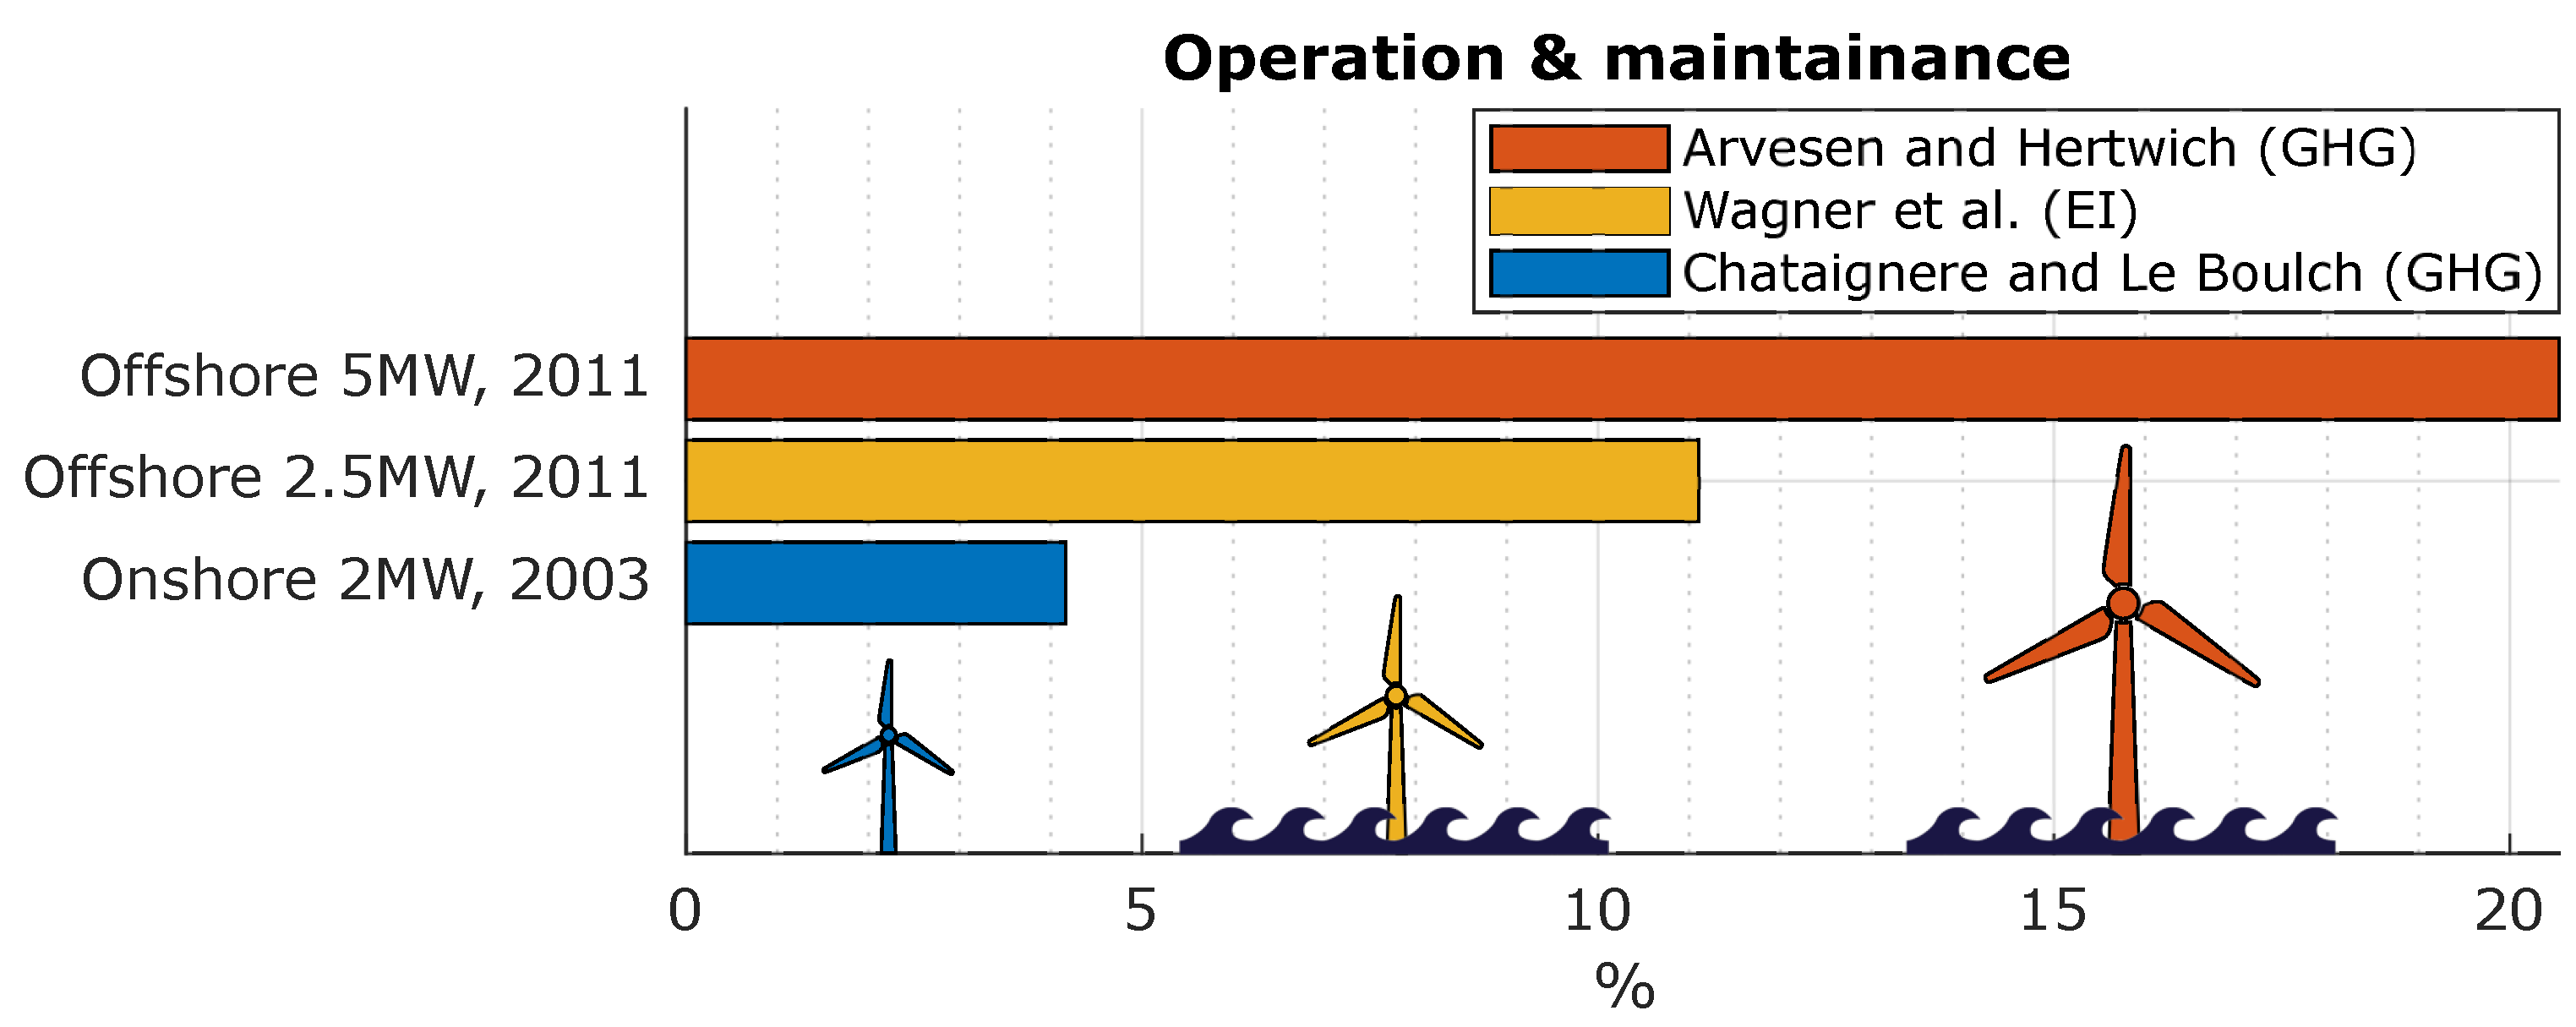
The size and power of wind turbines can also be considered as significant factors that contribute to the climate change index, whether in terms of greenhouse gas (GHG) emissions or energy intensity (EI). As shown in
Figure 4, the difference between offshore and onshore wind turbines is evident once more. For similar wind turbines with a power value of 2 MW or 5 MW, offshore turbines exhibit a higher percentage compared to onshore turbines. However, when power generation requirements increase, the GHG contribution also rises. It is also important to note that there are other factors, such as the production of materials that have a significant impact on GHG emissions, which will also increase proportionally with the turbine size. This relationship is crucial because the design power of new wind turbines is expected to increase substantially. Consequently, the application of digital twin technology is not only necessary to monitor this contribution but also to leverage the recorded data to improve the designs of the next generation.
3. Methodology
The research described in this paper was applied to an offshore floating wind turbine (OFWT) as part of the H2020 FIBREGY project [
9]. Within the FIBREGY project, one of the tasks involved the life cycle management of fiber-based OFWTs.
This methodology is divided into two parts: first, introducing the digital twin platform and its capabilities; and then, applying the digital twin in real-time to a wind turbine. The second part focuses on applying the finite element method to calculate the remaining useful life, specifically by calculating a fatigue index for composite materials through the serial–parallel rule of mixtures.
3.1. Digital Twin Platform
The platform used to create a digital twin of an offshore wind turbine structure is the so-called OSI4IOT [
10,
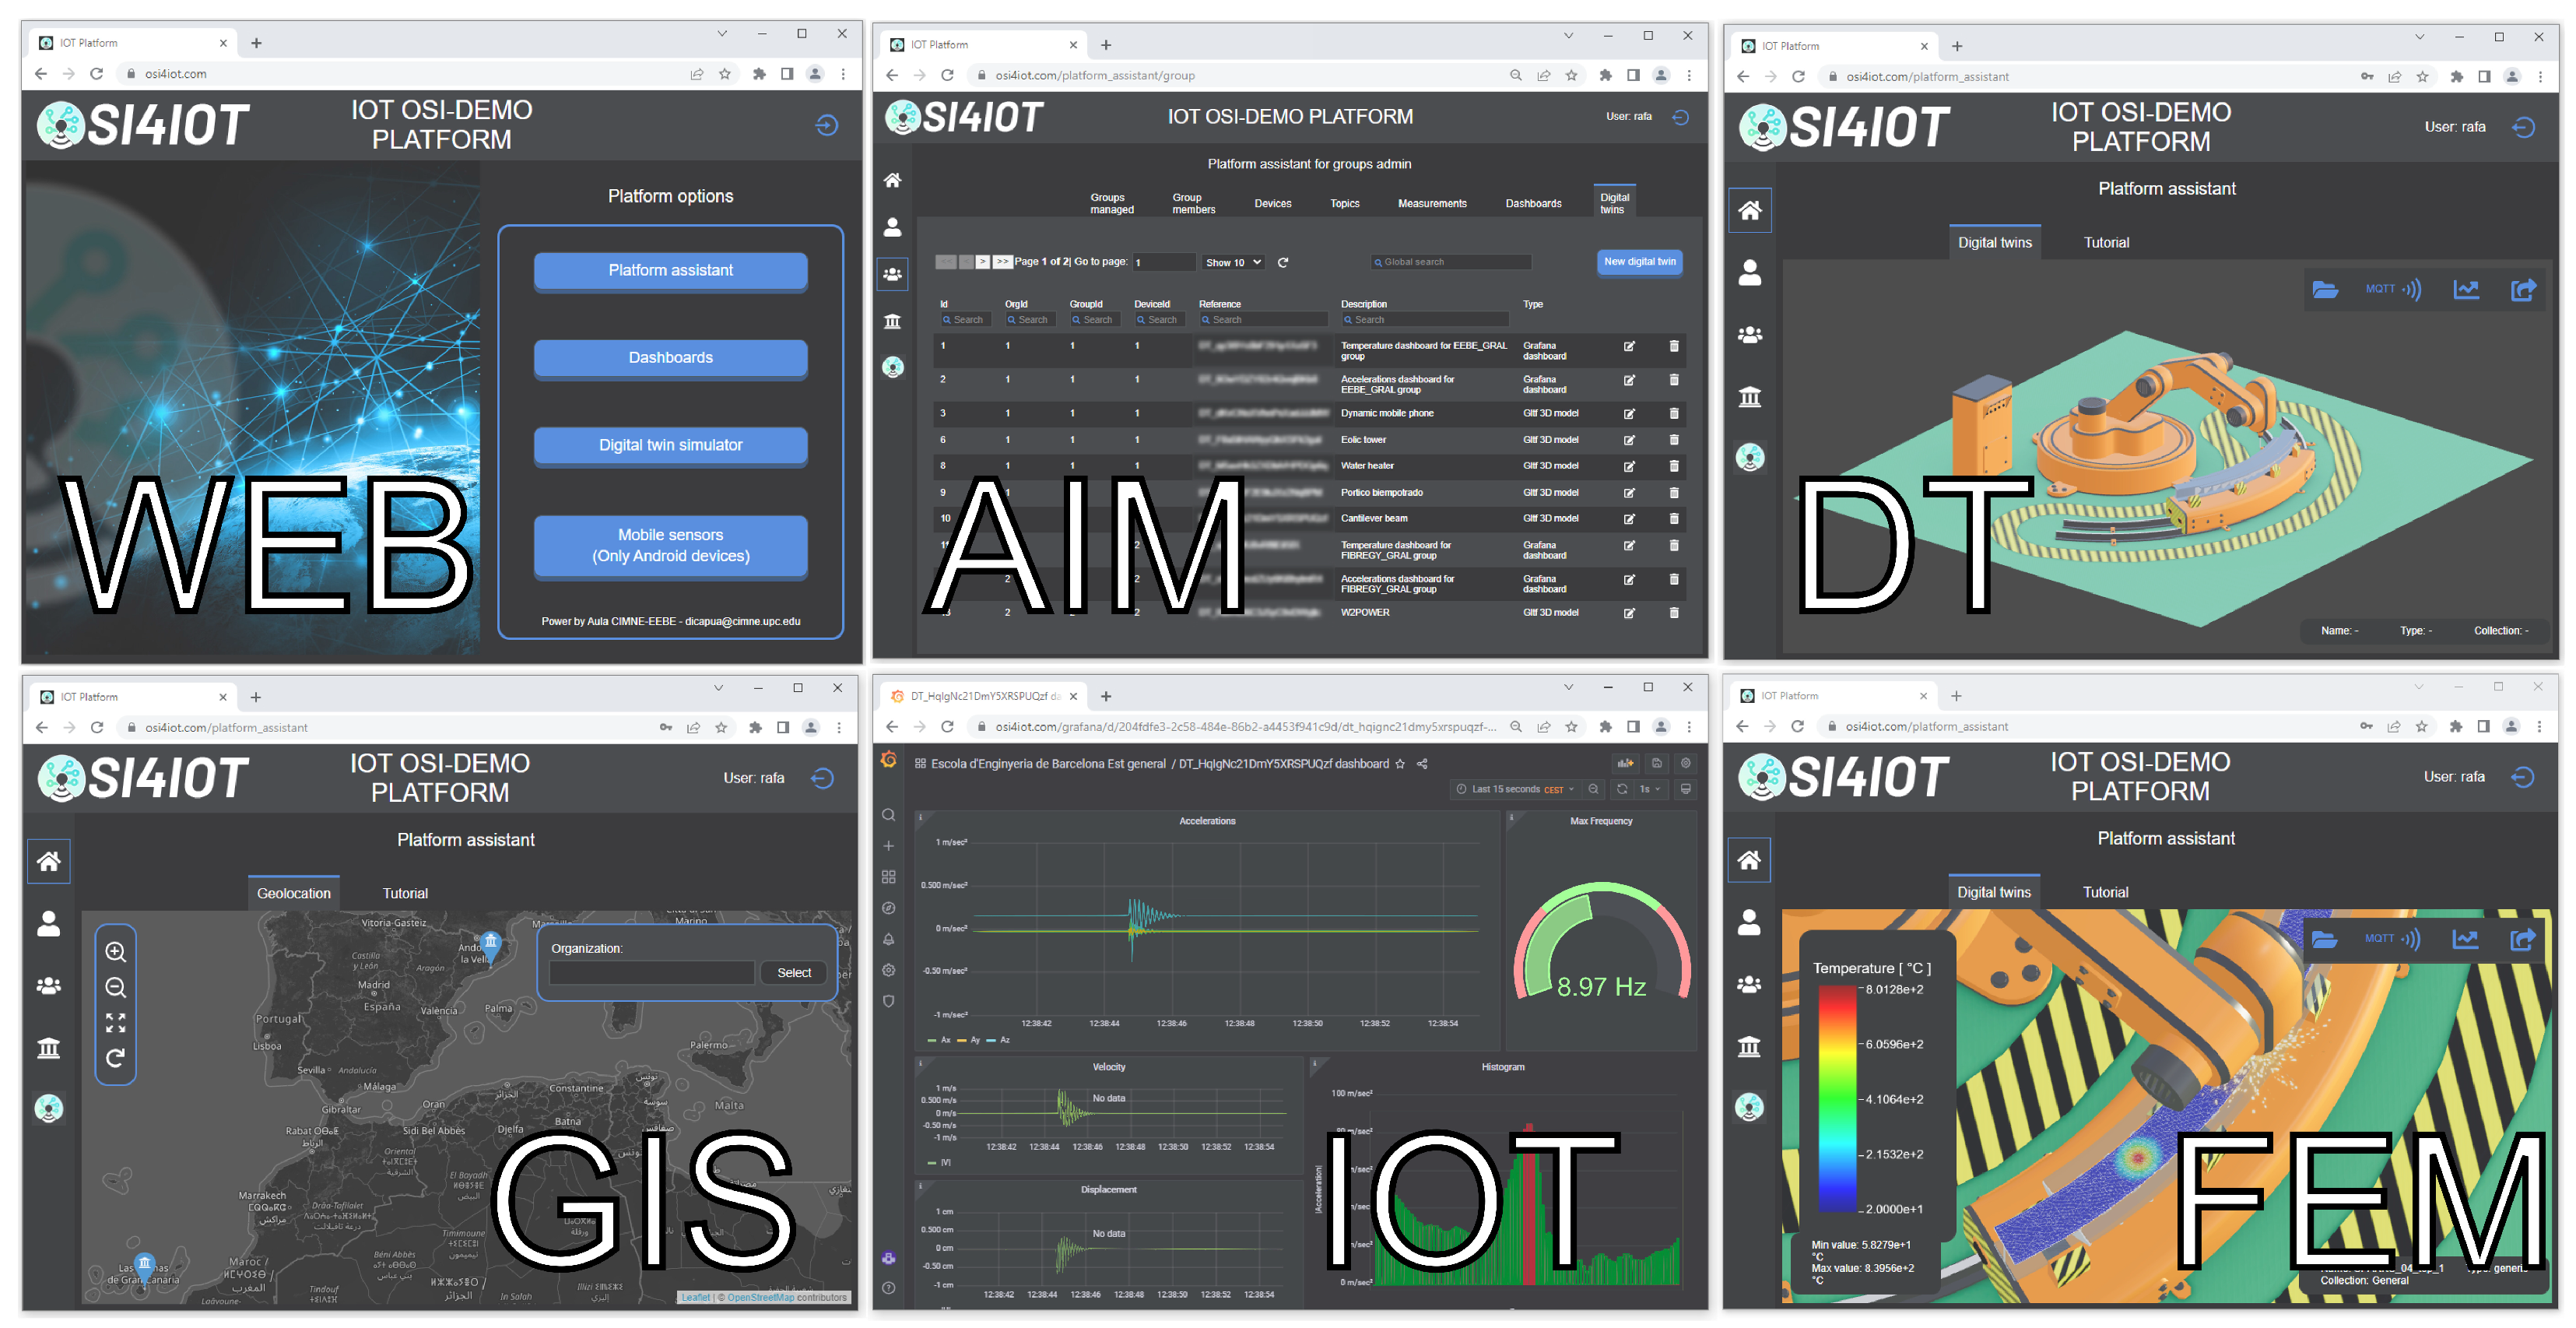
11]. OSI4IOT is an open-source web-based platform designed for monitoring industrial assets and structures. The platform’s features are depicted in
Figure 5, and it incorporates several technologies, including web-based functionality, the integration of digital twins (DT), a geographical information system (GIS), compatibility with the Internet of Things (IoT), integration of assets through asset information models (AIMs), and real-time simulation using the finite element method (FEM).
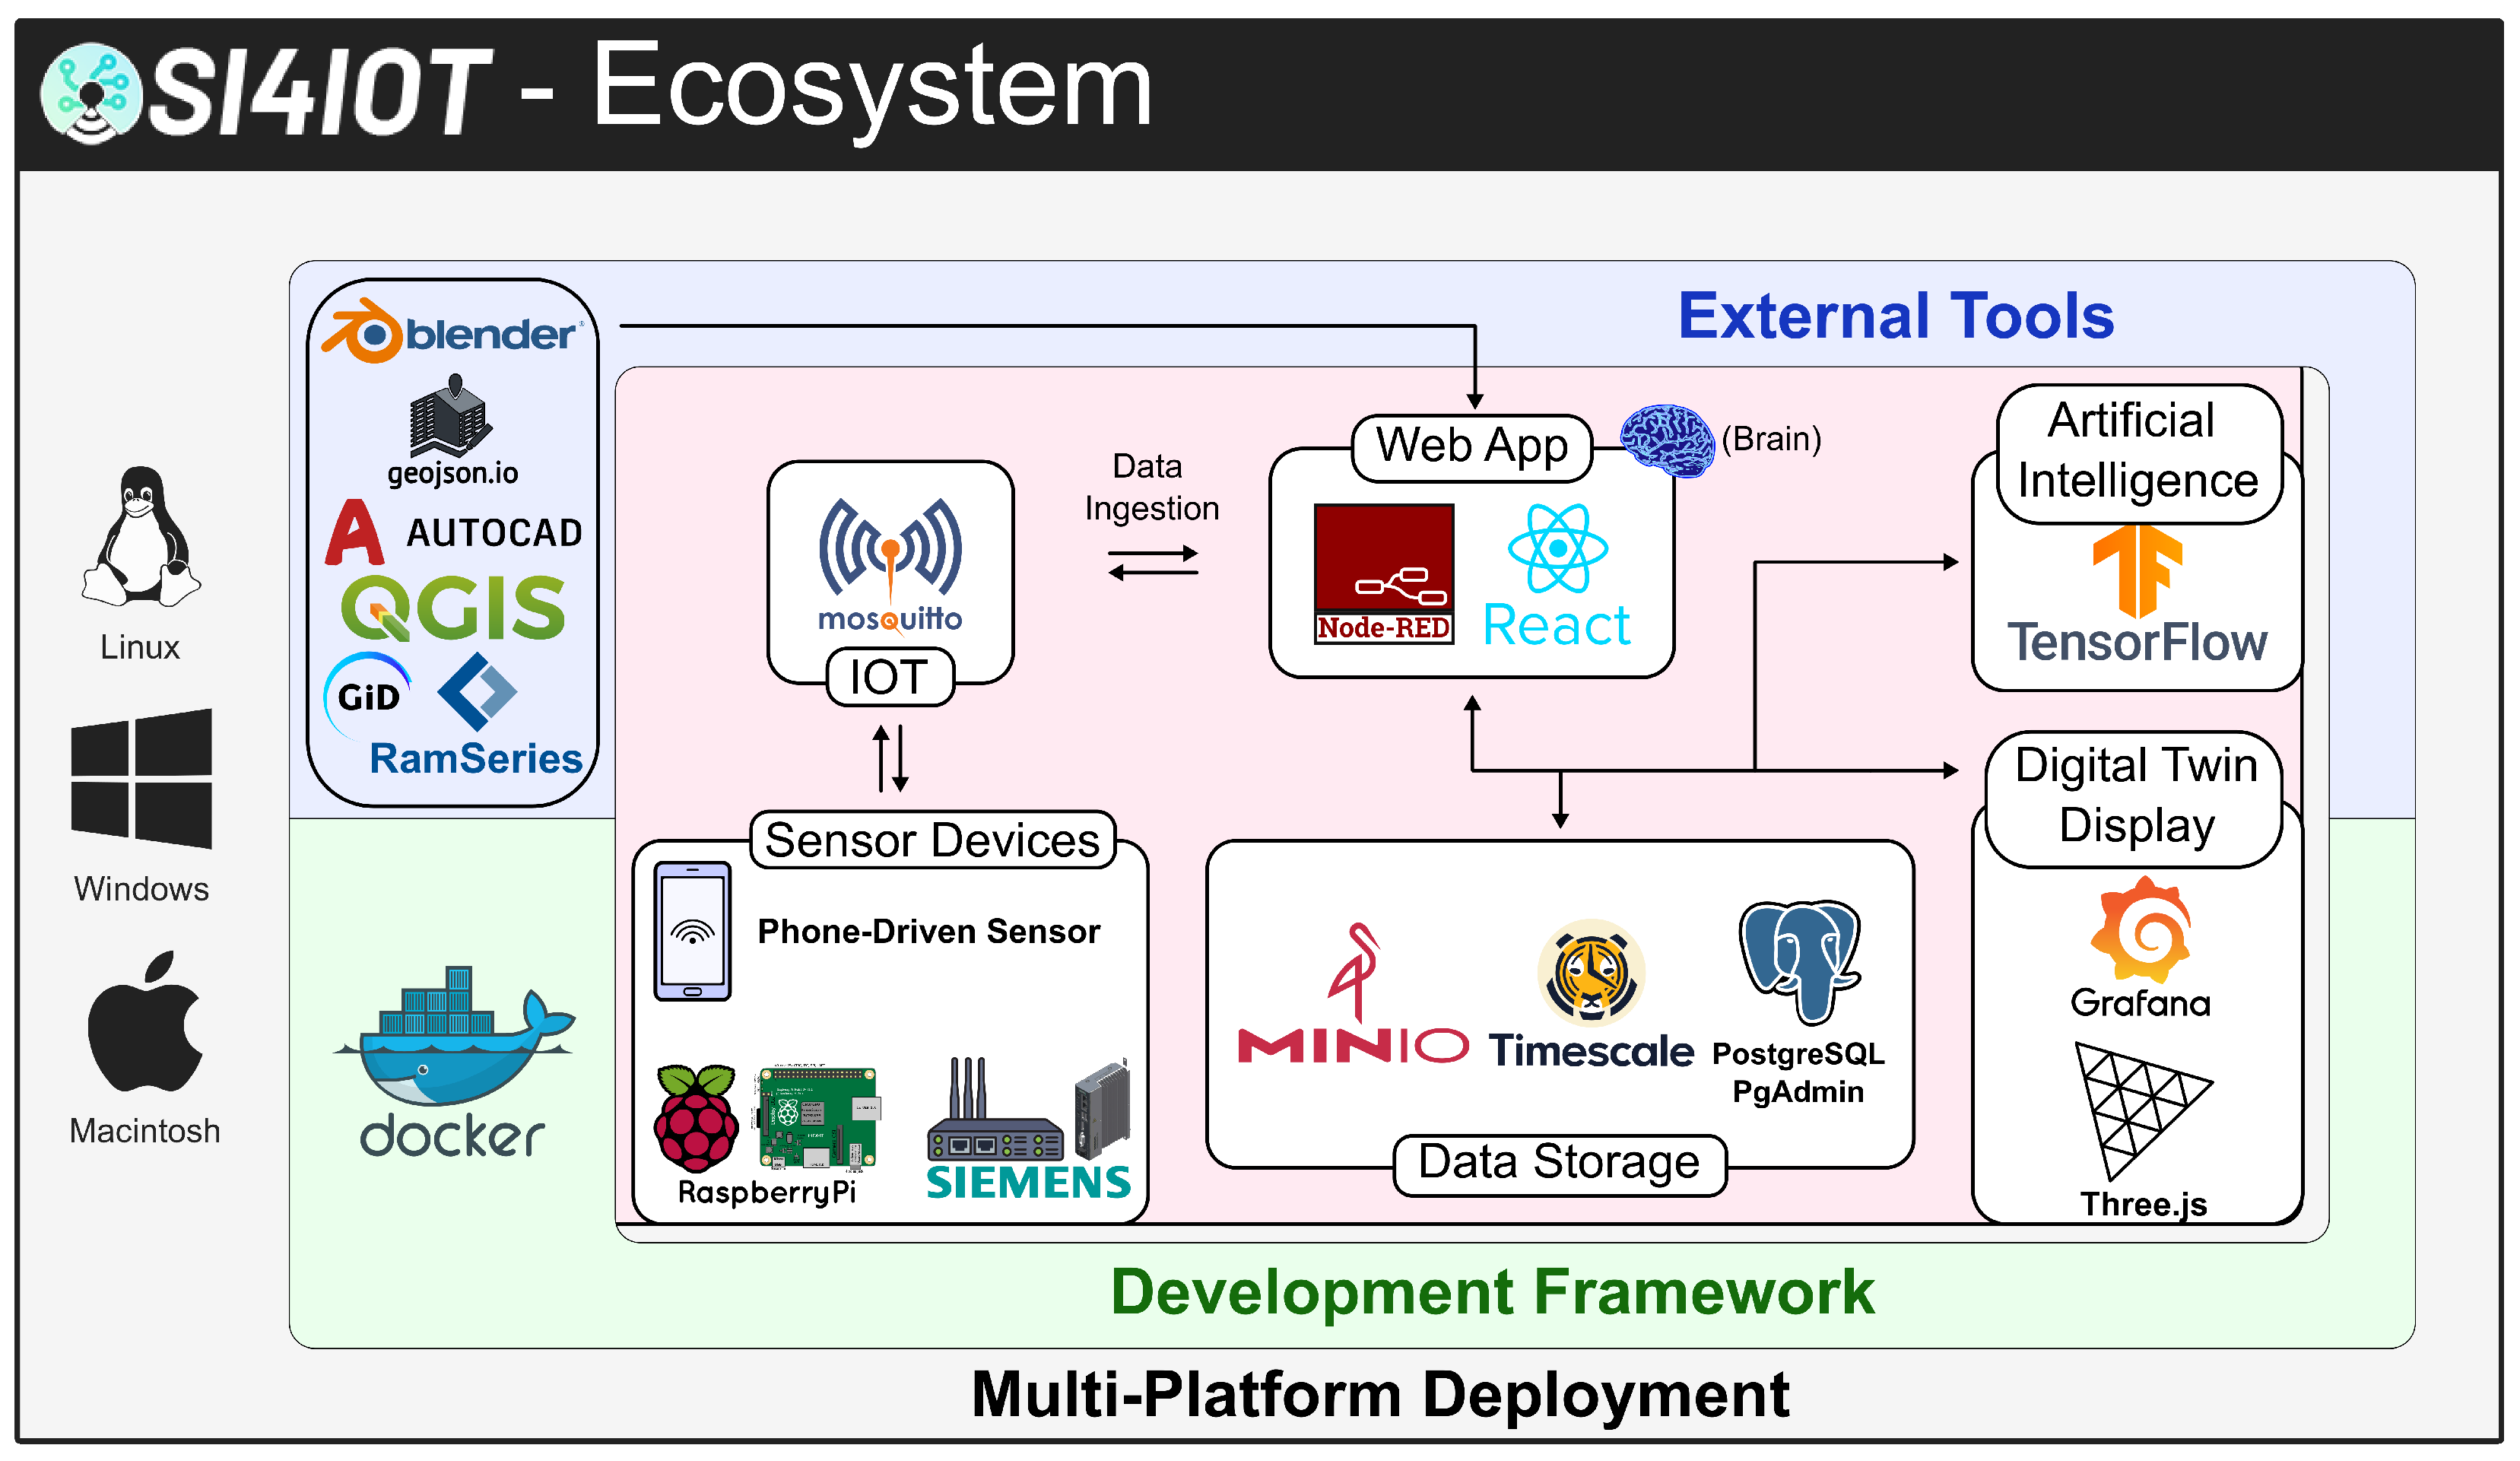
The OSI4IOT environment comprises various components as depicted in
Figure 6. This platform is operating-system-independent, thanks to its use of Docker technology in its development. It consists of five distinct modules, with the core being the web app built using React and integrated with Node-RED for data manipulation. The default protocol for data communication from the sensors to the platform is MQTT, using Mosquitto technology. Sensor data can be obtained from industrial microcontrollers to simpler microcontrollers such as Raspberry Pi or sensors from mobile phones.
Data are ingested and stored in the Timescale database using the concept of buckets. Once the ingested data are transformed, they can be displayed in a 3D interactive digital twin model, on the Grafana dashboard, and can also be utilized to train a machine learning model built using the TensorFlow environment.
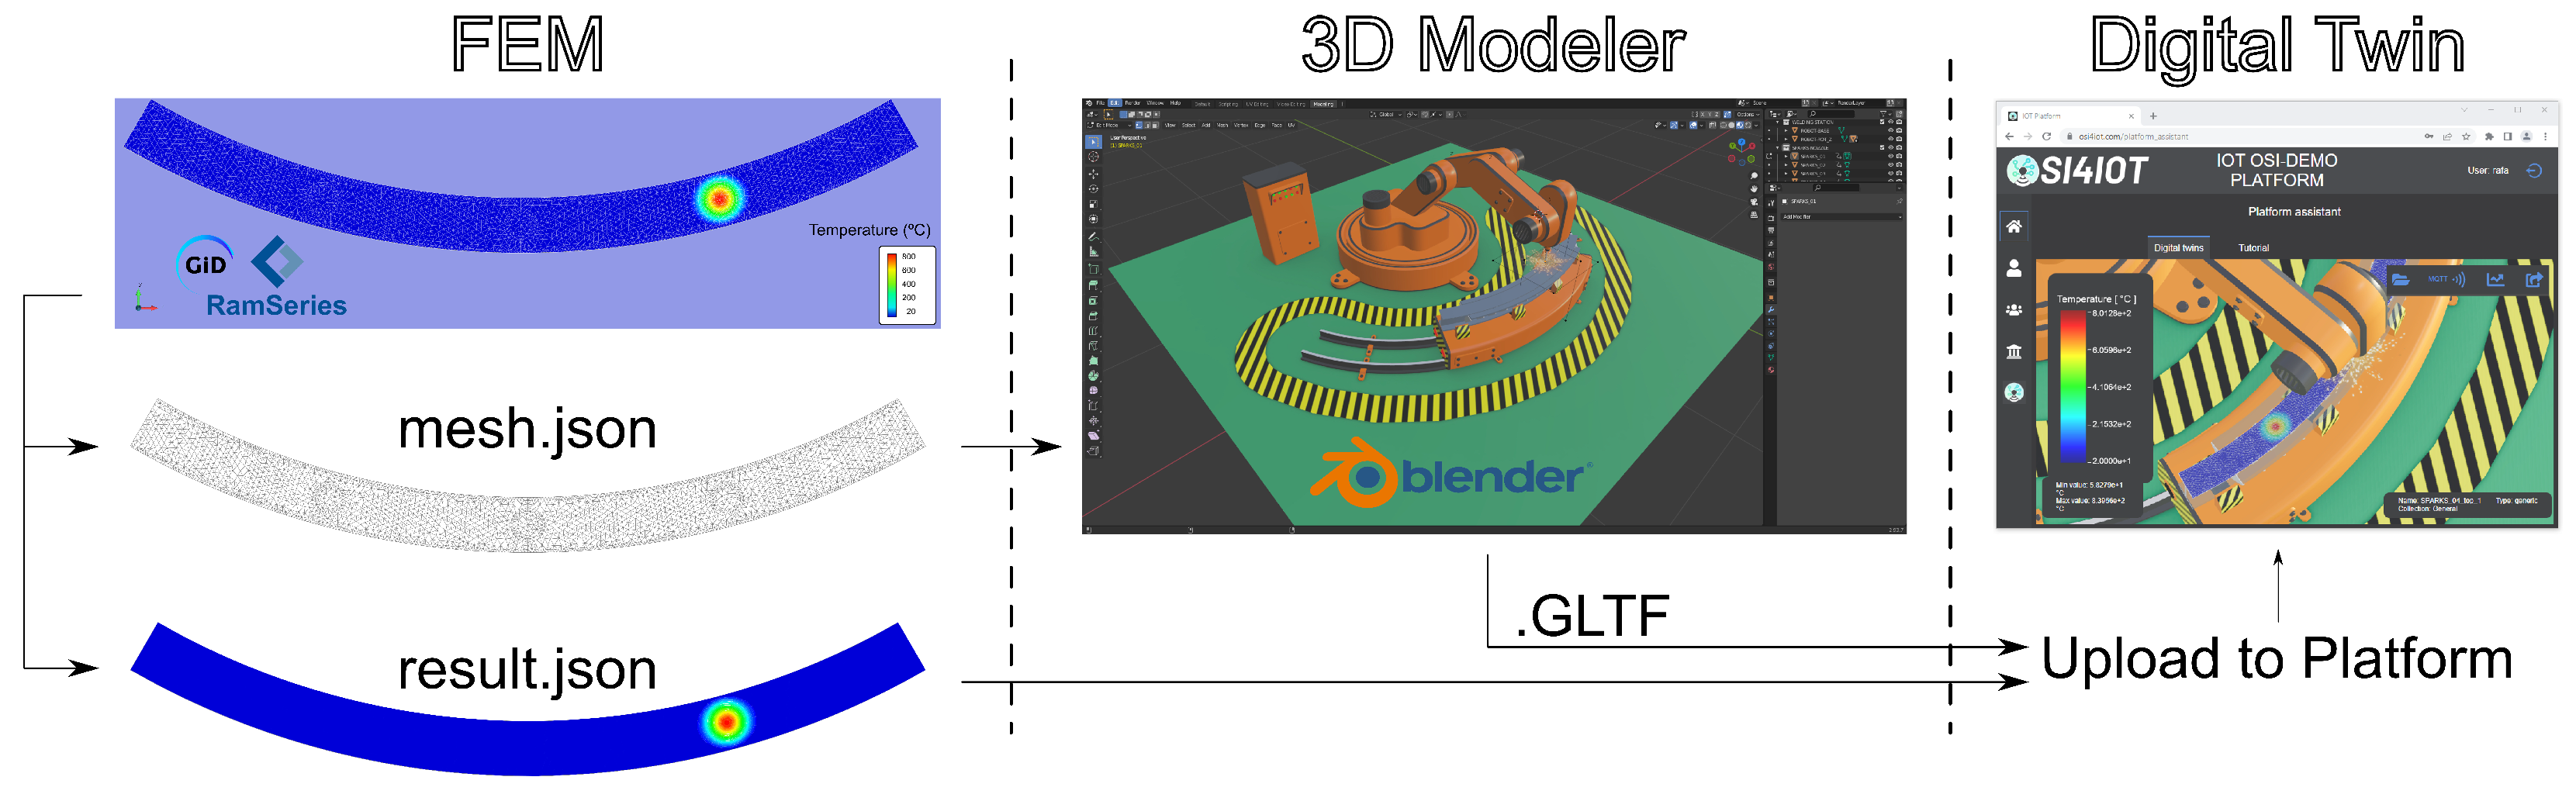
The last component of the system involves external tools. The platform utilizes Blender as its external modeling tool. For instance,
Figure 7 illustrates the pipeline used by external tools to generate the digital twin metadata for later creation in the platform. In this specific case, the process focuses on studying a welding robot arm.
The simulation of temperature profiles is obtained using finite element software (RAM Series), which exports both the mesh and nodal results in JSON files (mesh.json and result.json). The mesh is then imported into Blender to prepare the metadata, including sensors, assets, animations, and geometrical information. Subsequently, the digital twin model is exported in .glTF format, which is a standard format compatible with the three.js graphics and rendering library.
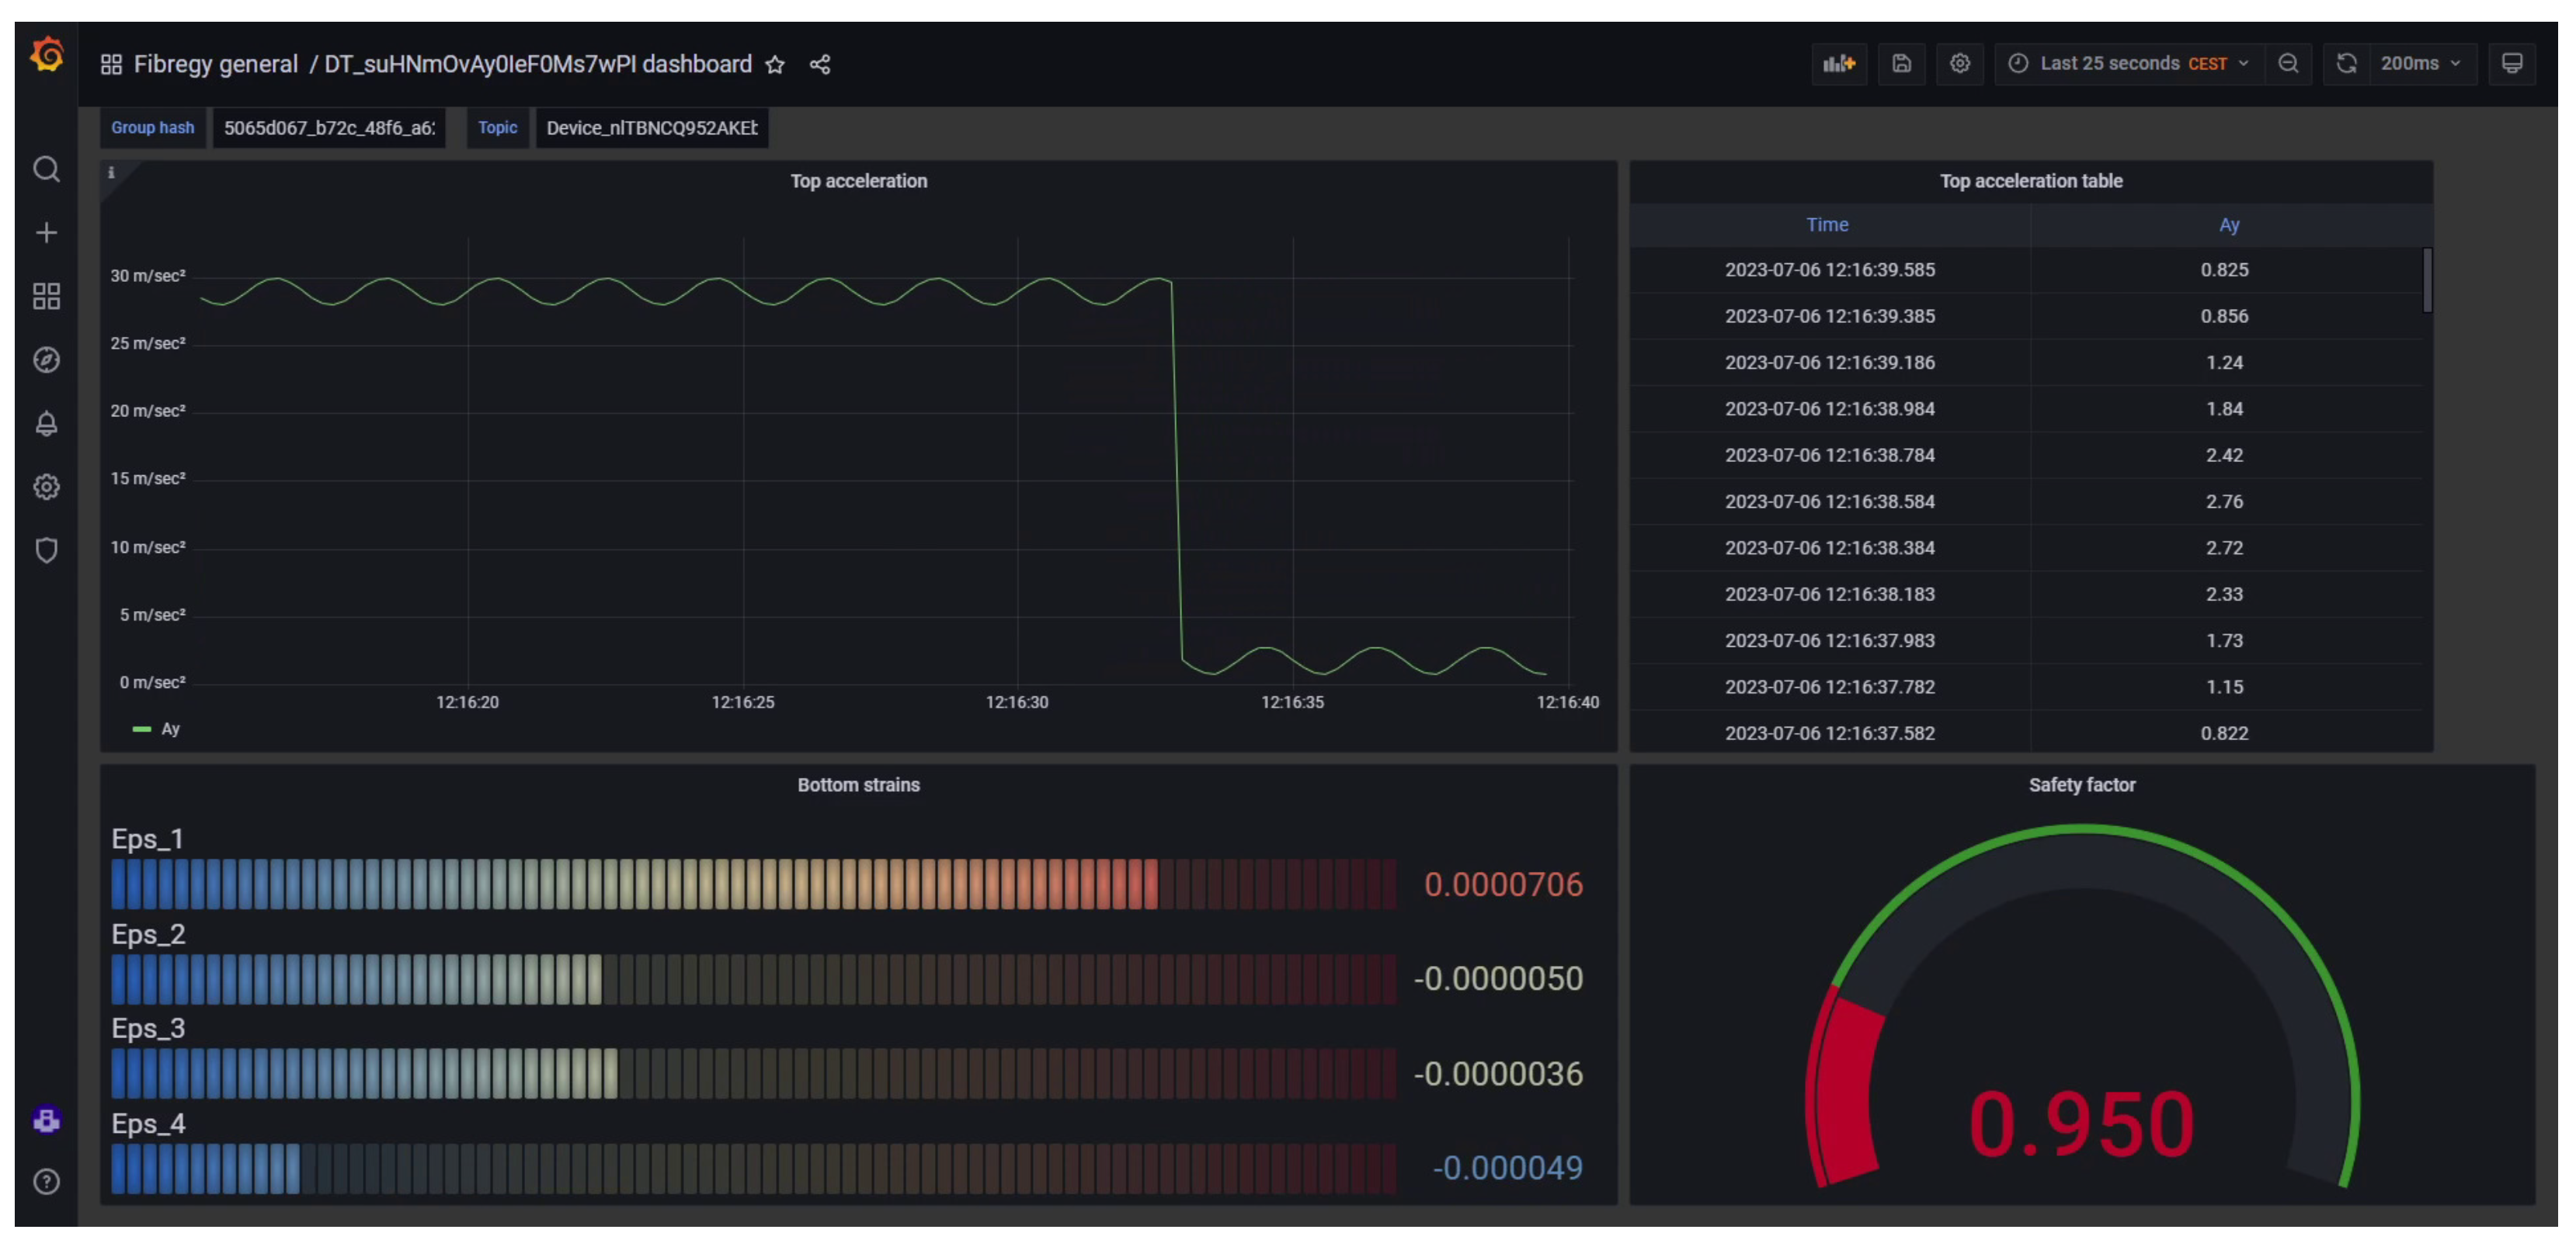
The results of the sensor data can be visualized through a Grafana dashboard, as depicted in
Figure 8.
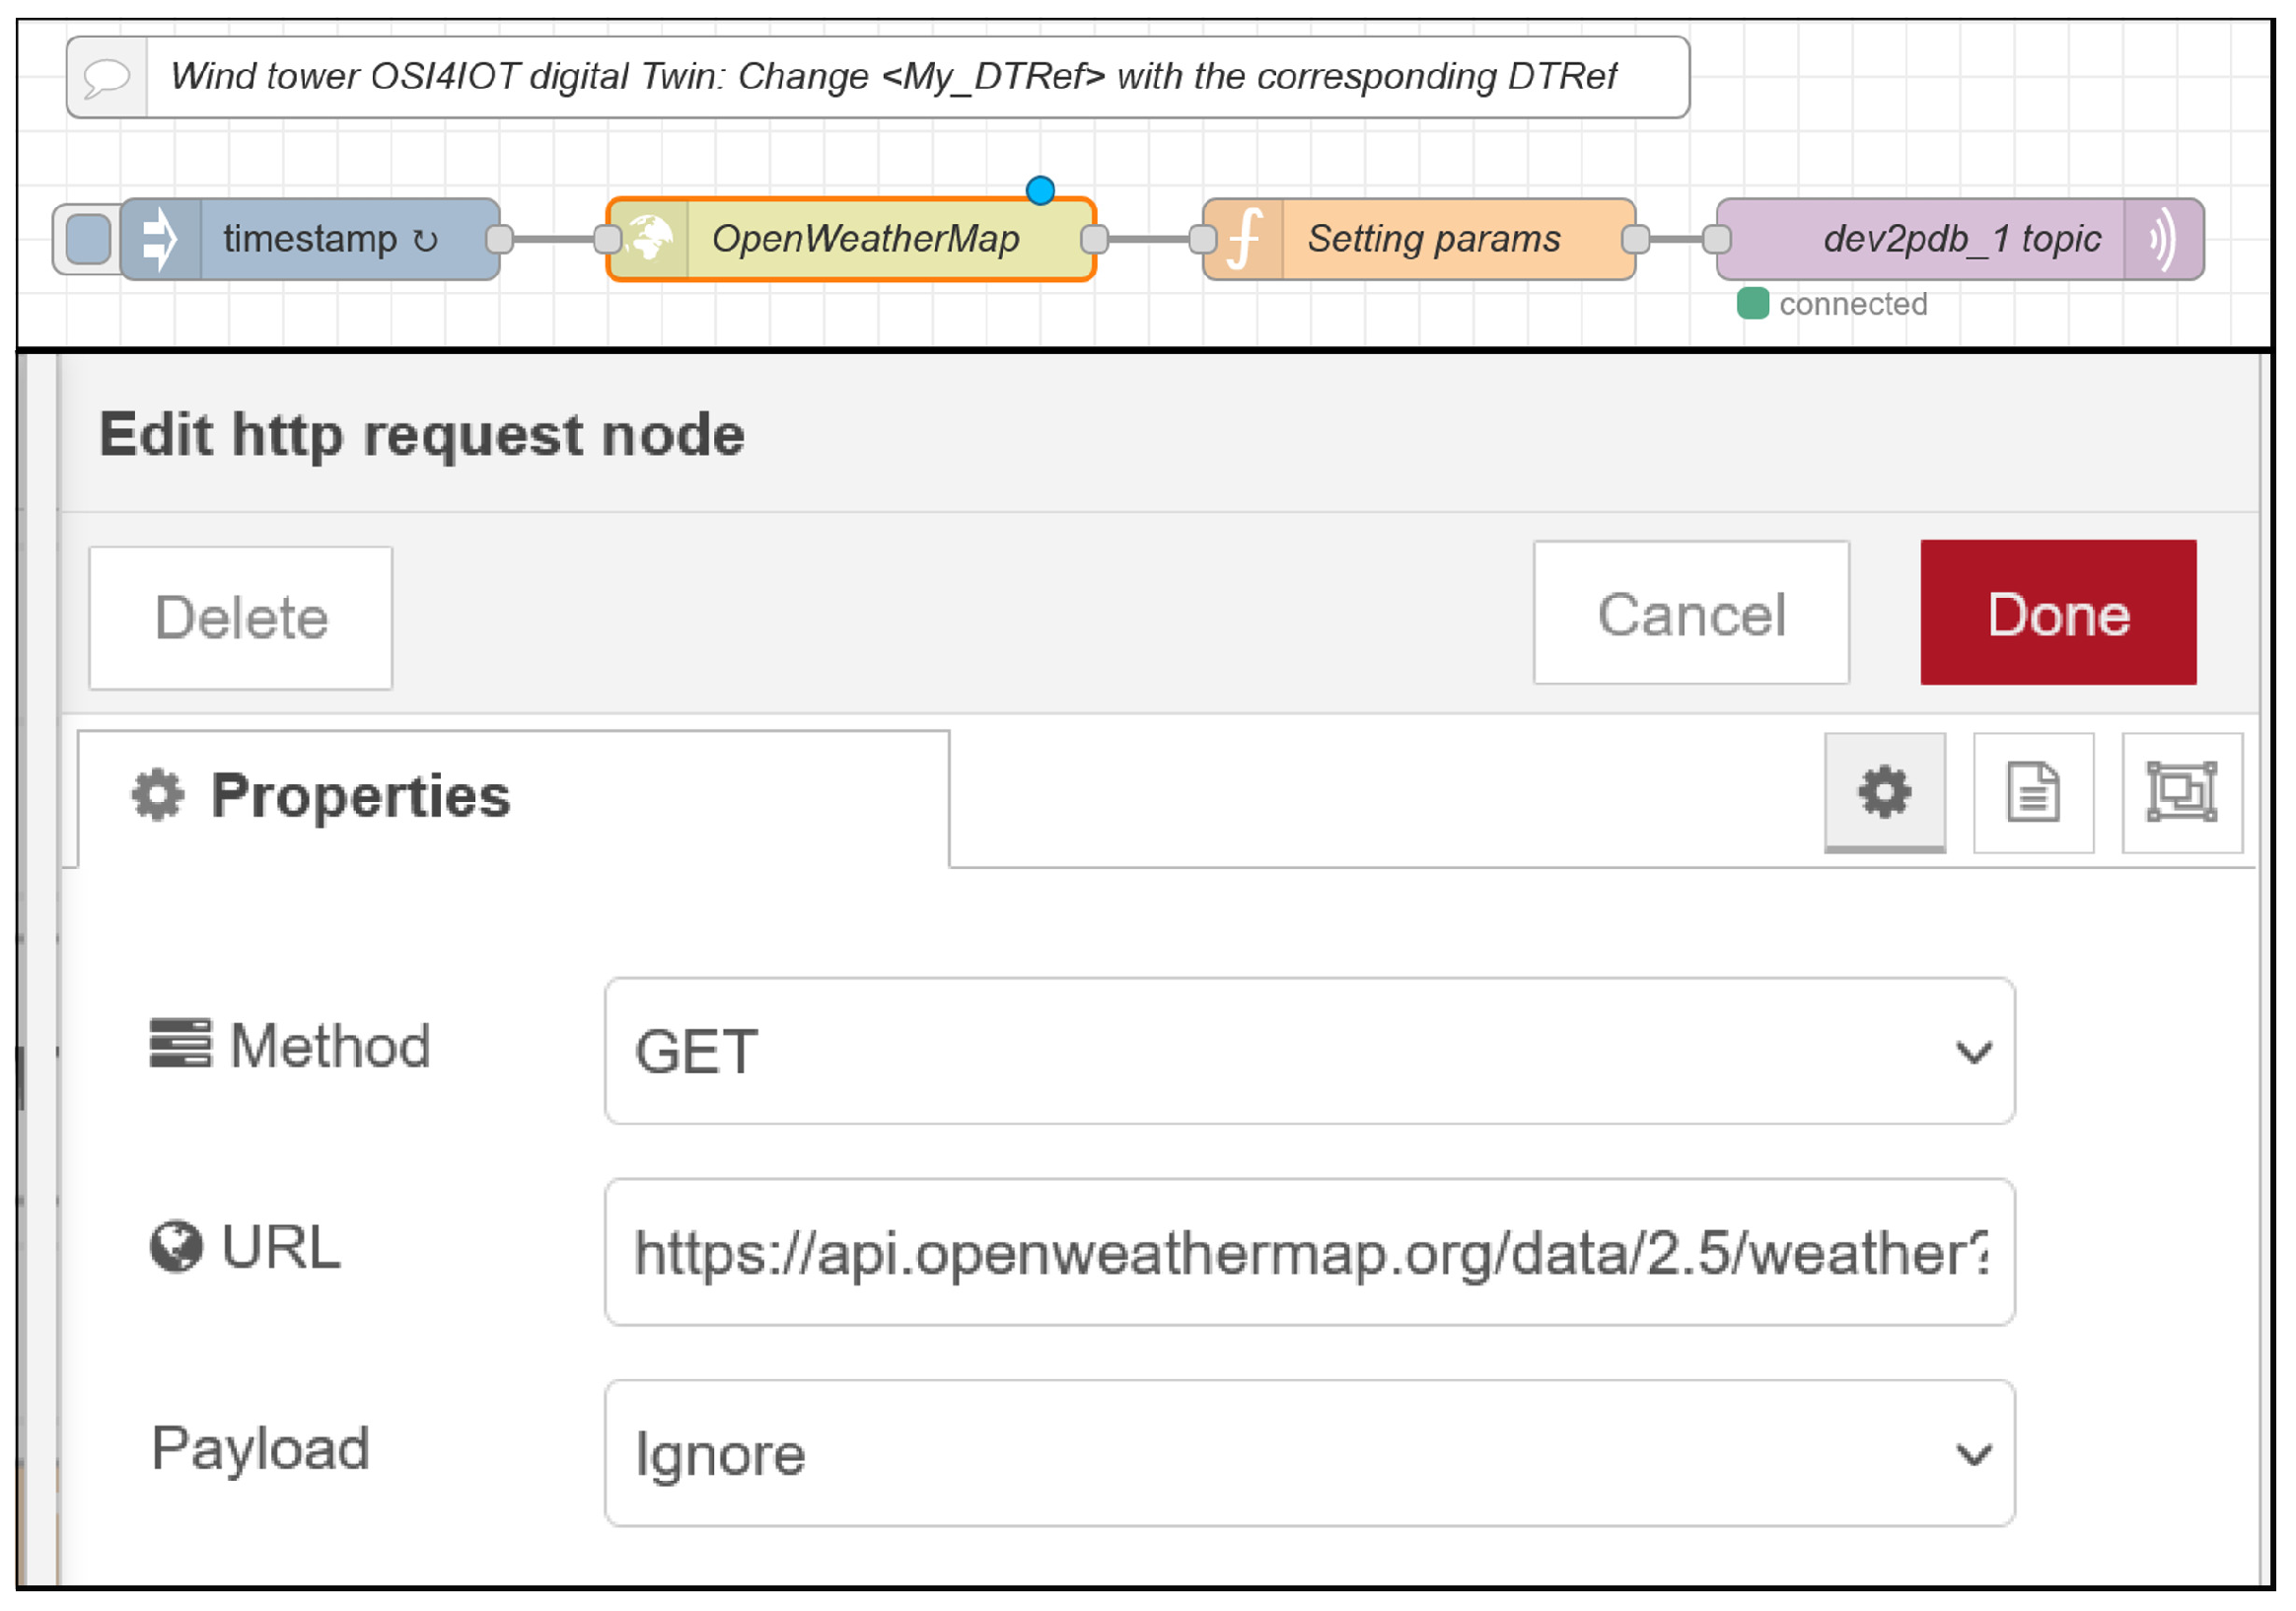
Additionally, the platform supports the inclusion of virtual sensors. The term “virtual sensor” refers to sensors that exist in the digital twin but not in the physical world. For instance, MetOcean data from a buoy can be obtained through an API request, allowing data related to waves, wind, and temperature to be retrieved. In the case of the wind turbine, as illustrated in
Figure 9, a virtual anemometer is created using the integrated Node-RED module. This virtual anemometer retrieves wind speed and wind direction data for the wind turbine through an API request to
https://openweathermap.org/ (accessed on 24 March 2024).
3.2. Remaining Useful Life
The methodology proposed in this paper is based on the finite element method and combined with a fatigue assessment formulation [
12].
3.2.1. Finite Element Method
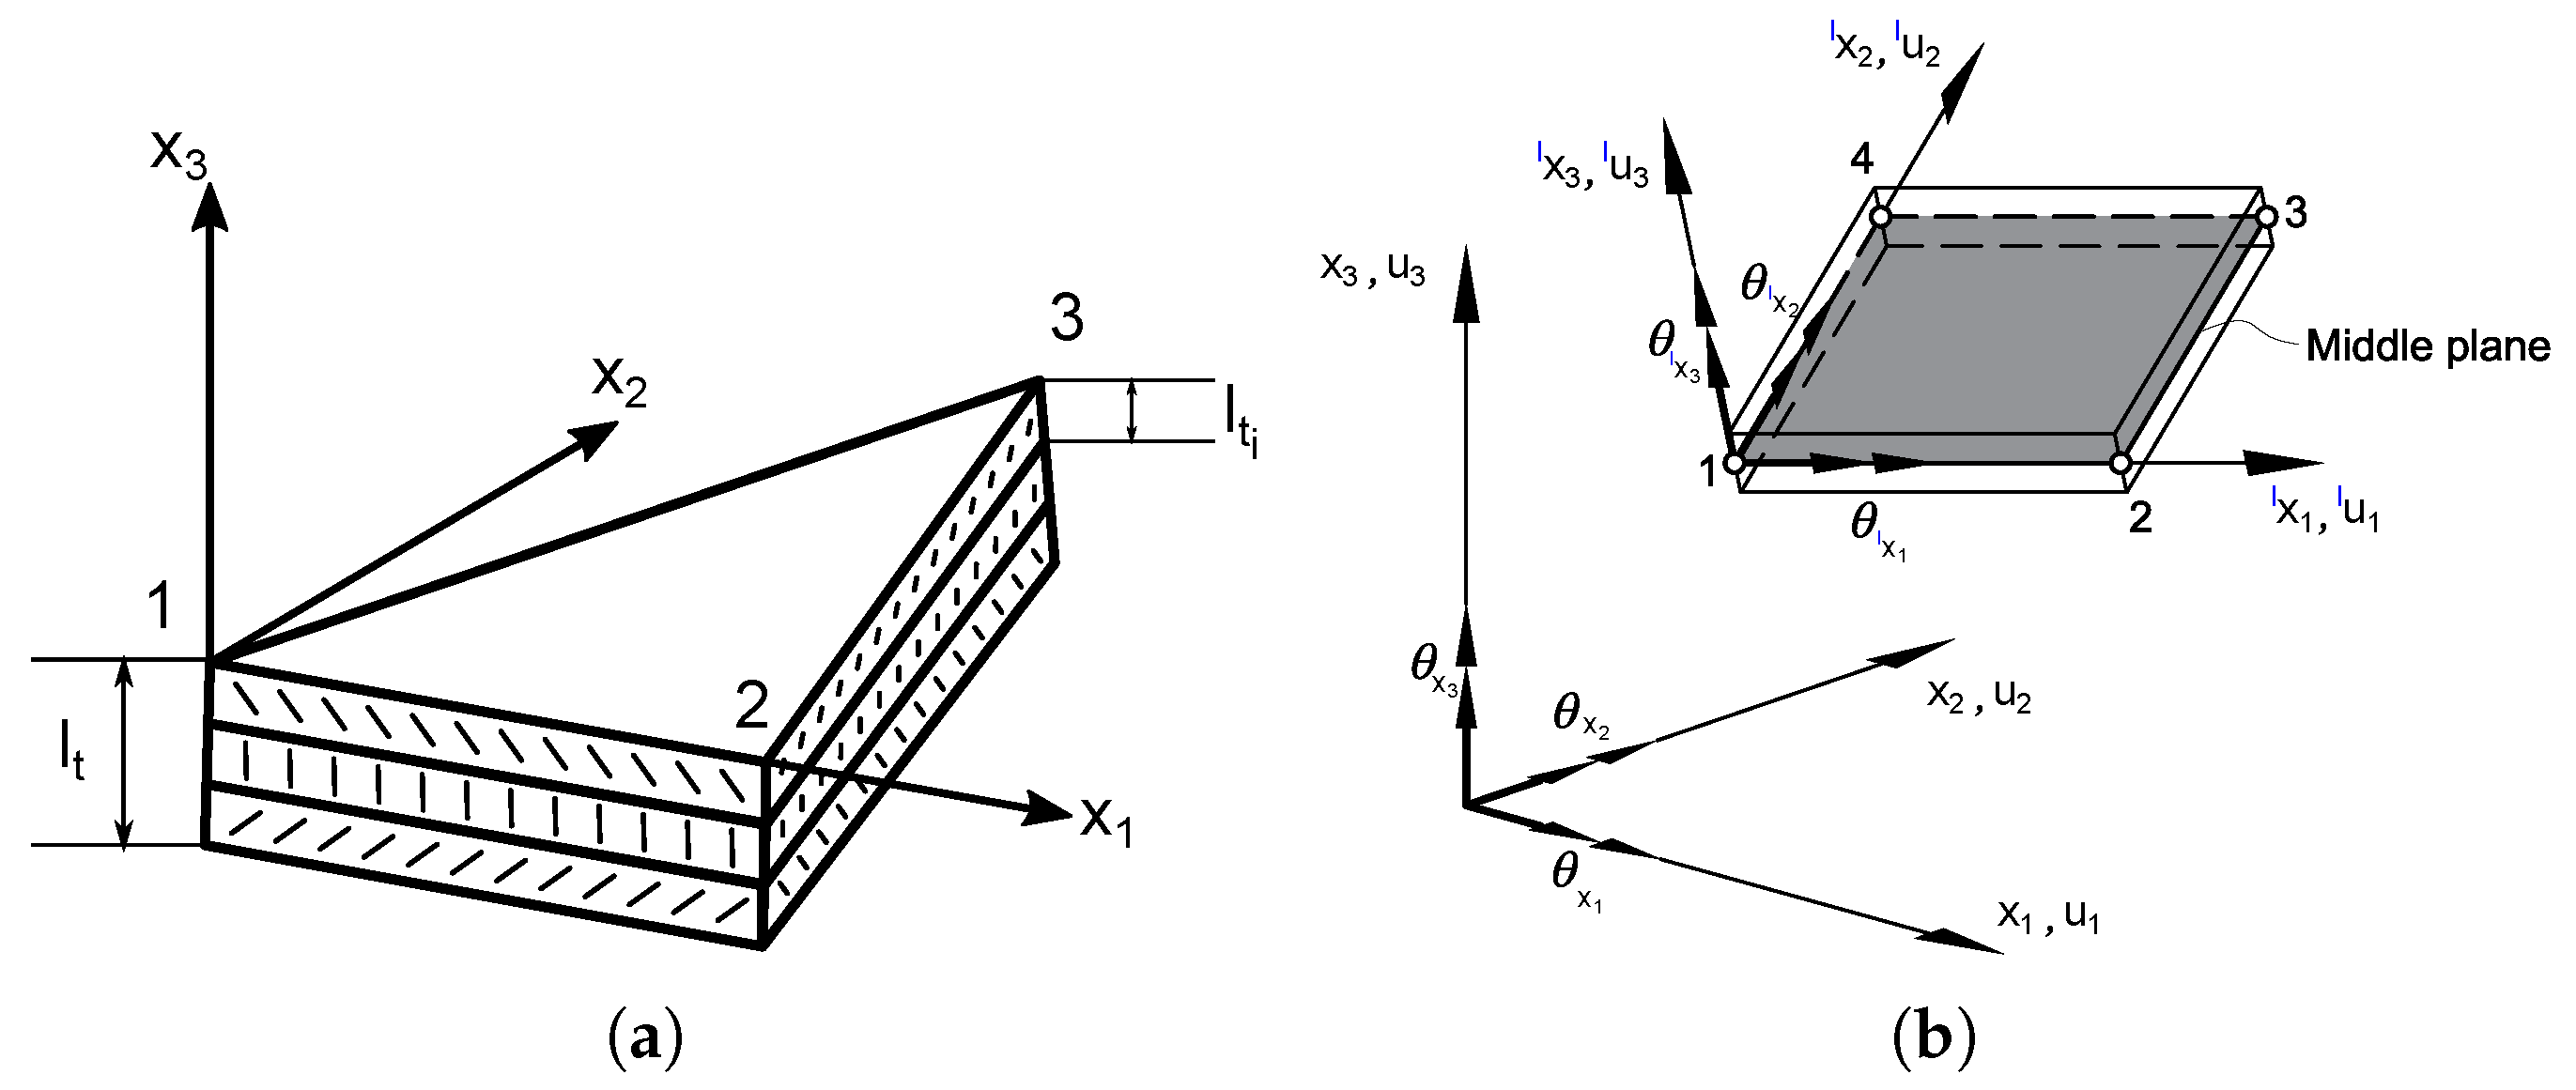
The formulation utilized in the spatial discretization involves linear triangles [
13] and bilinear quadrilaterals [
14] as shown in
Figure 10.
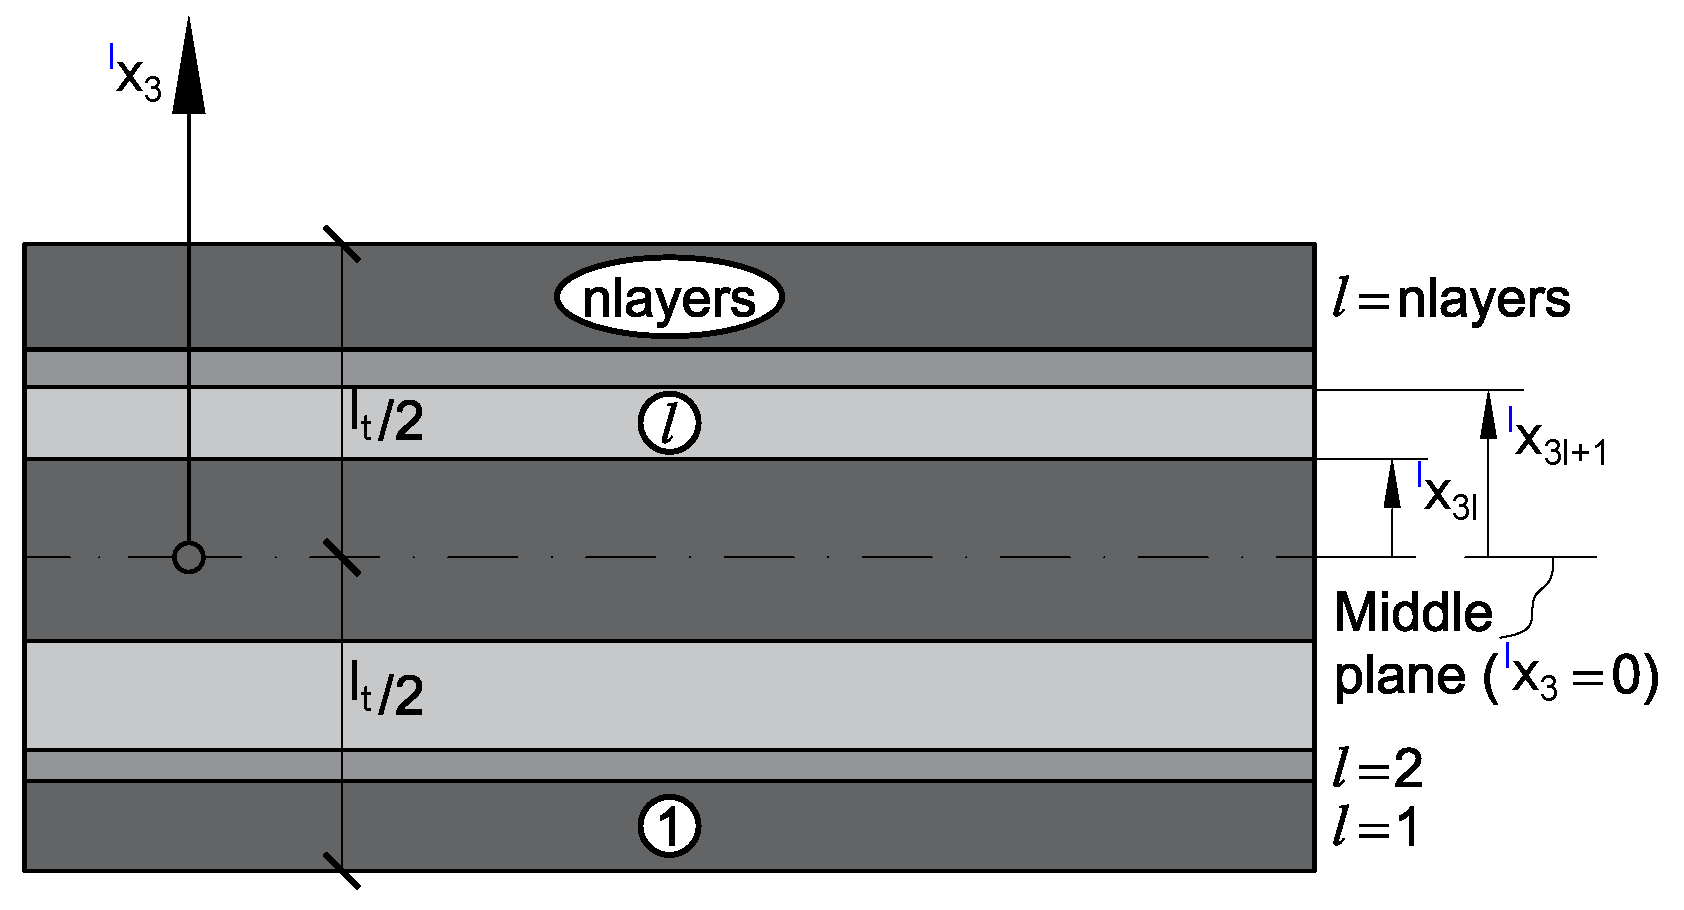
The through-thickness integration is shown in
Figure 11, employing a layerwise approach, given that the materials involved in the simulation are composites.
Another crucial aspect to consider is a method that enables the real-time structural response to be obtained. To achieve this, a reduced-order model (ROM) is integrated according to [
15], and the floating structure employed in the ROM hydroelastic analysis is the public OC4 from the DeepCwind project. The fundamental concepts can be summarized as follows:
- 1.
Assume that the nodal response of the spatial discretization can be represented by a modal basis, as follows:
where
u is the displacement field,
q is the temporal variation of modal amplitudes, and
a is the modal basis.
- 2.
The modal basis can be obtained from the eigendecomposition of the following dynamic problem, where
represents the eigenvalues.
- 3.
Consequently, the entire dynamic equation is as follows:
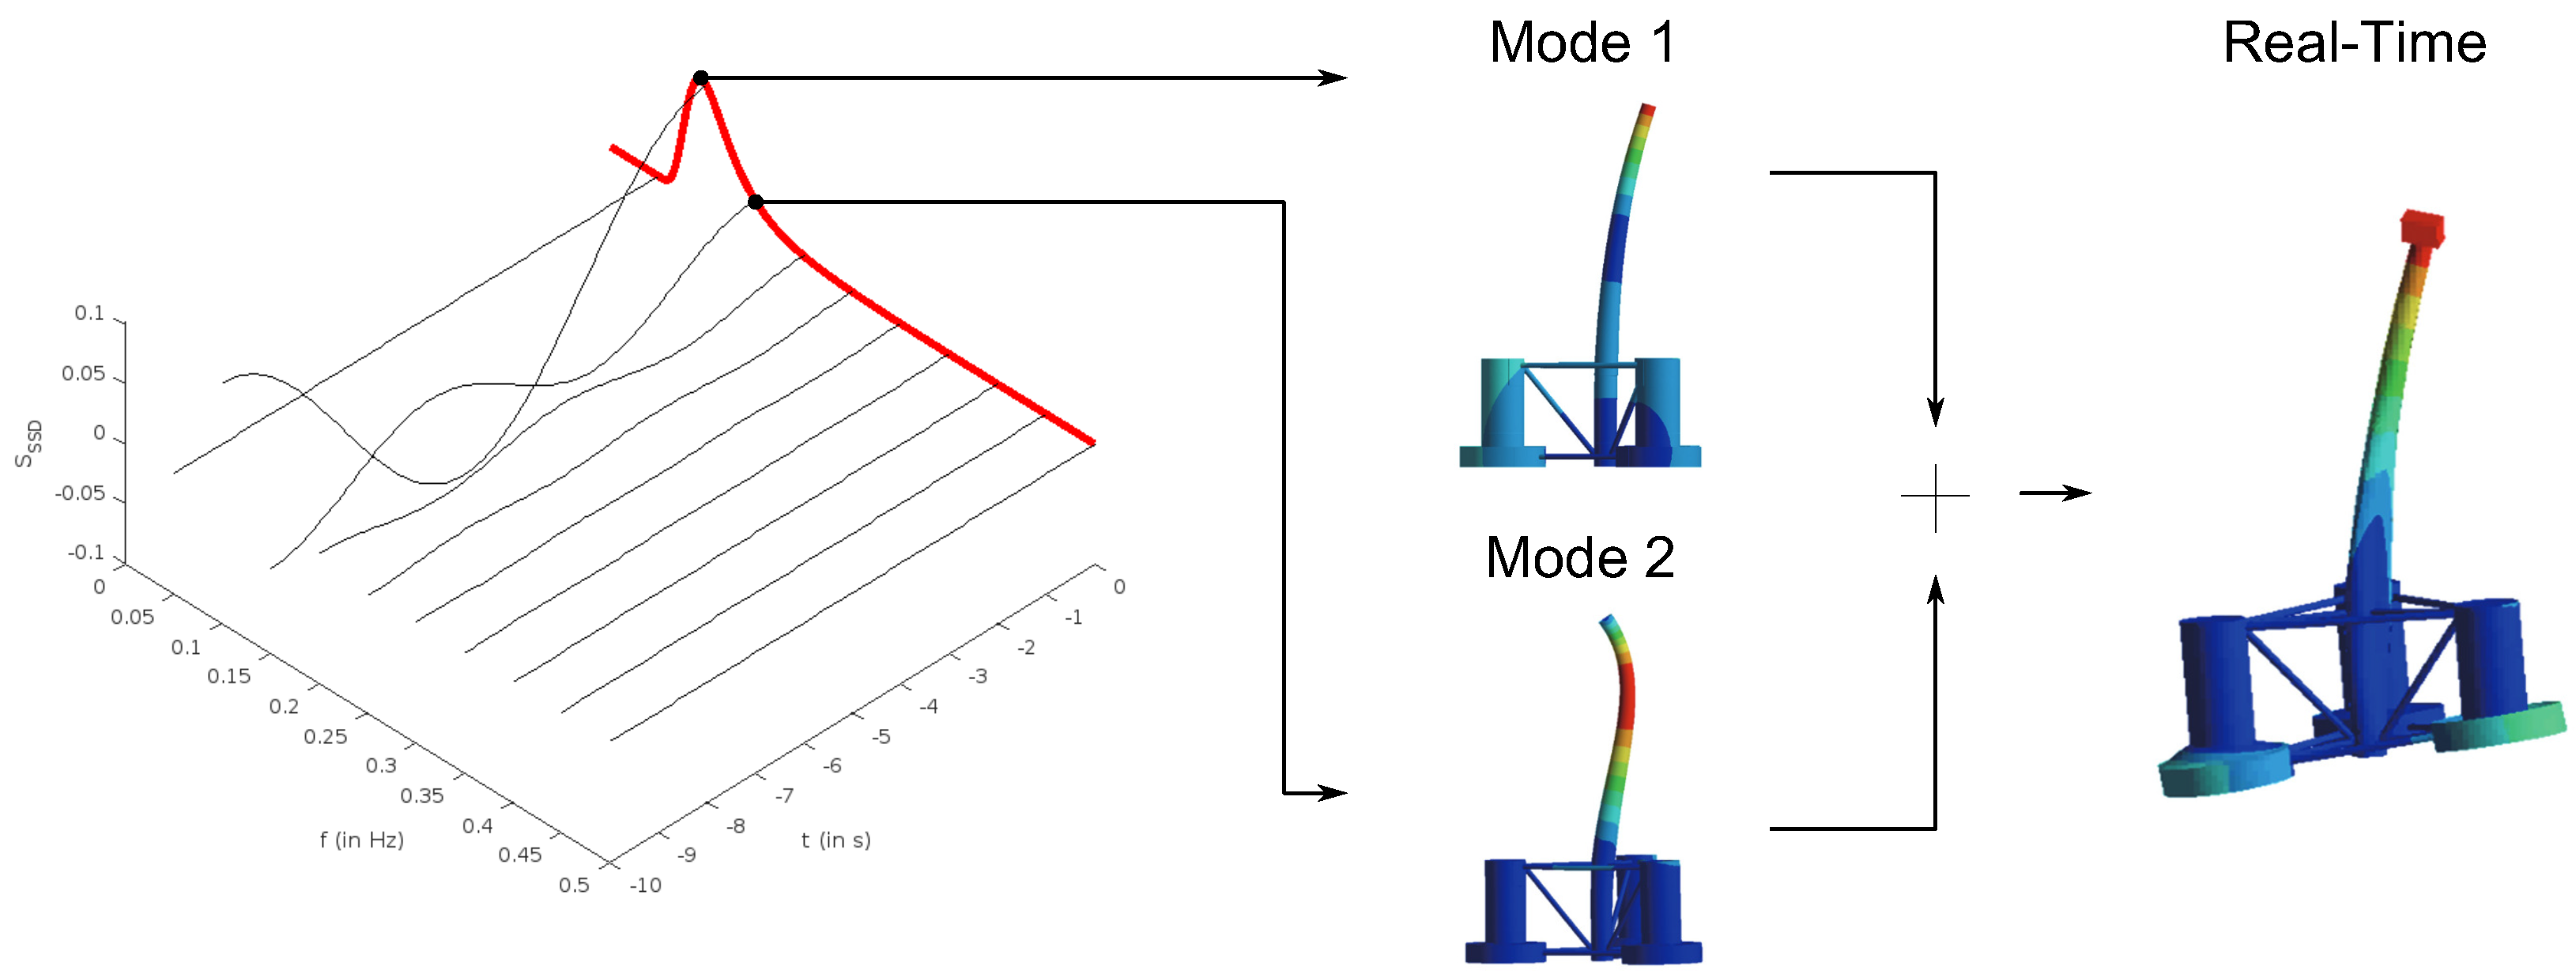
The approach is best described in
Figure 12, where the OC4 deformation modes are given. For a given spectrum, the characteristic modes are computed and stored. Then, with a provided environmental load, the real-time solution can be determined based on the precomputed modes.
3.2.2. Fatigue
The objective of this article is not only to provide a framework that can capture the real-time hydroelastic response of an offshore floating wind turbine (OFWT) but also to predict the life cycle of the OFWT. In order to monitor the life cycle of the structure, a fatigue model proposed by Petiteau and Paboeuf [
12] will be adapted to later obtain the remaining useful life (RUL) index. This model is orthotropic and designed for composite constitutive materials stacked layerwise. Each layer may consist of one or two materials, where one layer represents just a core material and a layer with two materials represents the combination of fiber and matrix materials, respectively.
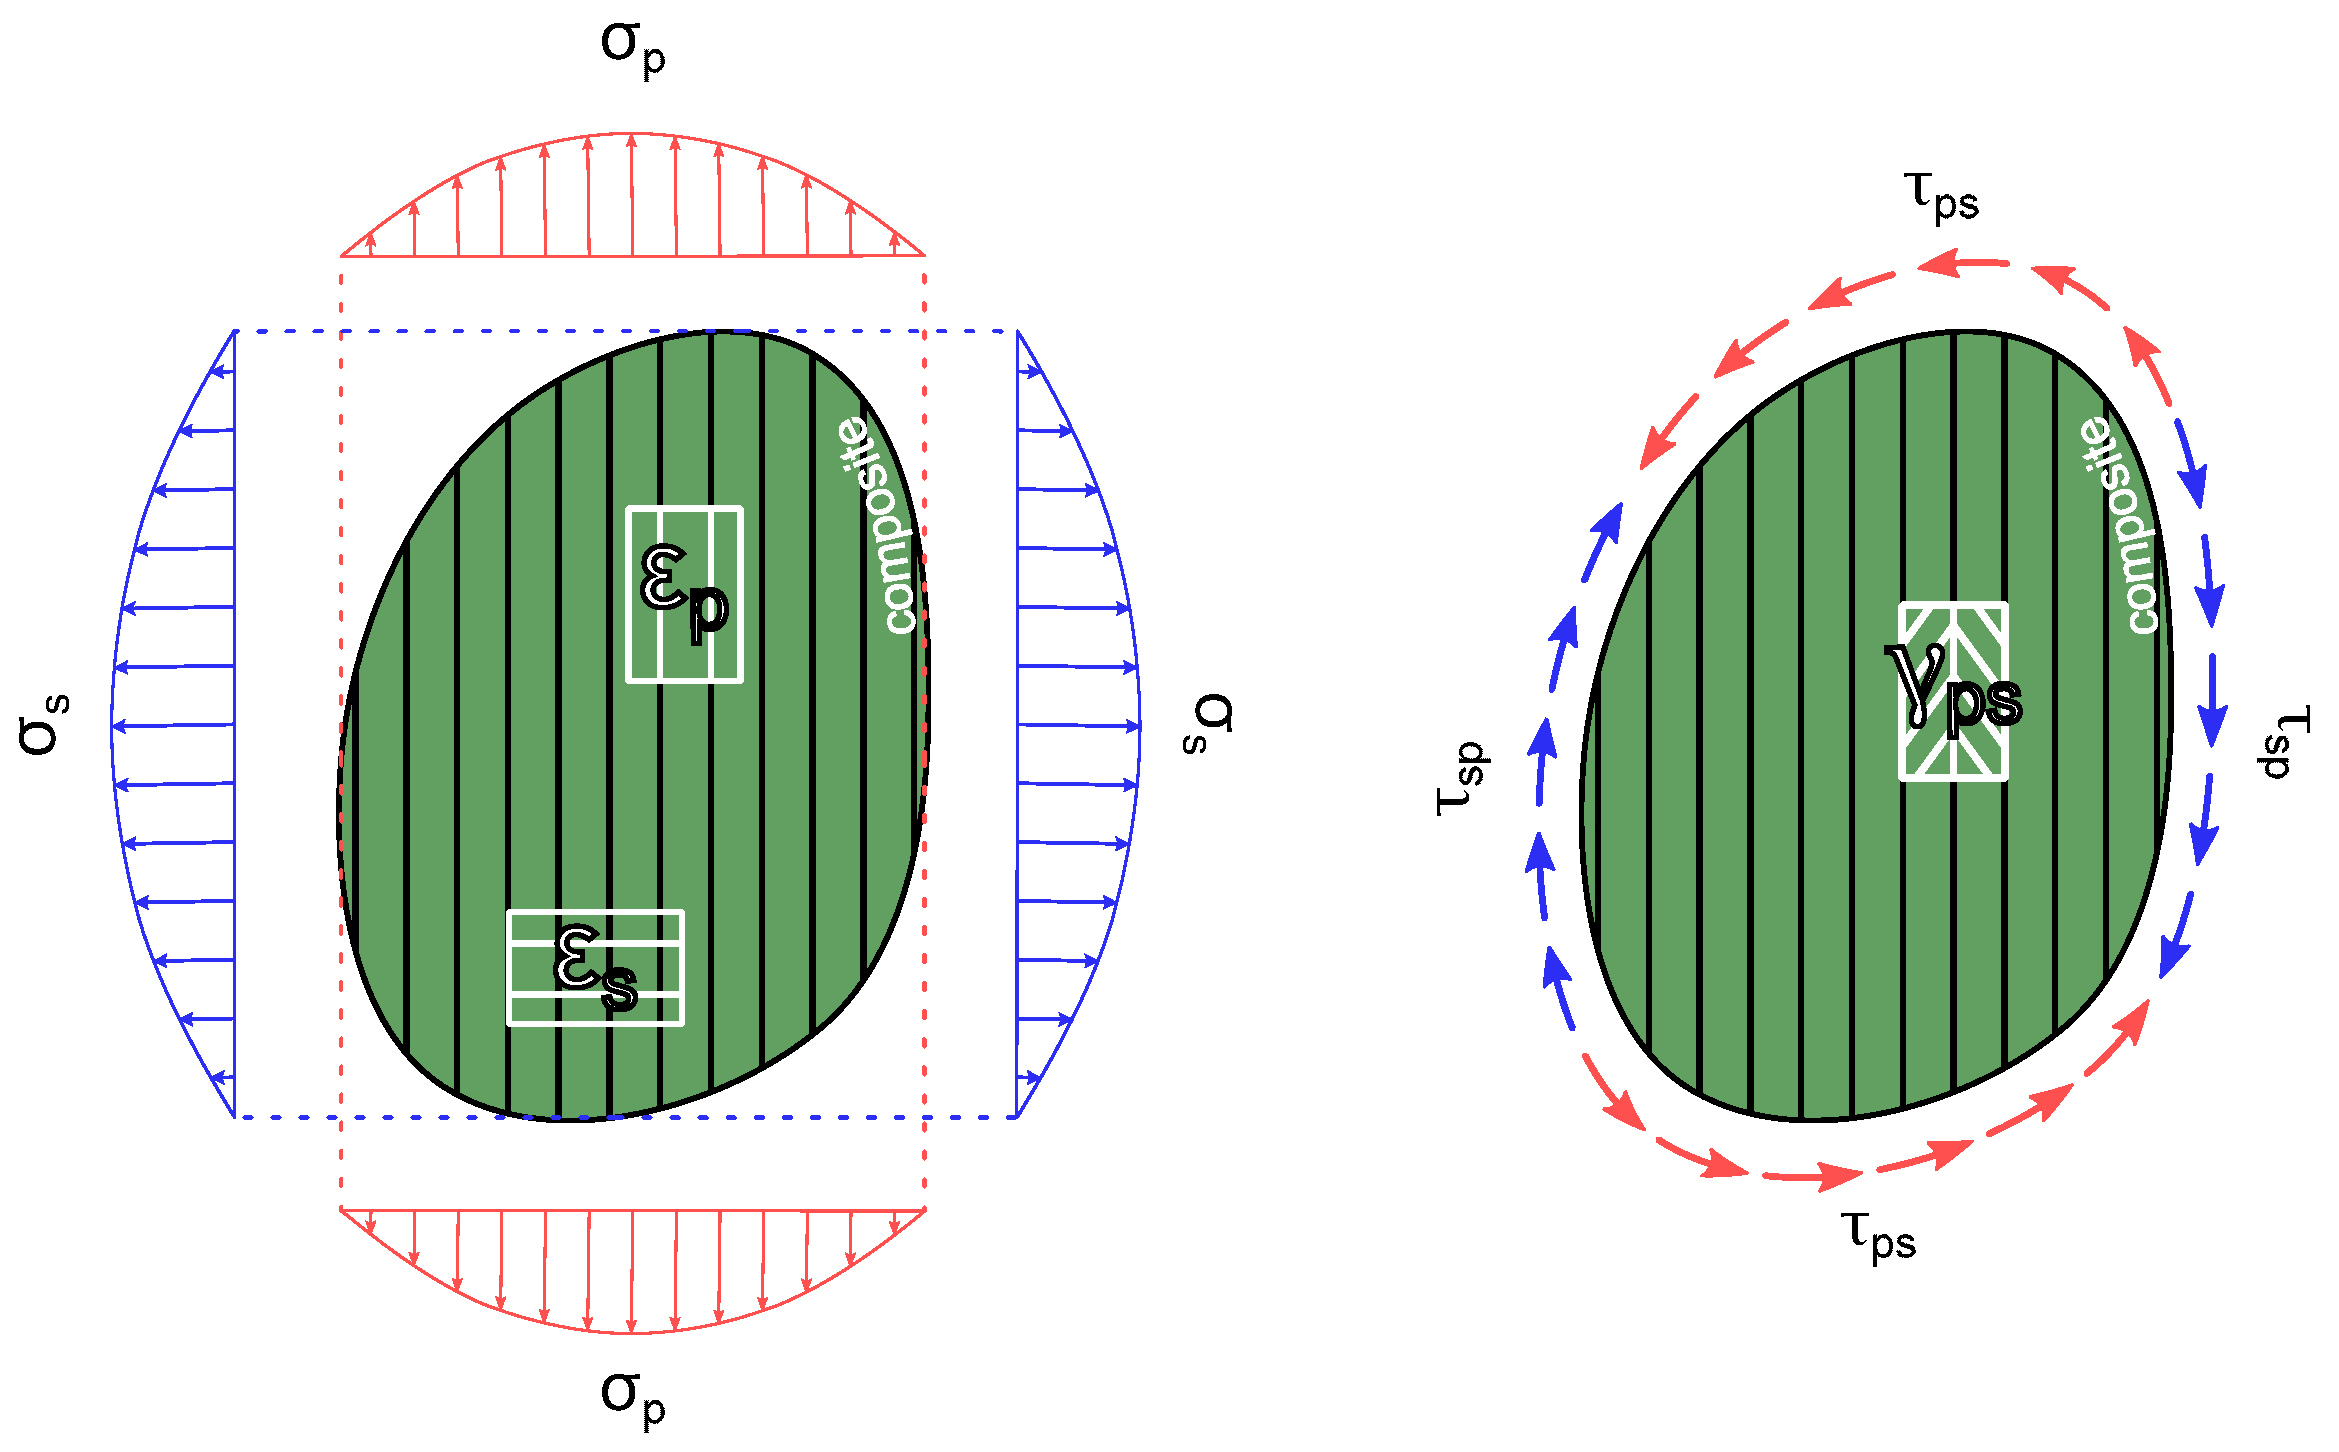
In
Figure 13, the characteristic stresses,
and
, of a laminate layer are presented. These local stresses include the parallel component aligned with the fiber orientation and the serial component orthogonal to the fiber orientation.
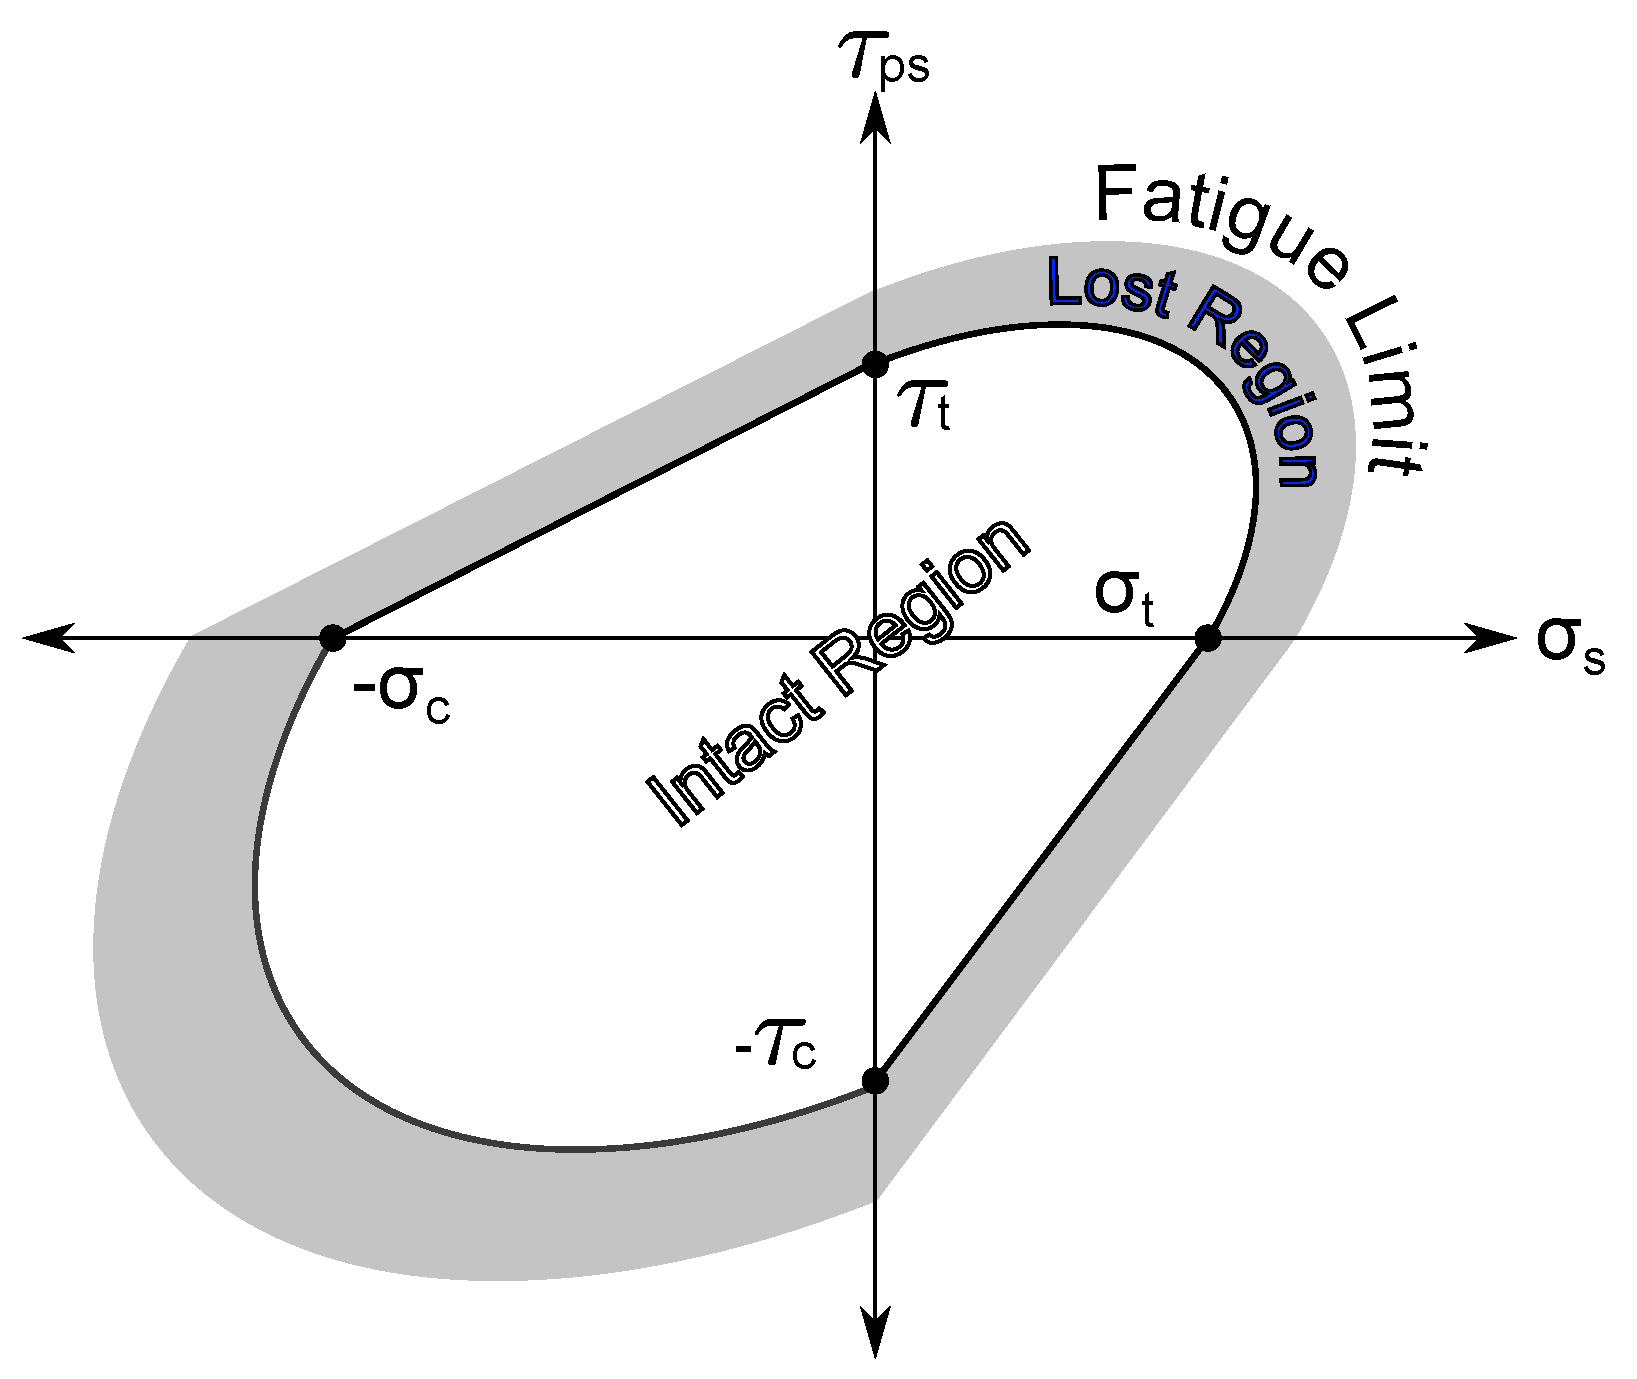
The methodology by Petiteau and Paboeuf primarily focuses on transverse fatigue because the directions perpendicular to the fibers are the weakest. Consequently, a failure envelope rule is proposed for the two weakest stress components: serial stress,
, and in-plane shear stress,
(refer to
Figure 14). The fatigue mechanism employs a similar approach to fluency rules, where the fatigue limit decreases due to the loss of mechanical properties. As the loss region expands, the mechanical limits for in-plane shear and serial stress are reduced. The model also accounts for non-symmetric behavior in compression and tension states, although the in-plane shear is considered symmetric.
The fatigue limit variation is characterized by the S-N curves. However, in the case of orthotropic composite materials, a separate curve must be established for each combination of fiber and matrix, volumetric fraction, and ply orientation. As a result, the extensive experimental characterization required for numerous combinations becomes costly and can be a limitation for the current application of this methodology. On the other hand, the serial–parallel theory [
16] or in short, SPROM, a non-linear constitutive technique, is introduced to obtain the orthotropic behavior of composites based on the isotropic properties of the constituent materials that make up the laminate (fiber and matrix). By employing this approach, it is necessary to characterize only the S-N curves in the parallel (0°) and serial (90°) directions.
The serial–parallel rule of mixtures (SPROM) can be succinctly described as follows:
Similar to the behavior described in
Figure 13, the behavior of a laminate ply is characterized by its serial and parallel components, where stresses (
) and deformations (
) can be described as follows:
Compatibility equations, also known as the Reuss–Voigt hypothesis [
17,
18], are defined as follows:
The theory employs the rule of mixtures (ROM), where
represents the volumetric fraction.
Consequently, the transverse serial stress of the fiber must be equal to that of the matrix (Equation (
5)). Combined with Equation (
6), this poses a minimization problem. This results in a formulation where both the serial and parallel stresses depend on the deformation of the matrix phase. If the constitutive model is elastic, then the classical orthotropic constitutive matrix is obtained. The advantage of the SPROM is that it allows for simulating damage (non-linear constitutive models) based on the damage rheology of its fiber and matrix phases.
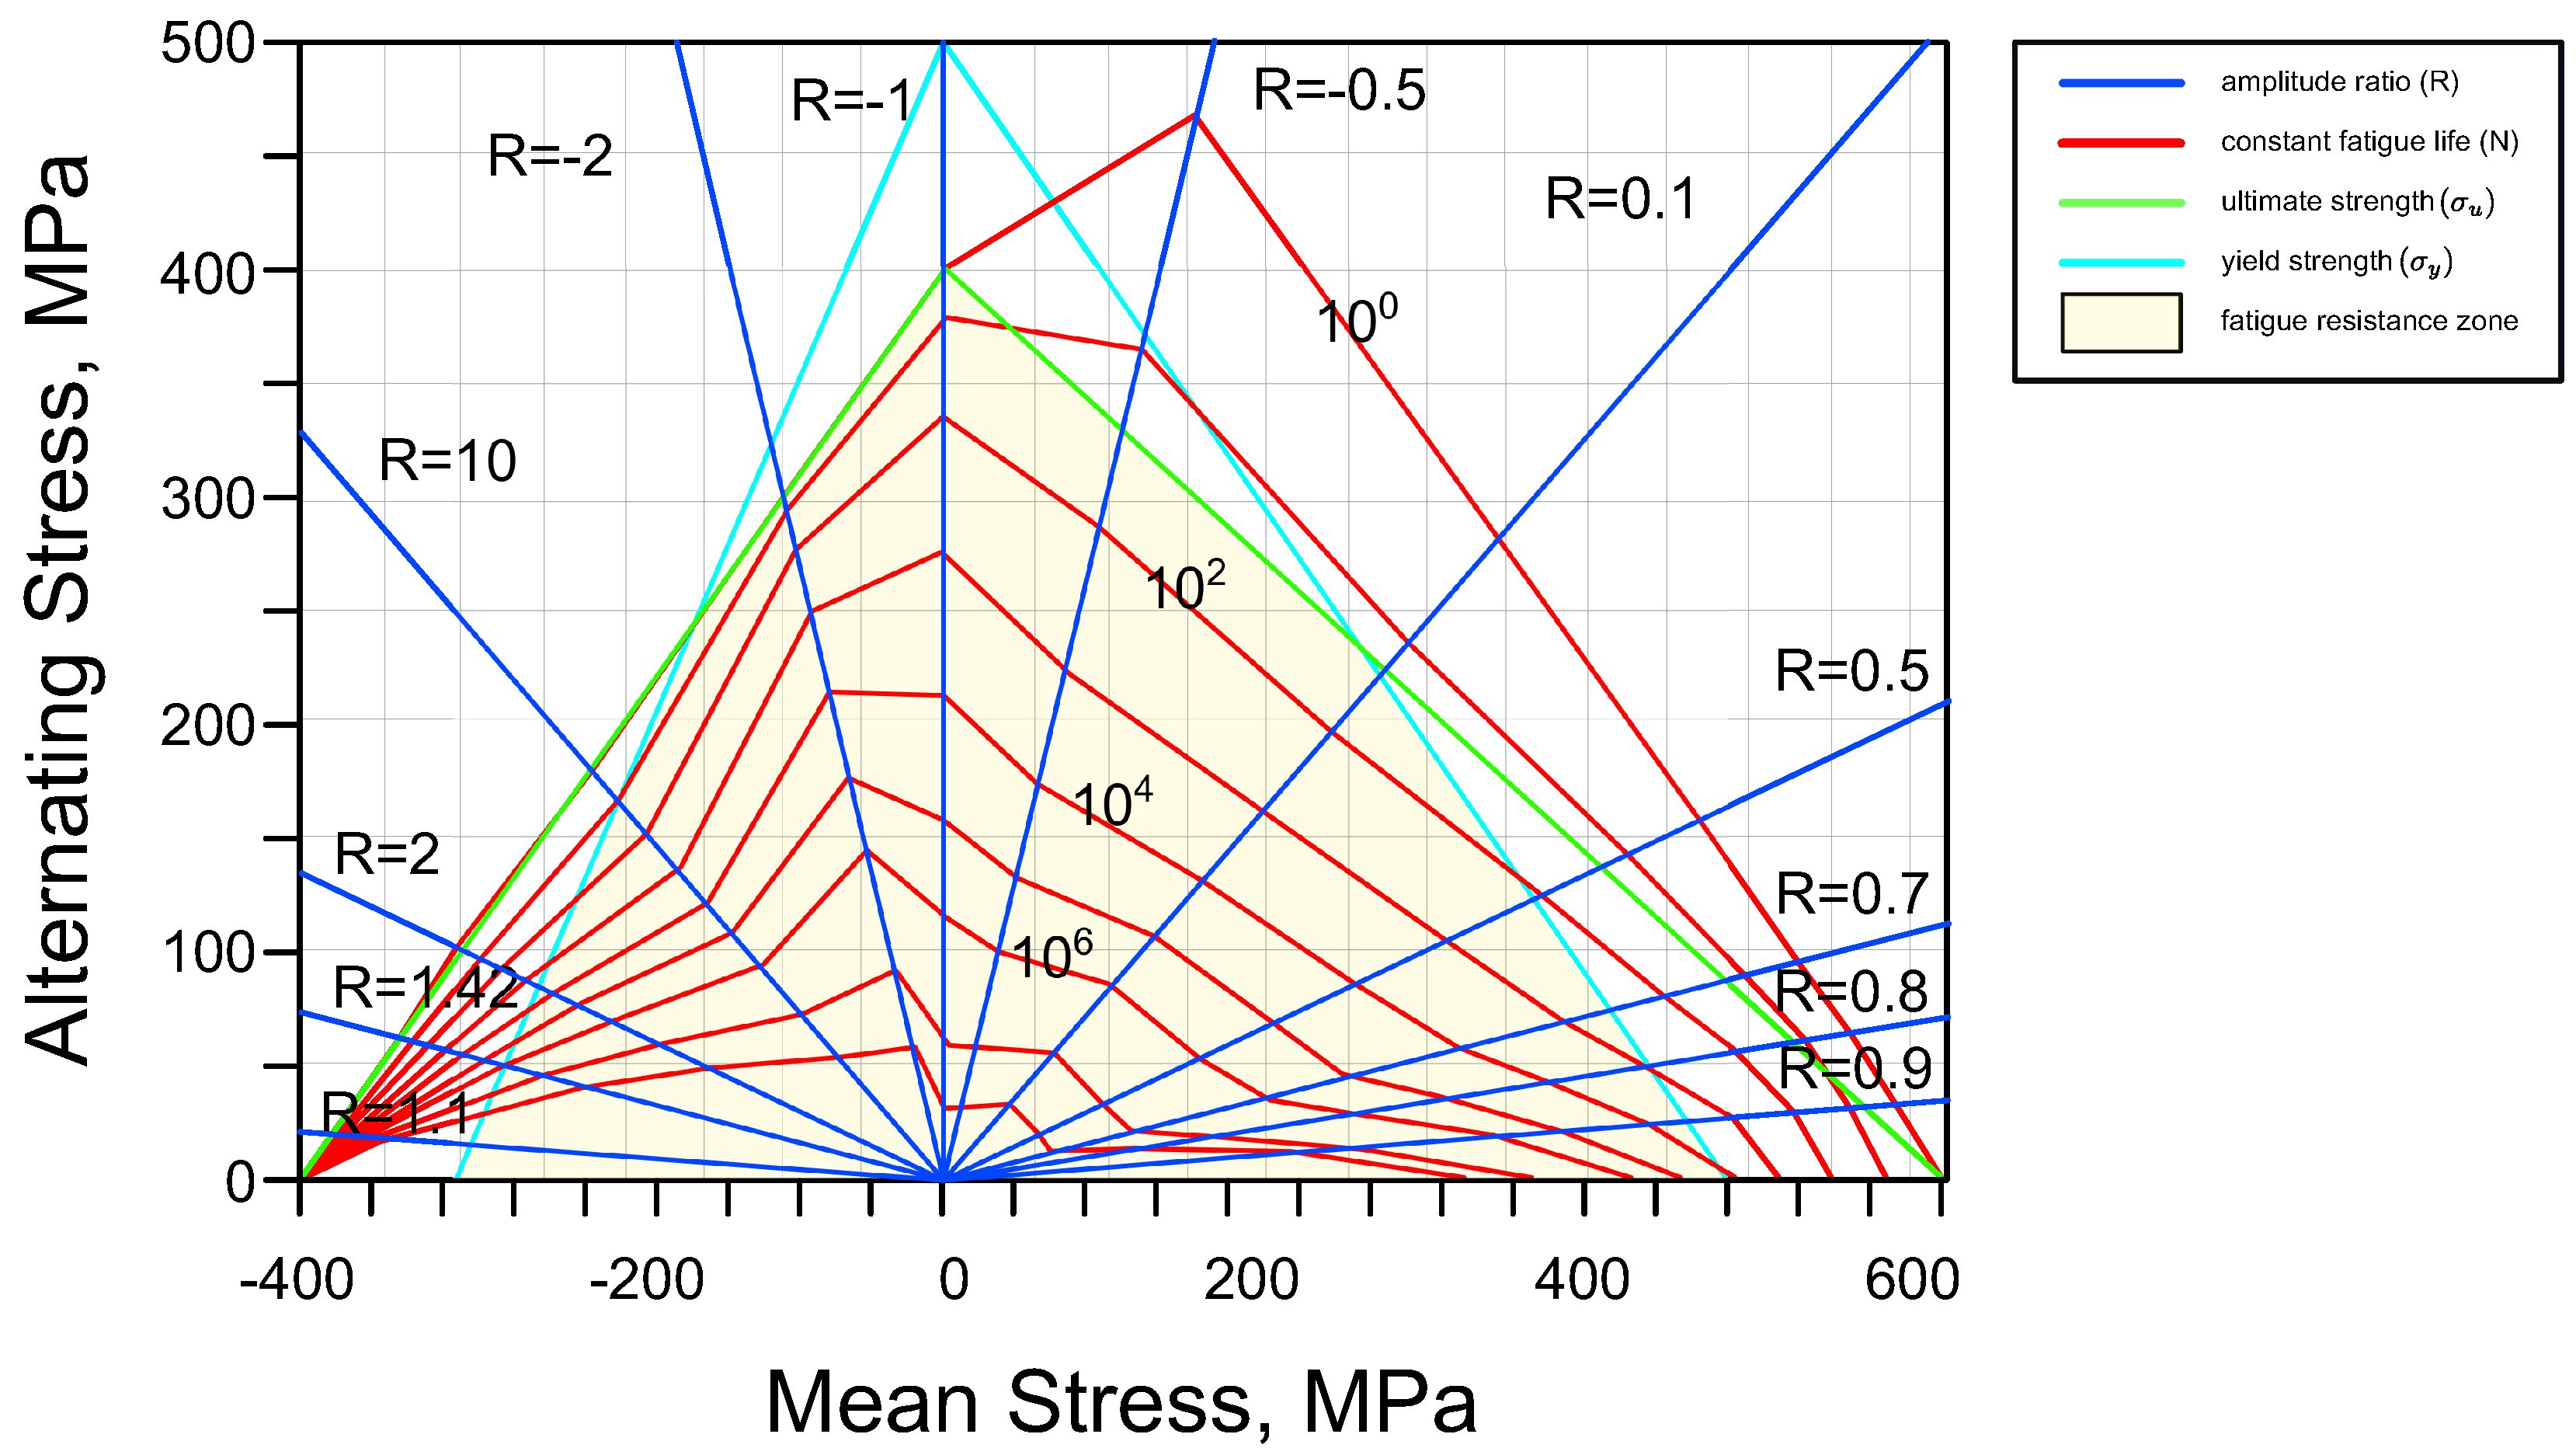
The S-N curves can also be utilized to construct the constant fatigue life (CFL) diagram, which provides information about the maximum number of cycles (
N) for a given mean stress (
), alternating stress (
), and amplitude ratio (
R) as shown in
Figure 15.
The amplitude ratio, mean stress, and alternating stress are defined in terms of the minimum stress (
) and maximum stress (
).
The Palmgren–Miner rule, as described in [
20,
21], is employed to evaluate the cumulative damage experienced by the material.
where
D represents the damage index,
i is the index of a cyclic interval,
k is the total number of cyclic intervals,
stands for the number of cycles, and
represents the total number of cycles until fatigue rupture.
A stress history is recorded, and a cycle-counting algorithm is employed to evaluate the damage to a laminate layer at the Gauss point level. In marine applications, it is common to use a rainflow algorithm with three points or four points to count the cycles, and utilize the cumulative damage estimation to determine the remaining useful life (RUL) [
22]. In this case, the cumulative damage estimation can be obtained using Equation (
10). The accumulated damage is linear, although there are formulations that incorporate a non-linear additive effect [
23], particularly in the context of wind turbines.
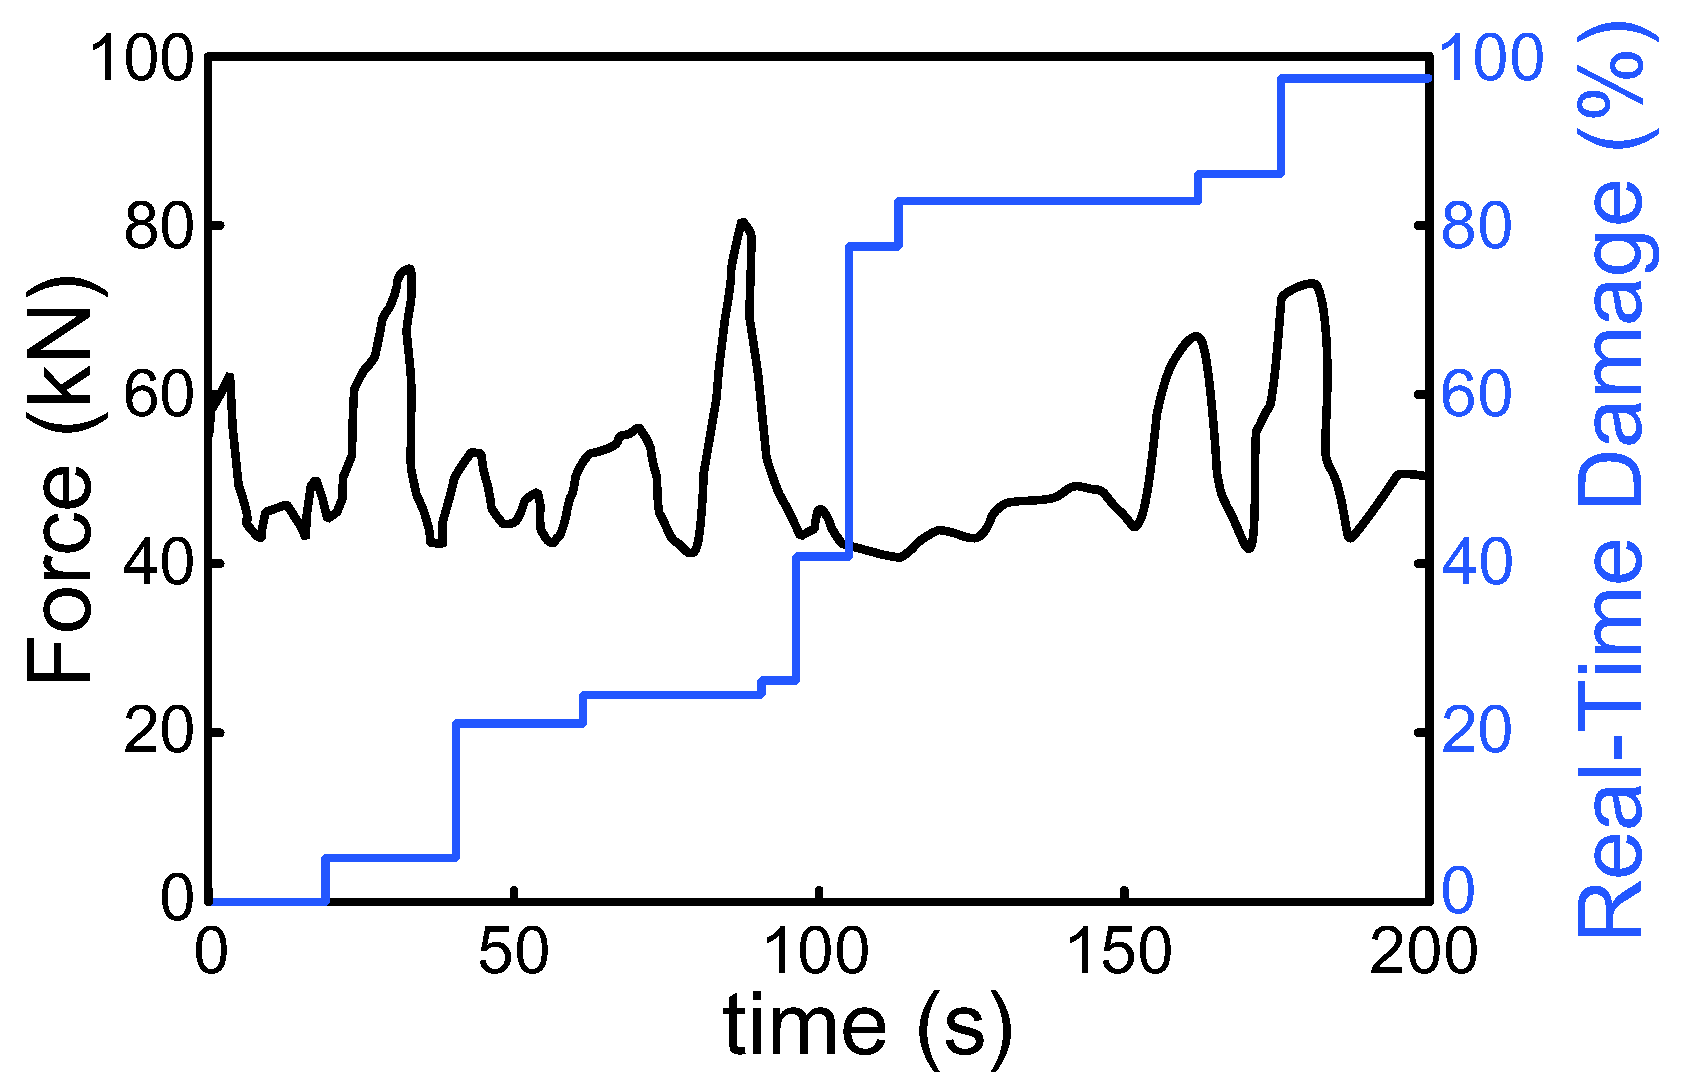
As fatigue is calculated at the Gauss point level, for each ply of the laminate, it is crucial to employ a real-time cycle-counting strategy (refer to
Figure 16). To address this challenge, various algorithms have been proposed either in incremental form [
24] or in combination with memory-reducing techniques [
25].
3.2.3. Summary
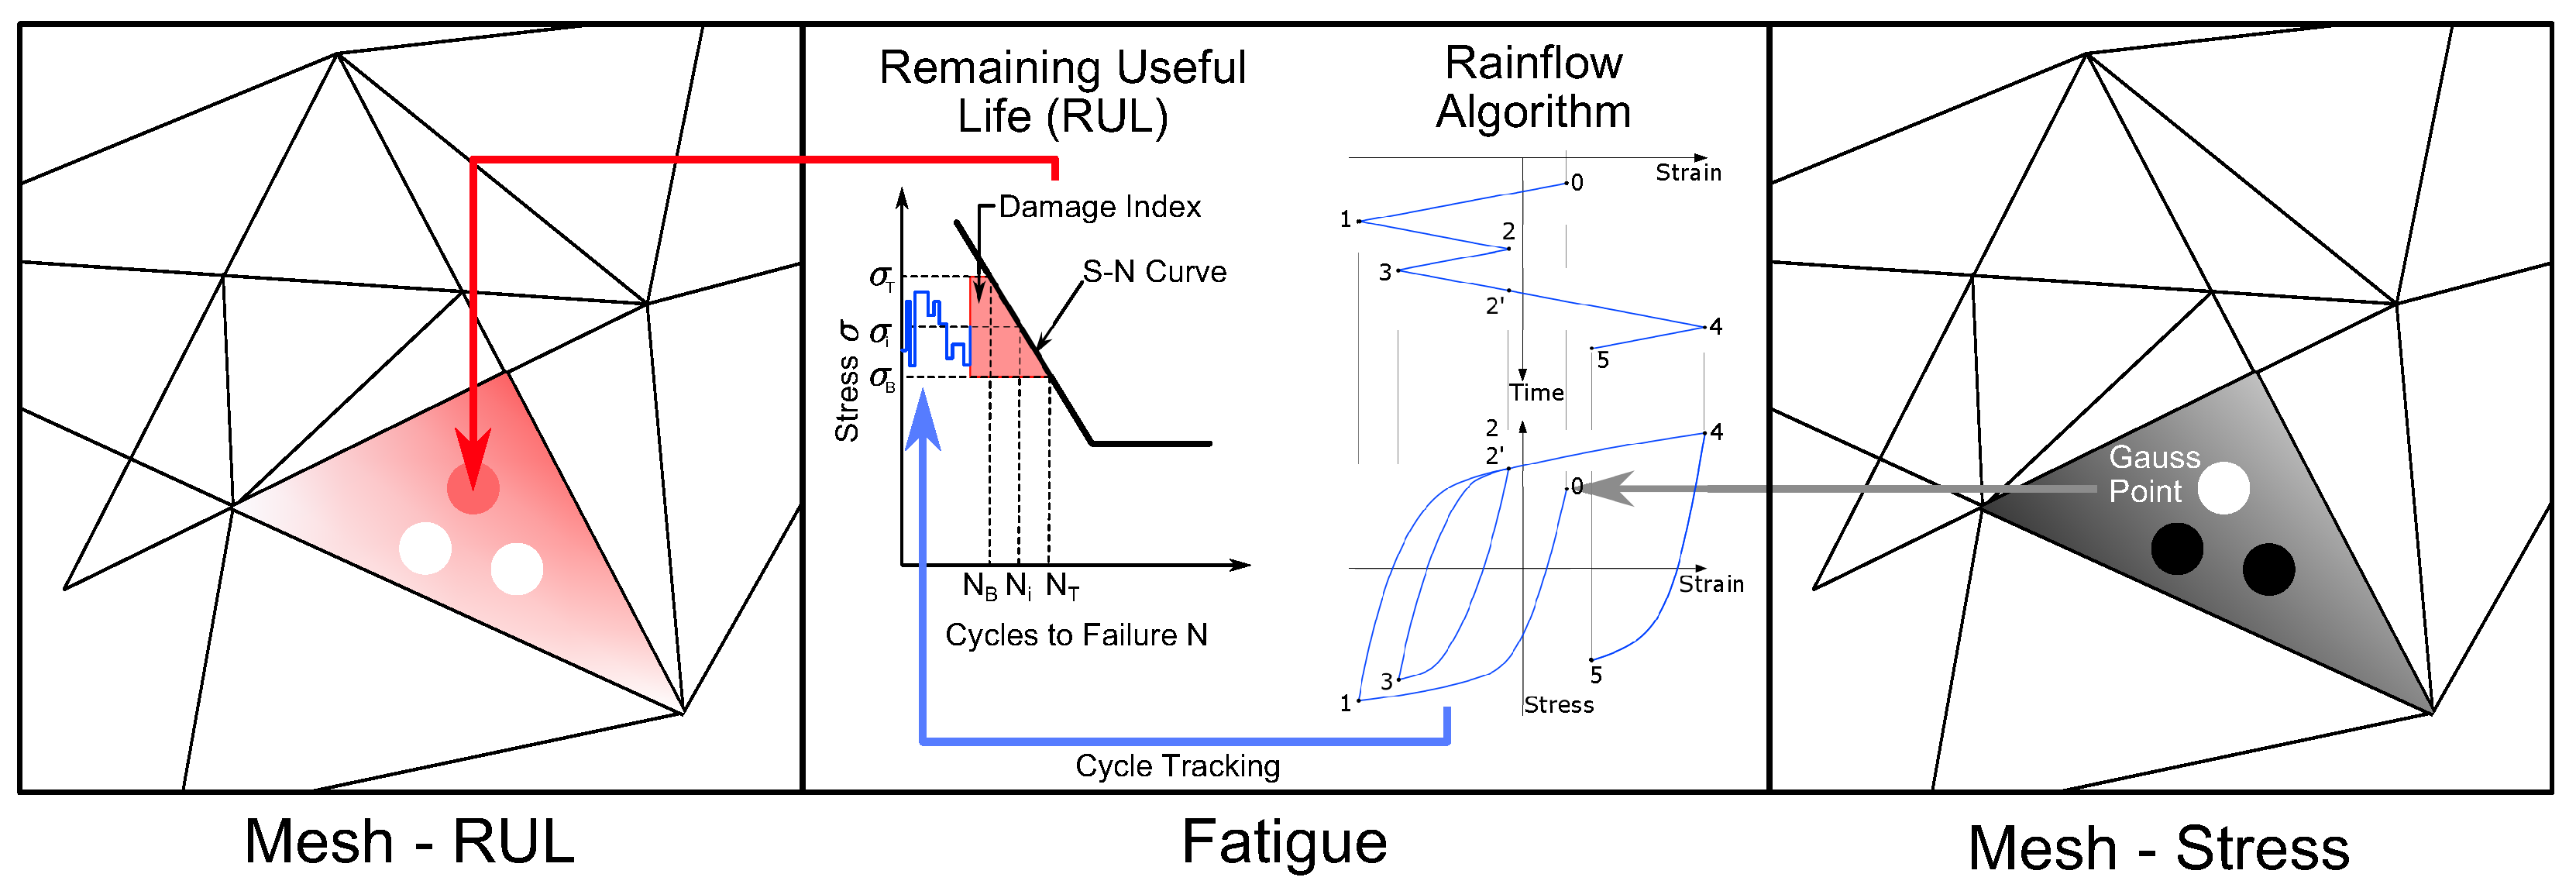
In
Figure 17, the methodology is summarized. The primary objective of this paper is to demonstrate the monitoring of an offshore wind turbine. To effectively track the life cycle of the structure, the concept of remaining useful life (RUL) will be utilized. The methodology to obtain the RUL is described as follows:
Utilizing a finite element method approach to obtain the stress history at the Gauss point level.
Implementing a cycle-counting algorithm, such as the rainflow algorithm, adapted to avoid excessive data storage and to enable real-time cycle prediction.
Applying a fatigue damage model, such as the Palmgren–Miner rule, to establish the RUL metric.
Therefore, the stresses at each Gauss point are tracked, which are then post-processed using an optimized cycle-counting algorithm. This returns the number of cycles at different ranges, which is used to obtain the RUL index for the given constitutive properties of the material model (CFL diagram). In this case, a simple Palmgren–Miner rule is used to obtain the index of damage that goes from 0% to 100%. This information is obtained at each Gauss point and integrated through the thickness to be seen for each element. This damage index can be used together with a threshold to perform maintenance once a region has undergone a significant damage threshold.
4. Showcase
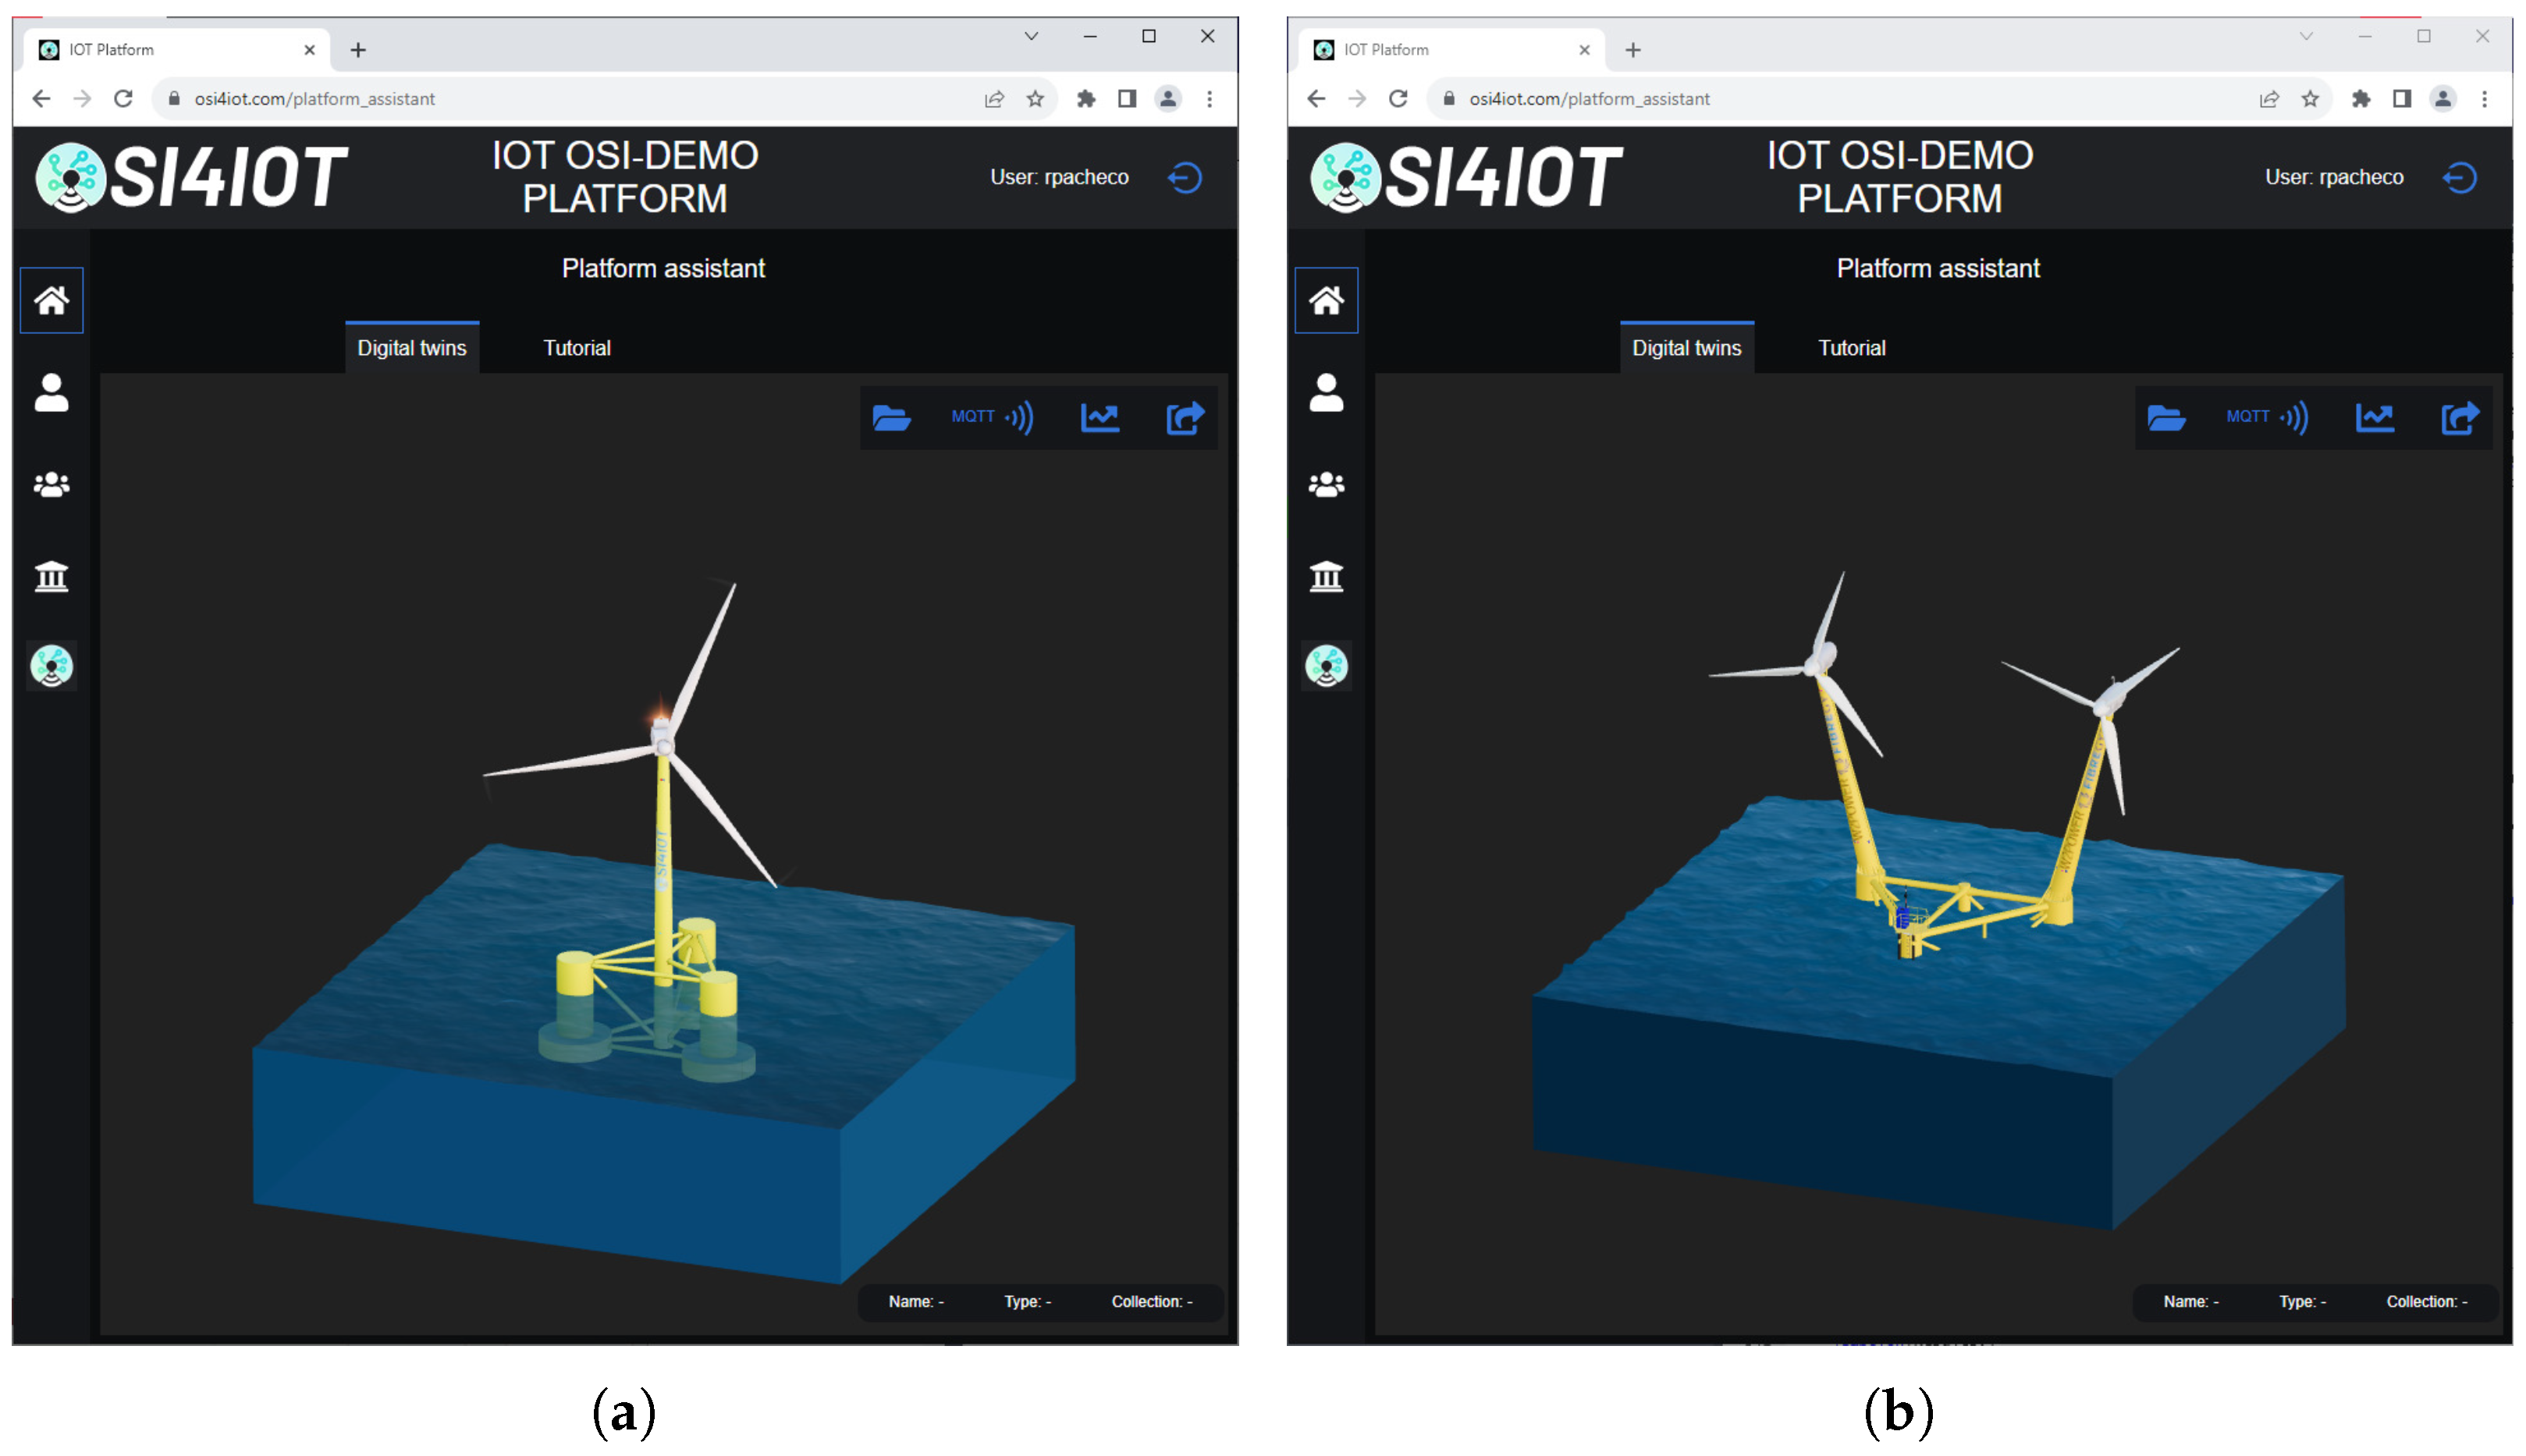
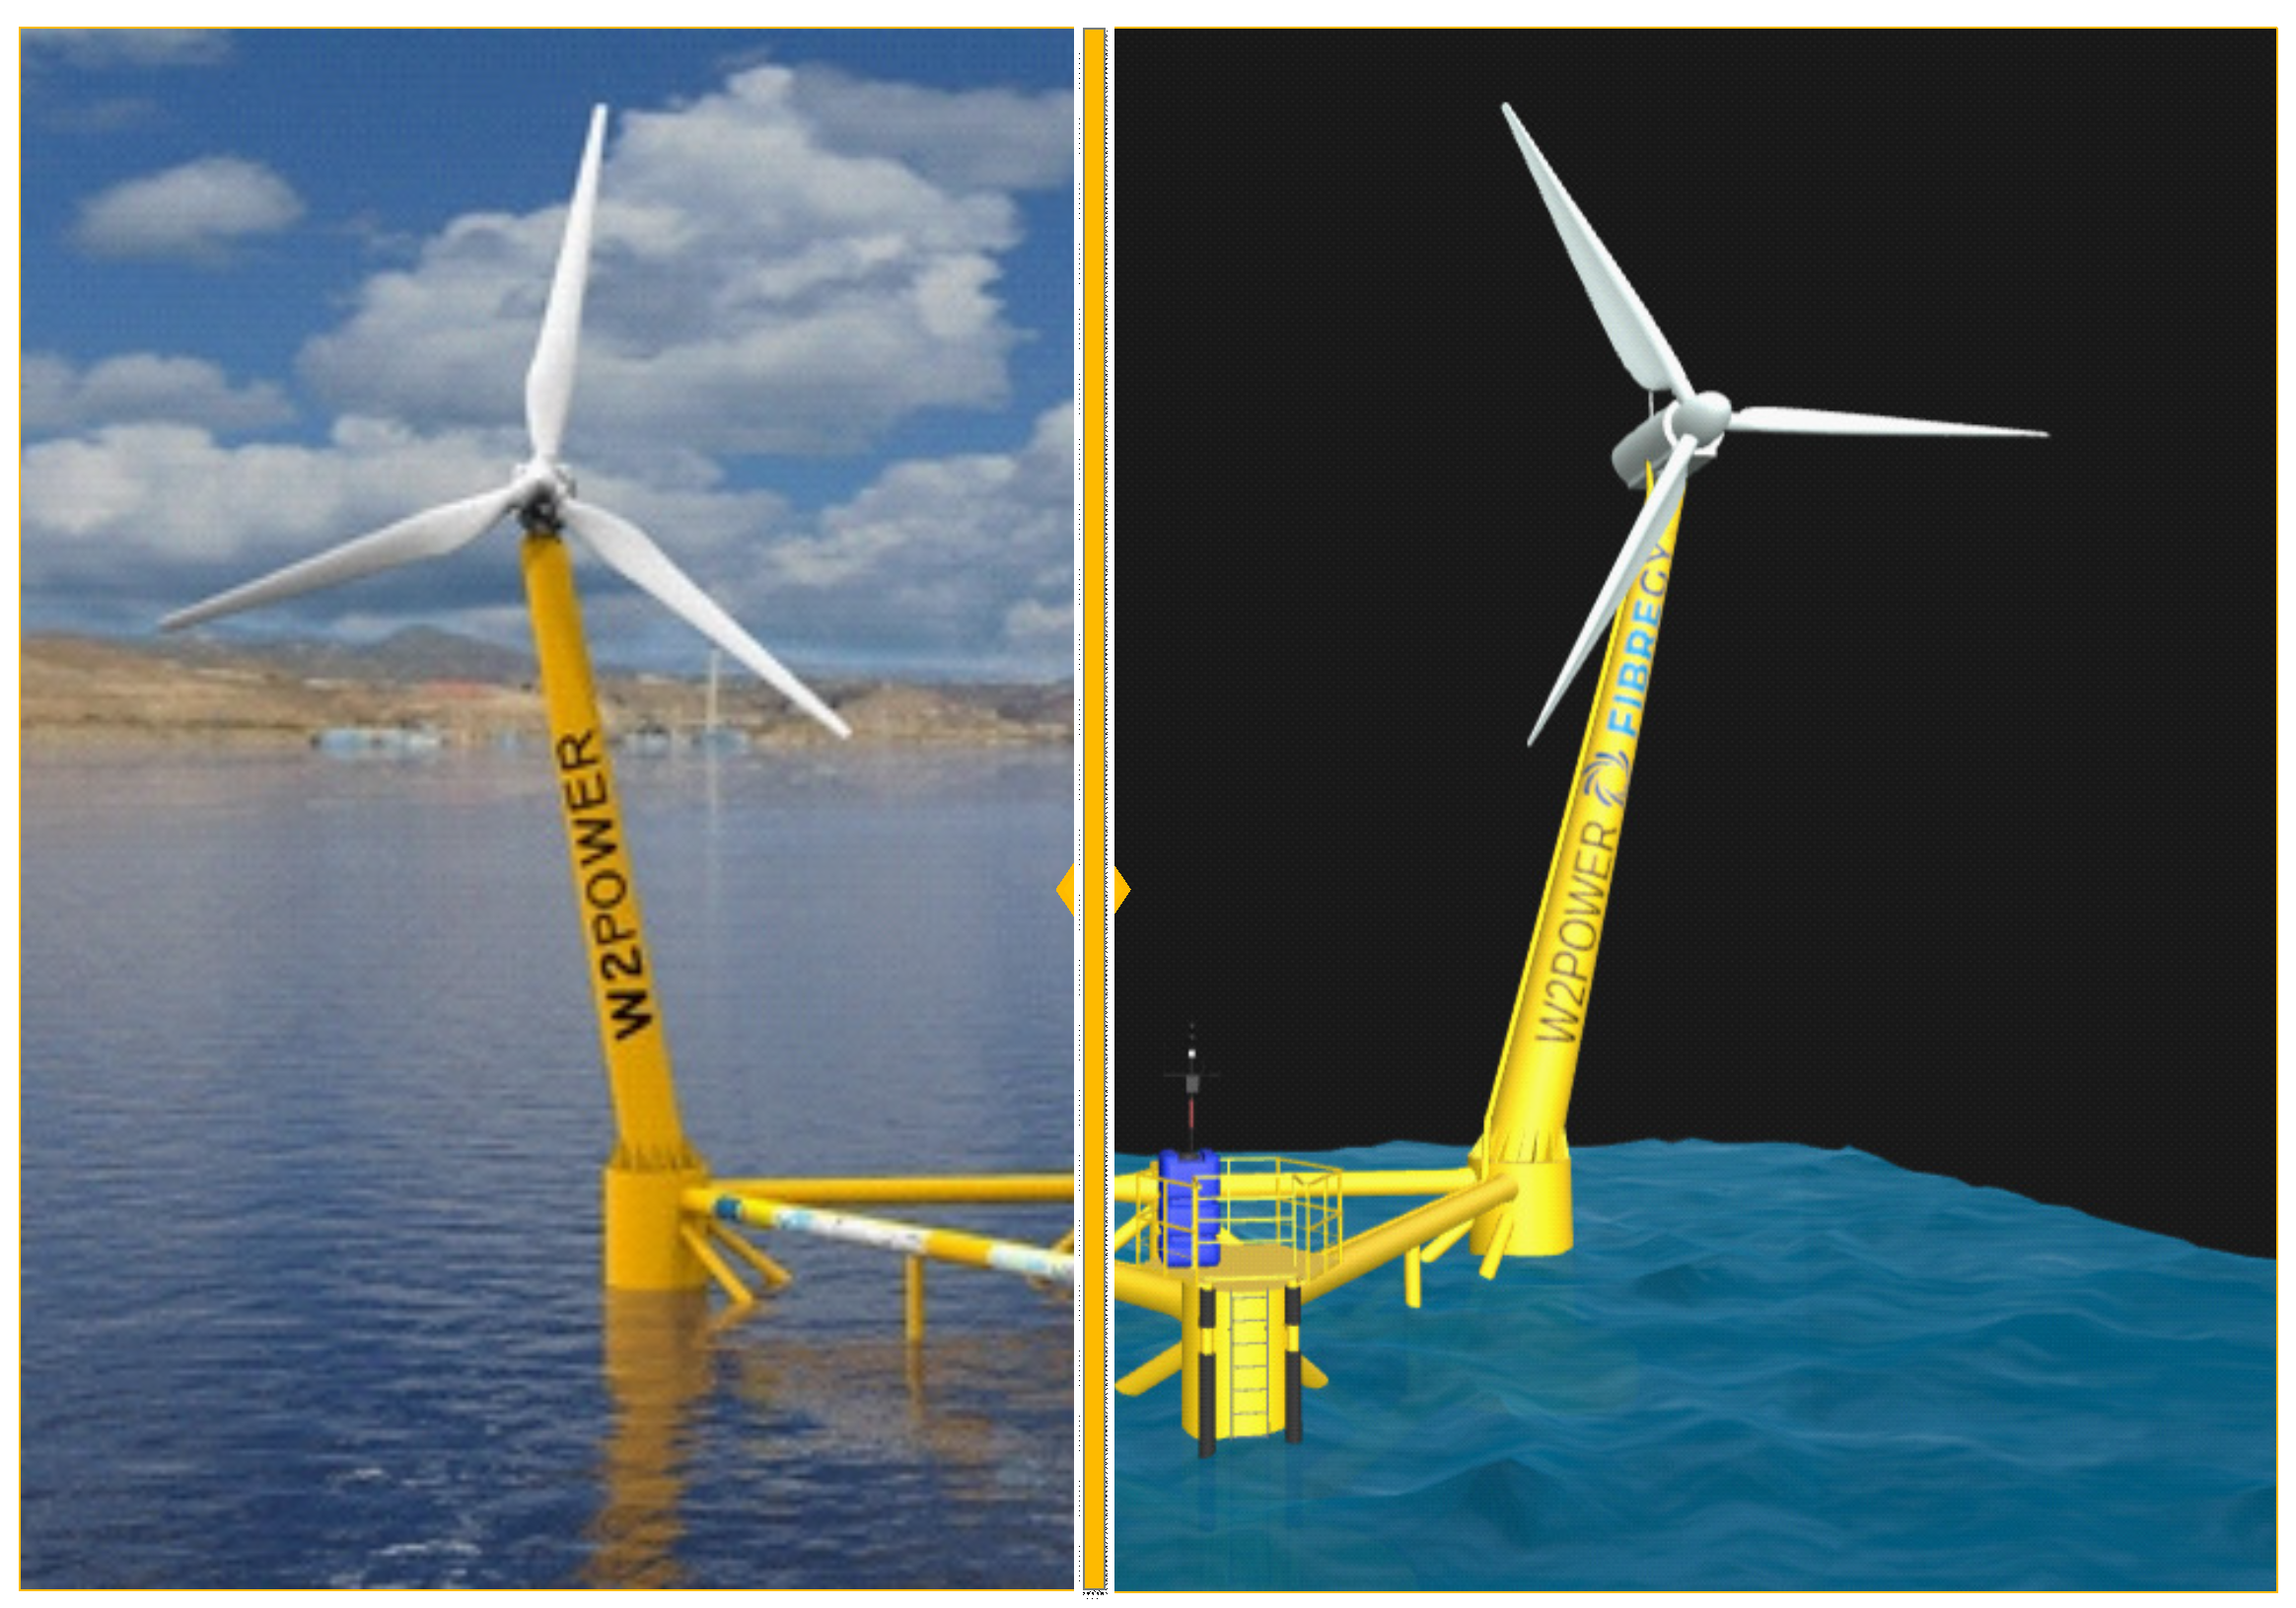
The methodology outlines the platform ecosystem and the theoretical background for generating the remaining useful life index, specifically based on the fatigue damage index. To illustrate the application of the methodology, a case study will be employed, focusing on a mono-tower. In
Figure 18, the digital twin of the mono-tower is depicted on the left, while the real dual-tower offshore floating wind turbine from the FIBREGY project is shown on the right.
The model used for the case study is the mono-tower wind turbine with the DeepCwind OC4 floating structure [
26].
4.1. Environmental Load Monitoring
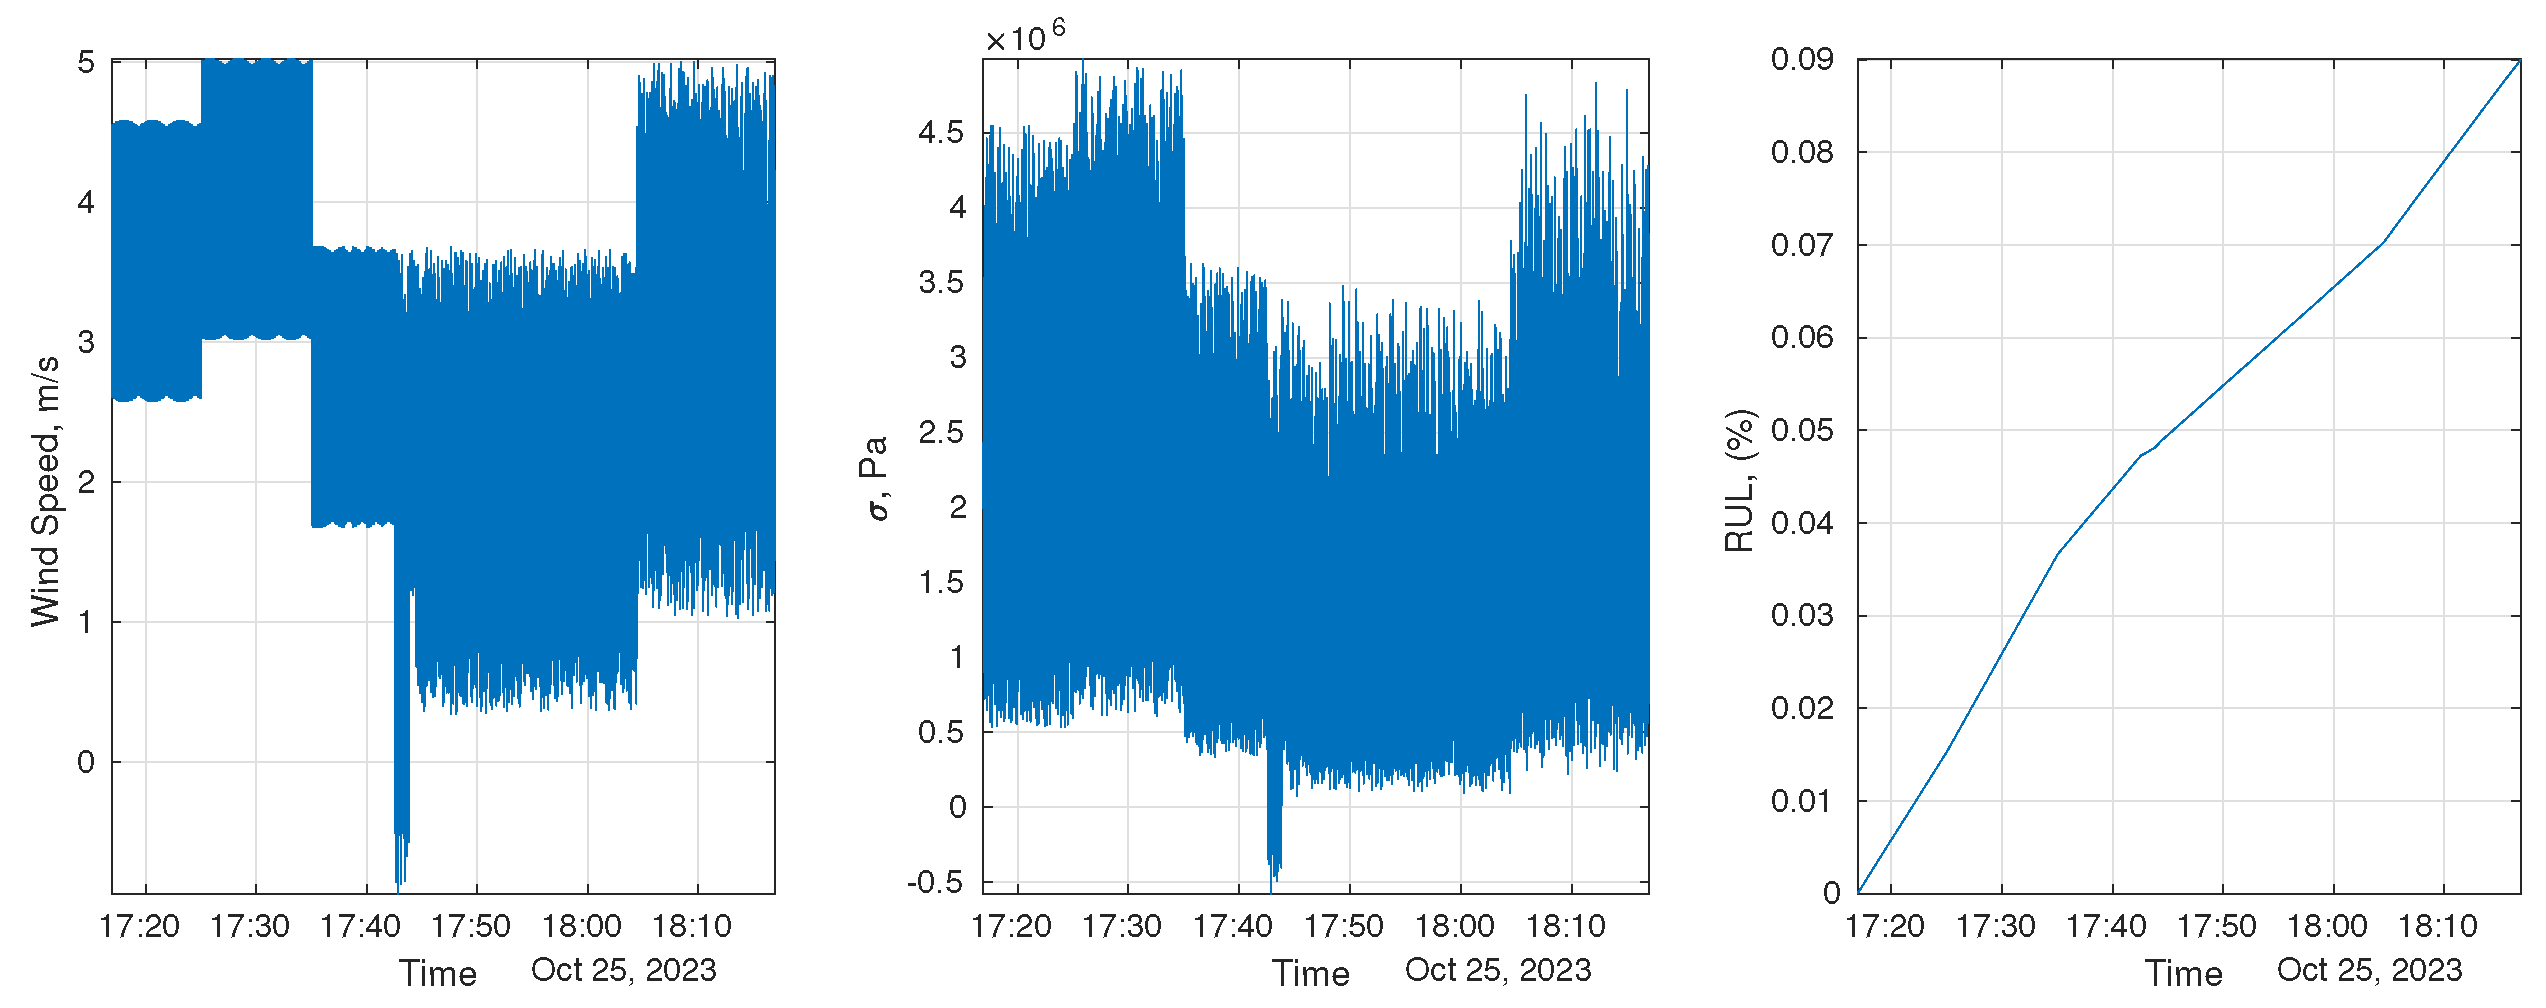
Utilizing the virtual anemometer as explained in the methodology section, the wind speed and wind direction data can be obtained. The virtual sensor collects MetOcean data at a latitude of 41.4224 and a longitude of 2.347. The wind load for the previous hour is displayed in
Figure 19. It is important to note that for this analysis, the heading is neglected, and the load is considered one-dimensional.
The wind speed is between −1 m/s and 5 m/s. The stress is also plotted for the region associated with the highest fatigue damage. In this case, the damage is calculated for each element by storing the maximum through-thickness value of the different Gauss points. Alternatively, if memory constraints are an issue, the damage could be stored per region of interest, e.g., ref. [
26] focused on the analysis of different regions where high-stress and vibrations could be of importance, particularly the joints between bars and the pontoon/columns.
The remaining useful life is obtained from the Palmgren–Miner rule. However, in this case, as it is based on only one hour of simulation, the amount of damage is insignificant.
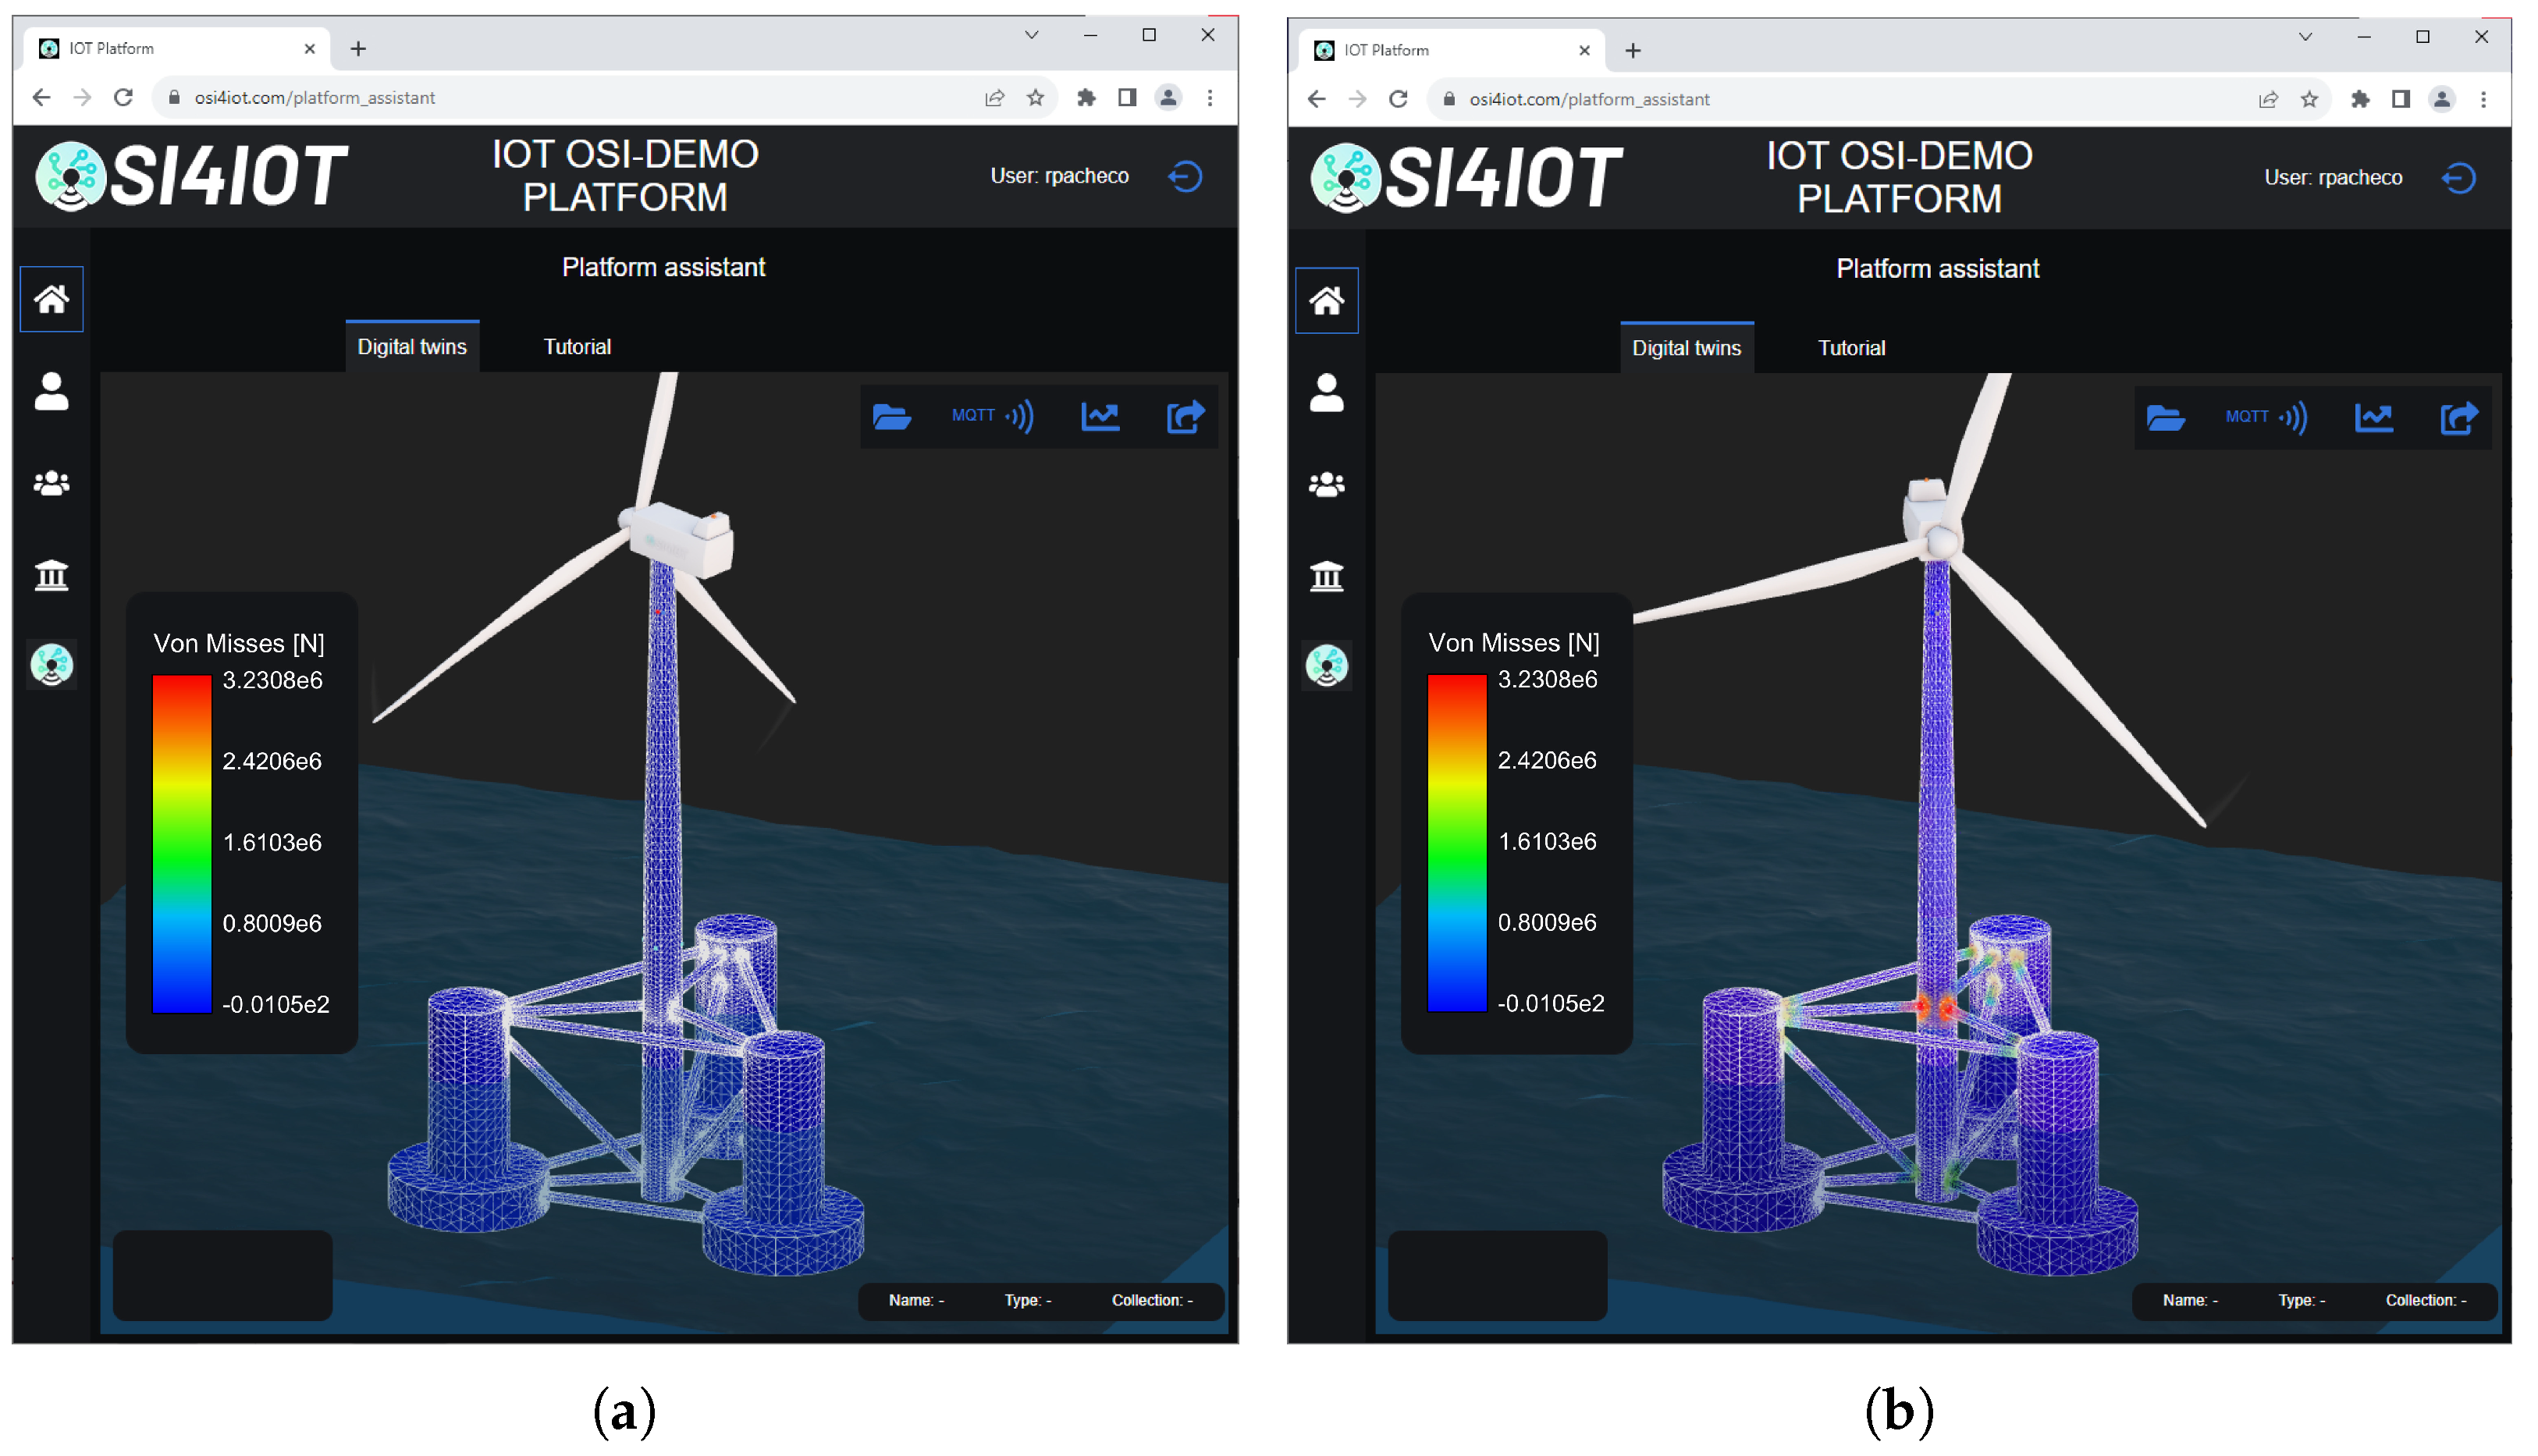
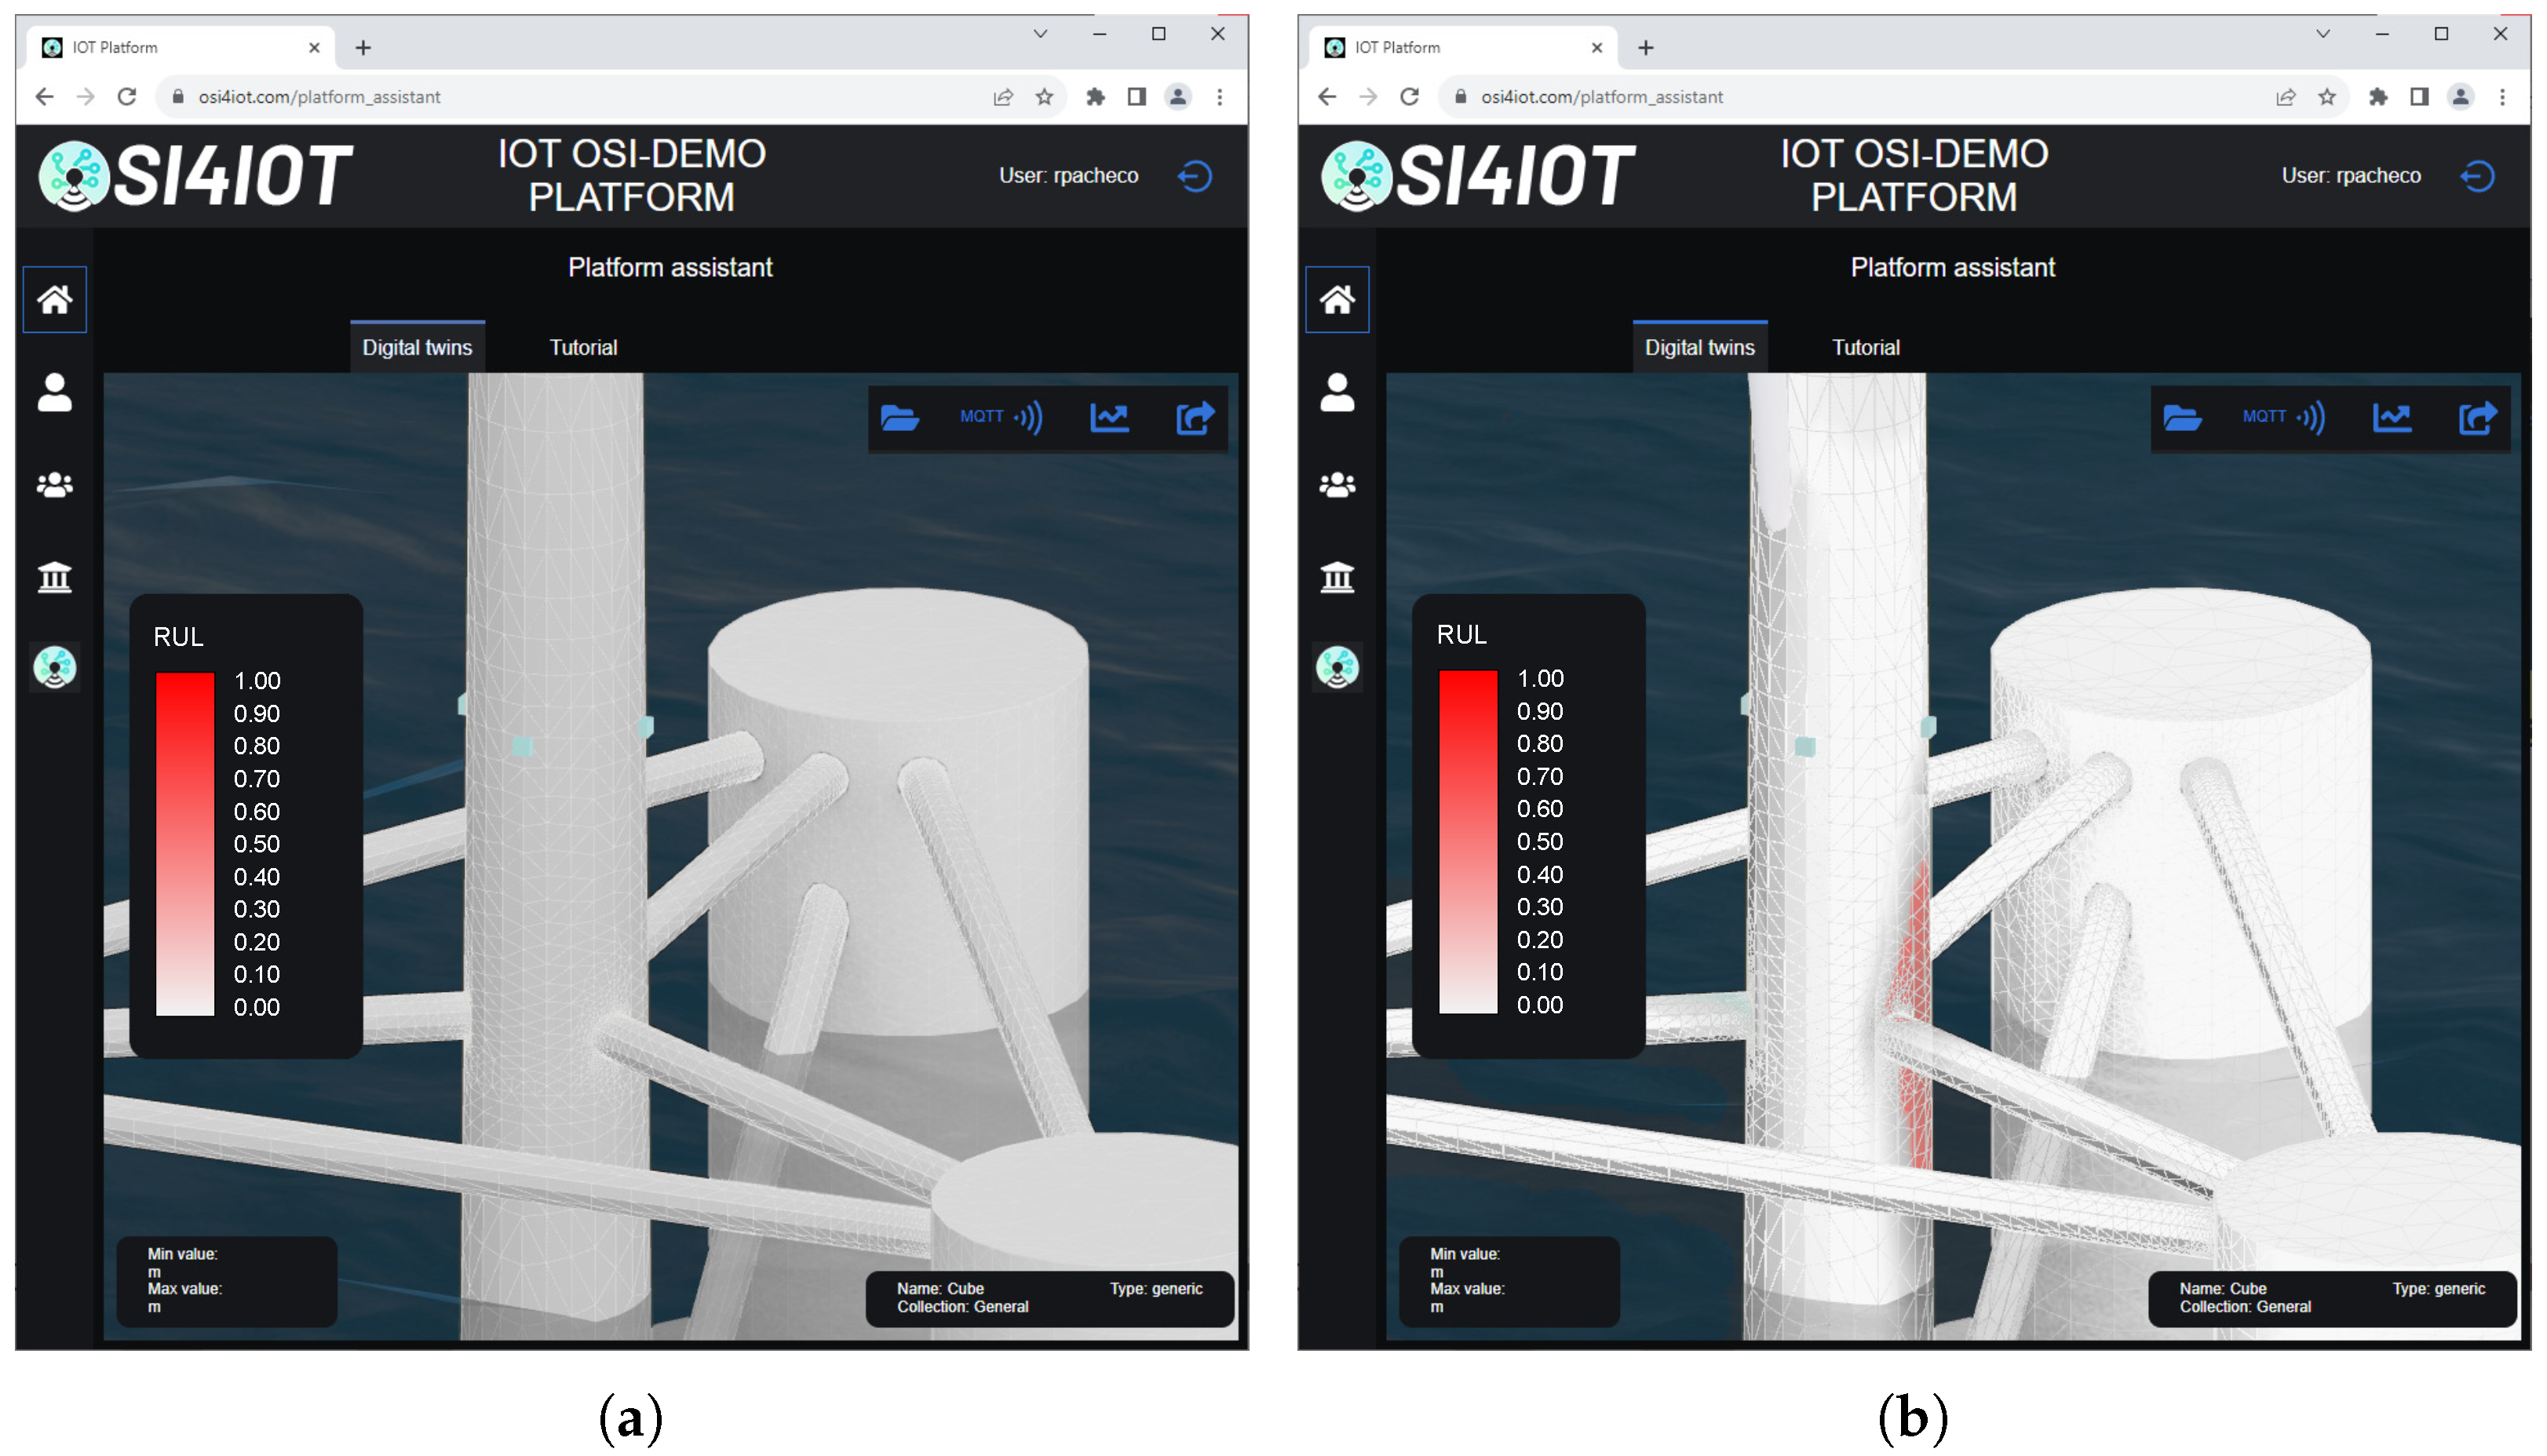
The web platform’s digital twin also displays a real-time diagram of stresses. In
Figure 20, one can see the von Mises stress distribution in the structure, which allows for tracking possible failures if any element exceeds the elastic limit. The “one-hour-ago” snapshot clearly shows a null distribution of stresses, corresponding to the time when the wind speed is, on average, zero. The “now” snapshot displays the distribution of stresses at the end of the load history.
The highest stresses are found in the unions, the dynamic or cyclic nature of the problem suggests that the joints in the floating structure are more likely to experience failure. The tower is modeled using a carbon-epoxy composite to replicate the methodology used for the dual-tower design, resulting in non-symmetric behavior in compression and tension. In
Figure 21, the non-symmetric fatigue can be noted due to this effect. It results from considering a non-symmetric CFL diagram, as shown in
Figure 15. In the “one-hour-ago” snapshot, the fatigue is almost zero, although the color appears grayish rather than white. However, for the “now” snapshot, the fatigue increases to almost 0.1%.
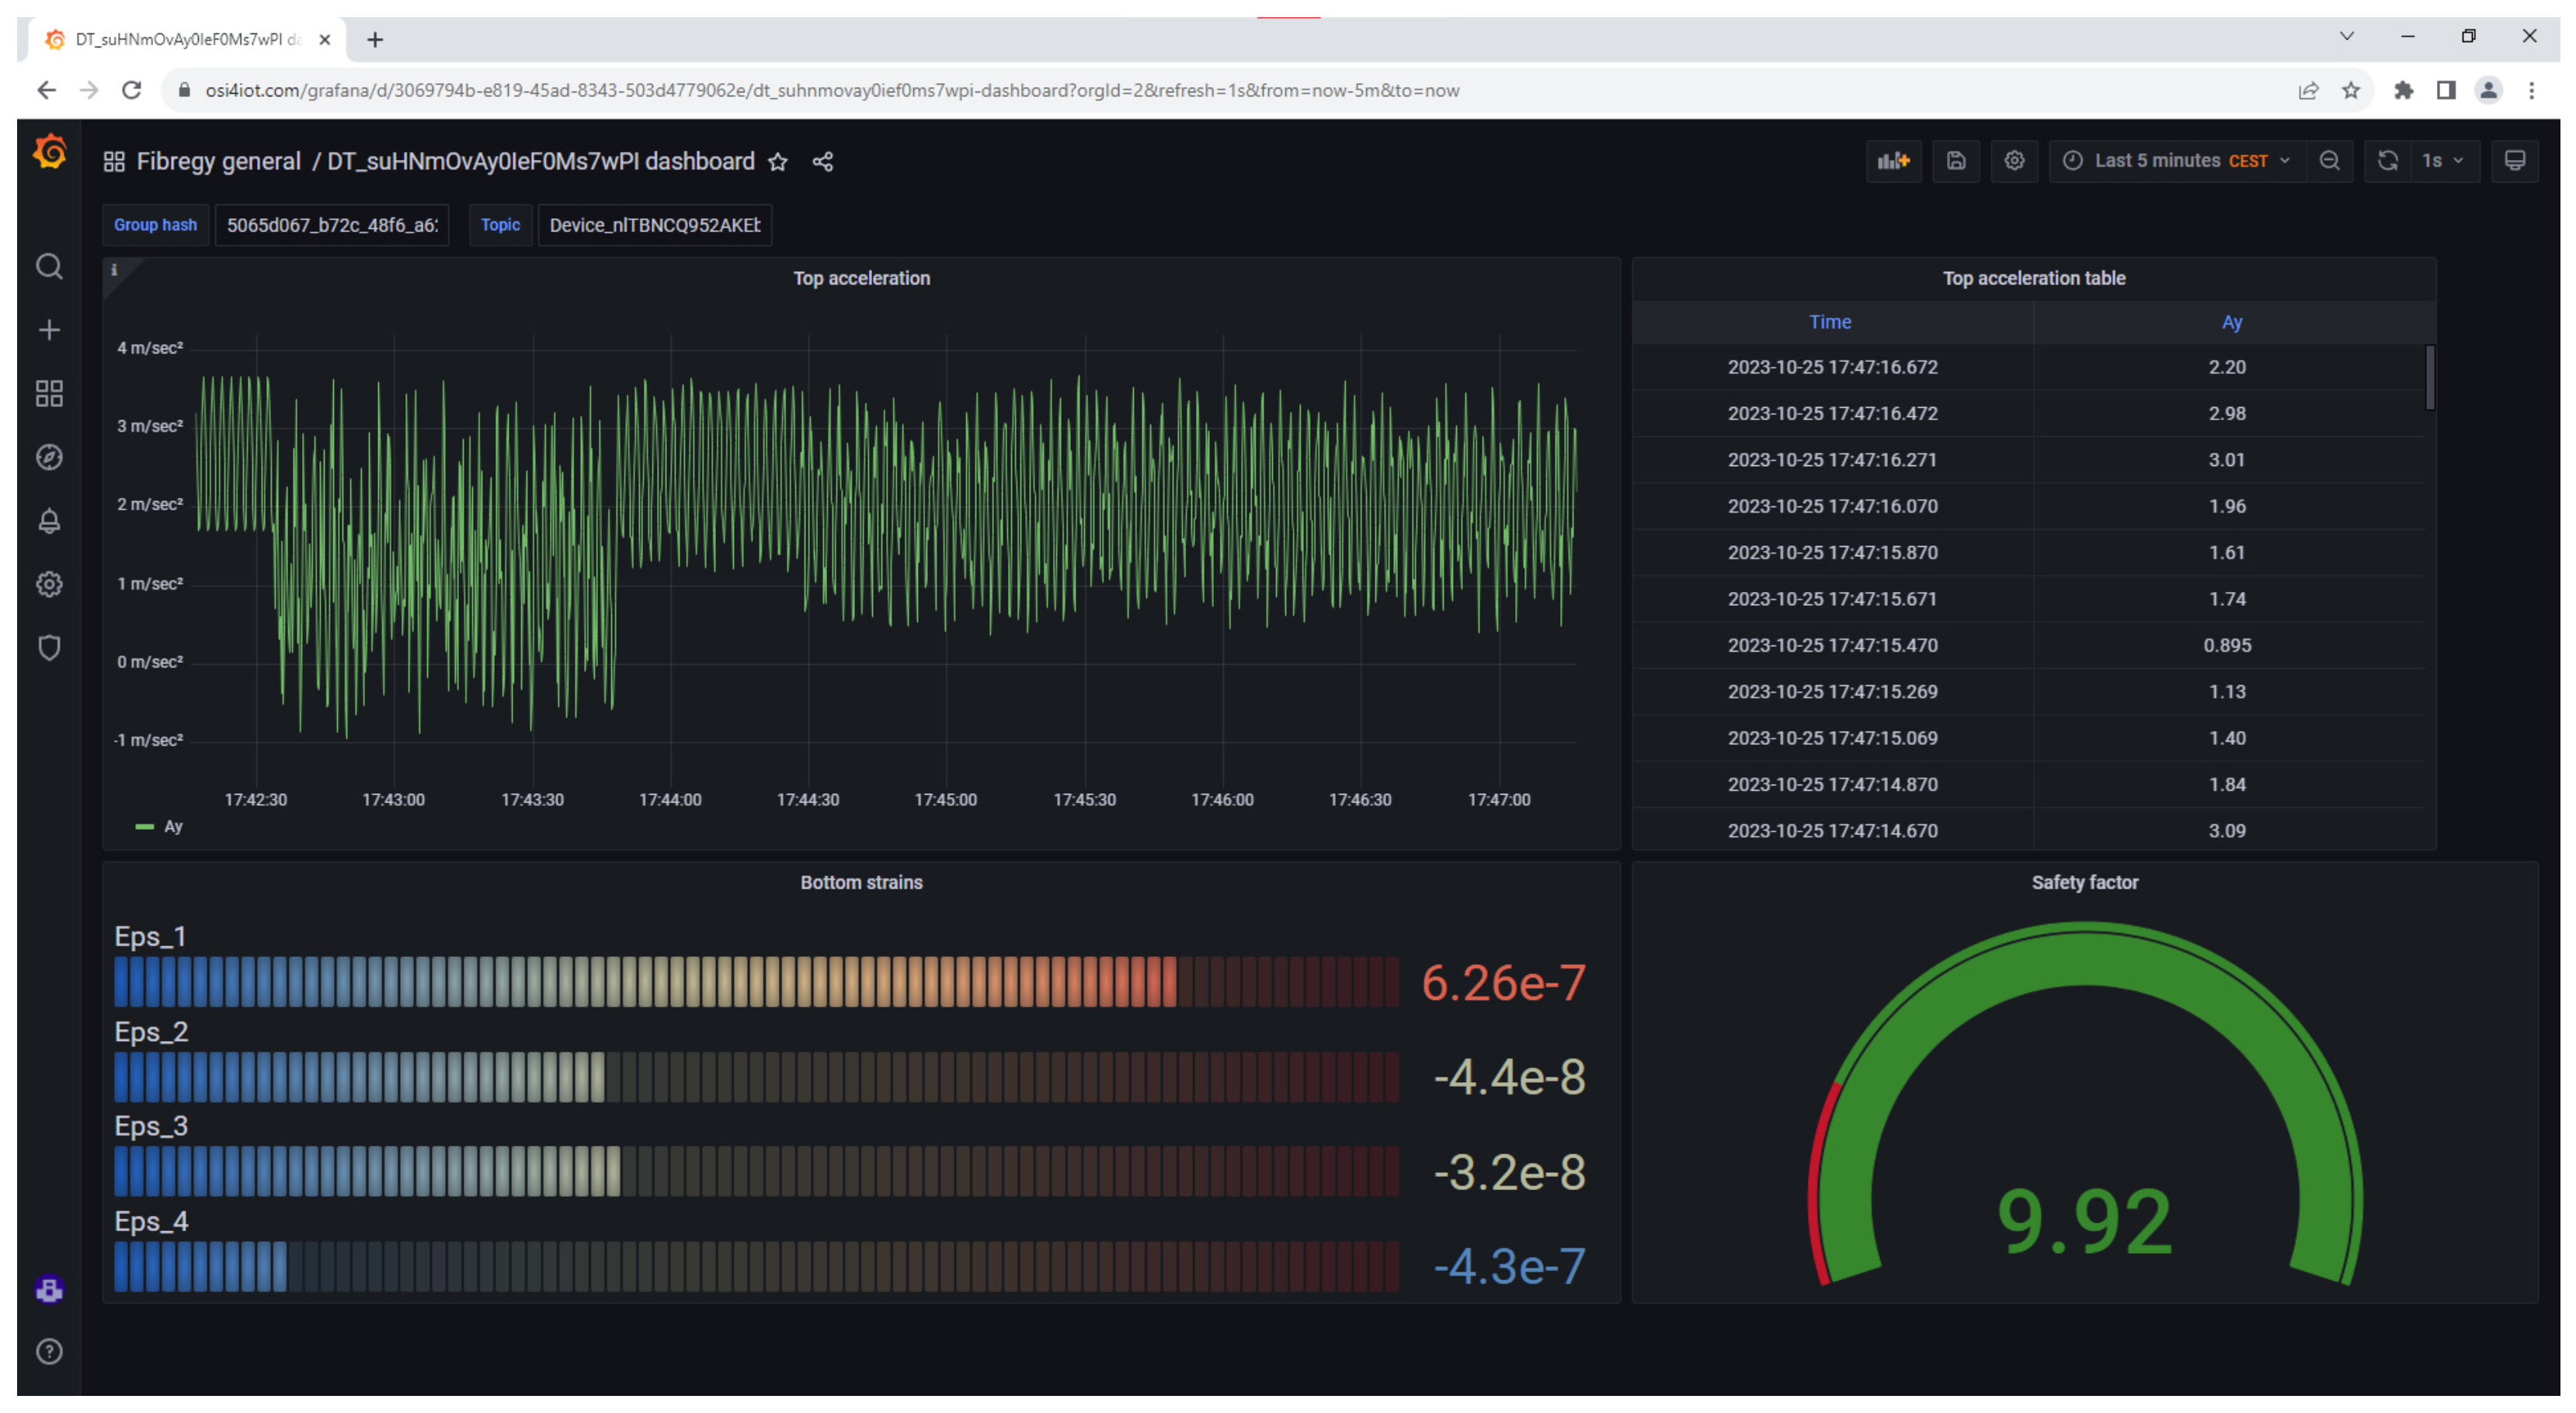
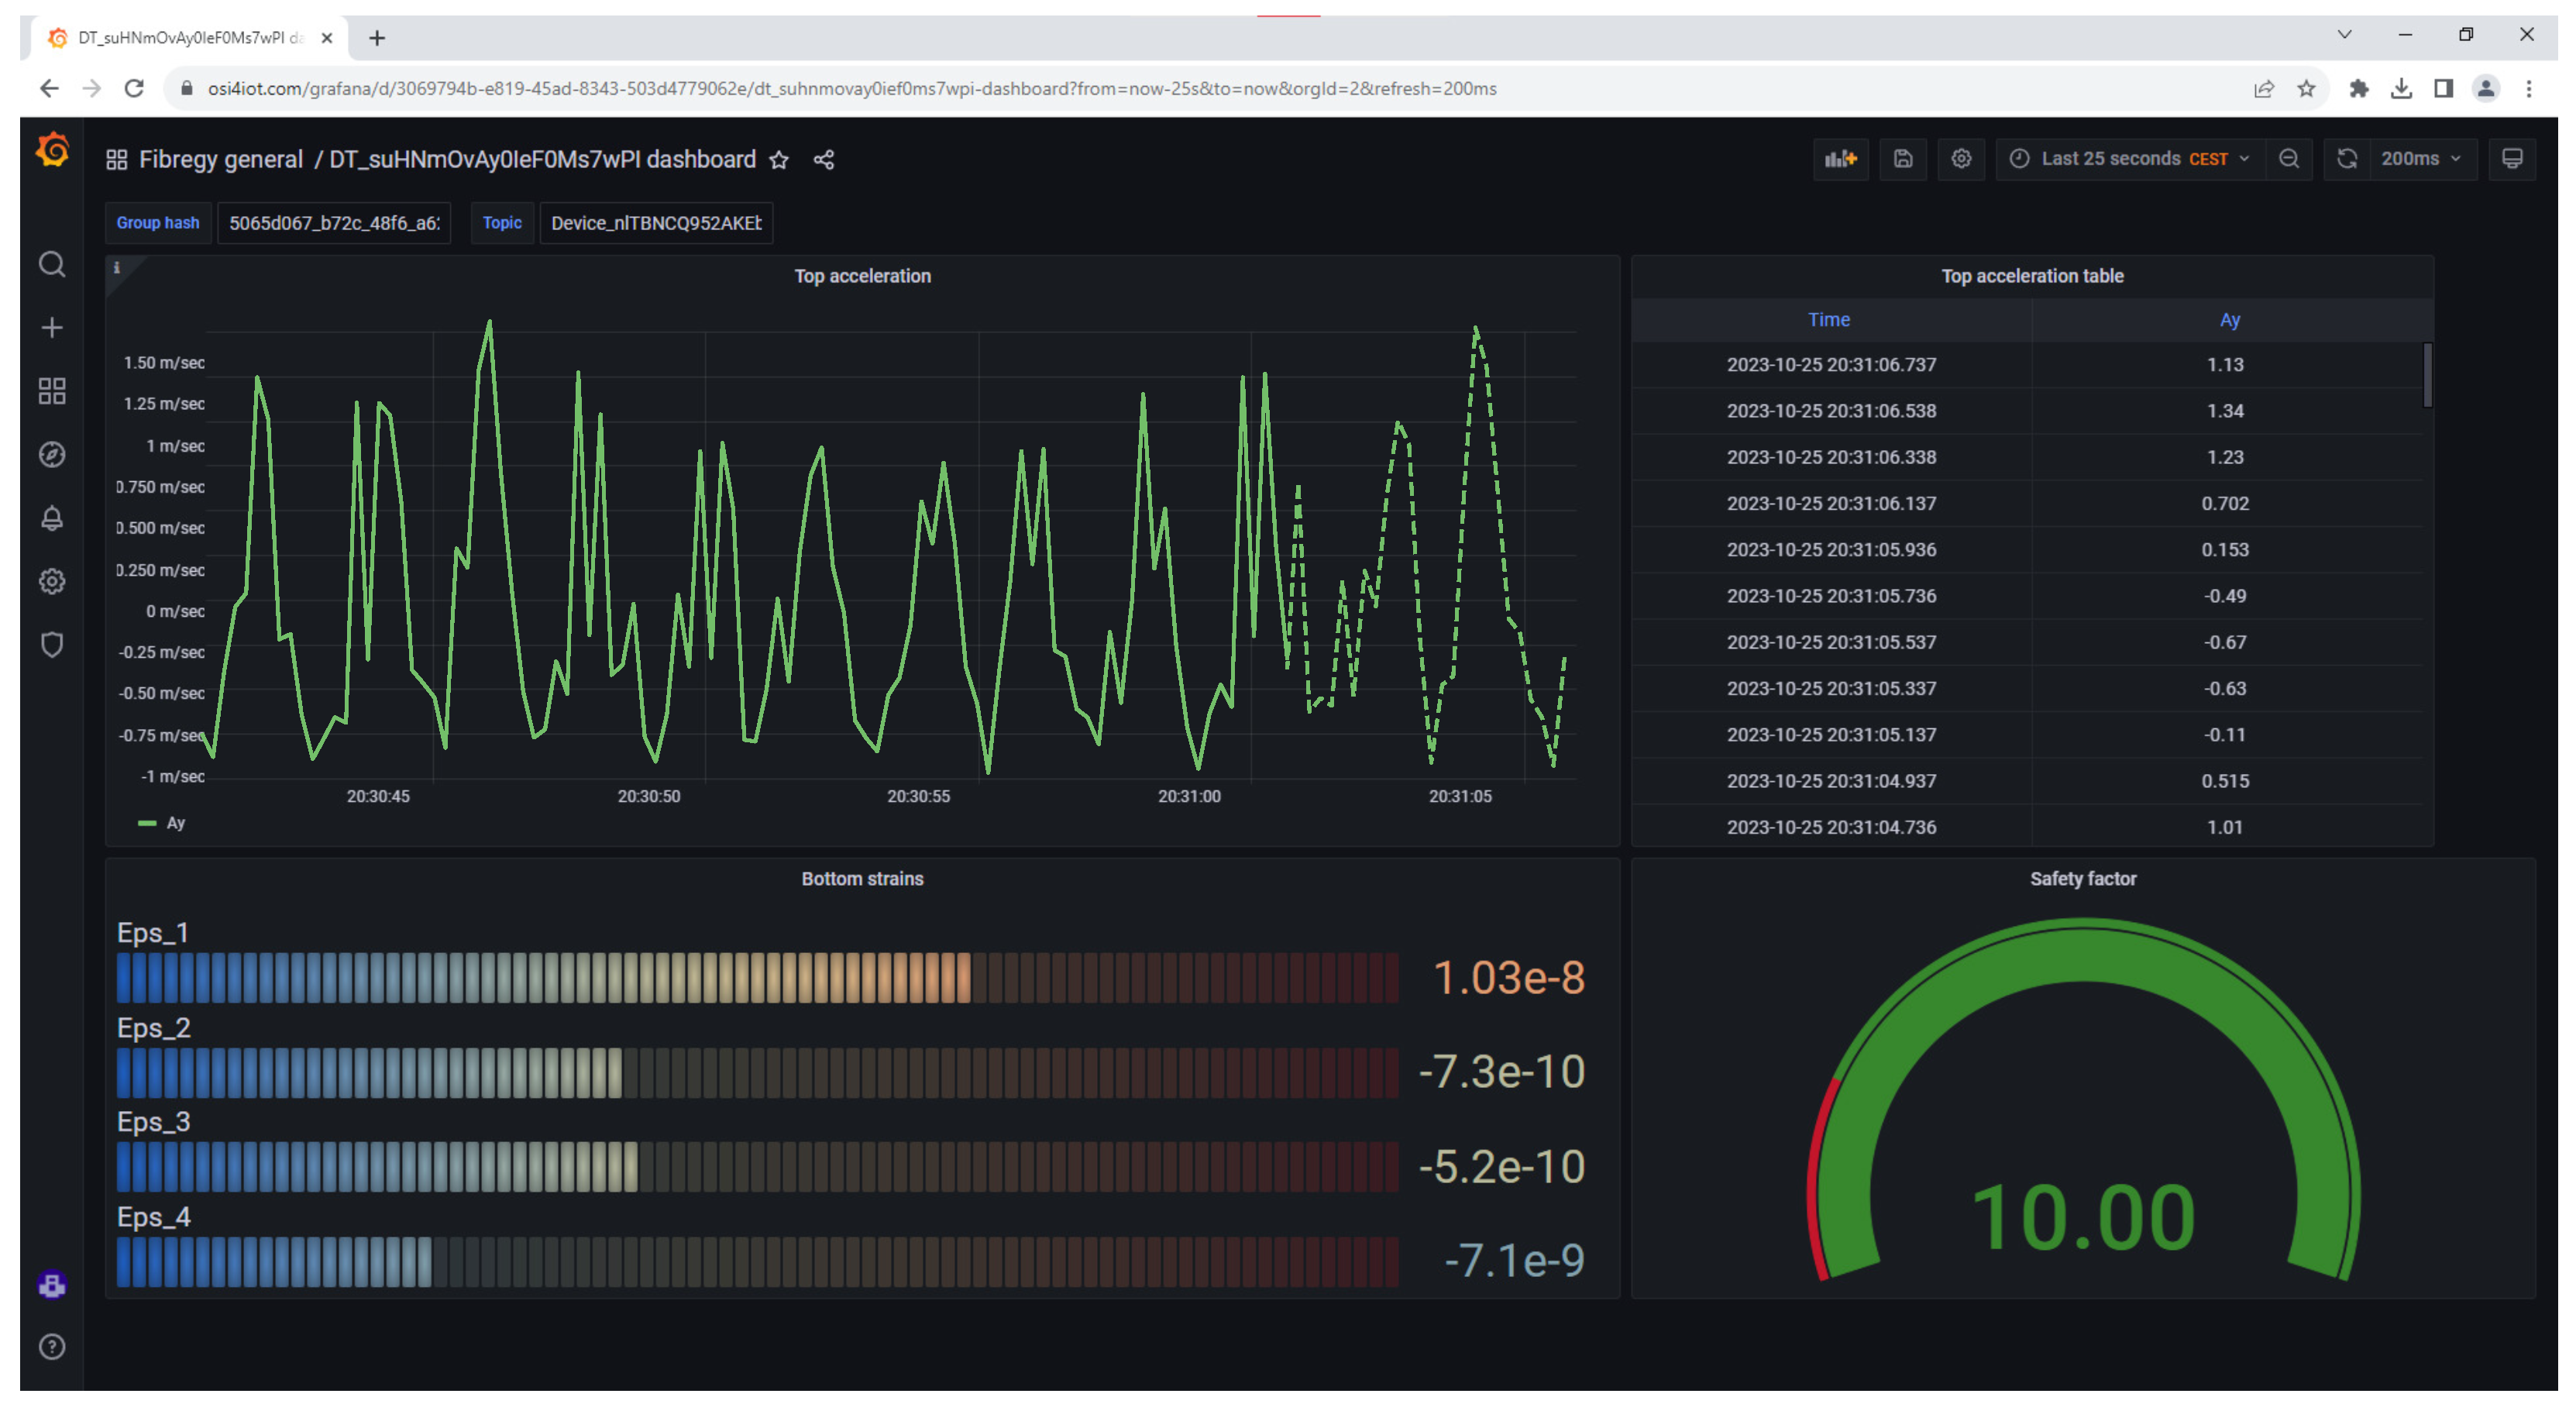
At the same time, the values obtained from the accelerometers, strain gates, inclinometers, and optic fibers could be displayed by means of a
Grafana dashboard similar to the one shown in
Figure 22. It is important to note that, in this model, the displayed values are not gathered from real sensors. Instead, they are derived from virtual sensors based on the mesh deformation and displacement at specific locations where real sensors are placed.
4.2. Predictive Maintenance
In the current example of the mono-tower, the remaining useful life is defined based on the maximum damage observed throughout the structure’s life. The recorded values are too low to trigger any warnings or alerts. To activate the warning and subsequent alert, a threshold is set, e.g., at an accumulated damage of 50%.
The current methodology can potentially be employed for predictive maintenance if the wind, current, temperature, and wave load forecasts are accurate enough. For instance, the reduced hydroelastic order model discussed in the methodology [
15] could, in theory, be used to calculate simulations for a future time period before the forecasted time elapses, i.e., only if
t-seconds of simulation can be computed before the
t-second forecast elapses. This would represent a true real-time application. In standard FEM simulations, achieving such real-time capabilities is generally not feasible due to computational limitations.
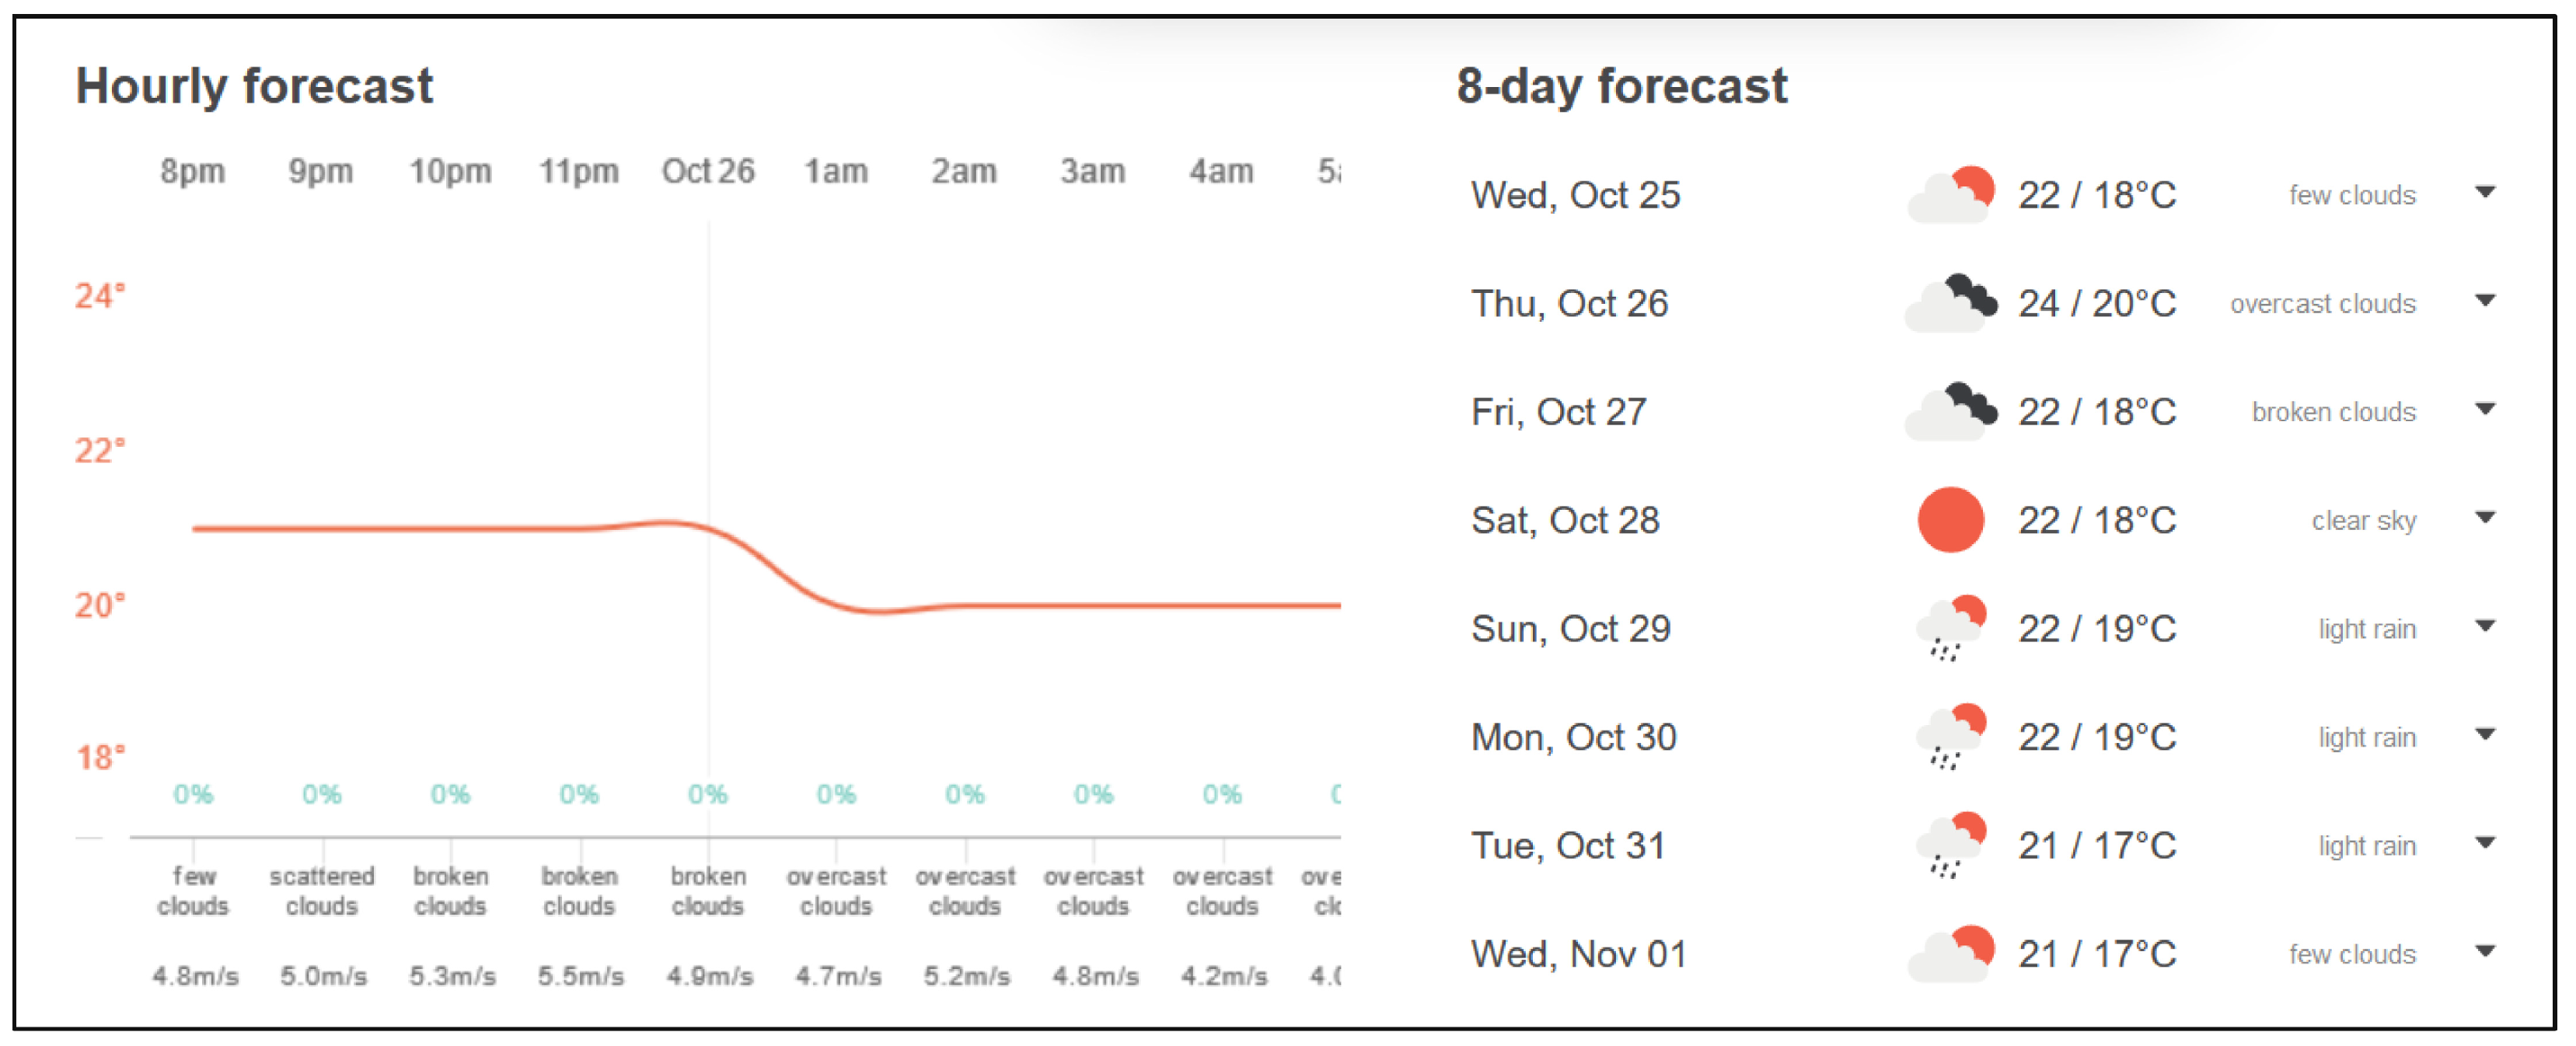
In this specific case, wind forecasts can be obtained using the same virtual sensor approach, but in this context, it would involve predicting future wind conditions, as depicted in
Figure 23. This would be a valuable feature for real-time predictive maintenance.
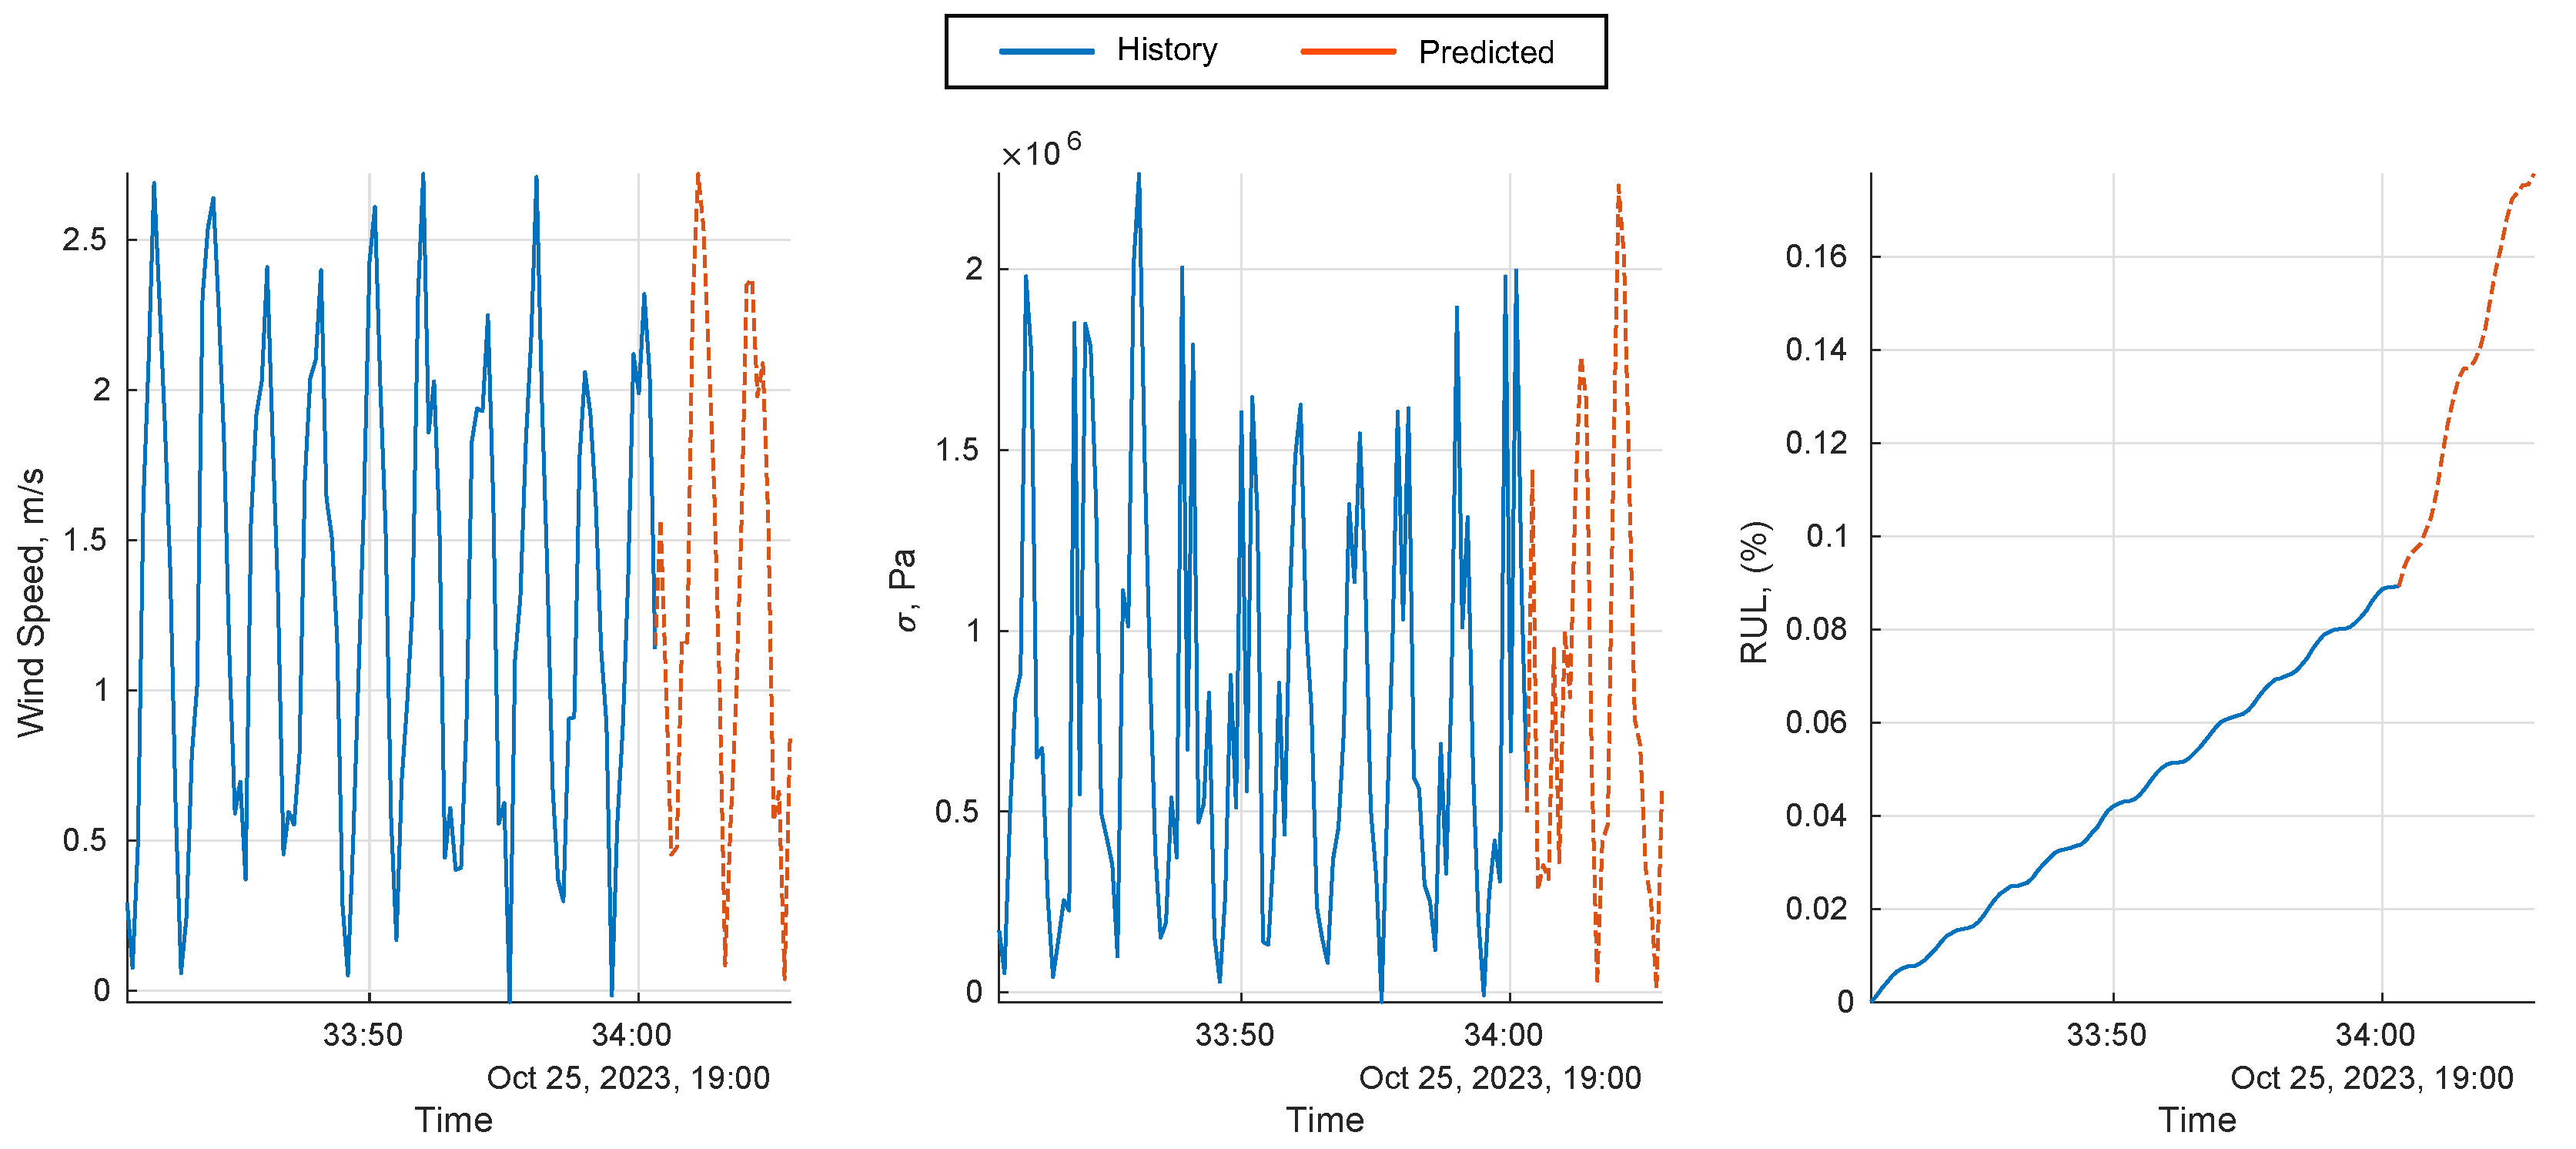
Subsequently,
Figure 24 displays the current state in blue at the joints of the floating structure, based on historical data for the last 20 min, and the forecasted state in orange for the next 10 min. This visualization is a valuable tool for predictive maintenance.
Lastly, the forecast data can also be displayed in the Grafana dashboard, as demonstrated in
Figure 25. This integration allows for the comprehensive monitoring and analysis of forecasted conditions, contributing to predictive maintenance strategies.
5. Implementation
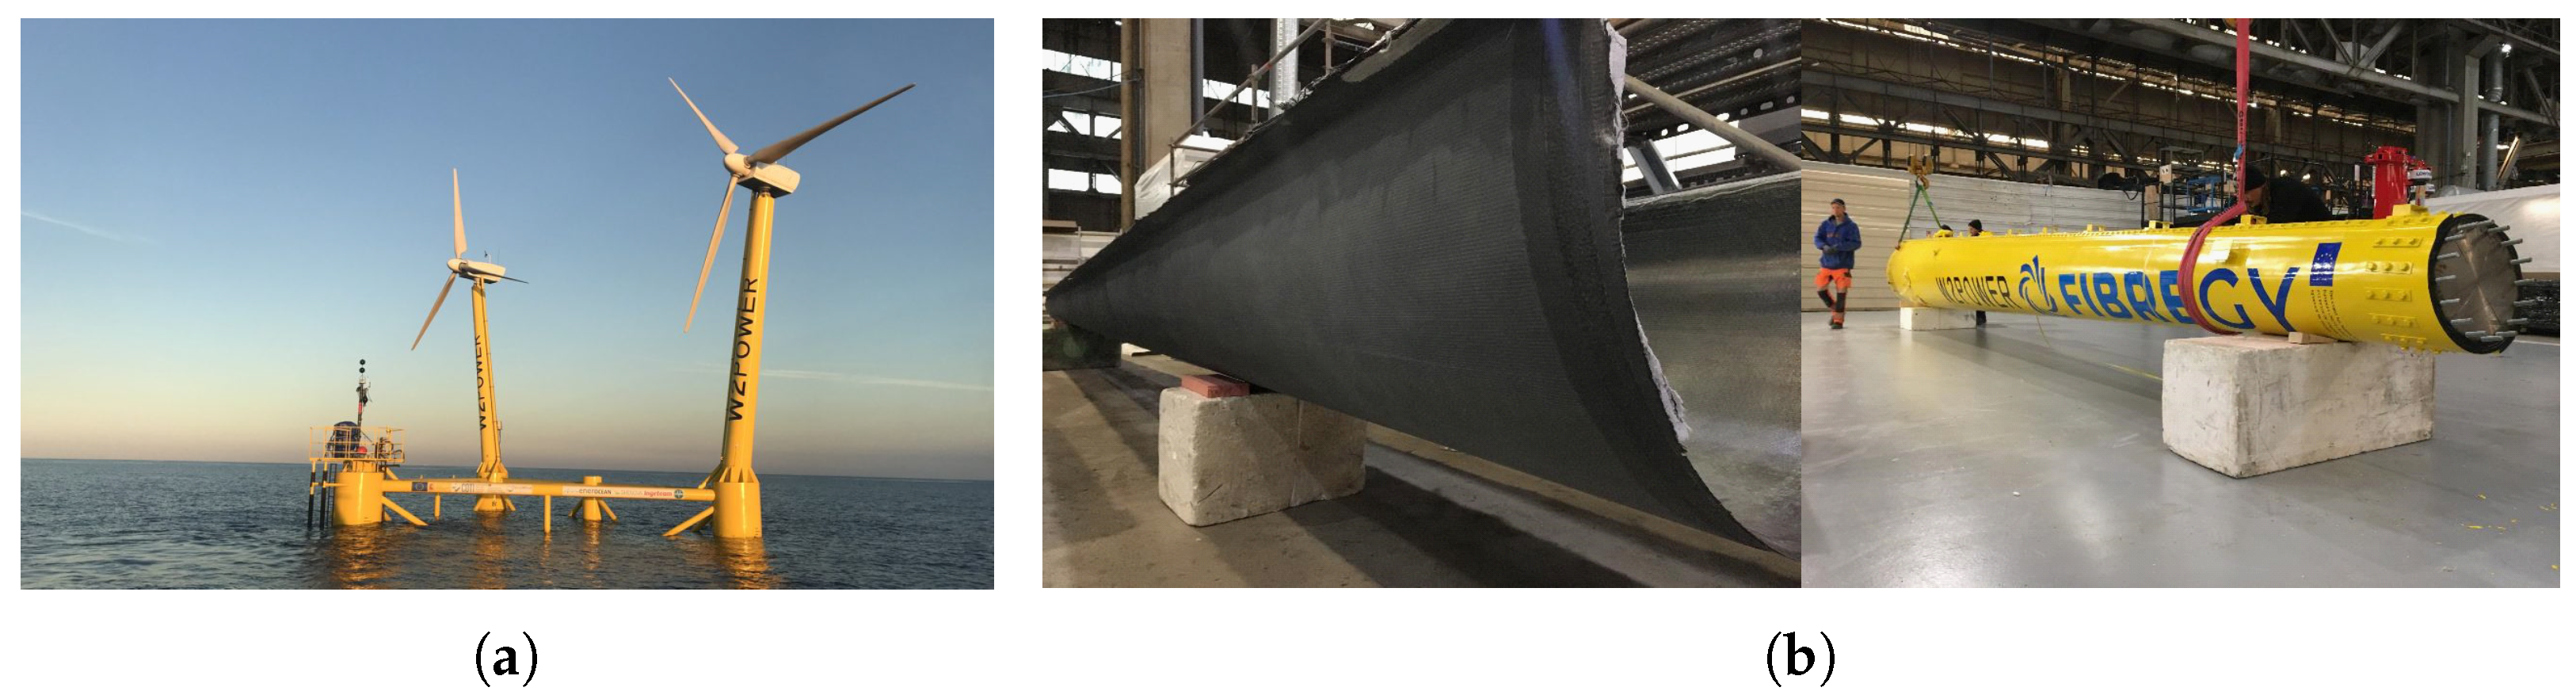
The described methodology will be applied to an existing double-tower floating wind turbine called W2POWER from EnerOcean. This turbine has its towers reconverted to carbon fiber material as part of the H2020 FIBREGY project [
9], and the reconversion is showcased in
Figure 26.
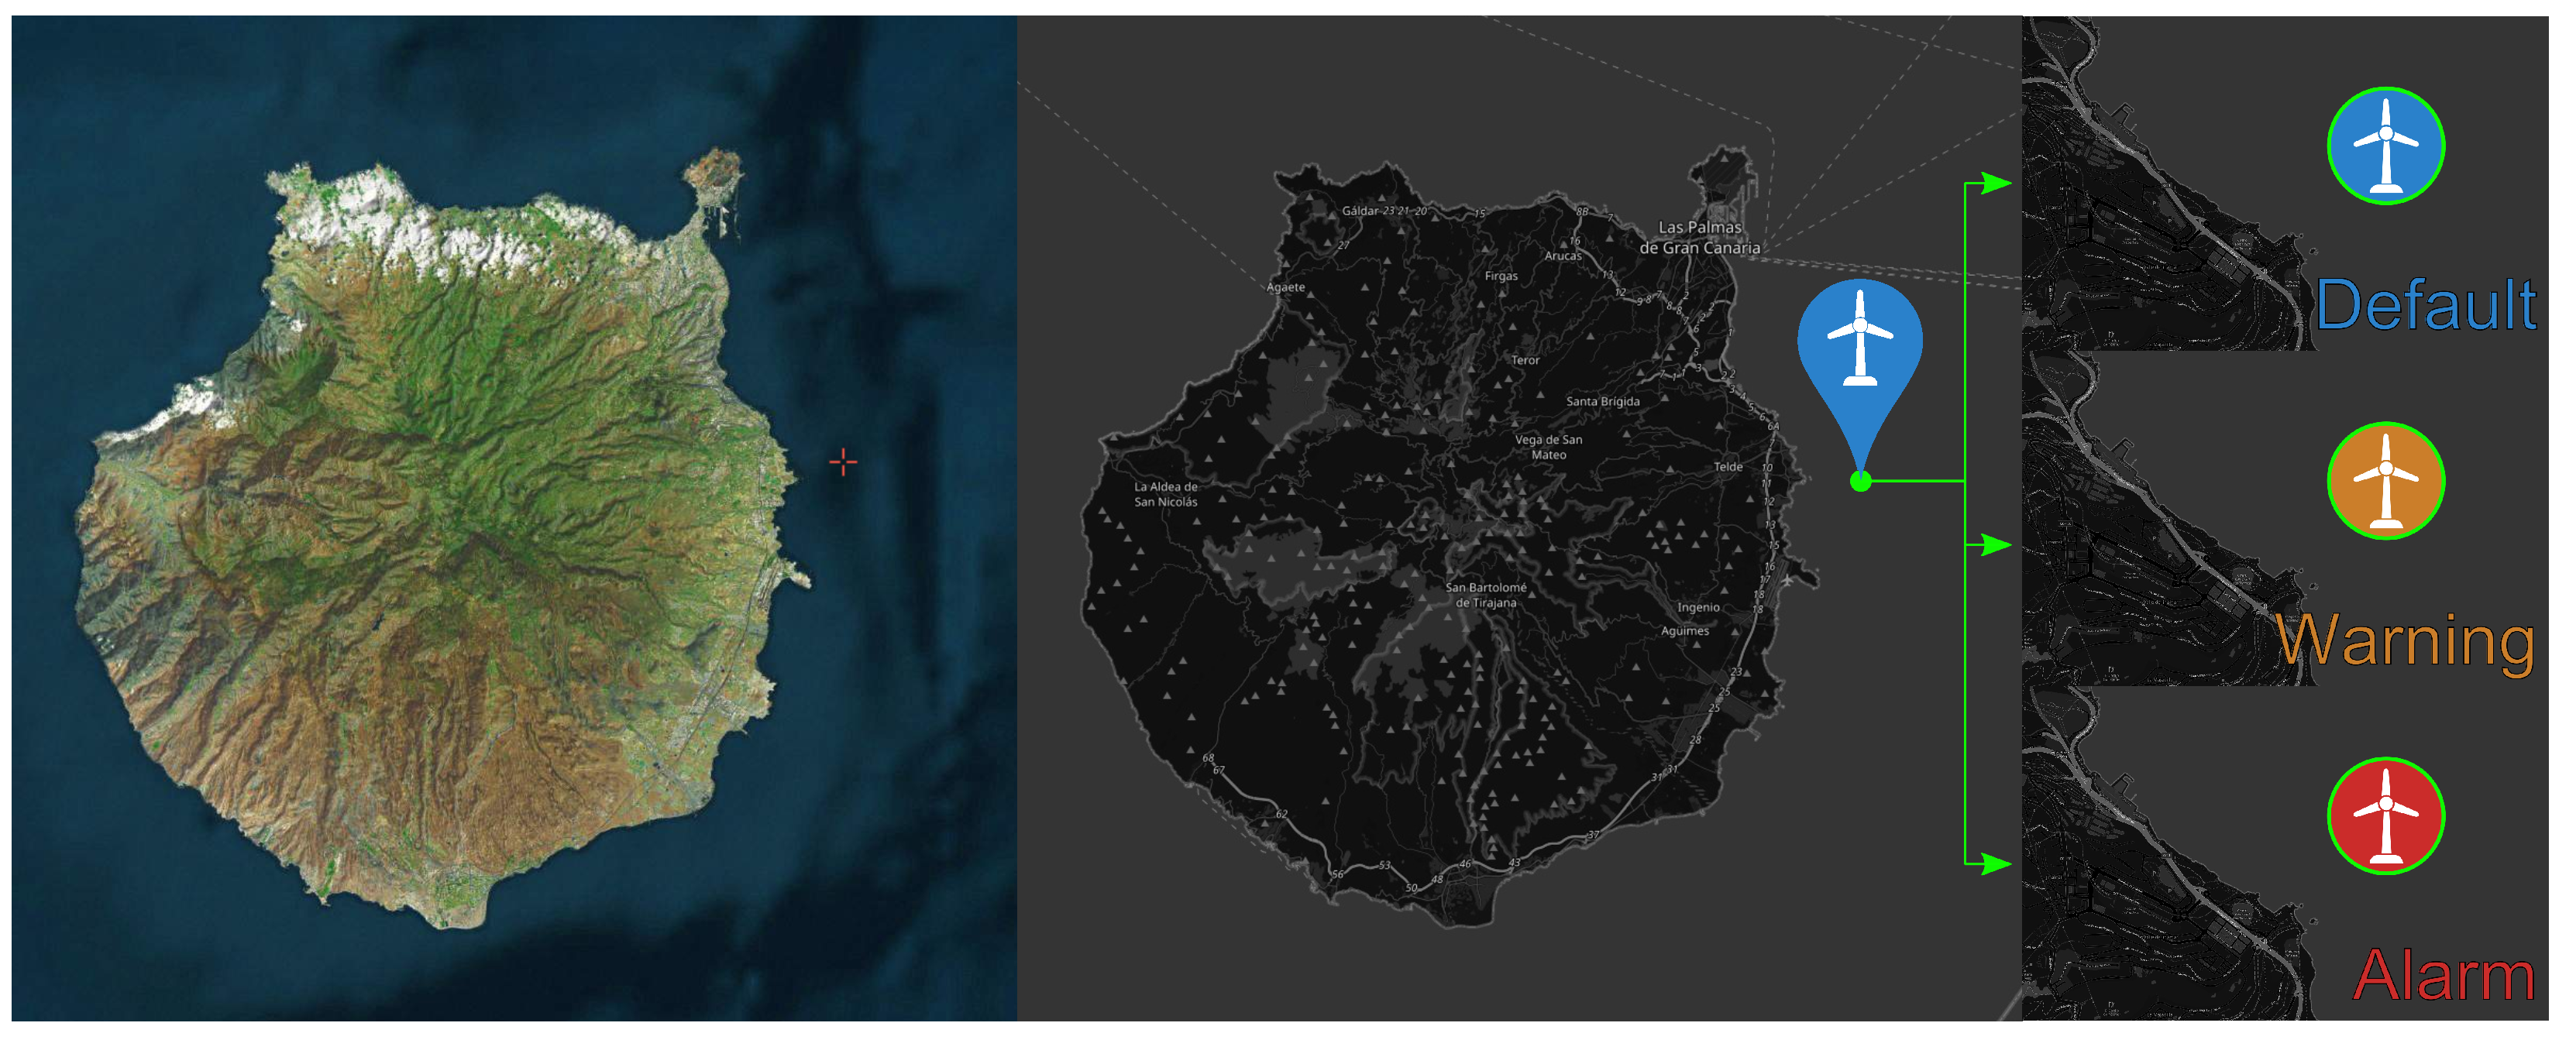
The floating wind turbine is monitored through the GIS of OSI4IOT, as seen in
Figure 27. You can observe the leaflet where the wind turbine is located, specifically in the Oceanic Platform of the Canary Islands (PLOCAN) in Spain. The GIS of OSI4IOT supports three types of states: the default state, warning state (in orange), and alert state (in red). These states are defined based on various metrics. For example, when specific metrics, such as damage calculated using Equation (
10), exceed a defined threshold (e.g.,
), a warning is issued. If the warning persists for a designated period of time (
), it transitions into an alert state, indicating more severe issues that require immediate attention. Both warning and alert states prompt immediate notifications through the platform’s notification system.
While converting the wind turbine to composite material, various types of sensors will be integrated into the OFWT structure. These sensors include a buoy provided by PLOCAN, an anemometer, and other sensors placed along the mooring lines. The sensor data are collected and transmitted to the OSI4IOT platform through a microcontroller using the MQTT protocol. This sensor information can be stored to be used later in statistical analysis or machine learning models to improve the prediction of necessary maintenance inspections. Moreover, combining the data with the elemental RUL definition at different regions of interest in the structure can be used to correlate the necessary inspections or repairs with a set of reference RUL values. Therefore, knowing the present RUL state, the forecast can be obtained to decide—based on the reference RUL value—if a necessary inspection or repair is likely to be scheduled in a particular part of the structure.
The digital twin can be found in
Figure 28. The process to create this digital twin is presented in
Figure 7. Initially, a finite element model (FEM) was developed to analyze the response of the wind turbine to various types of loads, including air pressure loads, wind turbine loads, mooring loads, current loads, and wave loads. This model involves a coupling between OpenFAST and SeaFEM solvers. SeaFEM utilizes a modal matrix reduction method for its hydroelastic analysis [
15]. The reduction order method (ROM) allows for real-time solutions once the modes of the floating structure are computed. The real-time FEM solution is of great importance because it aims to predict fatigue by calculating the structural response for a 6 h window based on the current environmental conditions.
The second part of creating the digital twin involves exporting the mesh and the precomputed modal results from the hydroelastic analysis; a profound analysis of the hydroelastic FEM model and its results can be found in [
27]. The mesh is exported with its connectivity and coordinate matrices in JSON format. It is then imported into Blender using an open-source add-on available in the platform’s GitHub repository. The modal results are also exported in JSON format for each node. In Blender, sensors, assets, animations, and metadata are designed. Afterward, everything is exported in glTF format, which can be read using the three.js library. Finally, in the platform’s digital twin creator, the glTF file and the results in JSON format are uploaded to generate the corresponding digital twin.
6. Conclusions
The paper comprehensively explores the potential of utilizing digital twin models to enhance wind turbine performance, emphasizing cost reduction and sustainability within the framework of 7D-BIM technology.
In the methodology section, the platform’s capabilities are introduced, with a significant focus on the formulation for the real-time calculation of remaining useful life, particularly regarding fatigue in composite structures. The showcase section demonstrates the practical application of the platform to the offshore wind turbine industry, with a specific case study involving the W2POWER structure.
The application of digital twin technology to offshore floating wind turbines presents several unique advantages. Firstly, the platform’s data ingestion capability is invaluable for prioritizing inspection schedules. It allows for a data-driven approach to determine which structures require immediate attention and which can wait. Second, it facilitates the reduction of costly and unnecessary inspections for structures lacking real-time monitoring. This not only optimizes resources but also helps prevent prolonged inspection intervals. Third, digital twin technology enables the reliable tracking of a structure’s lifespan and supports efforts to extend it. Finally, it allows for the dynamic adjustment of inspection and maintenance plans through forecasting and predictive maintenance, enhancing efficiency and cost-effectiveness. These advantages underscore the transformative potential of digital twins in optimizing offshore wind turbine performance and sustainability.


 ,
, 


