Article

Behavior Analysis of a Bucket Foundation with an Offshore Wind Turbine during the In-Water Sinking Process

1
State Key Laboratory of Hydraulic Engineering Intelligent Construction and Operation, Tianjin University, Tianjin 300072, China
2
School of Civil Engineering, Tianjin University, Tianjin 300072, China
3
School of Computer Science and Engineering, Tianjin University of Technology, Tianjin 300384, China
4
School of Water Conservancy and Hydroelectric Power, Hebei University of Engineering, Handan 056038, China
*
Author to whom correspondence should be addressed.
J. Mar. Sci. Eng. 2024, 12(3), 494; https://doi.org/10.3390/jmse12030494
Submission received: 26 January 2024 / Revised: 12 March 2024 / Accepted: 13 March 2024 / Published: 15 March 2024
(This article belongs to the Special Issue Offshore Renewable Energy)

Abstract

:
To enhance the safety of the in-water sinking operation for an integrated system, including a bucket foundation (BF), tower, and rotor nacelle assembly (RNA), in complex marine environmental conditions, a model test of in-water sinking for an offshore wind turbine and bucket foundation (OWT–BF) is conducted. The motion behavior of the OWT–BF and the sling tensions during the in-water sinking process are investigated, and the numerical method is validated through test results. The results demonstrate a positive correlation between the wave height and motion response of the OWT–BF. The most critical stage of the in-water sinking operation occurs when the top cover of the bucket is fully submerged, resulting from the substantial cross-sectional difference between the bucket base and the transition section. Furthermore, the closer the OWT–BF is to the seabed, the less it is affected by waves in terms of motion response. It is advisable to conduct the in-water sinking operation of the OWT–BF in sea states with wave heights below 1.5 m. Simultaneously, slings can efficiently control the motion response of the OWT–BF, thereby enhancing the safety of the sinking operation.

1. Introduction

At present, the proportion of offshore wind capacity is still relatively small compared to that of onshore wind capacity [1]. The complete utilization of offshore wind energy resources will effectively improve energy supply problems and generate significant economic benefits [2,3]. However, technical issues such as the construction, transportation, and installation of offshore wind power structures have been important factors restricting the development of offshore wind power. The traditional method of installing an OWT and its supporting foundations usually involves sea sweeping, positioning, transportation, piling, lifting, etc., and the entire construction process is operated at sea [4,5]. This method is difficult, costly, and time-consuming, and it is also limited by the marine environment and window period. Therefore, to accelerate the development of offshore wind power, there is an urgent need for a new and efficient program to improve the efficiency of offshore wind power construction [6].
To promote the development of offshore wind power, Tianjin University proposed a novel supporting structure for offshore wind power, i.e., a bucket foundation, which has the advantages of strong capsize resistance, bucket-top bearing, self-floating towing, and negative-pressure sinking [7], and it is mainly applied to soft clay (or silty clay) and fine sand (or sandy silt) foundations [8]. In recent years, the BF has been rapidly popularized and applied in the field of offshore wind power. In addition, the research team of the BF also developed a set of integrated for the construction, transportation, and installation of the OWT–BF, which mainly includes the processes of onshore prefabrication, air-floating towing, in-water sinking, and in-soil sinking. The integrated technology of the OWT–BF avoids the use of large-scale machinery such as lifting equipment at sea, simplifies the construction process, reduces the difficulty of offshore operation and the risk of damage to the wind turbine, and easily realizes the goal of immediate installation and use. The technology is not only safe, efficient, environmentally friendly, and economical, but also accelerates the low-cost, large-scale development and application of offshore wind power. The in-water sinking operation of the OWT–BF is one of the key steps of the integrated technology. The motion and dynamic characteristics of the OWT–BF during the sinking process are directly related to the safety of the installation, so these need to be focused on by research.
The BF can be regarded as an air-floating structure during the in-water sinking process, which is mainly provided with buoyancy by the gas inside the bucket and realizes in-water sinking through dynamic regulation of the gas. The concept of an air-floating structure was put forward as early as the 1980s, and it was subsequently studied by many scholars [9,10]. Compared to ordinary floating bodies, air-floating structures are characterized by the fact that the structure is supported by gas, and the gas inside the structure can absorb wave energy and reduce the motion response of the structure under the action of waves, which improves the safety of the structure [11,12,13]. Cheung et al. [14] analyzed the dynamic response of an air-floating platform consisting of a series of vertical cylinders with bottom openings by numerical methods, and the numerical results were better verified by model tests. The oscillations of the water column and the motion characteristics of the platform were discussed in detail. Lee and Newman [15] analyzed a very large floating structure (VLFS) supported by an air cushion. They assumed the air–water interface to be a free liquid surface and derived the extended equations of motion for rigid body motion and generalized modes. Pinkster et al. [16] analyzed the hydrodynamic characteristics of a large mobile offshore platform supported by gas. Based on the three-dimensional potential flow theory, the response transfer function of the structure under wave action was derived from numerical calculations and model tests. The results showed that the numerical method was able to better predict the motion and the bending moments of the structure in waves. Maeda et al. [17] proposed a pontoon-type mega floating structure supported by an air cushion. The wave pressure was analyzed by applying the potential flow theory using the pressure distribution method, and the pressure and volume changes of the air cushion were linearized to derive the basic characteristics of the elastic deflection of the structure. Ikoma et al. [18,19,20,21] investigated the motion characteristics and hydroelastic properties of air-floating structures under linear wave action. Regarding the in-water sinking of air-floating structures, T. Næss et al. [22] investigated the wave-slamming force on a four-bucket suction anchor during lifting and sinking into the water. The study reveals the importance of the suction-anchor-top cover passing through the splash zone and shows that the slamming force will not damage the structure and crane when the suction-anchor-top cover passes through the splash zone. Zhang et al. [23,24] conducted a model test on the in-water sinking of a four-bucket jacket foundation and revealed the effect of waves on the foundation during the sinking process. In addition, DNV-GL [25] also published a special recommendation manual on modeling and analysis methods for the offshore operation of multiple-bucket foundations.
From the above analysis, it can be seen that the current research mainly focuses on the in-water sinking of the foundation, none of which involves the tower or RNA. Due to the presence of the tower and RNA, the center of gravity of the OWT–BF is significantly higher compared to the foundation alone. The stability of the structure is significantly weaker, and the installation system is more complex, making the integrated installation of OWT–BF more difficult. The current OWT–BF integrated-installation programs were applied at water depths of less than 15 m, as shown in Figure 1. When the water depth is shallow, the in-water sinking process of the OWT–BF is fast, and it is correspondingly less difficult to install. Furthermore, the height of the bucket base is generally within the range of 5–15 m. Throughout the sinking process, when the bottom of the bucket contacts the seabed, the top cover is not submerged yet. Once the bucket base contacts the seabed, the OWT–BF is constrained by the soil, and the safety of the in-water sinking operation is significantly improved. Therefore, the integrated installation of an OWT–BF is relatively easy in shallow waters. In cases where the height of the bucket base is less than the actual water depth, the bottom of the bucket remains uncontacted with the seabed even when the bucket base is fully submerged. Due to the substantial difference in shape between the bucket base and the transition section, corresponding measures must be taken to assist in the completion of the in-water sinking operation of an OWT–BF. With the development of offshore wind power in China in deeper water, the actual water depth will be much greater than the height of the bucket base. Although the applicable water depth of BF can be up to 50 m [26,27], the installation difficulty increases significantly with the increase in water depth, so the integrated technology of OWT–BF will face serious challenges in deep water. Therefore, it is crucial to explore the motion law of the OWT–BF during the in-water sinking and to determine suitable conditions for the sinking environment for practical engineering applications. In this paper, considering the weight and shape of the OWT–BF, model tests are carried out based on the prototype 30 m-water-depth condition to study the motion law of the OWT–BF during the in-water sinking under wave action. The control strategy based on the use of slings and other auxiliary equipment to assist the operation of the OWT–BF’s in-water sinking is proposed and verified, which provides the theoretical support and technical guidance for the integrated technology of the OWT–BF.

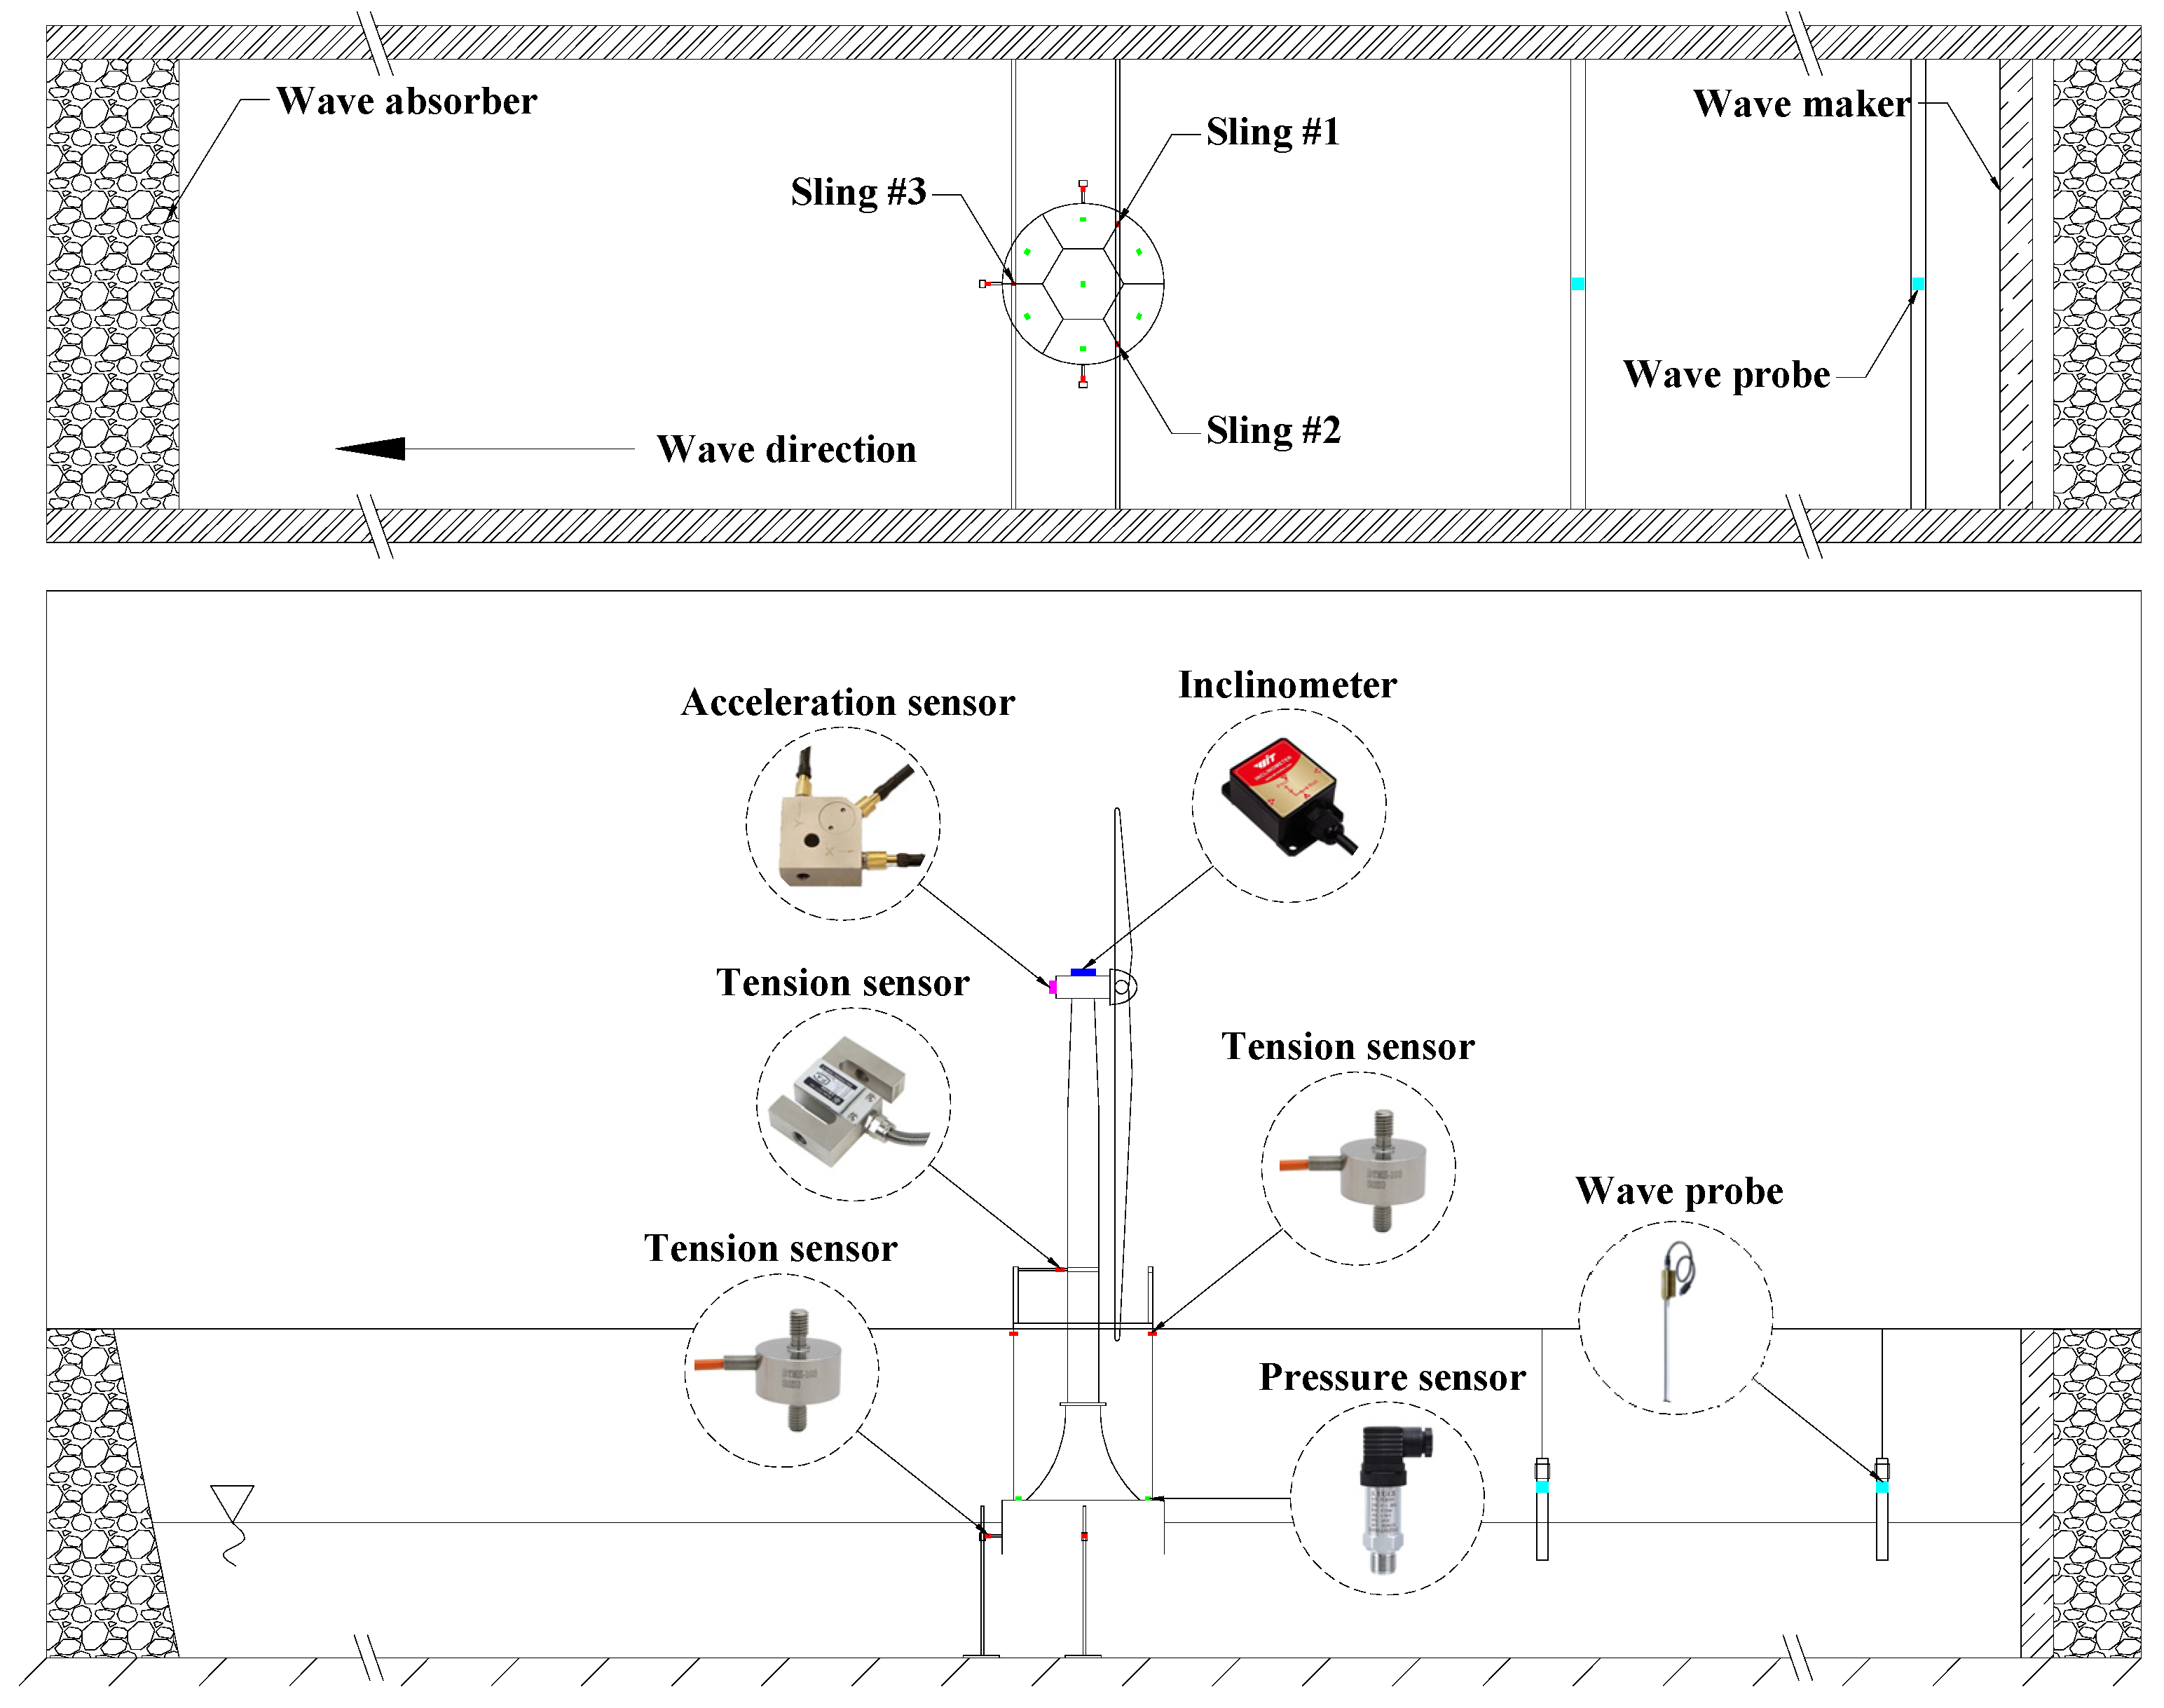
2. Experimental Techniques

2.1. Similarity Theory

The model test is an important means to study the hydrodynamics of ocean engineering, and the similarity principle is an important theory to guide the study of the model test as well as to forecast the hydrodynamic performance of the entity. The hydrodynamic model test in ocean engineering aims to examine the motion and forces acting on the structure within the oceanic environment, with gravity and inertia forces being the predominant factors influencing its behavior. Consequently, the model test must adhere to the Froude similarity criterion, indicating that the Froude number of the model and prototype must be equal, ensuring an accurate similarity in gravity and inertia forces between the model and the prototype. Additionally, the motion and forces exerted on the structure under wave action exhibit periodicity, requiring the model and prototype to maintain equality in the Strouhal number. So,
V m / g L m = V s / g L s ,
V m T m / L m = V s T s / L s
where Vm, Lm, and Tm are the velocity, wavelength, and period of the model, respectively; Vs, Ls, and Ts are the velocity, wavelength, and period of the prototype, respectively.
In actual engineering, the structure is in a seawater environment. However, the model test is carried out in the laboratory, and the test model is in a freshwater environment. Therefore, the density of seawater and freshwater should be maintained at a fixed ratio, and the ratio is generally γ = 1.025. According to the similarity theory, the proportional relationship between the physical quantities of the model and prototype is shown in Table 1.

2.2. Model Description

The test relies on a prototype of a 6.45 MW wind turbine situated within an offshore wind farm in the Jiangsu Sea area, as depicted in Figure 2. The prototype primarily comprises the BF (bucket base, transition section), tower, and RNA, and the test is conducted at a 1:50 scale. Based on the similarity theory, the principal parameters of the prototype and model of the OWT–BF are listed in Table 2.
Figure 3 illustrates the test layout of the OWT–BF. The BF is segmented into seven compartments, comprising six side compartments and a central hexagonal compartment. Each compartment is individually connected to an air pump using a dedicated gas pipe. A pressure sensor is employed to monitor the gas pressure within each compartment. Three slings, distributed at 120°, are positioned above the top cover of the bucket, with the tension of each sling measured using a tension sensor. In practical engineering, the OWT–BF is situated within the U-channel of the transportation and installation vessel. To reduce the motion of the OWT–BF during transportation and installation, three constraints are established within the U-channel. One end of each constraint is affixed to the inner wall of the U-channel, while the other end is in close contact with the bucket wall. The three constraints are positioned on both sides and in the middle of the U-channel. A spring device is employed to simulate the constraint during the test, and the bolts are adjusted to position the spring precisely in the middle of the bucket wall and in direct contact with the wall. The constraint frame is positioned in the middle of the tower and surrounds the tower. The inclinometer and acceleration sensor are positioned on the top of the nacelle. According to the right-hand spiral rule, the x-axis corresponds to the wave-spread direction representing the surge direction of the OWT–BF. The y-axis aligns with the width of the wave flume, which signifies the sway direction of the OWT–BF. The z-axis is defined as the vertical direction of the water surface, which represents the heave of the OWT–BF.

2.3. Test Conditions

Based on engineering experience, it is recognized that the in-water sinking process of the OWT–BF is relatively slow, resulting in a slow change in the liquid level inside the bucket. To facilitate the test analysis, the dynamic process of continuous sinking is decomposed into quasi-static processes with varying sinking depths. To prevent air leakage from the BF during the wet towing process and to account for the draft depth of the transportation and installation vessel in practical engineering, the initial sinking depth was established at 14 cm (prototype 7 m), with the sinking depth representing the height of the bottom of the bucket from the water surface. The maximum sinking depth is determined based on the model mass, leading to the establishment of a test water depth of 60 cm (30 m for the prototype). Considering the height of the bucket wall (12 m for the prototype) and the condition where the water surface aligns with the top cover of the bucket, the entire sinking process is divided into five depths following the principle of equal division, with a depth interval of 10 cm (5 m for the prototype). Generally speaking, the installation operation of offshore platforms is usually carried out in seasons with calm sea states, roughly equivalent to level 3–4 sea states, and the corresponding wave height is 0.5–2.5 m. Therefore, the wave heights of 0.5 m, 1.5 m, and 2.5 m are selected for the test. Currently, the installation of a few dozen OWT–BFs is completed by the integration technology of OWT–BF. According to the feedback from the actual project, the sea state of a wave period of 7–8 s has a more obvious influence on the in-water sinking operation of OWT–BF. Therefore, the wave period of 7.8 s is selected for the test. Simultaneously, adhering to the principle of a single variable and the requirement for force balance, the initial tension of the slings at each sinking depth is set to 10 N (prototype 1250 kN) by adjusting the gas pressure. The test conditions are detailed in Table 3.

3. Experimental Results and Discussion

3.1. Motion Responses

Recognizing the importance of the motion response of the wind turbine during in-water sinking, the top of the nacelle is equipped with an acceleration sensor and inclinometer for measuring the surge acceleration, heave acceleration, and pitch angle of the OWT–BF [28]. Comprising the bucket base and the transition section, the BF exhibits significant differences in body shape. To represent the relationship between the sinking depth and the height of the bucket base more intuitively, the relative sinking depth k is employed to indicate various sinking states. This involves expressing k as the ratio of the sinking depth to the height of the bucket base. If k is 1, the water surface aligns precisely with the top cover of the bucket. If k is less than 1, the water surface contacts the bucket base. If k is greater than 1, the water surface contacts the transition section, as depicted in Figure 4.
Figure 5 illustrates the surge acceleration, heave acceleration, and pitch angle of the OWT–BF under varying wave-height conditions at each sinking depth. It is evident that the surge acceleration, heave acceleration, and pitch angle exhibit an increase with the rising wave height at each sinking depth. In identical conditions, the surge acceleration significantly surpassed the heave acceleration. For wave heights less than 5 cm, pitch angles remained within 2°.
For k values less than 1, the surge acceleration decreased with an increase in k. This occurs because the height difference between the liquid surface inside and outside the bucket remains unchanged until the water surface reaches the top cover of the bucket. As k increased, the gas volume in the compartment decreased, and, concurrently, the liquid volume and surge radiation damping increased, resulting in a decrease in surge acceleration. Two factors contribute to the decrease in the pitch motion during this stage. On the one hand, both the additional mass and the radiation damping of the pitch increase with the growing sinking depth. On the other hand, the reduction in the distance between the center of gravity and the center of buoyancy enhances stability.
At k values slightly above one, the surge acceleration increased from 0.01 g, 0.03 g, and 0.04 g to 0.03 g, 0.19 g, and 0.31 g for wave heights of 1 cm, 3 cm, and 5 cm, while the pitch angles increased from 0.21°, 0.71°, and 1.43° to 0.43°, 1.15°, and 1.83°, respectively. Evidently, both the surge acceleration and the pitch angle experienced a substantial increase in this stage. At k equal to 1.4, both the surge acceleration and pitch angle attained their maximum values during the entire sinking process. Concurrently, with a wave height of 5 cm, the surge acceleration of 0.31 g surpassed the permissible maximum horizontal acceleration of 0.25 g for the wind turbine. The sudden increase in motion during this stage can be attributed to the water surface surpassing the top cover of the bucket. Consequently, the wave exerted pressure on both the top cover of the bucket and the transition section, leading to the generation of vertical wave forces. Due to the impact of the vertical wave, the motion of the OWT–BF intensified, leading to an augmentation in both the surge acceleration and pitch angle during this stage.
With the ongoing increase in k, both the surge acceleration and pitch angle exhibited a decreasing trend, and the magnitude of the decrease was substantial. The surge acceleration decreased to less than 0.1 g, and the pitch angle reduced to less than 0.6°. This can be attributed to the low rate of change in the cross-sectional area of the transition section with the sinking depth when the water surface reached the transition section. Consequently, there was a slow change in gas volume in the compartments during this sinking phase. Additionally, with the decreasing volume of gas in the bucket, the influence of the gas on the motion of the OWT–BF gradually diminished, resulting in a decrease in both the surge acceleration and pitch angle. Simultaneously, the heave acceleration remained within 0.05 g, which is significantly below the permissible heave acceleration of 0.2 g for the wind turbine. Consequently, the impact of heave acceleration on the in-water sinking of the OWT–BF was relatively negligible.

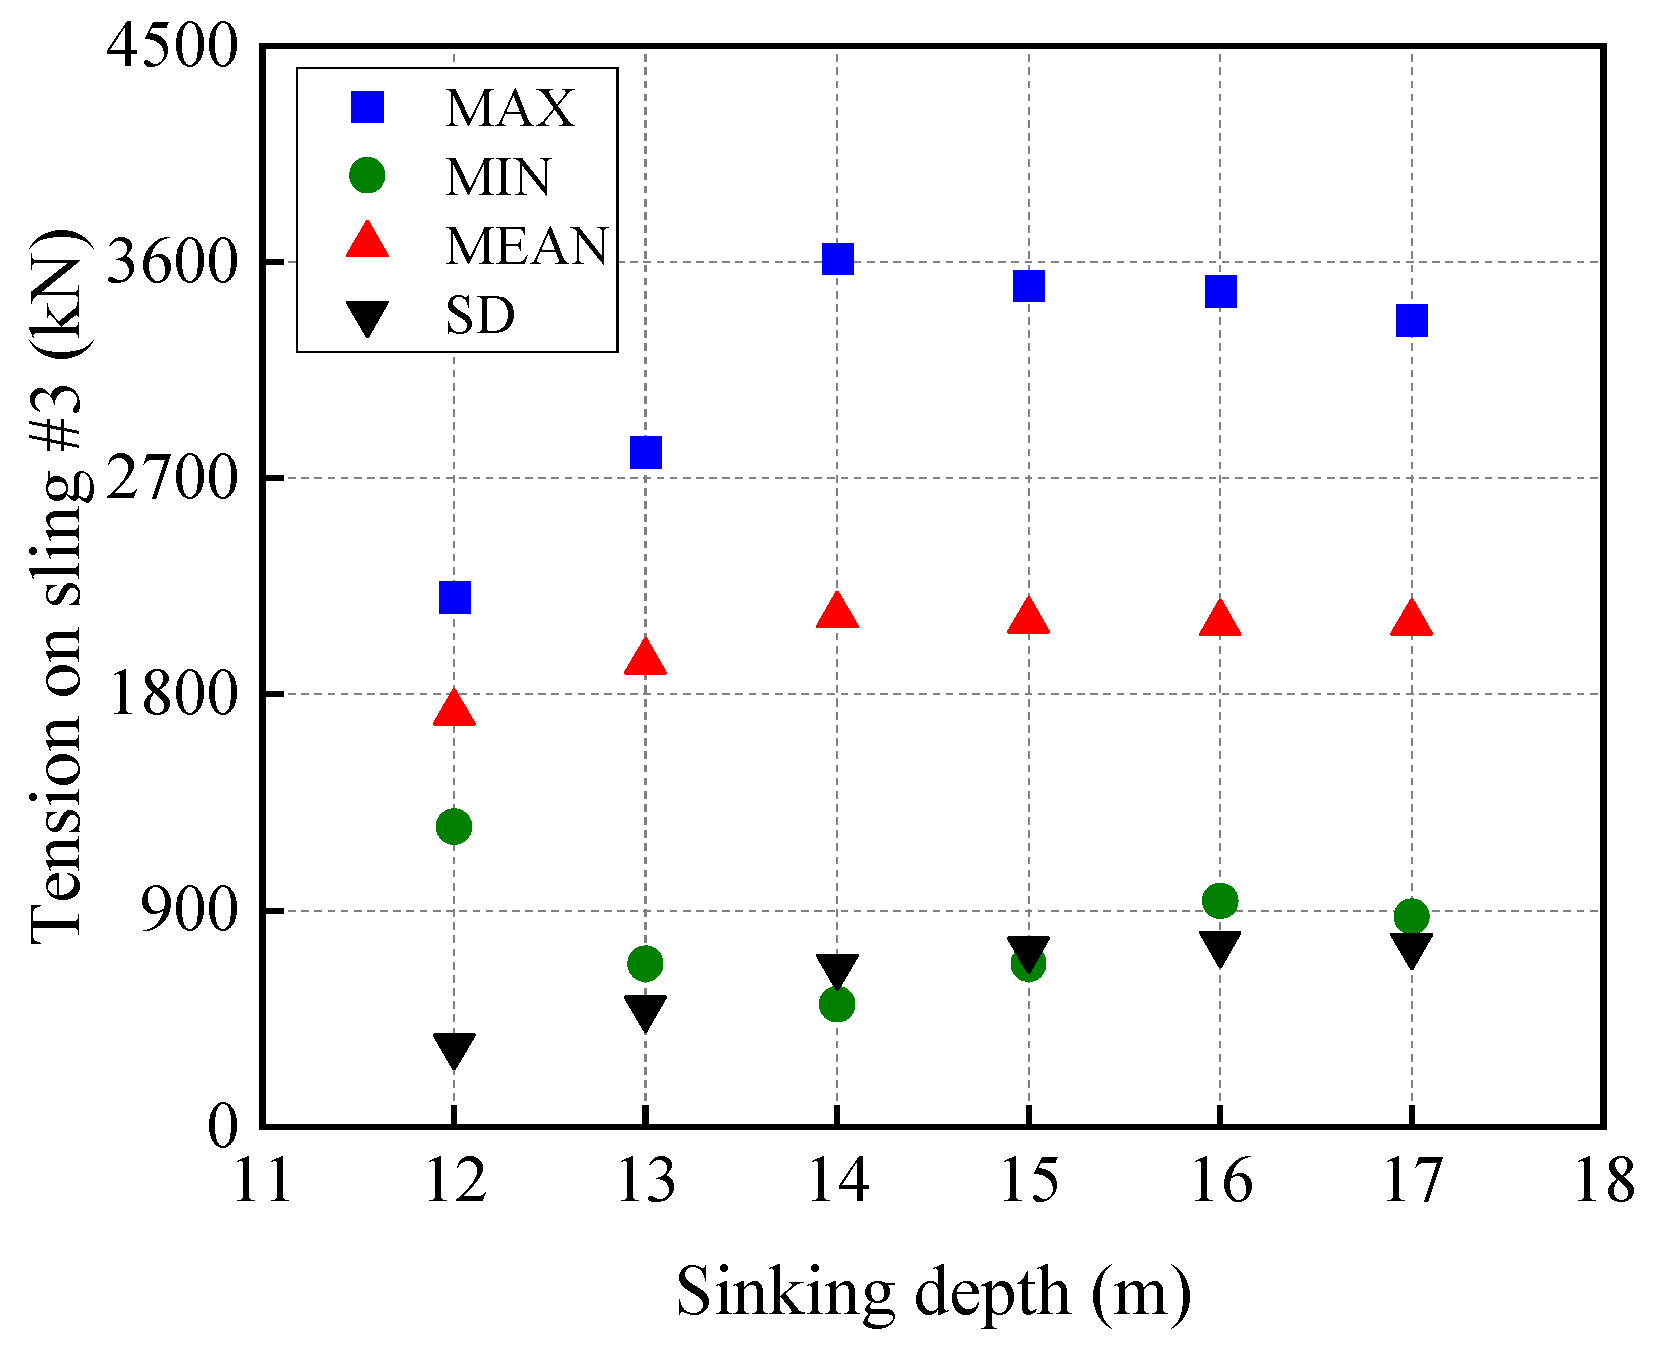
3.2. Tension on Sling

The in-water sinking operation of the OWT–BF primarily relies on the collaboration between gas pressure and slings. Since slings serve as crucial auxiliary tools, variation in tensions on slings can, to some extent, reflect the interaction between the OWT–BF and the installation vessel. Figure 6 shows the tensions on slings #1, #2, and #3 under different wave heights at each sinking depth. The tensions on slings #1 and #2 closely matched each other as they were situated on the wave-facing side and symmetrically arranged. The tension on sling #3, positioned on the wave-back side, was notably larger than that on sling #1 and #2.
At k values less than 1, the tensions on slings #1, #2, and #3 exhibited a tendency to decrease as k increased. This is attributed to the fact that, before the water surface exceeds the top cover of the bucket, the waterline surface area remains unchanged, resulting in the water-spring stiffness remaining constant. With an increase in sinking depth, the gas pressure remains constant, and concurrently, the gas volume in the compartment decreases. This results in an increase in the stiffness of the gas spring. Consequently, the heave stiffness of the gas spring and water spring in series increases. Additionally, the increase in the additional mass and radiation damping of the heave also causes a deceleration of the vertical motion of the OWT–BF. Consequently, these factors contribute to the decrease in the tension on slings #1, #2, and #3 at this stage.
At the point where k exceeded 1, the tensions on slings #1, #2, and #3 experienced an increase. This is because, at the point where the water surface exceeded the top cover of the bucket, the surface wave acted directly on the top cover of the bucket and the transition section, significantly intensifying the vertical effect of the wave. Additionally, it was observed during the test that, due to the close proximity between the water surface and the top cover of the bucket, a water splash occurred above the top cover of the bucket. This splash would intensify the pitch and heave motion of the OWT–BF, leading to increased tension on slings #1, #2, and #3 during this stage.
As k continued to increase, the tensions on slings #1, #2 and #3 decreased. During this stage, no splashing occurred. This is because an increase in the height of the top cover of the bucket from the water surface weakened the vertical action of waves. Additionally, as the submerged volume of the transition section increased, the distance between the center of gravity and the center of buoyancy of the OWT–BF decreased, which led to increased stability. Consequently, the tensions on slings #1, #2, and #3 all decreased during this stage.

4. Numerical Analysis

4.1. Modeling

Figure 7 illustrates the in-water sinking system of the OWT–BF, comprising RNA, tower, bucket, three slings above the top cover, three constraints at the periphery of the bucket wall, and the limit frame of the tower. The focus of this paper is on the motion behavior of the OWT–BF during the in-water sinking process, excluding consideration of the influence of the vessel on the OWT–BF. Consequently, slings, constraints, and limit frames are simulated in a simplified manner. According to the model test device, three slings are positioned above the top cover of the bucket and distributed at 120°. The three constraints are positioned at the left, right, and rear of the bucket, respectively, with a distribution of 90 degrees. Given that the collision of the OWT–BF with the constraints during the in-water sinking process results in an axial deformation of the constraint, the constraints are simulated using the fender model in SIMA [29]. The limit frame surrounds the tower, and the motion of the tower induces axial deformation of the limit frame, so the limit frame is modeled with springs.

4.2. Validation of Numerical Results
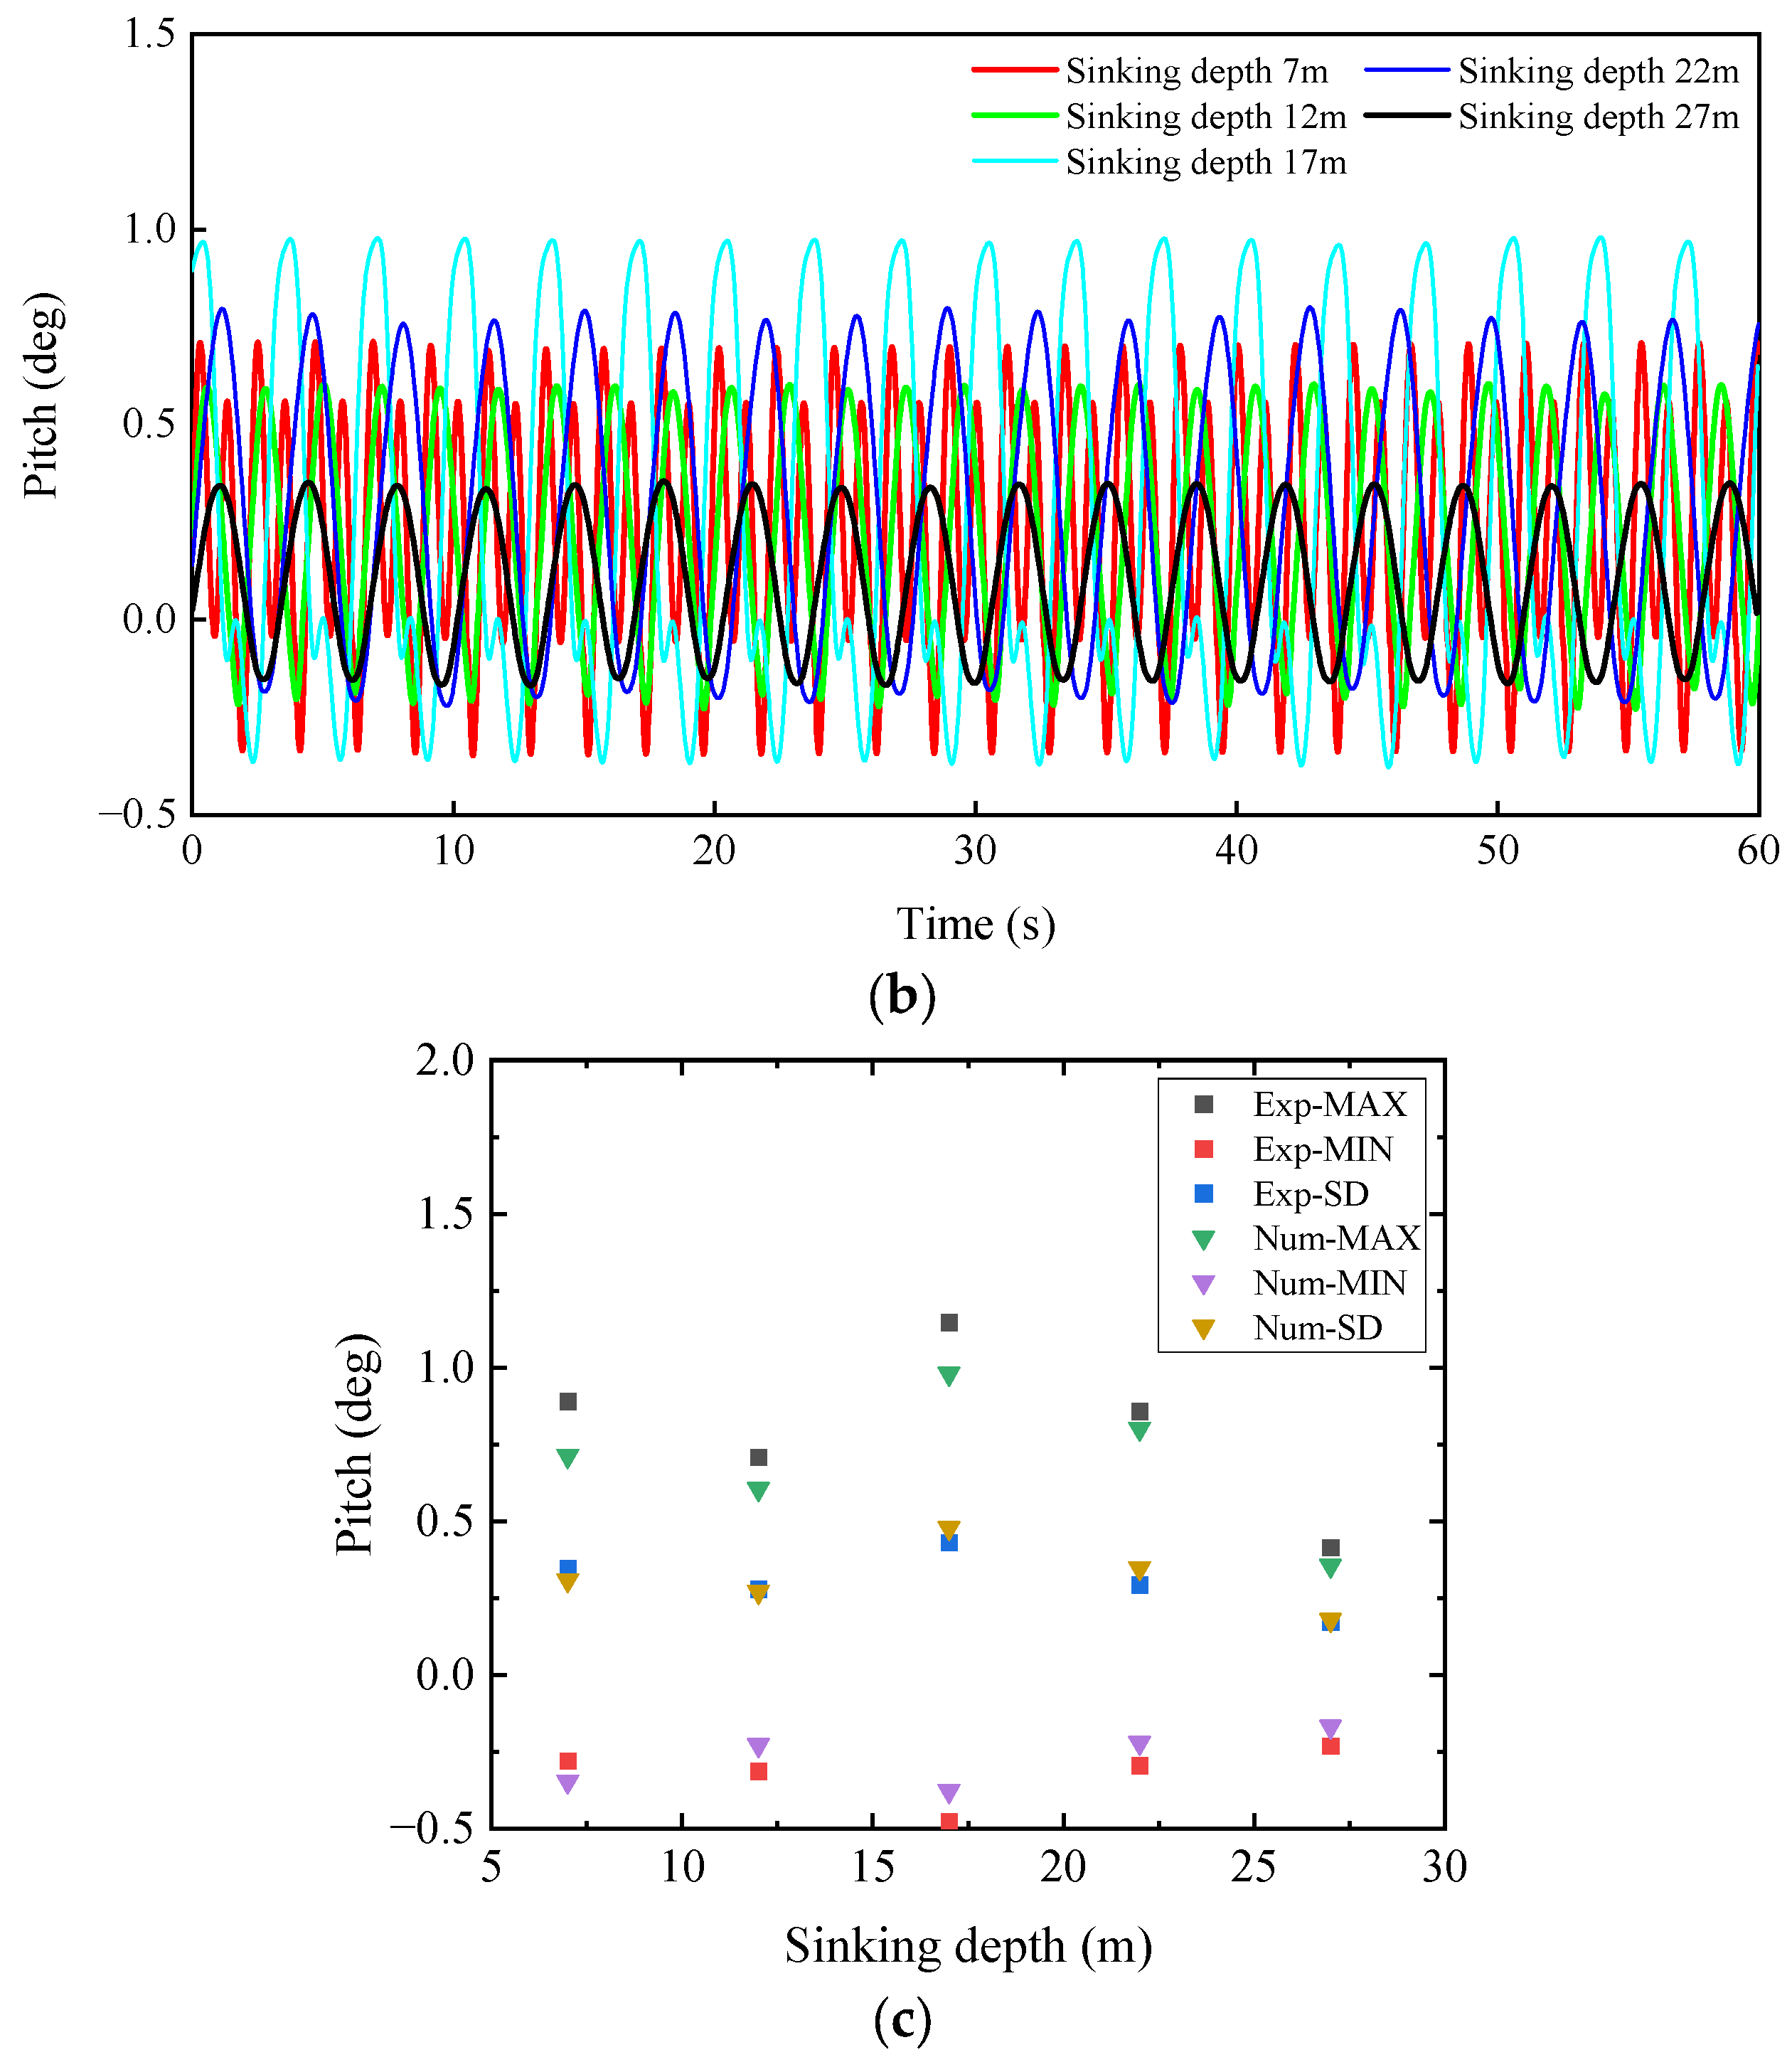
4.2.1. Pitch

Figure 8 displays the time trajectories and statistical values of the pitch angle for the OWT–BF in both the model tests and numerical simulations at various sinking depths with a wave height of 1.5 m. The results indicate that the standard deviation values obtained through the numerical method align with the test results. As the sinking depth increased from 7 m to 27 m, the maximum values of pitch angle varied as follows: 0.890°, 0.709°, 1.148°, 0.859°, and 0.414° for the test results, and 0.713°, 0.605°, 0.980°, 0.801°, and 0.355° for the simulation results, respectively. The increases in the test results over the simulation results were 19.9%, 14.7%, 14.6%, 6.7%, and 14.3%, respectively. This suggests that the test results for the pitch angle were consistently higher than the simulation results. This difference is attributed to the model test being conducted in a 2 m wide and 70 m long flume, where the OWT–BF experienced sidewall effects and wave reflection, introducing a disparity between the model test and the numerical simulation. Nonetheless, the disparity between the two was relatively minor, and the trends in the pitch angle with sinking depth in both the tests and simulations were consistent.

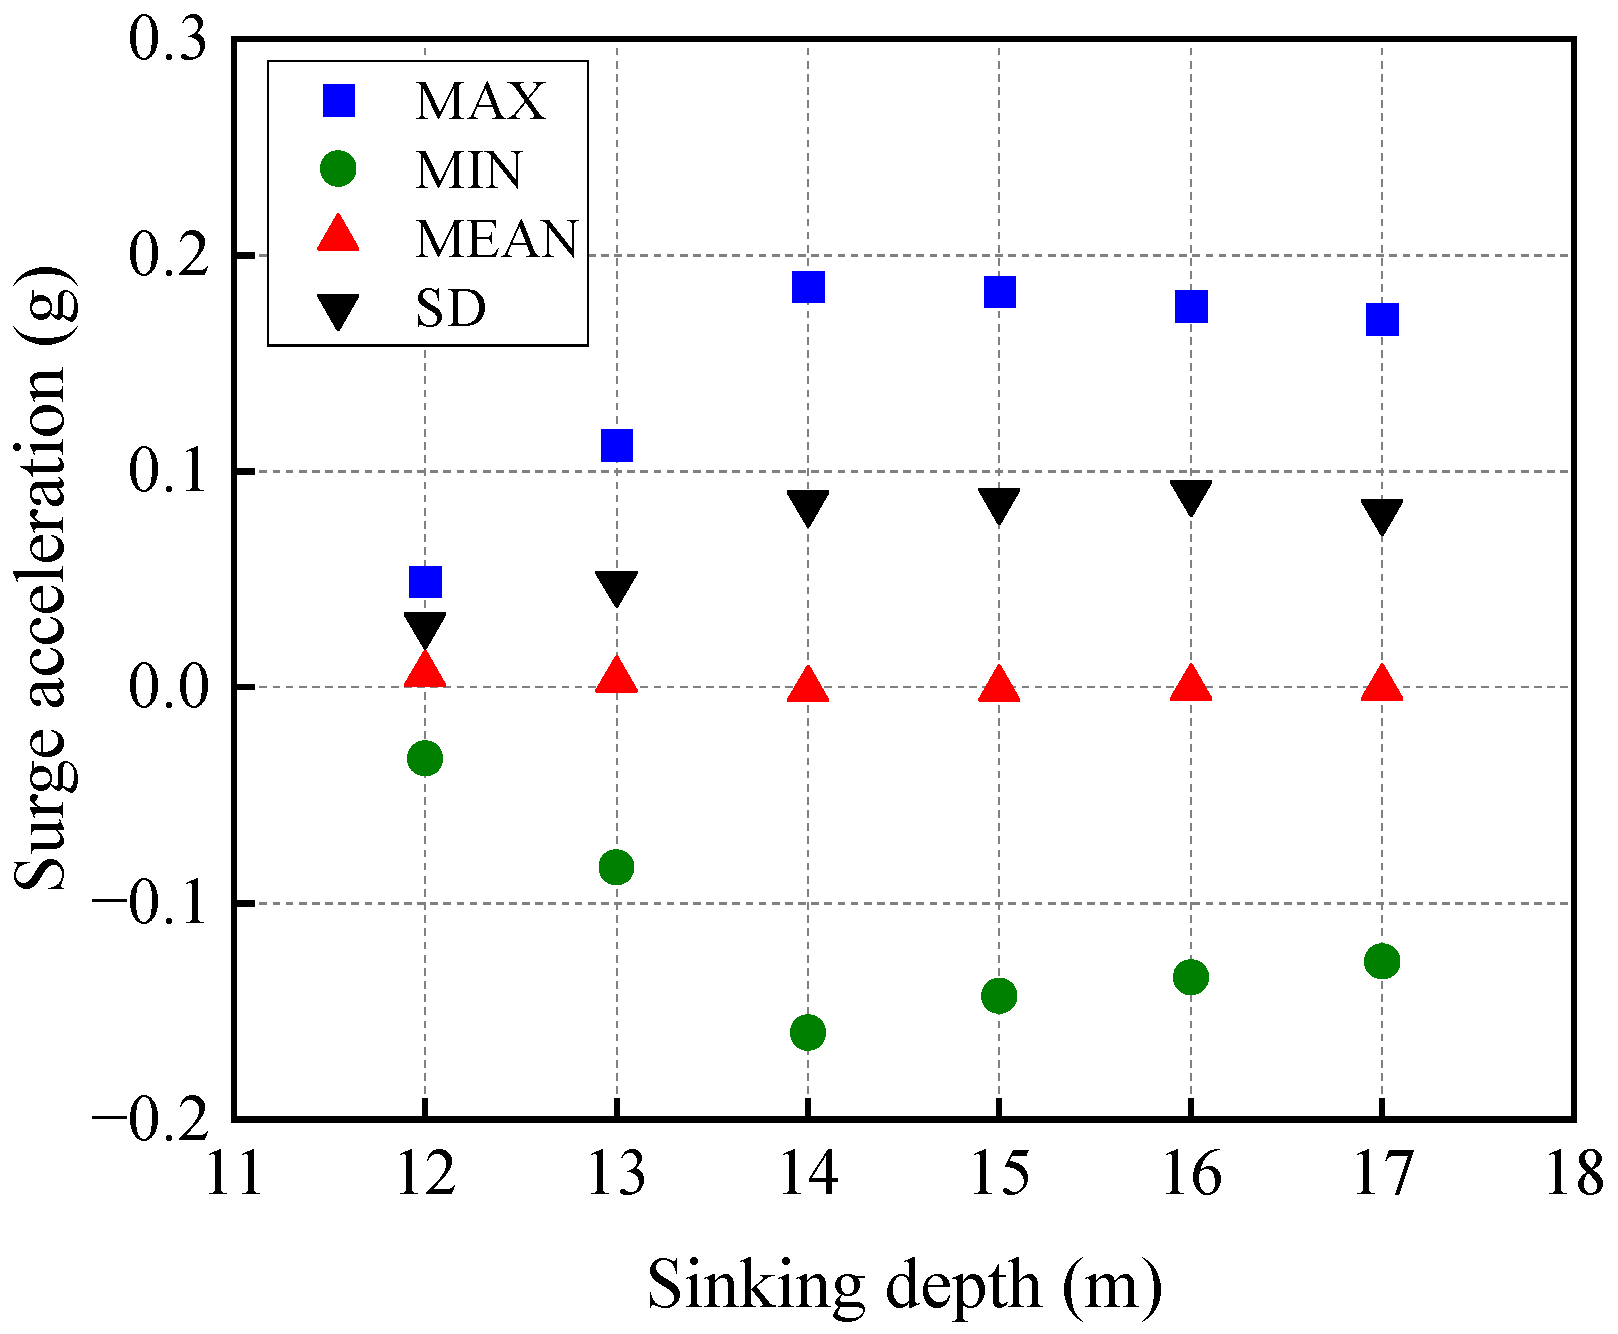
4.2.2. Surge Acceleration

Figure 9 illustrates the time trajectories and statistical values of surge acceleration for the OWT–BF in both the model tests and numerical simulations at various sinking depths with a wave height of 1.5 m. The variation trend of surge acceleration with changing sinking depth was consistent between the test and simulation results. As the sinking depth increased from 7 m to 27 m, the maximum values of surge acceleration were 0.113 g, 0.060 g, 0.184 g, 0.110 g, and 0.040 g for the test results, and 0.092 g, 0.050 g, 0.017 g, 0.092 g, and 0.034 g for the simulation results, respectively. The test results were slightly larger than the simulation results, which can be attributed to the model test being conducted in a wave flume, while the numerical method accurately simulates the marine environment. Additionally, the numerical method uses a sealing approach to simulate the air–liquid surface in the bucket, in contrast to the compressible gas in the test. This led to a slightly larger test result than the simulation results, but the difference was not significant.

4.2.3. Tension on Slings

Compared to the numerical methods, ensuring exact consistency in length and stiffness for each sling during the test is challenging due to the layout of the slings, potentially influencing the test results. Figure 10 illustrates the time trajectories and statistical values of the tension on sling #1 in both the model tests and numerical simulations at various sinking depths with a wave height of 1.5 m. As the sinking depth increased from 7 m to 27 m, the maximum values of the tension on sling #1 were 1357 kN, 1518 kN, 1358 kN, 1375 kN, and 1593 kN for the test results, and 1402 kN, 1541 kN, 1411 kN, 1468 kN, and 1541 kN for the simulation results, respectively. The increases in the test results over the simulation results were 3.2%, 1.5%, 3.7%, 6.3%, and 3.4%, respectively. The average values of the sling tensions in the test and simulation results fell between 1200 kN and 1600 kN, closely aligning with the initial values of the sling tensions and demonstrating good agreement. Furthermore, the variation trends for the sling tensions in the test and simulation results were fundamentally the same with the increasing sinking depth.

4.3. Determination of Dangerous Conditions

From both the test and simulation results, it can be observed that as the sinking depth increased from 12 m to 17 m, the sling tension, pitch angle, and surge acceleration all exhibited an increase, reaching their maximum values throughout the sinking process. Due to the small size of the test model, subdividing the sinking depth resulted in insignificant changes in the test results. Therefore, the dynamic characteristics of the OWT–BF at sinking depths from 12 m to 17 m were analyzed by numerical methods at 1 m intervals.
From the above analysis, the variation trend of the tensions on the three slings with changes in sinking depth is consistent. Under the same conditions, the tension on sling #3 was larger than those on slings #1 and #2. Therefore, sling #3 was analyzed in this section. Figure 11 illustrates the tension on sling #3 at sinking depths from 12 m to 17 m. The results indicated that when the sinking depth increased from 12 m to 17 m, the maximum values of the sling tensions were 2204 kN, 2808 kN, 3613 kN, 3500 kN, 3479 kN, and 3357 kN, respectively. When the sinking depth increased from 12 m to 14 m, the tension kept increasing by 64.0%. Subsequently, when the sinking depth increased from 14 m to 17 m, the tension tended to decrease by 7.1%. Consequently, the tension on the slings was maximal at a sinking depth of 14 m.
Figure 12 presents the pitch angle at sinking depths from 12 m to 17 m. The results show that when the sinking depth increases from 12 m to 14 m, the pitch angle exhibits a large increasing trend. The maximum, minimum, and average values of the pitch angle increased from 0.60°, 0.23°, and 0.23° to 1.18°, 0.55°, and 0.31°, representing increases of 95.3%, 138.6%, and 32.5%, respectively. When the sinking depth increased from 14 m to 17 m, the pitch angle showed a slower decreasing trend. The maximum, minimum, and average values of the pitch angle decreased to 0.98°, 0.38°, and 0.28°, with decreases of 17.0%, 30.8%, and 9.4%, respectively. Consequently, the pitch angle reached its maximum when the sinking depth was 14 m.
Figure 13 shows the surge acceleration at sinking depths from 12 m to 17 m. The results indicate that when the sinking depth increased from 12 m to 14 m, the surge acceleration kept increasing, with the maximum and minimum values of the surge acceleration increasing from 0.050 g and 0.032 g to 0.186 g and 0.160 g, respectively. When the sinking depth increased from 14 m to 17 m, the surge acceleration showed a decreasing trend, and the maximum and minimum values decreased to 0.170 g and 0.126 g, respectively. Consequently, the trends of sling tension, pitch angle, and surge acceleration with sinking depth were consistent at sinking depths from 12 m to 17 m. Moreover, they all reached a maximum at a sinking depth of 14 m, where the relative sinking depth k was 1.2.

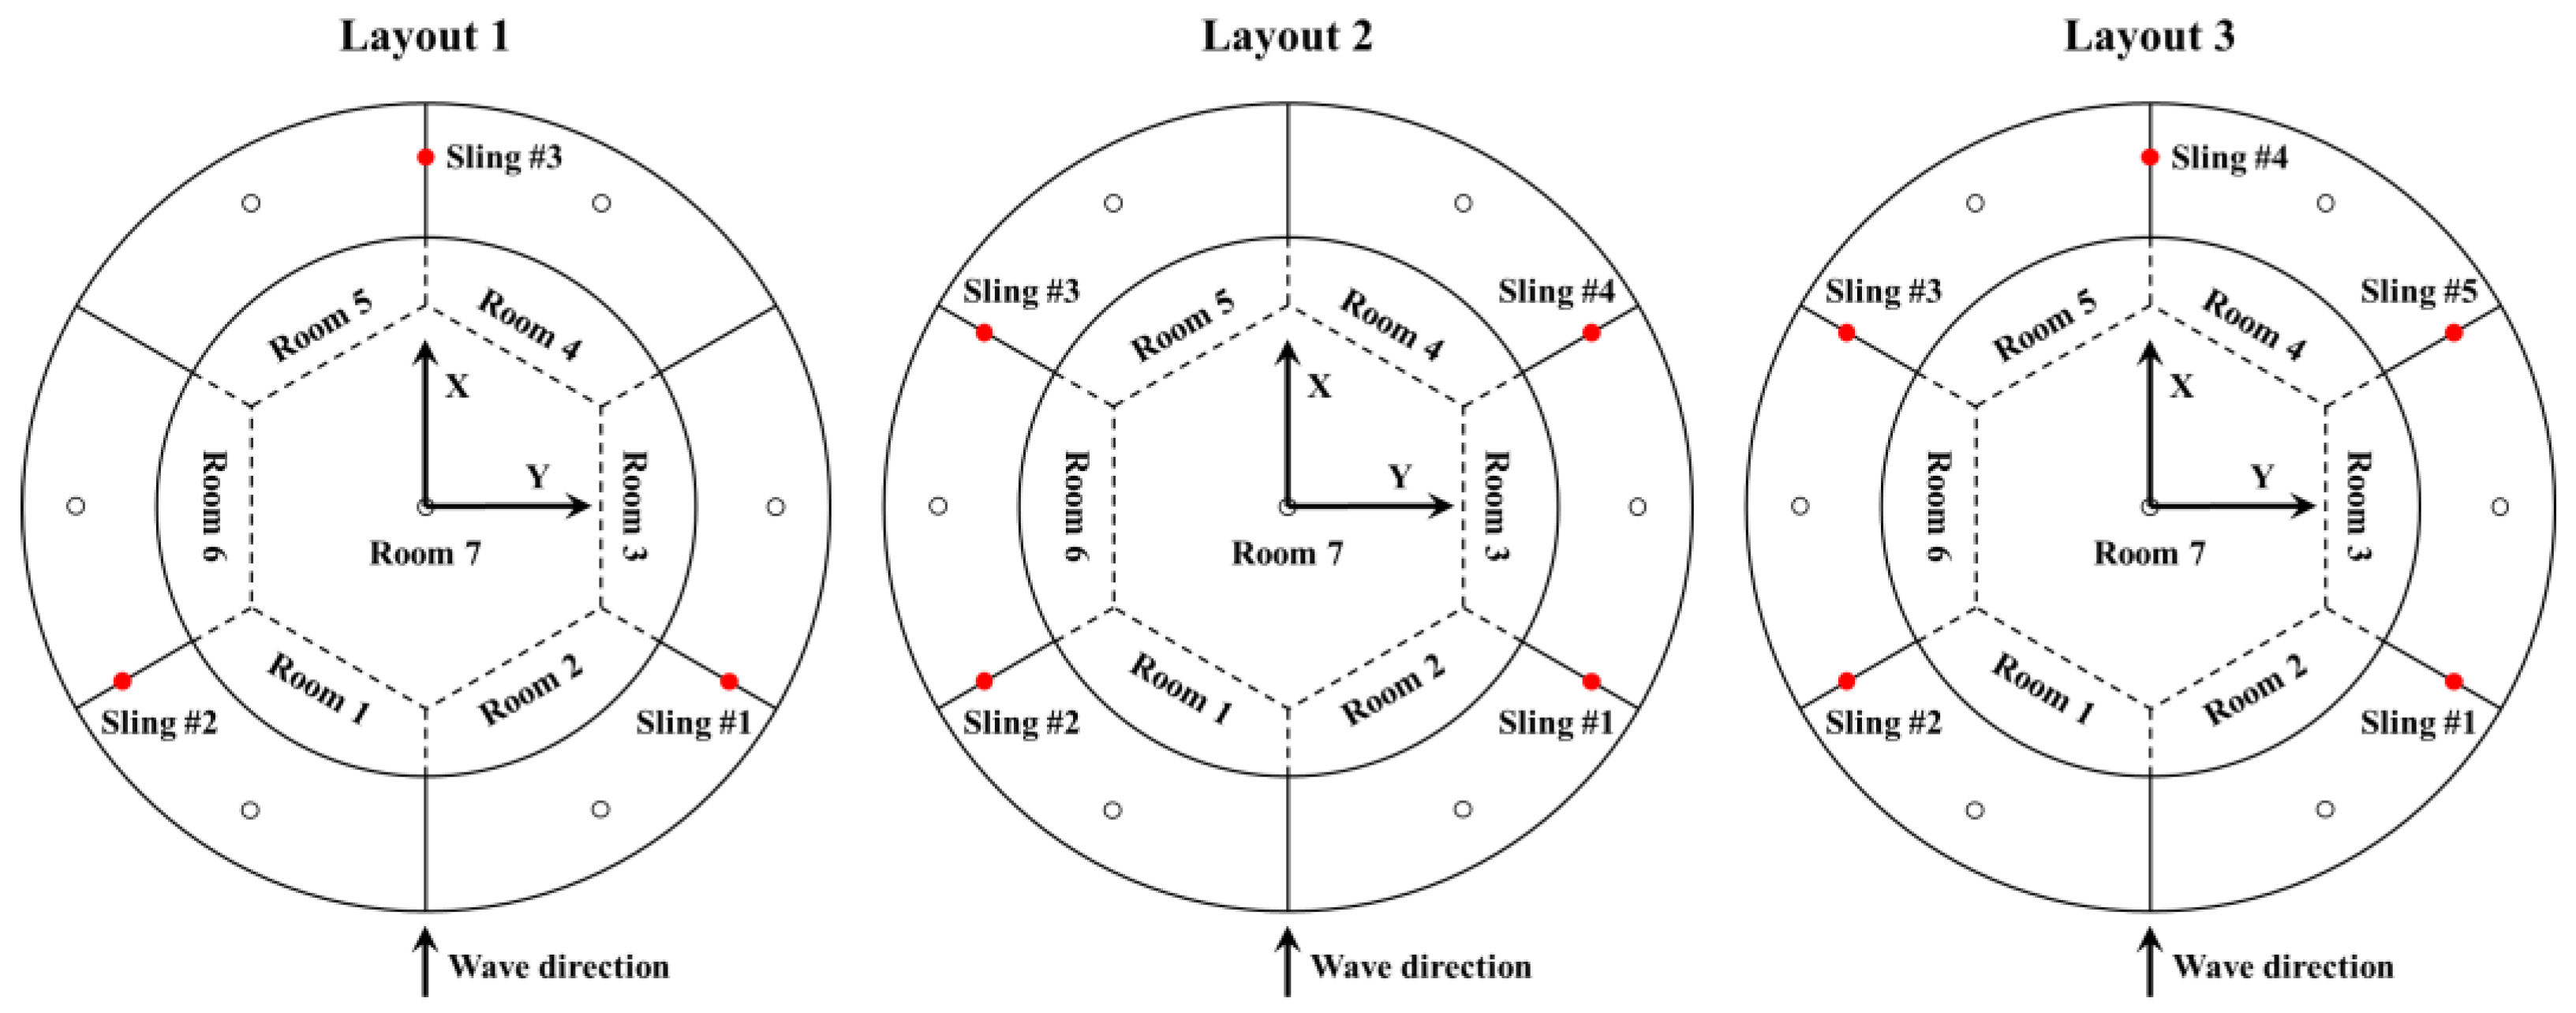
4.4. Optimization of Sling Layout

The sling is an important auxiliary tool during the in-water sinking process of the OWT–BF, and it is essential to study the layout of the sling. According to the analysis in Section 4.3, the maximum values of the sling tension, pitch angle, and surge acceleration all appeared at sinking depths between 12 m and 17 m, so this section focuses on the motion behaviors of the OWT–BF in this interval of sinking depth. The in-water sinking operation of the OWT–BF was conducted with the assistance of the transportation and installation vessel. The OWT–BF was located in the U-channel of the transportation and installation vessel, and the slings were positioned above the top cover of the bucket. As the layout of the slings is limited by the U-channel, considering that the opening side of the U-channel cannot be arranged with slings, only the inner side of the U-channel is considered to be arranged with slings. In summary, three layouts were selected, and the numbers of slings were 3, 4, and 5, respectively, as shown in Figure 14.
Figure 15 shows the pitch angle and surge acceleration of the OWT–BF for the three layouts of slings. In Figure 15a, when the sinking depth increased from 12 m to 17 m, the pitch angles varied as follows: 0.60°, 1.11°, 1.18°, 1.09°, 1.04°, and 0.98° for layout 1; 0.87°, 1.53°, 1.52°, 1.51°, 1.42°, and 1.23° for layout 2; and 0.46°, 1.06°, 1.26°, 1.15°, 1.00°, and 0.91° for layout 3. The results indicate that the pitch angles of layout 1 and layout 3 were smaller than those of layout 2 under identical conditions, with the difference between the pitch angles of layout 1 and layout 3 being less pronounced. Figure 15b reveals that the surge acceleration of layout 2 surpassed that of layout 1 and layout 3 for sinking depths from 12 m to 17 m. At a sinking depth of 14 m, the surge acceleration values for layout 1, layout 2, and layout 3 were 0.186 g, 0.246 g, and 0.184 g, respectively. The surge acceleration of layout 2 exceeded that of layout 1 and layout 3 by 32.3% and 33.7%, respectively. Consequently, both the pitch angle and surge acceleration of layout 2 with four slings surpassed those of layout 1 with three slings and layout 3 with five slings. Simultaneously, there were minimal disparities in both pitch angle and surge acceleration between layout 1 and layout 3. Considering safety and economic factors, layout 1, comprising three slings, emerges as the most reasonable option.

5. Control Strategies for the In-Water Sinking Process of the OWT–BF

The presence of superstructures, such as towers and RNAs, significantly raises the center of gravity of the entire structure. This leads to the OWT–BF failing to meet stability requirements, even though the BF itself satisfies self-floating stability requirements. Additionally, when the structure tilts under external loads, the gas inside the bucket compresses and fails to provide sufficient restoring force. Consequently, auxiliary equipment and control strategies are essential for the in-water sinking operation of the OWT–BF. The coordinated action of slings will effectively control the motion response of the OWT–BF, facilitating the sinking operation under more complex environmental conditions.
According to the above analysis, there is a similarity in the change rule of the motion response of the OWT–BF and the sling tensions with the sinking depth. Consequently, the entire sinking process is divided into three stages as follows:
Stage 1: Rapid Sinking Stage. Before the water surface reaches the top cover of the bucket, given the columnar structure of the bucket base, the sinking operation at this stage is performed by discharging the gas in the bucket evenly. Simultaneously, the sinking speed of the OWT–BF and the release speed of the sling are determined by the gas discharge speed, ensuring uniformity throughout the entire sinking process.
Stage 2: Hovering Stage. As the water surface approaches the top cover of the bucket, the sinking operation is halted. During this stage, filling the compartments of the top cover with water prevents the rapid inflow of seawater immediately after the water surface surpasses the top cover. This precaution avoids an imbalance of force, which could result in a sudden increase in the sling tension. Subsequently, the tension on the slings is heightened to enhance their constraints on the OWT–BF, limiting the motion response during the most dangerous stage.
Stage 3: Slow Sinking Stage. Once the water surface surpasses the top cover, the OWT–BF accelerates its sinking when the gas is evenly discharged due to the decreasing cross-sectional area of the transition section. However, excessive sinking speed may lead to the loss of sling constraint, resulting in the OWT–BF losing balance. Hence, this stage involves sinking to a specific depth and then pausing to make real-time adjustments in sling tension and air pressure to achieve equilibrium. This process is iterated until the entire sinking operation is completed.

6. Conclusions

The BF has broad application potential in the field of offshore wind power. To enhance the integrity, safety, and reliability of the integrated technology of the OWT–BF, it is of great significance to study the in-water sinking process of the OWT–BF. In this paper, the behavior of the OWT–BF during the in-water sinking process under wave action is investigated through both model tests and numerical simulations. The primary conclusions are as follows:
(1)
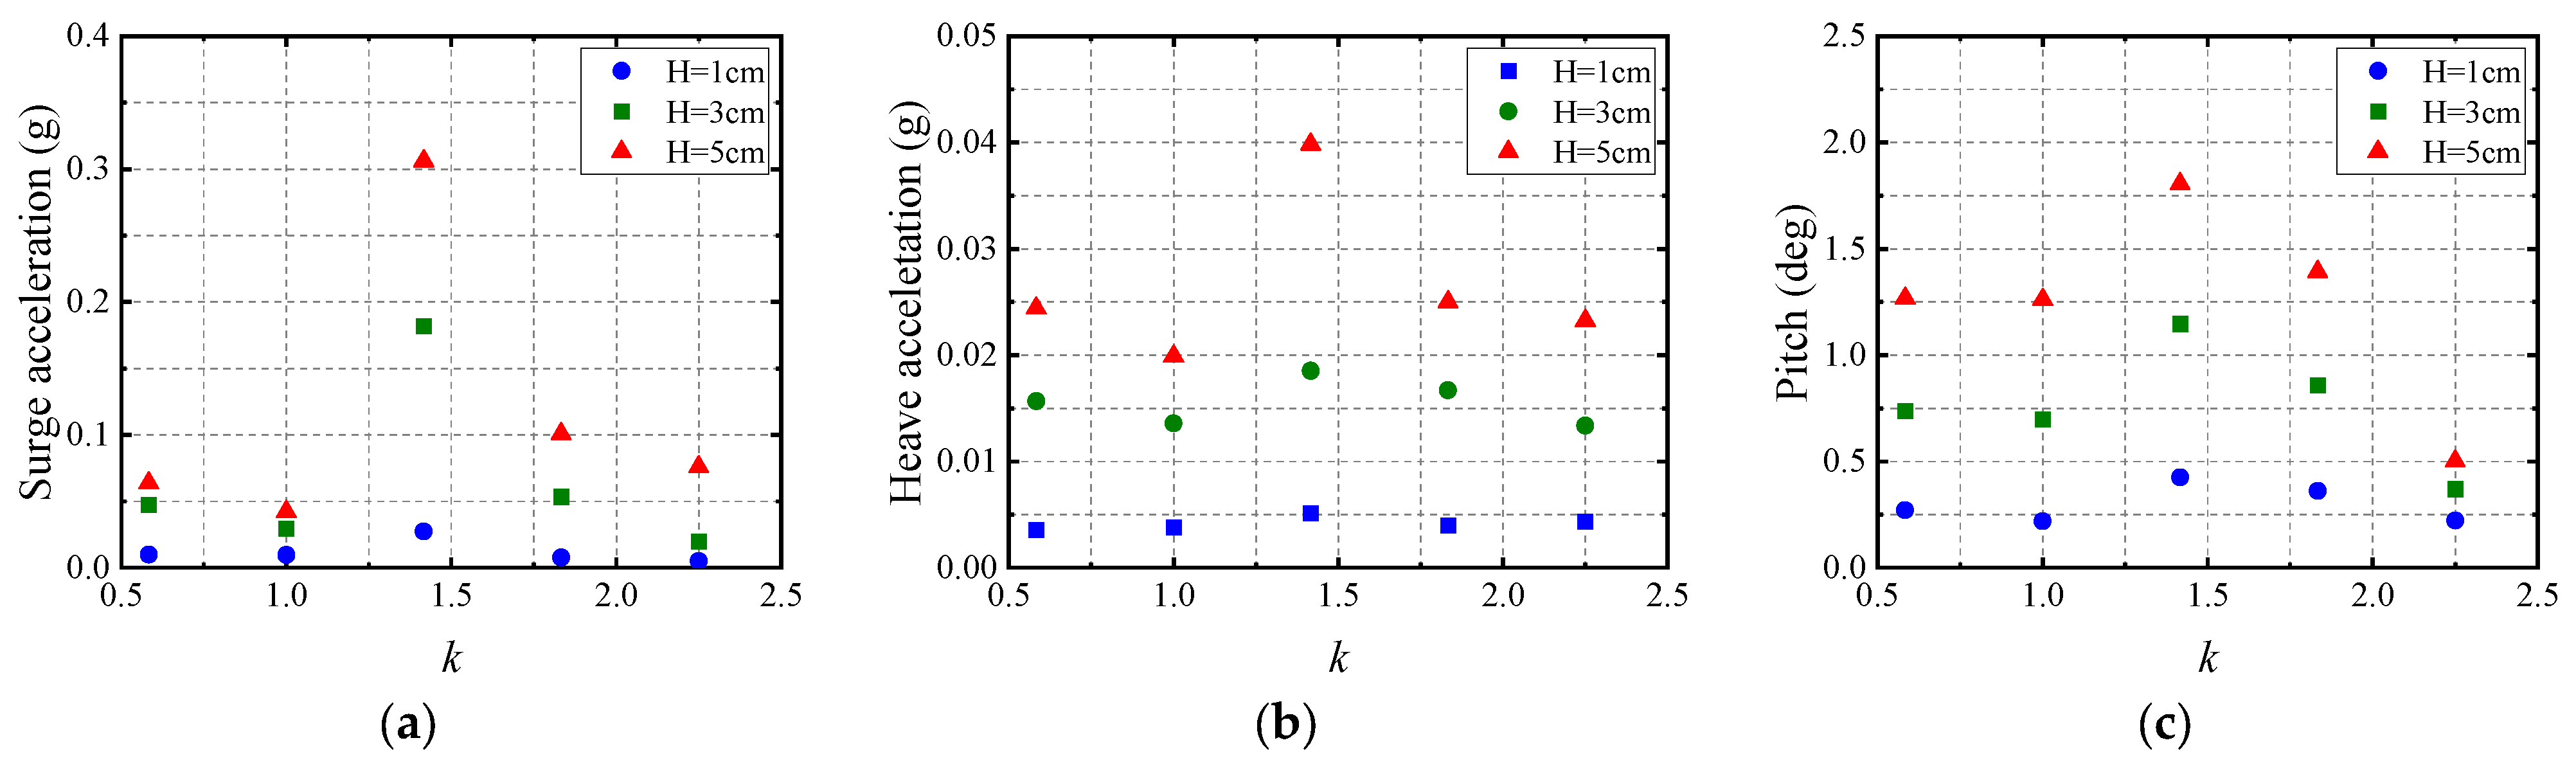
During the in-water sinking process, the motion of the OWT–BF and the sling tensions increase with an increase in the wave height. Under identical conditions, the surge acceleration is obviously larger than the heave acceleration, establishing the surge acceleration as the predominant controlling factor of the in-water sinking process of the OWT–BF.
(2)
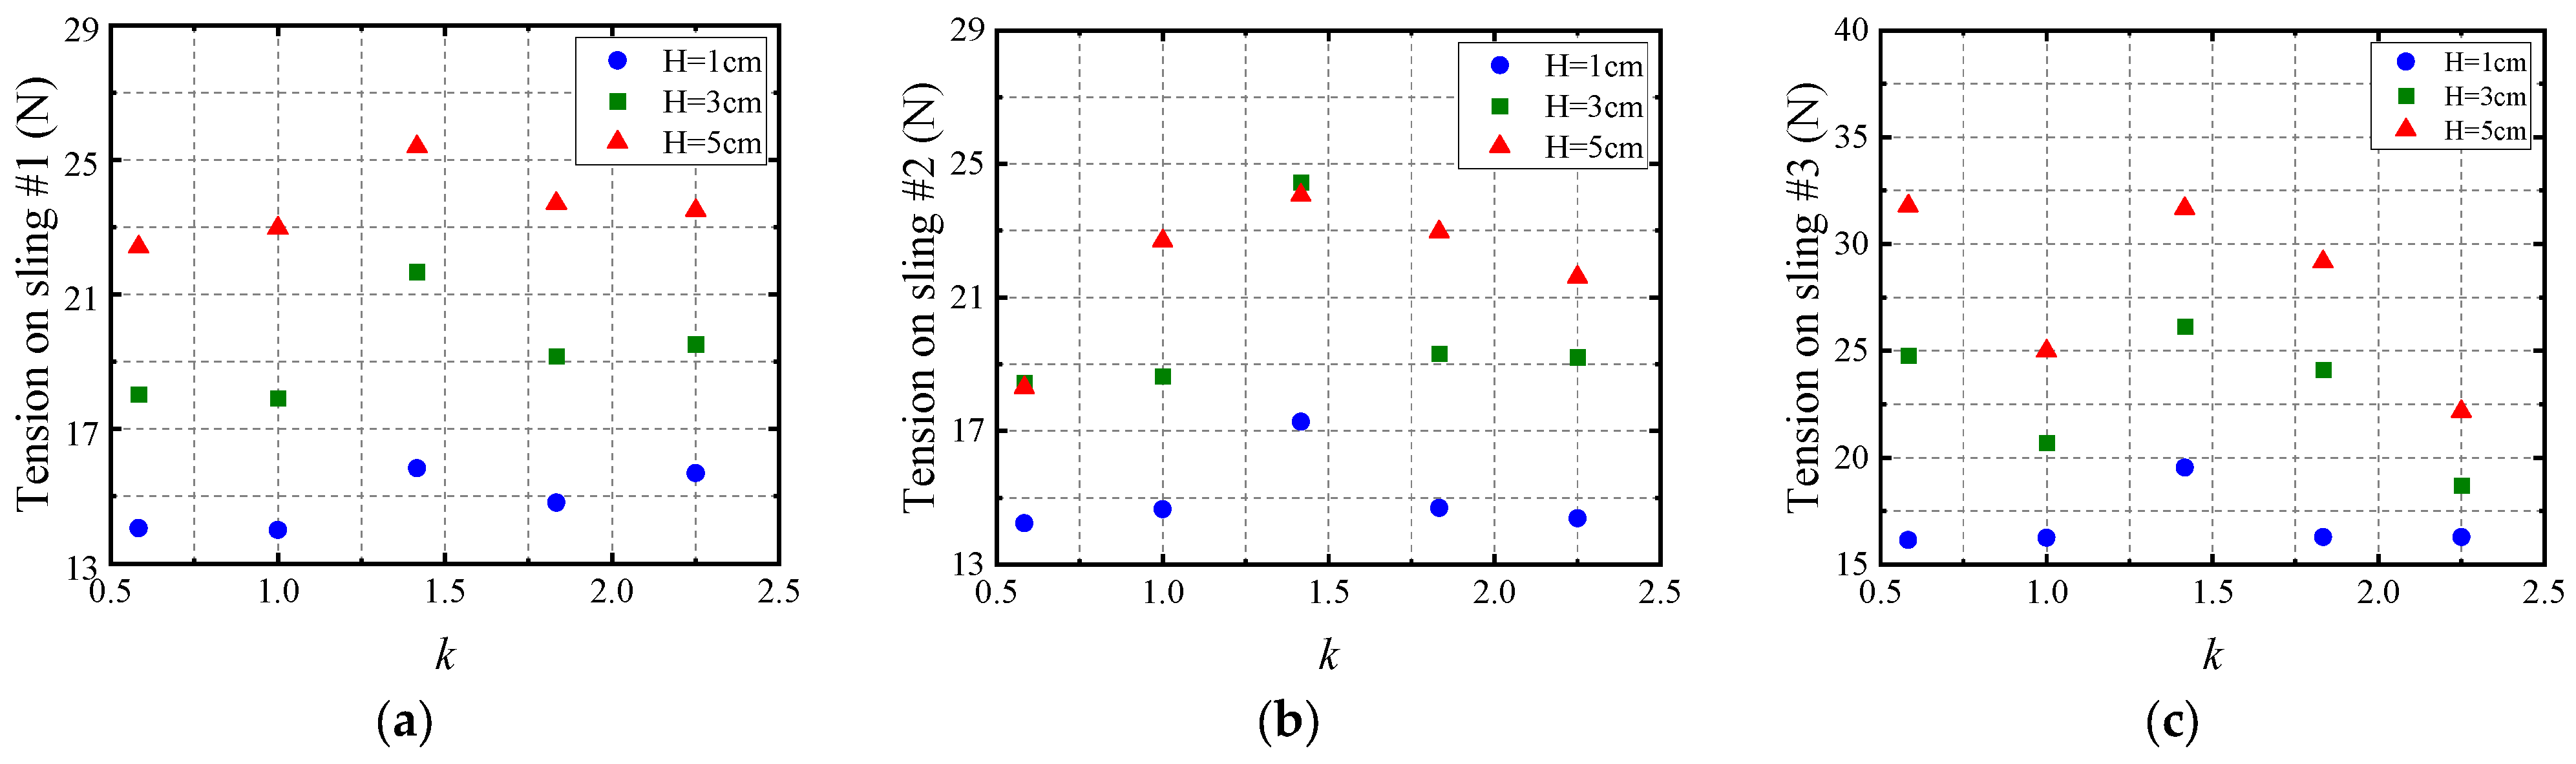
A relative sinking depth of 1.2 is the most dangerous condition in the whole sinking process, as the motion of the OWT–BF and the sling tensions reach their maximums at this depth. At a wave height of 2.5 m, the surge acceleration reaches 0.31 g, surpassing the allowable horizontal acceleration of 0.25 g. Consequently, requisite measures should be implemented to mitigate the motion of the OWT–BF at this stage, and it is advisable to conduct the in-water sinking operation of the OWT–BF when the wave height is below 1.5 m.
(3)
As the relative sinking depth exceeds 1.2, the motion of the OWT–BF and the sling tensions are significantly reduced by wave influences as the sinking depth increases, thereby enhancing the safety of the sinking operation.
(4)
The change rules of the OWT–BF motion and sling tensions with the sinking depth remain relatively consistent during the in-water sinking process. The sinking strategy controlled by the sling and gas pressure proves effective in controlling the motion of the OWT–BF. Therefore, the slings serve as crucial auxiliary equipment for accomplishing the installation of an air-floating structure.
(5)
The layout of slings exerts a more significant influence on the motion of the OWT–BF than the quantity of slings.

Author Contributions

Conceptualization, J.L., H.W., Y.G. and N.S.; methodology, J.L., H.W., Y.G. and N.S.; software, F.Y., T.X. and D.X.; validation, F.Y.; formal analysis, F.Y.; resources, J.L.; data curation, F.Y.; writing—original draft, F.Y., T.X. and D.X.; writing—review and editing, F.Y., T.X. and D.X.; supervision, J.L., H.W., Y.G. and N.S.; project administration, J.L. and N.S.; funding acquisition, J.L. and N.S. All authors have read and agreed to the published version of the manuscript.

Funding

This research was funded by the following grants: a Science and Technology Project of the Hebei Education Department, grant number BJK2023099; Hebei Natural Science Foundation grant number E2022402074; and Hebei Natural Science Foundation grant number E2020402074.

Institutional Review Board Statement

Not applicable.

Informed Consent Statement

Not applicable.

Data Availability Statement

Data are contained within the article.

Conflicts of Interest

The authors declare no conflicts of interest.

References

  1. Global Wind Energy Council (GWEC). Global Wind Report 2023; GWEC: Brussels, Belgium, 2023. [Google Scholar]
  2. Li, Y.; Huang, X.; Tee, K.F.; Li, Q.S.; Wu, X.P. Comparative study of onshore and offshore wind characteristics and wind energy potentials: A case study for southeast coastal region of China. Sustain. Energy Technol. Assess. 2020, 39, 13. [Google Scholar] [CrossRef]
  3. Li, J.J.; Wang, G.D.; Li, Z.H.; Yang, S.L.; Chong, W.T.; Xiang, X.B. A review on development of offshore wind energy conversion system. Int. J. Energy Res. 2020, 44, 9283–9297. [Google Scholar] [CrossRef]
  4. Castro-Santos, L.; Filgueira-Vizoso, A.; Lamas-Galdo, I.; Carral-Couce, L. Methodology to calculate the installation costs of offshore wind farms located in deep waters. J. Clean. Prod. 2018, 170, 1124–1135. [Google Scholar] [CrossRef]
  5. Lacal-Arántegui, R.; Yusta, J.M.; Domínguez-Navarro, J.A. Offshore wind installation: Analysing the evidence behind improvements in installation time. Renew. Sust. Energ. Rev. 2018, 92, 133–145. [Google Scholar] [CrossRef]
  6. Guo, Y.H.; Wang, H.J.; Lian, J.J. Review of integrated installation technologies for offshore wind turbines: Current progress and future development trends. Energy Convers. Manag. 2022, 255, 25. [Google Scholar] [CrossRef]
  7. Lian, J.J.; Ye, F.D.; Wang, P.W.; Guo, Y.H.; Wang, H.J.; Xiao, T.R.; Xiong, D.Z. Integrated transportation of offshore wind turbine and bucket foundation based on a U and K shaped assembled platform. Ocean Eng. 2023, 275, 16. [Google Scholar] [CrossRef]
  8. He, B.; Jiang, J.; Cheng, J.; Zheng, J.B.; Wang, D. The capacities of tripod bucket foundation under uniaxial and combined loading. Ocean Eng. 2021, 220, 13. [Google Scholar] [CrossRef]
  9. Liu, X.Q.; Le, C.H.; Zhao, M.J.; Ding, H.Y.; Zhang, P.Y.; Lv, N.; Luo, S. Experimental Study on Influencing Factors of Motion Responses for Air-Floating Tetrapod Bucket Foundation. China Ocean Eng. 2022, 36, 258–267. [Google Scholar] [CrossRef]
  10. Chakrabarti, S.K. Scale effects on a unique launch sequence of a gravity-based structure. Appl. Ocean Res. 1995, 17, 33–41. [Google Scholar] [CrossRef]
  11. Van Kessel, J.L.F. Aircushion Supported Mega-Floaters. Ph.D. Thesis, Technische Universiteit Delft, Delft, The Nederlands, 2010. [Google Scholar]
  12. Van Kessel, J.L.F.; Pinkster, J.A. The Effect of Aircushion Division on the Structural Loads of Large Floating Offshore Structures. In Proceedings of the ASME 2007 26th International Conference on Offshore Mechanics and Arctic Engineering, San Diego, CA, USA, 10–15 June 2007. [Google Scholar]
  13. Van Kessel, J.L.F.; Pinkster, J.A. Wave-induced Structural Loads on Different Types of Aircushion Supported Structures. In Proceedings of the Seventeenth International Offshore and Polar Engineering Conference, Lisbon, Portugal, 1–6 July 2007. [Google Scholar]
  14. Cheung, K.F.; Phadke, A.C.; Smith, D.A.; Lee, S.K.; Seidl, L.H. Hydrodynamic response of a pneumatic floating platform. Ocean Eng. 2000, 27, 1407–1440. [Google Scholar] [CrossRef]
  15. Lee, C.H.; Newman, J.N. Wave effects on large floating structures with air cushions. Mar. Struct. 2000, 13, 315–330. [Google Scholar] [CrossRef]
  16. Pinkster, J.A.; Meevers Scholte, E.J.A. The behaviour of a large air-supported MOB at sea. Mar. Struct. 2001, 14, 163–179. [Google Scholar] [CrossRef]
  17. Maeda, H.; Ikoma, T.; Masuda, K.; Rheem, C.K. Hydroelastic Behaviors of Large Aircushion Supported Elastic Floating Structures in Regular Waves. In Proceedings of the MTS/IEEE Oceans 2002 Conference, Biloxi, MI, USA, 29–31 October 2002. [Google Scholar]
  18. Ikoma, T.; Masuda, K.; Maeda, H.; Rheem, C.K. Hydroelastic Behavior of Air-Supported Flexible Floating Structures. In Proceedings of the ASME 2002 21st International Conference on Offshore Mechanics and Arctic Engineering, Oslo, Norway, 23–28 June 2002. [Google Scholar]
  19. Ikoma, T.; Masuda, K.; Maeda, H.; Rheem, C.K. Effects of Aircushion Division to Hydroelastic Responses of an Aircushion Type Very Large Floating Structure. In Proceedings of the ASME 2003 22nd International Conference on Offshore Mechanics and Arctic Engineering, Cancun, Mexico, 8–13 June 2003. [Google Scholar]
  20. Ikoma, T.; Masuda, K.; Rheem, C.-K.; Maeda, H. Response Reduction of Motion and Steady Wave Drifting Forces of Floating Bodies Supported by Aircushions in Regular Waves. In Proceedings of the 25th International Conference on Offshore Mechanics and Arctic Engineering, Hamburg, Germany, 4–9 June 2006. [Google Scholar]
  21. Ikoma, T.; Kobayashi, M.; Masuda, K.; Rheem, C.-K.; Maeda, H. A Prediction Method of Hydroelastic Motion of Aircushion Type Floating Structures Considering with Draft Effect into Hydrodynamic Forces. In Proceedings of the ASME 2008 27th International Conference on Offshore Mechanics and Arctic Engineering, Estoril, Portugal, 15–20 June 2008. [Google Scholar]
  22. Næss, T.; Havn, J.; Solaas, F. On the importance of slamming during installation of structures with large suction anchors. Ocean Eng. 2014, 89, 99–112. [Google Scholar] [CrossRef]
  23. Zhang, P.; Li, Y.e.; Le, C.; Ding, H.; Yang, Z.; Qiang, L. Dynamic characteristics analysis of three-bucket jacket foundation lowering through the splash zone. Renew. Energy 2022, 199, 1116–1132. [Google Scholar] [CrossRef]
  24. Zhang, P.Y.; Li, Y.E.; Ding, H.Y.; Le, C.H. Response analysis of a lowering operation for a three-bucket jacket foundation for offshore wind turbines. Renew. Energy 2022, 185, 564–584. [Google Scholar] [CrossRef]
  25. DNV GL. DNVGL-RP-N103 Modelling and Analysis of Marine Operations; Det Norske Veritas: Oslo, Norway, 2017. [Google Scholar]
  26. Kim, S.R.; Hung, L.C.; Oh, M. Group effect on bearing capacities of tripod bucket foundations in undrained clay. Ocean Eng. 2014, 79, 1–9. [Google Scholar] [CrossRef]
  27. Wang, L.Z.; Wang, H.; Zhu, B.; Hong, Y. Comparison of monotonic and cyclic lateral response between monopod and tripod bucket foundations in medium dense sand. Ocean Eng. 2018, 155, 88–105. [Google Scholar] [CrossRef]
  28. Zhang, P.; Han, Y.; Ding, H.; Zhang, S. Field experiments on wet tows of an integrated transportation and installation vessel with two bucket foundations for offshore wind turbines. Ocean Eng. 2015, 108, 769–777. [Google Scholar] [CrossRef]
  29. DNV. SIMO User Manual Version 4.0 Rev 0; Norwegian Marine Technology Research Institute, Marintek: Trondheim, Norway, 2012. [Google Scholar]
Figure 1. Integrated installation of an OWT–BF.
Jmse 12 00494 g001
Figure 2. Test model: (a) OWT–BF; (b) BF.
Jmse 12 00494 g002
Figure 3. The test layout of the OWT–BF.
Jmse 12 00494 g003
Figure 4. In-water sinking process of the OWT–BF.
Jmse 12 00494 g004
Figure 5. The motion responses of the OWT–BF under varying wave-height conditions at each sinking depth: (a) surge acceleration; (b) heave acceleration; (c) and pitch angle.
Jmse 12 00494 g005
Figure 6. The tensions on slings under different wave heights at each sinking depth: (a) sling #1; (b) sling #2; and (c) sling #3.
Jmse 12 00494 g006
Figure 7. Numerical model of the in-water sinking system of the OWT–BF.
Jmse 12 00494 g007
Figure 8. The pitch angle of the OWT–BF at various sinking depths with a wave height of 1.5 m: (a) time trajectories of the model tests; (b) time trajectories of the numerical simulations; and (c) statistical values of the model tests and the numerical simulations.
Jmse 12 00494 g008aJmse 12 00494 g008b
Figure 9. The surge acceleration of the OWT–BF at various sinking depths with a wave height of 1.5 m: (a) time trajectories of the model tests; (b) time trajectories of the numerical simulations; and (c) statistical values of the model tests and the numerical simulations.
Jmse 12 00494 g009
Figure 10. The tension on sling #1 at various sinking depths with a wave height of 1.5 m: (a) time trajectories of the model tests; (b) time trajectories of the numerical simulations; (c) statistical values of the model tests and the numerical simulations.
Jmse 12 00494 g010
Figure 11. The tension on sling #3 at sinking depths from 12 m to 17 m.
Jmse 12 00494 g011
Figure 12. The pitch angle at sinking depths from 12 m to 17 m.
Jmse 12 00494 g012
Figure 13. The surge acceleration at sinking depths from 12 m to 17 m.
Jmse 12 00494 g013
Figure 14. Three layouts for slings.
Jmse 12 00494 g014
Figure 15. The motion responses of the OWT–BF for the three layouts of slings: (a) pitch angle and (b) surge acceleration.
Jmse 12 00494 g015
Table 1. Proportional relationship between the physical quantities of the model and prototype.
ItemsSymbolRatioItemsSymbolRatio
LineLs/LmλPeriodTs/Tmλ0.5
AreaAs/Amλ2Frequencyfs/fmλ0.5
VolumeVs/Vmλ3MassΔsΔmγλ3
Linear accelerationas/am1ForceFs/Fmγλ3
Angleαs/αm1MomentMs/Mmγλ4
Water densityρs/ρmγMoment of inertiaIs/Imγλ5
λ is the geometric similarity ratio.
Table 2. Principal parameters of both the prototype and model of the OWT–BF.
ParameterUnits1:50 ModelFull Scale
Bucket diameterm0.7236.0
Bucket heightm0.2412.0
Transition-section heightm0.4221.0
Tower heightm1.8391.7
Bucket foundation masskg23.112,889,000
Tower masskg3.96494,500
RNA masskg3.39423,400
Table 3. Test conditions.
ConditionsSinking DepthWave Height
Model (cm)Prototype (m)Model (cm)Prototype (m)
Condition 1-A~C1471/3/50.5/1.5/2.5
Condition 2-A~C24121/3/50.5/1.5/2.5
Condition 3-A~C34171/3/50.5/1.5/2.5
Condition 4-A~C44221/3/50.5/1.5/2.5
Condition 5-A~C54271/3/50.5/1.5/2.5
Disclaimer/Publisher’s Note: The statements, opinions and data contained in all publications are solely those of the individual author(s) and contributor(s) and not of MDPI and/or the editor(s). MDPI and/or the editor(s) disclaim responsibility for any injury to people or property resulting from any ideas, methods, instructions or products referred to in the content.

