Article

A Simulation Model of the Influence of LNG Ships on Traffic Efficiency at Tianjin Port

1
Intelligent Transportation Systems Research Center, Wuhan University of Technology, Wuhan 430063, China
2
Tianjin Research Institute for Water Transport Engineering, M. O. T., Tianjin 300456, China
3
College of Maritime, Beibu Gulf University, Qinzhou 535000, China
4
State Key Laboratory of Maritime Technology and Safety, Wuhan University of Technology, Wuhan 430063, China
5
National Engineering Research Center for Water Transport Safety (WTSC), Wuhan University of Technology, Wuhan 430063, China
6
Tianjin Maritme Safety Administration, Tianjin 300211, China
*
Authors to whom correspondence should be addressed.
J. Mar. Sci. Eng. 2024, 12(3), 405; https://doi.org/10.3390/jmse12030405
Submission received: 21 December 2023 / Revised: 27 January 2024 / Accepted: 20 February 2024 / Published: 26 February 2024
(This article belongs to the Special Issue Safety and Efficiency of Maritime Transportation and Ship Operations)

Abstract

:
Tianjin Port is one of the largest ports in northern China. Liquefied natural gas (LNG) ships are one of the most special ship types, and their navigation safety and efficiency has become the top concern of the port authority. There are two LNG berths at the port, and the annual arrivals, which reach more than 100, increasingly influence other ships. The objective of this study is to evaluate the influence of LNG ships on other ships in a quantitative way. To realize this, a simulation system is established by analyzing the factors affecting waterway transit efficiency. The software Arena is adopted to simulate the arrival and departure of the ships at Tianjin Port and to simulate how the average waiting time and the average queue length in the port area are affected by the LNG ships. A traffic system for the two ship types is formulated, and the mutual influences between them are expressed by the inbound and outbound waterway states. The simulations are performed under both existing and new ship traffic regulations. Cases in which the number of LNG ships gradually increases are simulated comprehensively. The simulation model as well as the results can serve as a good reference for the local port authority in the formulation of traffic regulations.

1. Introduction

Liquefied natural gas (LNG) transportation by ship plays a vital role in the economic development of the regions surrounding ports, and even the whole country [1,2]. LNG has advantages in terms of safety, reliability, environmental-friendliness, cost-effectiveness, flexibility, and convenience [3]. The LNG shipping industry has developed rapidly, and the volumes of LNG transportation and ship traffic have been increasing in recent years all around the world [4,5]. China has also built many large LNG terminals at eastern and southern coastal sea ports, including Dalian, Caofeidian, Tianjin, and Dongjiakou [6]. Furthermore, some ports have built or plan to build two or more LNG berths to accommodate more LNG ships. On the other hand, the navigation safety of LNG ships, along with that of other ships including those carrying crude oil, LPG, and various chemicals, are among the top concerns of the Maritime Safety Administrations (MSA) because these materials are highly hazardous due to their flammable, highly polluting, or explosive properties [7,8]. In particular, LNG ships are typically big and carry large volumes of dangerous gas. Should an accident occur, it may bring disastrous consequences to the port as well as the environment [9,10]. It may even lead to the closure of the whole port for a long time, which would sacrifice the port’s efficiency to a large degree [11].
Due to the high-risk nature of LNG ships, their traffic management requirements when entering and leaving port waterways are much stricter than those of other ship types. For instance, LNG ships in the port area are usually isolated at a certain distance from other navigating ships (this is referred to as ‘exclusivity’). According to the China Design Code for Sea Ports [12], there should be no other ships ahead of an LNG ship when it is entering or leaving a port waterway, and the ships following an LNG ship should keep a sufficiently safe distance. It also suggests that when an LNG ship is navigating a waterway, it should be convoyed by a certain number of ships, that traffic control should be carried out, and that other ships should be prohibited from entering the mobile safety zone of the LNG ship.
Given their strict navigation safety requirements, LNG ships can potentially impact the navigation efficiency of other ships in port waters [13]. LNG ships usually have higher priority, so other ships have to wait for longer, and this results in the sacrificing of the traffic efficiency of other ships navigating the same waterways. This would be more apparent in ports with double or multiple LNG berths [14].
The measures taken to ensure the navigation safety of LNG ships also significantly affect the loading and unloading volumes of ships, as well as port operation efficiency, making the contradiction between the safety and efficiency of LNG ships entering and leaving port a prominent issue [15]. Consequently, it is meaningful to investigate the influence of LNG ships on the overall efficiency of other ships in port waterways. In this paper, a traffic simulation model is proposed to perform a quantitative evaluation of this impact with an increase in LNG ships as well as other ships. Tianjin Port, which has dual LNG berths and which has seen an increase in LNG ship traffic, was selected as the case study.
The Tianjin Sinopec LNG Pier is located in the east basin of Tianjin Port’s “Dagang area”, and LNG berth I is located at the north end of the east basin’s east mole, with a pier axis line direction of 090°–270°. LNG berth II is located on the inside of the east mole’s breakwater and on the northeast side of the first LNG berth, with a pier axis line direction of 045°–225°. The two berths are adjacent to each other at about 160 m, and their maximum docking ship type is an LNG ship with a volume of 266,000 m3. Ships using the two berths share the waters of the same basin when turning around, and they share the same “Dagang area” waterway when entering and leaving the port. At the end of 2021, the ‘double berth’ at Tianjin Sinopec LNG Pier, which has an annual waterway transit capacity of 10.8 million tons/year, was put into operation. The piers’ locations are shown in Figure 1. Both LNG ships and other ships share the Dagang Port waterway when entering and leaving the port waters. Their mutual influence when navigating further impacts the overall traffic efficiency.
The rest of this article is organized as follows: Section 2 includes a literature review of the research on ship traffic flow simulations along with a discussion on the lack of LNG ship traffic studies. The traffic simulation model, which considers the restrictions on both LNG ships and other ships in terms of waterway conditions, environment, and traffic rules, is formulated in Section 3. Section 4 introduces the construction of the simulation model, which was performed using Arena software (version 14.00.00). Section 5 presents the simulation results and discusses the waiting times and numbers of waiting ships when the numbers of LNG ships and other ships increase. Finally, Section 6 concludes the paper.

2. Literature Review

LNG ships are one of the most dangerous ship types in port operations. Aneziris et al. [16] performed a systematic literature review on safety assessments of LNG ships. Their focus was on risk assessments during storing and transferring. They pointed out that hazard and risk evaluations from regulations, standards, and guidelines are essential for the safe operation of LNG ships. The case of Meizhou Bay was studied, and the objective was to support the maneuver decisions for LNG ships when entering and leaving the port. Park [17] studied the estimations of facilities in LNG bunkering terminals using a simulation for Busan Port. The objective of the study was to estimate the LNG infrastructure requirements by predicting future demand. Park [18] further investigated the influence of demand fluctuations in different seasons on overall profit. The objective is to maximize profits by finding the optimum occupancy. Within the existing research, few studies have focused on the influence of LNG ships on other ships when entering and leaving port waterways. With respect to ship delays in port waterways, Durlik [19] performed a statistical analysis of ship delays while considering ship traffic regulation restrictions using the Świnoujście–Szczecin Fairway as a case study. However, a statistical analysis can only evaluate the present ship traffic situation; it is unable to predict future trends in ship waiting times. Thus, the traffic efficiency of ports which receive LNG ship traffic should be investigated using a new methodology.
Traffic simulations are one of the most effective tools for evaluating ship traffic efficiency under different conditions from a macro perspective [20,21]. The main idea is to randomly create the ship traffic flow in accordance with historical data, and to run the whole process for each ship, from arrival to departure, under various restrictions [22]. The restrictions are mainly caused by other ships, waterways, and environmental conditions, among other things. The tendencies of the ships’ waiting times and queue lengths with increased ship traffic volume can then be obtained by changing the relevant parameters. Many methodologies have been proposed. Qi et al. [23] introduced the idea of cellular automata (CA) into a ship traffic simulation and proposed a spatial–logical mapping (SLM) model that would consider safety issues based on a dynamic ship domain model. The model was then applied to the Singapore Strait, and the results indicated that the SLM model is effective in reducing the probability of ships changing their lanes. It also indicated that the ship traffic volume would decrease when the proportion of large ships increased.
Some research has focused on ship scheduling in straits. Mavrakis and Kontinakis [24] investigated the ship traffic scheduling in the Bosporus Strait using queue theory. The interactions between southbound and northbound traffic was considered, and the restrictions resulting from weather conditions, channel dimensions, and ship traffic regulations were included in the simulation system. The results indicated that a linear increase in ship volume would result in an exponential increase in both average and maximum waiting time, suggesting that the existing scheduling method should be enhanced to a large degree in order to accommodate more ships. Although there is no LNG ship traffic in the Bosporus Strait, this simulation procedure is a good reference for the present study. Ramin et al. [25] investigated the ship traffic density at Port Klang and in the Straits of Malacca. The exponential smoothing method was proposed to predict the future traffic density, and it achieved satisfactory precision. The results could be a useful reference for future ship traffic simulation studies involving LNG ships.
Compared to centralized ship traffic scheduling, distributive scheduling methods have attracted growing attention. Moreover, the software Arena is one of the most used tools in the performance of discrete-time system simulations. It has been used in different areas, such as warehouse loading and unloading simulations [26] and emergency services simulations [27]. Oljira et al. [28] constructed a manufacturing system using Arena to evaluate the performance of a mineral water production line system. The simulation model helped to optimize the production line by eliminating bottlenecks; the throughput was increased from 21.12% to 54.03%, and the cycle time was also reduced to a large degree. Guneri and Seker [29] used Arena software to test the real performance of a workshop using a simulation which tested the performance of the system in a safer mode. Rasib [30] investigated ways of improving production smoothness in the food manufacturing industry using Arena. Some improvement strategy suggestions were tested based on the simulation results, and the most effective ones were identified. In summary, Arena software is an effective tool for simulating discrete-time systems and testing the effectiveness of different optimization strategies in a low-cost way.
Motivated by the research outlined above, a few researchers also began using Arena in ship traffic simulations. For instance, Wang et al. [31,32] proposed a hybrid self-organizing scheduling (HSOS) method for restricted two-way waterways using Arena software. Small ships were given higher priority than large ships travelling in the same direction. When the large ships began to accumulate, they were then given higher priority to enhance the overall efficiency. Moreover, a vessel traffic system (VTS) center controlled the traffic directions to maintain balance. The results indicated that the HSOS method can greatly enhance efficiency. Using Arena software, Wang et al. [33] further investigated the effects of different parameters on overall efficiency in navigation environments with varied ship speeds. The following indicators were considered in the sensitivity analysis: mean value and variance of ship speed, channel length, safety distance, and arrival rate. The results indicated that the mean ship speed value was the most sensitive parameter, while the safety distance was the least sensitive parameter. These results are useful for finding ways of enhancing overall efficiency.
Within the existing research on waterway traffic scheduling and simulations, few studies have focused on the influence of ships with special safety requirements (e.g., LNG ships) on other ships. There is also a lack of effective methods for simulating LNG ship traffic as well as that of other ships in port waters. In order to fill this research gap, this study proposes a waterway traffic simulation model for Tianjin Port which considers the strict safety requirements of LNG ships under double LNG berth conditions. Through analyzing the main factors influencing the waterway transit capacity of ‘double LNG berths’, this study simulated the arrival and departure of both LNG ships other ships in the waterway using Arena software. Two indexes—the ships’ average waiting time and the average queue length—were introduced to analyze the impact of increasing numbers of LNG ships on the waterway capacity during the ‘double berth’ operation so as to provide a reference for formulating a port traffic organization scheme under an LNG ‘double berth’ centralized layout. The novelty of the proposed method lies in that it can perform a quantitative evaluation of the influence of LNG ships on other ships in port waterways under different parameter settings. The simulation system can predict future trends brought about by an increase in arriving LNG ships with satisfactory precision, and this will help the port authority to develop better ship traffic organization strategies.

3. The Traffic Simulation Model

The objective of the simulation model is to evaluate the influence of LNG ships on other ships at Tianjin Port. Thus, the influence that LNG ships and other ships have on one another should be considered in a systematic manner in the formulation of the simulation procedure. The simulation procedure for the LNG and other ship traffic is presented in Figure 2.
As can be seen in the figure, the simulation covers the whole process from arrival at the port, anchoring, entering the port, and berthing, to departure from the port. There are two LNG berths at Tianjin Port. The waterway can accommodate one-way or two-way navigation, depending on the navigation regulations and the ship types. The mutual influence between the LNG ships and the other ships is reflected in the inbound and outbound waterway states (open or closed), which is expressed as R2 or R3 in the figure. Besides that, the LNG ships also need to consider the weather and tide conditions, which are expressed as R1 in the figure. The main reason is that LNG ships usually have very large drafts, and they can only enter the waterway at high tide. The details of R1, R2, and R3 will be discussed in the following subsections. Moreover, it should be noted that at Tianjin Port, LNG ships have higher priority when entering the port waterway, which means that once the tide level is high enough for LNG ships, other ships should give priority to the LNG ships. The simulation procedure is largely explained in a qualitative manner in this section. The simulation parameters will be explained in more detail in a quantitative way in the following case studies involving Tianjin Port.

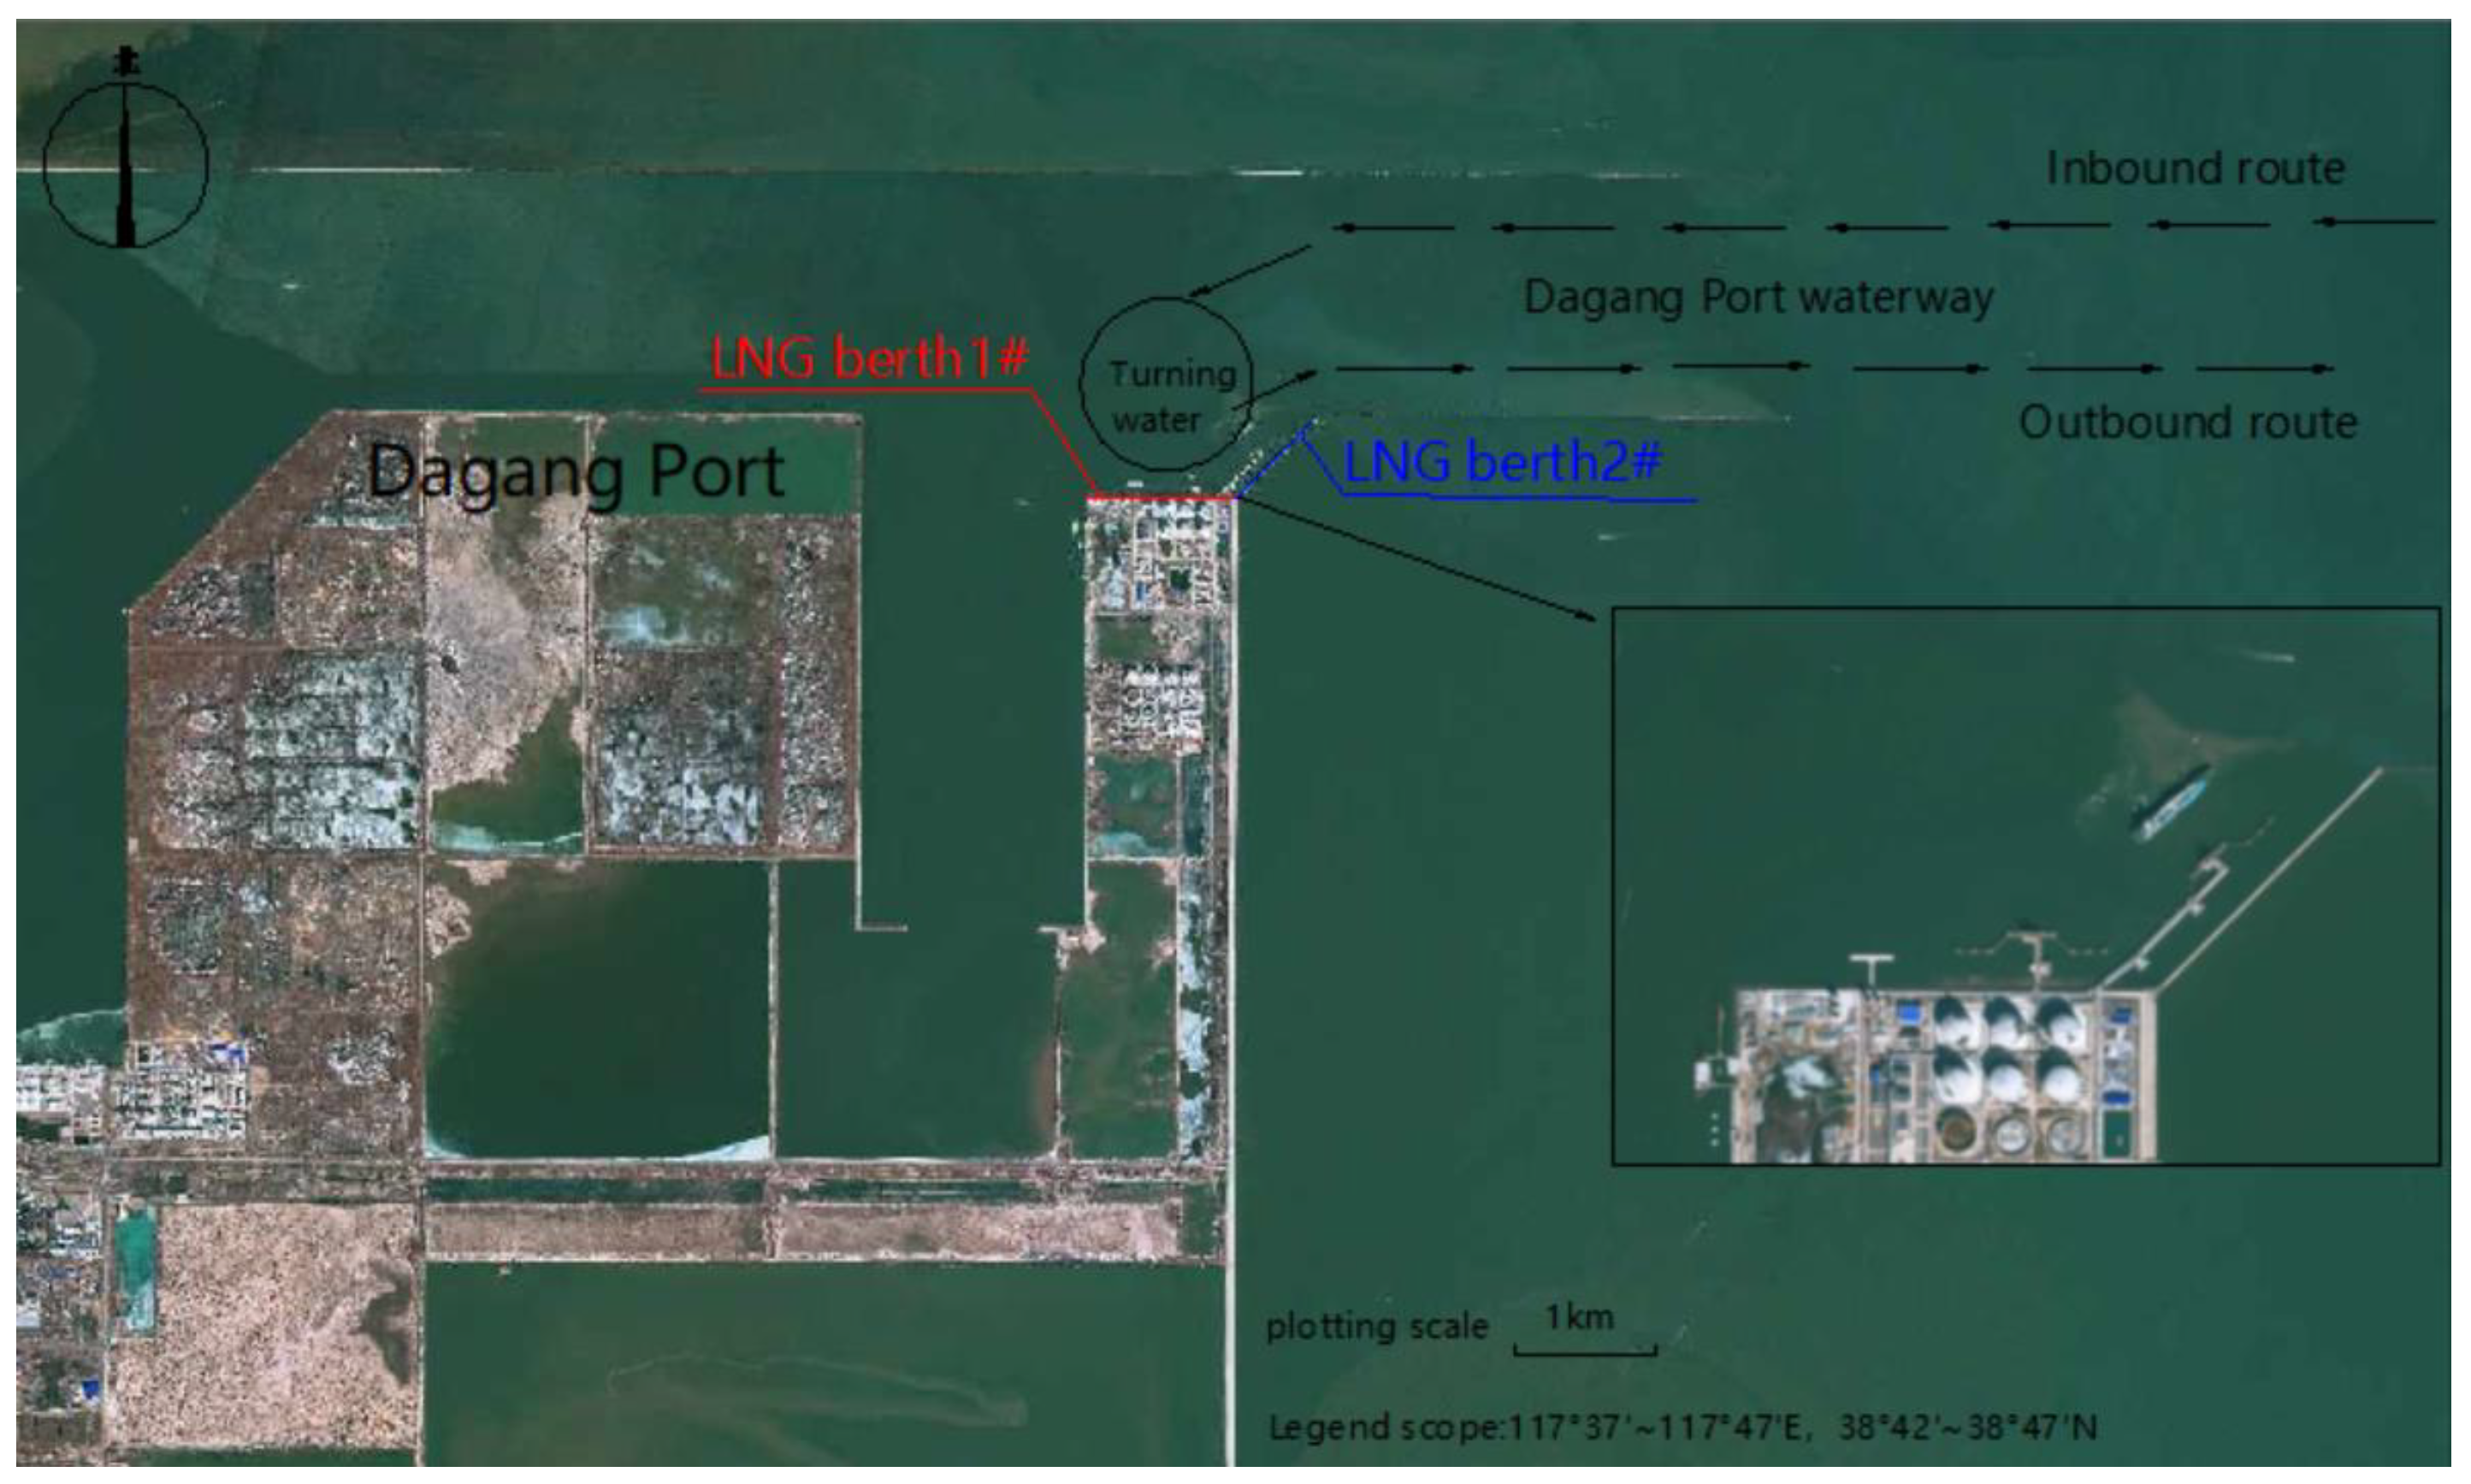
3.1. Navigation Restrictions and the Formulation of Regulations

(1)
Tide restrictions
Due to the substantial navigational depth requirements of large vessels, it is usually impossible to meet the navigable requirements for water depth without considering the tide level. Large ships such as LNG ships need to navigate by tide, making the tide riding level an essential factor affecting the navigation of ships. According to the Design Code of General Layout for Sea Ports, for navigable LNG ships, the navigable water level of waterways should be the lowest theoretical tide level. Additionally, the Code for Design of Liquefied Natural Gas Port and Jetty stipulates that “LNG piers should be in waters where LNG ships are not navigable by tide. And the initial tide level of navigable water depth of navigation waterways at LNG piers should adopt the local theoretical lowest tide level”.
Due to the fact tide levels change periodically, the window of time within which an LNG ship can enter a waterway can be determined by comparing the tide riding level of the ship and the tide level. First, the formula for calculating the tide riding level is as follows:
Hship = LD + ΔD1 + ΔD2 + ΔD3
where L is the draft of the ship (m), D is the designed water depth of the waterway (m), ΔD1 is the under-keel clearance (m), and ΔD2 is the difference between the waterway level and the tidal level (m). Moreover, a ship’s draft can change due to the ship’s speed, its inclination, a change in the ship’s difference, the navigation reserve, the accuracy of the depth measurement, etc., all of which are considered in ΔD3. This is related to factors including the ship’s resistance and cross-sectional area, and is proportional to the square of ship velocity. A sine curve is used to simulate the tidal variation law, which is presented over time as follows:
H = H ave + R sin t T × 360 °
where H refers to the tide height at t (m), Have is the still-water level (m), T refers to the tidal variation period (h), and R is the tidal range (m). Based on the above analysis, the time period during which H > Hship is the period during which an LNG ship can enter a waterway with a satisfactory draft. It should be noted that before entering the waterway, the residual time for satisfying such a requirement should be longer than the ship’s navigation time, and this needs to be considered in the following simulations. The procedure for deciding whether a ship can enter the waterway is included in the simulation system.
(2)
Weather condition restrictions for all ships
Due to the influence of severe weather, rain, fog, and sea ice, the navigation conditions of waterways may be affected, preventing safe navigation. Therefore, navigation is prohibited for ships in ports during severe weather and sea conditions. The period during which adverse weather and sea conditions impact waterway navigation has been examined and subsequently minimized. According to the historical hydrology and meteorology conditions and the local port regulations, there are in total around 24 days (576 h) per year during which ships cannot enter or leave the port waterway. In each case, the waterway is typically closed for 12 h or 24 h.

3.2. Waterway Restrictions

At Tianjin Port, the waterway for LNG ships is a two-way waterway with a total length of 24.83 n miles. The other ships can carry out two-way navigation with other ships, but the cannot do this with LNG ships. LNG ships can only carry out one-way navigation, and other ships cannot appear in front of the LNG ships when they are entering and leaving the port waterway. However, other ships can navigate behind the LNG ships, with a large safety distance of 2 n miles. With respect to navigation speed, LNG ships mostly navigate under 10 knots. That is to say, the LNG ships need around 2.5 h to arrive at the berth from anchorage. In contrast, other ships can navigate at various speeds, which we assumed to be uniformly distributed between 10 and 13 knots.

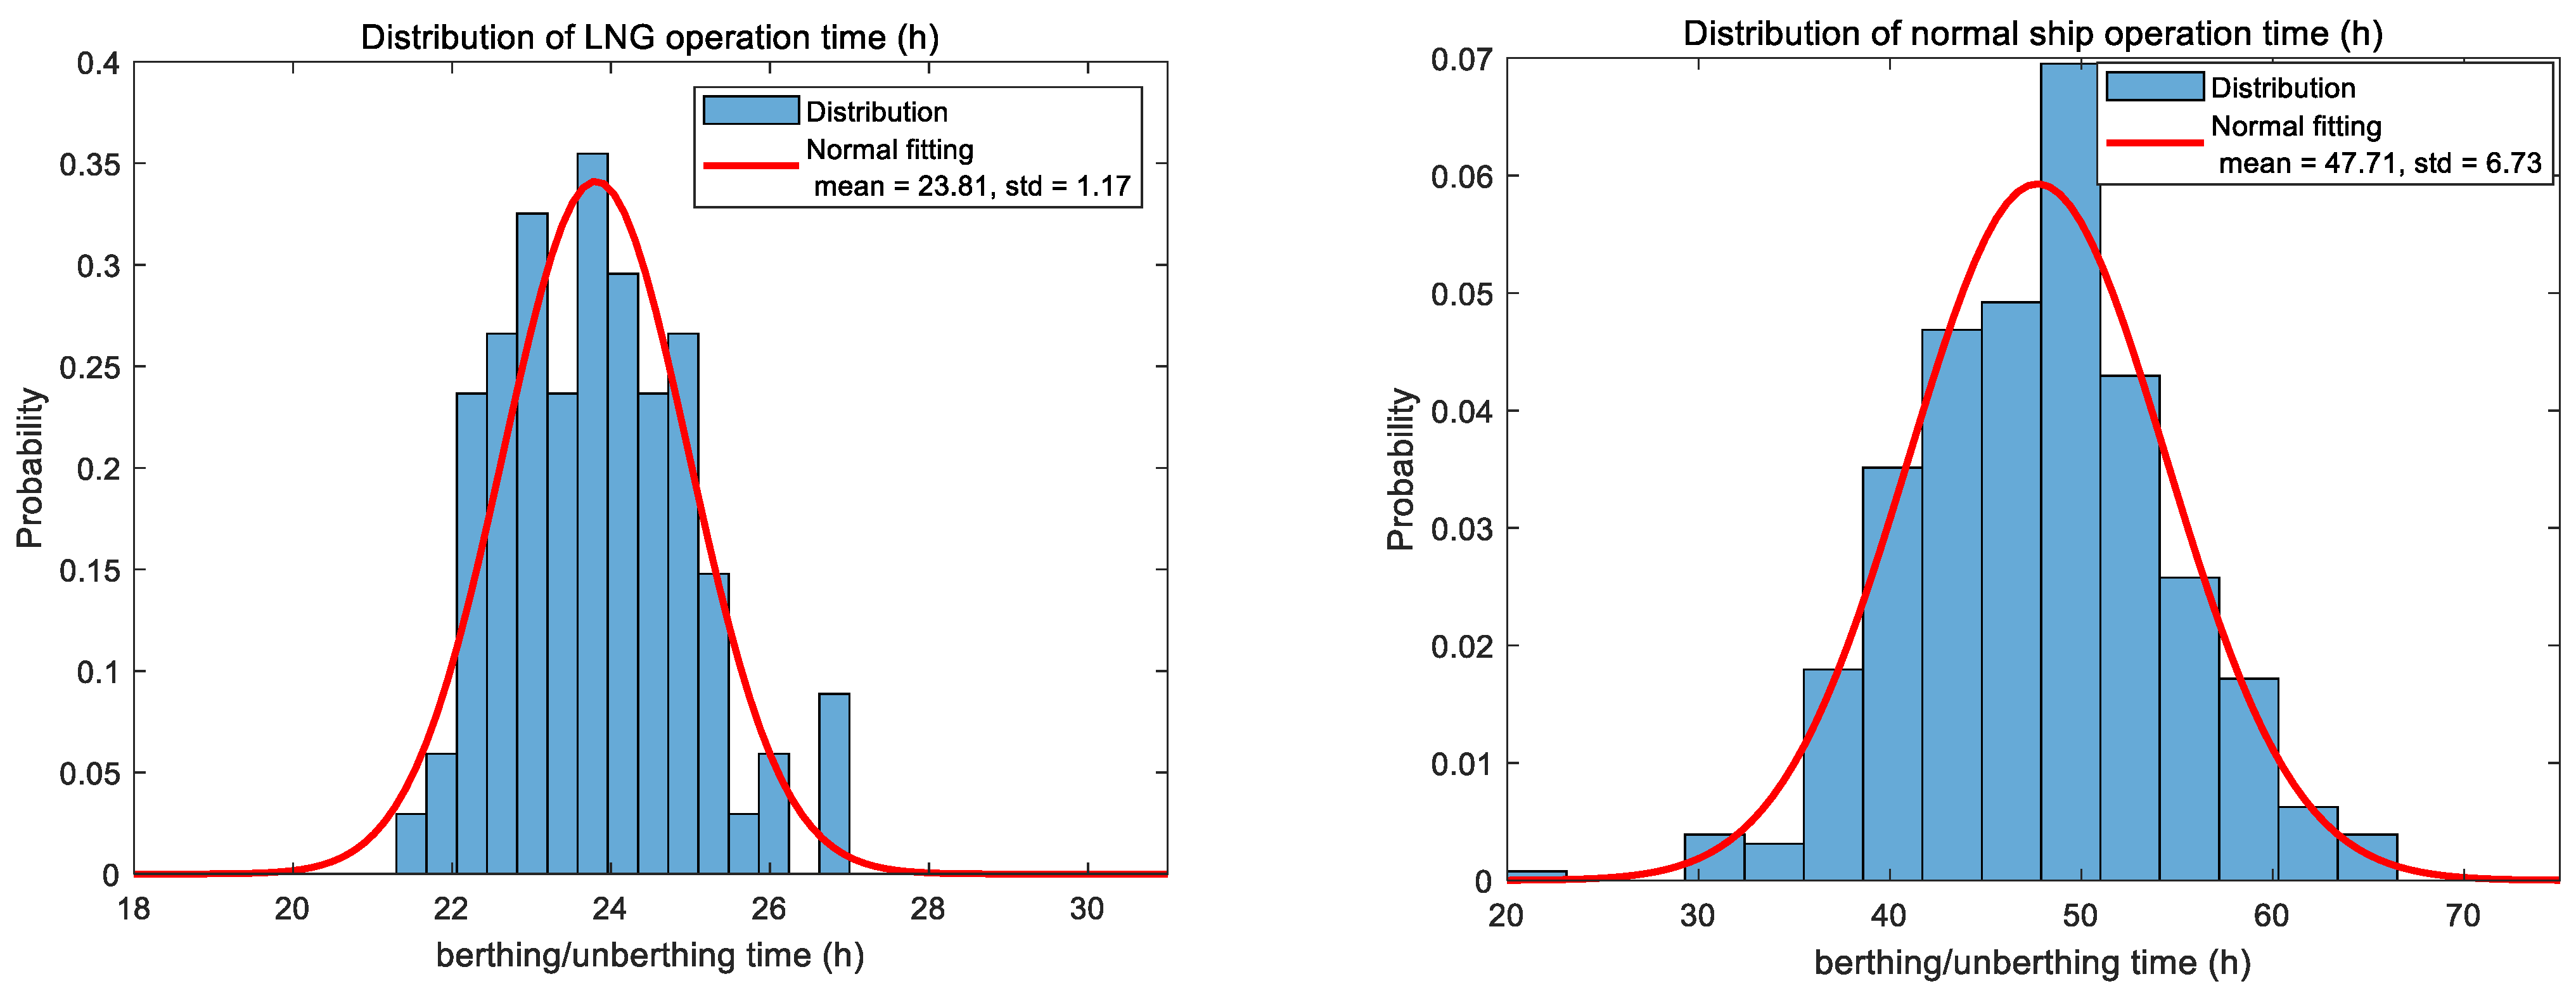
3.3. Ship Operation Time

When ships arrive in the port waters, they need to perform various tasks before leaving the port, including berthing and unberthing operations, working operations, and so on. In 2022, a total of 135 LNG ships visited Tianjin Port. The distribution of the operation time of the LNG ships at berth is fitted with the normal distribution on the left in Figure 3. The operation time does not vary too much and is distributed at around 24 h. Although the sample size is not very large, the normal distribution can fit the data at the accepted level of 95% using the normal fitting function in Matlab R2022a.
With respect to the other ships, we collected data for 413 ships at Tianjin Port, and the distribution was also fitted with the normal distribution, as is shown on the right in Figure 3. A normal distribution with a mean value of 47.71 h and a standard deviation of 6.73 fits the data well. It can be seen that the frequency (around 50 h) is a little bit higher than the fitting value. This may be because the ships’ operation times are more concentrated around the mean value, while the more extreme short and long operation times are not so common. Despite this, the test results indicate that the data fit the normal distribution under the accepted 95% level. Therefore, these parameters will be treated as the input parameters in the following simulation systems.

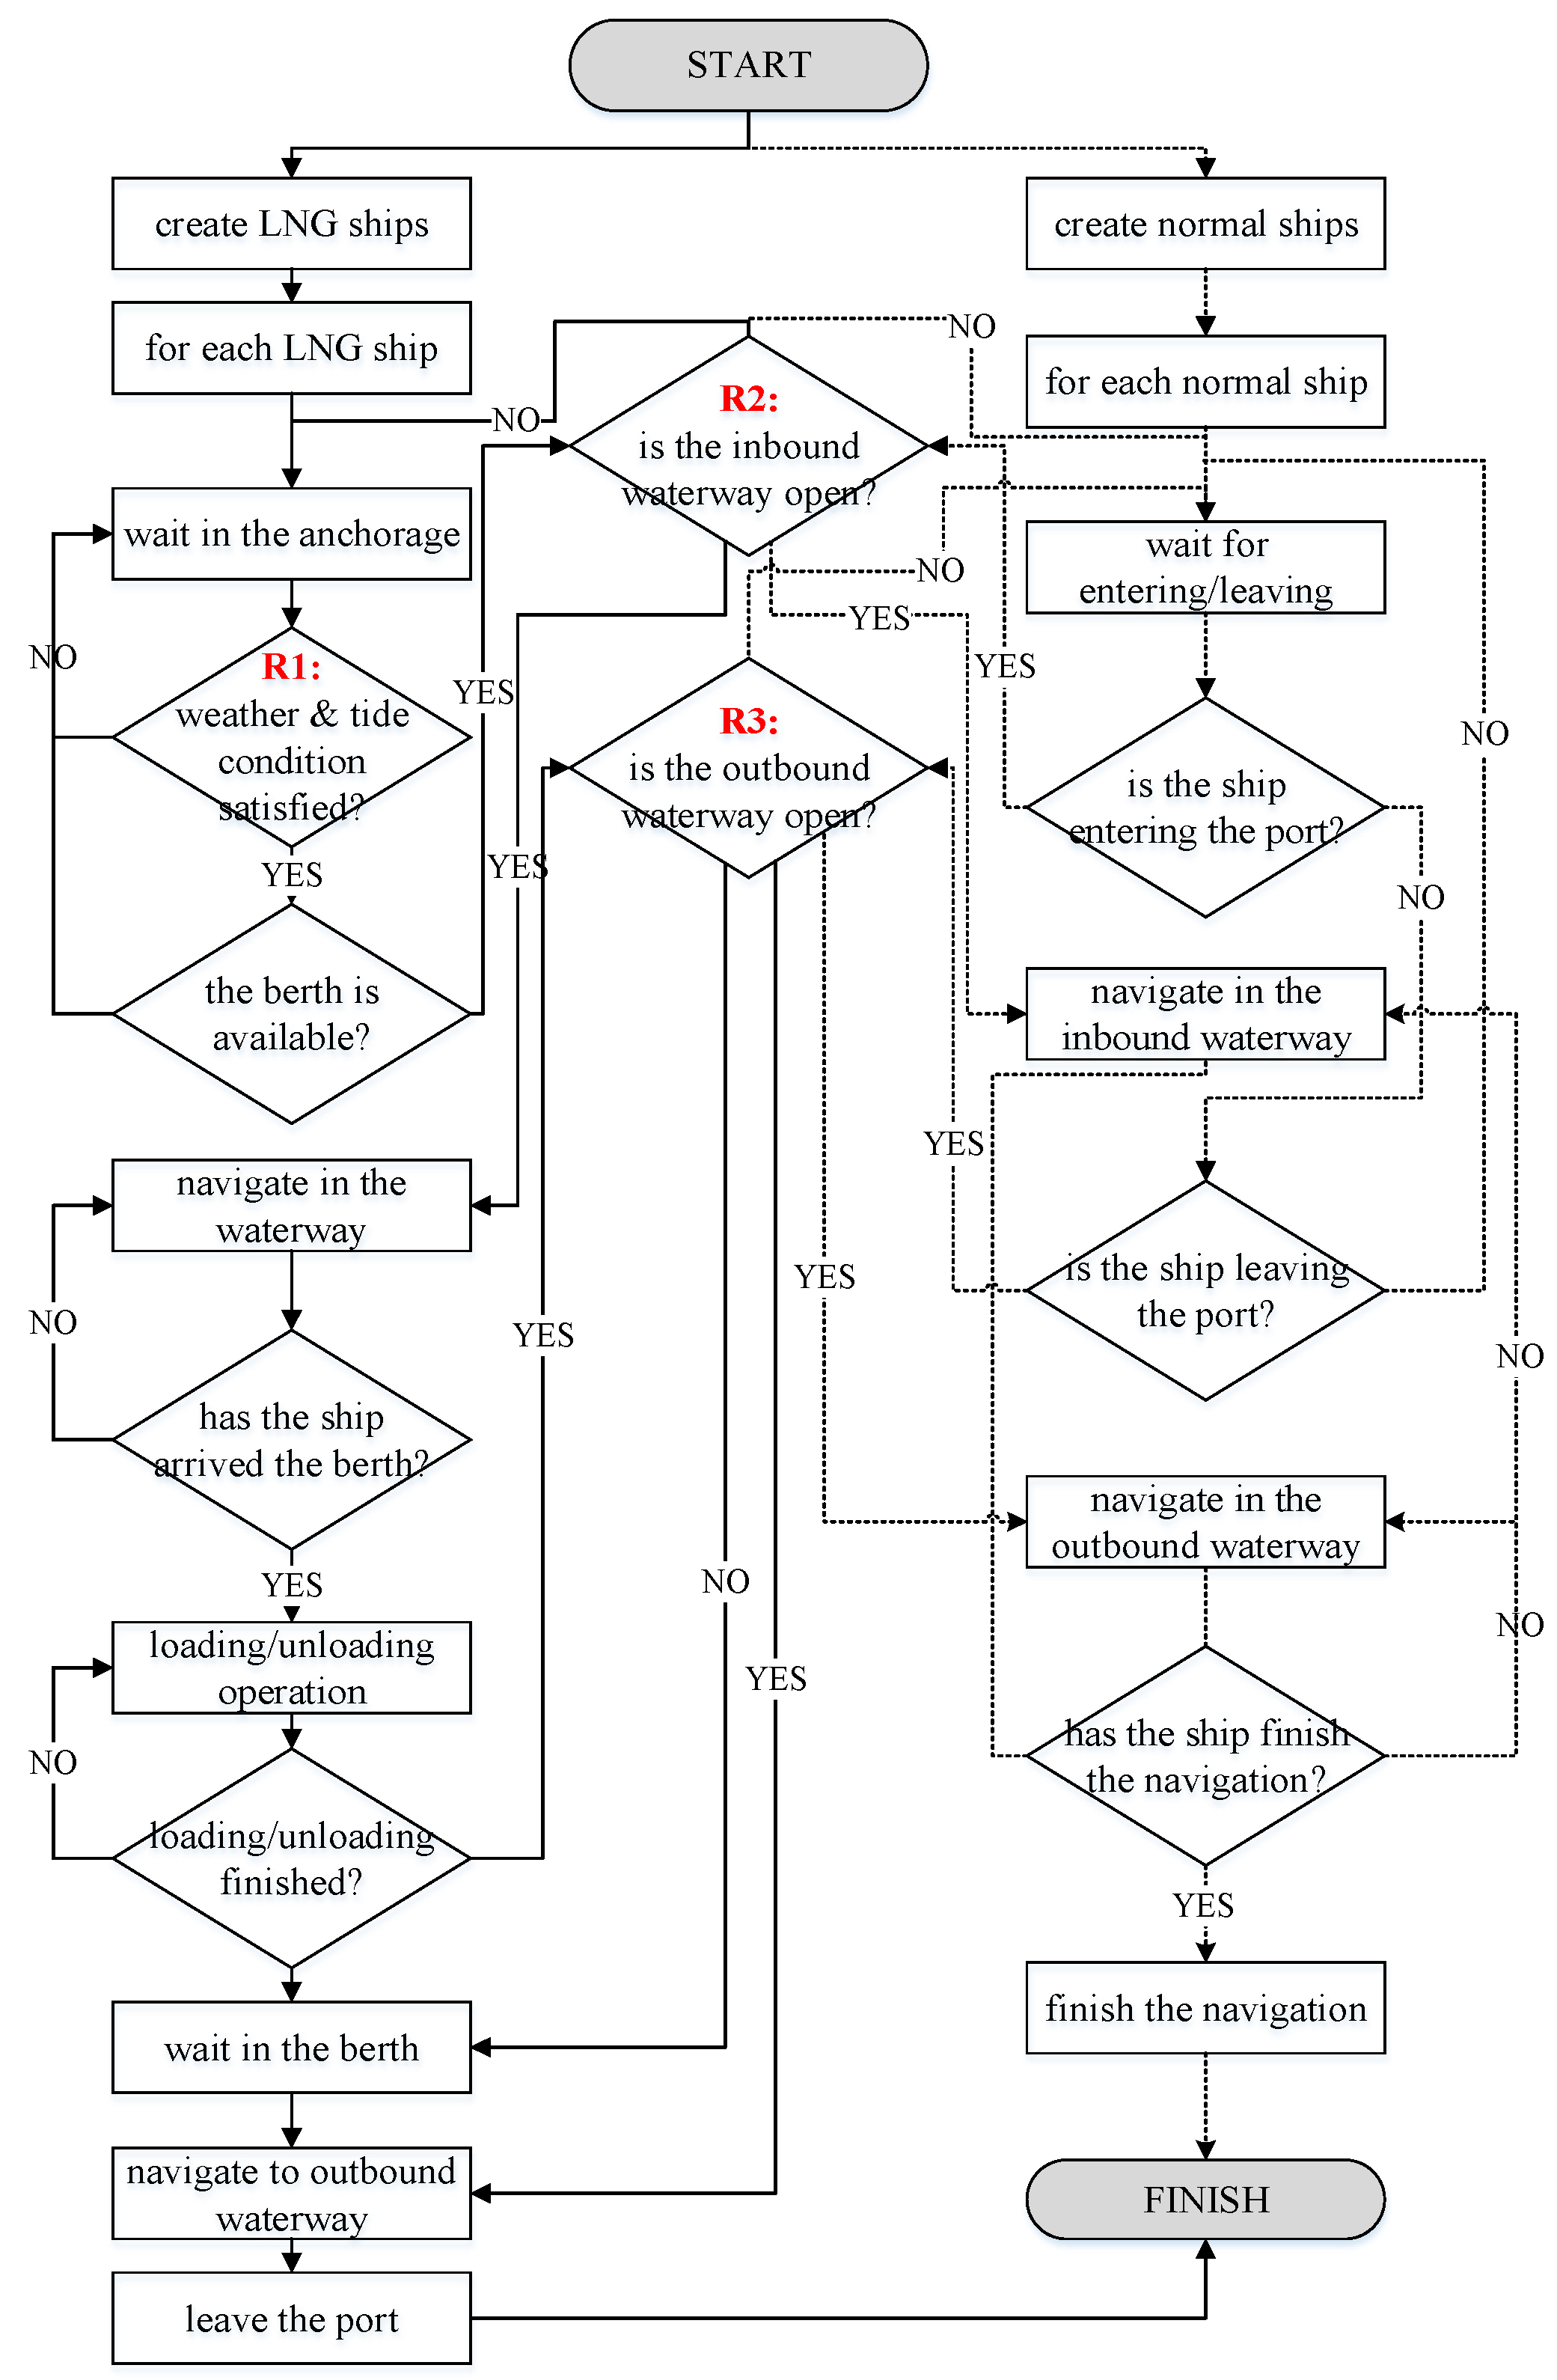
3.4. Ship Scheduling Regulation

At Tianjin Port, a first-come-first-served (FCFS) scheduling mode is used for both LNG ships and other ships. However, the LNG ships have higher priority than the other ships due to their higher requirements, i.e., they can only enter the port during high tide in the daytime. That is to say, LNG ships are not allowed to navigate in the waterway during nighttime. Moreover, the number of LNG berths has been increased from one to two, and this has promoted and increase in the number of LNG ships arriving from 8–9 to 13–15 per month. With respect to the LNG berths, since two LNG berths are deployed in the same area, and since they share the waters of one basin, ships in the two berths cannot turn around and perform docking and unberthing operations at the same time. When two LNG ships arrive at the port concurrently, the ship which docks at the first LNG berth is given priority. When two LNG ships leave the port simultaneously, the ship docked at the second LNG berth will have priority.
Considering the above regulations and restrictions, the LNG ships are given the highest priority when entering or leaving the port. Moreover, they are not allowed to perform berthing or unberthing operations simultaneously in the two berths. Other ships can enter or leave the waterway sequentially only when the safety requirements for the LNG ships are satisfied.

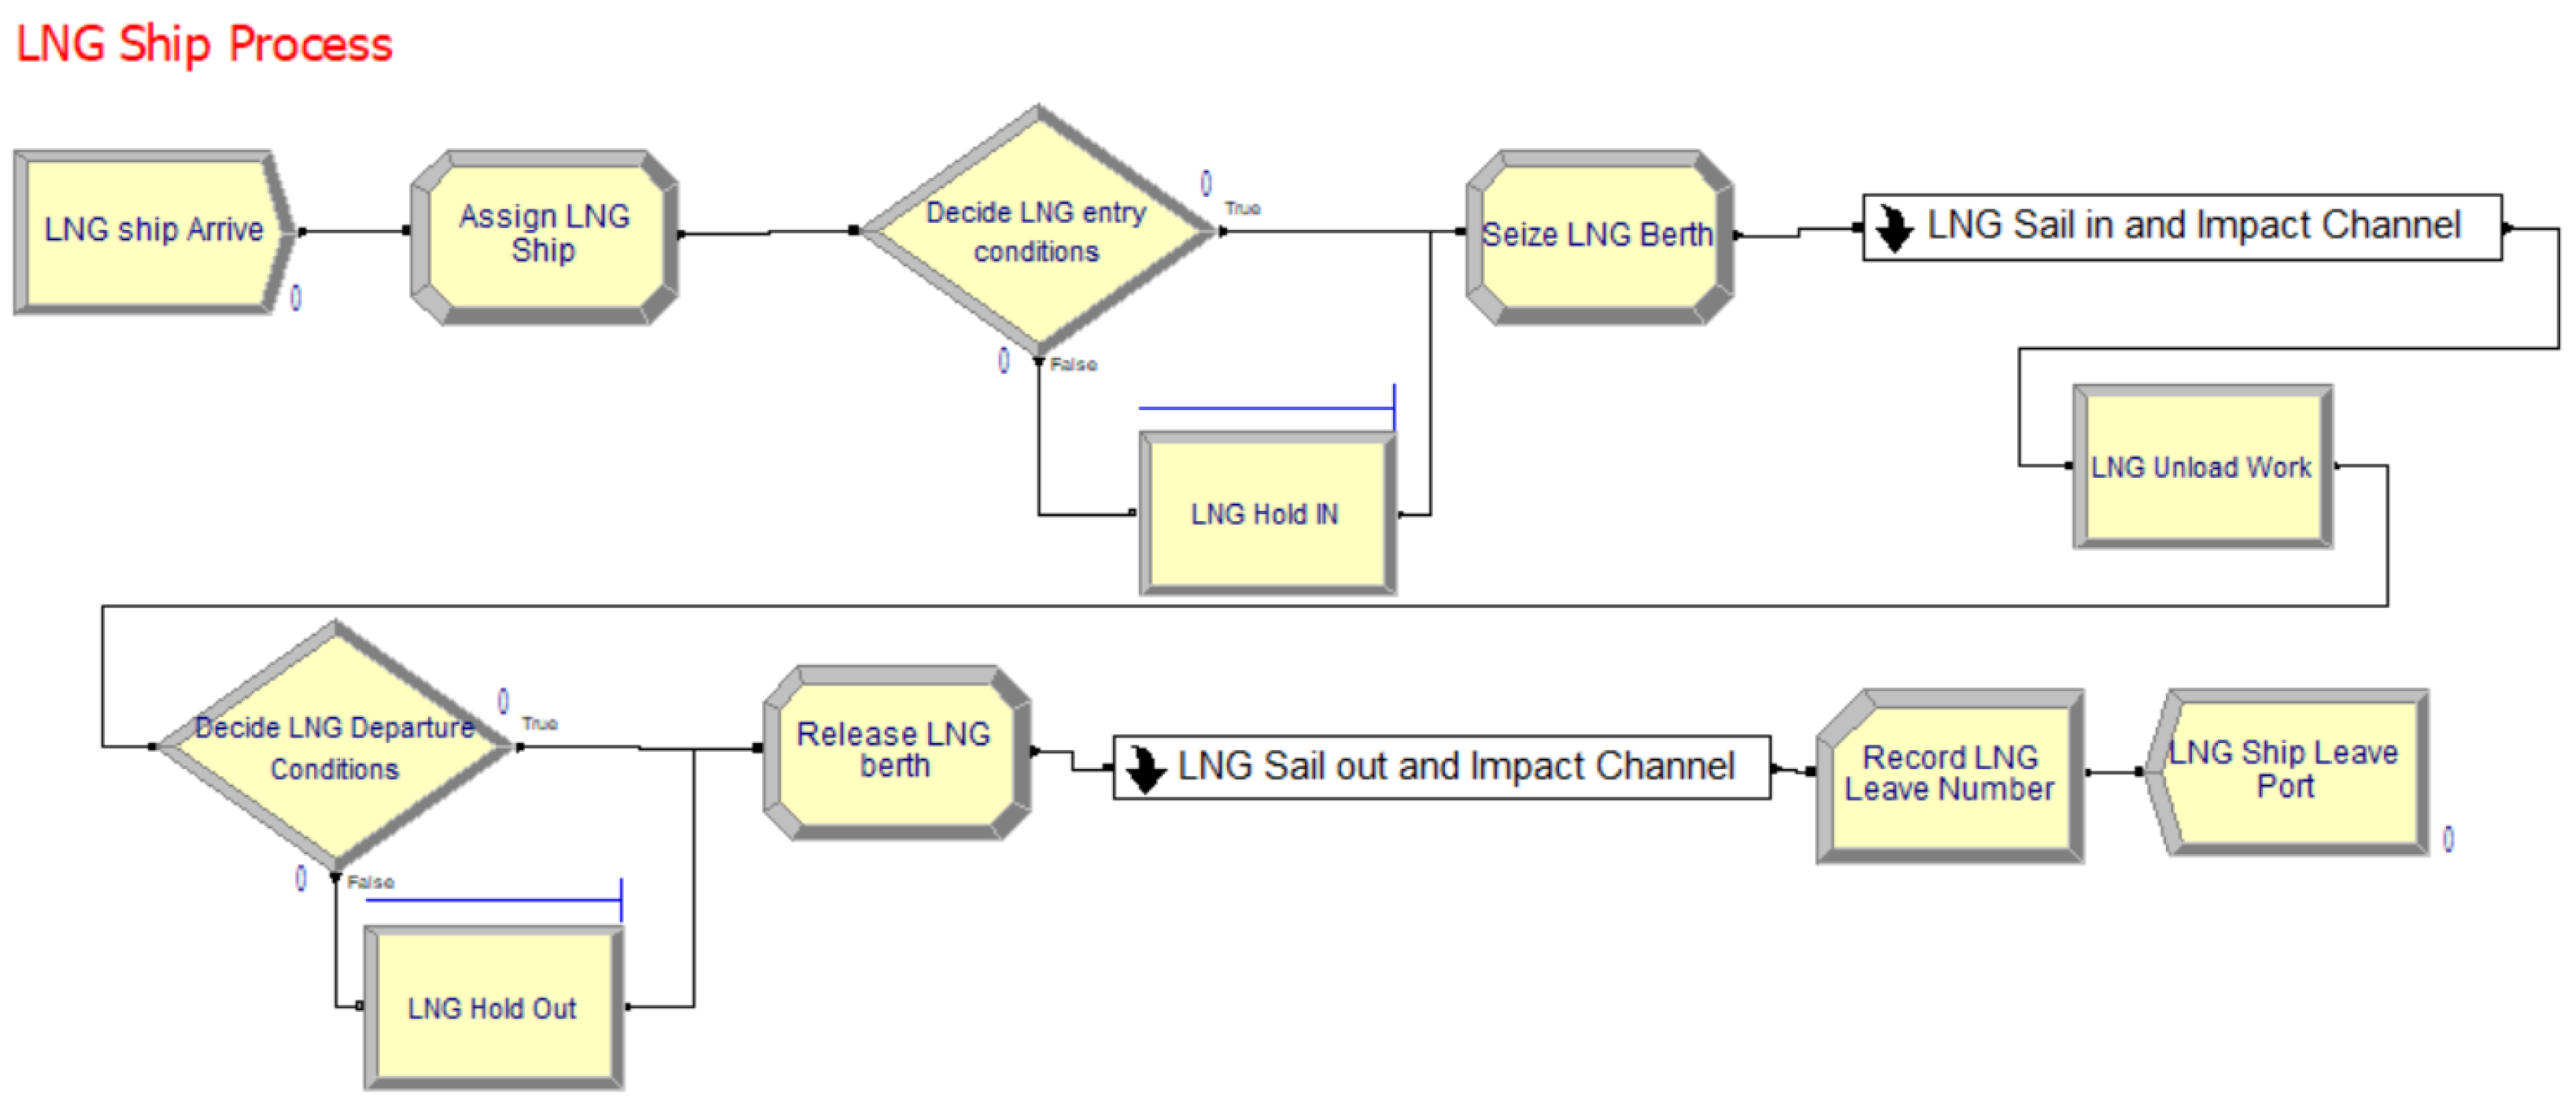
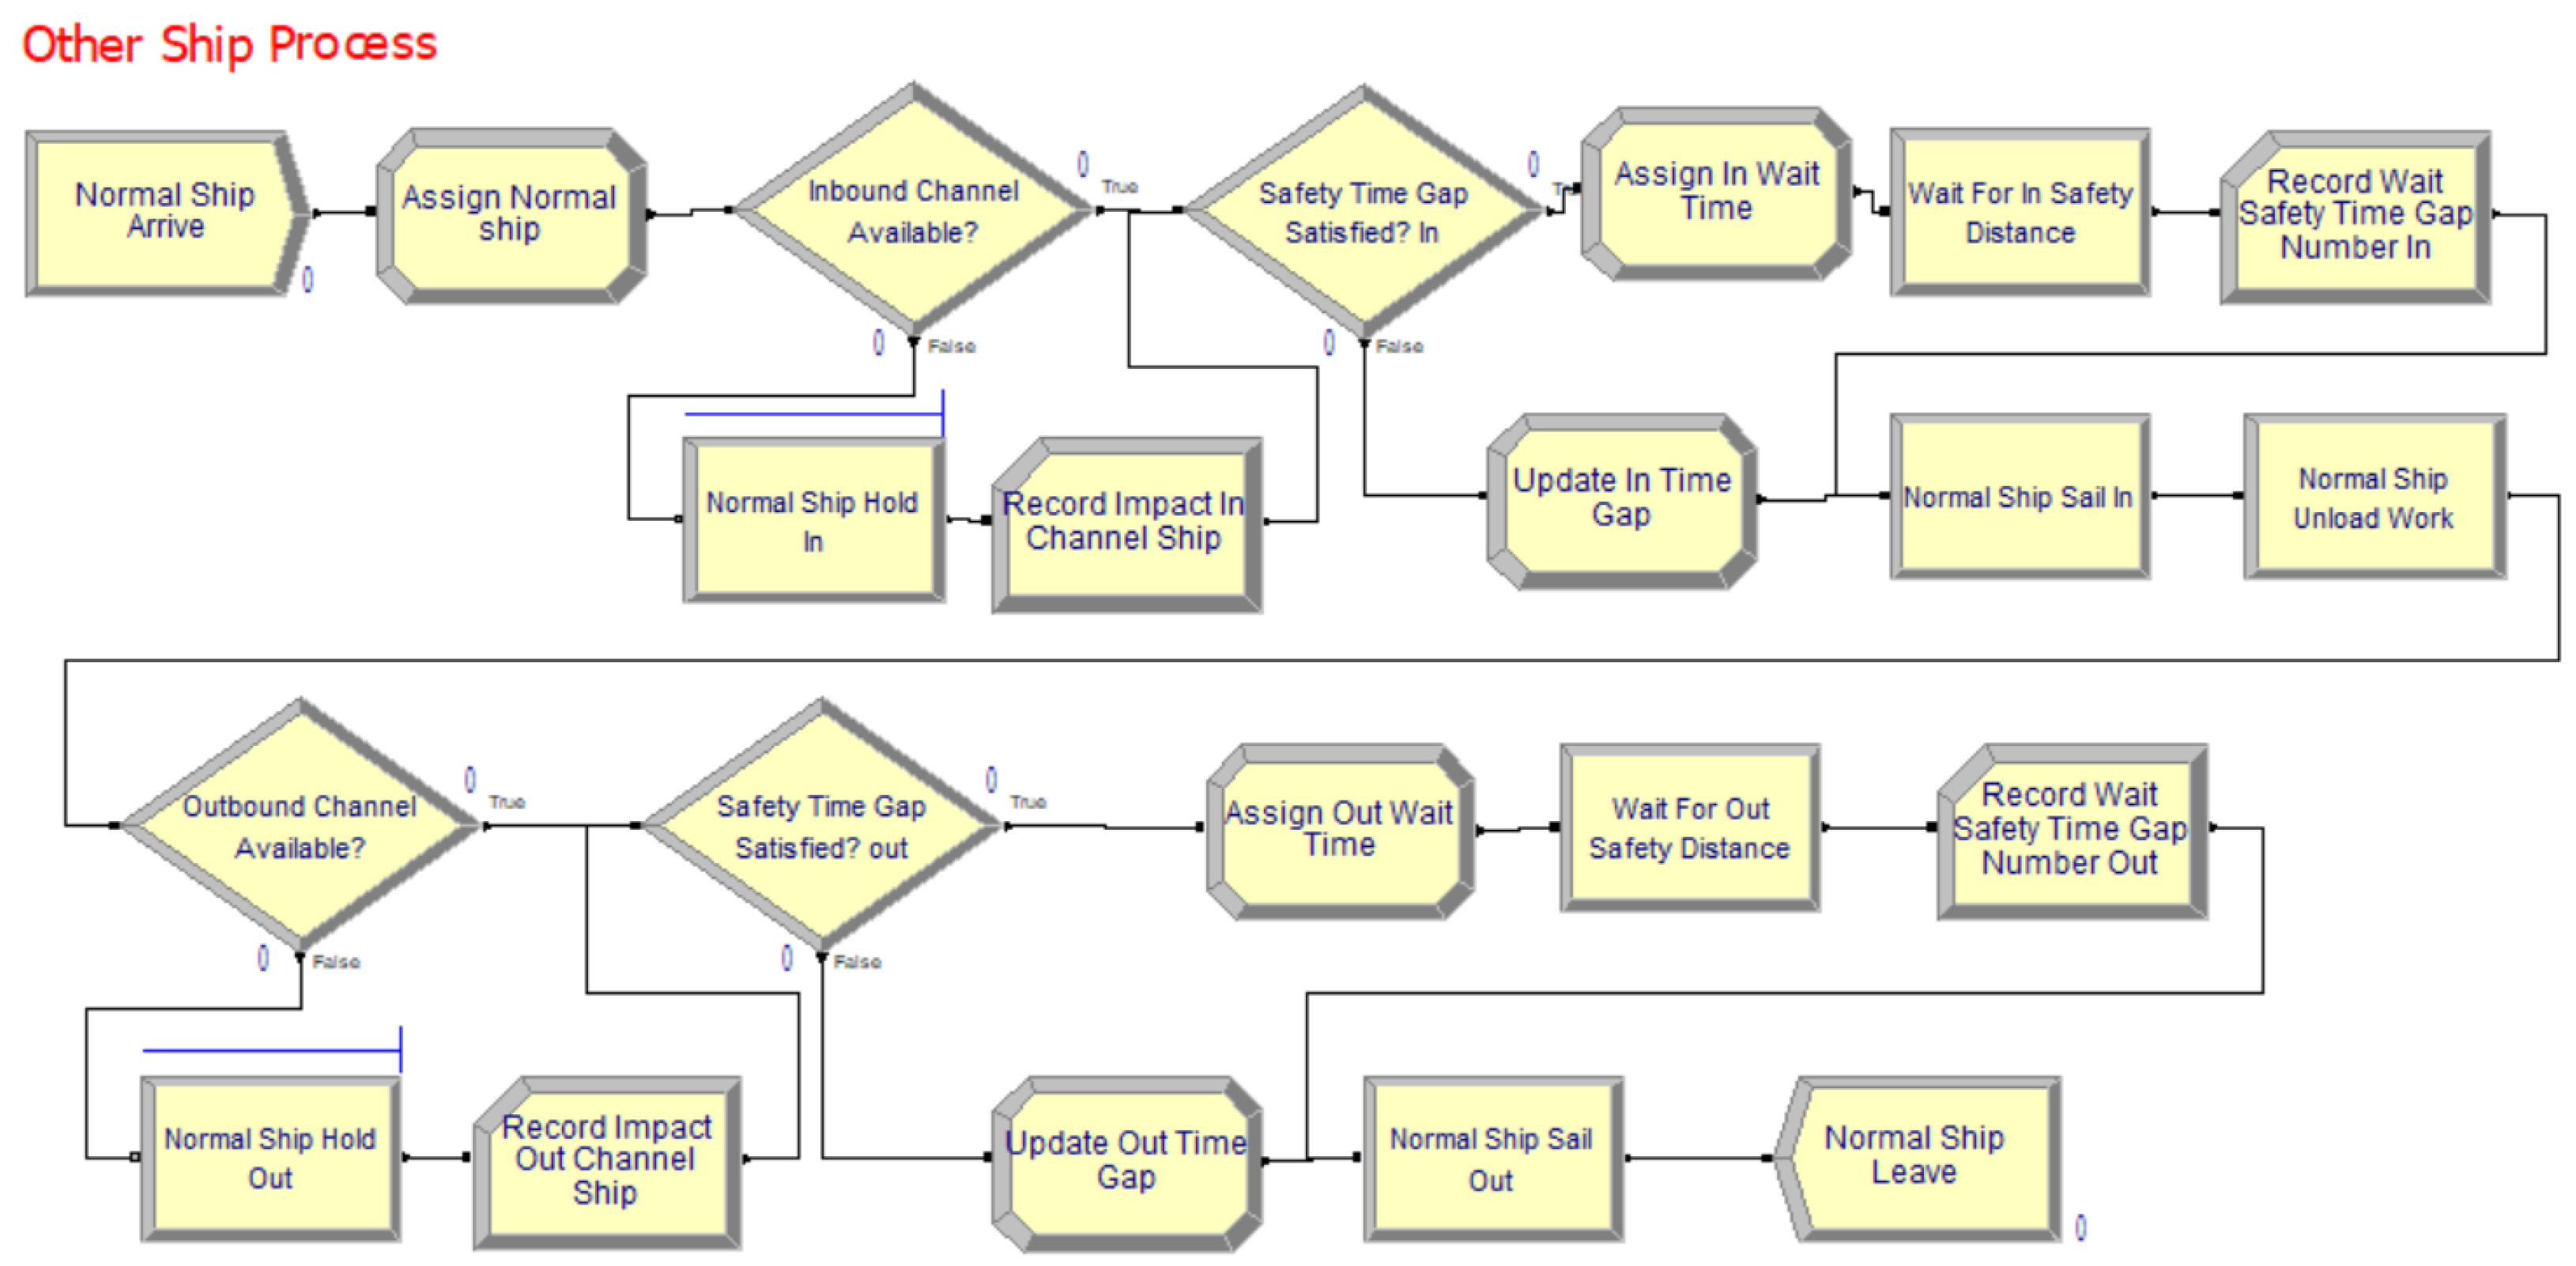
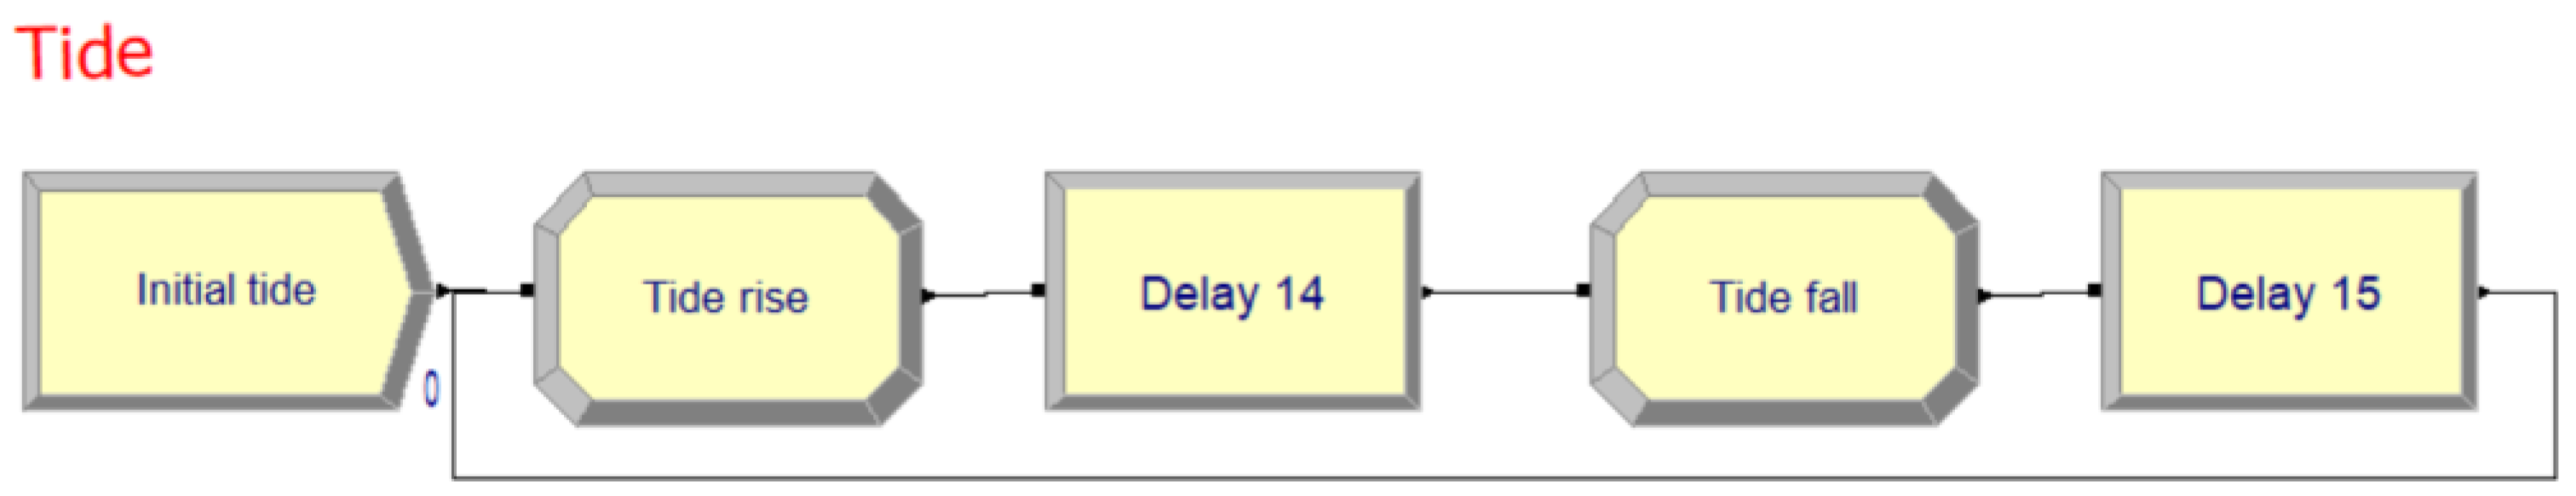
4. Simulation Formulation Using Arena Software

In this section, the simulation model for the ship traffic system involving both LNG ships and other ships constructed using Arena software is discussed. In accordance with the flowchart in Section 4, the values/distributions of the parameters for the traffic system at Tianjin Port, which considers the influence of LNG ships, are summarized in Table 1. According to the historical data, in 2022, 135 LNG ships arrived at Tianjin Port. The distribution of the berthing times of the LNG ships was obtained from the normal fitting results shown on the left in Figure 3. Due to the fact that the port waterway would be closed for 24 days (576 h), the total simulation time for 1 year was set to 341 days (8184 h). Because the waterways close temporarily due to weather conditions, the time interval between two LNG ships can be treated as an exponential distribution with a parameter of 60.62 h. Similarly, there were on average 1135 other ships per year, and the time interval between two ships followed an exponential distribution with a parameter of 7.21 h. The parameters will be applied to the ship transportation system formulation for both the LNG ships and the other ships.
Following the flowchart in Figure 2, the discrete-time simulation model can be constructed using Arena software. The reason why Arena software was used is that it offers a flexible and user-friendly simulation environment for modeling and optimizing complex systems across diverse industries. With a graphical interface, it enables easy model creation and dynamic visualization, aiding in process optimization and resource allocation. It supports experimentation without real-world disruption, and the statistical analysis of performance indicators.
Using Arena software, the model was composed of three parts: the workflow of the LNG ships, the workflow of the other ships, and the tide restriction formulations. The mutual influence between the LNG ships and the other ships was realized by updating the inbound and outbound channel states. The channel availability for the LNG ships was determined using the tide restriction formulation model.
The workflow of the LNG ships is presented in Figure 4, which is a snapshot of the simulation process. It can be seen that at the time point, 69 LNG ships have arrived and 66 ships have left the port. Initially, the arriving LNG ships are randomly generated in accordance with the arrival rate. The model then checks whether the first LNG ship can enter the waterway. This is determined by the tide condition, the LNG berth condition, and the waterway condition. Once an LNG ship has entered or left the channel, it places more restrictions on the navigation of other ships. Such restrictions are realized by “LNG Sail in and Impact Channel” and “LNG Sail out and Impact Channel”. These two nodes change the channel states, which will be further used in the workflow of other ships. The node “LNG Unload Work” is used for delaying the LNG ship process in accordance with the berth operation period. After the LNG ship has finished its operations, it will leave the port and the corresponding berth is released using “Release LNG berth”. In the meantime, the number of visiting LNG ships is updated accordingly.
The simulation workflow of the other ships is presented in Figure 5. It is also a snapshot of the simulation process. The other ships are created randomly with an exponential distribution between two consecutive ships. The “Inbound Channel Available?” and “Outbound Channel Available?” nodes are connected with the channel states in the LNG ship simulation workflow. The safety distance between two consecutive other ships and that between other ships and LNG ships are determined using the “Safety Time Gap Satisfied? In” and “Safety Time Gap Satisfied? Out” nodes. The safety distance is calculated by multiplying the safety time by the navigation speed of other ships. In this process, the time gap between ships is continuously updated using nodes such as “Update In Time Gap” and “Update Out Time Gap”. After a normal ship leaves the port, information including arriving time, wait time, and whether it was impacted by an LNG ship, among other things, is recorded. When finishing the whole simulation process, the data can be statistically analyzed in a systematical way.
It should be noted that the tide condition has an impact on the LNG ships. Figure 6 presents the tide restriction formulation used in the simulation. It is a regular switch between tide rise and tide fall stages. As there are two tide rise stages and two tide fall stages each day, the switch frequency is set to 6 h (Delay 14 and Delay 15). The tide model is connected with the LNG ship scheduling model in Figure 4. It should be noted that in the simulation, the distinction between high tide and low tide is not considered, and the tide level is assumed to be the same in different periods. Although this is not strictly in line with common practice, the difference between the water level at high tide and at low tide does not vary too much. Therefore, the influence of such a distinction is not apparent, and it would not have much of an impact on the results. Moreover, it should be noted that an LNG ship can only enter the channel when the residual tide rise period is long enough for the LNG ship to arrive at the berth waters. This restriction is included in the simulation model.
By combining the above three sub-models, a simulation model for the Tianjin Port ship traffic system involving both LNG ships and other ships can be realized. Since the discrete-time simulation cannot reach a steady state in the early stage because only a few ships have arrived and no ships have finished the whole procedure, a warm-up period of 100 h was set up in the simulations. This meant that the data from the first 100 h of each simulation were not recorded; only the simulation data from the residual 8184 h were recorded for further data analysis. Moreover, each simulation was run 5 times with the same parameters in order to validate that the results were steady and that the fluctuations were within an acceptable level.

5. Simulations Results and Analysis

5.1. Results and Analysis

In this section, we discuss the simulations of the Tianjin Port waterway traffic system that were performed using Arena. The results for both normal ship and LNG ship volume from five parallel simulations are presented in Table 2 along with the historical data from 2022. According to the statistics, from 29 December 2021 to 29 December 2022 in the “Dagang area” of Tianjin Port, a total of 1450 ships entered and left the port (135 LNG ships and 1315 other ships). It can be seen that the simulated ship traffic volume largely fluctuated around the level seen in the real data with limited variations; this indicates that the simulation system can reflect the real ship traffic system to a large degree.
In order to further analyze the overall performance of the ship traffic system, Table 3 presents the waiting time of the ships by summarizing the 5 parallel simulations. Arena software can summarize the uncertainties in the simulation results. For example, the average values along with the half widths and other typical parameters can be found in the simulation results reports. All the data in the subsequent sections are from these reports, including the confidence intervals and other typical values.
The LNG ships usually need to wait for a long time before entering the waterway, with an average value of 12.45 h and a maximum value of 54.5 h. According to the historical data from 2022, the average waiting time of an LNG ship was 13.48 h. Due to the uncertainty of the simulations, the confidential interval from LNG ship waiting time was [10.81, 14.09] (considering the half width in the table). The historical data also indicate that LNG ships usually need to wait for around 2.5 h before leaving their berth, and this is also consistent with the simulation results. Similarly, the historical data indicate that the other ships usually need to wait for around 2 h before entering the waterway due to the impact of the LNG ships, and that they also need to wait for 2.1 h before leaving their berth due to the influence of the LNG ships. Therefore, the simulation results are consistent with the real data.
LNG ships are influenced by many factors, including the tide conditions, the operation conditions of other LNG ships in their berths, and the LNG ships leaving the waterway. However, the waiting time for LNG ships when leaving the port is much shorter, with an average of 2.42 h and a maximum value of less than 5 h. The average waiting time for other ships (both arriving and leaving) is around 2 h. A survey of the Tianjin Maritime Safety Administration and the Tianjin Port Pilot Center provided a subjective evaluation by relevant experts on the waiting times of other ships due to the impact of LNG ships, which in general is thought to be between 1.5 h and 3 h. This estimate is similar to the real waiting times encountered by ships when leaving the port. Although the average waiting time for other ships is much shorter than that for LNG ships, the traffic volume is much larger. Therefore, the total waiting time is much longer, and this fact requires special attention.
Besides the waiting time, the queue length is another important indicator when evaluating the overall traffic efficiency. Table 4 presents the queue lengths of LNG and other ships in the five simulations along with the distributions. The average queue lengths for both the LNG ships and the other ships were small, and the entering LNG ships experienced the longest queues with a maximum value of 0.1133. This means that the queue length was larger than 1 for more than 10% of the simulated time, with a maximum queue length of 3. This would be the main reason that some LNG ships have to wait for a very long time, as can be seen from the data in Table 3. The maximum queue length reaches 4–5 for entering and leaving other ships. Under such circumstances, the ships would wait for a much longer time, which sacrifices the overall traffic efficiency.

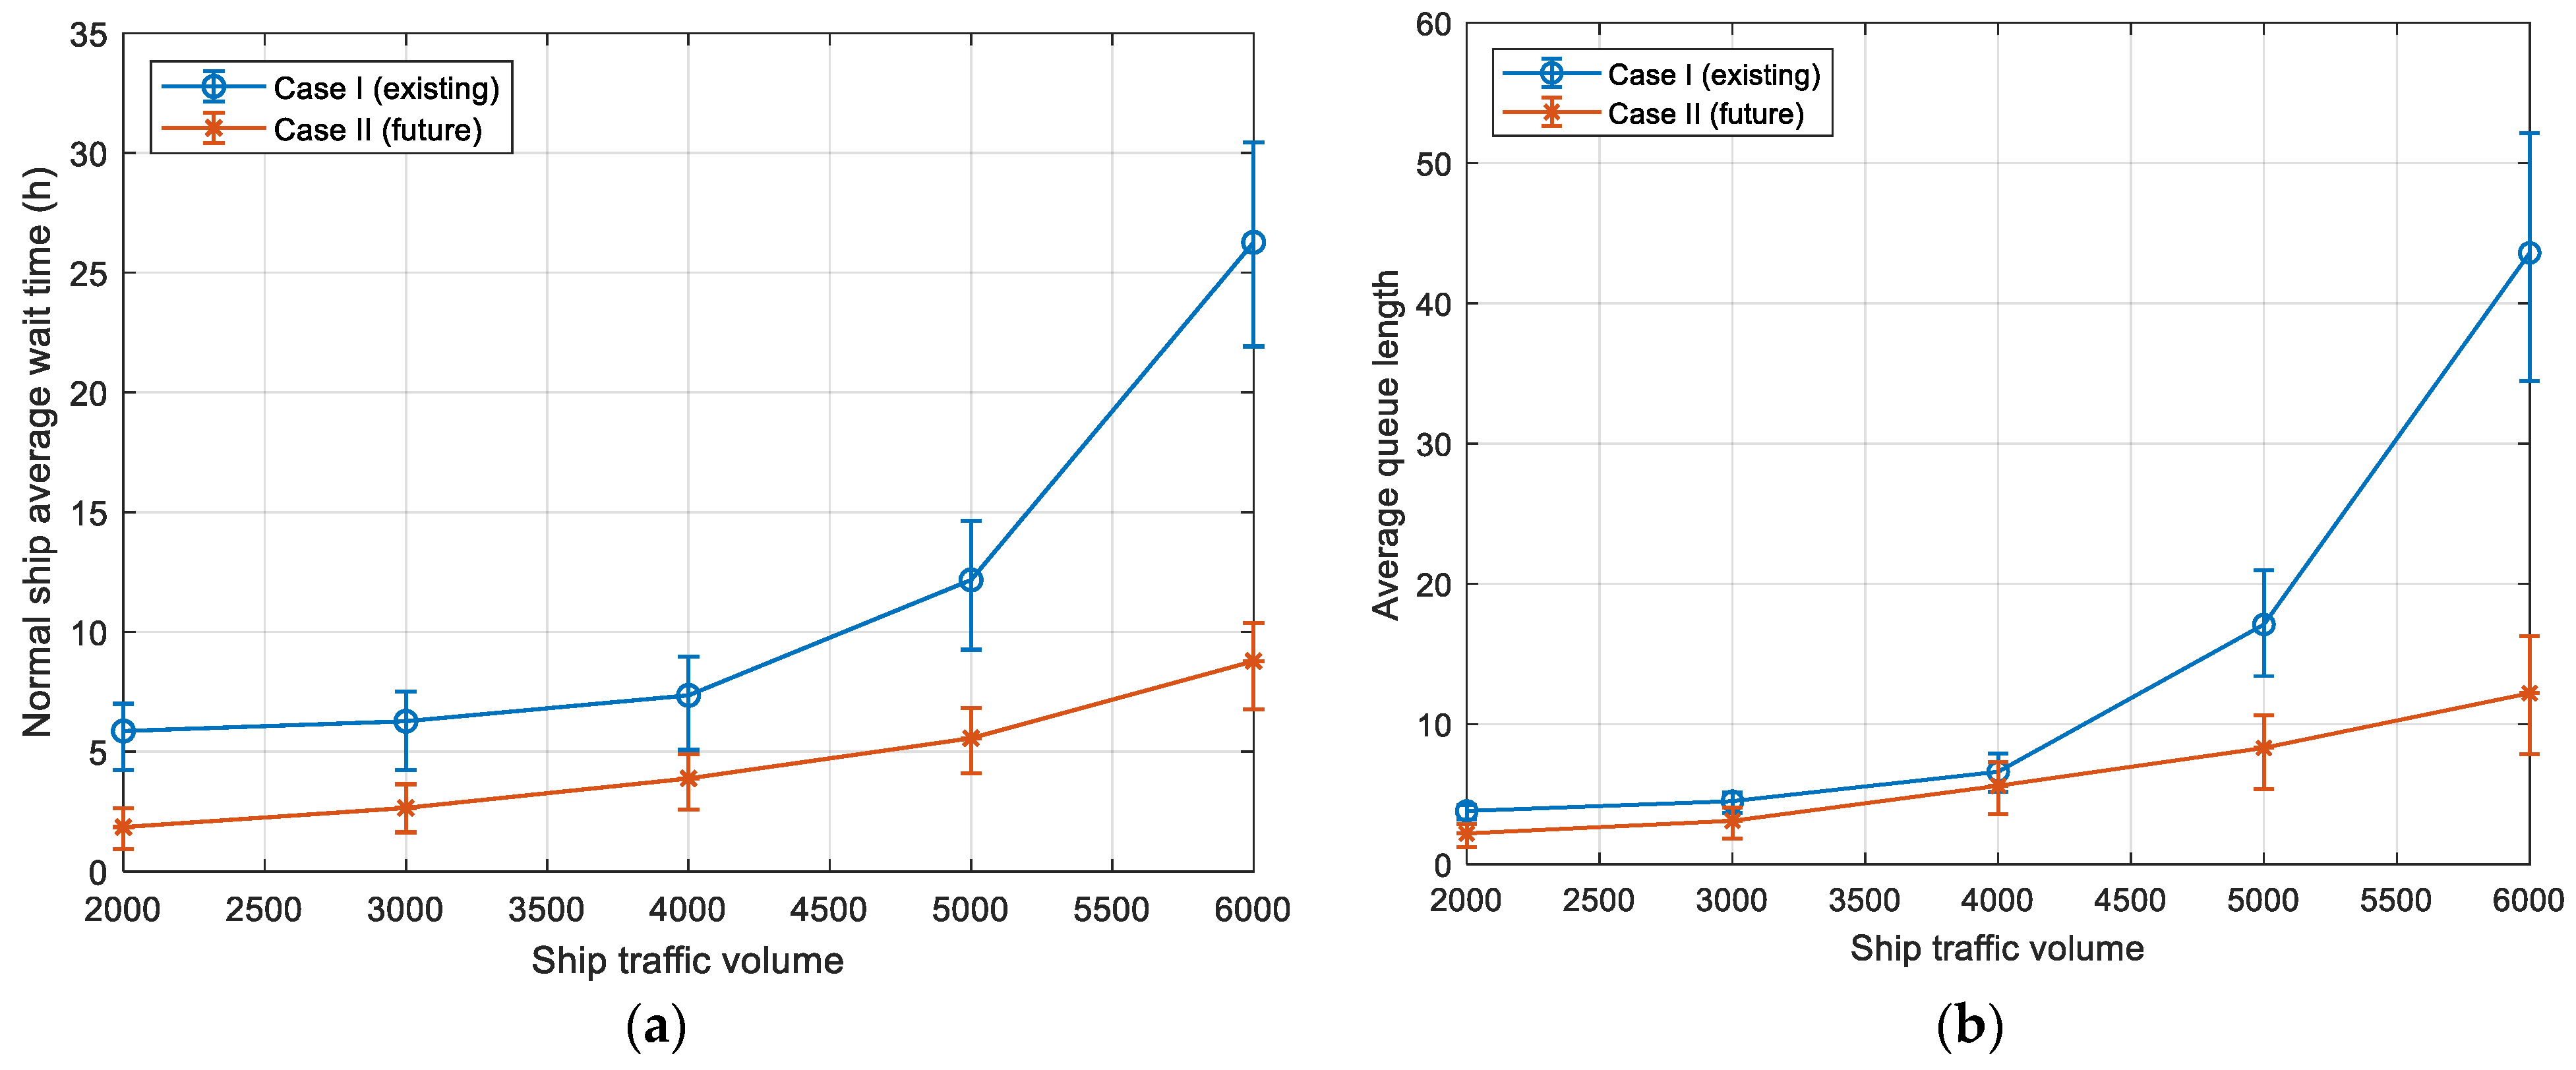
5.2. Simulation with Increased Number of Other Ships

Considering the existing ship traffic situation, it is reasonable to predict that ship traffic will continue to increase in the near future. Due to the fact that the two LNG berths are almost fully utilized, the number of arriving LNG ships would not likely increase. However, the number of other ships would likely increase to a large degree. Nevertheless, since the LNG ships usually have the highest priority to enter and leave the waterway, an increase in the number of other ships would not influence the efficiency of the LNG ships. However, the influence of the LNG ships on the other ships could be apparent. As a result, a ship traffic simulation with an increased number of other ships was performed and will be discussed in this section.
It should be noted that the waterways used by LNG ships can have many different traffic regulations. The regulations are largely a trade-off between efficiency and safety. The distinction between the two cases in terms of navigation regulations is present in Table 5.
(1)
Case I: The existing traffic regulations
The waterway permits one-way navigation for LNG ships and two-way navigation for other ships. A 1 n mile safety distance is set for LNG ships navigating in the waterway, i.e., ships in front of the LNG ships are removed, and ships to the rear can follow at this safety distance. Moreover, LNG ships are given the highest priority to enter the waterway in the first place, and ships in front of the LNG ships are prohibited from navigating in the waterway. Other ships at a distance beyond 1 n mile of the LNG ships on the waterway can follow to navigate. Under these traffic organization working conditions, the waterway will not be closed.
(2)
Case II: Modified traffic regulations
In order to enhance the overall traffic efficiency, the port may change the regulations. So, we assume that the traffic regulations will change in the future because the ships’ waiting times would increase tremendously with the increase in the number of LNG ships. Only by changing the regulations can the waterway utilization be enhanced and the overall traffic efficiency become acceptable. In view of this, it is assumed that in this case the waterway permits two-way navigation for both LNG ships and other ships. The front and rear ships outside the safety distance of the LNG ships on the waterway can navigate, i.e., ships in front of the LNG ships can sail, and ships to the rear can follow. That is to say, ships can navigate 1 n mile in front of and to the rear of the LNG ships. When LNG ships are entering or leaving the waterway, other ships on the opposite waterway are not allowed to navigate. However, other ships can navigate in both directions on the waterway, and ships can navigate in front of and to the rear of LNG ships if they are beyond the safety distance. It is assumed that such regulations could increase waterway utilization and reduce the impact of LNG ship navigation on waterway transit capacity. Navigation safety would also likely increase to some degree.
The simulations of the two cases were all performed five times under the same parameters, and the results are presented in Figure 7. The left figure shows the tendency of the average waiting time under the two sets of regulations, and the right figure is the average number of other ships waiting. The error bars are the lower and upper boundaries from the five simulations. With the increase in traffic volume, both the e average waiting time and the number of other ships waiting increased exponentially under the existing regulations, and they grew linearly under the new traffic regulations. That is to say, the existing traffic regulations would gradually become impracticable. The reason why both the waiting times and the queue lengths under the new traffic regulations are lower than those under the existing regulations is that in Case II the navigation regulations were relaxed to some degree, and this helps promote waterway utilization. For example, ships can navigate in front of one LNG ship in Case II, which enables some ships to enter or leave the waterway earlier than they can in Case I.
By looking at the figures in more detail, the following findings can be obtained: (1) When the traffic volume of other ships is not too large (less than 4000 ships), in two-ship traffic regulation cases, ship navigation under the existing regulations does not have any apparent impact on the waterway transit capacity in the “Dagang area”. The distinction between them stays at an acceptable level. (2) When the traffic volume of ships further increases, some ships have to wait in the anchorage waters or near the pier outside the waterway under the existing regulations, increasing the wait time to a large degree. In the future, as the traffic volume of ships in the port area increases, new traffic organization strategies should be adopted to increase the navigable time of other ships.
Moreover, when the number of ships reaches 6000, the existing traffic regulations become impracticable. The average waterway waiting time rises to 26.27 h, and the average queue length reaches over 40, which is unacceptable. By then, the waterway transit capacity is affected to an unacceptable extent, and severe congestion appears in the port operation area. Hence, the existing traffic regulations need to be replaced with the new regulations. Under the new regulations, a ship’s average waiting time is 8.78 h, and the average queue length is reduced to 12.2. These two important parameter values are acceptable.
With respect to the robustness of the simulation system, the error bars in Figure 7 reflect the annual fluctuations in the waiting times among the five parallel simulation years. Taking the average waiting time as an example, the deviation from the mean value in Case I lies between 0.6 h and 9.12 h, and in Case II it lies between 0.93 h and 4.35 h among the five simulation years. One way to reduce such deviations is to prolong the simulation time. However, this would not better reflect the uncertainties concerning the arriving ships in different years. Therefore, these fluctuations are common, and decision makers need to consider such uncertainties when evaluating overall ship traffic efficiency.

6. Conclusions

In this paper, Arena software was used to simulate the whole process from ships entering the port, to the berthing operation, to ships leaving the port. The simulations of the existing LNG ship and normal ship traffic volume indicate that the model can reflect the real circumstances with satisfactory precision. The tendencies of the waiting time and queue length indicators following an increase in the number of other ships arriving under both the existing traffic regulations and new traffic regulations were investigated in more detail. The results indicate that the simulations can reflect real ship traffic trends at Tianjin Port. The results also revealed that when the number of other ships arriving annually reaches 6000, under the existing ship traffic regulations, the ships’ average waiting time is 26.27 h, and the average queue length of other ships reaches 43.6, severely affecting the waterway transit capacity. When adopting the new traffic organization regulations, the ships’ average waiting time can be decreased to 8.78 h, and the average number of waiting ships can be reduced to 12.2, enhancing the waterway transit efficiency to a large degree. In the meantime, special attention should be paid to guaranteeing the navigation safety of all ships.

Author Contributions

Conceptualization, Y.L., J.Z. and W.T.; methodology, J.Z. and B.M.; software, Y.L., J.Z. and W.T.; validation, Y.L., J.Z., W.T., B.M. and R.Z.; formal analysis, J.Z. and B.M.; investigation, W.T. and J.Z.; resources, J.Z., W.T. and R.Z.; data curation, Y.L., B.M. and R.Z.; writing—original draft preparation, Y.L. and W.T.; writing—review and editing, W.T. and B.M.; visualization, Y.L. and W.T.; supervision, J.Z. and R.Z.; project administration, Y.L.; funding acquisition, Y.L. and J.Z. All authors have read and agreed to the published version of the manuscript.

Funding

This research was supported by the Fund of Guangxi Science and Technology Program (AB23026132), the Guangxi Natural Science Foundation (2022JJA160158), the Hubei Key Laboratory of Inland Shipping Technology (No. 202202), the Central Public Research Institutes Fundamental Research (TKS20230407; TKS20230206), the National Natural Science Foundation of China (51920105014; 52071247), the Innovation and Entrepreneurship Team Import Project of Shaoguan city (201212176230928), and the Fundamental Research Funds for the Central Universities (WUT: 223144002, 2023IVB079).

Institutional Review Board Statement

Not applicable.

Informed Consent Statement

Not applicable.

Data Availability Statement

Data are contained within the article.

Conflicts of Interest

The authors declare no conflicts of interest.

References

  1. Zhang, F.; Yu, H.; Li, H.; Peng, L.; Zhou, T. Safety or Efficiency an ECSO Framework of Traffic Organization Optimization for LNG Carriers Entering and Leaving Port. Math. Probl. Eng. 2021, 2021, e8804219. [Google Scholar] [CrossRef]
  2. Zhu, M.; Huang, L.; Huang, Z.; Shi, F.; Xie, C. Hazard Analysis by Leakage and Diffusion in Liquefied Natural Gas Ships during Emergency Transfer Operations on Coastal Waters. Ocean Coast. Manag. 2022, 220, 106100. [Google Scholar] [CrossRef]
  3. Chen, L.J.; Yan, X.P.; Huang, L.W.; Yang, Z.L.; Wang, J. A systematic simulation methodology for lng ship operations in port waters: A case study in meizhou bay. J. Mar. Eng. Technol. 2018, 17, 12–23. [Google Scholar] [CrossRef]
  4. Gkonis, K.; Psaraftis, H. Investment rules and competition patterns in LNG shipping: A Game Theory approach. In Proceedings of the IAME 2007 Annual Conference, Athens, Greece, 4–6 June 2022. [Google Scholar]
  5. IGU. World LNG Report, 2017th ed.; International Gas Union: Barcelona, Spain, 2017. [Google Scholar]
  6. Miller, G.; Zeng, X. Chinese LNG import prospects brighten. Fairplay 2017, 388, 1–24. [Google Scholar]
  7. Sun, B.; Guo, K. LNG accident dynamic simulation: Application for hazardous consequence reduction. J. Loss Prev. Process Ind. 2013, 26, 1246–1256. [Google Scholar] [CrossRef]
  8. Lv, P.; Zhuang, Y.; Deng, J.; Su, W. Study on lockage safety of LNG-fueled ships based on FSA. PLoS ONE 2017, 12, e0174448. [Google Scholar] [CrossRef]
  9. Koopman, R.P.; Ermak, D.L. Lessons learned from LNG safety research. J. Hazard. Mater. 2007, 140, 412–428. [Google Scholar] [CrossRef]
  10. Elsayed, T.; Leheta, H.; Shehadeh, M. Multi-attribute risk assessment of LNG carriers during loading/offloading at terminals. Ships Offshore Struct. 2009, 4, 127–131. [Google Scholar] [CrossRef]
  11. Li, M.; Mou, J.M.; Xinsheng, Z.; Gong, S. The impact of LNG carrier transit on fairway capacity. Sci. J. Marit. Univ. Szczec. 2018, 56, 63–70. [Google Scholar] [CrossRef]
  12. Gu, M. Design Code of General Layout for Sea Port (JTS165-2013); China Communications Press: Beijing, China, 2013. [Google Scholar]
  13. Wang, W.; Peng, Y.; Tian, Q.; Song, X. Key influencing factors on improving the channel capacity of coastal ports. Ocean Eng. 2017, 137, 382–393. [Google Scholar] [CrossRef]
  14. Gucma, L. LNG Terminals Design and Operation: Navigational Safety Aspects; Marine Traffic Engineering: Szczecin, Poland, 2013. [Google Scholar]
  15. Liu, J.; Liu, Y.; Qi, L. Modelling liquefied natural gas ship traffic in port based on cellular automaton and multi-agent system. J. Navig. 2021, 74, 533–548. [Google Scholar] [CrossRef]
  16. Aneziris, O.; Koromila, I.; Nivolianitou, Z. A systematic literature review on LNG safety at ports. Saf. Sci. 2020, 124, 104595. [Google Scholar] [CrossRef]
  17. Park, N.K.; Park, S.K. A study on the estimation of facilities in LNG bunkering terminal by simulation—Busan Port case. J. Mar. Sci. Eng. 2019, 7, 354. [Google Scholar] [CrossRef]
  18. Park, N.K.; An, Y. Estimation of LNG Dolphin Capacity: Dolphins of Different Size in Republic of Korea. J. Mar. Sci. Eng. 2022, 10, 2031. [Google Scholar] [CrossRef]
  19. Durlik, I.; Gucma, L.; Miller, T. Statistical Model of Ship Delays on the Fairway in Terms of Restrictions Resulting from the Port Regulations: Case Study of Świnoujście-Szczecin Fairway. Appl. Sci. 2023, 13, 5271. [Google Scholar] [CrossRef]
  20. Chen, L.; Hopman, H.; Negenborn, R. Distributed model predictive control for vessel train formations of cooperative multi-vessel systems. Transp. Res. Part C Emerg. Technol. 2018, 92, 101–118. [Google Scholar] [CrossRef]
  21. Eldemir, F.; Camci, F.; Uysal, O. Analysis and simulation of Istanbul Strait marine traffic management strategies (No. 13-1024). In Proceedings of the Transportation Research Board 92nd Annual Meeting, Washington, DC, USA, 13–17 January 2013. [Google Scholar]
  22. Jiang, L.; Huang, G.; Huang, C.; Wang, W. Data mining and optimization of a port vessel behavior behavioral model under the internet of things. IEEE Access 2019, 7, 139970–139983. [Google Scholar] [CrossRef]
  23. Qi, L.; Zheng, Z.; Gang, L. A cellular automaton model for ship traffic flow in waterways. Phys. Stat. Mech. Its Appl. 2017, 471, 705–717. [Google Scholar] [CrossRef]
  24. Mavrakis, D.; Kontinakis, N. A queueing model of maritime traffic in Bosporus Straits. Simul. Model. Pract. Theory 2007, 16, 315–328. [Google Scholar] [CrossRef]
  25. Ramin, A.; Mustaffa, M.; Ahmad, S. Prediction of marine traffic density using different time series model from AIS data of Port Klang and Straits of Malacca. Trans. Marit. Sci. 2020, 9, 217–223. [Google Scholar] [CrossRef]
  26. Liong, C.Y.; Loo, C.S. A simulation study of warehouse loading and unloading systems using Arena. J. Qual. Meas. Anal. 2009, 5, 45–56. [Google Scholar]
  27. Wang, T.; Guinet, A.; Belaidi, A.; Besombes, B. Modelling and simulation of emergency services with ARIS and Arena. Case study: The emergency department of Saint Joseph and Saint Luc Hospital. Prod. Plan. Control 2009, 20, 484–495. [Google Scholar] [CrossRef]
  28. Oljira, D.G.; Abeya, T.G.; Ofgera, G.; Gopal, M. Manufacturing system modeling and performance analysis of mineral water production line using ARENA simulation. Int. J. Eng. Adv. Technol. 2020, 9, 312–317. [Google Scholar] [CrossRef]
  29. Guneri, A.F.; Seker, S. The use of arena simulation programming for decision making in a workshop study. Comp. App. Eng. Educ. 2008, 16, 1–11. [Google Scholar] [CrossRef]
  30. Rasib, A.A. Production Smoothness Improvement through ARENA Application in the Food Manufacturing Industry. Turk. J. Comput. Math. Educ. (TURCOMAT) 2021, 12, 3516–3526. [Google Scholar]
  31. Wang, H.; Liu, J.; Zhang, J.; Liu, K.; Yang, X.; Yu, Q. Self-organizing cooperation model for ships navigating in restricted one-way waterway. Brodogradnja 2018, 69, 1–23. [Google Scholar] [CrossRef]
  32. Wang, H.; Tian, W.; Zhang, J.; Li, Y. A hybrid self-organizing scheduling method for ships in restricted two-way waterways. Brodogradnja 2020, 71, 15–30. [Google Scholar] [CrossRef]
  33. Wang, H.; Liu, J.; Liu, K.; Zhang, J.; Wang, Z. Sensitivity analysis of traffic efficiency in restricted channel influenced by the variance of ship speed. Proc. Inst. Mech. Eng. Part M J. Eng. Marit. Environ. 2018, 232, 212–224. [Google Scholar] [CrossRef]
Figure 1. The Dagang Port and the LNG berth locations.
Jmse 12 00405 g001
Figure 2. Simulation procedure for the LNG and other ship traffic.
Jmse 12 00405 g002
Figure 3. Distribution of operation time of LNG ships (left) and other ships (right) at Tianjin Port according to historical data.
Jmse 12 00405 g003
Figure 4. The workflow of LNG ships.
Jmse 12 00405 g004
Figure 5. The workflow of other ships.
Jmse 12 00405 g005
Figure 6. The tide restriction formulation.
Jmse 12 00405 g006
Figure 7. Comparison of the waiting times (a) and queue lengths (b) in the two cases.
Jmse 12 00405 g007
Table 1. The values/distributions of the parameters for the waterways of the LNG ships at Tianjin Port.
ParameterValues or Distributions
Time interval between two LNG ships (h)Exponential (60.62) [135 ships per year]
Time interval between two other ships (h)Exponential (7.21) [1135 ships per year]
Navigation speed of LNG ships (kn)10
Navigation speed of other ships (kn)Uniform (10, 13)
Waterway length (n mile)24.83
Number of LNG berths2
Navigation speed of LNG ships (kn)10
Navigation speed of other ships (kn)8
Safety distance between LNG ships and other ships (n mile)2
Safety distance between other ships (m)500
Berthing time of LNG ships (h)Normal (23.81, 1.17)
Operating time of other ships (h)Normal (47.71, 6.73)
Waterway closing period due to severe weather conditions (h)576
Table 2. The numbers of normal and LNG ships in the five simulations.
Ship VolumeSimulation 1Simulation 2Simulation 3Simulation 4Simulation 5Real Data
Other ships113911251175120211881135
LNG ships140128134137132135
Table 3. The waiting times for LNG and other ships under the existing navigation situation (all data are shown in hours).
Waiting Time (h)AverageHalf WidthMinimum AverageMaximum AverageMinimum ValueMaximum Value
Arriving LNG ships12.45191.6410.860113.61420.056654.5461
Leaving LNG ships2.42740.272.23872.75800.01194.9655
Arriving other ships2.04670.291.82212.32300.00565.8633
Leaving other ships2.16890.351.85802.47540.00189.0862
Table 4. The waiting queue for LNG and other ships under the existing navigation situation.
Number WaitingAverageHalf WidthMinimum AverageMaximum AverageMinimum ValueMaximum Value
Entering LNG ships0.11330.030.09300.13850.003.00
Leaving LNG ships0.00510.000.00330.00910.001.00
Entering other ships0.02350.000.02170.02490.004.00
Leaving other ships0.02510.010.01730.03440.005.00
Table 5. Comparison between two sets of traffic regulations.
Navigation RegulationsCase ICase II
Two-way navigation for LNG ships××
Two-way navigation for other ships
Other ships can follow LNG ships at a 1 n mile safety distance
Other ships can navigate in front of LNG ships×
Two-way navigation between LNG and other ships××
Two-way navigation between other ships×
Disclaimer/Publisher’s Note: The statements, opinions and data contained in all publications are solely those of the individual author(s) and contributor(s) and not of MDPI and/or the editor(s). MDPI and/or the editor(s) disclaim responsibility for any injury to people or property resulting from any ideas, methods, instructions or products referred to in the content.

