Article

A Comparative Study on the Cam Relationship for the Optimal Vibration and Efficiency of a Kaplan Turbine

1
Guangxi Datengxia Gorge Water Conservancy Development Co., Ltd., Guiping 537226, China
2
Department of Energy and Power Engineering, Tsinghua University, Beijing 100084, China
*
Author to whom correspondence should be addressed.
J. Mar. Sci. Eng. 2024, 12(2), 241; https://doi.org/10.3390/jmse12020241
Submission received: 25 November 2023 / Revised: 5 January 2024 / Accepted: 12 January 2024 / Published: 30 January 2024
(This article belongs to the Special Issue Advancement in the Multiphase Flow in Fluid Machinery)

Abstract

:
Kaplan turbines are generally used in working conditions with a high flow and low head. These are a type of axial-flow hydro turbine that can adjust the opening of the guide vanes and blades simultaneously in order to achieve higher efficiency under a wider range of loads. Different combinations of the opening of the guide vanes and blades (cam relationship) will lead to changes in the efficiency of the turbine unit as well as its vibration characteristics. A bad cam relationship will cause the low efficiency or unstable operation of the turbine. In this study, the relative efficiency and vibration of a large-scale Kaplan turbine with 200 MW output were tested with different guide vane and blade openings. The selection of the cam relationship curve for both optimal efficiency and optimal vibration is discussed. Compared with the cam relationship given by the model test, the prototype cam relationship improves the efficiency and reduces the vibration level. Compared to the optimal efficiency cam relationship, the optimal vibration cam relationship reduces the efficiency of the machine by 1% to 2%, while with the optimal efficiency cam relationship, the vibration of the unit increases significantly. This research provides guidance for the optimization of the regulation of a large adjustable-blade Kaplan turbine unit and improves the overall economic benefits and safety performance of the Kaplan turbine power station.

1. Introduction

The Kaplan turbine is a type of axial-flow hydraulic turbine that has adjustable runner blades and guide vanes. It was invented by the Austrian professor Viktor Kaplan in 1913 [1]. Compared to the Francis turbine, the Kaplan turbine can operate with a lower head, which is not possible with Francis turbines. The head of a Kaplan turbine ranges from 10 to 70 m, and the output ranges from 5 to 200 MW. The diameter of the runner is between 2 and 11 m. Generally, Kaplan turbines have larger discharge and lower rotation speeds than Francis turbines [2]. One of the most significant advantages of the Kaplan turbine is its dual-regulation characteristic, which allows it to fit a greater range of heads. With adjustable blades, it is able to adjust the inlet angle to maintain a relatively high efficiency with different discharges. Kaplan turbines are now widely used throughout the world in high-discharge, low-head hydropower plants.
Vibration is one of the main threats to the safe and stable operation of hydropower units and endangers the life of the units. The vibration of a hydropower unit is affected by the coupling of hydraulic, mechanical, and electromagnetic excitations during operation. The rotor–stator interaction (RSI) is one of the most typical hydraulic excitations among hydro-turbines and is caused by the uneven distribution of pressure behind the guide vanes [3]. A vortex rope under partial load and overload conditions causes low-frequency vibration and even a power swing [4]. Different types of cavitation that occur in the guide vanes, blade entrance, trailing edge, and tips are also important hydraulic excitations in the Kaplan turbine [5,6]. Unbalanced, misaligned, and loose bearings contribute to mechanical excitation, often with the frequencies of the harmonics of the rotation frequency [7]. An unbalanced magnetic pull, rotor bar defects, and so on induce electromagnetic excitations in the machine [8]. Due to the above excitation effects, vibration problems in the unit are inevitable. The RSI is widely propagated to the whole flow domain, which is often detected by the pressure sensor located in the headcover and vaneless region. The induced vibration of the shaft can be detected by vibration sensors mounted on the bearings [9]. The entrance cavitation imposes high-frequency excitation on the runner, which can be detected by acoustic emission sensors installed on the shaft [10]. The low-frequency oscillation of the shaft caused by the vortex rope can be detected by proximity probes. In recent years, new electric power systems have paid more attention to the vibration of the power supply. Therefore, the operational safety of hydraulic machinery is more important than unit efficiency. To maintain the balance of the power grid, hydropower stations usually undertake the task of peak shaving and valley filling, and the units may operate within a wide range of loads. The operational safety of hydropower units will face huge challenges without accurate guidance in the operating area. Based on this, the industry has put forward requirements for dividing the operating area of hydropower units and applying anti-vibration measures. Some universities and scientific research institutions have conducted research on the theory of operational area division. Wang Zhengwei et al. [11] proposed a method based on an indefinite field and dynamic stress response analysis to divide the turbine operating areas of Wanjiazhai Hydropower Station and Shuikou Hydropower Station. Guoqing Chen et al. [12] proposed a method utilizing wavelet analysis and the gray moments of vibration signals to establish the turbine’s vibration area. Yulin Fan et al. [13], based on the short-time Fourier transform, identified the vortex belt load area in the division of the turbine operating area. Many researchers have shown interest in studying the vibration of hydropower units under extreme working conditions, such as a small load and overload. For instance, Philipp Conrad et al. [14] conducted model tests and comparative studies using computational fluid dynamics to predict the shape and size of internal vortexes in the runner blades within a small load area. Valero et al. [5], based on real machine tests, examined the relationship between vibration signals in the overload area and factors like the water head, sensor position, and operating point.
The aforementioned articles related to operating area division have primarily focused on improving the method of data feature extraction. However, in terms of data sources, the main basis has been unit stability tests, which are among the conventional methods of operating area division. Due to limitations in time and space, variable-load tests can only be conducted with a limited number of water heads and load conditions. Consequently, it becomes challenging to cover all operating water heads in the final divided operating area, resulting in relatively rough division results.
The efficiency of the Kaplan turbine varies with different combinations of the guide vane opening (GVO) and the blade opening (BO). Each GVO has a corresponding highest efficiency point, forming a cam relationship that represents the optimal GVO-BO combination [15]. However, the cam relationship is typically generated through model tests of the turbine runner, which may differ from the efficiency characteristics of the prototype due to scaling effects [15]. The Kaplan turbine has a radial flow in the guide vanes and an axial flow in the runner. Because of the dual-regulation characteristic, the flow in the machine varies among different operating conditions [16]. The hydraulic excitation caused by the flow can lead to stress concentration and potential damage to the components of the machine [17]. The lowest level of hydraulic excitation occurs at each blade opening, and the condition with the lowest vibration level is usually close to the best efficiency point but with different operating parameters. Generally, the cam coordinates are found through efficiency tests by means of numerical simulations, model tests, or field tests. RG Iovănel, AS Dehkharqani, et al. conducted a numerical simulation on a Kaplan turbine model and validated the calculation result by performing a model test [18]. Jingming Zhou conducted efficiency simulations on the Datengxia Kaplan turbine and proposed cam coordinates based on the numerical simulation results [19]. Yali Zhang simulated cavitation occurring at the blade tip of a Kaplan turbine and analyzed its effects [20]. R.Ž. Jovanović, I.O. Božić applied artificial neural networks to the prediction of the off-cam operating conditions of Kaplan turbine units [21].
Traditionally, there are two dimensions in a characteristic hill chart of a hydraulic turbine. The efficiency is influenced by both nED and QED, which are determined by the head (H) and discharge (Q), respectively. The discharge of a hydraulic turbine is controlled by the angle of the guide vanes. Therefore, for each value of head, there is a certain guide vane opening (α) that corresponds to the highest efficiency. Because of the special design of the Kaplan turbine, there is another dimension, blade opening (β), that influences its efficiency. The adjustable blades make the evaluation of the efficiency of Kaplan turbines more complicated. For a given head, different combinations of the guide vane opening and blade opening have different efficiencies. Therefore, coordinate curves are used to describe the relationship between the guide vane opening and blade opening with different heads [22,23,24]. Each Kaplan turbine has to undergo a cam relationship test during the model test in order to obtain its best efficiency. However, the efficiency performance is only one of the characteristics of hydraulic turbine units. Nowadays, more attention is being paid to the stability performance of hydraulic turbine units, which is of paramount importance to the operational safety of and economic benefit for hydropower plants. Many accidents have been reported to be related to the excessive vibration and pressure pulsation of turbine units [25,26,27]. The severity of vibration and pressure pulsation varies with different operating conditions. Carme Valero et al. analyzed the influence of operating conditions on the vibration performance of a pump-turbine unit. The results show that both the head and guide vane openings have a great influence on the vibration of the machine [8]. Li Zhenggui performed an in-depth study on the combination relationship and performance of bulb tubular turbines and revealed the mechanism of the guide vanes and blades on the inner flow of bulb tubular turbines [28]. H. Isaksson researched the uncertainty of the cam curve of Kaplan turbines [29]. A. Gajic, B. Ignjatovic, et al. analyzed the cam relation by means of efficiency calculations and bearing vibration measurements [30]. However, the coordinate curve of Kaplan turbine units has not been researched as much, let alone the coordinate curve of a prototype unit. To summarize, the basic method for finding the optimal GVO-BO combination is numerical simulation or model or field tests based on the efficiency of the machine. In this research, the efficiency and vibration coordinate curves of a prototype Kaplan turbine unit were researched. A coordinate test was conducted on the prototype turbine unit in order to obtain both the best efficiency points and best vibration performance points for different heads. The efficiency coordinate curves and vibration coordinate curves were calculated and compared. As a result, this article proposes a synergy curve strategy for the axial-flow turbine: the optimal efficiency synergy relationship should be used when the vibration does not exceed the standard, and the optimal stability synergy relationship should be used under unstable conditions. This research provides guidance for the operation and scheduling of the axial-flow rotary-propeller turbine unit and improves the overall economic benefits and safety performance of the power station.
In this study, index tests and vibration tests were performed on the largest Kaplan turbine unit, with a power output of 200 MW. The efficiency and vibration characteristics were examined under various operating conditions. Two different criteria were used to select the efficiency cam relationship and vibration cam relationship. A comparison was made between the machine’s performance using these two cam relationships.

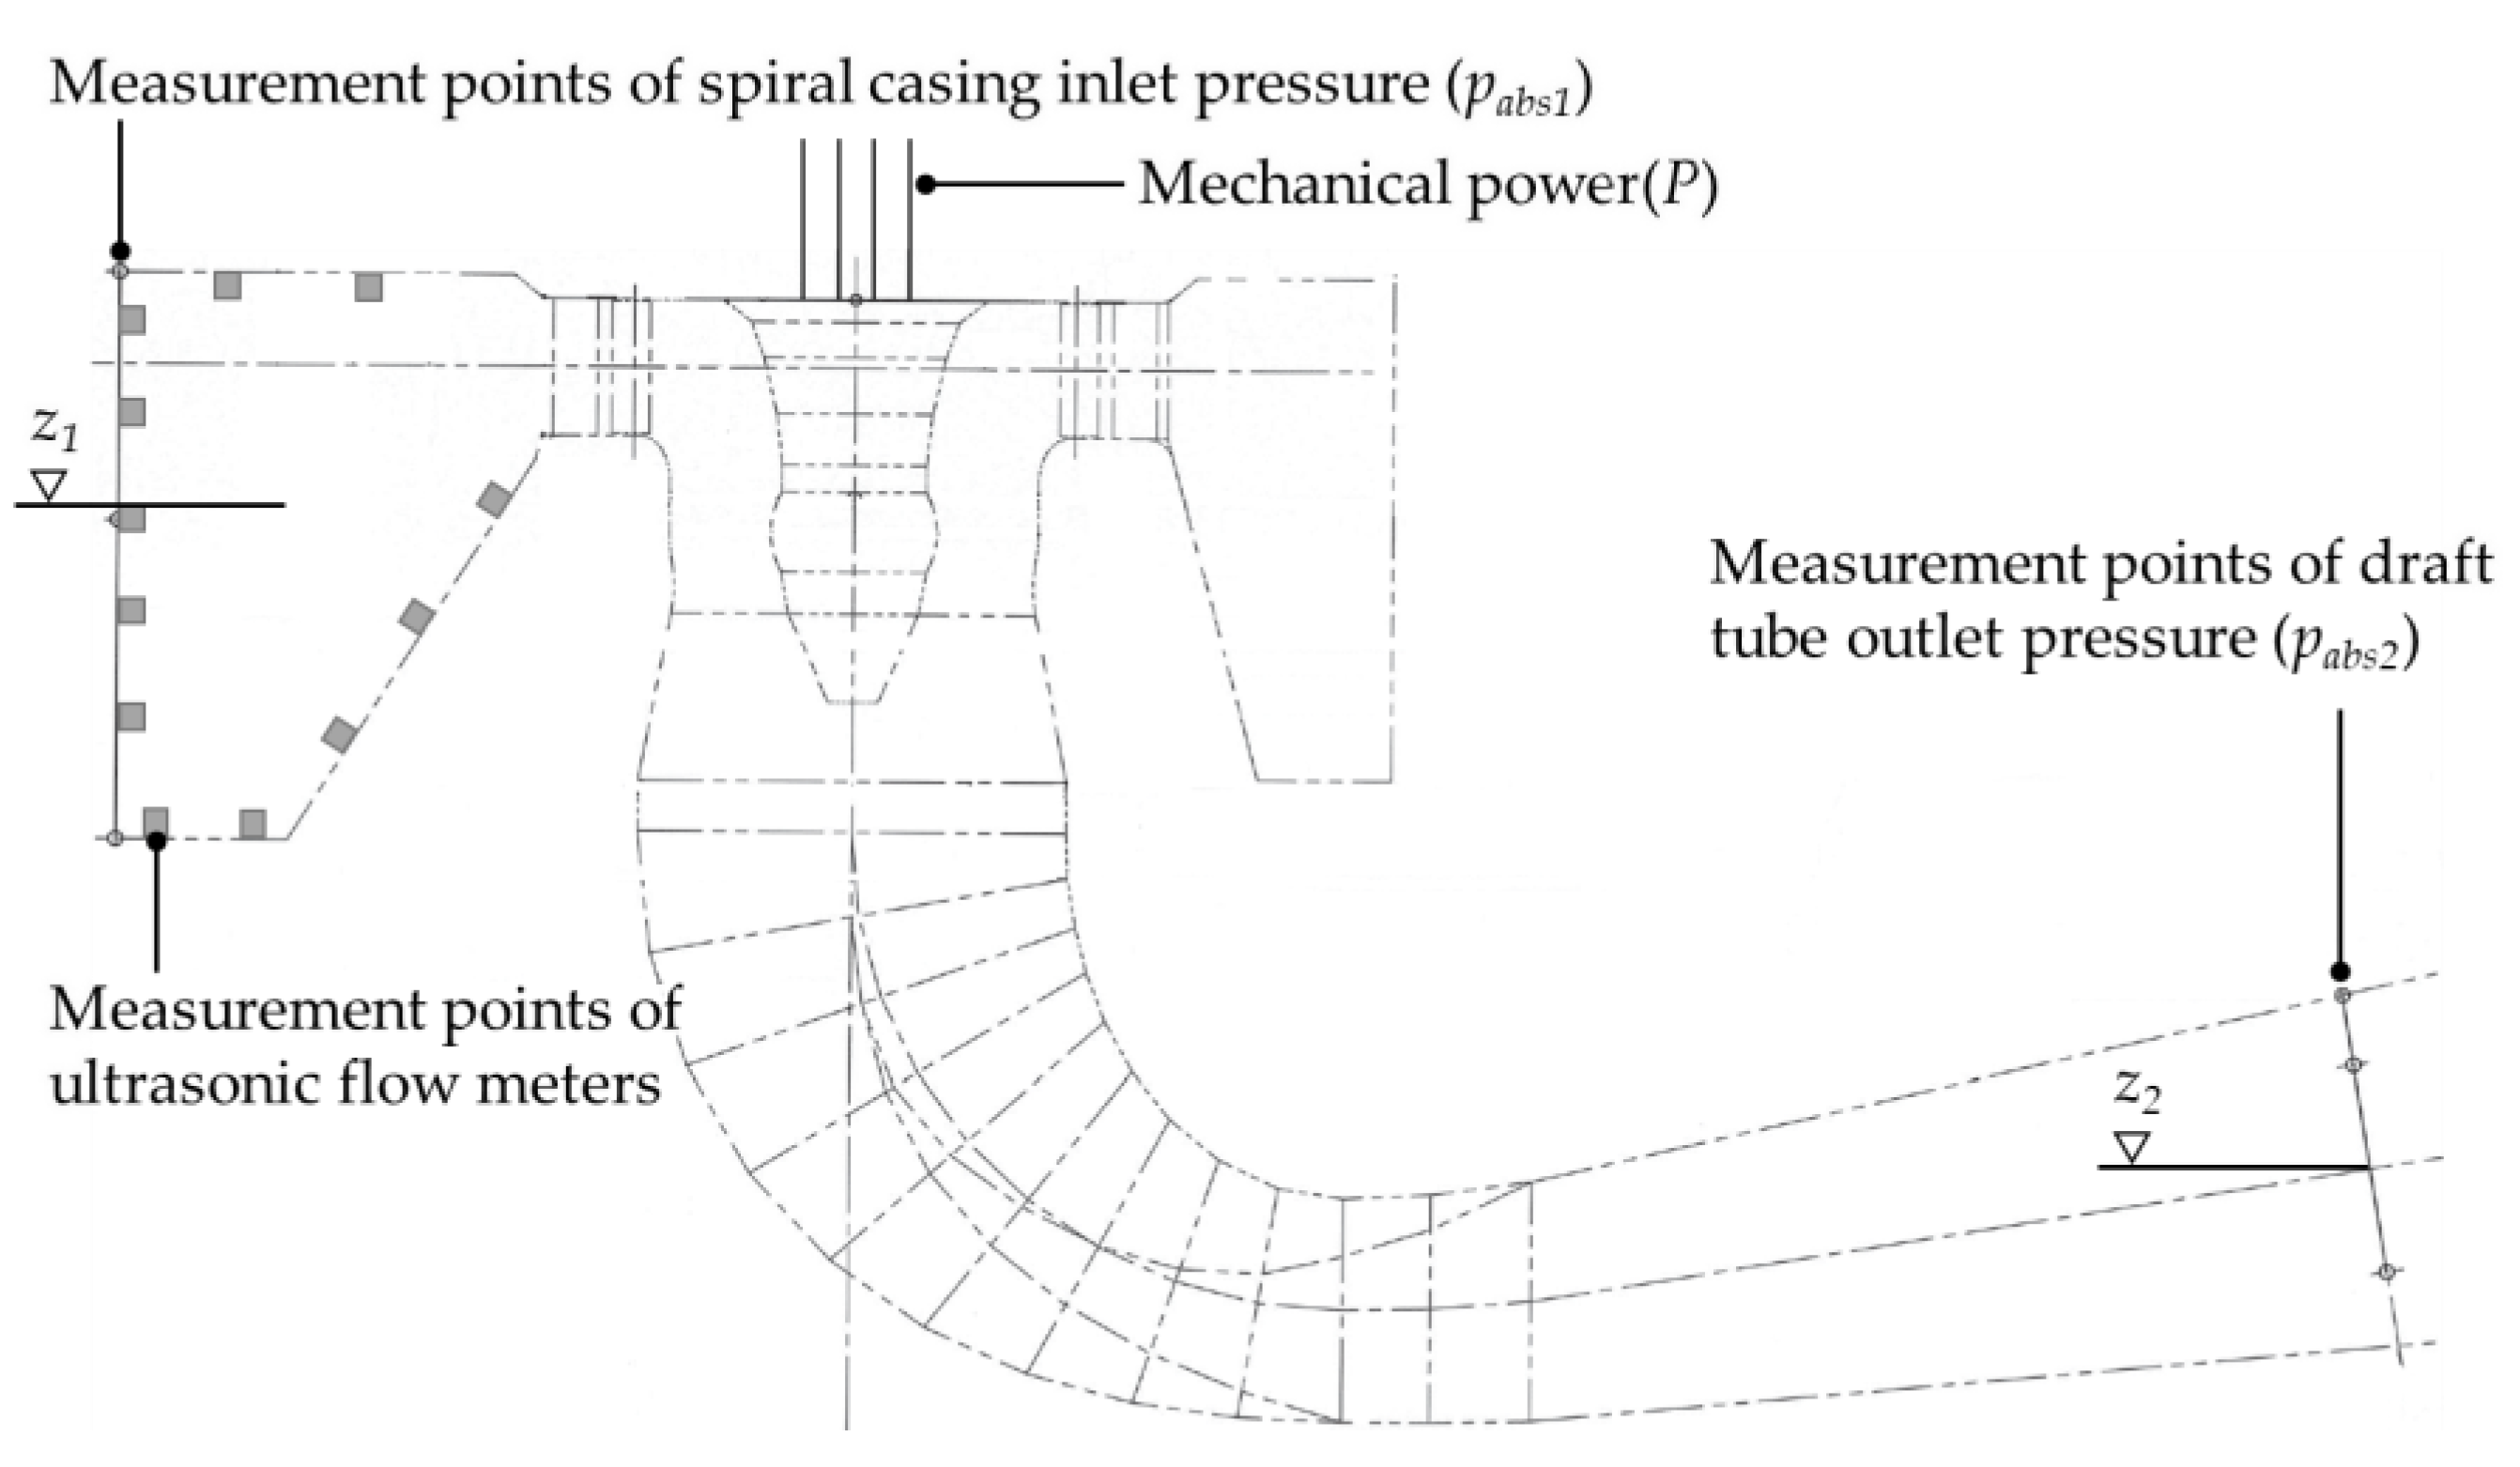
2. Field Test Setup and Calculation Methodology

The researched unit is a large-capacity adjustable-blade Kaplan turbine with a rated output of 200 MW. The diameter of the runner is 10.42 m. Each runner consists of 6 adjustable blades. The head of the machine ranges from 12.91 m to 37.79 m, and the rated discharge is 890.34 m3/s. The other parameters are listed in Table 1.

Index Text Setup and Data Processing

An index test was performed on the researched machine by measuring the energy parameters with different combinations of GVOs and BOs. As shown in Figure 1, the spiral casing inlet pressure (P1) and draft tube outlet pressure (P2) are measured by two pressure sensors installed on the spiral casing inlet and draft tube outlet, respectively. Twelve ultrasonic flow meters are mounted on the inlet of the spiral casing in order to measure the velocity (V1) of the inlet flow. The output of the turbine is obtained by calculating the generator output (Pg) and its efficiency (ηg). The tests were conducted using various guide vane openings and blade openings, which are marked in Figure 2. In the figure, each color represents a test with the same blade opening. During the tests, the blade opening and guide vane opening were decoupled in order to achieve all the combinations. The tests included 7 BOs, each of which was tested with 4~8 GVOs.
The vibration test was performed at the same time as the coordinate test. Displacement sensors and proximity probes were used in order to obtain the absolute vibration of the bearings and the relative displacement of the shaft. The installed positions of the sensors are shown in Figure 3 and the parameters are listed in Table 2. The vibration parameters were measured with a sampling frequency of 4096 Hz. The peak-to-peak values of the measured displacement were used as indicators of the vibration of the machine.
The main purpose of the cam optimization test is to determine the cam relationship between the blades and guide vanes. With the optimal cam relationship, a Kaplan turbine reaches its highest efficiency. During the cam test, the possible ranges of the blade opening and guide vane opening are set, and the characteristics of the turbine are tested. The relation between the relative efficiency and the output is fitted, and the peak point is selected as the highest efficiency point [31,32]. The efficiency curves are fitted for each blade opening, and thus, the peak points are able to form the envelope curve ηt = f(P). This envelope curve describes the best operating point for a constant head. Based on this envelope curve, the blade opening and guide vane opening points can be extracted, and the cam dependency BO = f(GVO) can be formed. For a machine that operates with a wide range of heads, the cam test needs to be conducted with several heads. Cam dependency relations are determined for each head in order to cover all heads. Cam optimization allows the hydraulic turbine to utilize the hydraulic potential to the greatest extent possible. Operating the turbine according to the cam relationship can achieve the highest efficiency. The main problem for the index test is the discharge measurement. However, the relative efficiency measurement requires relative discharge values, so the absolute discharge measurement is not necessary. The relative discharge can be obtained by using the Winter–Kennedy method, an ultrasonic flowmeter, etc., which are cheaper and easier. The cam relation optimization based on relative discharge measurement is sufficient for guiding the operation of the machine.
The efficiency of the unit is determined by calculating the turbine output using the Bernoulli Equation. Equation (1) represents the calculation formula for the relative efficiency of the hydraulic turbine:
η t = P P h × 100 %
The turbine output P is the mechanical power delivered by the turbine shaft, assigning to the hydraulic machine the mechanical losses of the relevant bearings. Ph is the hydraulic power available for producing power in the turbine:
P h = E ρ Q 1 ± Δ P h
where Δ P h is hydraulic power correction for relative power testing, and ∆Ph = 0. E represents the specific hydraulic energy of the turbine:
E = g ¯ z 1 z 2 + p a b s 1 p a b s 2 ρ + v 1 2 v 2 2 2
where g ¯ represents the value of gravity acceleration at the reference level of the machine. z1 and z2 are the elevations of the spiral casing inlet and draft tube outlet, respectively; pabs1 and pabs2 are the static pressures of the spiral casing inlet and draft tube outlet, respectively, and v1 and v2 are the flow velocities of the spiral casing inlet and draft tube outlet, respectively.
The relative displacement of the shaft Bd is calculated from the peak–peak value:
B d = m a x s i m i n s i
where si is the displacement with a 97.5% confidence interval.
The discharge and output have to be corrected, given that the head keeps changing in a small range. The discharge QP and output NP are corrected according to the following equations:
Q P = H P / H N 0.5 Q N
N P = H P / H N 1.5 N N
where H, N, and Q represent the head, output, and discharge, respectively; subscripts P and N represent prototype and model, respectively.

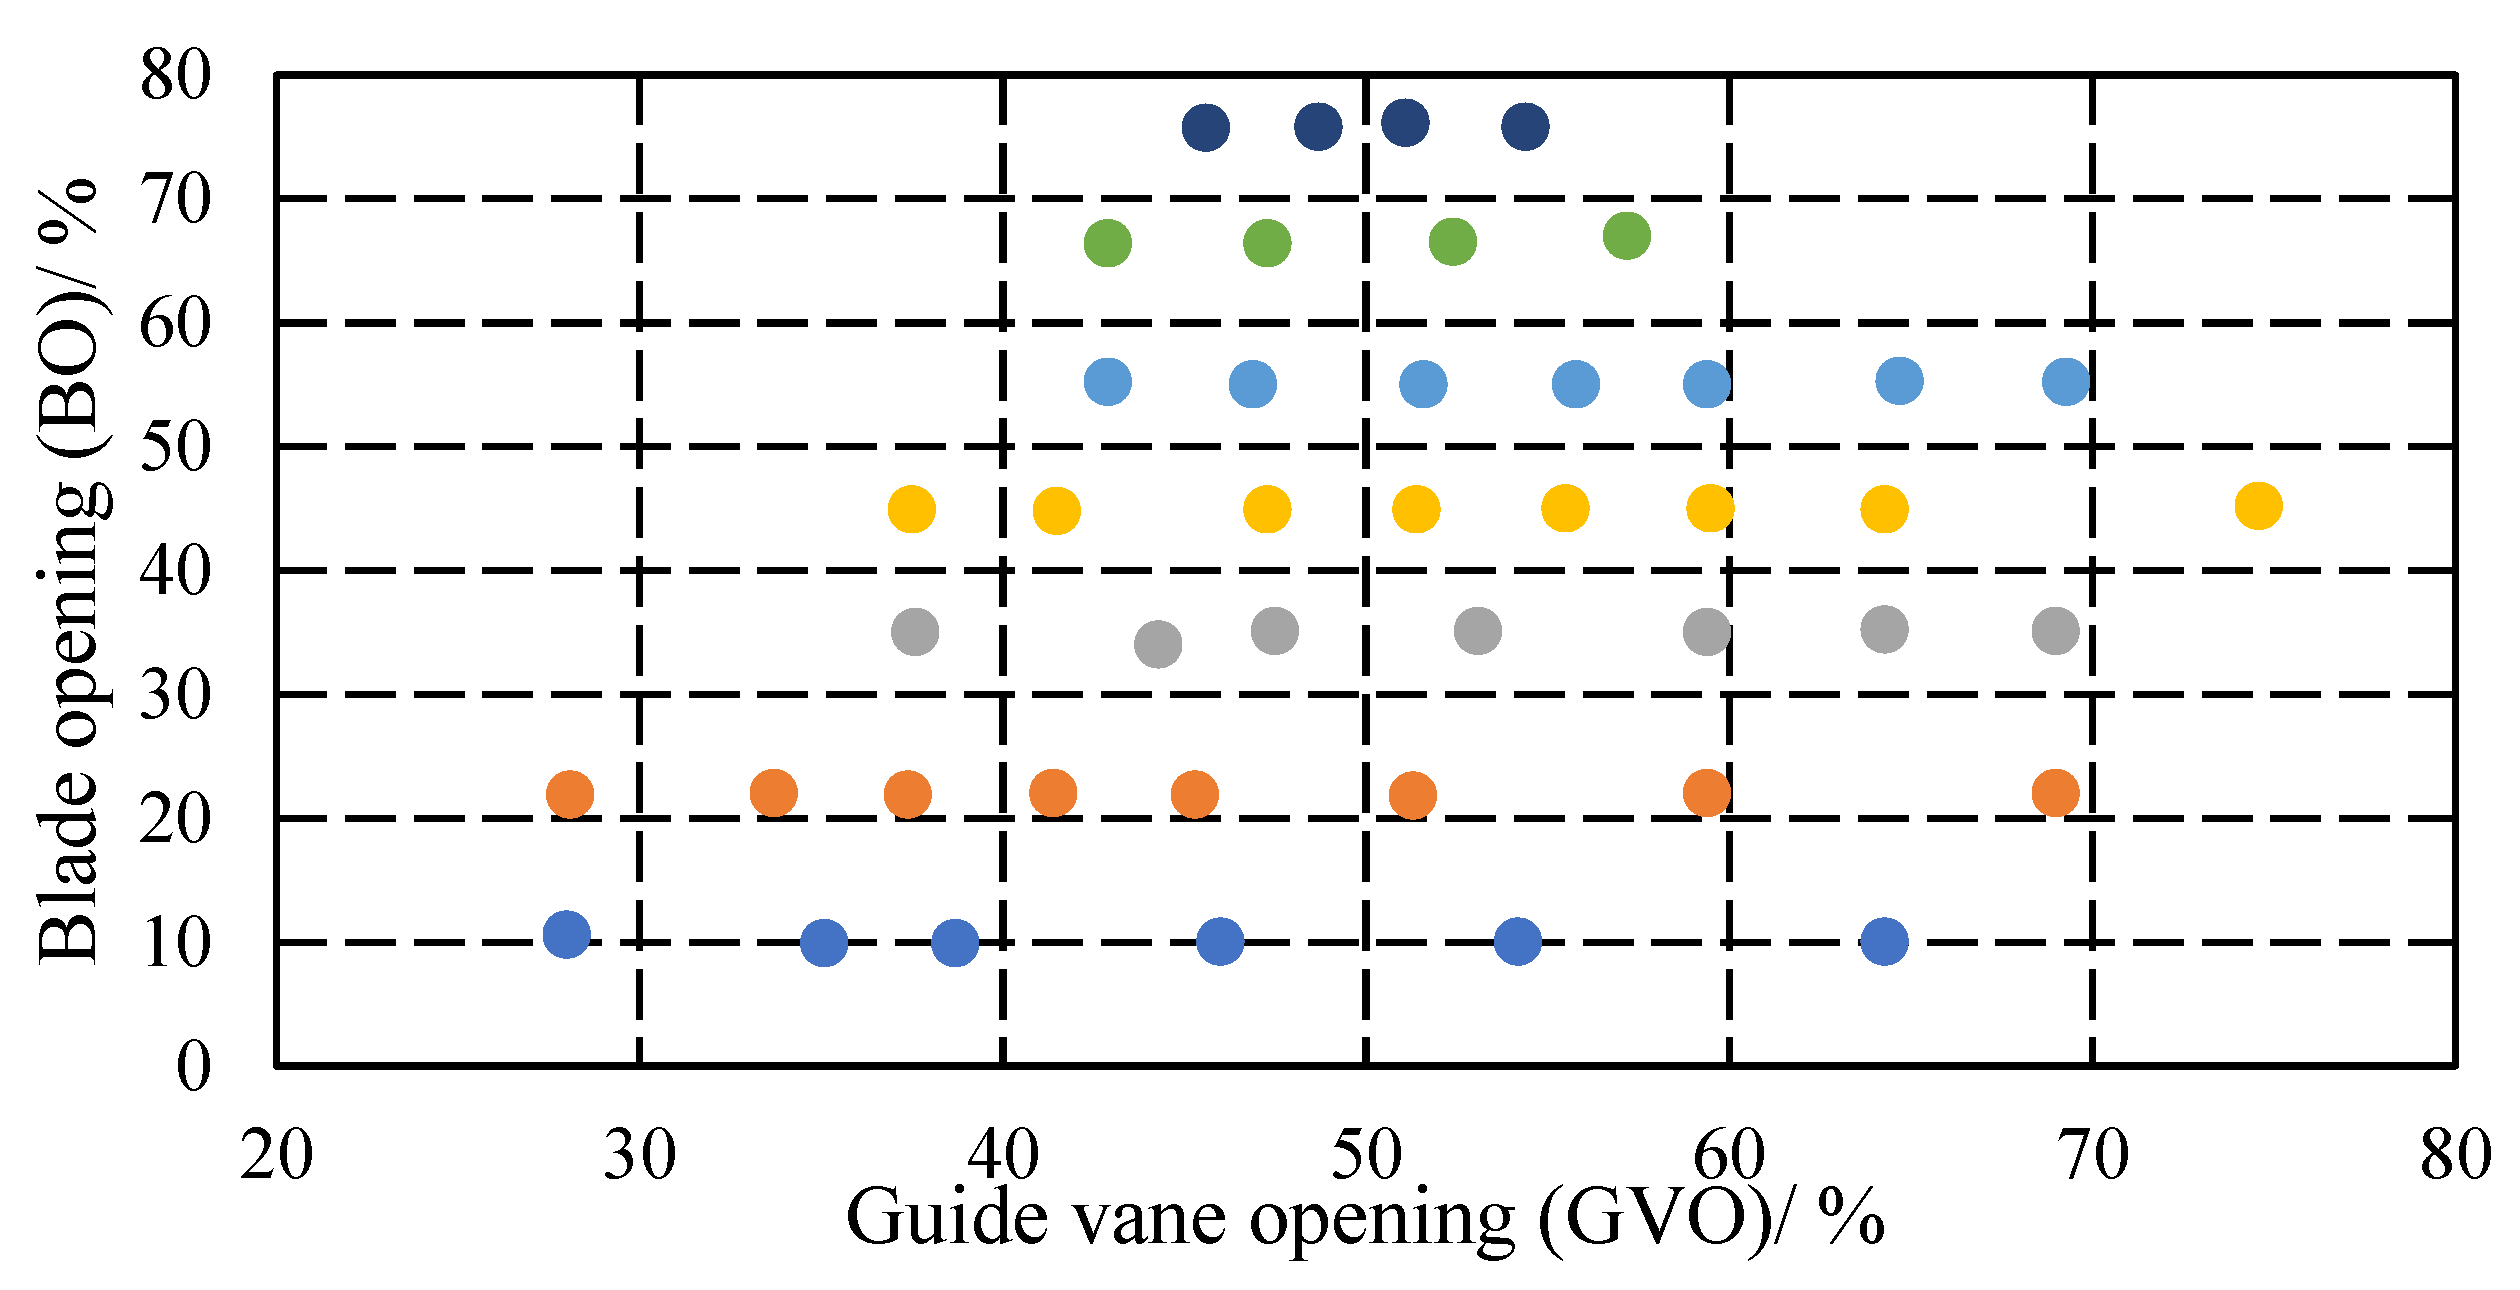
3. Cam Relationship Determination

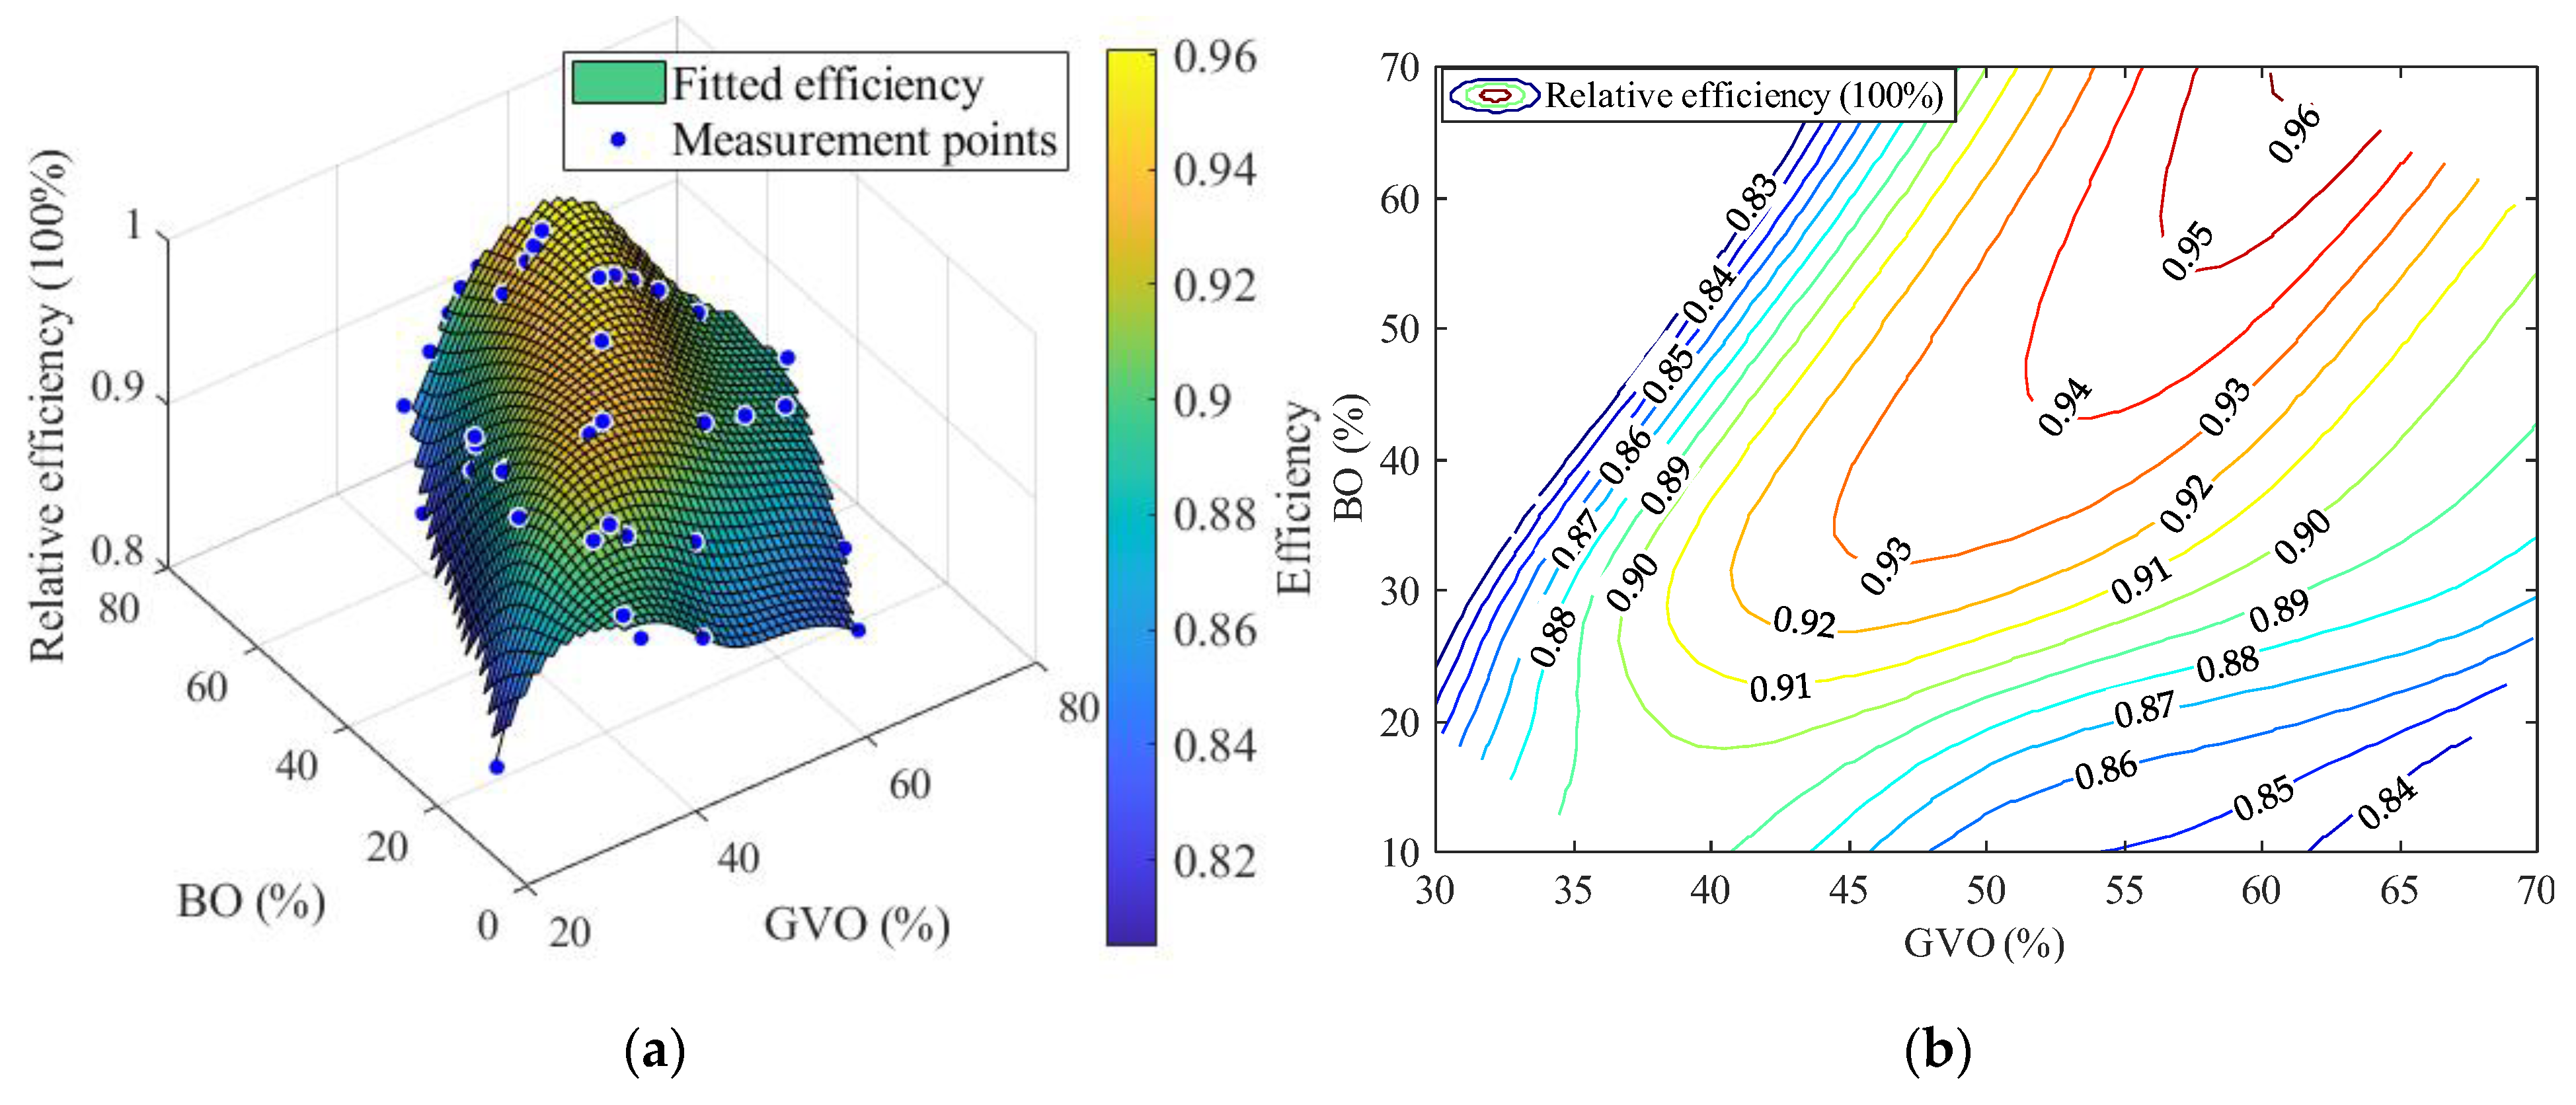
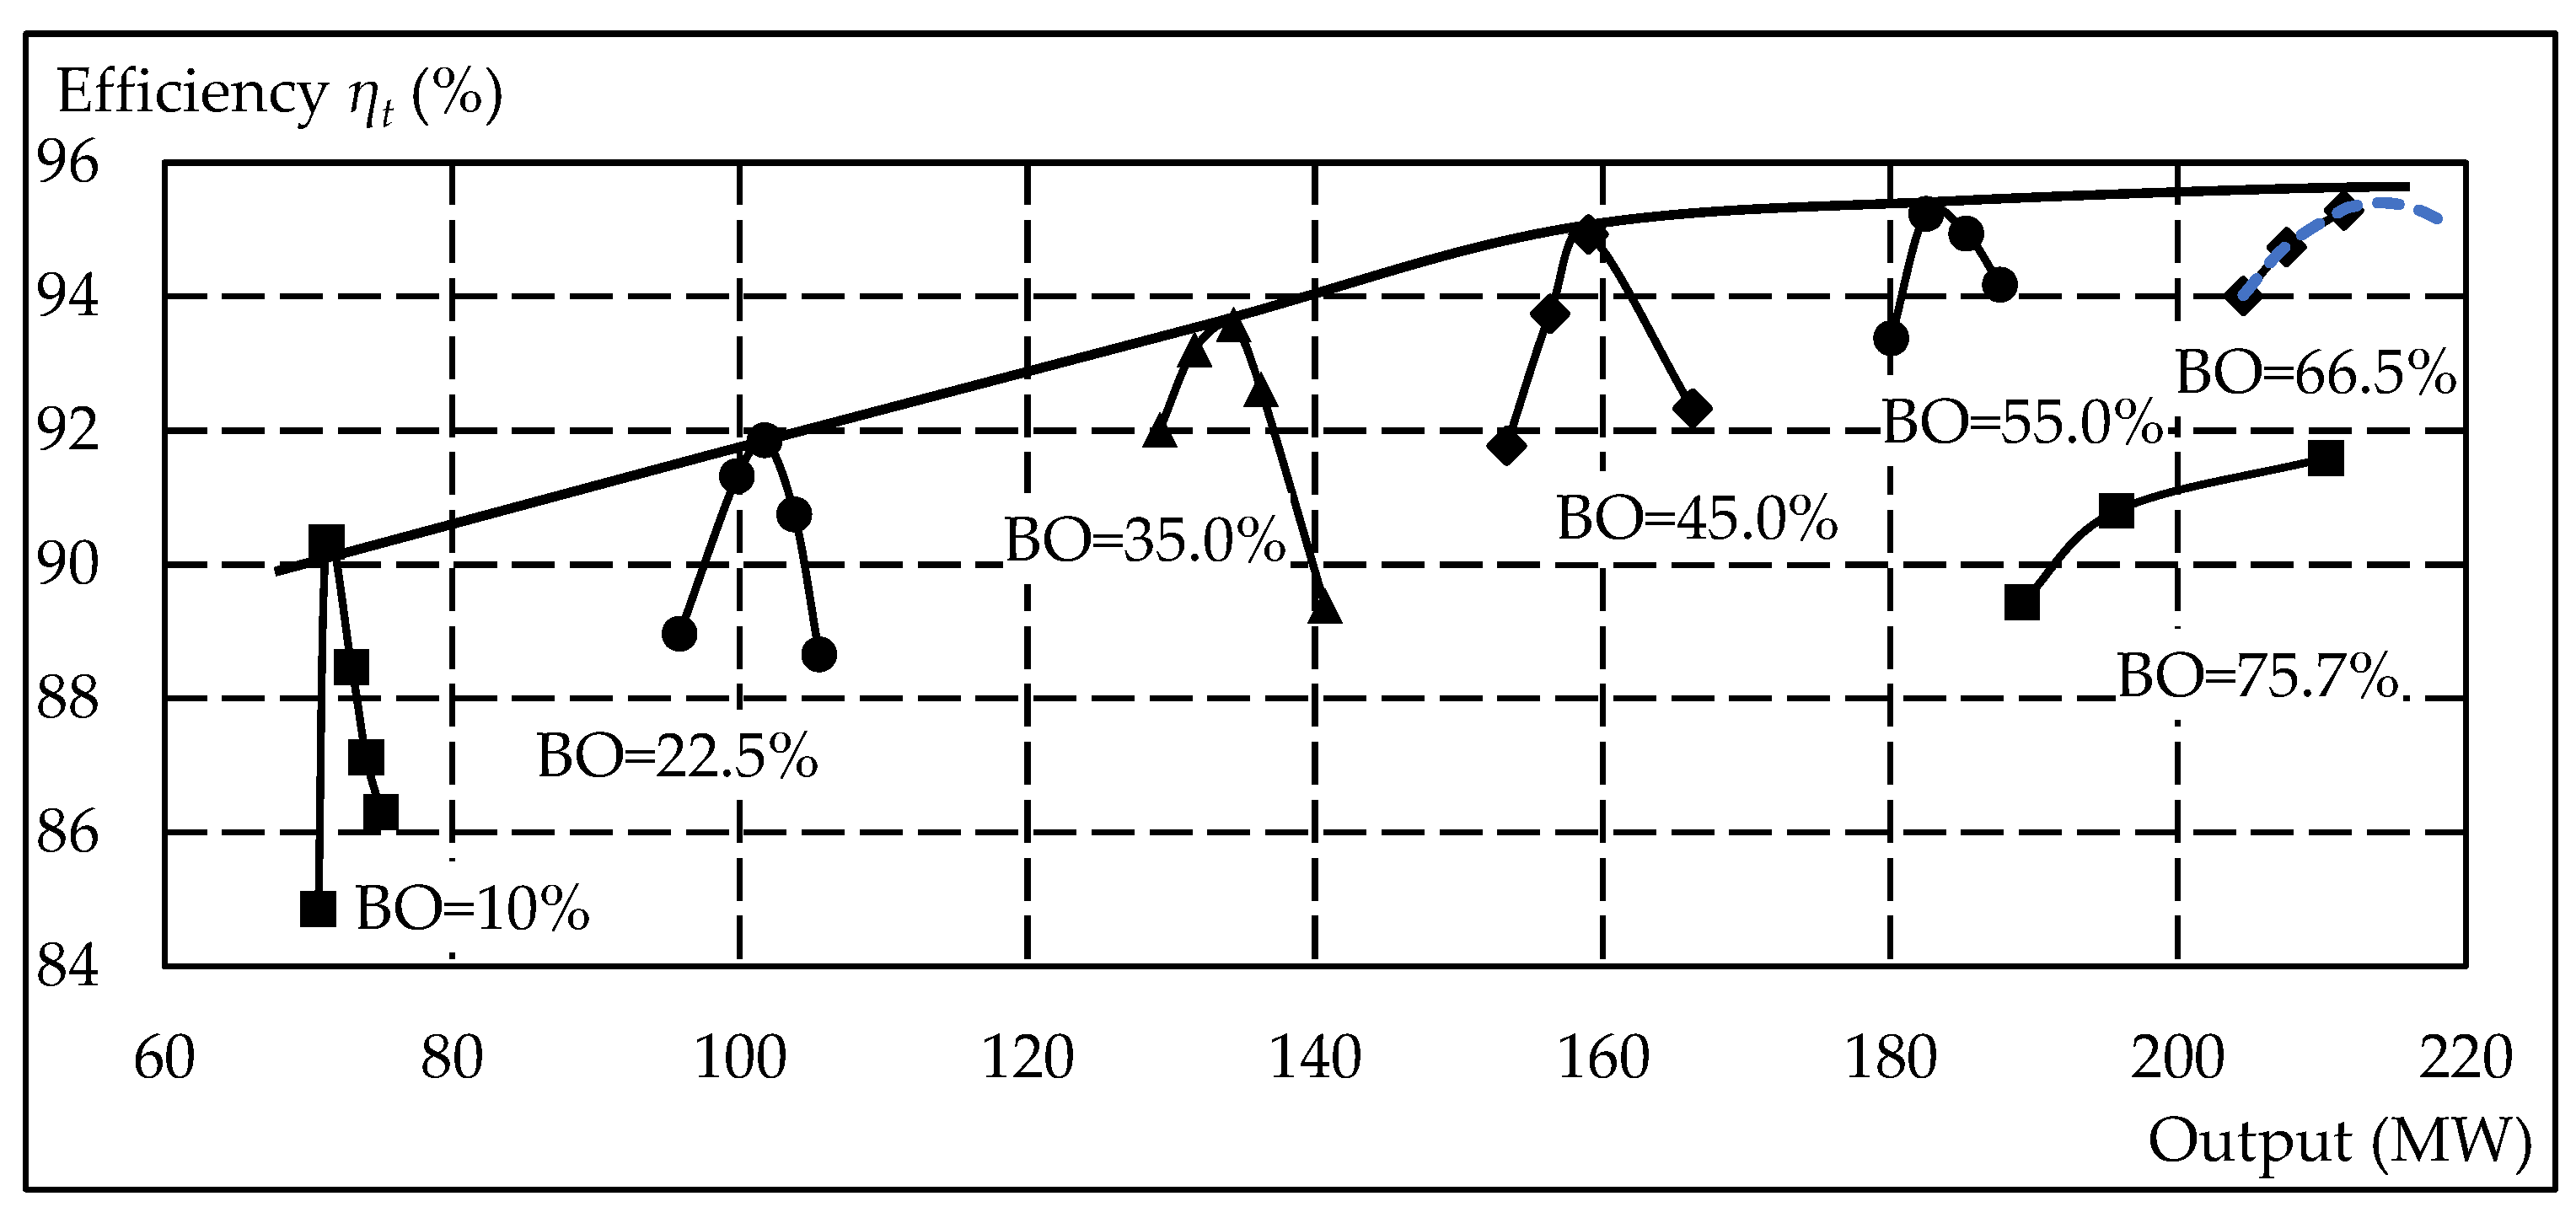
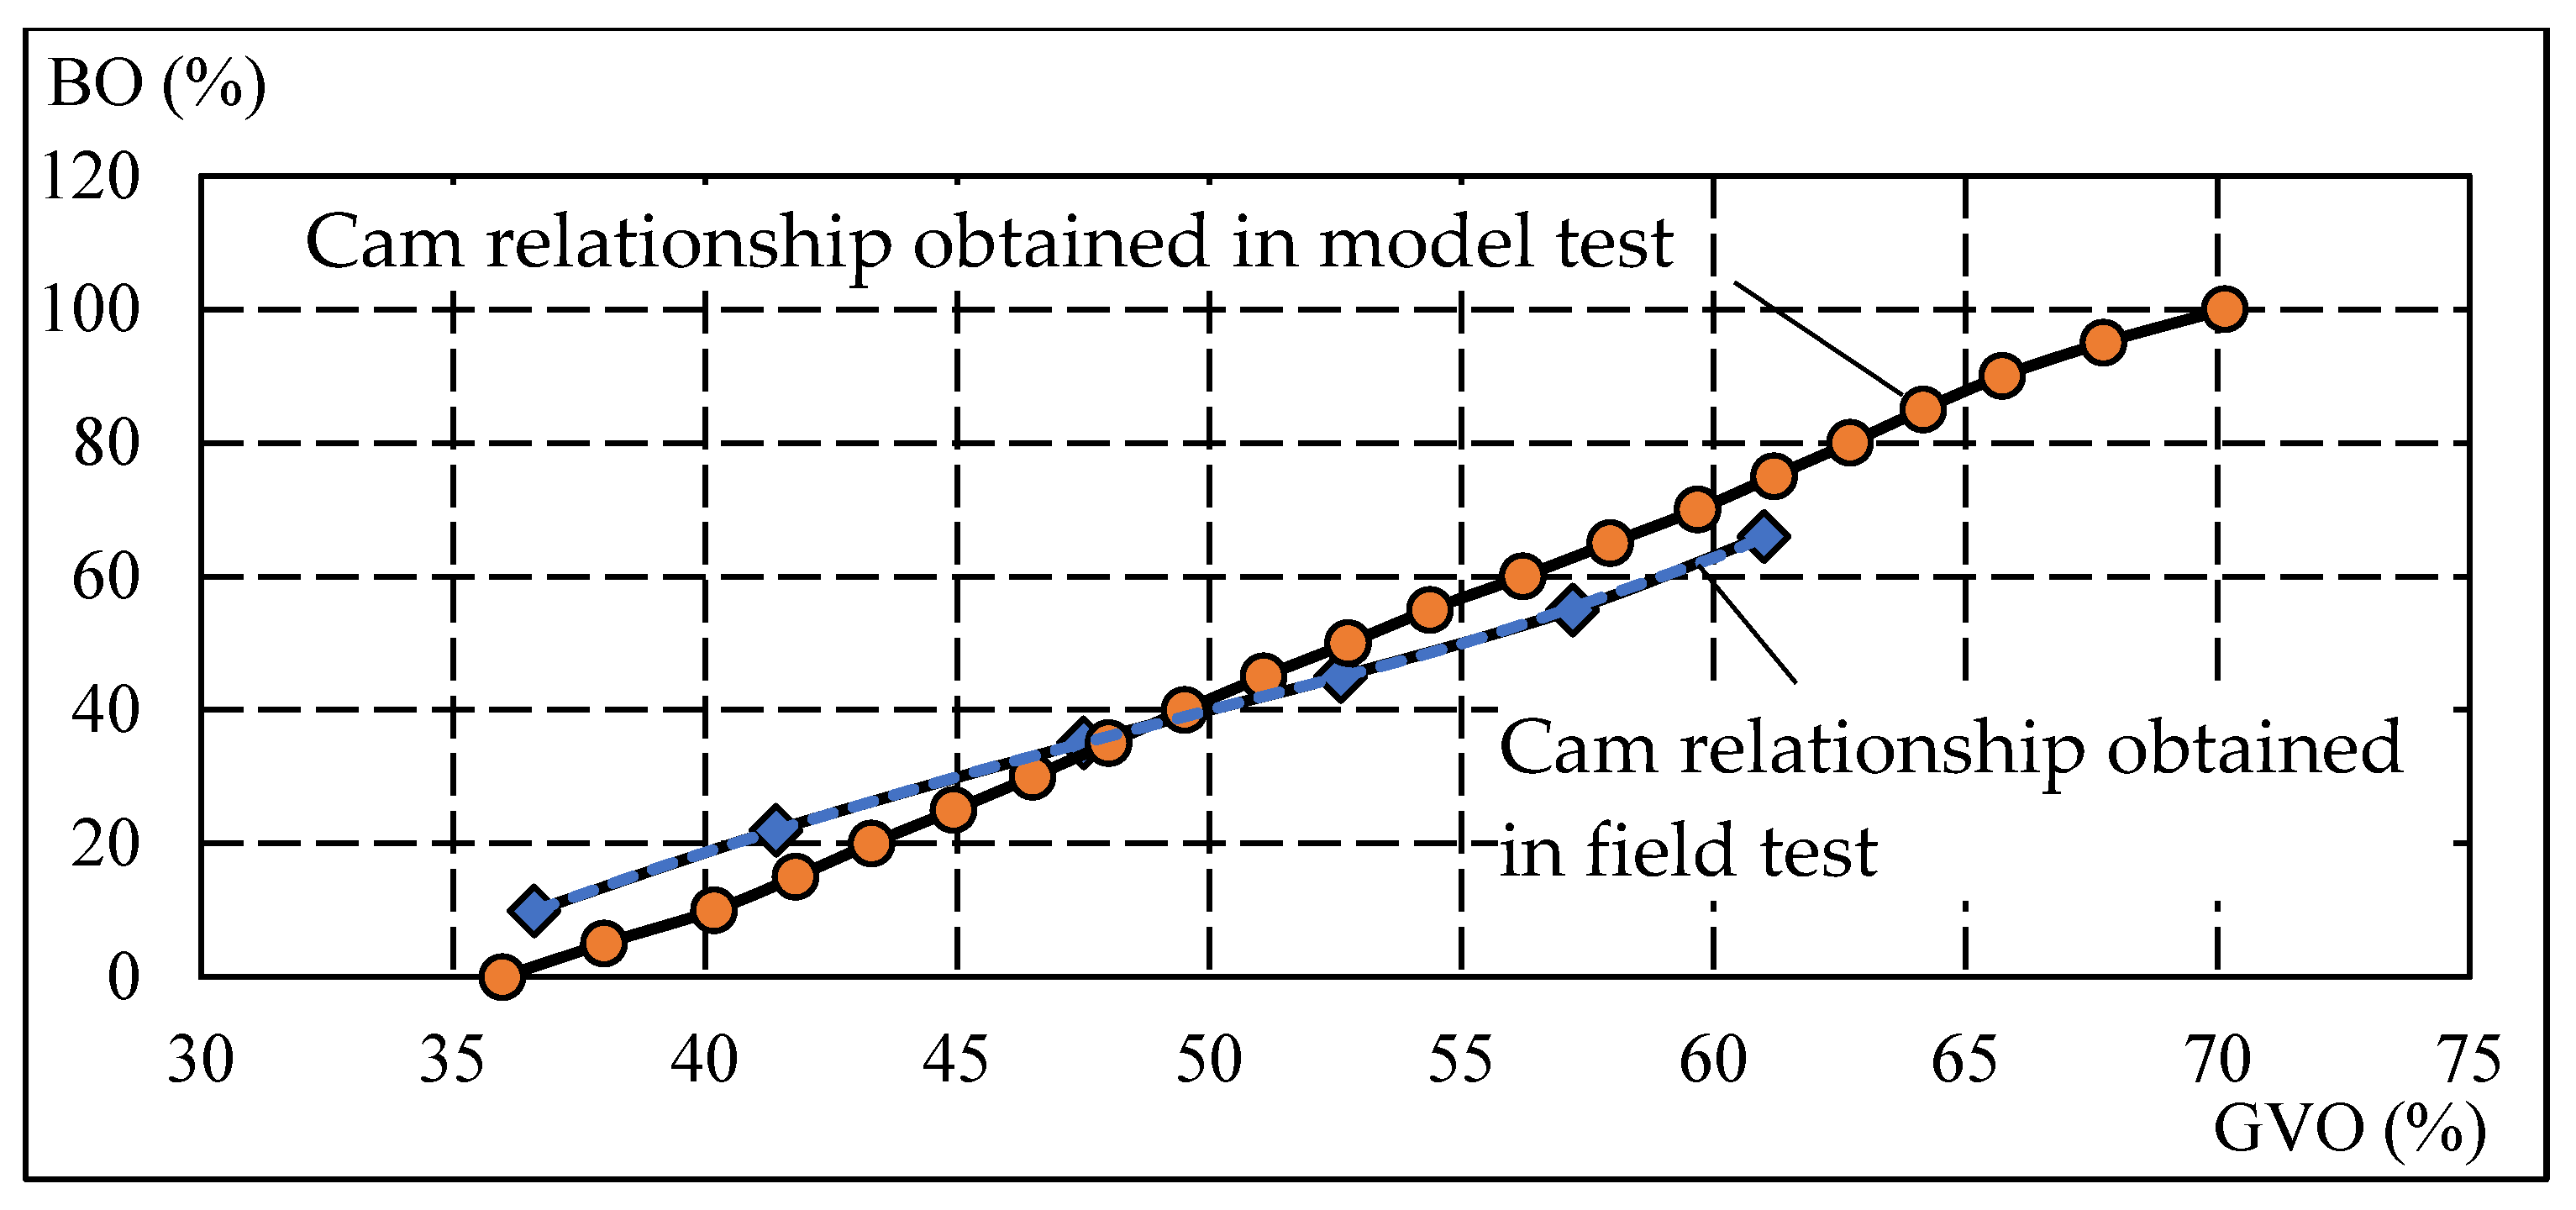
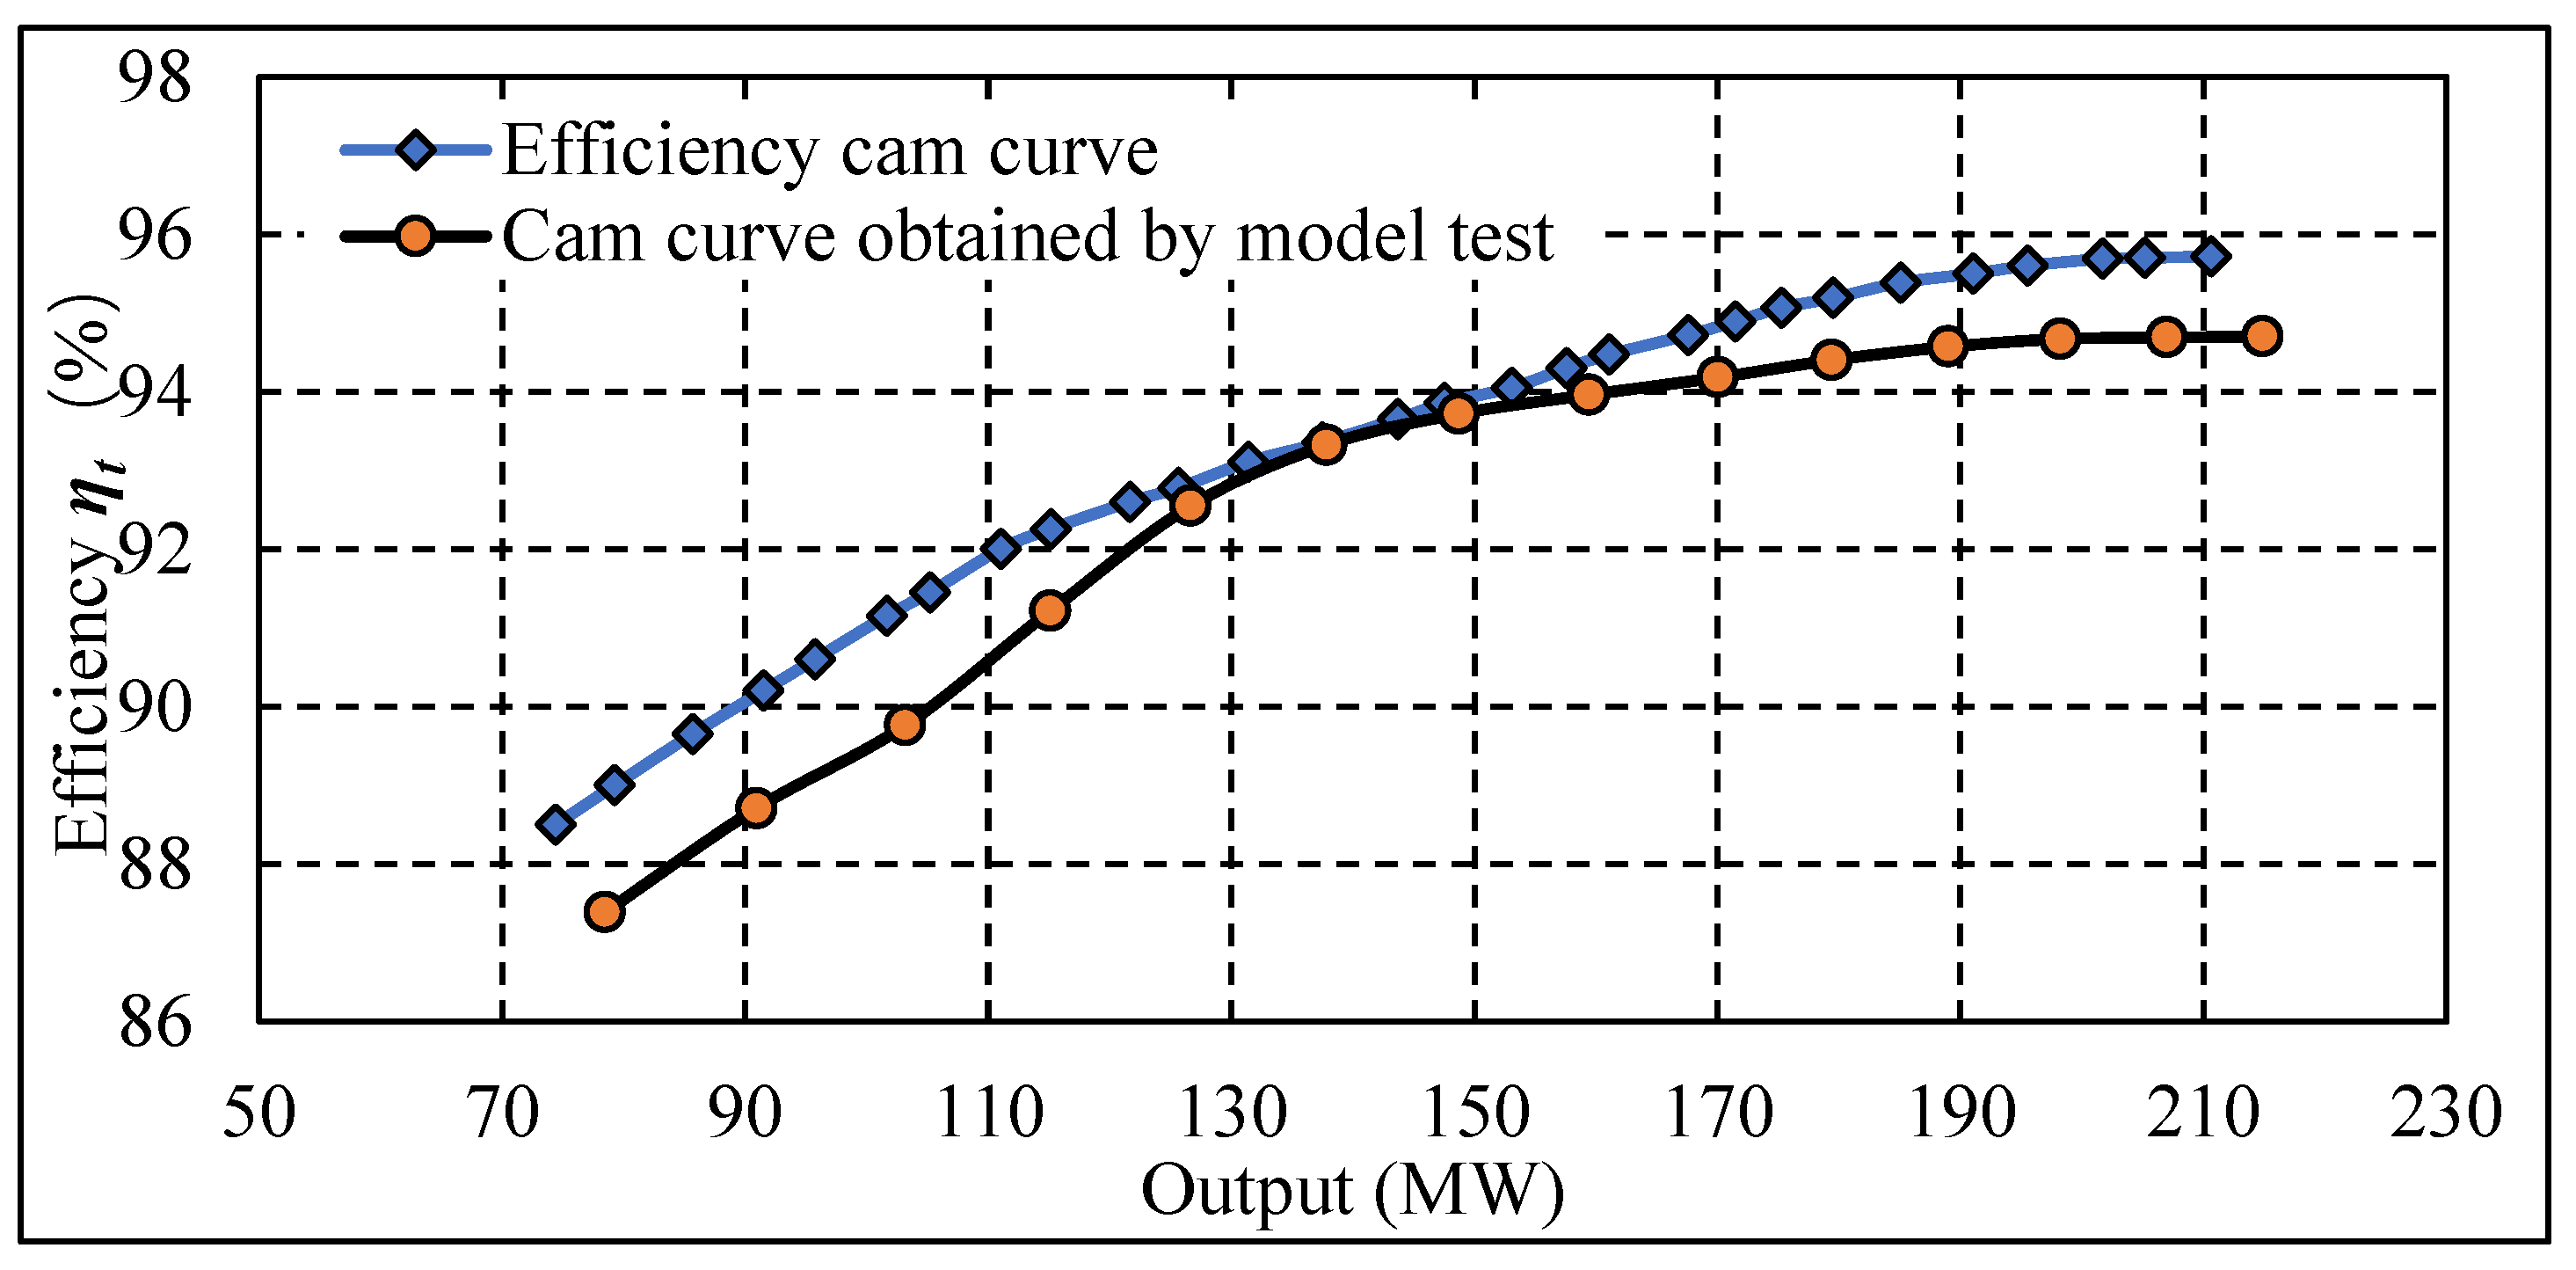
3.1. Efficiency Cam Relationship

The studied Kaplan turbine’s relative efficiency, ηt, was computed for every operating condition. The ηt value versus the GVO and BO, along with the fitted hill chart, is depicted in Figure 4. The diagram reveals that the machine’s best efficiency point (BEP) lies at the hill chart’s peak. The efficiency noticeably diminishes with either an increase or a decrease in the GVO. As the BO deviates from the BEP, there is a minor drop in efficiency, as well. For each BO, the ηt curve following GVO variation takes on a parabolic shape and reaches its maximum. Consequently, the optimal efficiency point can be selected for each blade opening. The apex efficiency point for the corresponding blade opening is the intersection of each isoline with a line parallel to the x-axis. These points determine the cam relationship.
Figure 5 illustrates the output–ηt curve, a conventional method for identifying the cam relationship. It is worth noticing that when the BO = 75.7, the output of the turbine reaches 105% of the rated output before the machine reaches its highest efficiency point. Both procedures yield identical results regarding the relationship between the GVO and BO, as shown in Figure 6. This figure compares the current cam relationship with that derived from field testing. The updated cam relationship reveals a substantial difference: for enhanced efficiency, the GVO should be reduced under low-BO conditions and increased under large-BO conditions.
The newly obtained cam relationship was applied to the prototype machine. During the test, the guide vane opening was adjusted from 35% to 60%, and the blade was adjusted automatically according to the GVO. The efficiency of each operating point is calculated according to Equation (1). The efficiency curve is presented in Figure 6. The new efficiency curve calculated using the efficiency cam relationship is compared with the efficiency of the present cam relationship. In Figure 7, it can be seen that the efficiency with the newly obtained cam relationship is higher than the efficiency with the cam relationship obtained in the model test, especially under low-load and high-load operating conditions. When the unit is operating at 80 MW or 210 MW, the efficiency of the turbine increases by 1%~2%. It should be noted that the efficiency in this research was obtained by calculating the relative efficiency. The absolute efficiency of the Kaplan turbine unit could be lower, but the change rule would remain the same. This result indicates that the dependency relationship of the prototype is different from the dependency relationship of the model. Despite the model test, it is necessary to obtain the cam relationship of the prototype by means of a field test.

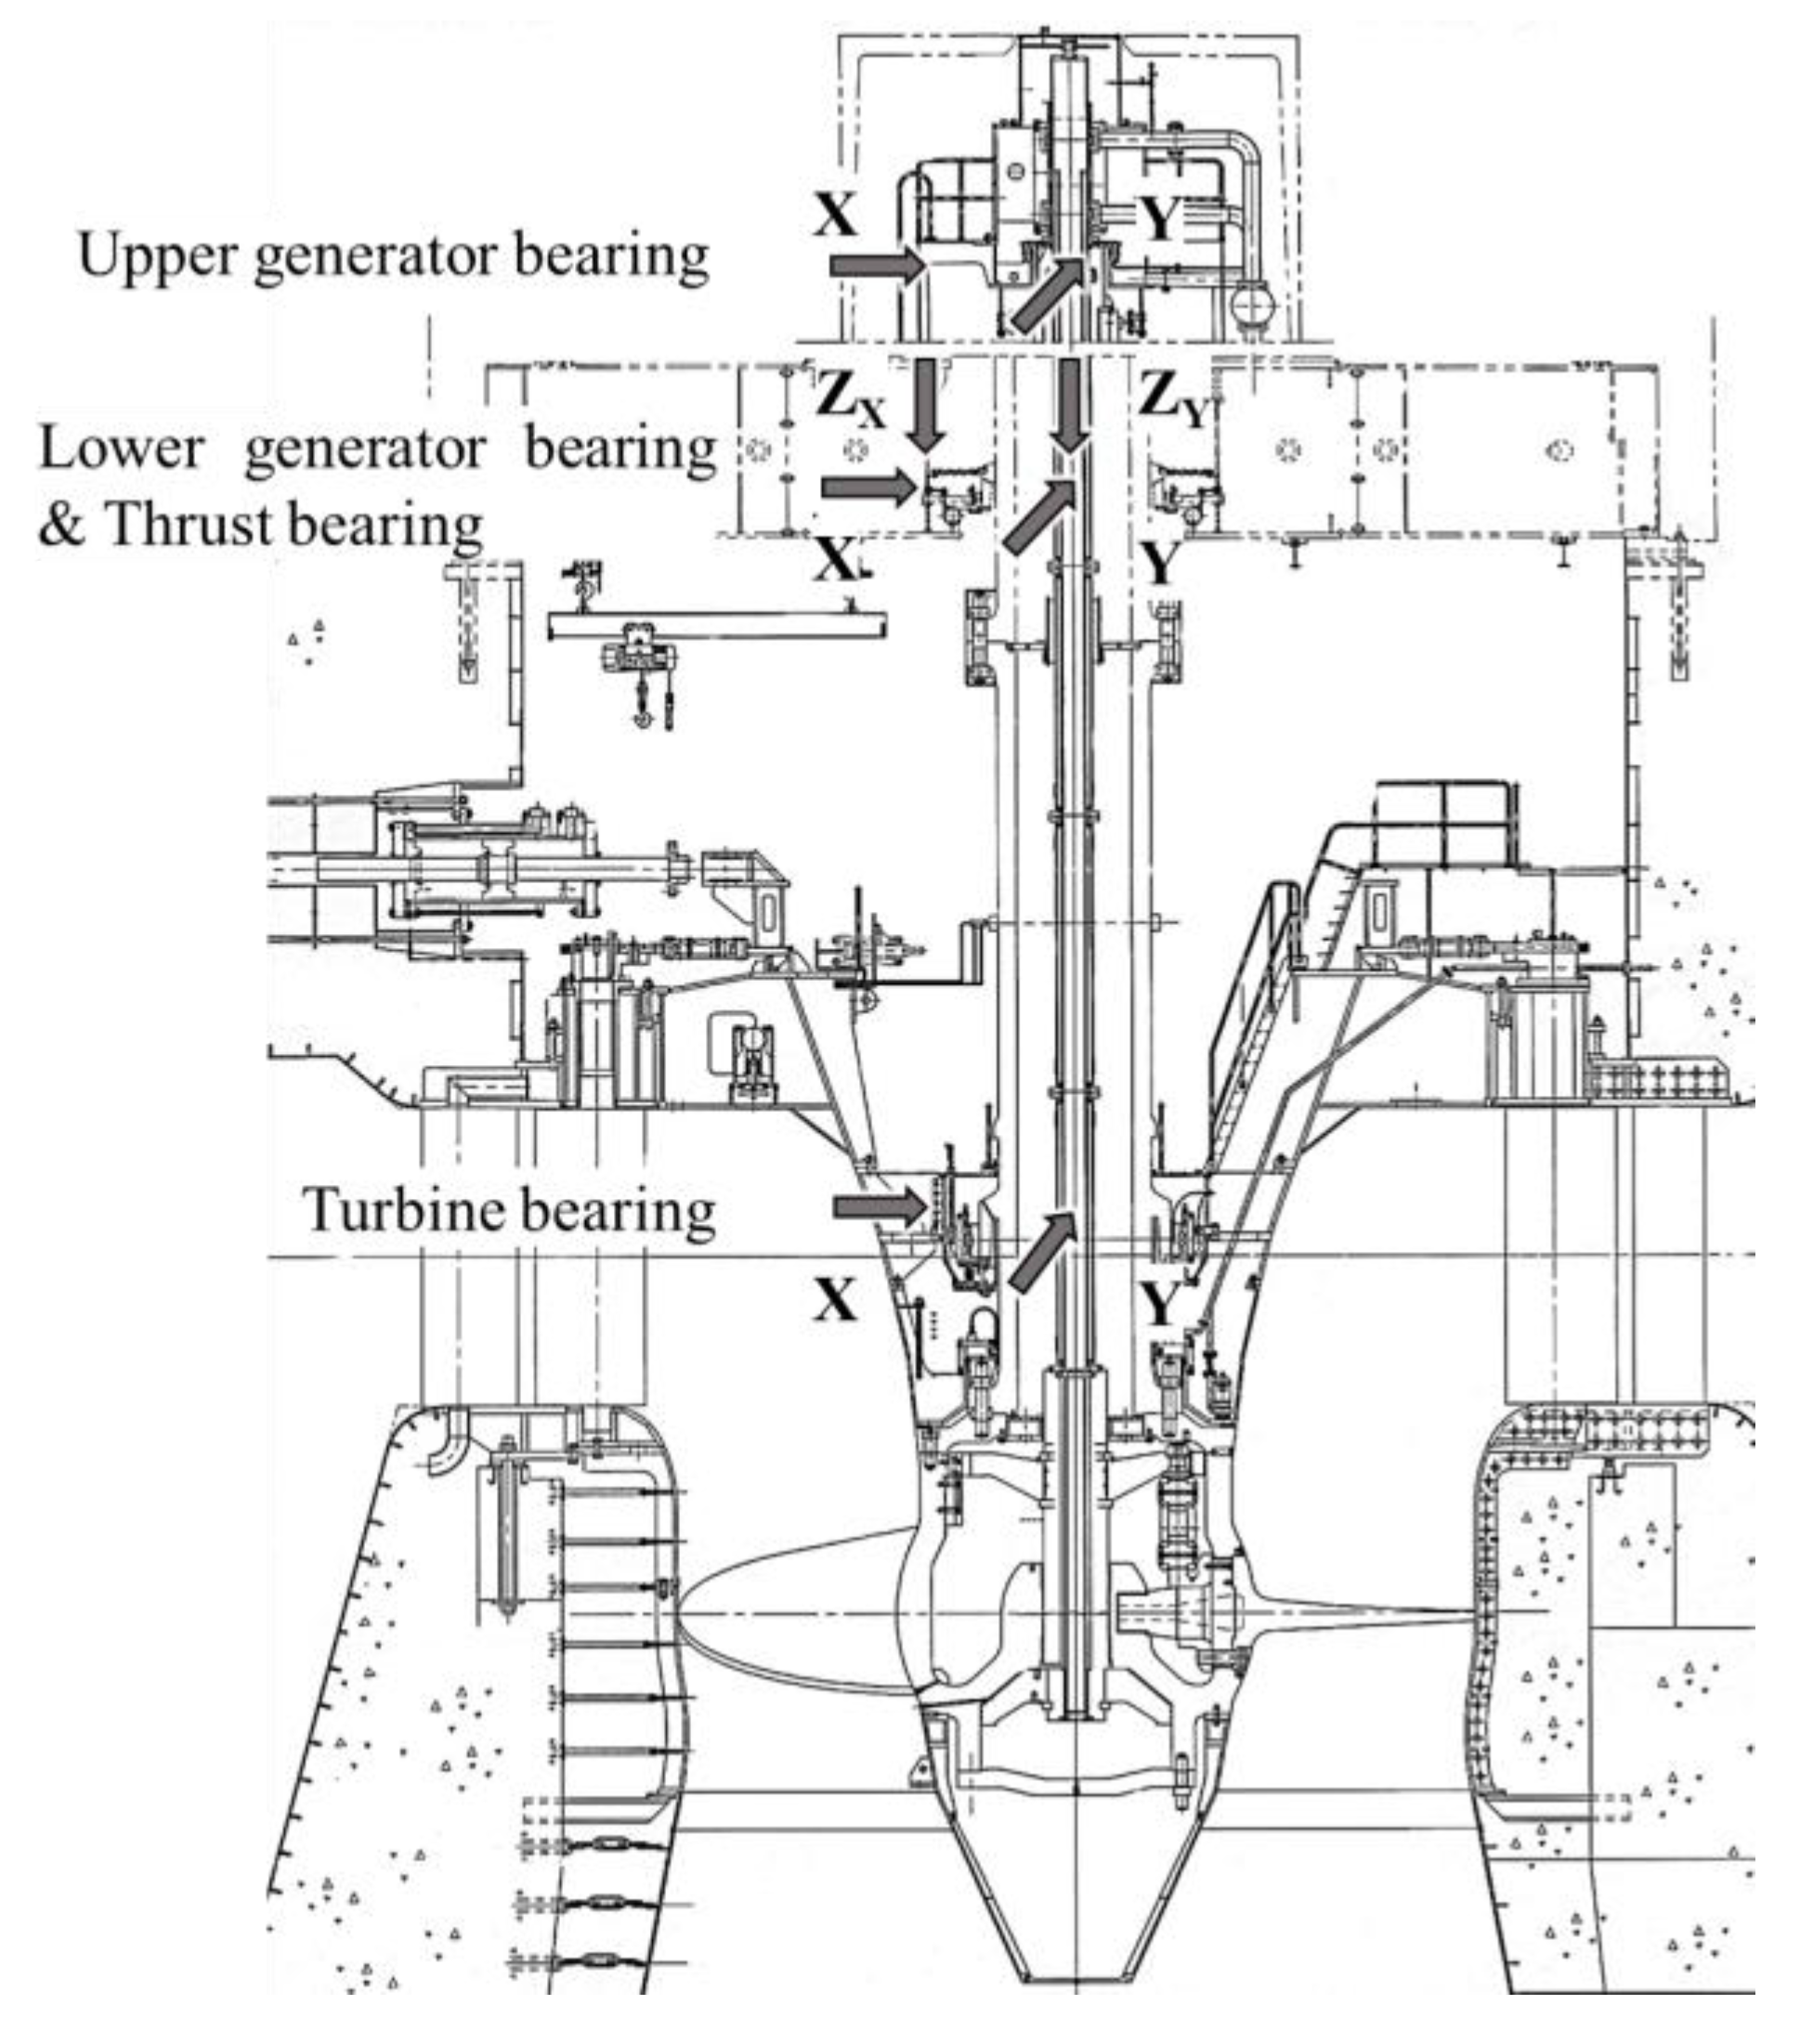
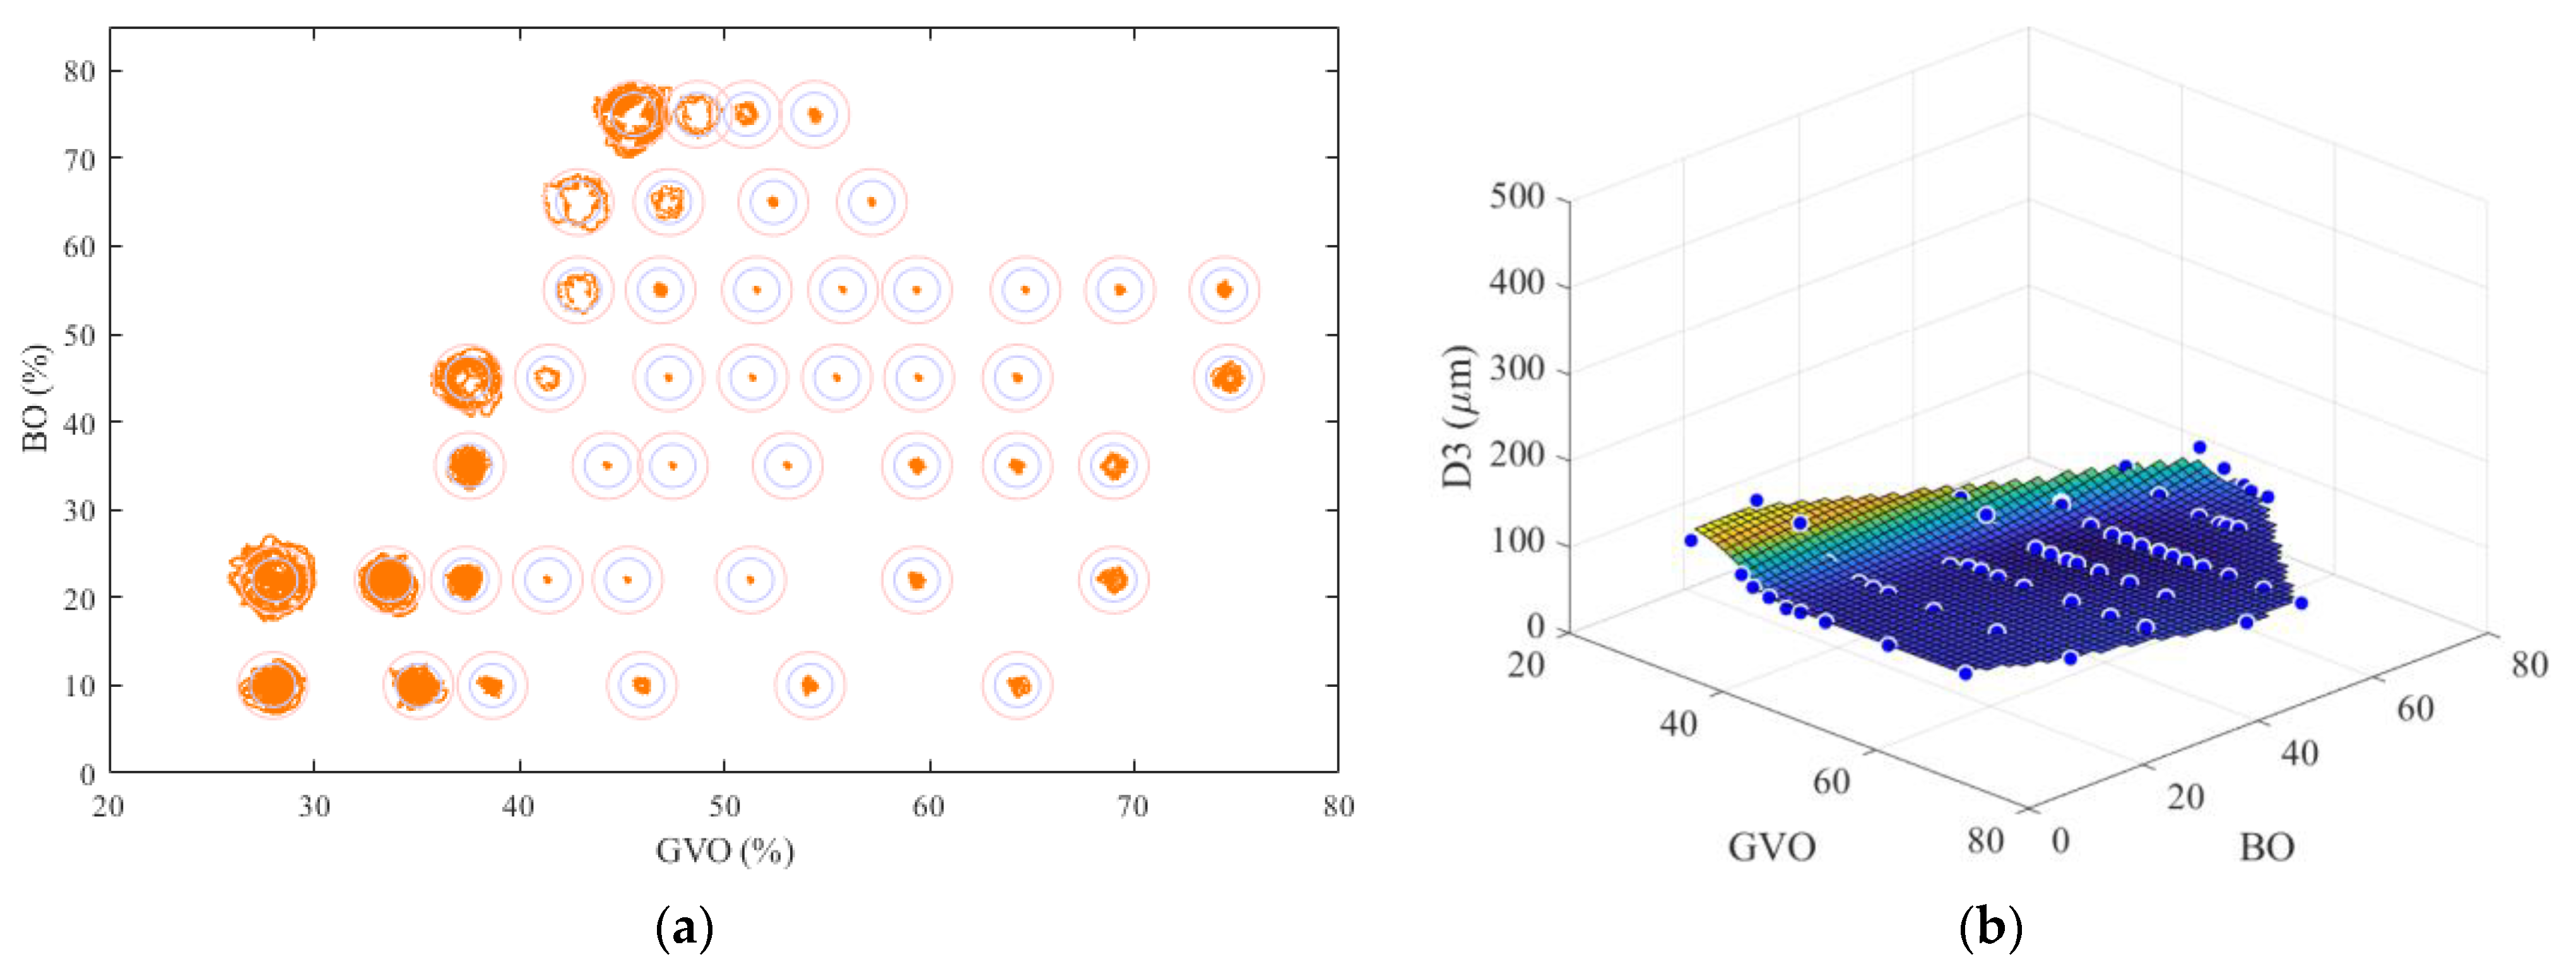
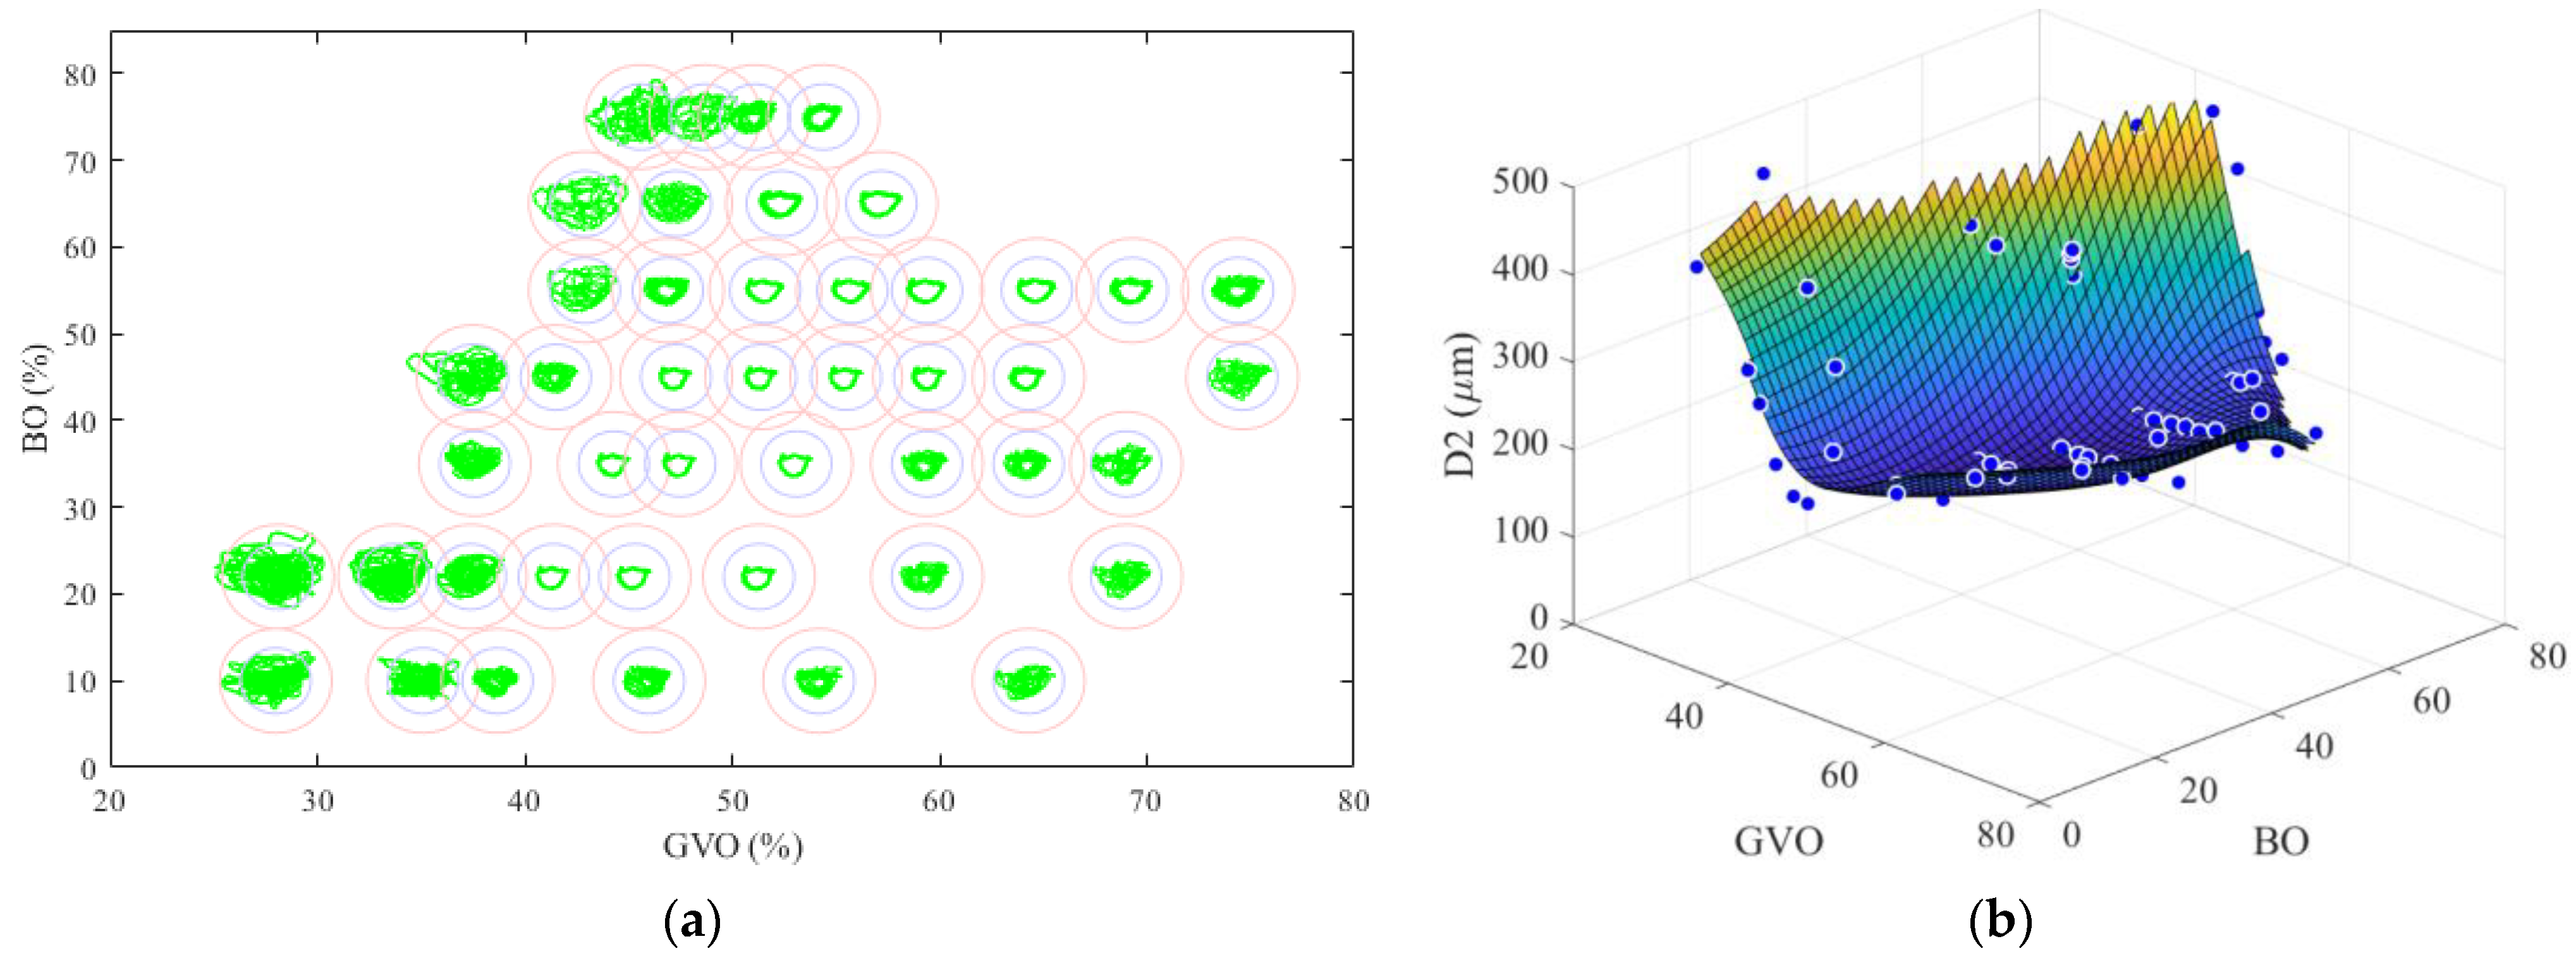
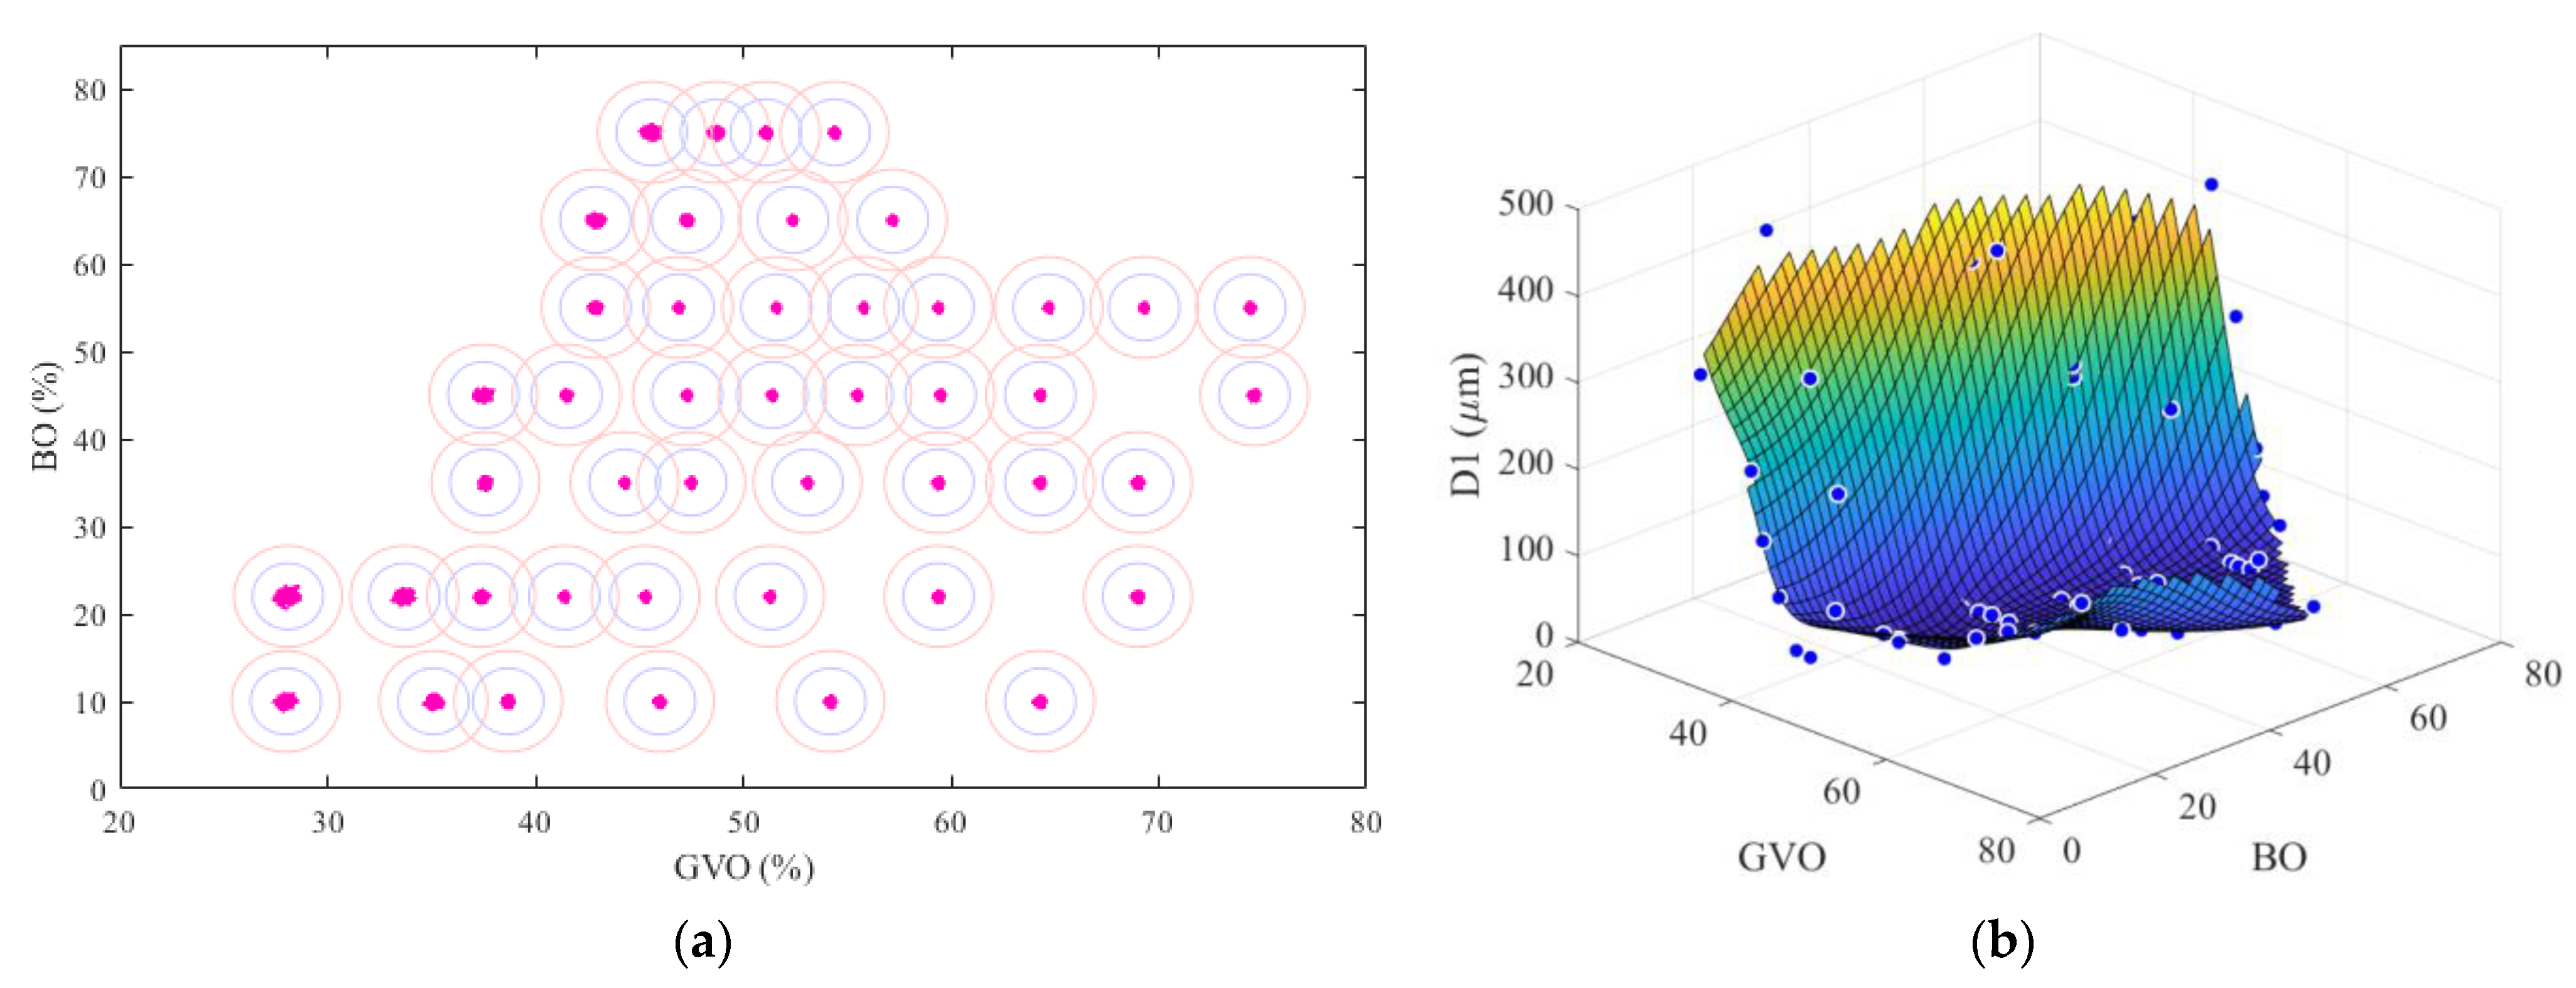
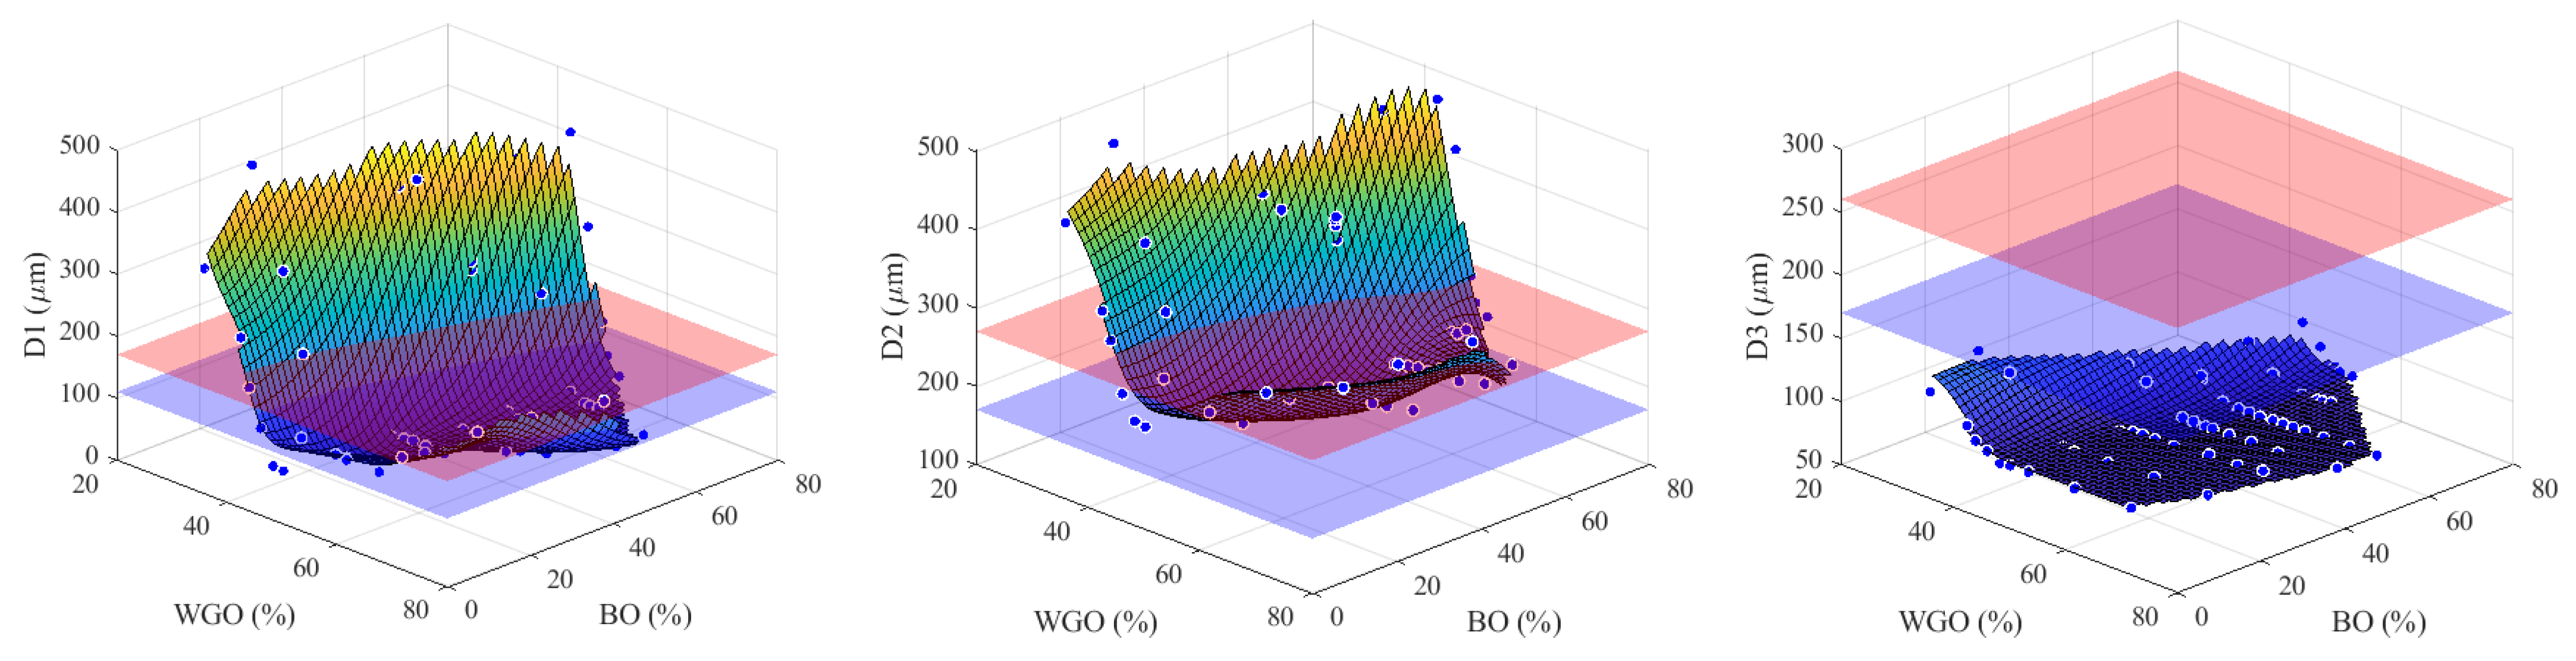
3.2. Vibration Cam Relationship

In this section, the result of the vibration test under each operating condition is analyzed. The vibration test data were measured by the sensors described in Table 2. The shaft orbits of the upper generator bearing, lower generator bearing, and turbine bearing are displayed in Figure 8, Figure 9 and Figure 10. Reference shaft displacement values are added to each orbit in order to compare the vibration intensity of each operating condition. The reference displacements are defined according to the international standard ISO 20816-5 [33]. The inner circle represents the alarm level (upper generator bearing: 170 µm; lower generator bearing: 170 µm; turbine bearing: 110 µm) of displacement, while the outer circle means the trip level (upper generator bearing: 260 µm; lower generator bearing: 270 µm; turbine bearing: 170 µm). From the figures, it can be seen that the displacement of the shaft depends on the operating conditions a lot. The generator bearings even reach the trip level with a low guide vane opening. With the increase in the GVO, the displacement is reduced, while it rises when the GVO becomes large. In the region of the BEP, the orbits are within the alarm level. When the GVO reaches a large value, the orbit increases its diameter, which almost reaches the alarm level. The orbit of the turbine bearing remains at a low level, below the alarm level, under all operating conditions. On the right of each figure, the measured displacements are denoted as blue points and the fitted displacement surface is also shown. The same notation is used in the later figures.
Similar to the efficiency cam relationship, there is a combination of blade and guide vane openings that lead to the best vibration relationship. Different combinations of BO and GVO result in various operating conditions, which cause different vibration levels. The vibration of the machine can be described by combining the hill charts of different measurement positions. The hill charts of each measurement position are compared with the international level, and the operating regions are divided. As shown in Figure 11, the blue plane indicates the action level between operating zones A-B and C. Below the blue threshold, the machine is considered acceptable for unrestricted long-term operation. The red plane represents the action level between operating zones C and D. Between these two planes, machines need either further investigation to be undertaken or some action to be taken to reduce the vibration magnitude. All operating points beyond the red level indicate that there is an increased probability of damage to the machine, and immediate action is therefore required to identify the reason for the high magnitudes of vibration. For turbine bearings, the operating condition between 40% and 60% GVO is considered to be safe, while the condition with a GVO lower than 35% is defined as a forbidden region. The other region is defined as the transition operating region. The operating regions of the lower generator bearing and upper generator bearing are also divided.
The shaft operating zones in Figure 11 are overlapped with each other and the overall operating zone is formed as shown in Figure 12. The red, blue, and green regions represent the forbidden region, transient region, and safe region, respectively. In the forbidden region, at least one measurement point exceeds the C-D limit. In the safe region, all of the measurement positions are at the A-B level. For each blade opening, the lowest vibration point is marked, and the points of all blade openings form the vibration cam relationship. When the machine is operating within this curve, the unit has the lowest vibration level. The isolines of relative efficiency is shown beneath the operation regions in order to compare the relation between the unit efficiency and 2 cam curves.

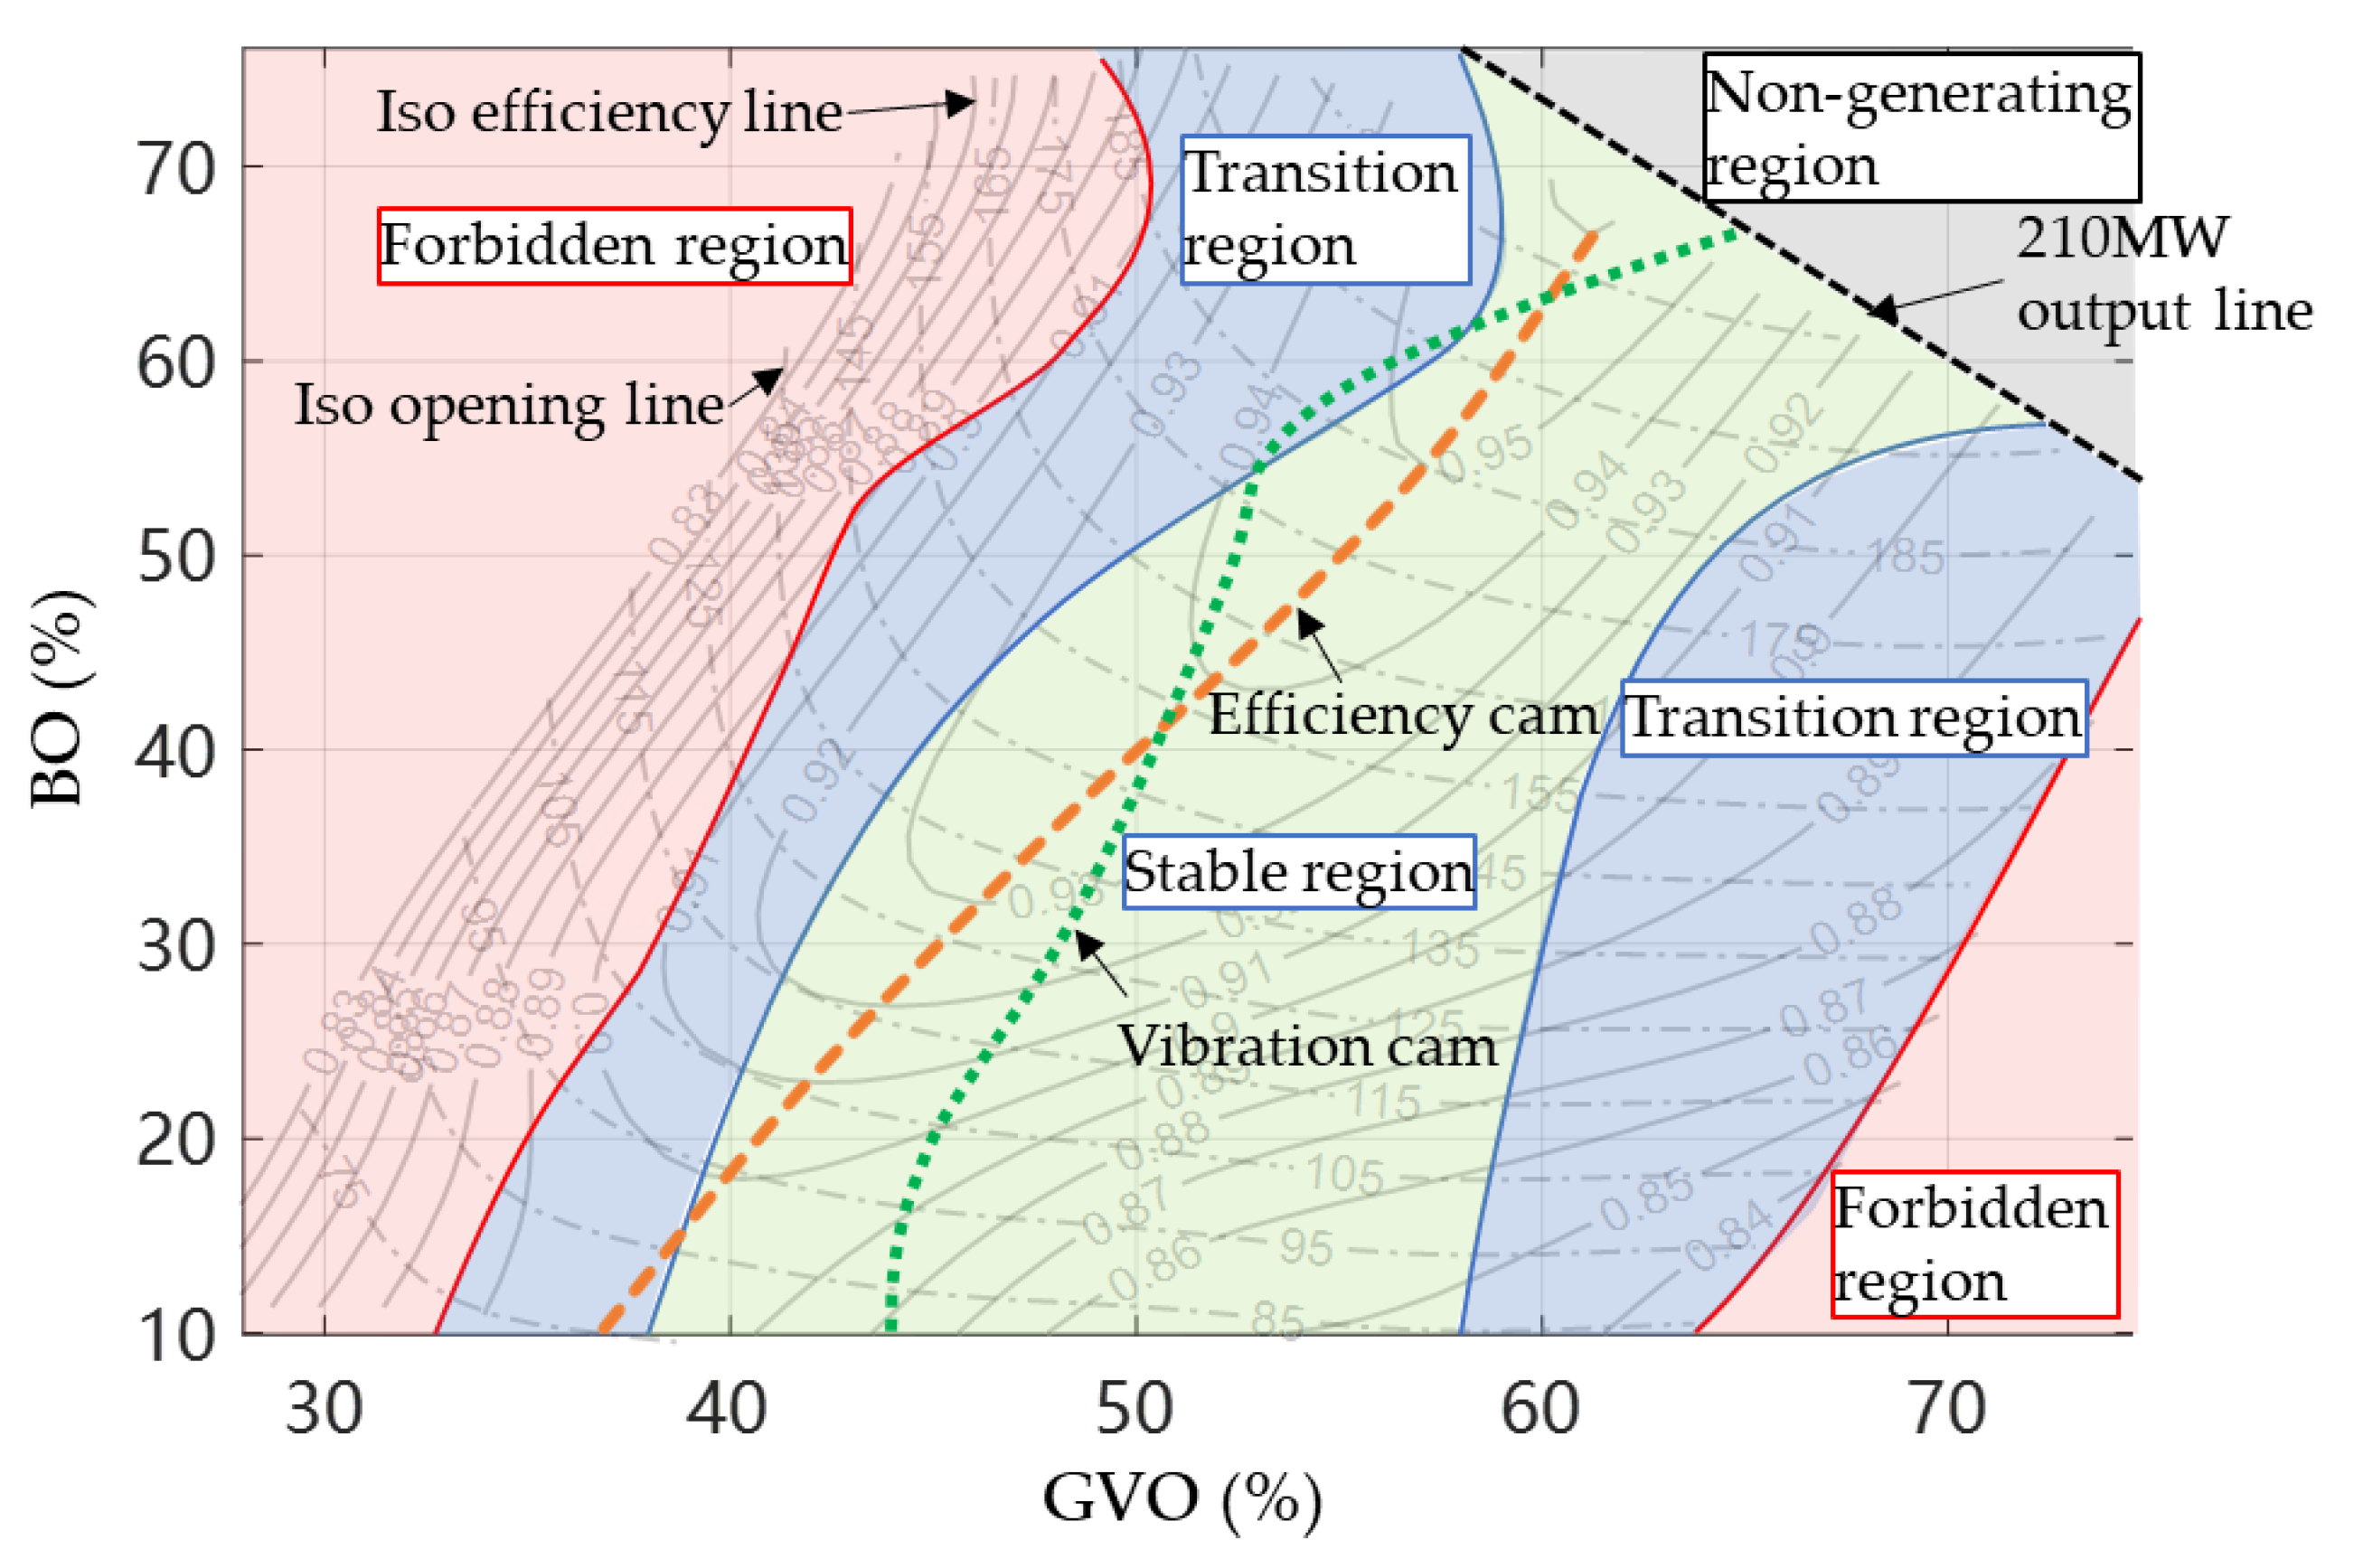
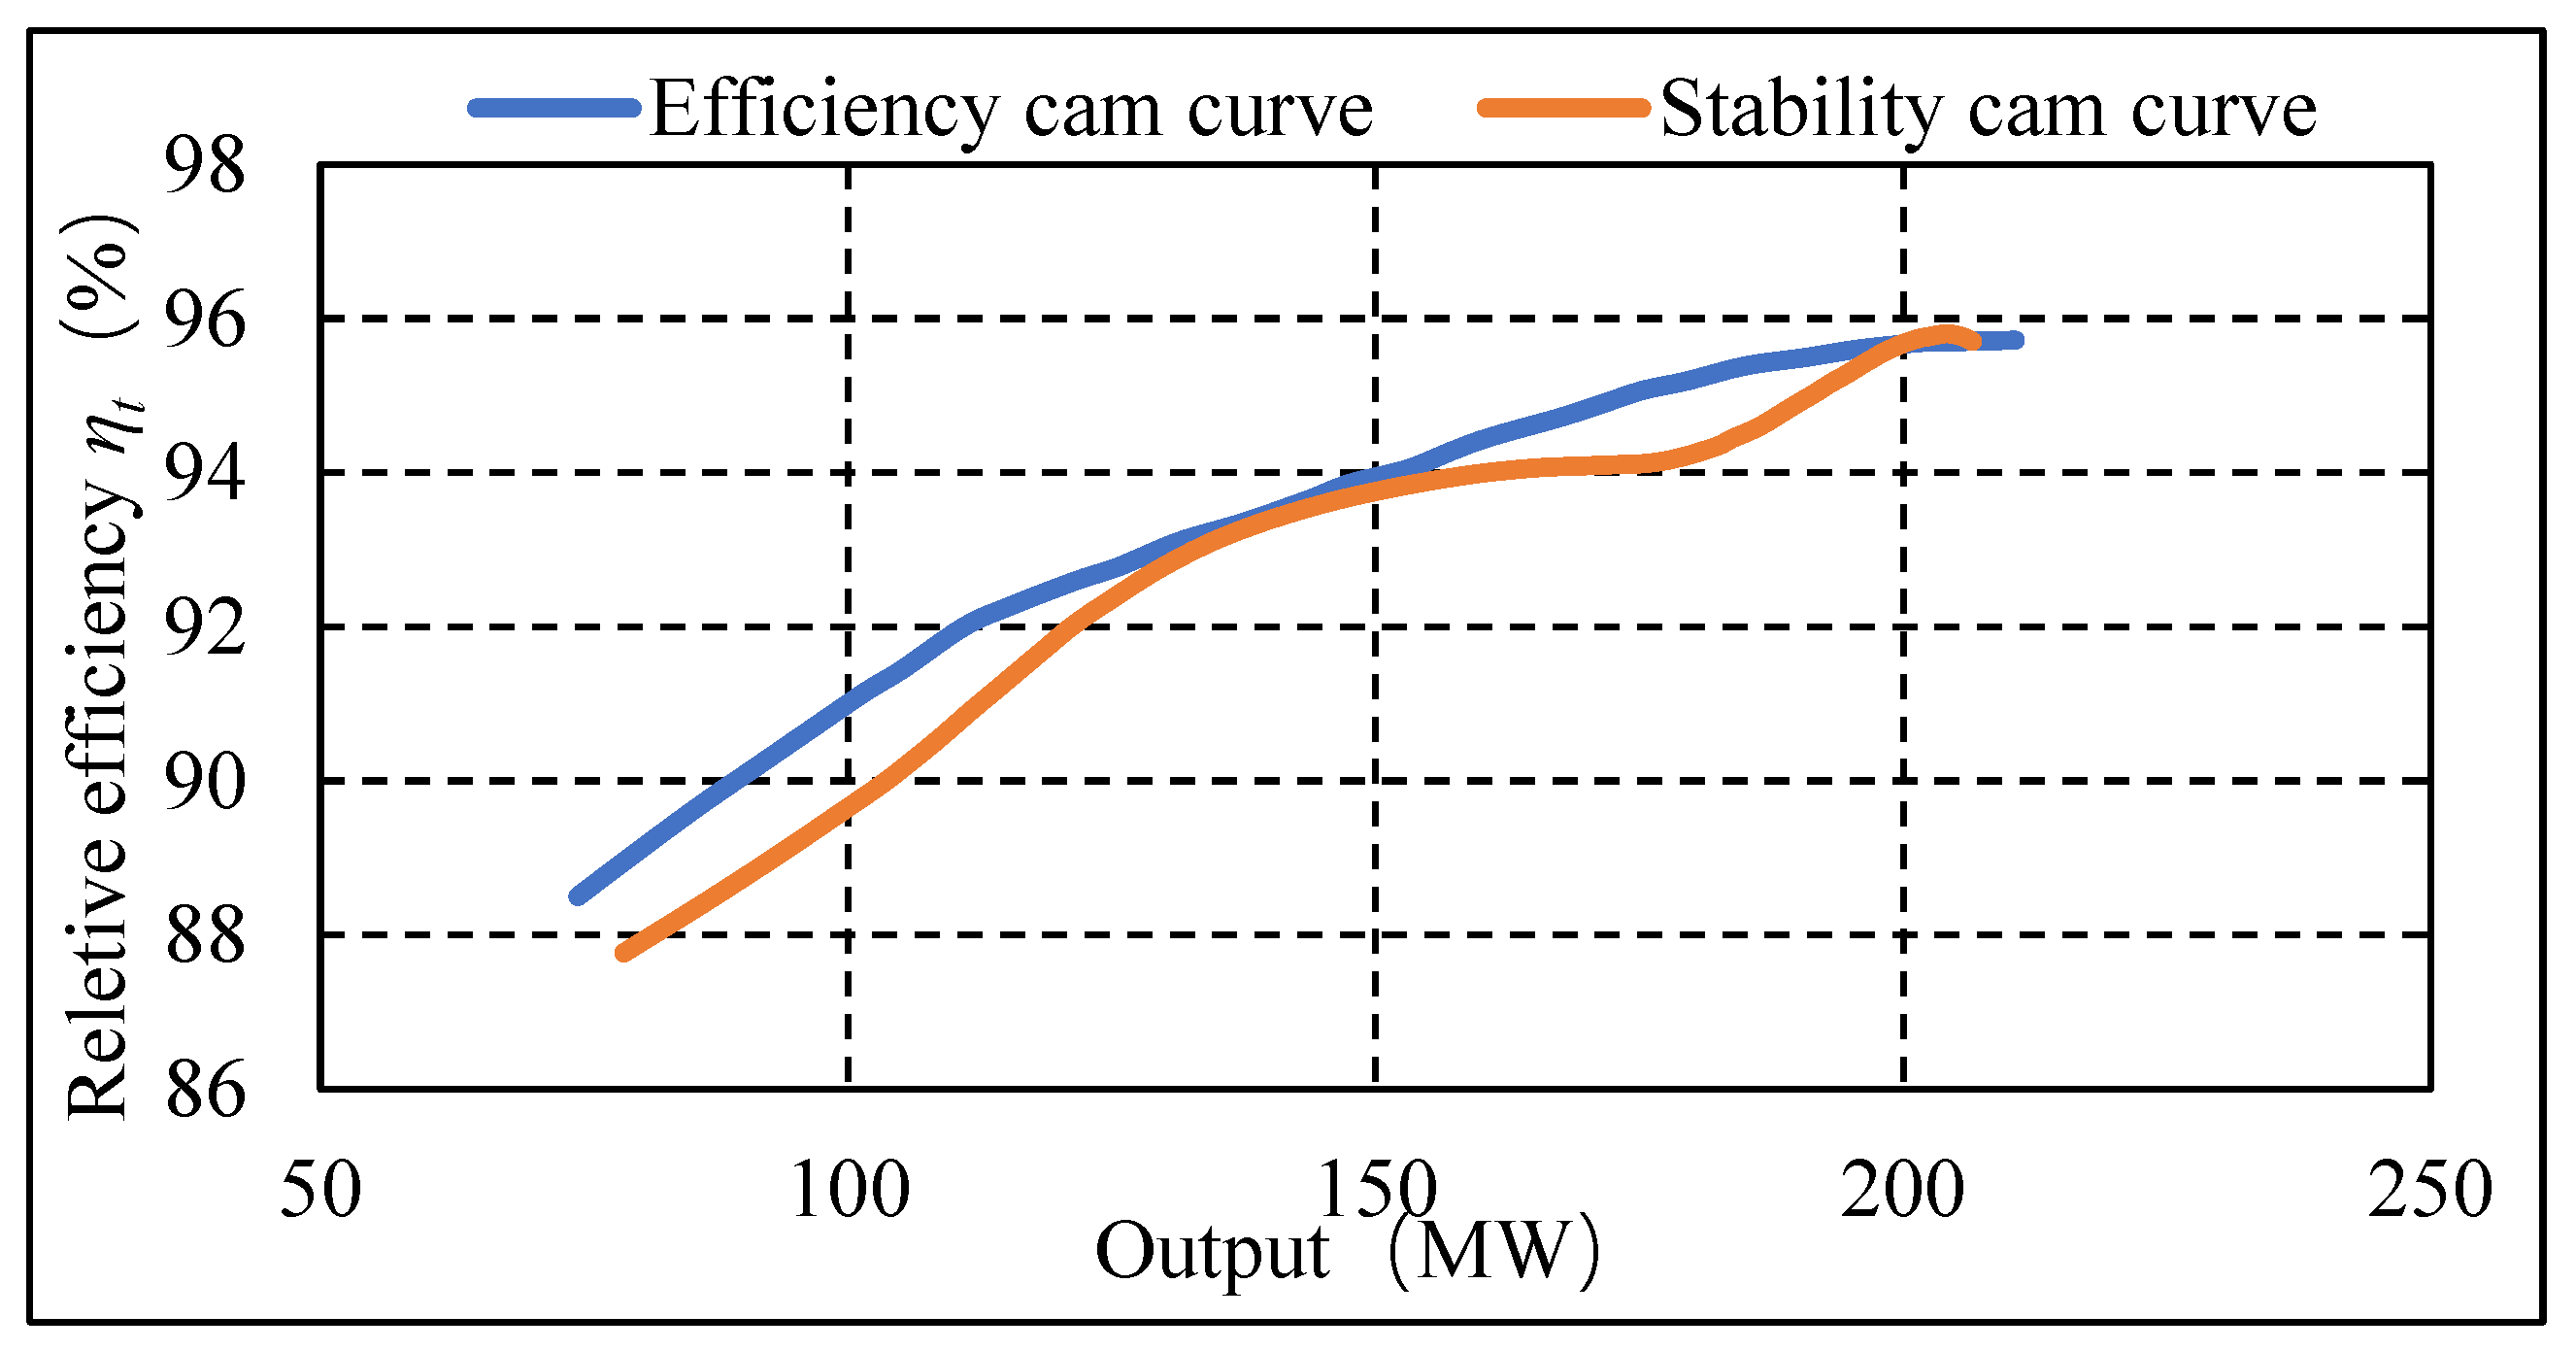
3.3. Comparative Analysis of Efficiency Coordinate Curve and Vibration Coordinate Curve

To compare the efficiency cam relationship and vibration cam relationship, both of them are put in the operating region figure. From Figure 13, it can be seen that the vibration cam relationship has a higher GVO with a low BO and a lower GVO with a high BO. The intersection point between the efficiency cam relationship and the vibration cam relationship is close to the best efficiency point.

4. Conclusions

In this study, the relative efficiency and vibration of a large-scale adjustable-blade Kaplan turbine were tested using a fixed head. The relative efficiency and vibration with different guide vane openings and blade openings were obtained. Through test data analysis, the optimal efficiency cam relationship and the optimal vibration cam relationship were obtained. The main conclusions are summarized below.
Compared with the cam relationship given by the model test, the prototype cam dependency curve improves the efficiency by up to 2%.
The vibration cam relationship is different from the efficiency cam relation. Compared with the efficiency dependence relationship, the efficiency of the optimal vibration dependence relationship is reduced by 1%, but the vibration of the machine increases.
As a result, this article proposes a synergy curve strategy for the axial-flow turbine. The obtained results can help the power station increase the operational quality and give operators guidance on the operation of the hydraulic turbine unit.

Author Contributions

Conceptualization, Z.W. and W.Z.; methodology, S.D.; software, W.Z.; validation, M.X.; formal analysis, M.X.; investigation, W.Z.; resources, Z.W.; data curation, T.H.; writing—original draft preparation, W.Z.; writing—review and editing, W.Z.; visualization, M.X.; supervision, Z.W.; project administration, S.D.; funding acquisition, Z.W. All authors have read and agreed to the published version of the manuscript.

Funding

This research was funded by Guangxi Datengxia Gorge Water Conservancy Development Co., Ltd. with the project “Research on the Safe and Stable Operation of the Datengxia Large Kaplan Turbine Project”.

Institutional Review Board Statement

Not applicable.

Informed Consent Statement

Not applicable.

Data Availability Statement

Data available on request due to restrictions. The data presented in this study are available on request from the corresponding author. The data are not publicly available due to data security management regulations of Guangxi Datengxia Gorge Water Conservancy Development Co., Ltd.

Conflicts of Interest

Author Sen Deng and Tianbao Huang was employed by the company Guangxi Datengxia Gorge Water Conservancy Development Co., Ltd. The remaining authors declare that the research was conducted in the absence of any commercial or financial relationships that could be construed as a potential conflict of interest.

References

  1. Polák, M. A brief history of the kaplan turbine invention. Energies 2021, 14, 6211. [Google Scholar]
  2. Smith, B.E. The Kaplan Adjustable-Blade Turbine. Trans. Am. Soc. Mech. Eng. 1930, 52, 137–141. [Google Scholar]
  3. Rodriguez, C.G.; Mateos-Prieto, B.; Egusquiza, E. Monitoring of rotor-stator interaction in pump-turbine using vibrations measured with on-board sensors rotating with shaft. Shock Vib. 2014, 2014, 276796. [Google Scholar] [CrossRef]
  4. Valentín, D.; Presas, A.; Egusquiza, M.; Valero, C.; Egusquiza, E. Behavior of Francis turbines at part load. Field assessment in prototype: Effects on power swing. IOP Conf. Ser. Earth Environ. Sci. 2019, 240, 062012. [Google Scholar] [CrossRef]
  5. Valero, C.; Egusquiza, E.; Presas, A.; Valentin, D.; Egusquiza, M.; Bossio, M. Condition monitoring of a prototype turbine. Description of the system and main results. J. Phys. Conf. Ser. 2017, 813, 12041. [Google Scholar] [CrossRef]
  6. Zhao, W. Improved Condition Monitoring of Hydraulic Turbines Based on Artificial Intelligence Techniques. Doctoral Thesis, Universitat Politècnica de Catalunya, Barcelona, Spain, 2021. Available online: http://tdx.cat/handle/10803/672373 (accessed on 11 January 2024).
  7. Egusquiza Estévez, E. Comportament Dinàmic de Màquines Hidràuliques; Edicions UPC: Barcelona, Spain, 2003; Available online: http://hdl.handle.net/2099.3/36745 (accessed on 11 January 2024).
  8. Valero, C.; Egusquiza, M.; Egusquiza, E.; Presas, A.; Valentin, D.; Bossio, M. Extension of Operating Range in Pump-Turbines. Influence of Head and Load. Energies 2017, 10, 2178. [Google Scholar] [CrossRef]
  9. Egusquiza, E.; Valentín, D.; Presas, A.; Valero, C. Overview of the experimental tests in prototype. J. Phys. Conf. Ser. 2017, 813, 012037. [Google Scholar] [CrossRef]
  10. Valentín, D.; Presas, A.; Egusquiza, M.; Valero, C.; Egusquiza, E. Transmission of High Frequency Vibrations in Rotating Systems. Application to Cavitation Detection in Hydraulic Turbines. Appl. Sci. 2018, 8, 451. [Google Scholar] [CrossRef]
  11. Wang, Z.; Qin, L.; Zeng, J.; Lin, J.; Yang, J.; Chen, W.; Luo, Y.; Yan, Z. Hydroturbine operating region partitioning based on analyses of unsteady flow field and dynamic response. Sci. China Technol. Sci. 2010, 53, 519–528. [Google Scholar] [CrossRef]
  12. Chen, G.; Du, J.; Liang, S. A research method of hydropower generating unit vibration area establishment based on wavelet analysis and vibration signals gray moment. Sci. Technol. Eng. 2016, 35, 215–219. [Google Scholar]
  13. Fan, Y.; Zhang, F.; Fu, J. Identification of vortex zone operation of hydraulic turbine based on shorttime Fourier Transform. Yangtze River 2016, 8, 85–87. [Google Scholar]
  14. Conrad, P.; Weber, W.; Jung, A. Deep Part Load Flow Analysis in a Francis Model turbine by means of two-phase unsteady flow simulations. J. Phys. Conf. Ser. 2017, 813, 12027. [Google Scholar] [CrossRef]
  15. Gajić, A.; Ignjatović, B.; Predić, Z.; Ivljanin, B. Test of cam characteristic of the Kaplan turbine by on-site measurement. FME Trans. 2005, 33, 145–149. [Google Scholar]
  16. Adamkowski, A.; Lewandowski, M.; Lewandowski, S. Selected experiences with optimization tests of the Kaplan-type hydraulic turbines. J. Energy Power Eng. 2014, 8, 1002–1011. [Google Scholar] [CrossRef]
  17. Valentin, D.; Roehr, C.; Presas, A.; Heiss, C.; Egusquiza, E.; Bosbach, W. Experimental-Numerical Design and Evaluation of a Vibration Bioreactor using Piezoelectric Patches. Sensors 2019, 19, 436. [Google Scholar] [CrossRef]
  18. Iovănel, R.G.; Dehkharqani, A.S.; Bucur, D.M.; Cervantes, M.J. Numerical simulation and experimental validation of a Kaplan prototype turbine operating on a cam curve. Energies 2022, 15, 4121. [Google Scholar]
  19. Zhou, J.; Zhou, X.; Xia, M.; Luo, H.; Wu, Y.; Wang, Z. Research and Analysis on Model measurement and Prototype Operation of large-scale Kaplan turbine. In IOP Conference Series: Earth and Environmental Science; IOP Publishing: Bristol, UK, 2022; p. 12045. [Google Scholar]
  20. Zhang, Y.L.; Wu, Y.B.; Wei, J.W.; Wang, Z.W.; Zhou, L.J. Clearance flow field characteristics of Kaplan turbine under different flange clearance. In IOP Conference Series: Earth and Environmental Science; IOP Publishing: Bristol, UK, 2022; p. 12023. [Google Scholar]
  21. Jovanović, R.Ž.; Božić, I.O. Feedforward neural network and ANFIS-based approaches to forecasting the off-cam energy characteristics of Kaplan turbine. Neural Comput. Appl. 2018, 30, 2569–2579. [Google Scholar]
  22. Dunca, G.; Bucur, D.M.; Călinoiu, C.; Isbăşoiu, E.C. Experimental analysis of the optimal cam characteristic for a kaplan turbine. In Proceedings of the IGHEM 2012, Trondheim, Norway, 27–30 June 2012. [Google Scholar]
  23. Amiri, K.; Mulu, B.; Cervantes, M.J.; Raisee, M. Effects of load variation on a Kaplan turbine runner. Int. J. Fluid Mach. Syst. 2016, 9, 182–193. [Google Scholar] [CrossRef]
  24. Wu, Y.; Liu, S.; Dou, H.-S.; Wu, S.; Chen, T. Numerical prediction and similarity study of pressure fluctuation in a prototype Kaplan turbine and the model turbine. Comput. Fluids 2012, 56, 128–142. [Google Scholar] [CrossRef]
  25. Luna-Ramírez, A.; Campos-Amezcua, A.; Dorantes-Gómez, O.; Mazur-Czerwiec, Z.; Muñoz-Quezada, R. Failure analysis of runner blades in a Francis hydraulic turbine—Case study. Eng. Fail. Anal. 2016, 59, 314–325. [Google Scholar]
  26. Peltier, R.; Boyko, A.; Popov, S.; Krajisnik, N. Investigating the Sayano-Shushenskaya hydro power plant disaster. Power 2010, 154, 48. [Google Scholar]
  27. Zhao, Q.; Chai, J.; Ma, C.; Ding, J.; Li, B. Causes of Header Bolt Fracture of a Pumped Storage Power Station. J. Yangtze River Sci. Res. Inst. 2019, 36, 134–138. [Google Scholar] [CrossRef]
  28. Li, Z. The Research of Combination Relationship and Performance of Bulb Tubular Turbine. Ph.D. Thesis, Lanzhou University of Technology, Lanzhou, China, 2006. [Google Scholar]
  29. Isaksson, H. Uncertainties in Kaplan Cam Curve. Luleå University of Technology, Norrbotten County, Sweden. 2016. Available online: https://ltu.diva-portal.org/smash/record.jsf?pid=diva2%3A1026401&dswid=640 (accessed on 11 January 2024).
  30. Gajic, A.; Ignjatovic, B.; Komarov, D.; Daskalovic, L.; Stojkovic, D.; Predic, Z. Cam characteristics of the Kaplan turbine determined by efficiency and bearing vibrations. In Proceedings of the 6th International Conference on Hydraulic Machinery and Hydrodynamics, Timisoara, Romania, 21–22 October 2004. [Google Scholar]
  31. Kaniecki, M.; Krzemianowski, Z.; Banaszek, M. Computational fluid dynamics simulations of small capacity Kaplan turbines. Trans. Inst. Fluid-Flow Mach. 2011, 123, 71–84. [Google Scholar]
  32. Sheldon, L.H. Field testing and optimising efficiency of hydro turbines. Int. Water Power Dam Constr. 1982, 34, 22–28. [Google Scholar]
  33. ISO 20816-5:2018; Mechanical Vibration—Measurement and Evaluation of Machine Vibration—Part 5: Machine Sets in Hydraulic Power Generating and Pump-Storage Plants. ISO: Geneva, Switzerland, 2018; p. 60.
Figure 1. Measurement points of the index test.
Jmse 12 00241 g001
Figure 2. Operating condition setup for the on-site measurement.
Jmse 12 00241 g002
Figure 3. Measurement points of vibration test (X and Y are 2 radial directions with 90 degrees).
Jmse 12 00241 g003
Figure 4. Hill chart of relative efficiency ηt. (a) Three-dimensional hill chart of efficiency; (b) Contour plot of efficiency.
Jmse 12 00241 g004
Figure 5. Efficiency curve for fixed blade openings (marked with different symbols).
Jmse 12 00241 g005
Figure 6. Cam relationship obtained by model test and cam relationship obtained by field test.
Jmse 12 00241 g006
Figure 7. Cam relationship at present and cam relationship obtained by field test.
Jmse 12 00241 g007
Figure 8. Measurement result of upper generator bearing with different combinations of GVO and BO. (a) Shaft orbit; (b) hill chart of shaft displacement.
Jmse 12 00241 g008
Figure 9. Measurement result of lower generator bearing with different combinations of GVO and BO. (a) Shaft orbit; (b) hill chart of shaft displacement.
Jmse 12 00241 g009
Figure 10. Measurement result of turbine bearing with different combinations of GVO and BO. (a) Shaft orbit; (b) hill chart of shaft displacement.
Jmse 12 00241 g010
Figure 11. Comparison of the shaft displacement hill chart with international threshold.
Jmse 12 00241 g011
Figure 12. Overall operating zone of the researched machine.
Jmse 12 00241 g012
Figure 13. Efficiency comparison between the efficiency dependence relation and vibration coordinate curve.
Jmse 12 00241 g013
Table 1. Basic parameters of the researched Kaplan turbine unit.
ParameterValueUnit
Highest head37.79m
Rated head25.0m
Lowest head12.91m
Rated discharge890.34m3/s
Runner diameter10.4m
Rated output200MW
Run-away speed195.1rpm
Installation level14.71m
Best efficiency95.67M/P (%)
Rated efficiency95.67M/P (%)
Table 2. Specifics of the sensors used in the test.
Sensor TypeMeasurement PositionSpecification
Displacement sensorHeadcover (X-direction: A11; Y-direction: A14), lower bracket (X-direction: A21; Y-direction: A24), upper bracket (X-direction: A31; Y-direction: A34)Sensitivity: 8 mV/µm
Proximity probeTurbine bearing (X-direction: D11; Y-direction: D14), lower generator bearing (X-direction: D21; Y-direction: D24), upper generator bearing (X-direction: D31; Y-direction: D34)Sensitivity: 4 V/mm
Pressure sensorSpiral casing inlet (50 kPa), draft tube outlet (20 kPa)Output range: 4~20 mA
Disclaimer/Publisher’s Note: The statements, opinions and data contained in all publications are solely those of the individual author(s) and contributor(s) and not of MDPI and/or the editor(s). MDPI and/or the editor(s) disclaim responsibility for any injury to people or property resulting from any ideas, methods, instructions or products referred to in the content.

