Article

Assessing the Influence of Typhoons on Salt Intrusion in the Modaomen Estuary within the Pearl River Delta, China

1
Key Laboratory of the Pearl River Estuary Regulation and Protection of Ministry of Water Resources, Guangzhou 510611, China
2
Pearl River Water Resources Research Institute, Guangzhou 510611, China
3
The National Key Laboratory of Water Disaster Prevention, Hohai University, Nanjing 210024, China
4
College of Harbor, Coastal and Offshore Engineering, Hohai University, Nanjing 210024, China
*
Author to whom correspondence should be addressed.
J. Mar. Sci. Eng. 2024, 12(1), 22; https://doi.org/10.3390/jmse12010022
Submission received: 14 November 2023 / Revised: 14 December 2023 / Accepted: 15 December 2023 / Published: 20 December 2023
(This article belongs to the Special Issue Numerical Modelling of Atmospheres and Oceans II)

Abstract

:
Salt intrusion presents a significant environmental challenge in numerous estuaries around the world, including the Modaomen Estuary in China. This phenomenon typically occurs during the winter season due to reduced freshwater flow. However, an unusual salt intrusion event was observed during the autumn of 2022, coinciding with a typhoon. In this study, we assess the response of the Modaomen to Typhoon Nesat in 2022 and examine the influence of the typhoon on salt intrusion using the Semi-implicit Cross-scale Hydroscience Integrated System Model (SCHISM). The model results reveal that salt intrusion during a typhoon event is primarily driven by the storm surge and landward Ekman transport. Northeasterly winds enhance stratification between saltwater and freshwater in the Modaomen. Moreover, with the typhoon’s passage, the Denglongshan Station recorded a peak salinity of 17 psu, with salt intrusion stretching 29 km further. This escalation led to salinity levels surpassing the local drinking water standard of 0.5 psu across all freshwater intake points in Zhuhai City. Numerical experiments indicate that if Typhoon Nesat had occurred during spring tides, the salt intrusion would have been less severe. Furthermore, the study revealed that regulating the upstream runoff could potentially alleviate the effects of typhoon-induced salt intrusion on ensuring a safe water supply. With a runoff increase to 4000 m3/s, the impact of typhoons on Modaomen’s drinking water supply can be managed, and at 6000 m3/s, the influence of typhoons on water supply becomes negligible.

1. Introduction

The issue of water quality has emerged as a pivotal concern affecting water sources downstream in estuaries [1,2], notably the salt intrusion, which poses threats to drinking water safety. Salt intrusion is the process by which seawater from the sea enters an estuary through its main channel, elevating the salinity levels in the river section of the estuary. In recent decades, salt intrusion has intensified significantly in estuaries, becoming a prevalent environmental concern [3,4]. This escalation can be attributed to the continuous reduction of freshwater, influenced by both climate change and human intervention [5]. Salt intrusion is influenced by various external factors, including river discharge, tides, and winds [6,7,8]. Of these, river discharge and tides have been extensively studied, as fundamental model outcomes indicate that the extent of steady-state intrusion is primarily reliant on these factors [9,10,11]. However, recent decades have witnessed a growing emphasis on the impact of wind on salt intrusion [12,13,14]. Furthermore, recent research has revealed that down-estuary axial wind stress can enhance landward salt intrusion, contingent on the interplay between wind straining and wind mixing effects [15]. The various combinations of these forces have given rise to distinct salt intrusion patterns.
In general, salt intrusion tends to be mild during flood seasons due to the substantial river discharge, which acts as a barrier against the upstream flow of saltwater [16]. Riverine estuaries typically exist in a partially mixed state during these times, with salt intrusion becoming more pronounced during dry seasons. However, atypical salt intrusion events can occur during typhoon conditions, when significant landward salt transport transpires during storms [17,18]. It is worth noting that there have been relatively few studies examining the impact of these cyclone-scale winds on salt intrusion in estuaries.
The methodologies employed in investigating salt intrusion primarily encompass statistical analysis of measured data, analytical analysis, and numerical simulation [19,20,21]. Each method holds distinct advantages and significance [16]. Numerical models stand out as they can simulate extensive spatial and temporal variations in salinity and freshwater within estuaries. Moreover, they offer the benefits of easy application, broad spatial and temporal coverage, and excellent visualization of results [22]. In this study, we apply a numerical model to investigate how extreme weather events affect salinity responses within China’s Modaomen Estuary as a representative example. The Modaomen, situated within the Pearl River Delta, serves as a primary conduit for freshwater discharge from the Pearl River Estuary and features several water withdrawal plants along its course [23]. These water intakes play a crucial role in providing freshwater to the neighboring areas, encompassing Macao, Zhuhai, and Zhongshan cities. The Modaomen Estuary displays a significant challenge with salt intrusion, particularly during the dry season, and occasionally faces the added issue of storm surges [24].
Based on a statistical analysis of 73 years of tropical cyclone data from 1949 to 2021, as reported by the China Meteorological Administration, tropical cyclones in the autumn seasons near the Pearl River Estuary predominantly follow westward and northwestward trajectories. These types of tropical cyclones often give rise to storm surges in the estuary. However, the occurrence of salt intrusion is relatively rare in these conditions [25]. Nevertheless, in recent years, due to extreme weather events such as autumn droughts in the Pearl River Basin and insufficient water storage at the close of the flood season, the impact of autumn typhoons on the hydrodynamic and salinity characteristics in the estuary has grown more pronounced [26]. Extraordinary events, including Typhoon Nesat in 2022, have led to noteworthy instances of salt intrusion in the Pearl River Estuary.
Therefore, the aims of this study encompass quantifying the impact of Typhoon Nesat (2022) on salt intrusion in the Modaomen Estuary, along with an exploration of how the typhoon-induced salt intrusion responds to river flows and tidal influences. This investigation holds significant importance for the management of water resource safety in estuaries characterized by microtidal regimes. The structure of the article is as follows: Section 2 provides an overview of the study site and introduces the numerical model used. Section 3 presents the model results and includes an in-depth analysis of the findings. In Section 4, we engage in a discussion of how salt intrusion responds to alterations in river discharge and tides during the typhoon period. Finally, Section 5 offers the conclusions drawn from our research.

2. Methods

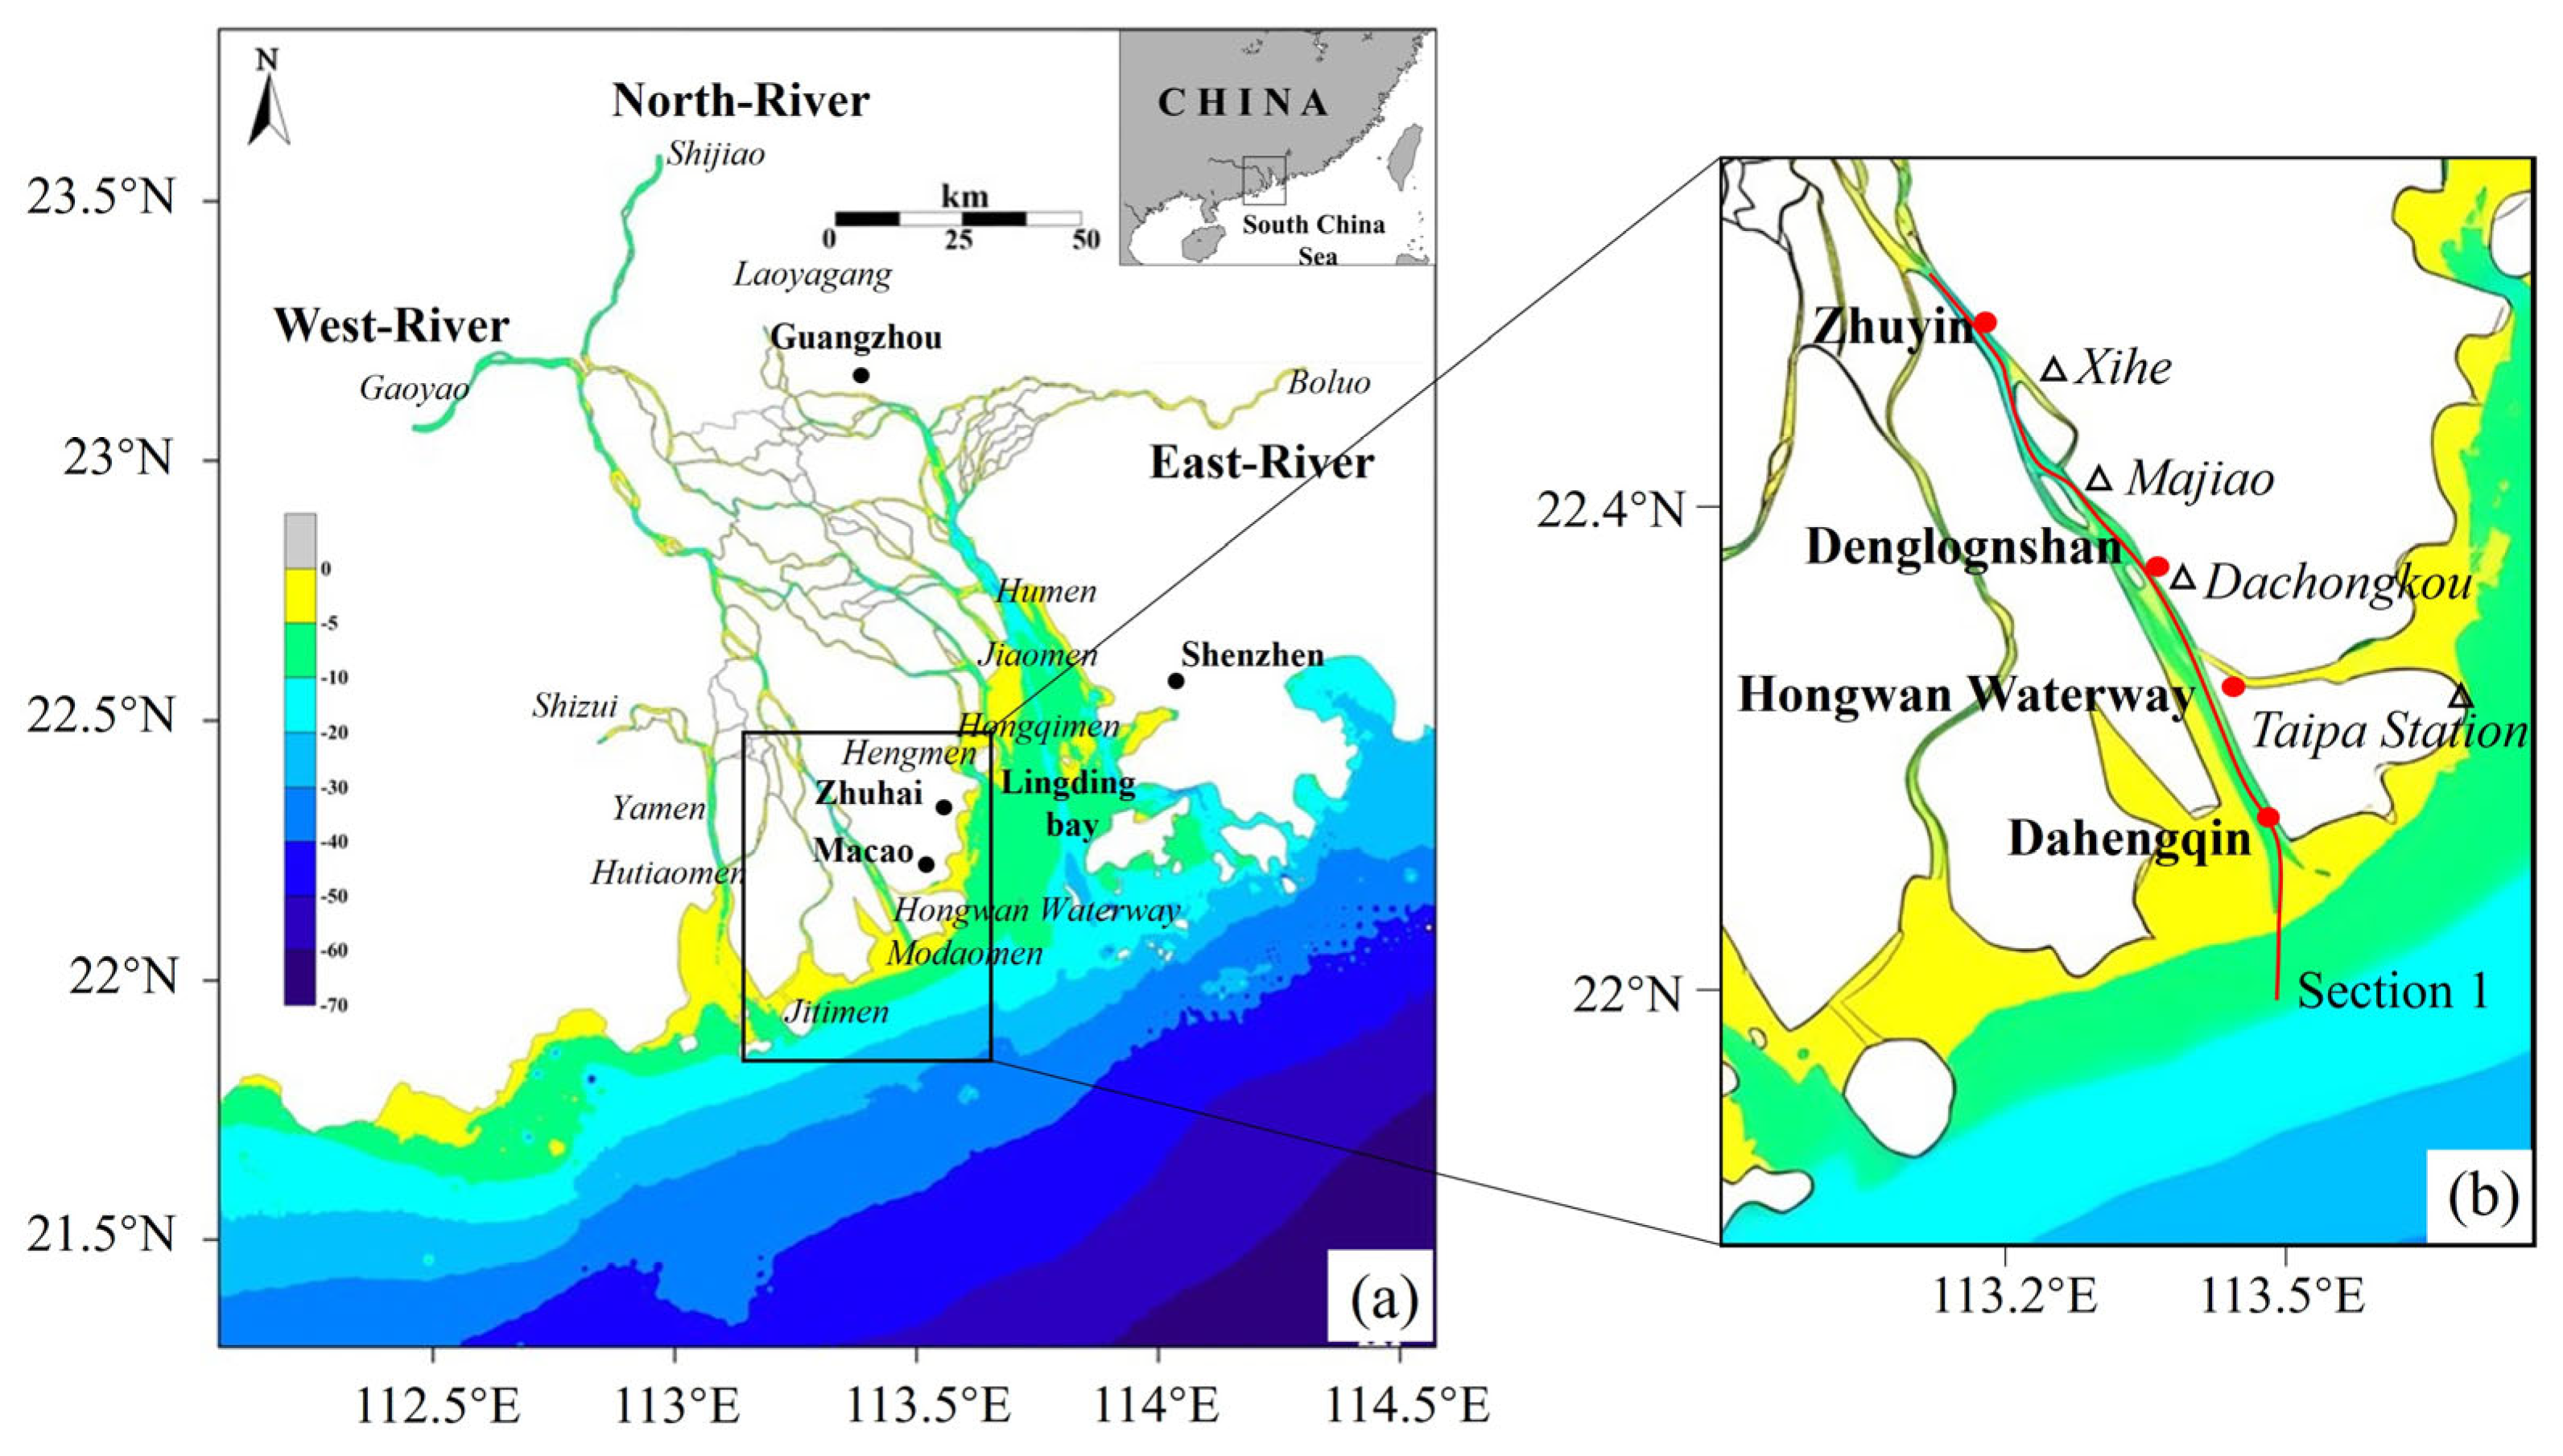
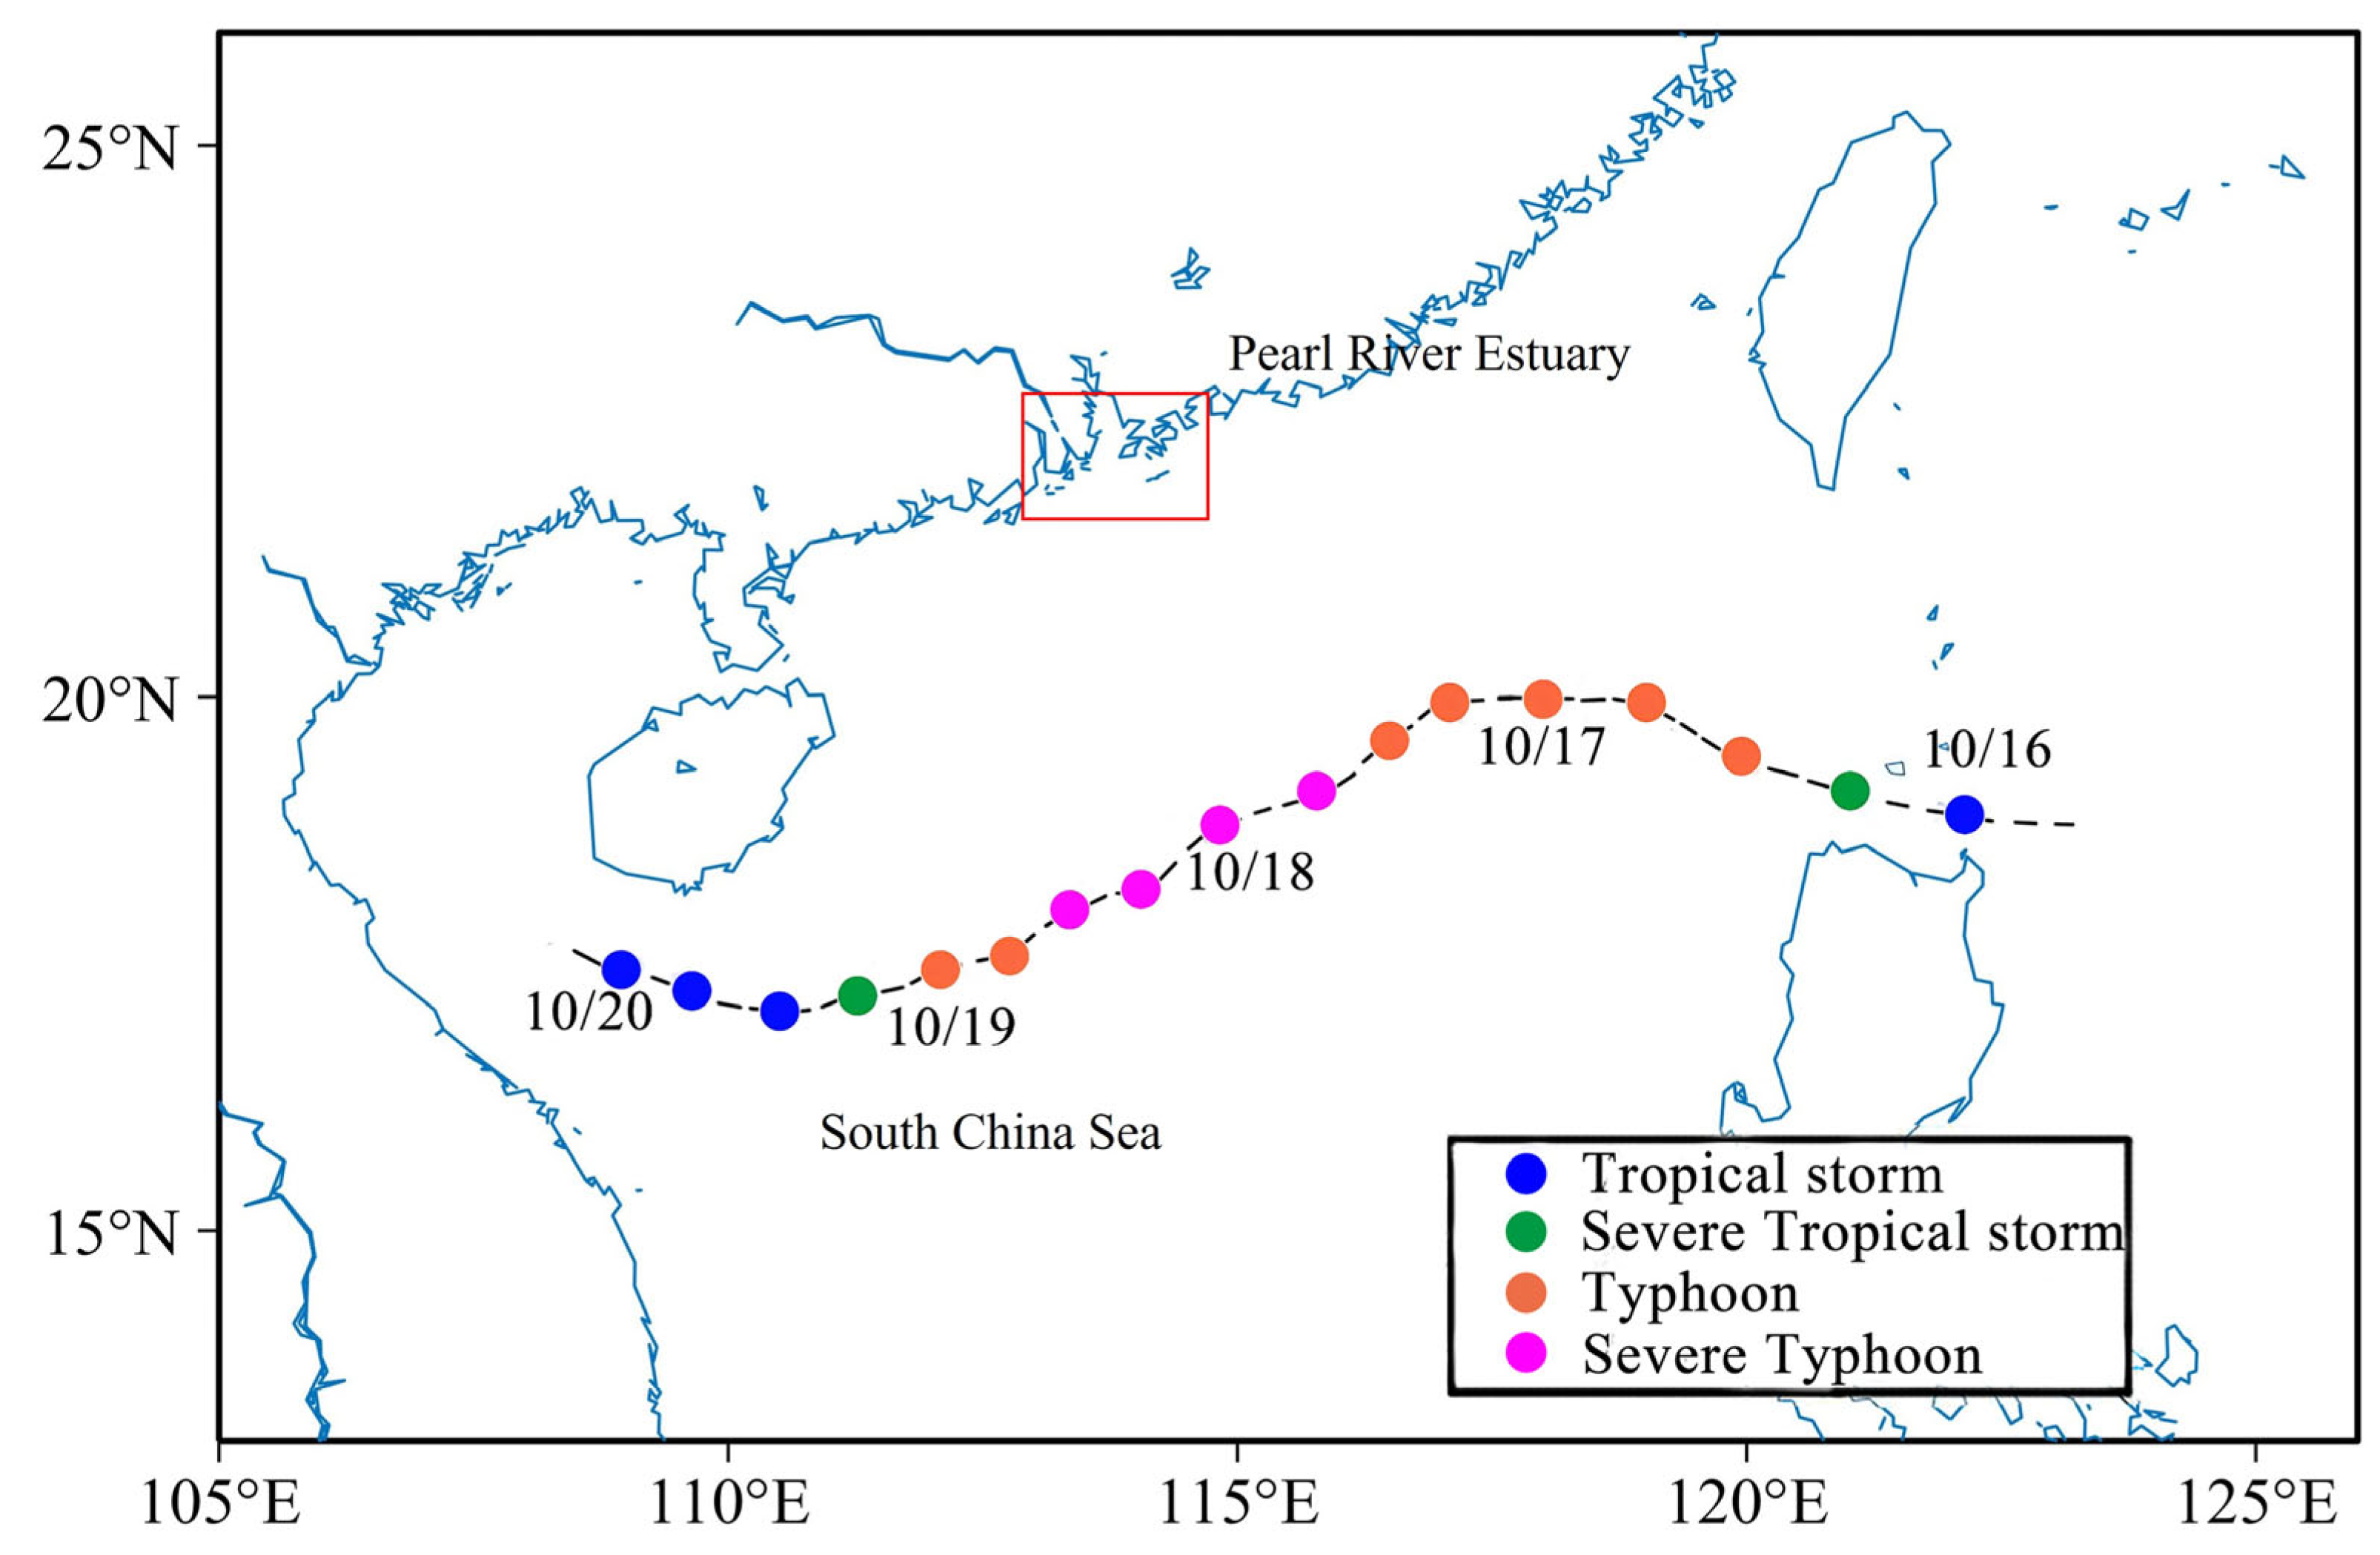
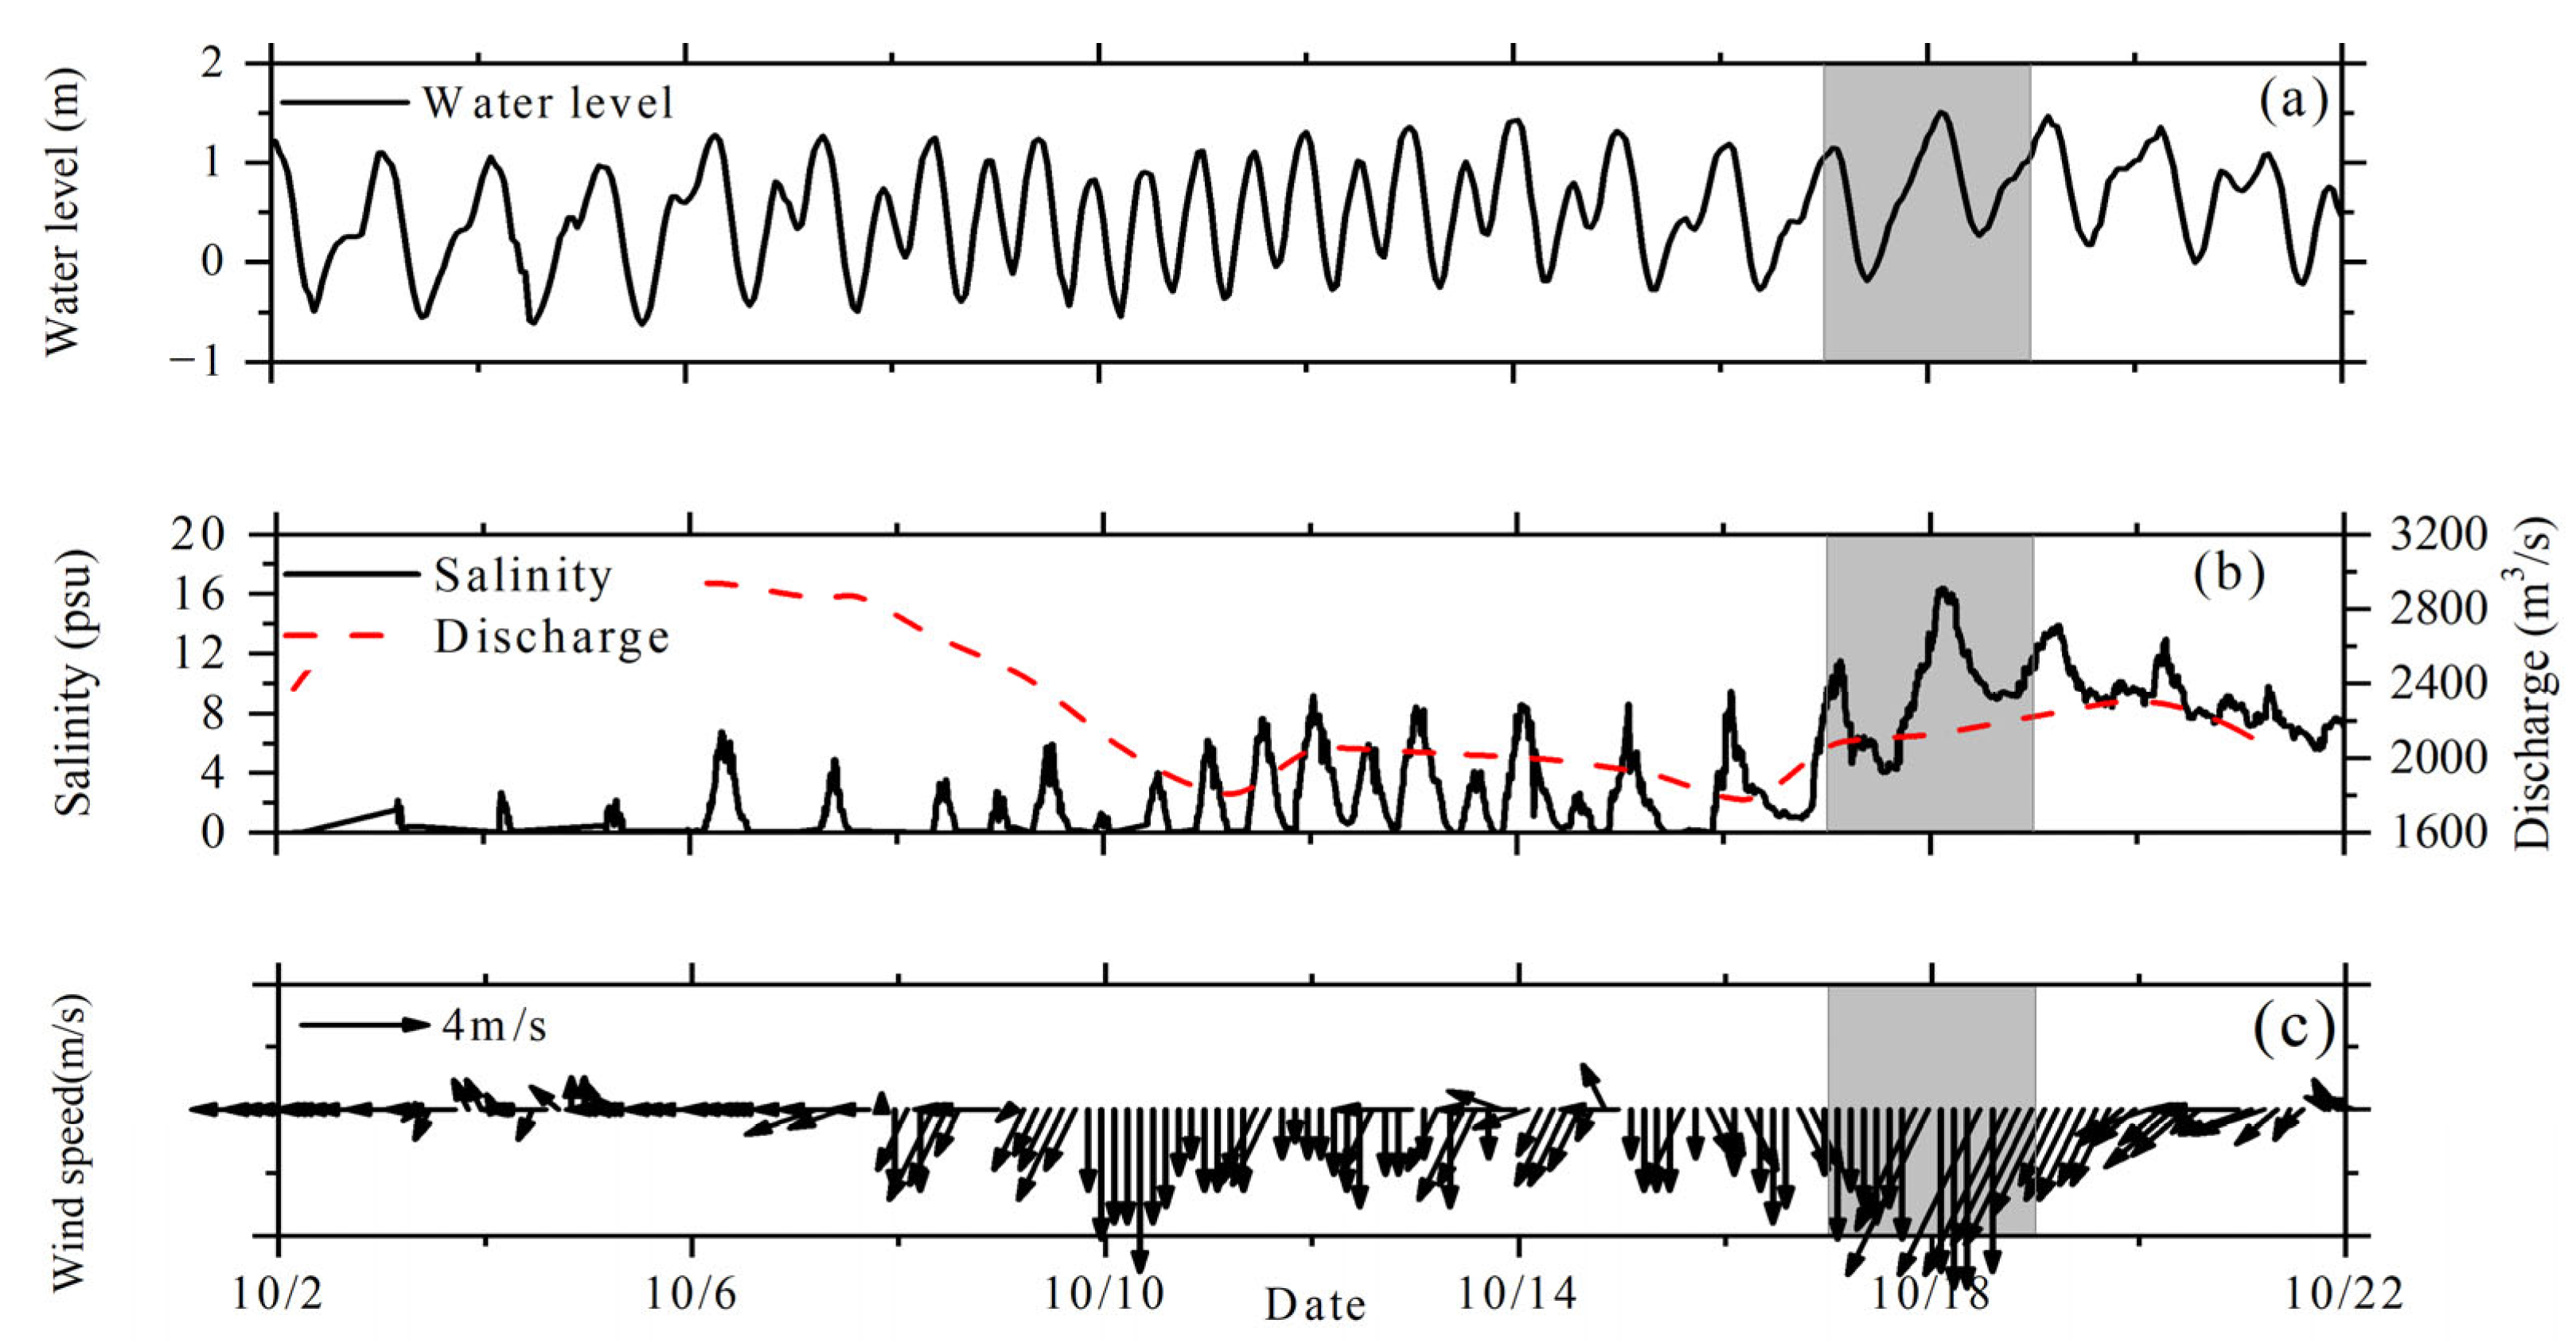
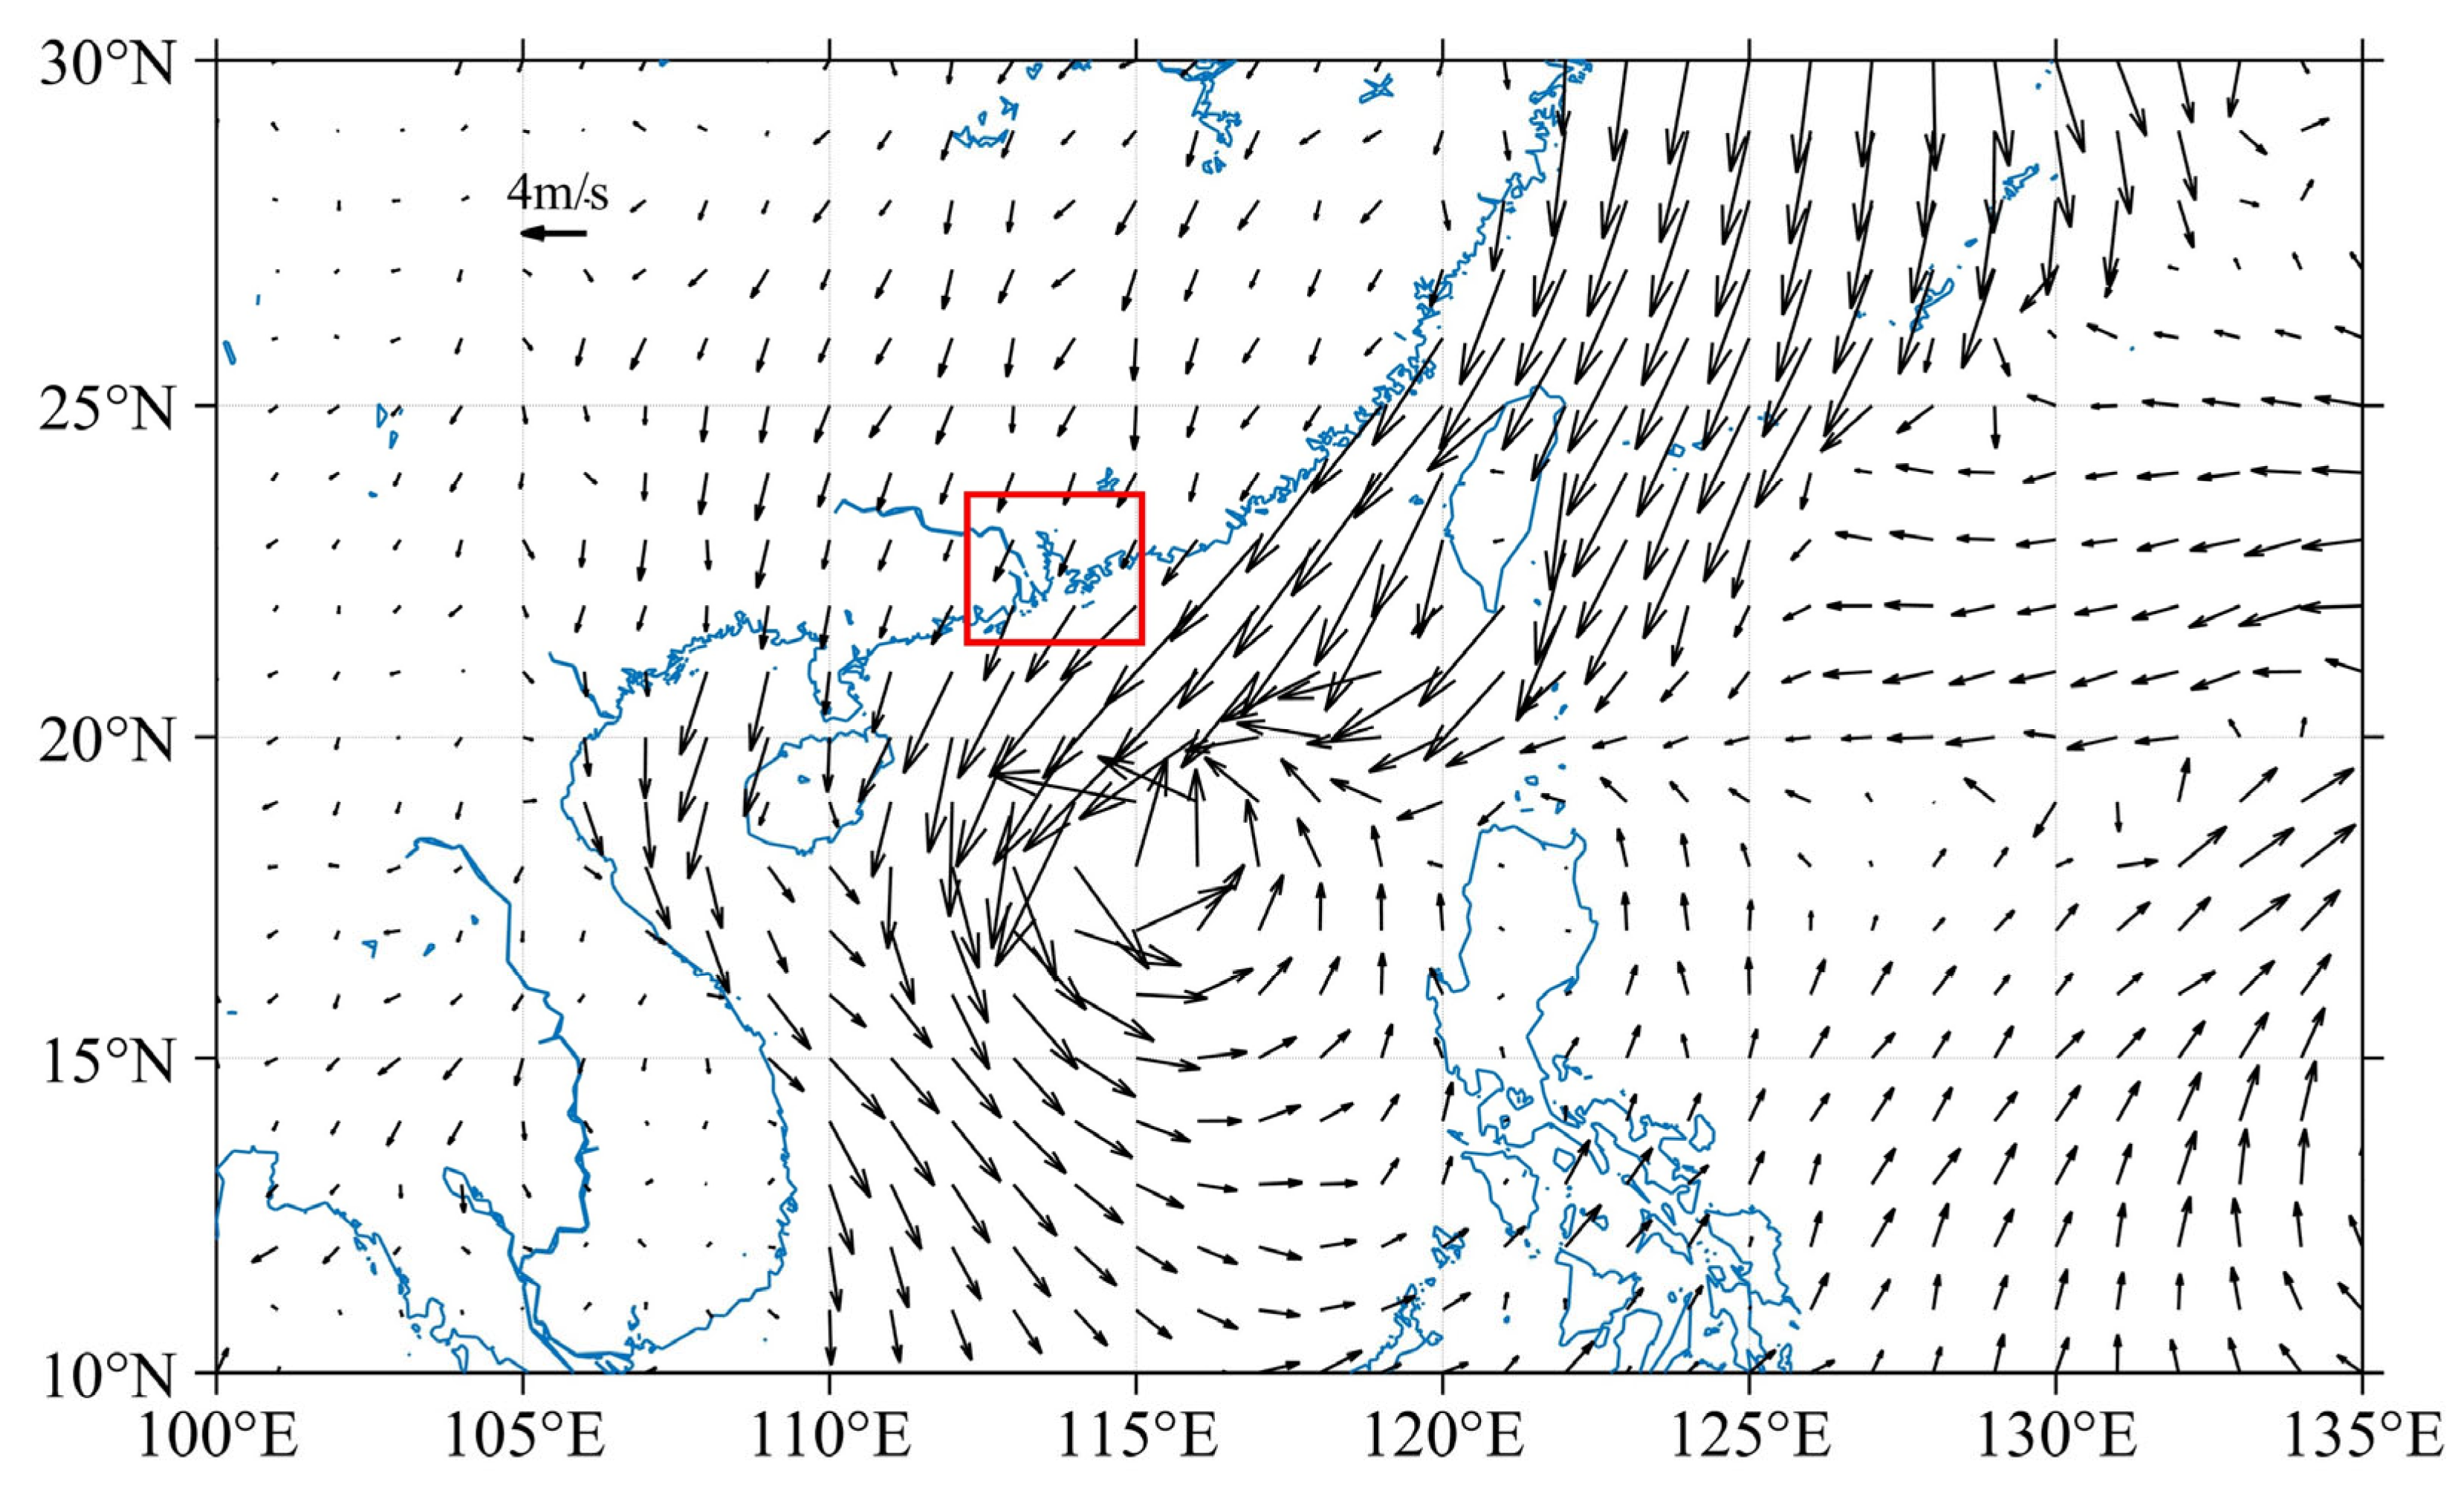
2.1. Study Area and Data

The Pearl River Estuary stands as one of China’s largest estuaries and is located in one of the most developed regions in the country. The Pearl River Delta, within this estuary, takes the form of a river-type delta characterized by an extensive river network. The upstream runoff is primarily sourced from three major river systems: the West, the North, and the East rivers. These rivers intersect and give rise to eight radial tributaries that ultimately flow into the South China Sea through eight distinct mouths. These mouths include Humen, Jiaomen, Hongqimen, Hengmen, Modaomen, Jitimen, Hutiaomen, and Yamen (refer to Figure 1a). Among these outlets, Modaomen serves as the primary discharge point for the West River, often recognized as the primary stem of the Pearl River. It contributes significantly, accounting for 28.3% of the total freshwater discharge from the Pearl River Delta into the sea. The Modaomen Estuary exhibits a semidiurnal mixed tide pattern and features a microtidal regime, with an average annual tidal range of 0.86 m at the Denglongshan station [27].
In this study, we gathered time series data for water levels and salinity from four monitoring stations situated along the Modaomen Estuary. The data for the lower and middle estuary stations were sourced from the Zhongshan Water Resource Management Bureau. These four stations, progressing from downstream to upstream, are Dachongkou, Denglongshan, Majiao, and Xihe, as visually represented in Figure 1b. The total water flux through the Modaomen outlet is primarily derived from two main sources: the West River and the North River. The river discharge data used in this paper was collected at upstream stations, specifically Gaoyao for the West River, Shijiao for the North River, and Boluo for the East River. These datasets were obtained from the official databases of the Guangdong Province Hydrology Bureau and the Pearl Hydrology Bureau under the River Conservancy Commission. Wind data were sourced from the hourly data of ERA5, which is the fifth-generation ECMWF atmospheric reanalysis of global climate [28]. Additionally, the natural wind conditions in the Modaomen area during Typhoon Nesat were analyzed using measured data from the Taipa Meteorological Station. This station is located at the outlet of the Hongwan Waterway, a tributary of Modaomen. Given its geographical proximity, the wind conditions at this location can be considered representative of the wind conditions experienced in the Modaomen Estuary.
Typhoon Nesat underwent a notable transformation in October 2022. It initially emerged as a tropical depression on 15 October over the Northwest Pacific Ocean and gradually gained strength while moving westward. By 17 October, it had been upgraded to a typhoon, and on 18 October, it further intensified, reaching the status of a severe typhoon. Subsequently, on 19 October, it weakened into a tropical storm and gradually dissipated. The track of the cyclone near the estuary can be observed in Figure 2. In Figure 3a, we can see that the influence of Typhoon Nesat resulted in a significant increase in water levels during the neap tide period from 17 to 19 October, coinciding with the typhoon’s passage. On the morning of 18 October, the storm surge and astronomical high tide heights combined, leading to the highest tidal level at Denglongshan station reaching 1.51 m.
As of October 2022, the Pearl River Basin had transitioned into the dry season, marked by a continued decrease in precipitation. Upstream runoff discharge fluctuated between 1500 and 3000 m3/s. However, during the passage of Typhoon Nesat on 18 October, the river discharge of the West River dropped to 2290 m3/s, nearly 50% lower than levels observed during the same period in previous years (refer to Figure 3b). Starting on 1 October, with the ongoing reduction in upstream water flow in the West River, the salinity at Denglongshan station steadily increased. On 18 October, influenced by Typhoon Nesat, in addition to the strong winds, a substantial volume of saltwater from the open sea entered the river, resulting in a sudden increase in salinity. In October 2022, the prevailing wind direction in the Pearl River Estuary was primarily northerly, including NWN (Northwest-North), NW (Northwest), NNE (North-Northeast), NE (Northeast), and N (North), accounting for approximately 89.4% of the wind patterns. As depicted in Figure 3c, wind speeds during non-typhoon periods ranged from 2 to 6 m/s. However, due to the influence of Typhoon Nesat, the maximum wind speed increased to 11 m/s. The persistent northward strong winds may exert significant effects on water flow and salt transport, leading to alterations in water salinity [29].

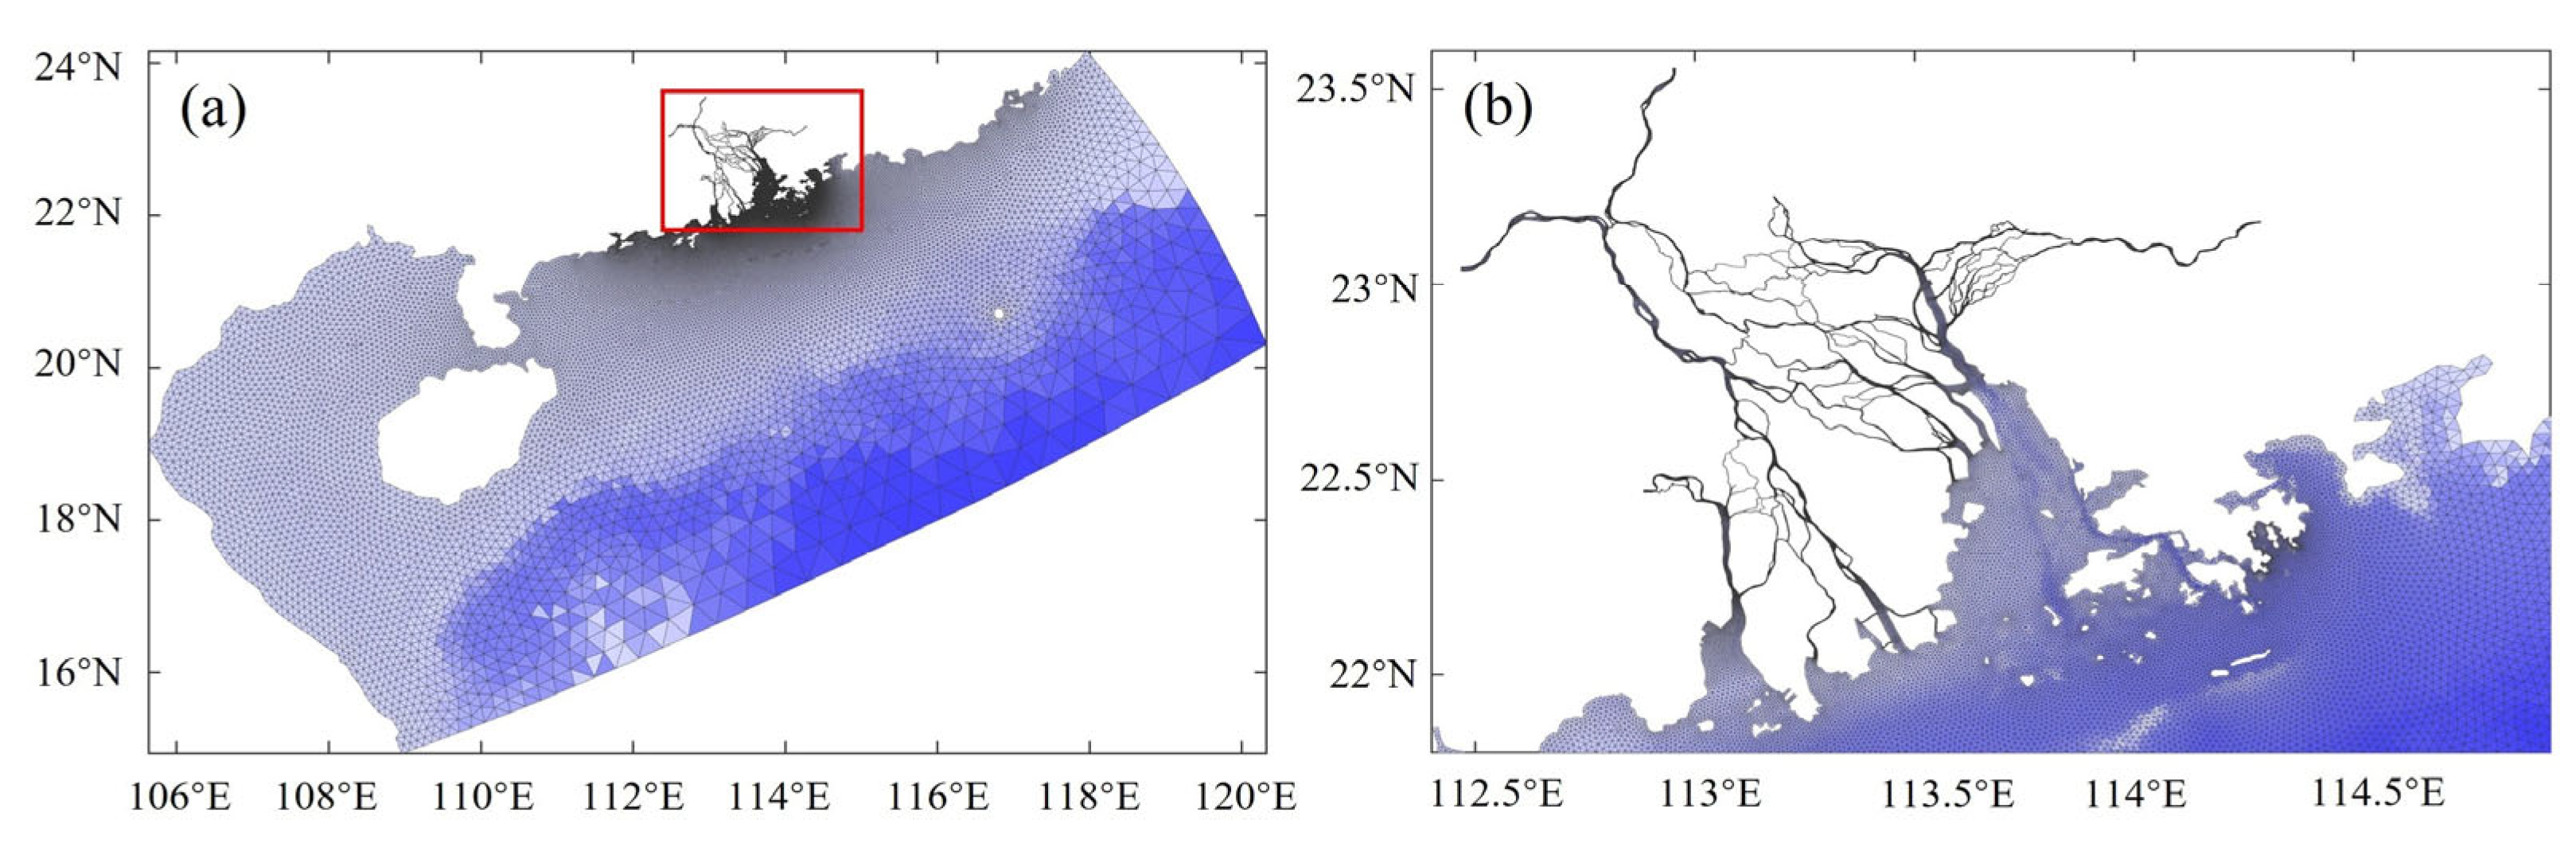
2.2. The Model and the Simulations

The three-dimensional baroclinic model of the Modaomen Estuary was developed using SCHISM, the Semi-implicit Cross-scale Hydroscience Integrated System Model [30]. SCHISM is a cross-scale modeling system based on an unstructured grid that employs an accurate semi-implicit finite element/finite volume method along with a Eulerian-Lagrangian algorithm to solve the Navier-Stokes equations. A higher-order scheme is implemented for momentum advection, incorporating the ELAD filter to manage excess mass through an iterative smoother. The model provides a highly flexible vertical grid system that z grid, sigma grid, and Localized Sigma Coordinates with Shaved Cells (LSC2) are available to implement. This system significantly reduces pressure gradient errors by maintaining a much milder coordinate slope compared to terrain-following coordinates. Furthermore, the horizontal viscosity scheme is tailored to be less dissipative in the eddying regime, aiming to effectively filter out spurious inertial modes while minimizing excessive dissipation. This approach alleviates the stability constraints of the model, enabling the execution of complex numerical simulations.
The model’s spatial coverage encompasses the northern region of the South China Sea, as depicted in Figure 4, featuring grid resolutions spanning from 20 m to 500 m. The bathymetry of nearshore regions and river channels was determined using nautical charts provided by the Navigation Guarantee Department of the Chinese Navy Headquarters and cruise data. Concurrently, the Etopo1 Global Relief Model dataset, featuring a 1 arc-minute resolution, was utilized to map the bathymetry beyond the continental shelves. The upstream flow boundary of the model is defined at specific stations, including Gaoyang, Shijiao, Shizu, Boluo, and Laoyagang, located in the upper reaches of the West River, North River, Tanjiang River, East River, and Liuxi River, respectively (as shown in Figure 1a). The upstream boundary conditions are based on measured flow data, while the offshore boundary conditions are derived from TPXO for tidal-level information [31]. Salinity at the offshore boundary is set to 35 practical salinity units (psu), and the initial salinity field is established by running the model to a state of equilibrium. The model simulations were performed from 1 August to 25 October 2022, and a two-month spin-up phase was implemented to attain a quasi-equilibrium state.
To investigate Modaomen’s response to Typhoon Nesat, we conducted a total of eleven simulations, each with specific configurations, as outlined in Table 1. Here is an overview of each case. Case 1: Analysis under realistic typhoon winds during October 2022. Case 2: Designed to isolate the effect of wind, simulating a scenario similar to Case 1 but without wind forcing. Case 3 to Case 8: These cases were established to assess the response of saline water intrusion to the combined impacts of runoff and typhoons under varying river discharge conditions. Case 9 to Case 11: These experiments aimed to simulate the response under the typhoon during different tidal conditions, including spring tide, intermediate tide, and neap tide. These scenarios are similar to Case 1 but incorporate larger tidal influences. These simulations were essential for examining Modaomen’s dynamic response to Typhoon Nesat under a range of conditions and helped to differentiate the individual effects of wind, river discharge, and tides.

3. Results

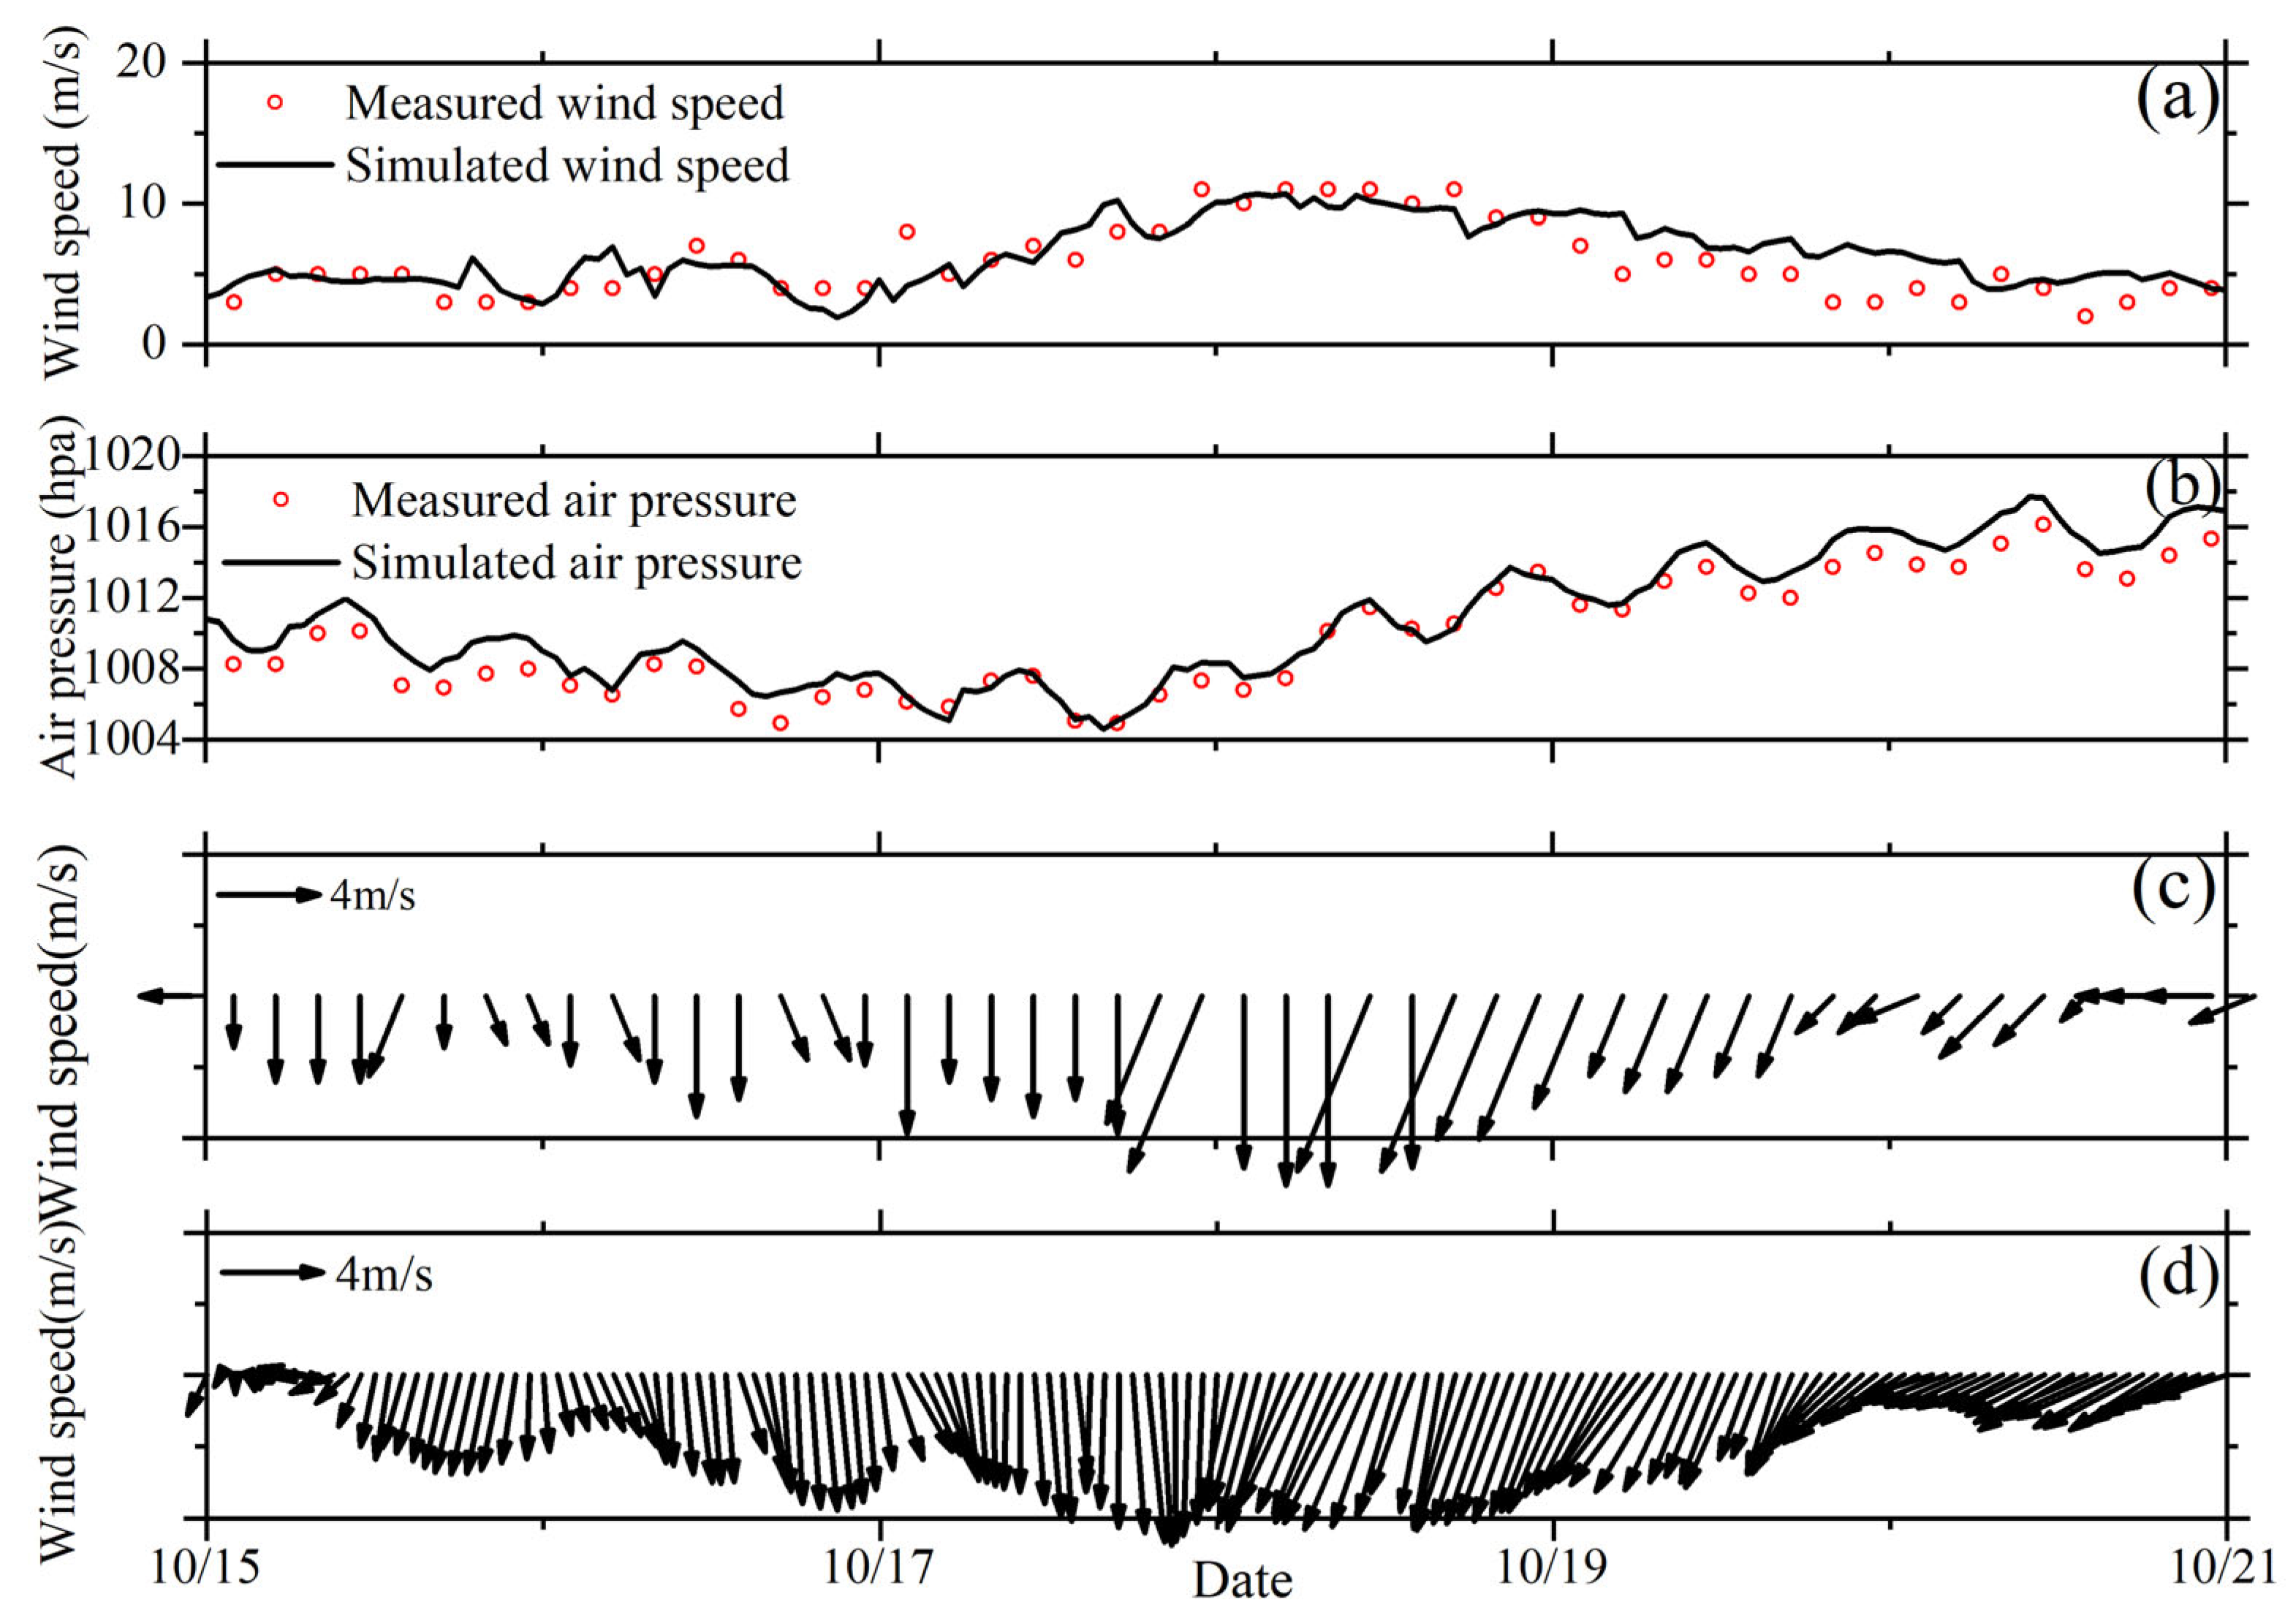
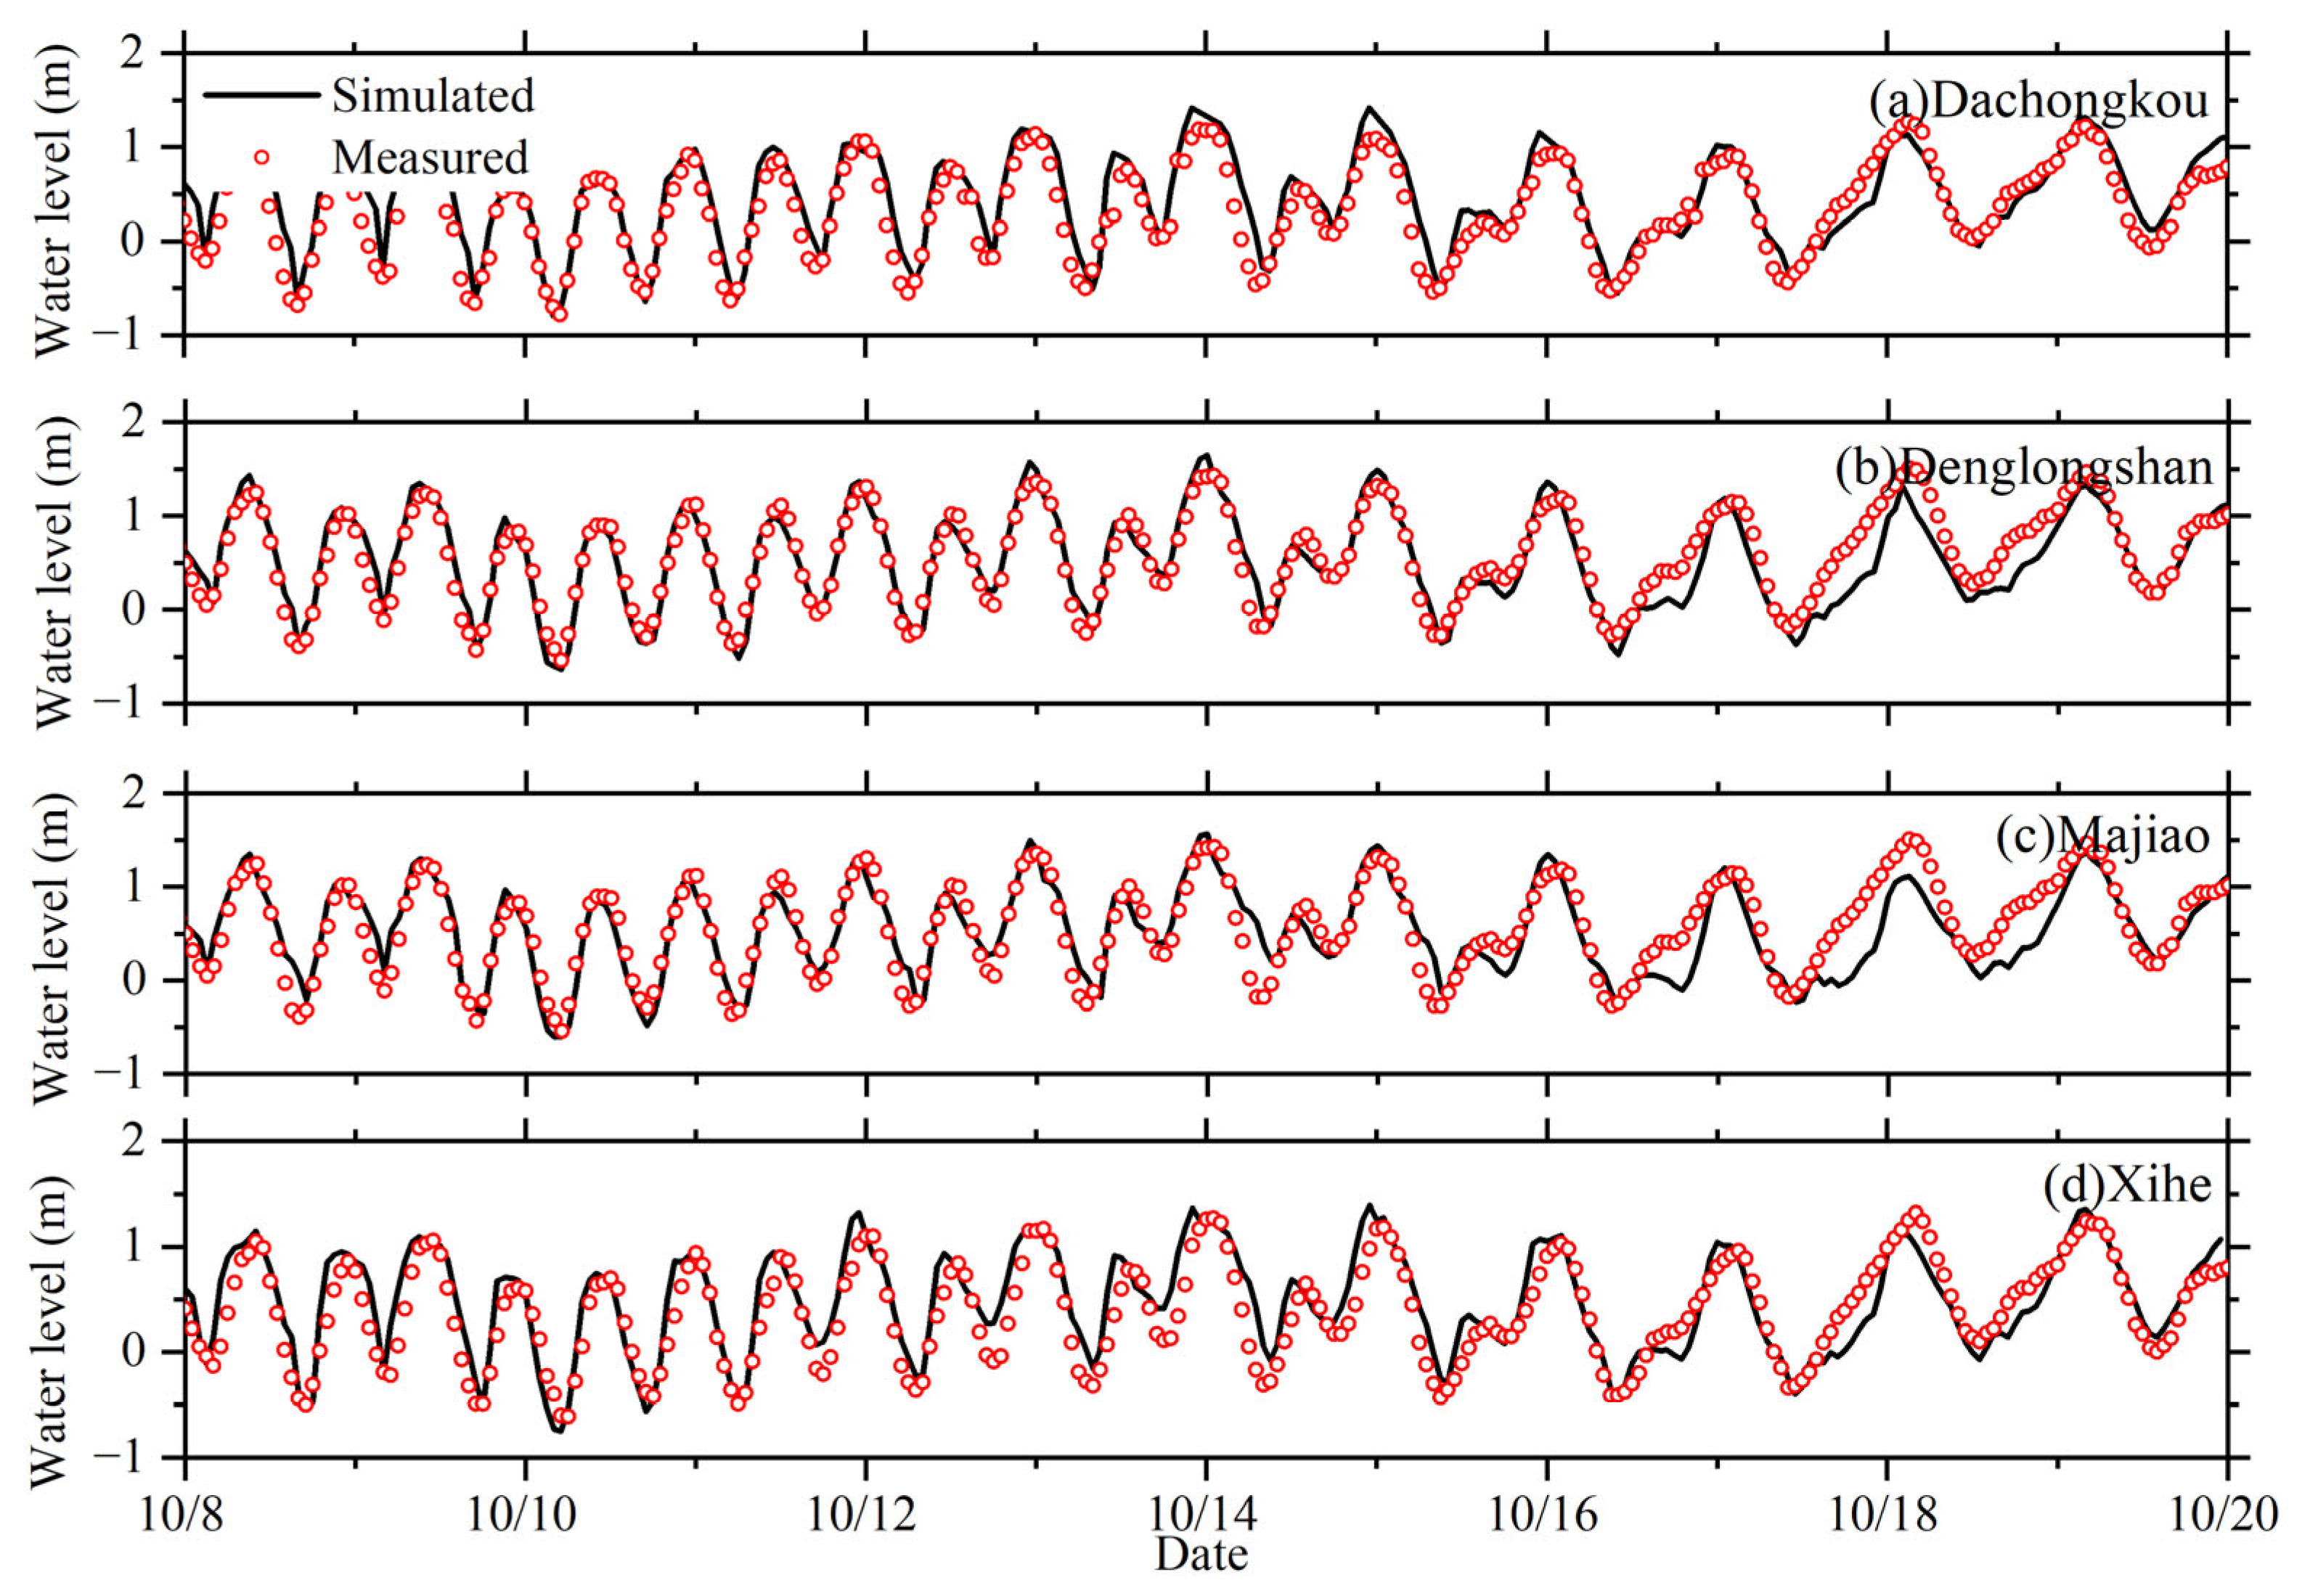
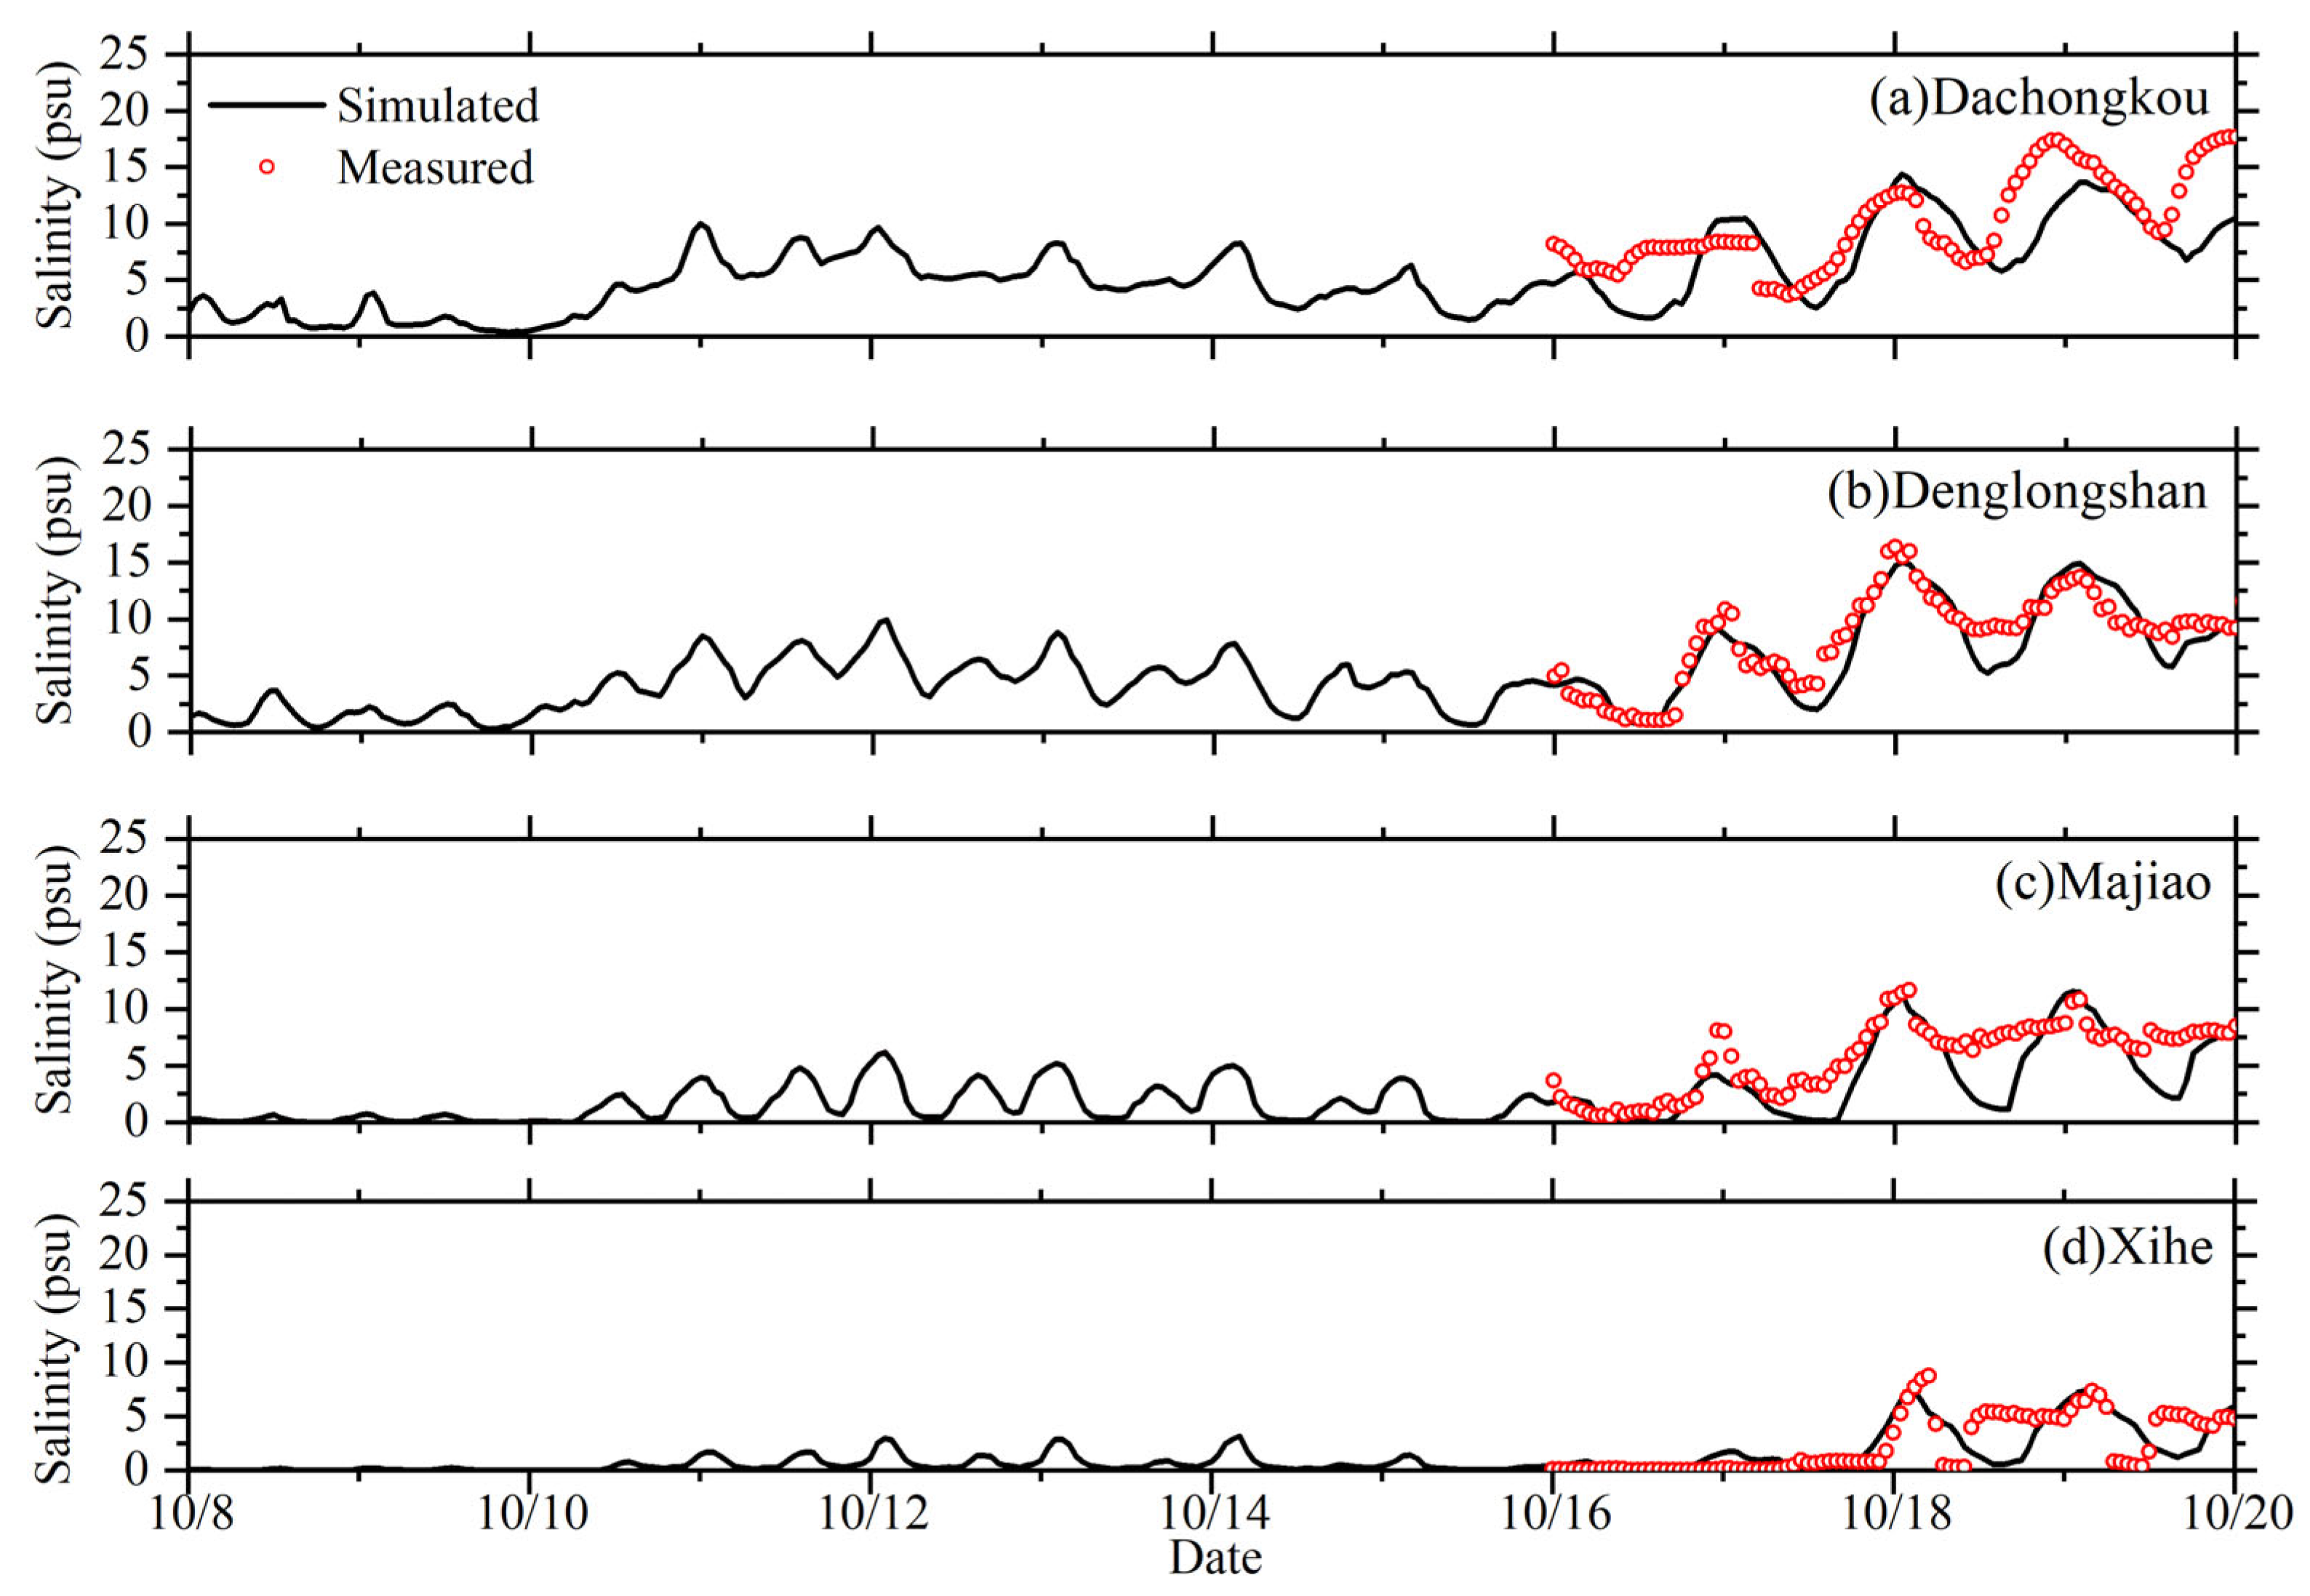
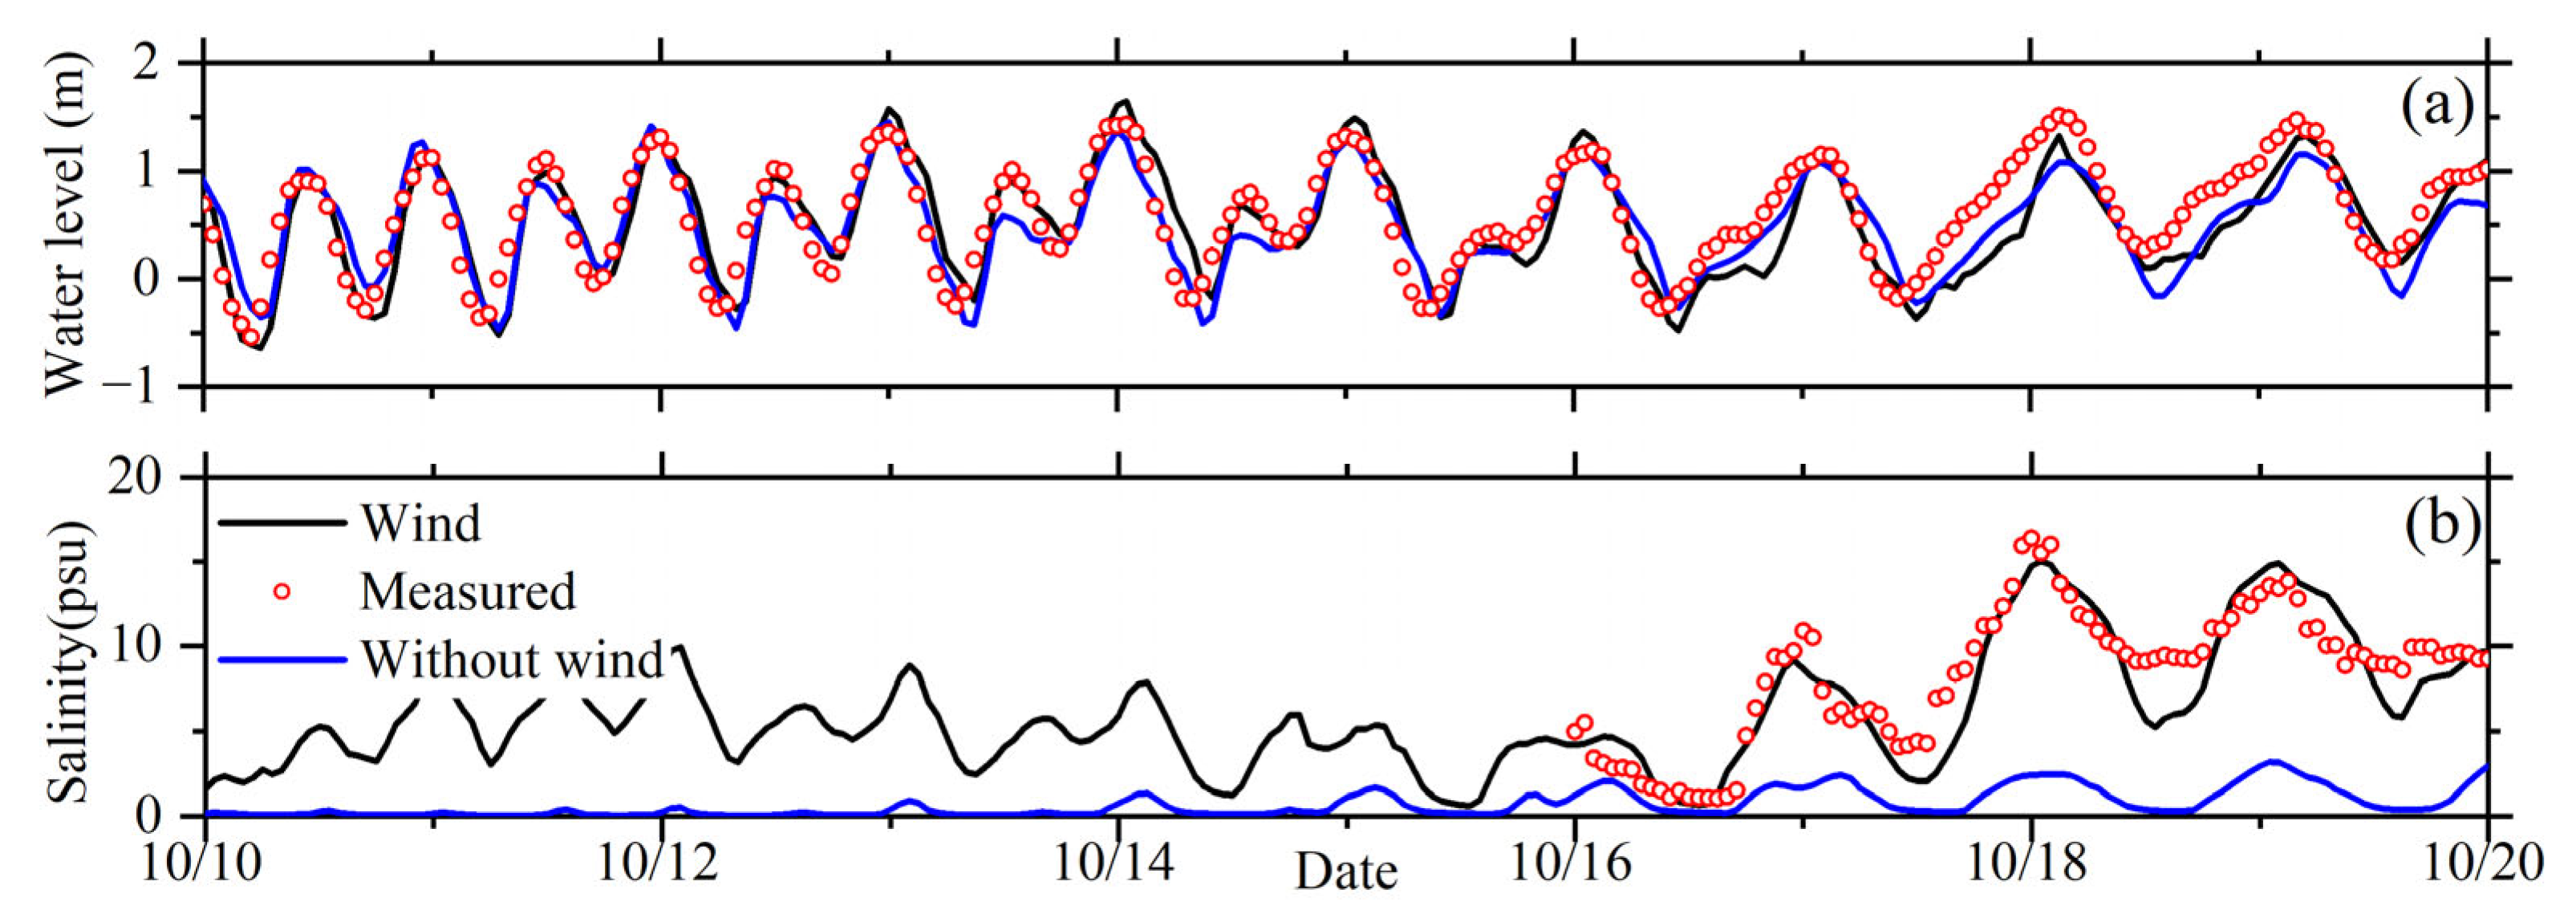
3.1. Model Validation

Utilizing wind data from ERA5, we simulated the wind field associated with Typhoon Nesat in 2022, as illustrated in Figure 5. The simulation covered a spatial range from 10° N to 30° N and 100° E to 135° E. To validate the accuracy of the simulation, we compared the wind direction, wind speed, and air pressure with measured data from the Taipa meteorological station in Macao. This verification process ensured the reliability of the simulated wind field data.
The comparison between the calculated and measured values of wind speed and air pressure at Taipa station is depicted in Figure 6a,b. To evaluate the simulation’s accuracy, we employed the predictive skill score (SS) as an indicator. The SS value measures how well the simulated values align with the observed values [32]. It is defined as follows:
SS = 1 i = 1 n ( X mod X obs ) 2 i = 1 n ( X mod X ¯ obs ) 2
where Xmod represents the calculated value by the model, Xobs represents the observed value, and X ¯ obs is the average of the observed values. The evaluation criteria are as follows: SS < 0.20 is considered unqualified; 0.20 ≤ SS < 0.50 is considered qualified; 0.50 ≤ SS ≤ 0.65 is considered good; and SS > 0.65 is considered excellent. For the calculated SS values for wind speed and air pressure using ERA5 data, they are 0.75 and 0.95, respectively. These results indicate that the verification of wind speed and air pressure during the typhoon period was excellent. As a result, this study ultimately selects ERA5 wind field data as the boundary input condition for the typhoon meteorological field at the sea surface to construct a numerical model of salt intrusion in the Pearl River Estuary.
To further validate the wind speed simulation results within the study area, a comparison was made between the modeled and observed wind vectors at Taipa station (Figure 6c,d). It is important to note that the observed wind speed data are statistically recorded with fixed direction bins (e.g., N, NE), which can lead to slight discontinuities in the results (as seen in Figure 6c), potentially causing minor deviations. However, when comparing the observed and calculated wind vector processes, it is evident that their trends closely align. During the typhoon period, there was a noticeable shift in wind direction, transitioning from north to northeast, accompanied by an almost twofold increase in wind speed. As the typhoon dissipated, the wind direction gradually shifted towards the east, and the wind speed returned to the range of 2–4 m/s. These comparisons indicate that the simulation results are reasonable and can be reliably used for further computations in the salt intrusion model.
The model underwent calibration and validation processes using measured data for water level and surface salinity during Typhoon Nesat. The locations of the measurement stations for water level and salinity are indicated in Figure 1a. Figure 7 and Figure 8 illustrate the time series of water level and surface salinity at Dachongkou, Denglongshan, Majiao, and Xihe stations for the period from 8 to 18 October 2022. In these figures, the black lines represent the values calculated by the model, while the red circles represent the measured values.
The accuracy of the model calculations was assessed using two key statistical indicators: the root mean square error (RMSE) and the skill score (SS). These indicators help gauge the quality of the model’s performance. The RMSE measures the average deviation between simulated results and observed data and is expressed as follows:
RMSE = ( X obs X mod ) 2 N
where Xmod and Xobs represent the simulated and observed values, respectively, and N is the number of observations. A smaller RMSE indicates a higher level of accuracy in the model’s predictions. The RMSE and SS values for each validation station are presented in Table 2, summarizing the simulation accuracy for both water level and salinity in the Modaomen Estuary.
The results of the verification process indicate that the model’s calculated water level data yielded good accuracy, with RMSE values less than 0.3 and SS values greater than 0.7 for all four stations. Regarding salinity, the SS value at Dachongkou was rated as good, while the SS values for the other stations were all rated as excellent. It is important to note that Dachongkou station, situated near the offshore area, features complex waterway topography influenced by offshore dynamics. This complexity makes it challenging to accurately simulate salinity at this location. However, in the broader context, the model’s simulation results are highly satisfactory and effectively capture changes in water flow and salinity in the Modaomen Estuary. These results can be confidently utilized for subsequent data processing and analysis.

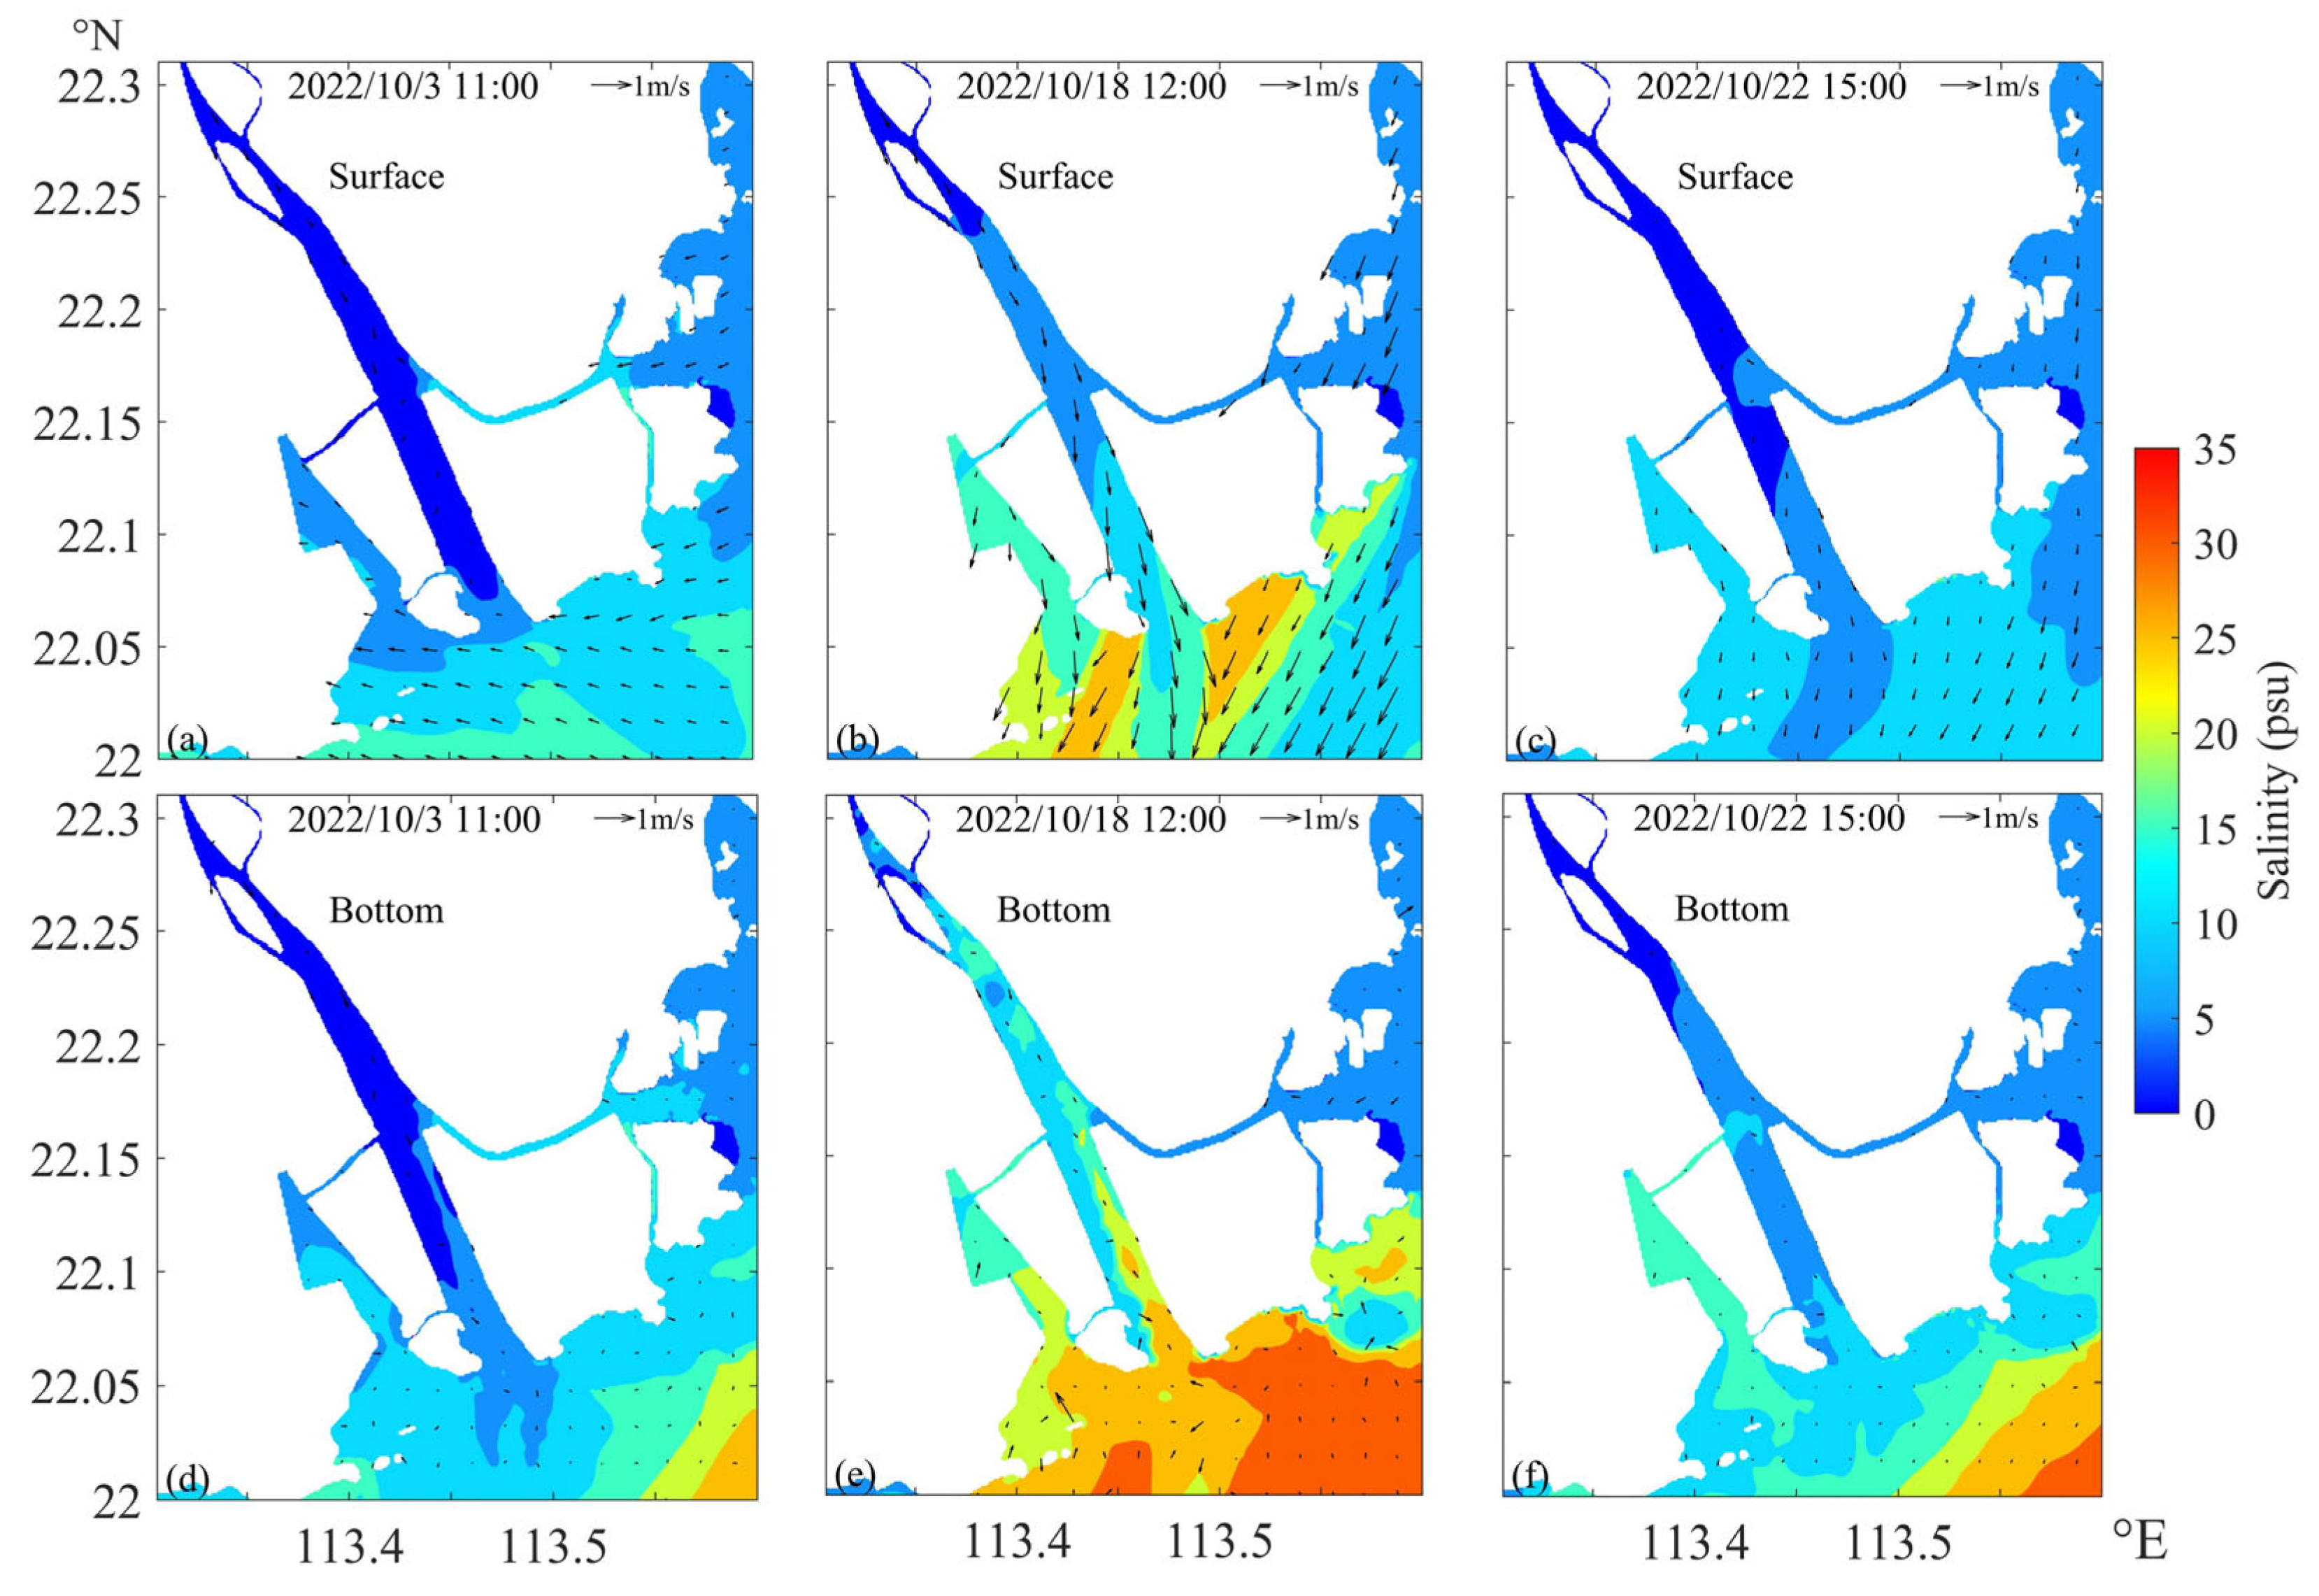
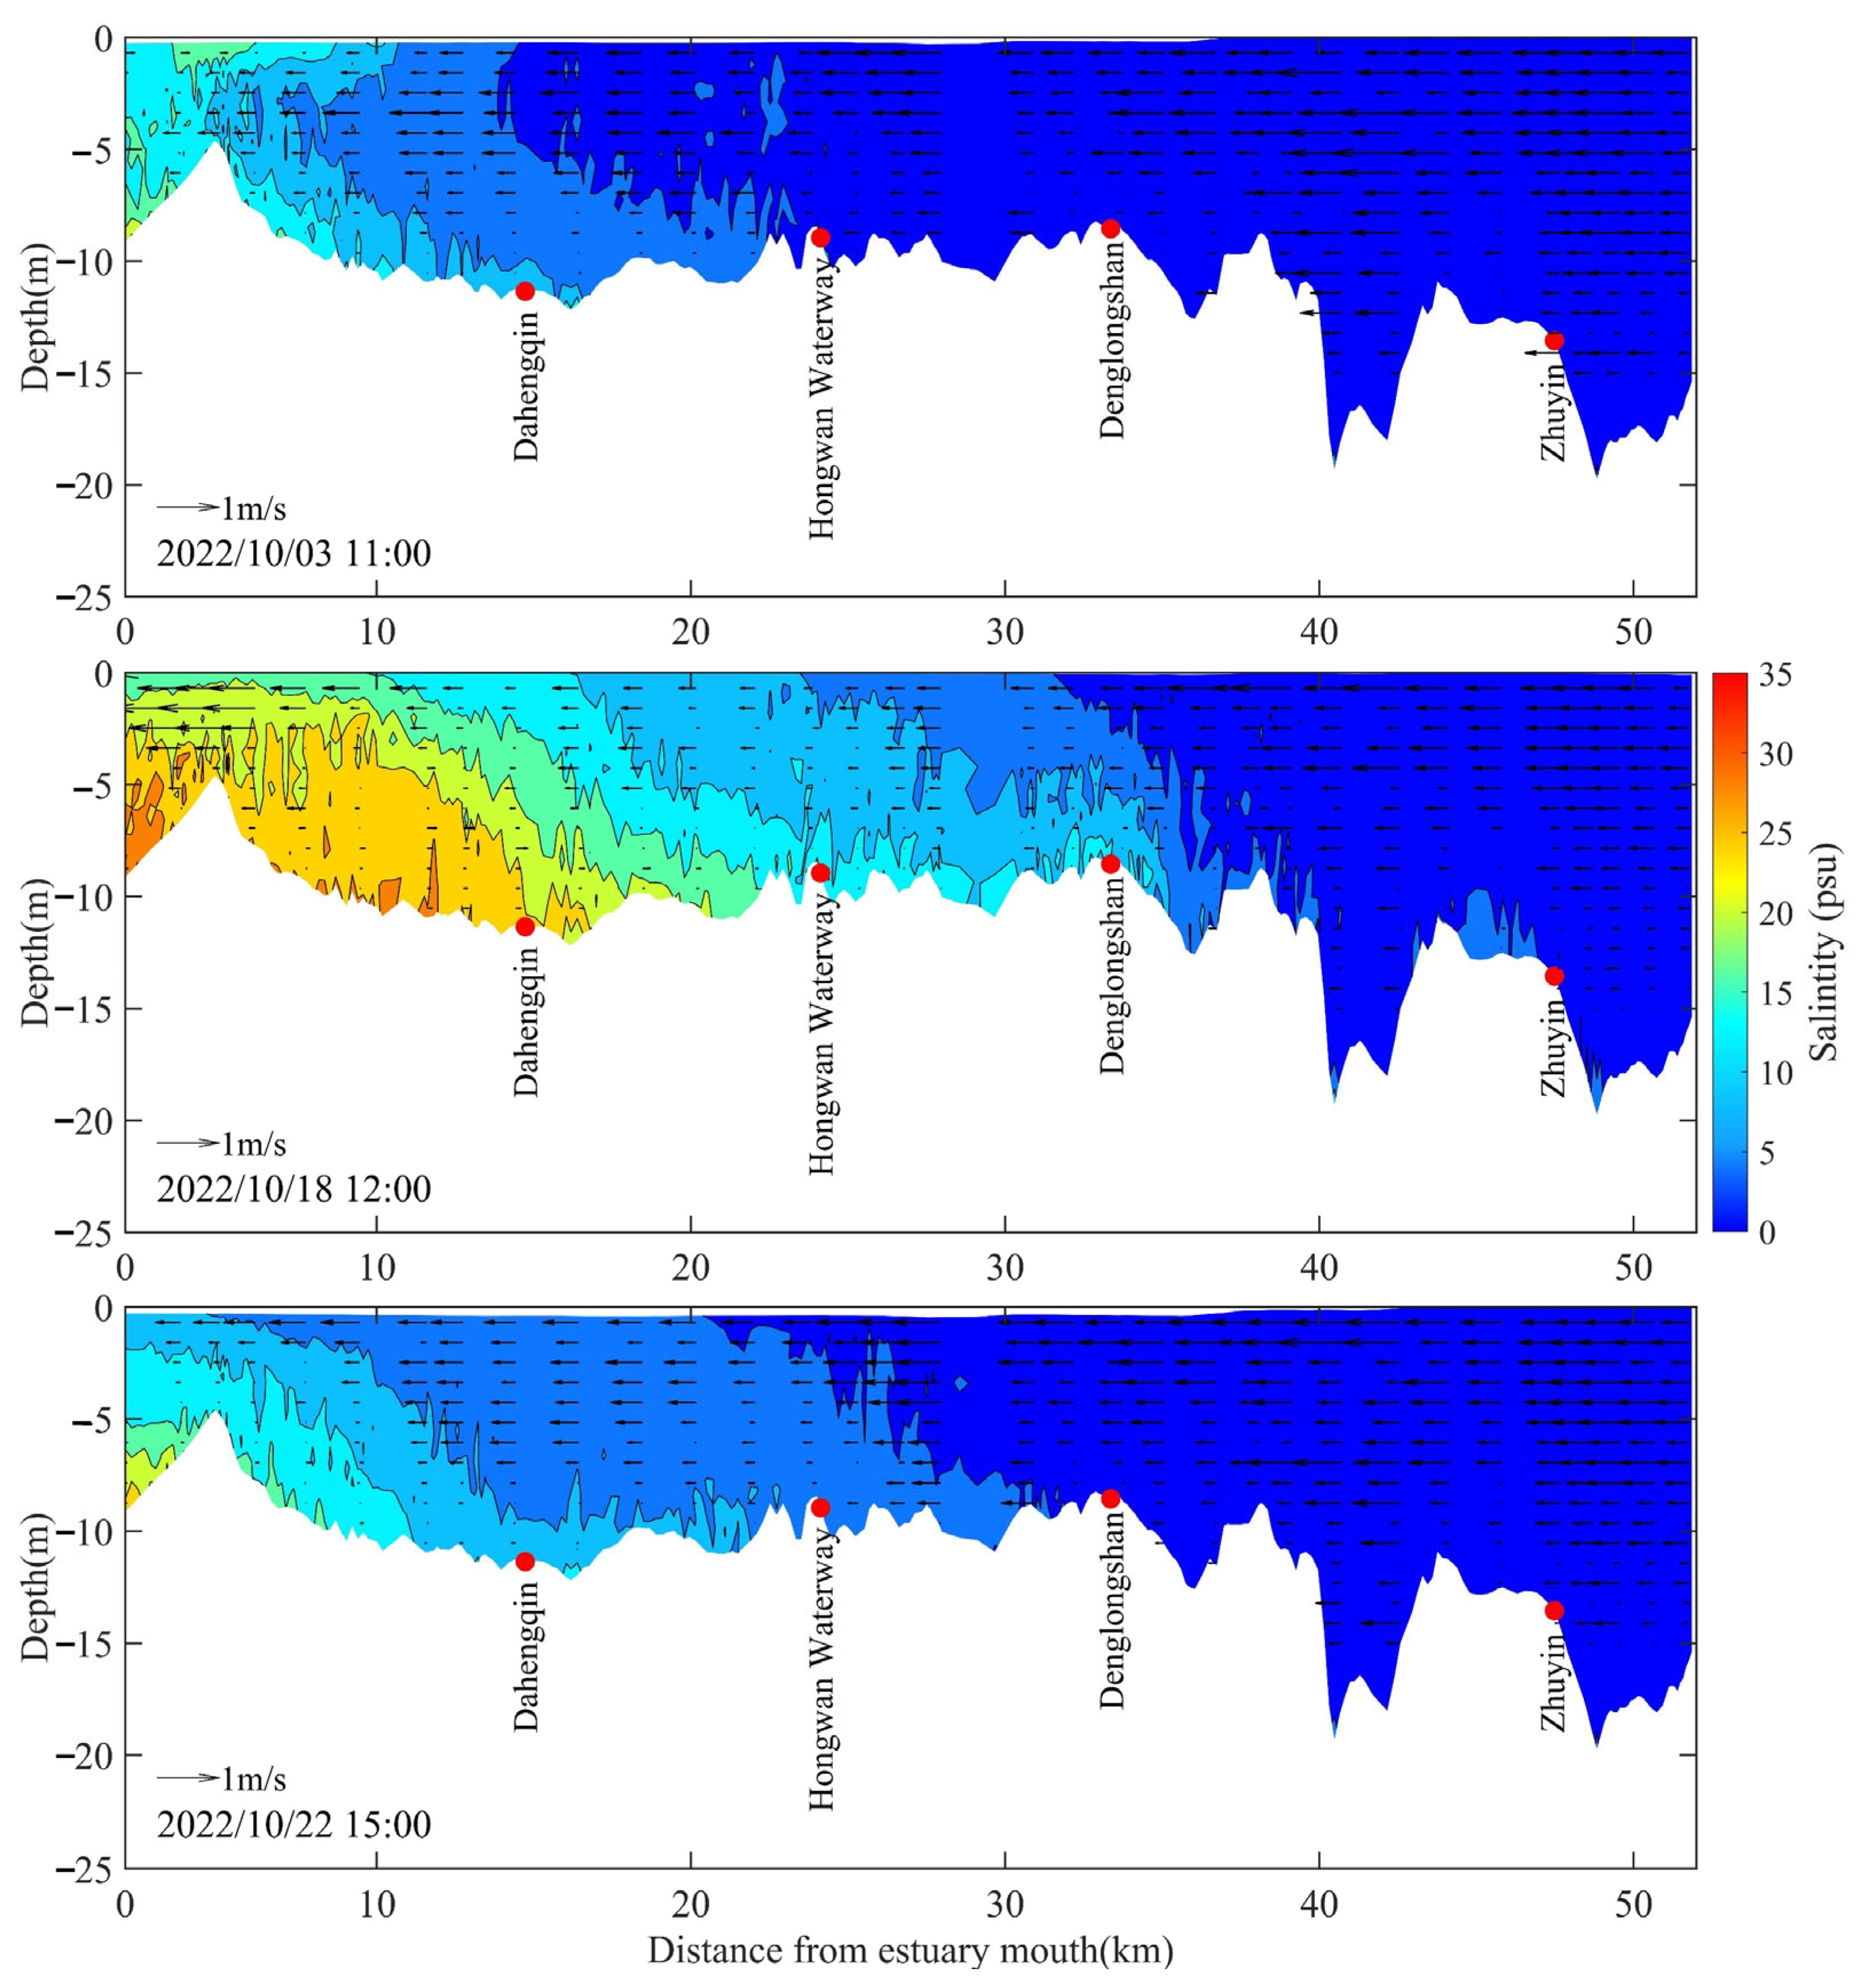
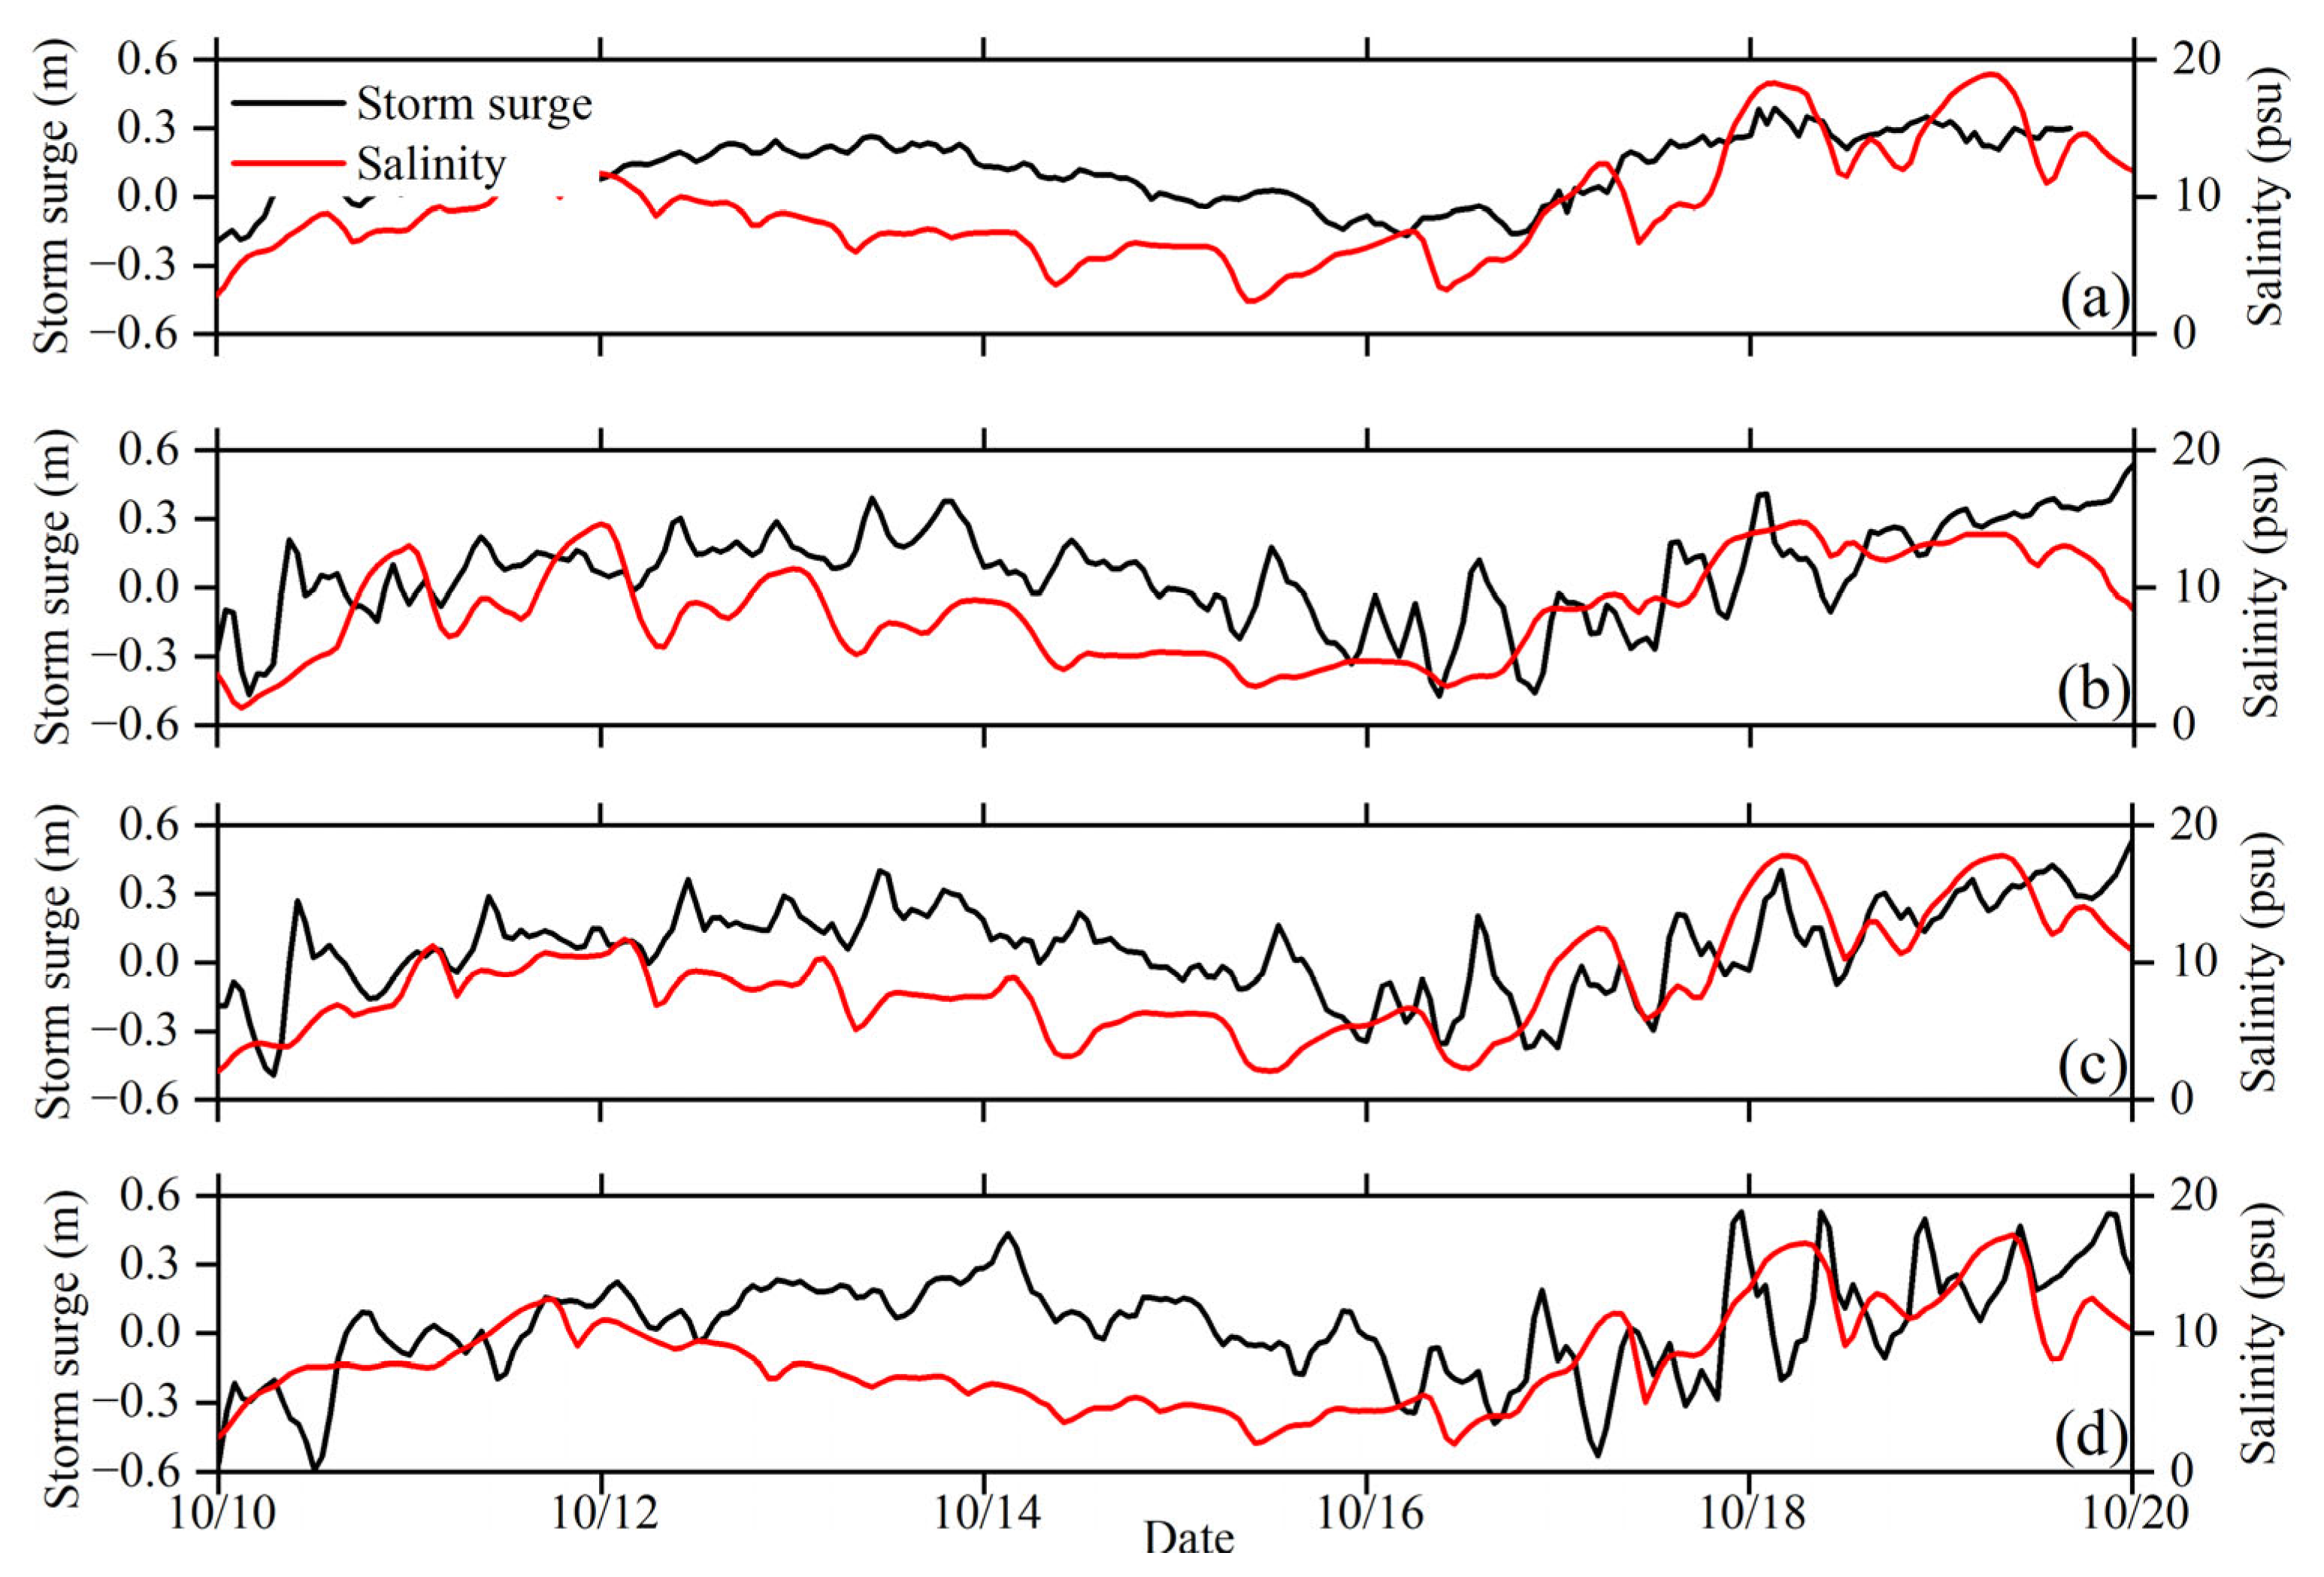
3.2. Modeled Salinity under Typhoon Nesat

Indeed, during a typhoon, the strong cyclonic wind stress can bring about significant alterations to the marine environment. In areas prone to frequent typhoon activity, like the Modaomen Estuary, the changes in dynamic salinity characteristics induced by powerful typhoons are of great importance. These changes cannot be overlooked. During a typhoon period, several key factors, such as sea surface elevation, wind direction, and wind speed, experience substantial differences compared to normal weather conditions. These variations lead to distinct hydrodynamic and salinity distribution patterns. In the specific case of Typhoon Nesat from 17 to 19 October 2022, the wind speed exhibited a rapid increase, with a majority of the time recording wind speeds exceeding 7 m/s and reaching a maximum of 11 m/s on 18 October. The prevailing wind direction was predominantly from the northeast. Consequently, during this period, wind stress had a pronounced impact on the Modaomen waterway, contributing to significant changes in the local hydrodynamics and salinity distribution. These changes play a crucial role in understanding and managing the environmental effects of typhoons in the region.
As a result, the analysis of the distribution patterns of the planar flow field and salinity field in the Modaomen Estuary before, during, and after a typhoon is conducted to gain insights into the response process of the Modaomen waterway to powerful typhoons. Furthermore, this analysis allows for a preliminary exploration of the influence of typhoons on the exchange flow and salinity structure. This exploration involves comparing the variation characteristics of surface and bottom layer flow velocity and salinity. Such investigations are vital for comprehending the dynamic effects of typhoons on this estuarine environment and its associated changes in hydrodynamics and salinity.
Figure 9a,d illustrates the conditions in the Modaomen waterway at 11:00 on 3 October during a neap tide. During this period, the surface water velocity was higher than the bottom water velocity. As a result, surface salinity was relatively low and was quickly carried away, while the bottom salinity remained high and increased rapidly. This led to faster salt intrusion in the deep trough on the right side of the waterway, gradually creating a salinity difference with the shallow beach on the left side. The majority of the salt accumulated in the deep trough. Furthermore, due to the asynchronous rise and fall of tides between the branches and the main waterway, the flow velocity in the main waterway was directed towards the sea, while the flow velocity in the branches moved towards the land. Additionally, both the surface and bottom salinities in the branches were higher than in the main waterway. This resulted in the significant transport of salt from the Hongwan waterway to the Modaomen main waterway. These findings depict the intricate dynamics of salt transport and salinity distribution within the Modaomen waterway during a neap tide period.
During the typhoon period, the Modaomen Estuary experienced the effects of a storm surge, leading to a significant increase in water levels. The surface salinity during this period was notably higher than under normal weather conditions, and there was a substantial disparity in salinity between the surface and bottom layers at the estuary’s mouth, as demonstrated in Figure 9b,e. This intensified salt intrusion during the typhoon period. The rise in water level caused a substantial influx of saltwater into the river, resulting in a significant salinity increase in the waterway. By 12:00 on 18 October, during the ebb tide, the bottom salinity concentration at the mouth exceeded 28 psu, greatly surpassing the bottom salinity distribution during the most severe salt intrusion observed before the typhoon. The waterway was significantly impacted by the typhoon, with a substantial difference in salinity between the surface and bottom layers. The upward movement of low-concentration saltwater extended over a considerable distance. Subsequently, after the typhoon, as illustrated in Figure 9c,f, the high-concentration saltwater within the Modaomen waterway gradually receded. The salinity difference between the surface and bottom layers was more pronounced in the middle and upper reaches of the waterway but diminished in the lower reaches. These findings illustrate the complex dynamics of salinity changes during and after a typhoon event in the Modaomen Estuary.
The impact of Typhoon Nesat on the Modaomen waterway was substantial, affecting both the surface and bottom water flow as well as the salinity distribution. The northeasterly wind further intensified the stratification between saltwater and freshwater during the neap tide. Surface water discharge, which was directed towards the sea, further facilitated the transport of brackish bottom water towards the land. This dynamic exacerbated salt intrusion, ultimately leading to the highest levels of salinity observed. The complex interactions of wind, tides, and storm surge played a critical role in shaping the salinity distribution in the Modaomen Estuary during the typhoon event.
To gain a deeper understanding of the influence of Typhoon Nesat on the mixing of salt and freshwater in the Modaomen Estuary, a longitudinal section along the deep trough of the Modaomen waterway, represented by the Section 1 line in Figure 1b, was selected. This section provides insights into the distribution and variation of flow velocity and salinity along the Modaomen longitudinal profile before, during, and after the typhoon. In alignment with the planar distribution characteristics, the study also examined the longitudinal distribution of flow velocity and salinity at corresponding times. Figure 10a–c displays these longitudinal distribution characteristics of flow velocity and salinity for the respective periods: before, during, and after Typhoon Nesat. This analysis aids in uncovering the specific characteristics of Typhoon Nesat’s influence on the interplay between salt and freshwater within the Modaomen Estuary.
Before Typhoon Nesat arrived on 3 October, during a neap tide, the influence of the salinity gradient prompted gravitational circulation in the Modaomen waterway. This circulation involved surface water flowing seaward and bottom water flowing landward, with salinity continuously intruding from the bottom, as shown in Figure 10a. Additionally, the presence of an underwater entrance bar and the weak tide dynamics during the neap tide made it challenging for saltwater to discharge, resulting in its accumulation in the waterway. During Typhoon Nesat’s influence, there was a significant rise in water levels in the offshore area. High-concentration saltwater from the offshore area progressively intruded into the Modaomen waterway, as shown in Figure 10b. This intrusion resulted in a conspicuous difference in salinity between the surface and bottom layers near the estuary’s mouth, forming a saltwater wedge. The saltwater was also impeded by the raised inverted slope topography, causing the accumulation of high-concentration saltwater at the estuary’s mouth. Consequently, salinity levels in the waters near the mouth were high and stratified, giving rise to a large-scale gravitational circulation pattern. After the passage of Typhoon Nesat, at 15:00 on 22 October, the typhoon’s influence had largely dissipated, and the waterway returned to exhibiting flow velocity and salinity distribution characteristics typical of the intermediate tide period after the neap tide under normal weather conditions, as shown in Figure 10c. In this post-typhoon phase, saltwater and freshwater mixed effectively in the middle and upper reaches of the Modaomen waterway, and a distinct salinity gradient persisted outside the mouth due to the influence of the sandbar.
In summary, it is evident that Typhoon Nesat had a substantial impact on salt intrusion and the stratification of saltwater and freshwater in the Modaomen Estuary. A significant volume of saltwater entered the waterway during the typhoon, and it was unable to disperse during the ebb tide. This led to a more pronounced salt-freshwater stratification within the estuary, highlighting the typhoon’s role in intensifying and altering the distribution of salinity in the region.

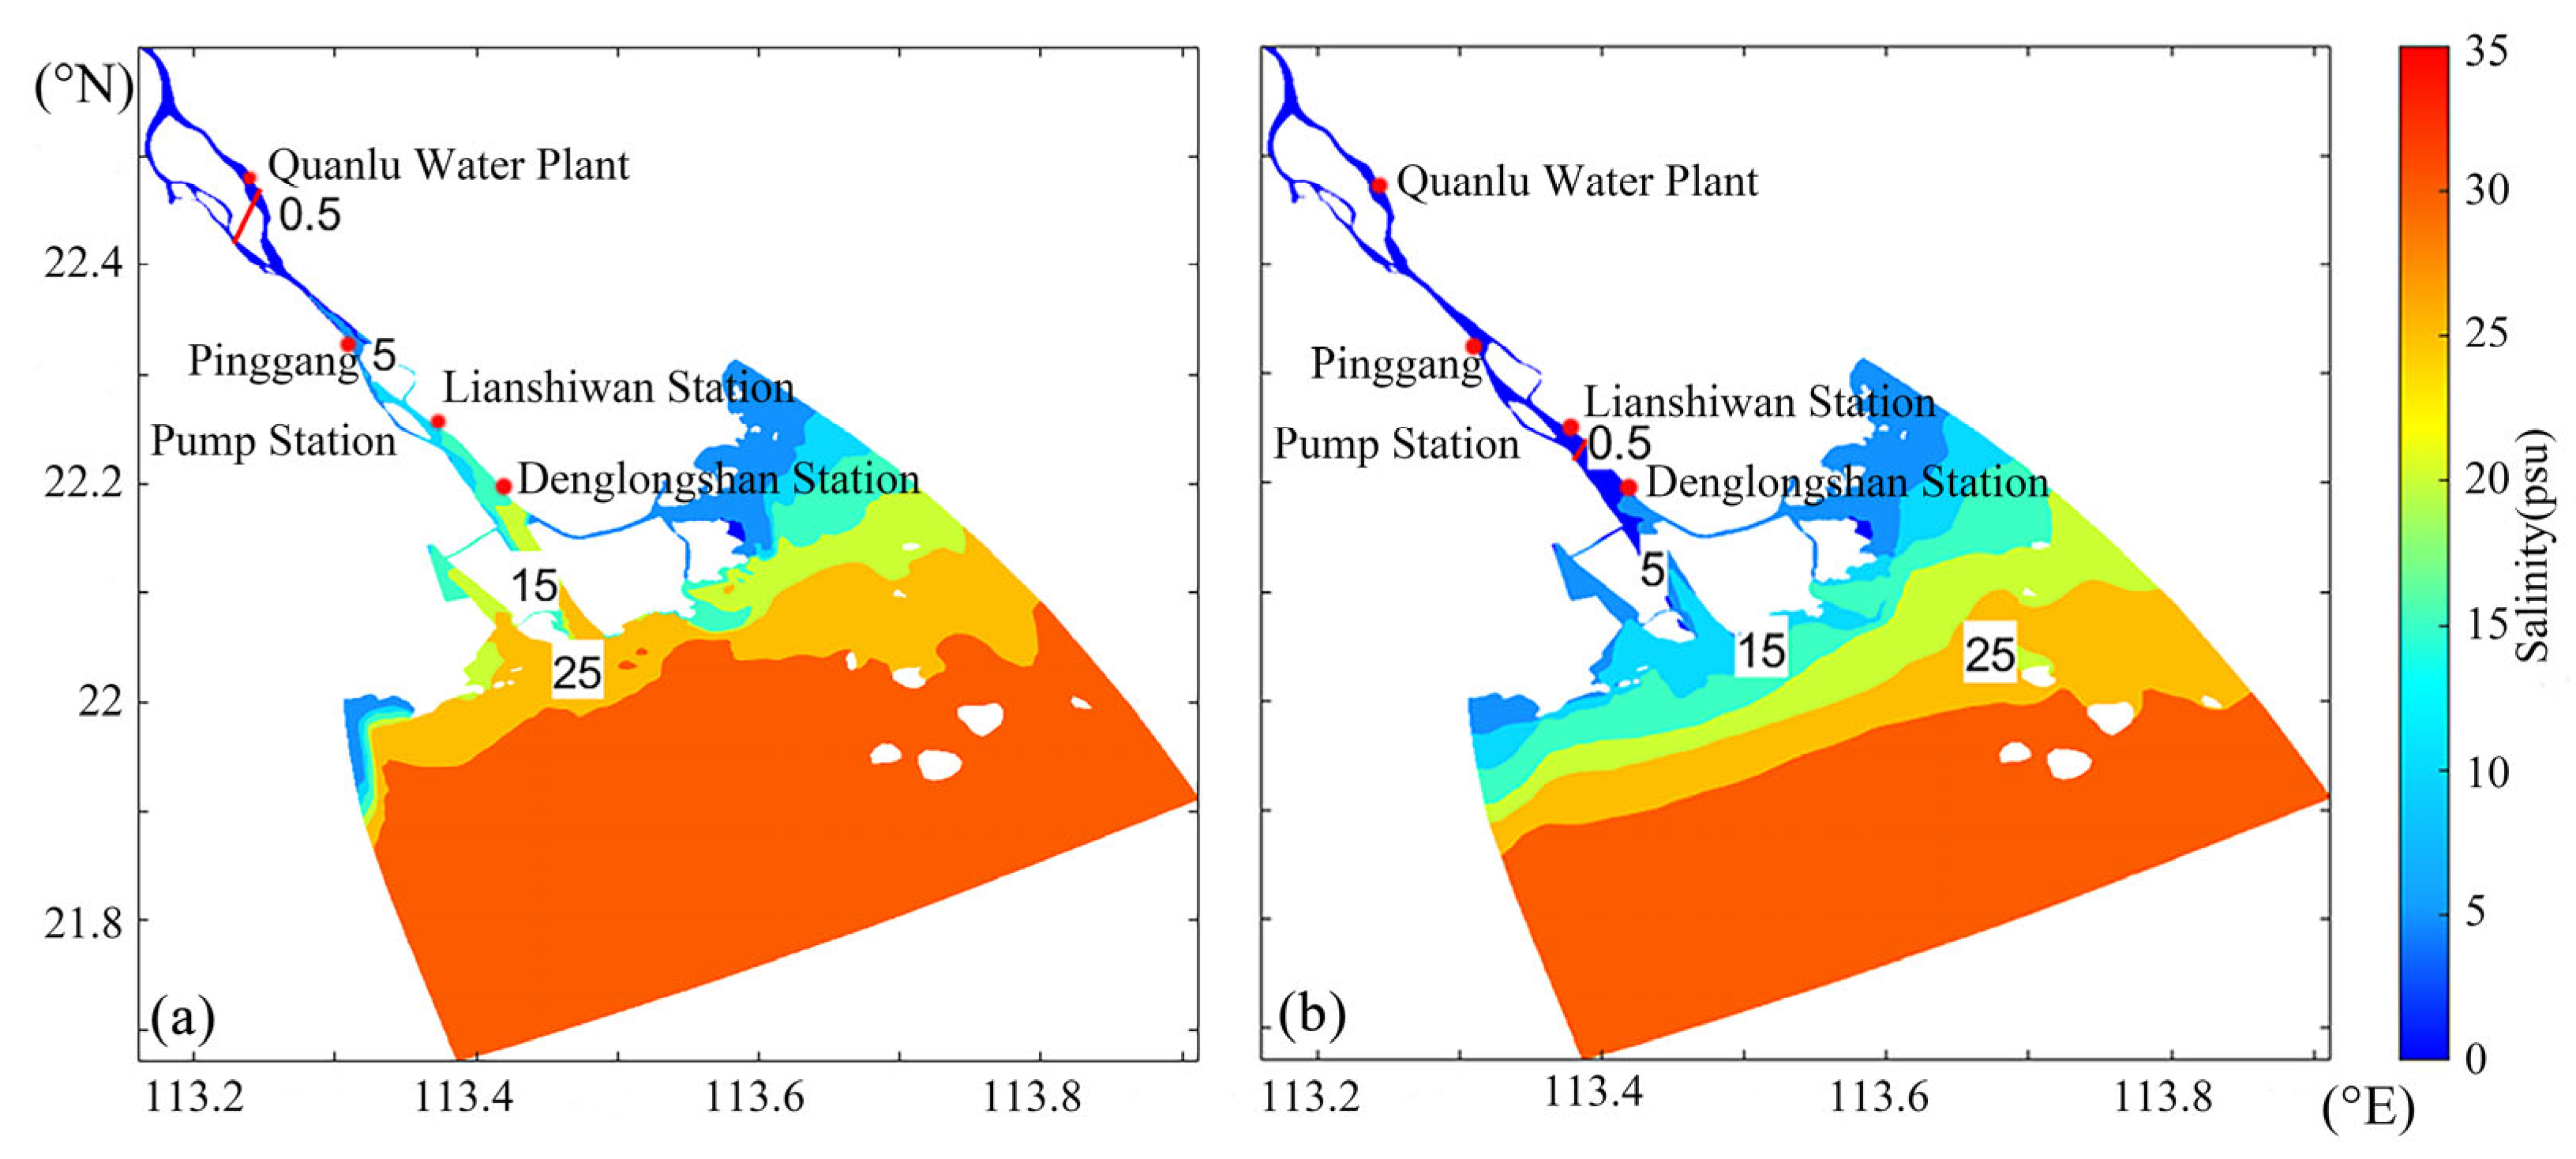
3.3. Impacts of Typhoon Winds on Salt Intrusion

To analyze the response characteristics of flow dynamics and salinity in the Modaomen Estuary to Typhoon Nesat, two different scenario experiments were conducted: one with wind (Case 1) and one without wind (Case 2), as detailed in Table 1. These experiments aimed to simulate the salt intrusion process in the Pearl River Estuary during the typhoon period. During Typhoon Nesat, the wind speed peaked at 11 m/s at 3:00 a.m. on 18 October, and the storm surge in the Modaomen waterway also reached its maximum value of 0.38 m (Figure 11a). The influence of Typhoon Nesat was evident in the significant increase in salinity at Denglongshan station. Salinity values remained around 3–17 psu during the typhoon period, whereas salinity in early October was nearly zero most of the time, with a maximum not exceeding 3 psu if the impact of wind was not considered (see Figure 11b). Both the modeled and observed water levels at Denglongshan station are depicted in Figure 11a. From 17 to 19 October, the tidal ranges at Denglongshan station ranged from approximately 1.3 m to 1.7 m. The modeled water level in Case 1, driven by Typhoon Nesat’s winds, exhibited better agreement with the observations, underlining the model’s ability to capture the typhoon’s effects on water levels in the Modaomen Estuary.
The salinity distribution characteristics in the Modaomen Estuary with and without the influence of wind forcings are compared and analyzed in Figure 12a (Case 1) and Figure 12b (Case 2). In Case 1, under the influence of Typhoon Nesat’s winds, the maximum salinity at Denglongshan station reached 17 psu. Approximately 56 km from the mouth, at the Quanlu Water Plant, the salinity exceeded 0.5 psu, rendering it unsuitable for intake and further treatment, which could potentially affect the domestic water security of the inhabitants (see Figure 12a). In Case 2 (no wind scenario), the maximum salinity at Denglongshan station was 3 psu, and the 0.5 psu isohaline was located near Lianshiwan station, which is 27 km from the mouth. In this scenario, the Pinggang Pump Station upstream was not affected by salt intrusion, and it could extract water as usual. The river discharge effectively prevented saltwater from intruding into the Modaomen waterway. Comparing the results of the two experimental scenarios, it is clear that Typhoon Nesat had a significant impact on salt intrusion in the Modaomen Estuary. The typhoon-induced storm surge caused the saltwater boundary (i.e., the 0.5 psu isohaline) to move upstream by approximately 29 km. Water intakes in Zhuhai city along the waterway were entirely affected and unable to draw water due to the intrusion of high salinity levels caused by the typhoon’s influence.
The water levels and depth-averaged currents on 18 October are depicted in Figure 13a,b. The Pearl River Estuary experiences a regime of mixed tides, with the ebb tide duration longer than the flood tide duration. As the runoff from the West River flows through the Modaomen waterway and reaches the sea, it undergoes a decrease in velocity due to the expansion of the cross-sectional area at the mouth. Consequently, a low-velocity area is formed near the mouth, resulting in water retention. During the typhoon and its associated winds, the landward Ekman transport leads to a sea level rise along the coast, as seen in Figure 13c. A portion of the residual current enters the Modaomen, causing an atypical increase in salinity within the estuary, as observed in Figure 12a. Furthermore, the strong northeastern wind directly impacts the water surface, intensifying the mixing of salt and freshwater. Surface runoff flows out to the sea, facilitating the transport of bottom saltwater toward the land, thereby exacerbating salt intrusion within the estuary.
In summary, the strong cyclonic wind stress induced by typhoons has two significant effects on the Pearl River Estuary, particularly in the Modaomen. Typhoons can cause fluctuations in water levels in the estuary. On the one hand, the interaction of the typhoon winds with the coastal area can lead to a sea level rise (storm surge) in the estuary, which can be influenced by the timing of the tides. These variations in water level can impact the salinity distribution within the estuary. On the other hand, strong northerly winds associated with typhoons enhance vertical mixing and affect the longitudinal transport of salinity. These winds can disrupt the normal flow patterns and lead to the mixing of saltwater and freshwater, which can significantly influence the salinity distribution in the estuary. As a result, typhoons have a notable impact on the salt intrusion in the Modaomen Estuary. They can cause atypical salt intrusion events, leading to changes in the flow field and salinity distribution that should not be disregarded when assessing environmental changes in the estuary.

4. Discussion

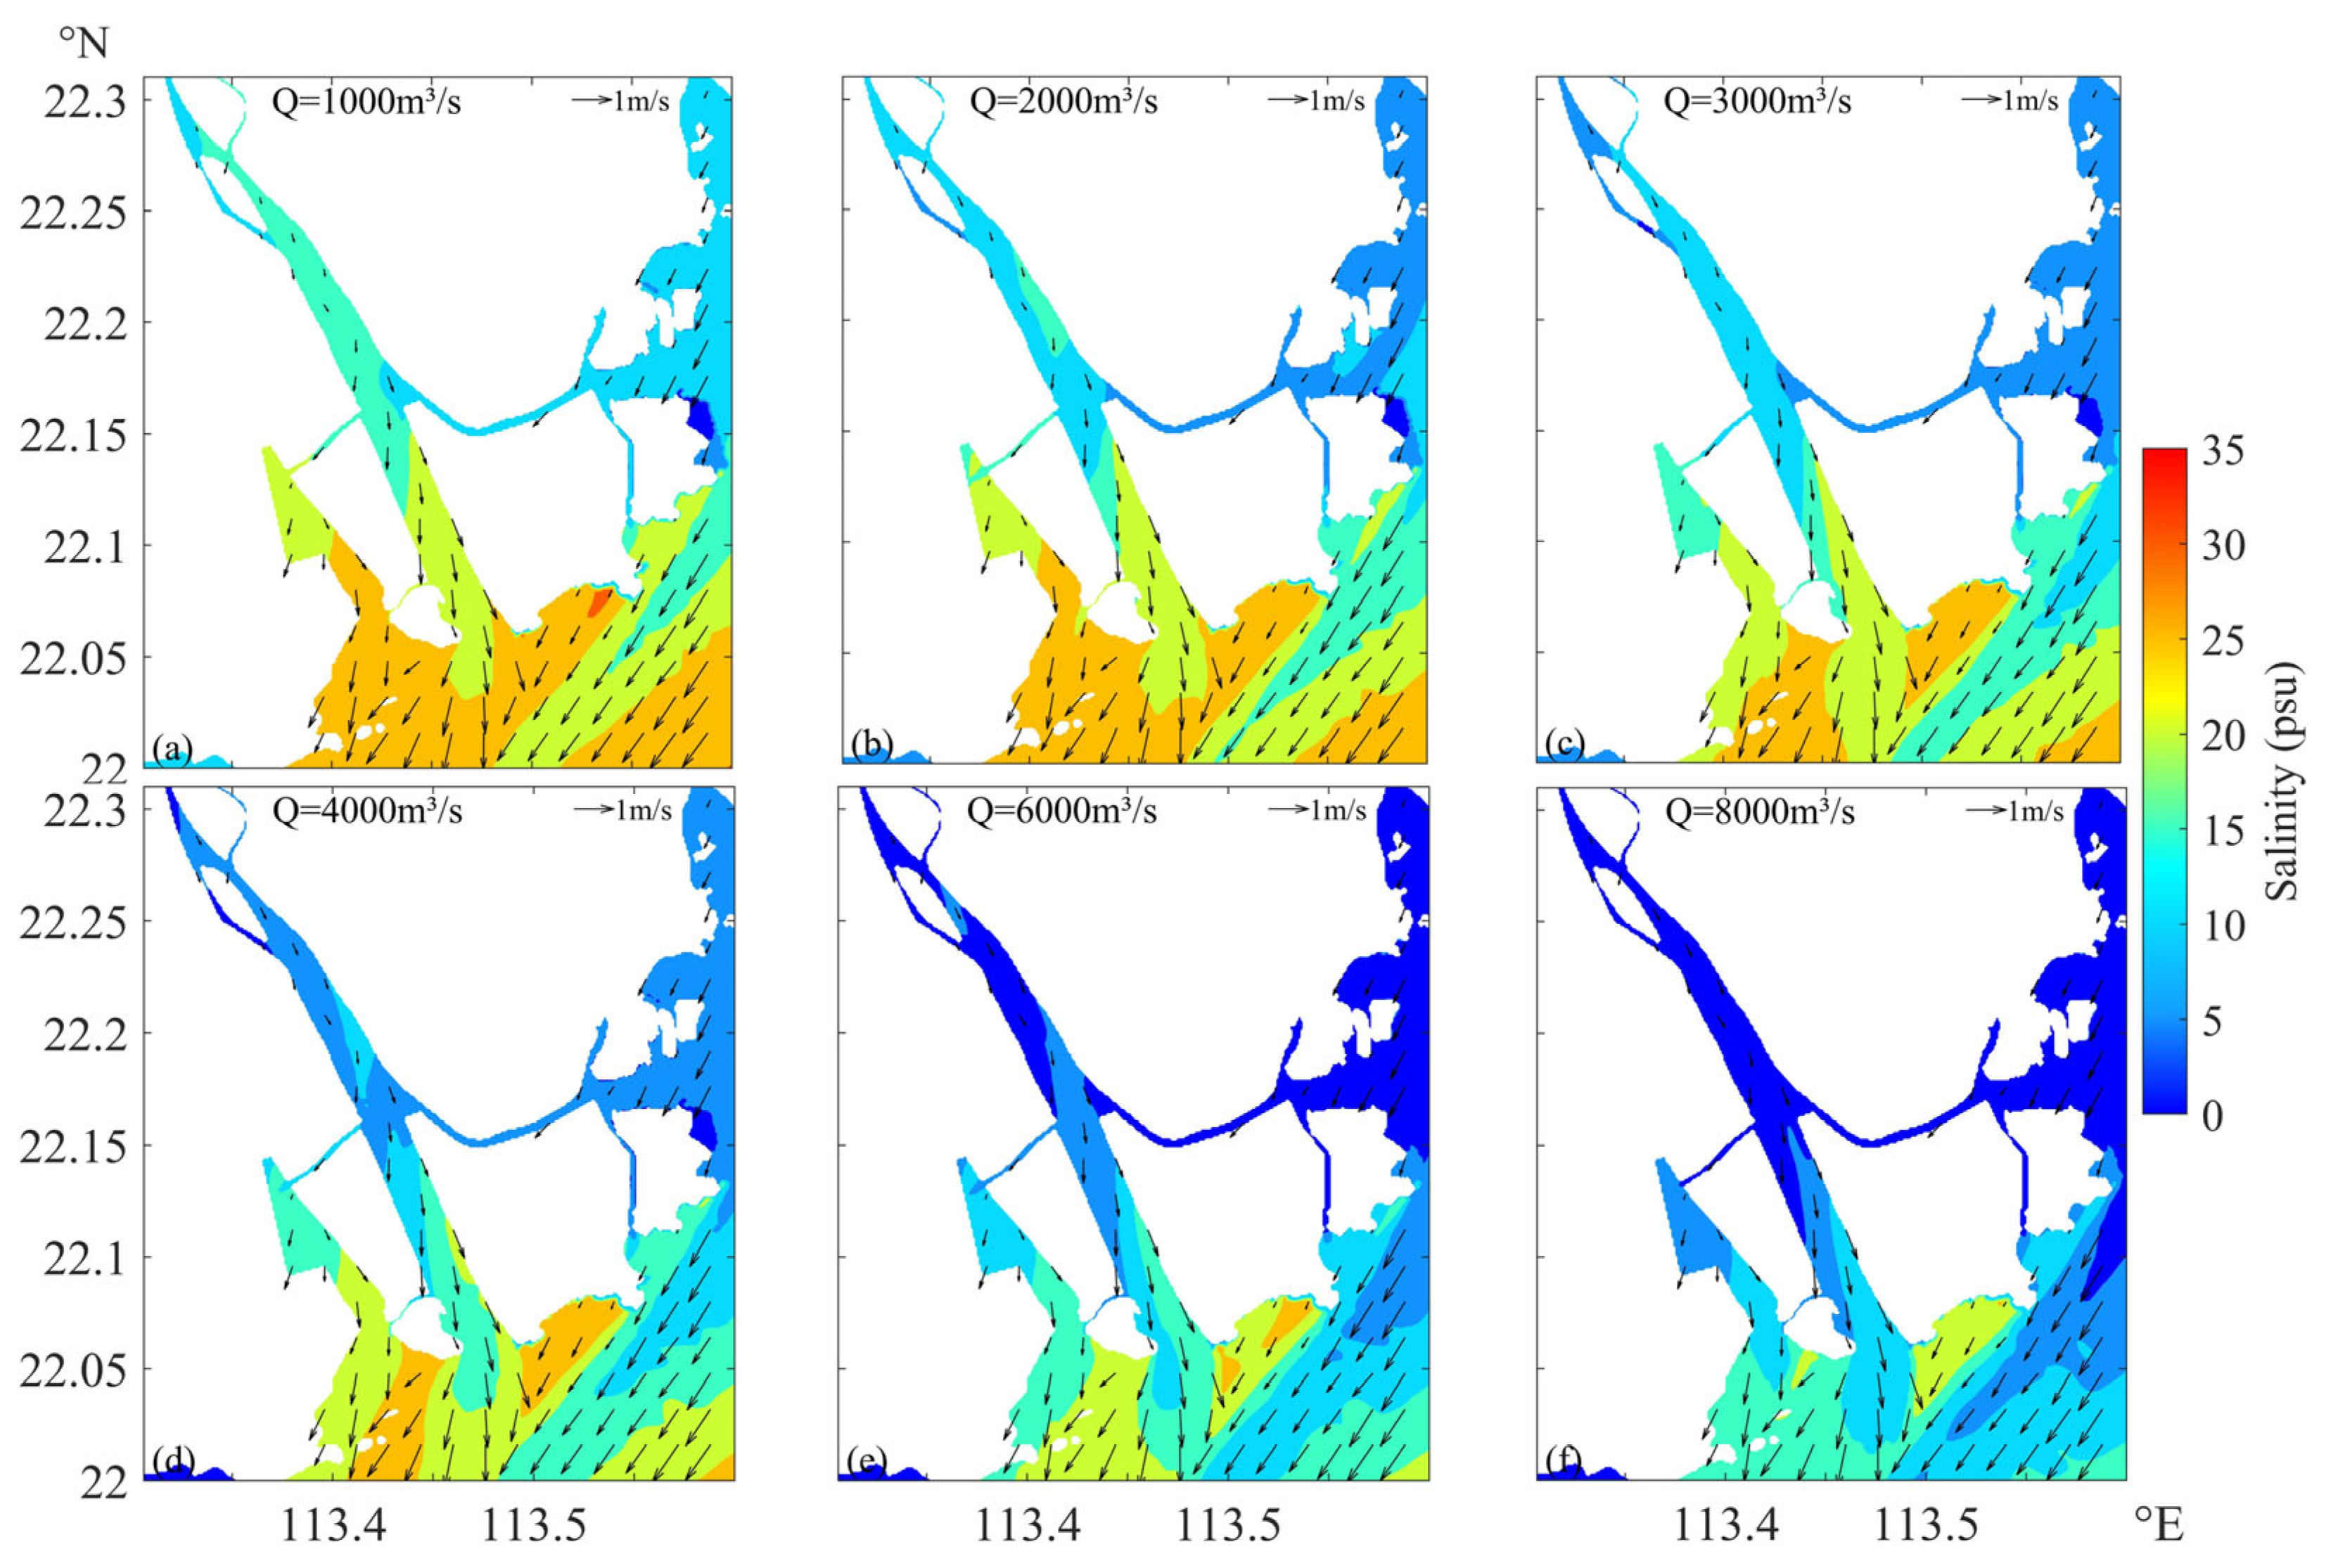
4.1. Effects of River Discharge

The Modaomen waterway serves as the primary outlet for the runoff from the West River. This region experiences distinct wet and dry seasons. The flood season typically spans from April to September, while the dry season occurs from October to March of the following year. The annual distribution of runoff in the Pearl River Delta exhibits significant seasonal variation, with the flood season contributing around 80% of the total annual runoff. Consequently, during the dry season, especially in the months of January and February, the discharge is relatively low, often falling below 2000 m3/s. This low discharge during the dry season poses challenges to the drinking water supply for cities in the Pearl River Delta, including major urban centers like Hong Kong, Guangzhou, Zhuhai, and Macao. It makes them vulnerable to salt intrusion events, as the reduced freshwater flow allows seawater to intrude further upstream in the estuaries. To mitigate the impact of salt intrusion during the dry season, one effective emergency measure is to release water from upstream reservoirs. This artificial increase in wintertime discharge can help maintain a suitable salinity level for drinking water supply and protect against the intrusion of saltwater into the estuaries.
The statistical analysis of multi-year measured data from 1984 to 2012 indicates that, historically, in the month of October, the mean freshwater discharge from the West River (Gaoyao Station) and North River (Shijiao Station) was approximately 5500 m3/s (see Table 3). However, in recent years, there has been a consistent trend of reduced rainfall in the Pearl River Basin, leading to a sustained decrease in river runoff. This decrease in discharge is particularly evident in the months of September and October. The atypical salt intrusion event in October 2022 may be attributed to the combined effects of this lower discharge and the influence of Typhoon Nesat. To investigate this hypothesis, six additional model runs (Case 3 to Case 8) were conducted. These cases utilized the same forcing and boundary conditions as Case 1, with the exception that the river discharge was adjusted based on the statistical analysis of measured data from the years 1984 to 2012 (as shown in Table 1). These simulations were carried out to assess the impact of varying river discharge on salt intrusion during the typhoon period and confirm whether the observed event in October 2022 can be attributed to the decrease in river discharge combined with the typhoon’s effects.
Under the various conditions explored, it is evident from Figure 14 that the extent of salt intrusion is influenced by the magnitude of river runoff. When the runoff from the North and West Rivers is less than 4000 m3/s, the 0.5 psu saltwater boundary intrudes beyond Zhuyin station during Typhoon Nesat, which could impact the water intake of Zhuhai city during typhoon days. On the other hand, when the river discharge is increased to more than 6000 m3/s, the salinity at the Pinggang Pump Station remains well below 0.5 psu. This means that the drinking water supply in cities around the Modaomen Estuary would not be affected. It is essential to note that the increased water storage in upstream reservoirs during autumn may lead to more salt intrusion events during the typhoon season, thus requiring quantitative evaluation of the combined effects of discharge and typhoons for effective water management in the Pearl River Estuary. Understanding the interplay of river discharge, typhoons, and salt intrusion is crucial for managing water resources in this region, especially given the increasing variability in weather patterns and potential impacts from climate change.

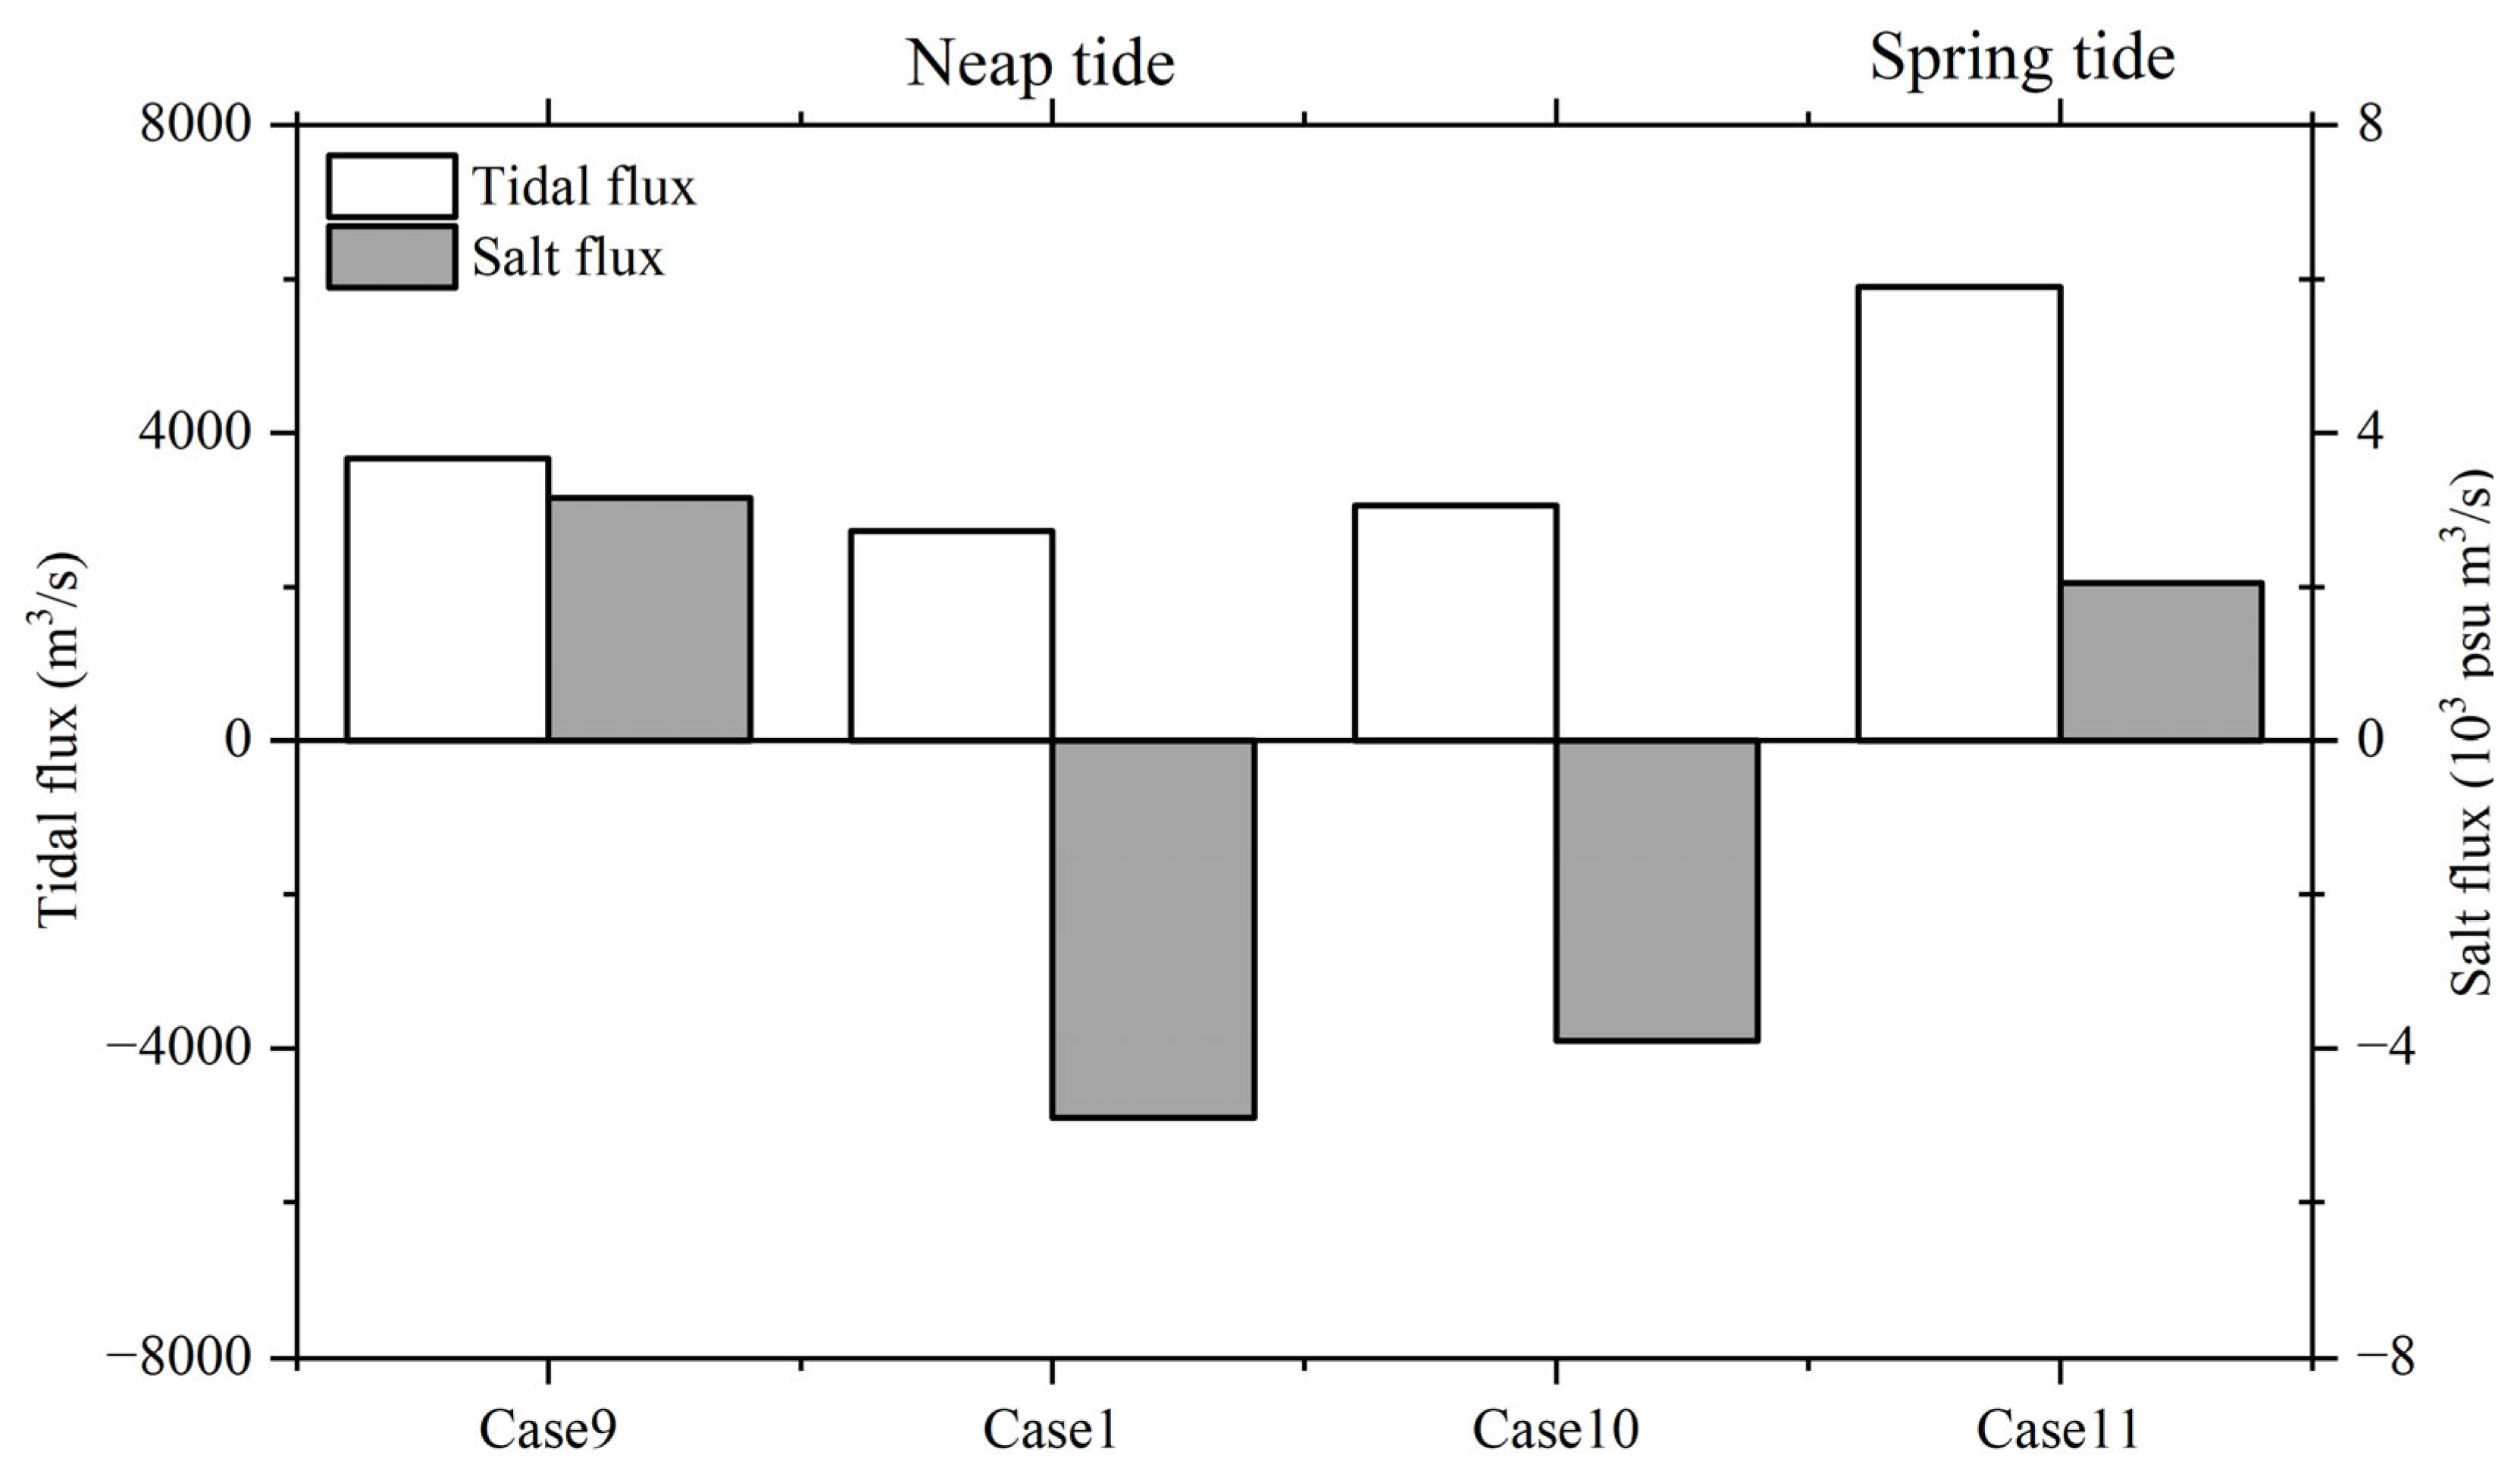
4.2. Effects of Tide

In addition to Case 1, where atypical salt intrusion under Typhoon Nesat occurred during the neap tide, three additional model experiments (Case 9 to Case 11) were conducted to assess what would happen if the same typhoon passed during different astronomical tide periods of the spring-neap tidal cycle. These scenarios had the same atmospheric forcing as Case 1 but featured altered astronomical tides at the open boundary, as detailed in Table 1. By simulating these different tidal conditions, the study aimed to understand how the timing of typhoon events in relation to the tidal cycle affects salt intrusion in the Modaomen Estuary. The half-monthly tidal cycle can be divided into four distinct time periods: the spring tide period, the neap tide period, and two intermediate tide periods. Generally, both the spring tide and neap tide periods last for approximately three to four days. In Table 1, “Intermediate tide after spring tide” refers to the period that occurs three to four days after the spring tide but before the neap tide. “Intermediate tide after neap tide” generally denotes the interval occurring three to four days after the neap tide.
The findings depicted in Figure 15 demonstrate the significant impact of the timing of typhoon events within the tidal cycle on salt intrusion in the Modaomen. This study reveals several key insights: During spring tides (Case 11), the residual water level in the channel is higher compared to neap tides (Case 1). The peak value of bottom salinity at Denglongshan station is 16.5 psu in Case 11, indicating that salt intrusion is relatively weak when a typhoon passes during the spring tide period. The timing of typhoon events within the tidal cycle significantly affects salt intrusion. The study identifies that the most severe salt intrusion occurs when a typhoon coincides with the neap tide period. It is followed by the intermediate tide after the neap tide, the spring tide, and the intermediate tide after the spring tide. In the absence of wind-induced effects, the most severe salt intrusion occurs during the intermediate tide after the neap tide. Under normal weather conditions, gravity circulation results in saltwater and freshwater stratification within the Modaomen during the neap tide period, leading to distinct layering. Salt intrusion predominantly originates from the bottom layer. Conversely, during the intermediate tide following the neap tide, vertical mixing intensifies, further enhancing salt intrusion. These findings underscore the intricate interplay between tidal phases, typhoon timing, and wind effects on salt intrusion dynamics in the Modaomen estuary.
The variations in tidal and salt flux at Denglongshan station under the combined influence of different astronomical tides and typhoons are illustrated in Figure 16. During the typhoon period, the average tidal flux directed seaward follows a cyclical pattern in sync with the half-monthly tidal cycle. When a typhoon coincides with spring tides in the Modaomen, the tidal flux directed seaward reaches its peak at 5898 m3/s. Subsequently, as the tidal forces wane, the tidal flux decreases, dropping to approximately 3362 m3/s during the intermediate tide period after the spring tide. Conversely, when a typhoon strikes the Modaomen during neap tides, the tidal flux reaches its minimum value of only 2724 m3/s. As the astronomical tide forces rebound after the neap tide, the tidal flux recovers, reaching 3059 m3/s during the intermediate tide period after the neap tide. Thus, the tidal flux follows a recurrent pattern over the half-monthly tidal cycle.
The impact of typhoons combined with astronomical tides on saltwater intrusion in the Modaomen Estuary was most pronounced during the neap tide and the intermediate tide period following the neap tide. This is evident in the outcomes of Case 1 and Case 10, as depicted in Figure 16. During the neap tide period, there was an actual increase in the average salt flux directed landward, further intensifying the salt intrusion. It is worth highlighting that the maximum net salt transport towards the land at the mouth of the Modaomen occurred during the neap tide period, registering at −4.9 × 10³ psu m3/s. The negative value signifies the direction of salt transport towards the land. In the intermediate tide period after the neap tide, the net salt flux towards the land gradually decreased, reaching −3.9 × 10³ psu m3/s. During the spring tide period, influenced by the typhoon, the net salt flux changed direction from landward to seaward, weakening the salt intrusion phenomenon. In the spring tide period, the net salt flux measured 2.05 × 10³ psu m3/s. In the intermediate tide period after the spring tide, the salt intrusion phenomenon further lessened, while the salt flux directed seaward increased, reaching 3.14 × 10³ psu m3/s. Consequently, when a typhoon coincides with neap tides, salt transport towards the land in the Modaomen reaches its peak, resulting in a particularly severe threat of saltwater-related issues for the surrounding cities in the estuary.

5. Conclusions

In this study, the flexible hydrostatic model SCHISM was adopted to simulate the salt intrusion influenced by typhoon weather. To calibrate and validate the model, data on typhoon winds, storm surges, and salinity from four stations along the Modaomen were gathered. The outcomes from the numerical model demonstrated its ability to accurately capture the temporal fluctuations in salinity within the Modaomen during the passage of Typhoon Nesat.
Through the creation of two distinct scenarios encompassing various meteorological conditions, one involving wind and the other without, the model results underscore the substantial influence of Typhoon Nesat on the remarkable salt intrusion event that occurred on 18 October. This led to the 0.5 psu saltwater boundary shifting approximately 29 km upstream. When the runoff from the North and West Rivers was less than 4000 m3/s during the typhoon, the 0.5 psu saltwater boundary intruded beyond Zhuyin station, endangering the water supply safety of numerous cities, including Zhuhai and Macao. Conversely, if the river discharge during Typhoon Nesat’s passage had surpassed 6000 m3/s, the net salt flux would have shifted from a landward direction to seaward. This would have guaranteed that water intake at Pinggang Pump Station and other upstream stations remained unaffected by saltwater, rendering the impact of salt intrusion in the Modaomen Estuary essentially negligible. Furthermore, during the neap tide, salt flux directed landward during the typhoon period reached its peak, resulting in the most severe salt intrusion within the half-monthly tidal cycle. In simpler terms, if the typhoon had occurred during spring tides, the salt intrusion event would have been relatively less severe.

Author Contributions

Conceptualization, F.Y. and Y.X.; methodology, F.Y. and Y.X.; software, J.Y.; validation, J.L.; resources, F.Y. and H.Z.; data curation, X.J.; writing—original draft preparation, F.Y. and Y.X.; writing—review and editing, W.Z. and H.Z.; visualization, J.Y. and J.L.; supervision, W.Z. All authors have read and agreed to the published version of the manuscript.

Funding

This research was funded by the National Key R&D Program of China (2021YFC3001000) and the National Natural Science Foundation of China (42006155).

Institutional Review Board Statement

Not applicable.

Informed Consent Statement

Not applicable.

Data Availability Statement

For the results and data generated during the study, please contact the corresponding author.

Conflicts of Interest

The authors declare no conflict of interest.

References

  1. Quang, N.; Sasaki, J.; Higa, H.; Huan, N.H. Spatiotemporal variation of turbidity based on Landsat 8 OLI in Cam Ranh Bay and Thuy Trieu Lagoon, Vietnam. Water 2017, 9, 570. [Google Scholar] [CrossRef]
  2. Quang, N.; Ngoc, P.K.; Sasaki, J. Study on the variation of bed shear stress by using swan model in Cam Ranh Bay and Thuy Trieu Lagoon. Vietnam. J. Mar. Sci. Technol. 2017, 17, 312–319. [Google Scholar] [CrossRef]
  3. Zhu, J.; Cheng, X.; Li, L.; Wu, H.; Gu, J.; Lyu, H. Dynamic mechanism of an extremely severe saltwater intrusion in the Changjiang estuary in February 2014. Hydrol. Earth Syst. Sci. 2020, 24, 5043–5056. [Google Scholar] [CrossRef]
  4. Hoitink, A.J.F.; Jay, D.A. Tidal river dynamics: Implications for deltas. Rev. Geophys. 2016, 54, 240–272. [Google Scholar] [CrossRef]
  5. Bellafiore, D.; Ferrarin, C.; Maicu, F.; Manfè, G.; Lorenzetti, G.; Umgiesser, G.; Zaggia, L.; Levinson, A.V. Saltwater intrusion in a mediterranean delta under a changing climate. J. Geophys. Res.-Ocean 2021, 126, e2020JC016437. [Google Scholar] [CrossRef]
  6. Ralston, D.K.; Geyer, W.R. Response to channel deepening of the salinity intrusion, estuarine circulation, and stratification in an Urbanized estuary. J. Geophys. Res.-Ocean. 2019, 124, 4784–4802. [Google Scholar] [CrossRef]
  7. Tian, R. Factors controlling saltwater intrusion across multi-time scales in estuaries, Chester River, Chesapeake Bay. Estuar. Coast. Shelf Sci. 2019, 223, 61–73. [Google Scholar] [CrossRef]
  8. Cai, H.Y.; Savenije, H.H.G.; Yang, Q.S.; Ou, S.Y.; Lei, Y.P. Influence of river discharge and dredging on tidal wave propagation: Modaomen estuary case. J. Hydraul. Eng. 2012, 138, 885–896. [Google Scholar] [CrossRef]
  9. MacCready, P.; Geyer, R.W. Advances in estuarine physics. Ann. Rev. Mar Sci. 2010, 2, 35–58. [Google Scholar] [CrossRef]
  10. Xu, Y.W.; Hoitink, A.J.F.; Zheng, J.; Kstner, K.; Zhang, W. Analytical model captures intratidal variation in salinity in a convergent, well-mixed estuary. Hydrol. Earth Syst. Sci. 2019, 23, 4309–4322. [Google Scholar] [CrossRef]
  11. Monismith, S.G.; Kimmerer, W.; Burau, J.R.; Stacey, M.T. Structure and flow-induced variability of the subtidal salinity field in northern San Francisco Bay. J. Phys. Oceanogr. 2002, 32, 3003–3019. [Google Scholar] [CrossRef]
  12. Kim, C.K.; Park, K. A modeling study of water and salt exchange for a micro-tidal, stratified northern Gulf of Mexico estuary. J. Mar. Syst. 2012, 96–97, 103–115. [Google Scholar] [CrossRef]
  13. Li, Y.; Li, M. Wind-driven lateral circulation in a stratified estuary and its effects on the along-channel flow. J. Geophys. Res. 2012, 117, C09005. [Google Scholar] [CrossRef]
  14. Scully, M.E.; Friedrichs, C.; Brubaker, J. Control of estuarine stratification and mixing by wind-induced straining of the estuarine density field. Estuaries 2005, 28, 321–326. [Google Scholar] [CrossRef]
  15. Chen, S.N.; Sanford, L.P. Axial wind effects on stratification and longitudinal salt transport in an idealized, partially mixed estuary. J. Phys. Oceanogr. 2009, 39, 1905–1920. [Google Scholar] [CrossRef]
  16. Savenije, H.H.G. Salinity and Tides in Alluvial Estuaries; Elsevier: Amsterdam, The Netherlands, 2005. [Google Scholar]
  17. Park, K.; Valentine, J.R.; Sklenar, S.; Weis, K.R.; Dardeau, M.R. The effects of Hurricane Ivan in the inner part of Mobile Bay, Alabama. J. Coast. Res. 2007, 23, 1332–1336. [Google Scholar] [CrossRef]
  18. Li, M.; Zhong, L.J.; Boicourt, W.C.; Zhang, S.L.; Zhang, D.L. Hurricane-induced storm surges, currents and destratification in a semi-enclosed bay. Geophys. Res. Lett. 2006, 33, 356–360. [Google Scholar] [CrossRef]
  19. Jay, D.A.; Uncles, R.J.; Largier, J.; Geyer, W.R.; Vallino, J.; Boynton, W.R. A review of recent developments in estuarine scalar flux estimation. Estuaries 1997, 20, 262–280. [Google Scholar] [CrossRef]
  20. Uncles, R.J. Estuarine physical processes research: Some recent studies and progress. Estuar. Coast. Shelf Sci. 2002, 55, 829–856. [Google Scholar] [CrossRef]
  21. Pritchard, D.W. Observation of circulation in coastal plain estuaries. In Estuaries; Lauff, G.H., Ed.; American Association for the Advancement of Science Publication: Washington, DC, USA, 1967. [Google Scholar]
  22. Twigt, D.J.; Goede, E.D.; Zijl, F.; Schwanenberg, D.; Chiu, A.Y.W. Coupled 1D–3D hydrodynamic modelling, with application to the Pearl River Delta. Ocean. Dyn. 2009, 59, 1077–1093. [Google Scholar] [CrossRef]
  23. Zhang, W.; Yan, Y.X.; Zheng, J.H.; Li, L.; Dong, X.; Cai, H.J. Temporal and spatial variability of annual extreme water level in the Pearl River Delta region, China. Glob. Planet. Chang. 2009, 69, 35–47. [Google Scholar] [CrossRef]
  24. Liu, B.J.; Yan, S.L.; Chen, X.; Lian, Y.; Xin, Y. Wavelet analysis of the dynamic characteristic of saltwater intrusion- A case study in the Pearl River Estuary of China. Ocean Coast Manag. 2014, 95, 81–92. [Google Scholar] [CrossRef]
  25. Gong, W.P.; Lin, Z.Y.; Chen, Y.Z.; Chen, Z.Y.; Zhang, H. Effect of winds and waves on salt intrusion in the Pearl River estuary. Ocean Sci. 2018, 14, 139–159. [Google Scholar] [CrossRef]
  26. Li, L.J.; Wang, C.N.; Pareja‐Roman, L.F.; Zhu, J.R.; Chant, R.J.; Wang, G.H. Effects of typhoon on saltwater intrusion in a high discharge estuary. J. Geophys. Res.-Ocean. 2022, 127, e2021JC018206. [Google Scholar] [CrossRef]
  27. Gong, W.P.; Shen, J. The response of salt intrusion to changes in river discharge and tidal mixing during the dry season in the Modaomen Estuary, China. Cont. Shelf Res. 2011, 31, 769–788. [Google Scholar] [CrossRef]
  28. Hersbach, H.; Dee, D. ERA5 reanalysis is in production. In ECMWF Newsletter No. 147; Lentze, G., Ed.; European Centre for Medium-Range Weather Forecasts (ECMWF): Reading, UK, 2016; p. 7. [Google Scholar]
  29. Gong, W.P.; Lin, Z.Y.; Zhang, H.; Lin, H.Y. The response of salt intrusion to changes in river discharge, tidal range, and winds, based on wavelet analysis in the Modaomen China. Ocean Coast. Manag. 2022, 219, 106060. [Google Scholar] [CrossRef]
  30. Zhang, Y.L.J.; Ye, F.; Stanev, E.V.; Grahorn, S. Seamless cross-scale modelling with SCHISM. Ocean Model. 2016, 102, 64–81. [Google Scholar] [CrossRef]
  31. Egbert, G.D.; Erofeeva, S.Y. Efficient inverse modeling of barotropic ocean tides. J. Atmos. Ocean. Technol. 2002, 19, 183–204. [Google Scholar] [CrossRef]
  32. Allen, J.I.; Somerfield, P.J.; Gilbert, F.J. Quantifying uncertainty in high-resolution coupled hydrodynamic-ecosystem models. J. Mar. Syst. 2006, 64, 3–14. [Google Scholar] [CrossRef]
Figure 1. (a) Location and topography of the Pearl River Estuary. (b) Locations for gauge stations are marked with triangle and dot symbols. The red line represents the longitudinal section along the deep trough of the Modaomen waterway.
Jmse 12 00022 g001
Figure 2. Track of Typhoon Nesat at six-hour intervals from 14:00 (CST time) on 15 October to 2:00 (CST time) on 20 October 2022.
Jmse 12 00022 g002
Figure 3. (a) Temporal variations in the measured water level at Denglongshan station, (b) measured surface salinity at Denglongshan station, river discharge at Wuzhou station, and (c) wind vector at Taipa Station in Macao from 2 October to 22 October 2022. The gray area represents the typhoon period.
Jmse 12 00022 g003
Figure 4. (a) Model domains and grids; (b) enlarged views of the model grid at the Pearl River Estuary (red box in first panel).
Jmse 12 00022 g004
Figure 5. The ERA5-predicted surface wind speed field at 3:00 a.m. on 18 October 2022.
Jmse 12 00022 g005
Figure 6. Measured and modeled time series of (a) typhoon wind speed and (b) air pressure at Taipa Station. Time series of (c) observed and (d) modeled wind vectors.
Jmse 12 00022 g006
Figure 7. Comparison of simulated water level (black line) with observed data (red circles) at the four stations (Dachongkou, Denglongshan, Majiao, and Xihe) from 8 to 20 October 2022.
Jmse 12 00022 g007
Figure 8. Comparison of simulated surface salinity (black line) with observed data (red circles) at four stations (Dachongkou, Denglongshan, Majiao, and Xihe) from 16 to 20 October 2022.
Jmse 12 00022 g008
Figure 9. Surface and bottom salinity distributions: (a,d) before the typhoon; (b,e) during the typhoon; (c,f) after the typhoon period.
Jmse 12 00022 g009
Figure 10. Salinity profile distribution along the longitudinal Section 1: (a) before the typhoon, (b) during the typhoon, and (c) after the typhoon period.
Jmse 12 00022 g010
Figure 11. Time series of (a) water level and (b) salinity at Denglongshan station. The black and blue lines represent the simulations with and without wind, respectively. The red circles refer to the observations.
Jmse 12 00022 g011
Figure 12. Salinity distribution at 3:00 a.m. on 18 October, (a) with typhoon winds and (b) without typhoon winds, showing isolines of salinity values at 0.5 psu (red line).
Jmse 12 00022 g012
Figure 13. Distribution of simulated water level and currents: (a) with typhoon winds, (b) without typhoon winds, and (c) the difference between these two scenarios (typhoon winds minus no typhoon winds).
Jmse 12 00022 g013
Figure 14. The simulated salinity distribution in Modaomen during the typhoon period for Cases 3 to Case 8 (af).
Jmse 12 00022 g014
Figure 15. Time series of salinity (red) and storm surge (black) at Denglongshan station in the (a) Case 1, (b) Case 9, (c) Case 10, and (d) Case 11 model results.
Jmse 12 00022 g015
Figure 16. Variation of tidal flux and salt flux at Denglongshan Station under different experimental scenarios.
Jmse 12 00022 g016
Table 1. Model case study settings.
Run CaseRiver Discharge (m3/s)TidesWind
Gaoyao StationShijiao StationTotal
Case 1Real-time Monitoring DataNeap tide (TR * 1.26 m)Typhoon Nesat
Case 2Real-time Monitoring DataNeap tideNo wind
Case 38751251000Neap tideTyphoon Nesat
Case 417502502000Neap tideTyphoon Nesat
Case 526253753000Neap tideTyphoon Nesat
Case 635005004000Neap tideTyphoon Nesat
Case 752507506000Neap tideTyphoon Nesat
Case 8700010008000Neap tideTyphoon Nesat
Case 9Real-time Monitoring DataIntermediate tide after spring tide (TR 1.47 m)Typhoon Nesat
Case 10Real-time Monitoring DataIntermediate tide after neap tide (TR 1.30 m)Typhoon Nesat
Case 11Real-time Monitoring DataSpring tide (TR 1.97 m)Typhoon Nesat
* TR: Tidal range.
Table 2. Simulation accuracy values for water level and salinity in Modaomen.
StationRMSESS
Water Level (m)Salinity (psu)Water LevelSalinity
Xihe0.172.180.900.72
Majiao0.212.570.770.65
Denglongshan0.181.870.860.82
Dachongkou0.223.040.730.57
Table 3. Runoff data for the Modaomen in October.
StationDischarge in October (m3/s)
MaximumMinimumMean
Gaoyao (in West River)10,65918474841
Shijiao (in North River)1119242640
Total11,66221555482
Disclaimer/Publisher’s Note: The statements, opinions and data contained in all publications are solely those of the individual author(s) and contributor(s) and not of MDPI and/or the editor(s). MDPI and/or the editor(s) disclaim responsibility for any injury to people or property resulting from any ideas, methods, instructions or products referred to in the content.

