Article

Quasi-Static Model Test of Pile-Supported Wharf under Cyclic Lateral Loading

1
School of Civil Engineering, Qingdao University of Technology, Qingdao 266520, China
2
School of Civil Engineering, Harbin Institute of Technology, Harbin 150001, China
*
Author to whom correspondence should be addressed.
J. Mar. Sci. Eng. 2024, 12(1), 115; https://doi.org/10.3390/jmse12010115
Submission received: 17 November 2023 / Revised: 1 January 2024 / Accepted: 5 January 2024 / Published: 7 January 2024
(This article belongs to the Special Issue Offshore Foundations: Liquefaction and Soil-Structure Interaction)

Abstract

:
The pile-supported wharf (PSW) is one of the most common structures in harbor engineering. To investigate the dynamic response characteristics of the PSW, a quasi-static model test of a PSW–ground system under cyclic lateral loading is conducted. The deformation and damage processes of piles and the sand stratum are observed and obtained. The hysteresis characteristics of the PSW–ground system and the response characteristics of piles are systematically explored. The strain energy of the pile group on the sloping ground is calculated and analyzed. The results show that there are two peak bending moments on the pile, and the maximum one occurs at the pile top. The pile embedded depth and the loading direction strongly affect the strain energy distribution of the pile group. Under downslope direction loading, the center piles have the largest strain energy percentage. The strain energy extends from the center piles to the outside piles with the increase in loading displacement amplitude. The test results indicate that the landside pile and center pile should be strengthened during seismic design.

1. Introduction

A wharf is a structure for the berthing of ships at the seaside or riverside, and it is one of the main structures of a harbor. One of the most common forms of wharf is the pile-supported wharf (PSW), which usually consists of piles, a deck, and supporting facilities. Piles are the most used foundation form to solve the problem of insufficient bearing capacity and fulfill seismic design demands. Thus, PSW systems are extensively used in harbor engineering, but this system is very susceptible to damage and difficult to repair compared to gravity wharves.
Unfortunately, many PSW structures are located in seismically active areas and are vulnerable to earthquake damage. For example, in the 1995 Hyogoken-Nanbu earthquake, the port of Kobe was heavily damaged, with widespread soil liquefaction in the port area and the failure of pile foundations. In the harbor area, liquefaction and lateral spreading caused severe damage to the quay wall. Lateral spreading also resulted in landside pile damage and deformation of the crane rails supported by the piles [1]. In the 1999 Chi-Chi earthquake, four docking wharves in the port of Taichung were destroyed due to soil liquefaction caused by the earthquake. The caissons supporting the wharf settled and were laterally displaced due to liquefaction, and the materials between the caissons were washed away by the tides, resulting in a massive 30 m diameter cavity [2]. During the 2010 Haiti earthquake, the port of Port-au-Prince was devastated. The entire North Wharf structure was severely damaged by soil liquefaction and lateral spreading, and the cranes were submerged in water. At the South Wharf, over 120 m of the wharf segment collapsed, and liquefaction and lateral spreading were observed along the shore, which led to lateral movement and the settlement of the piles and abutments [3]. The damage caused by such earthquakes to the PSW structures directly affects the normal operation of the port, which leads to tremendous economic losses.
Among all seismic events, near-fault seismic events have received widespread attention for their powerful destructive effects. The near-fault zone is generally defined as the area within 20 km of the fault. From the previously mentioned 1995 Hyogoken-Nanbu earthquake, the 1999 Chi-Chi earthquake, and the 2010 Haiti earthquake, numerous records of near-fault ground motions have been captured. Compared to far-field ground motions, near-fault ground motions have some unique characteristics; the most widely recognized one is the pulse characteristic. Many studies have shown that near-fault pulse-like ground motions present significant threats to the safety of various structures [4,5,6,7]. Therefore, research on the seismic performance of the PSW structure under near-fault pulse-like ground motions is necessary to reduce the earthquake damage risk and to achieve reliable port operations.
During earthquakes, the pile foundation of a PSW structure and the surrounding soil constitute a complex soil–pile interaction system. There have been many studies on the dynamic response of soil–pile interaction systems, mainly through numerical simulation or experimental methods. Since the 1970s, with the advances in computer technology and analysis software, many studies on numerical simulation of this problem have been carried out by researchers. Giannakou et al. [8] investigated the effect of batter piles on the elastic response of soil–pile structures using a three-dimensional (3D) finite element (FE) model; the results show that, under purely kinematic seismic loading, the effect of batter piles is negative. The performance of batter piles depends on the relation between the shear force and the overturning moment. Fan et al. [9] investigated the complex system of soil–structure–ship using a high-resolution FE model, identified four phases for the flexural damage of the pile-supported structure, and effectively evaluated the performance of the pile support structure under ship impact loading. Based on the analytical model, a simplified evaluation method of peak response is proposed. Muthukkumaran et al. [10] used the finite difference method to investigate the effect of combined lateral and vertical loads on a pile-supported platform and analyzed the effect of different seabed slopes on the soil–pile interaction behavior. The results show that the displacements at the pile top and seabed, and the depths at which maximum shear and bending moments occur, all increase as the seabed slope increases. Su et al. [11] explored the effect of seismically induced ground deformation on a PSW system through a 3D FE model; the results show that the lateral permanent deformation of the ground is caused by the weak soil stratum and the associated vertical deformation may lead to additional axial forces. The reduction in pressure in the pile, or even the generation of tension, may significantly reduce the stiffness and strength of reinforced concrete piles. Vytiniotis et al. [12] investigated the permanent ground deformation and seismic response of a typical PSW structure on loose granular fill. The analysis shows that the main driver of PSW structural damage is the lateral expansion of the soil, which is necessary to control downslope soil deformation. The numerical simulation method has been widely used in the study of the seismic performance of pile-supported structures in the past few decades due to its advantages of low cost, high computational speed, and good adaptability.
Apart from simulation studies, experimental studies are still the most direct way to research soil–pile interaction. Experimental studies can qualitatively analyze the mechanism of soil–pile interaction and quantitatively evaluate the reliability of different theories and numerical analysis models. Many researchers have carried out experimental studies on the dynamic performance of pile foundations. The common test methods to study the dynamic performance of structures mainly include the quasi-static test, centrifuge test, and shaking table test. McCullough et al. [13] conducted PSW model centrifuge tests, and the test results were also compared with the standard-of-practice design method results, and recommendations were made for design criteria. The test results indicated that the deep-pile bending moment may be greater than that at the pile top, which was not considered in the design method. Restrepo et al. [14] tested the pile–deck connection units of the Port of Los Angeles wharf under reverse cyclic loading. The dynamic response properties and damage mode of the pile–deck connections were investigated. The results showed lateral displacement reserves significantly larger than those corresponding to the structural strain limits in the seismic design code. Schlechter et al. [15] performed a series of centrifuge modeling tests with typical PSW configurations. Through the tests, lateral seismic loads on plumbed and batter piles were quantified, shear and bending moment data on the pile–deck connection were obtained, and the influence of embankment displacements on pile loading was clarified. Roeder et al. [16] conducted a series of PSW model tests to investigate the seismic performance of the pile–deck connection. The test results show that these connection units can tolerate large cyclic inelastic deformations, but significant deterioration in resistance and stiffness can be observed. This resistance degradation decreases the inelastic pushover resistance significantly and improves the inelastic dynamic response demands of the system. Takahashi et al. [17] investigated the damage mechanism of pile foundations of a PSW and the influence of liquefaction of backfill and the underlying sand layer on the permanent deformation of the wharf by centrifugal modeling tests. The test reasonably predicted the failure mode of the PSW in the Kobe earthquake. Parametric studies have shown that the deformation mode of ground and structures changes with the thickness of the underlying sand layer. Kawamata [18] conducted large-scale lateral loading modeling tests, showing that rockfill–pile interaction is mainly influenced by friction and embedding between the rock particles. Based on this conclusion, a stress-independent reaction due to interlocking was added to the current design method, thus improving the performance of the analysis.
Compared with the other two test methods, the quasi-static test is easy to perform. It can obtain stable and reliable data by simply controlling the loading process. The whole damage process of a pile foundation is very clear, which can reflect the cumulative damage characteristics of pile foundation and soil under cyclic loading, so it is widely used in seismic/dynamic performance research on pile foundations. In the past few decades, much research has emerged on the seismic performance of the PSW structure, but more research is needed on the load distribution of the PSW on the sloping ground under the influence of near-fault pulse-like earthquakes. A 3D FE analysis model will be established based on the OpenSees platform to study the PSW structure’s seismic performance. Before establishing the 3D FE model, a quasi-static test is conducted to investigate the dynamic performance of the PSW structure and to provide the necessary data support for the following numerical model. In contrast to past studies, this test specifically investigates the dynamic response characteristics and pile load distribution ratio of the PSW–ground system on the sloping ground.
This test is the first part of a series of studies on the seismic performance of the PSW under near-fault pulse-like ground motions. The final purpose of the studies is to investigate the mechanical properties, deformation characteristics, damage modes, and load distribution characteristics of the PSW structure under near-fault pulse-like ground motions to provide a reference for the seismic design of the PSW. To reach this purpose, modeling tests of the PSW structure are conducted first, then a 3D FE numerical model will be built and validated through the test results. In this study, the quasi-static model test of a PSW–ground system based on a realistic wharf prototype is performed under cyclic lateral loading. The deformation process of wharf piles and soil around piles and the damage pattern in the test are observed. The hysteresis characteristics of the PSW–ground system and the bending moment of the pile group are analyzed. The strain energy distribution of piles is calculated and characterized using the energy method. Through the above test and analysis, the dynamic response characteristics of wharf piles under cyclic loading are systematically analyzed, and the experimental data are provided to support the numerical simulation analysis in the future.

2. Quasi-Static Model Test of the PSW

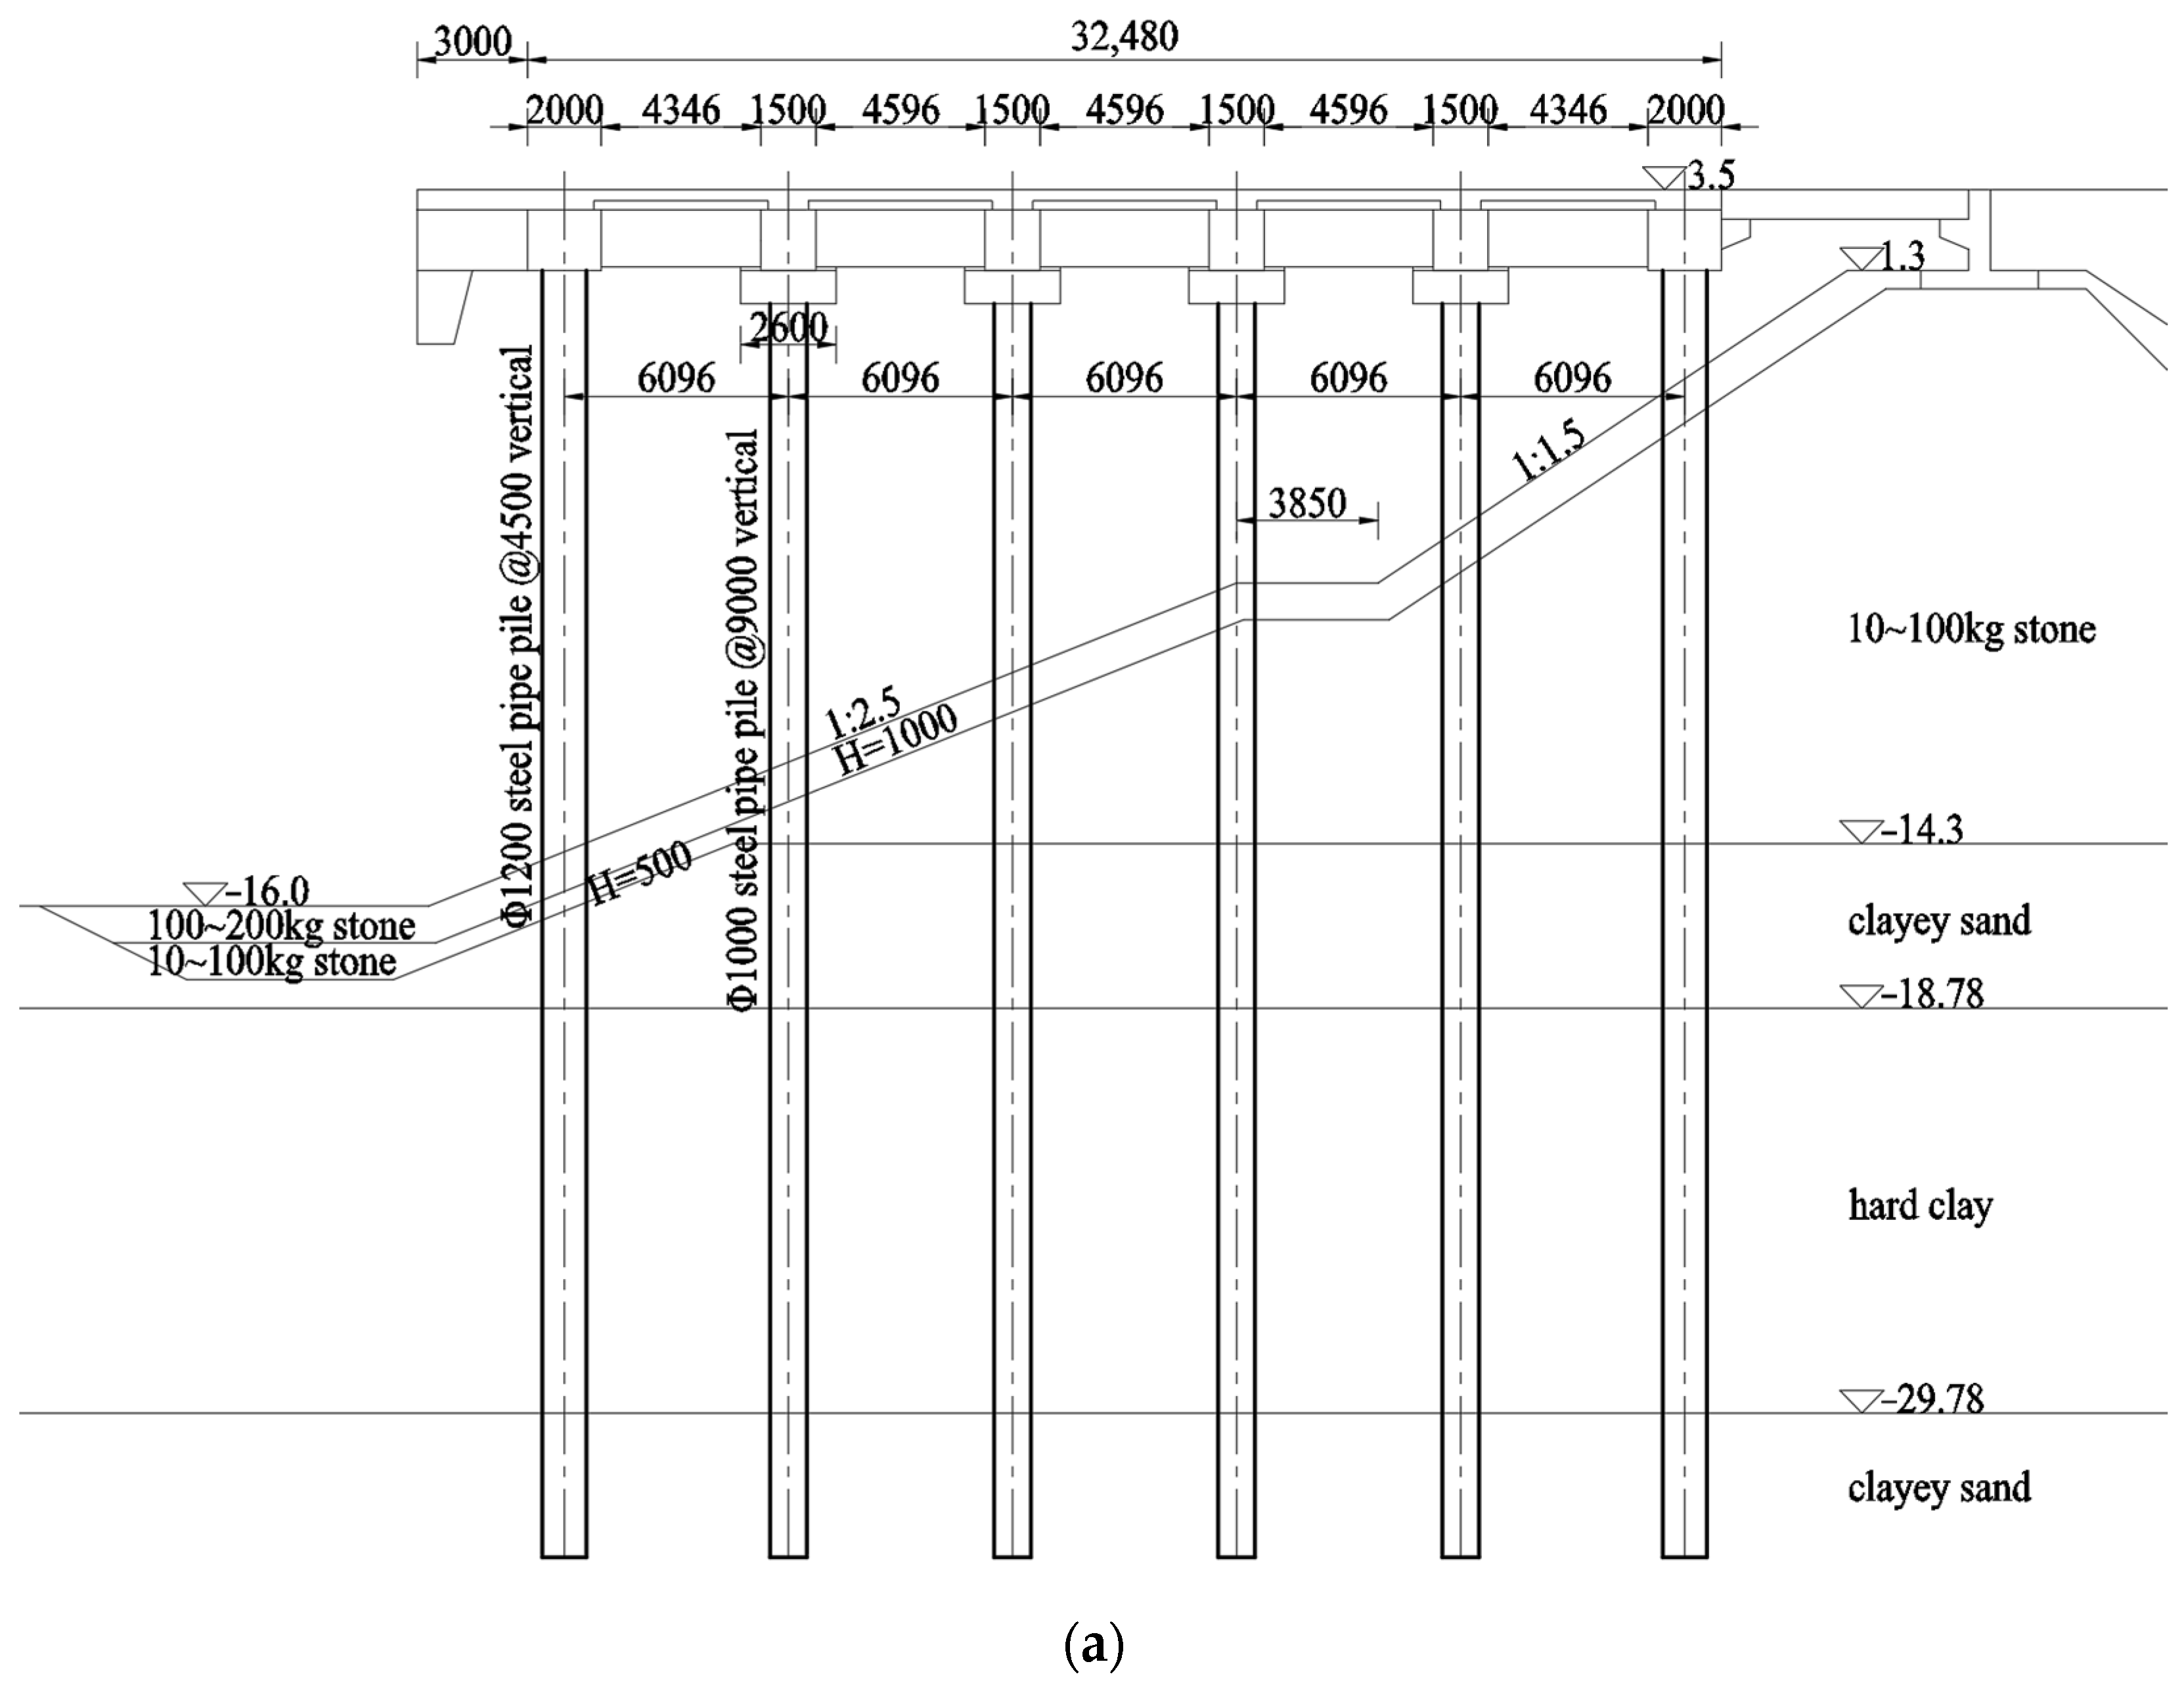
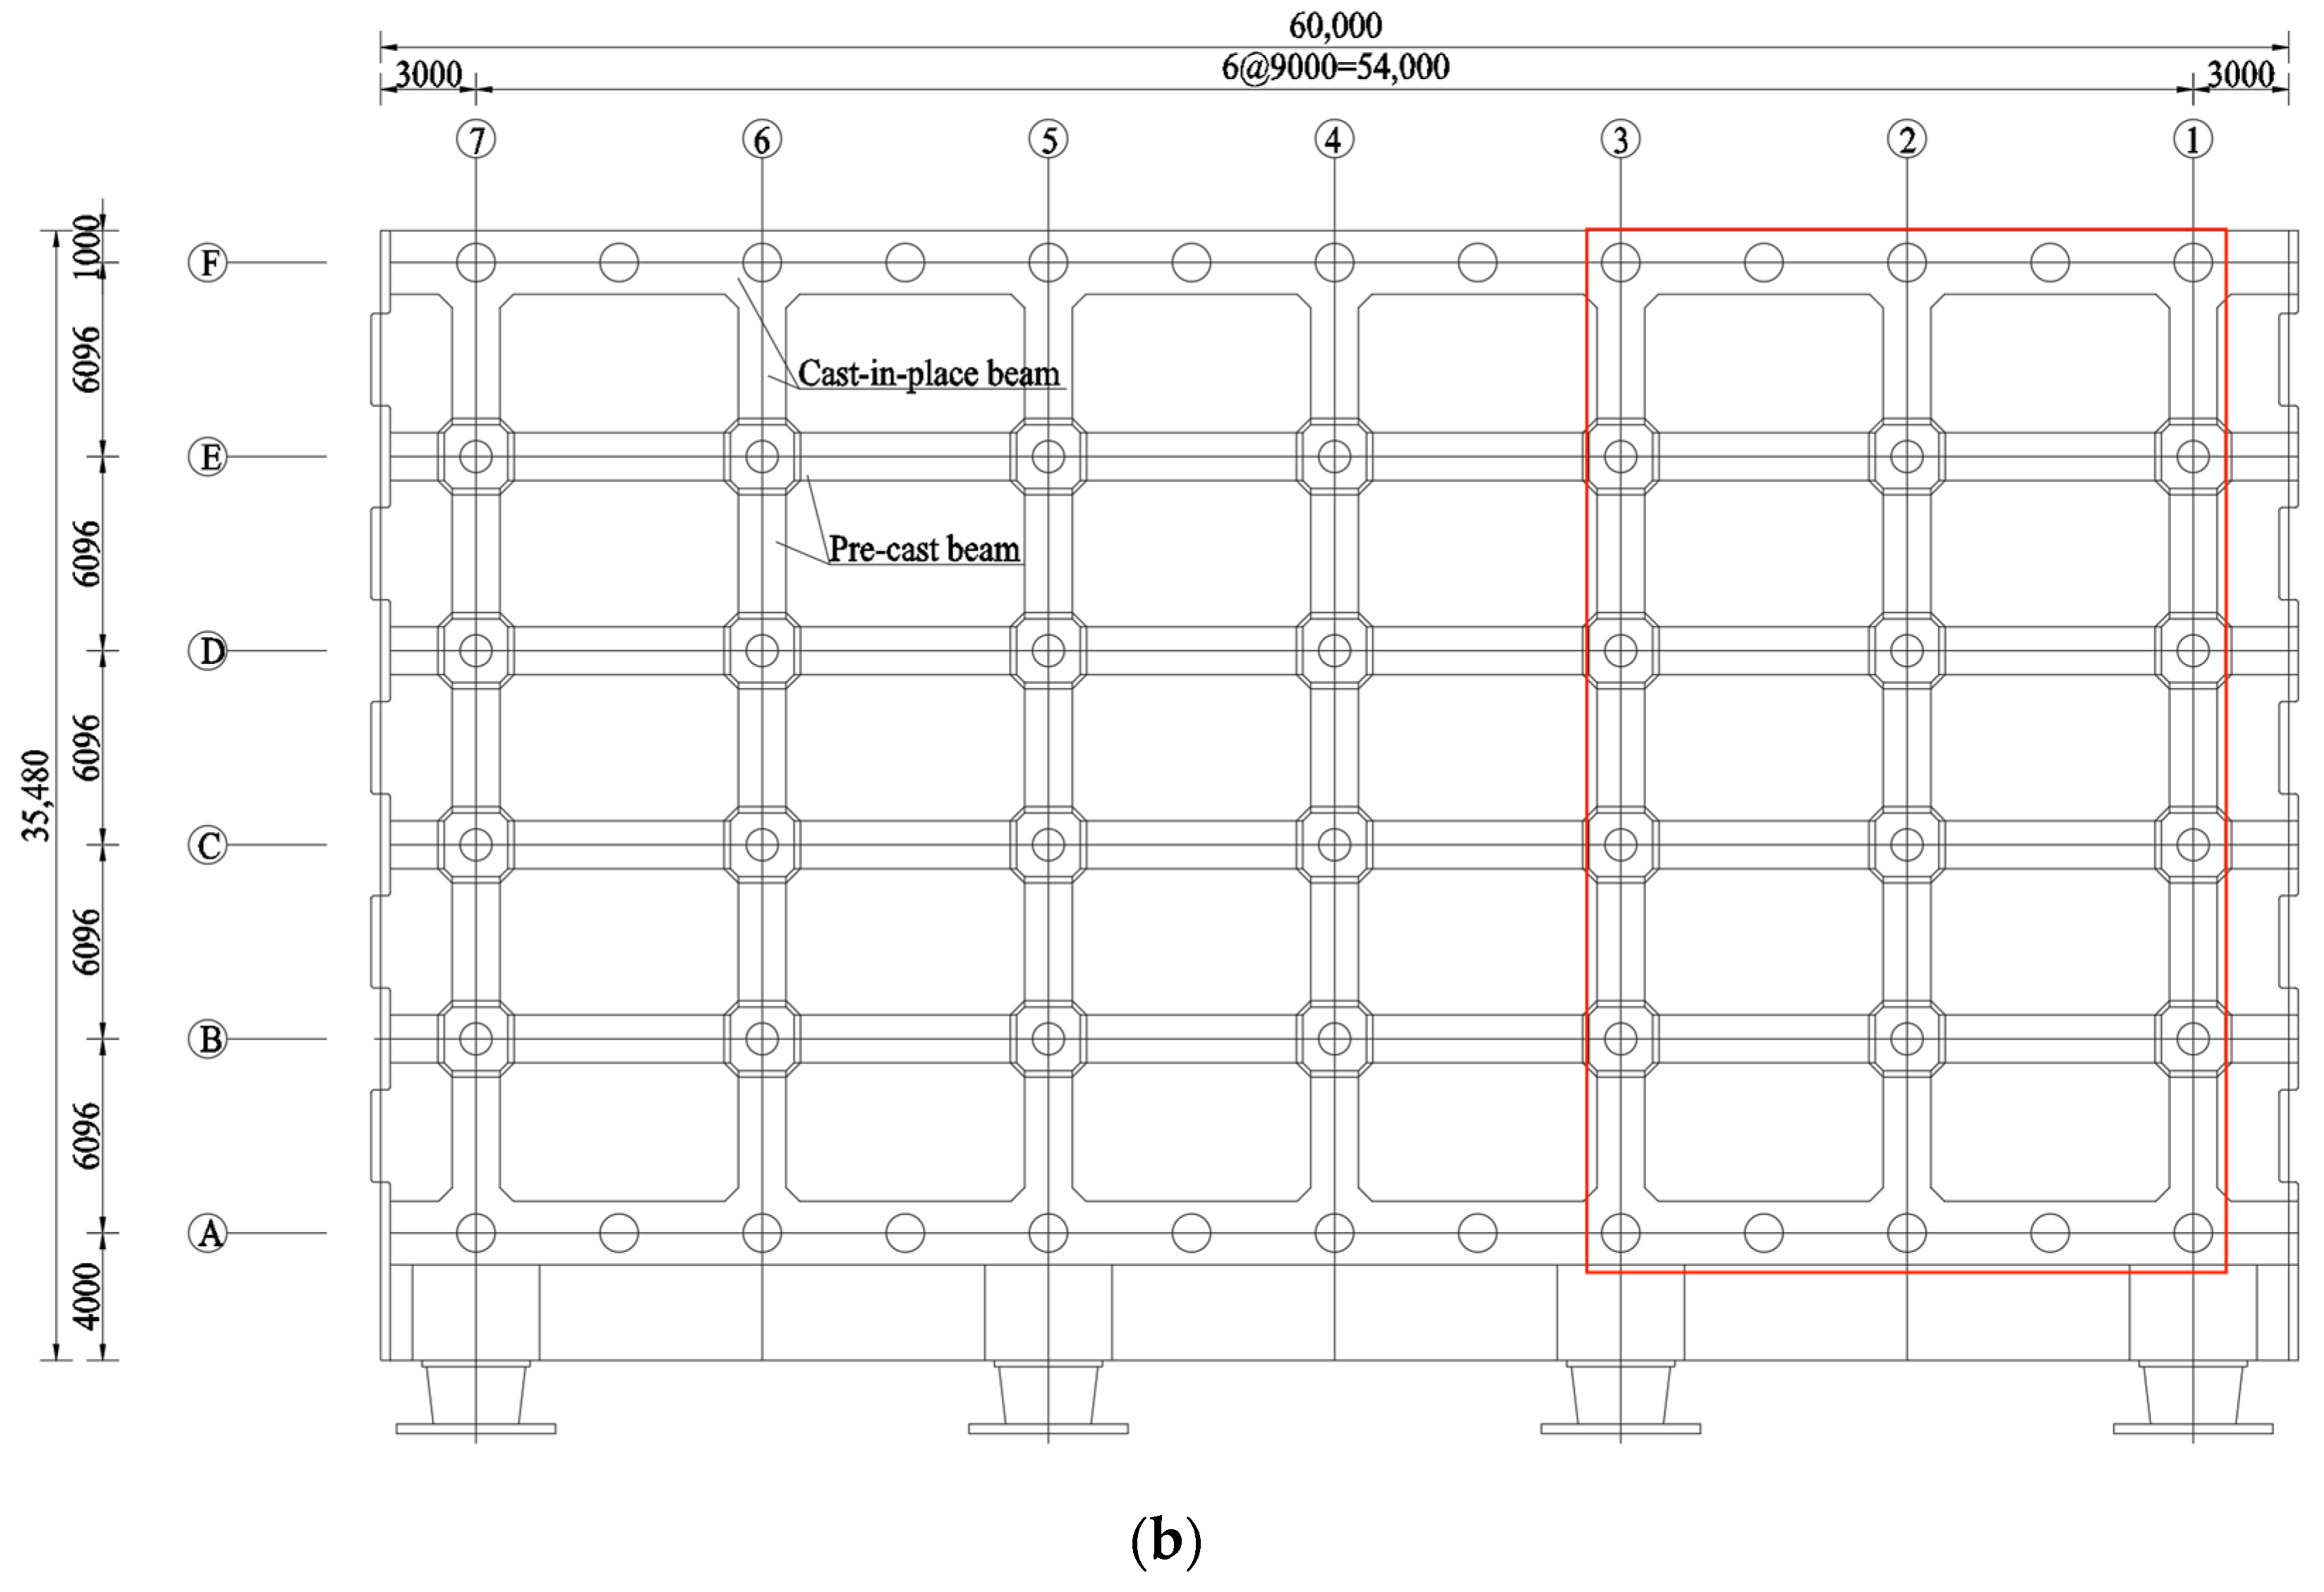
2.1. Description of Prototype Wharf

The prototype wharf is a typical PSW structure located in Puerto Manzanillo, on the west coast of Mexico. Puerto Manzanillo is located in the meizoseismal area and was severely damaged by the 1995 Colima–Jalisco earthquake. The total length of the wharf is 720 m. The pile foundation has plumb steel pipe piles, and the ground is liquefiable sandy soil. This PSW structure has a simple design, which makes it suitable as a test prototype. The arrangement of this prototype wharf is shown in Figure 1, including the cross-section and standard segment layout. It comprises steel pipe piles, pre-cast concrete beams, cast-in-place concrete beams, and cast-in-place concrete decks. The prototype contains two types of steel pipe piles, one with a diameter of 1200 mm and one with a diameter of 1000 mm, both with a steel pipe thickness of 18 mm.

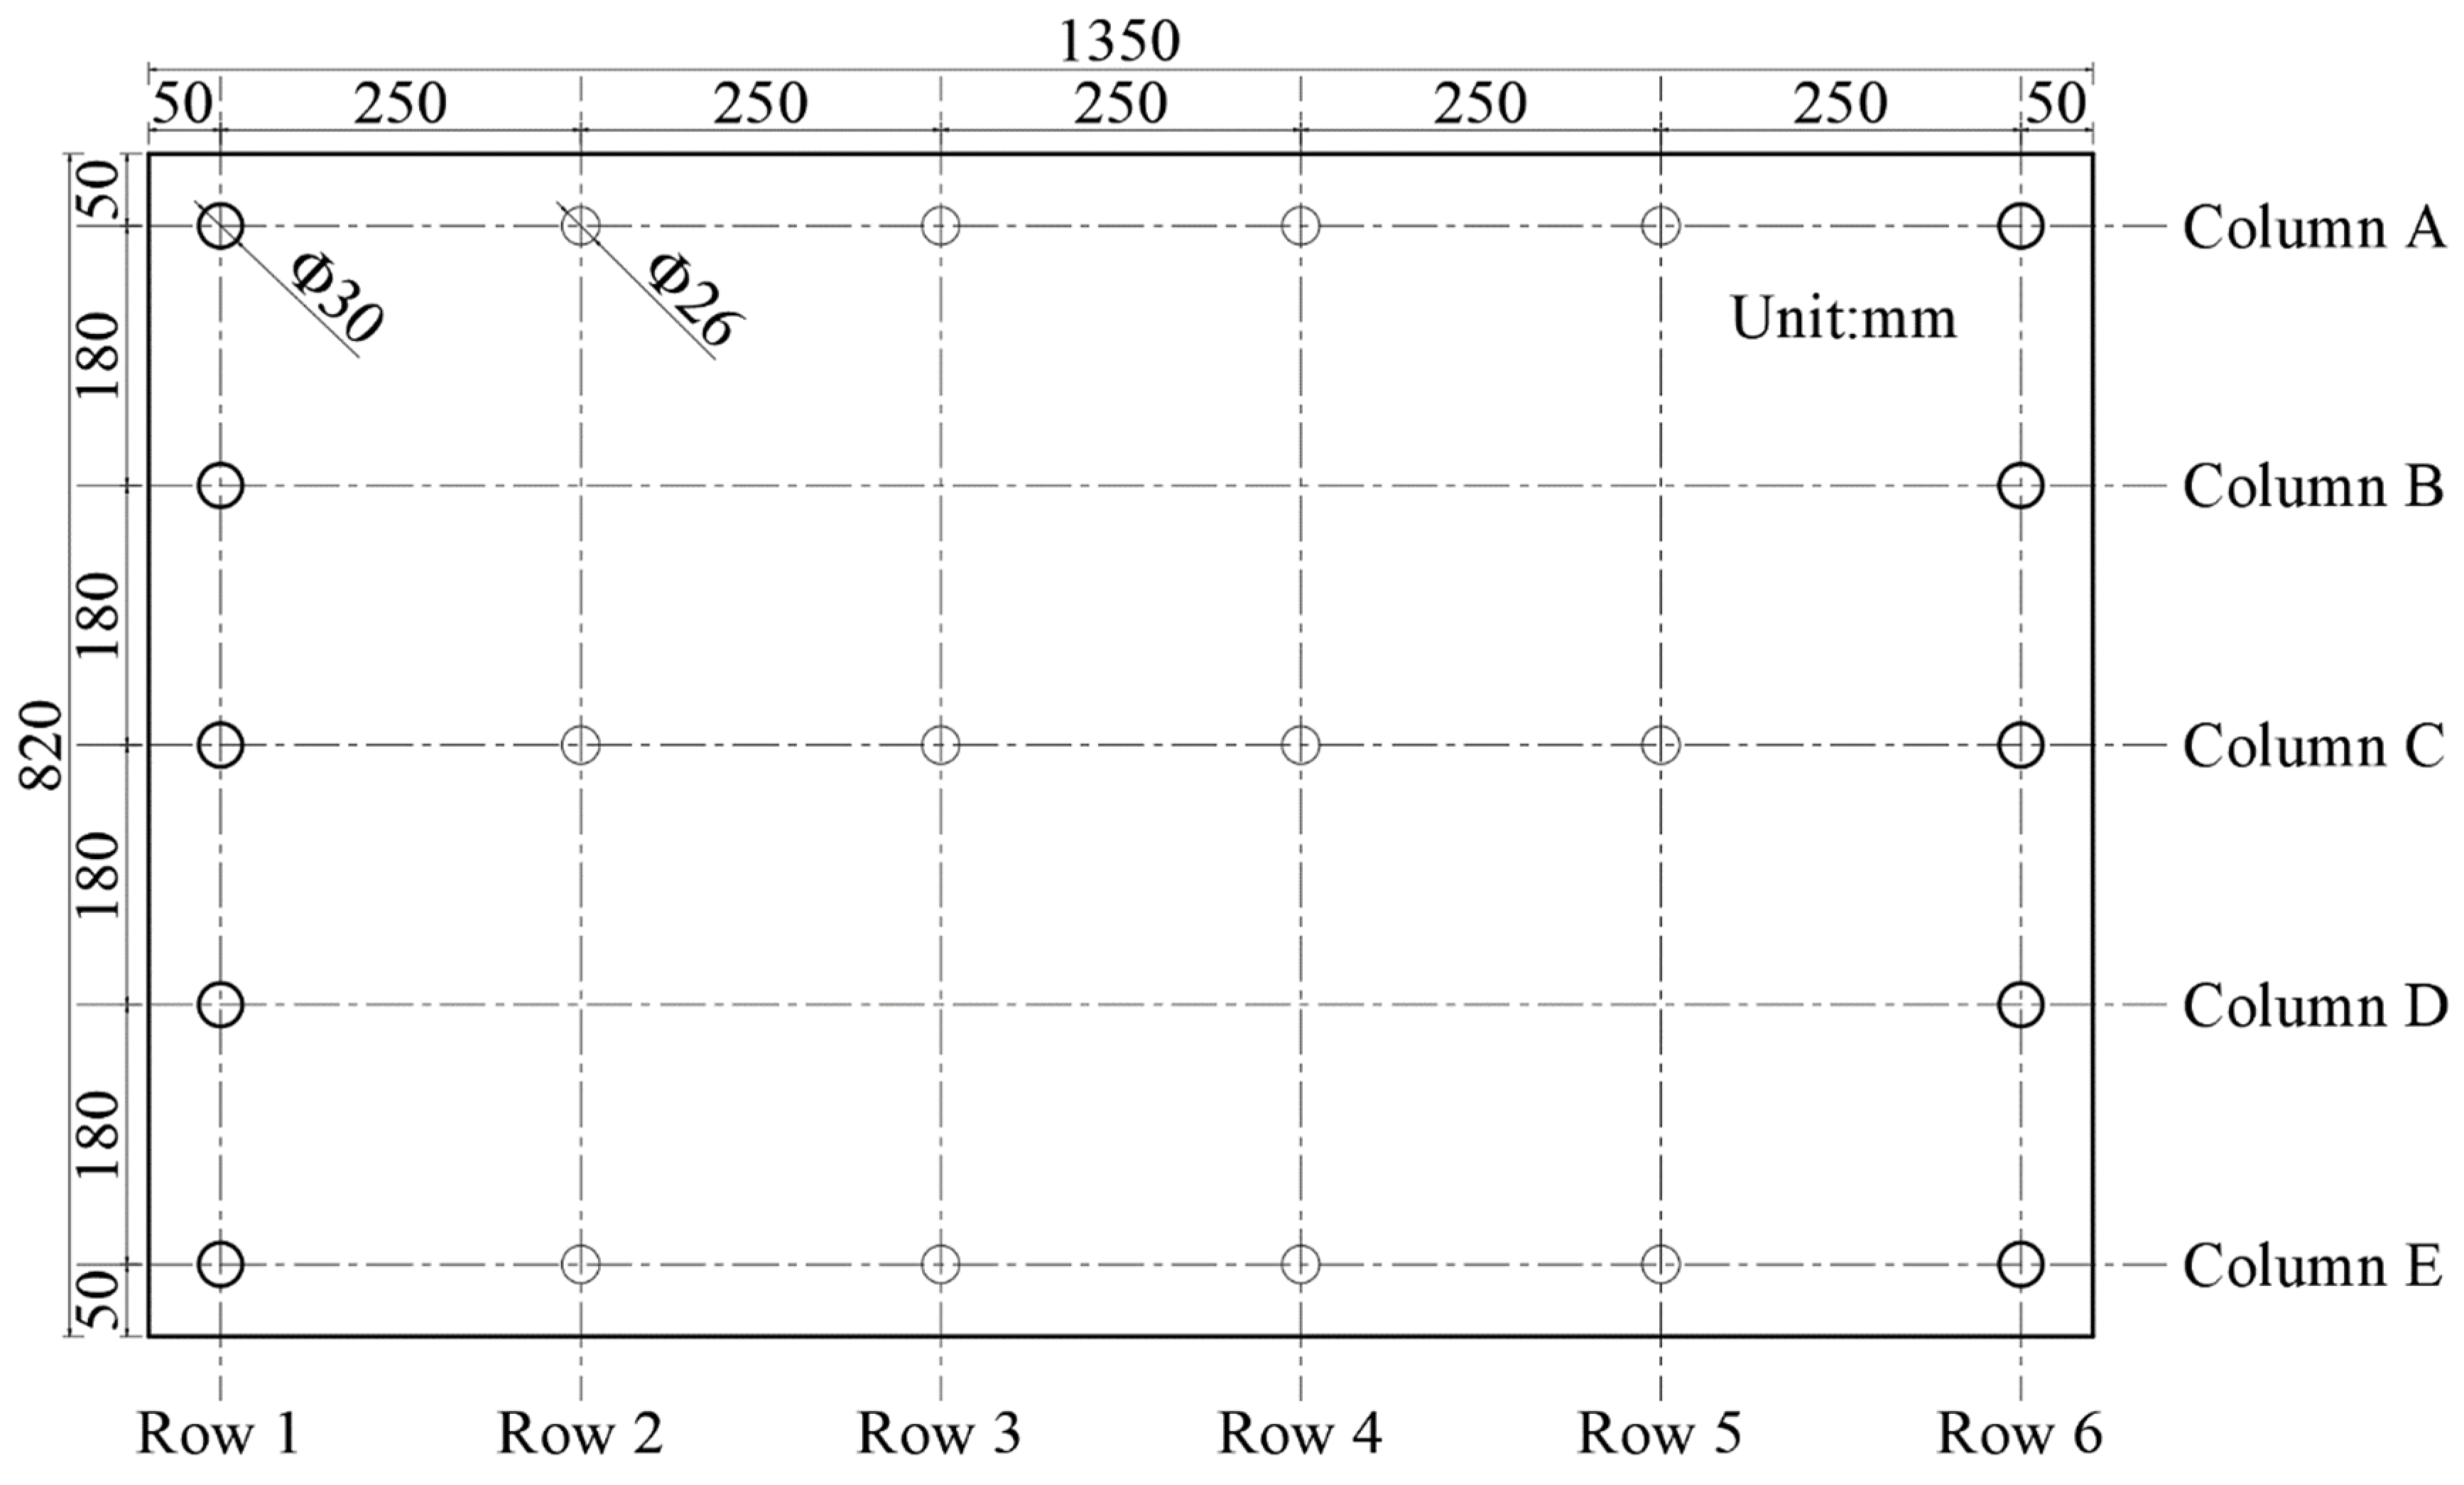
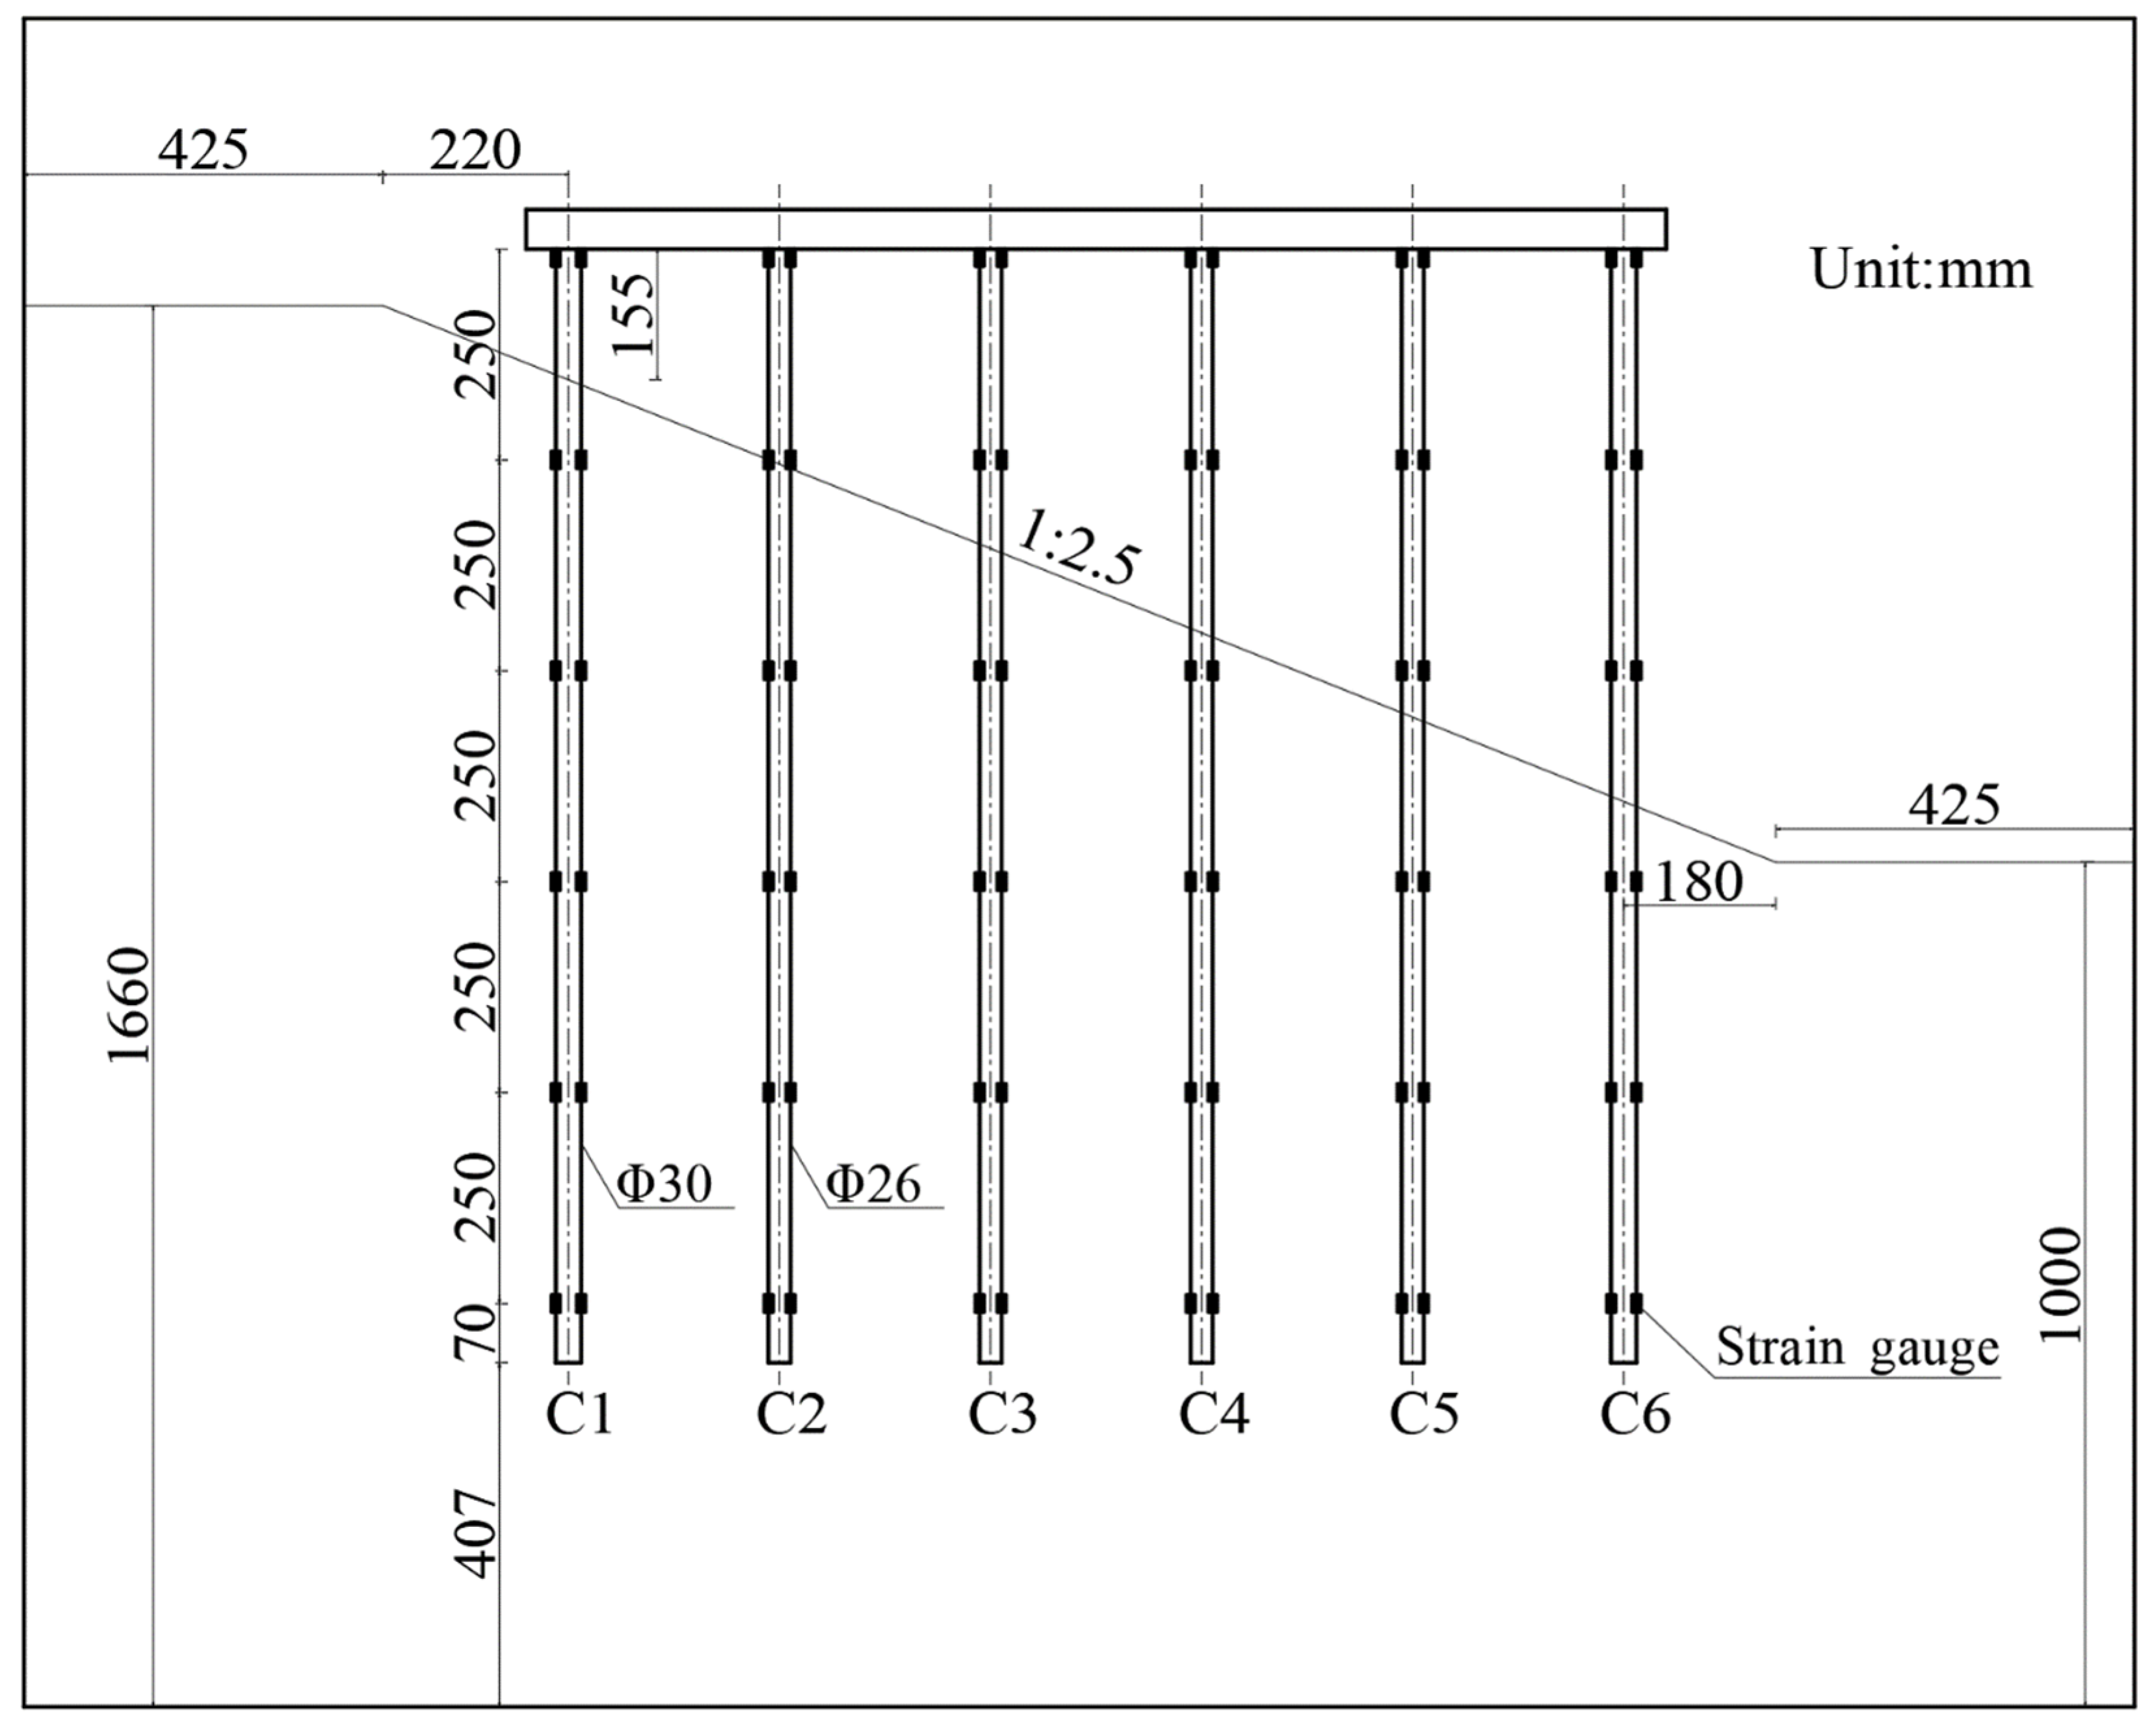
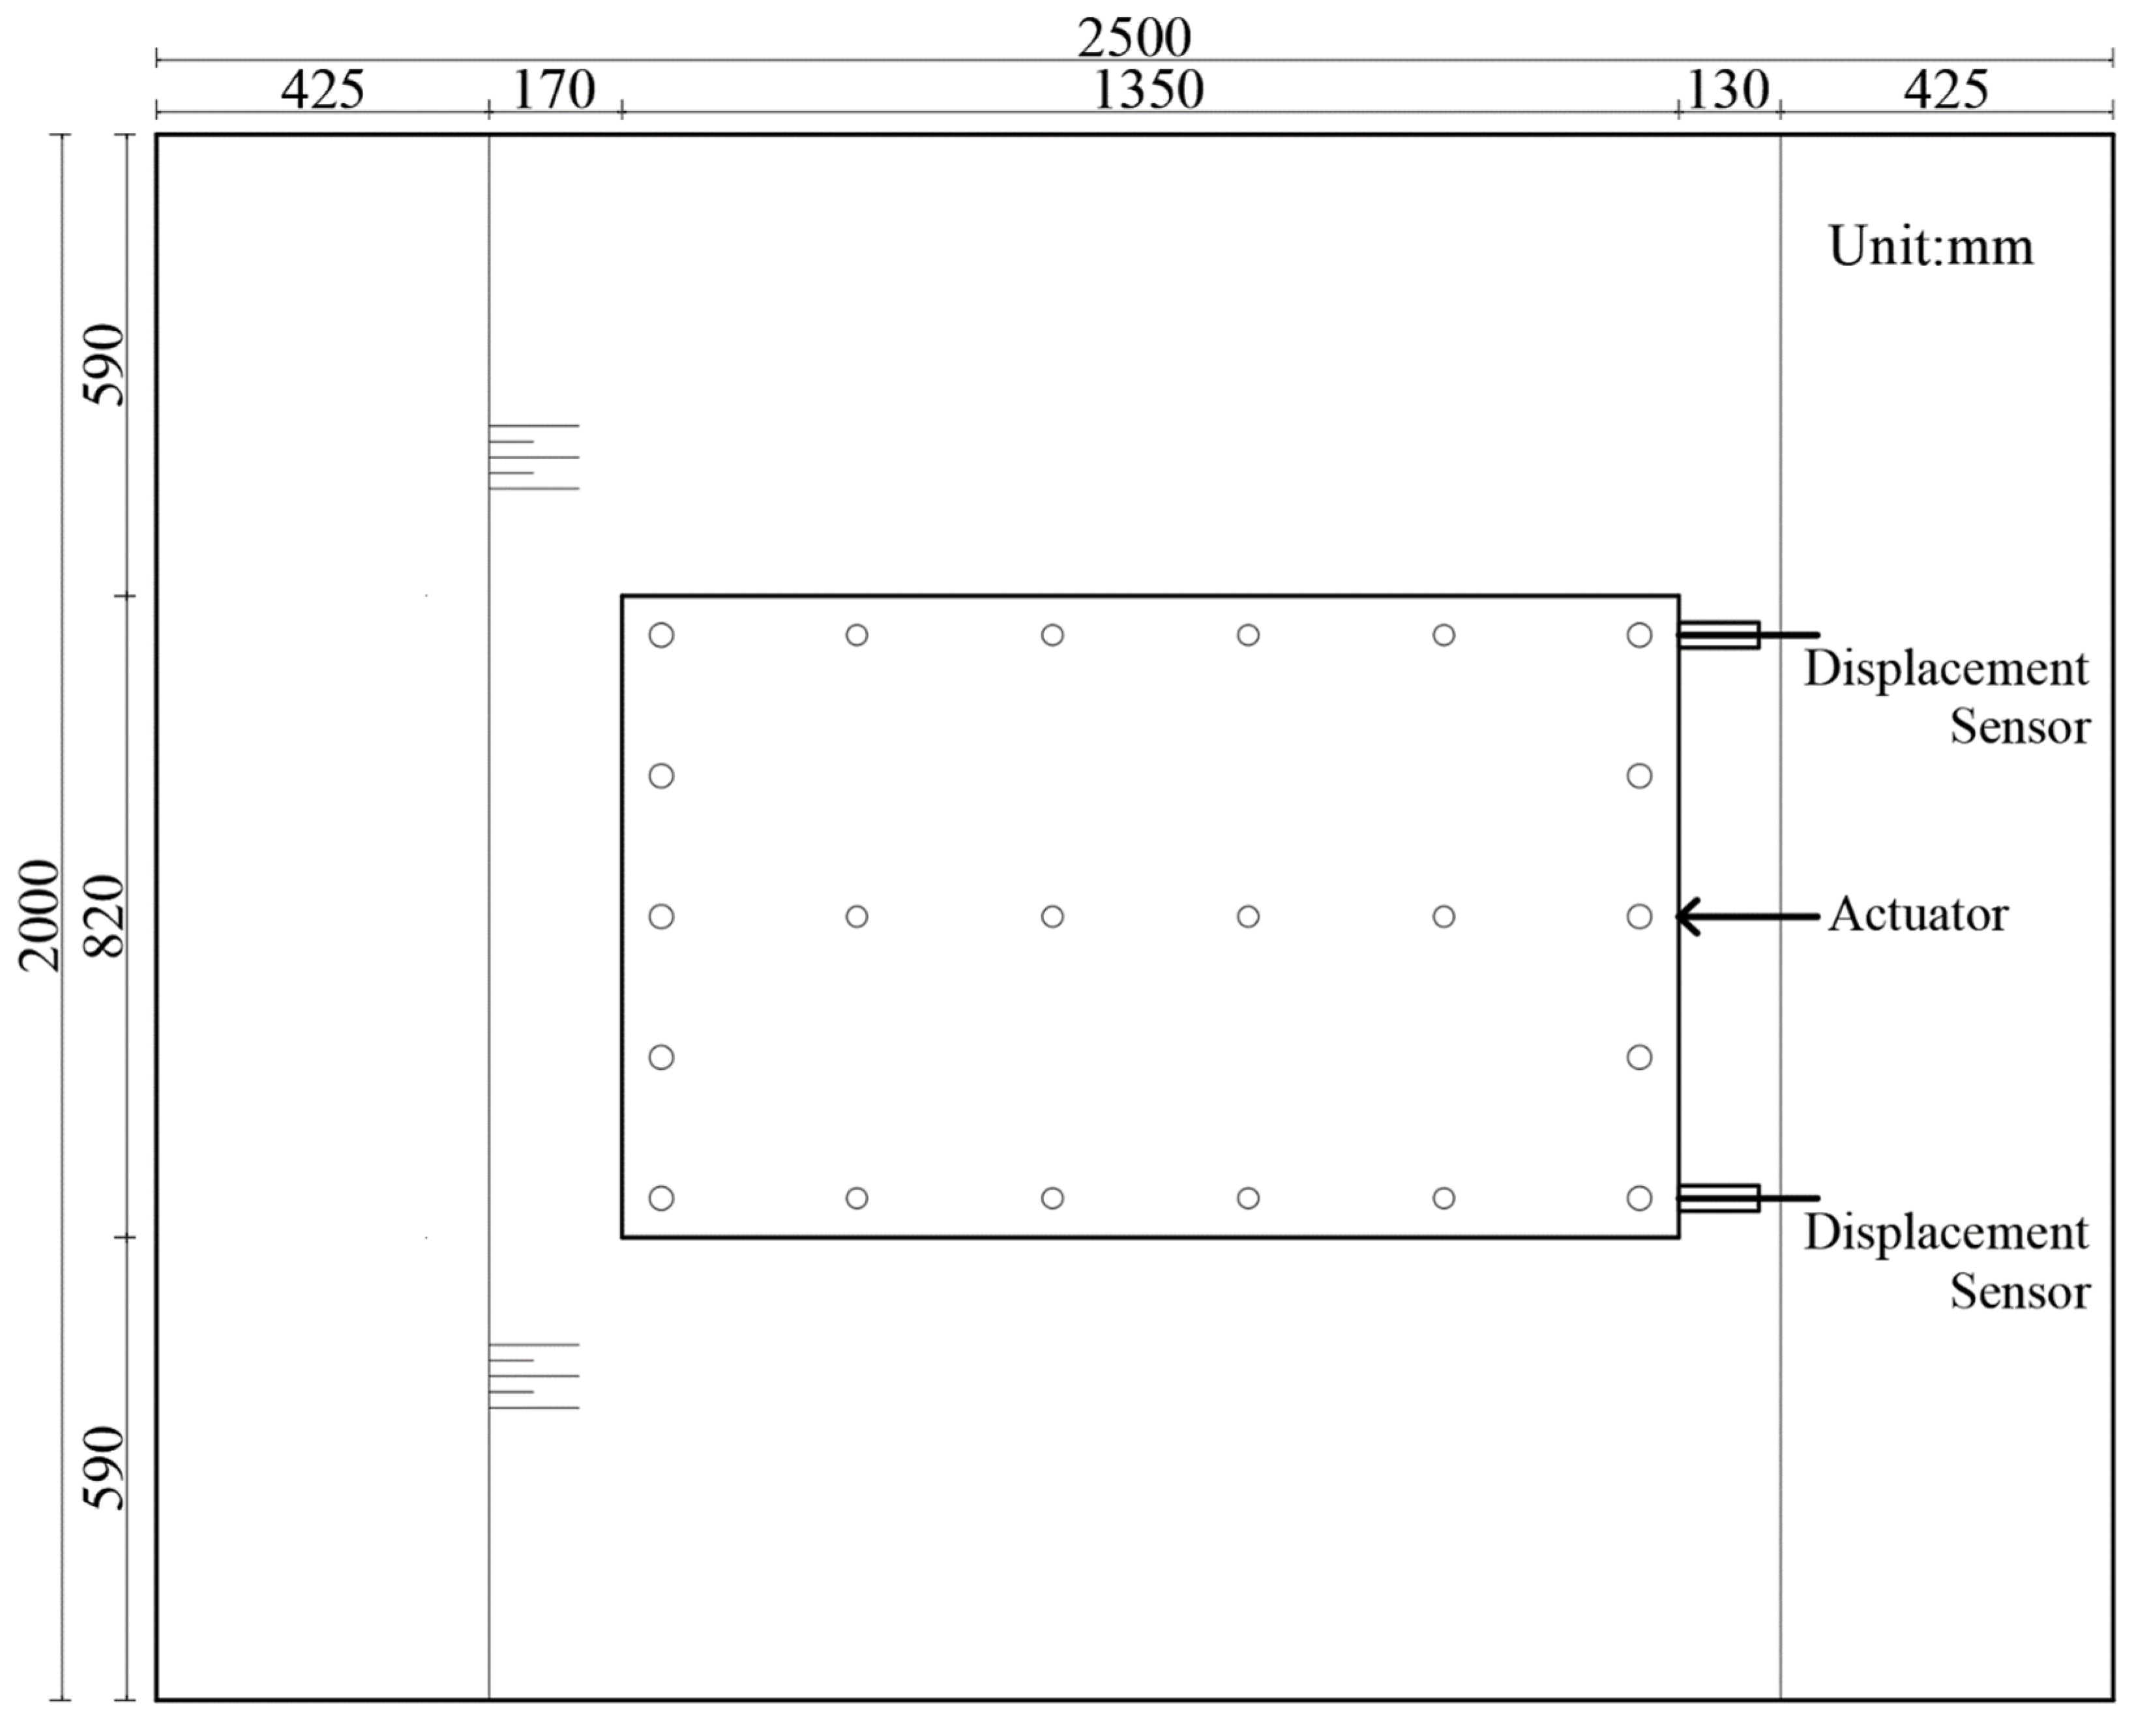
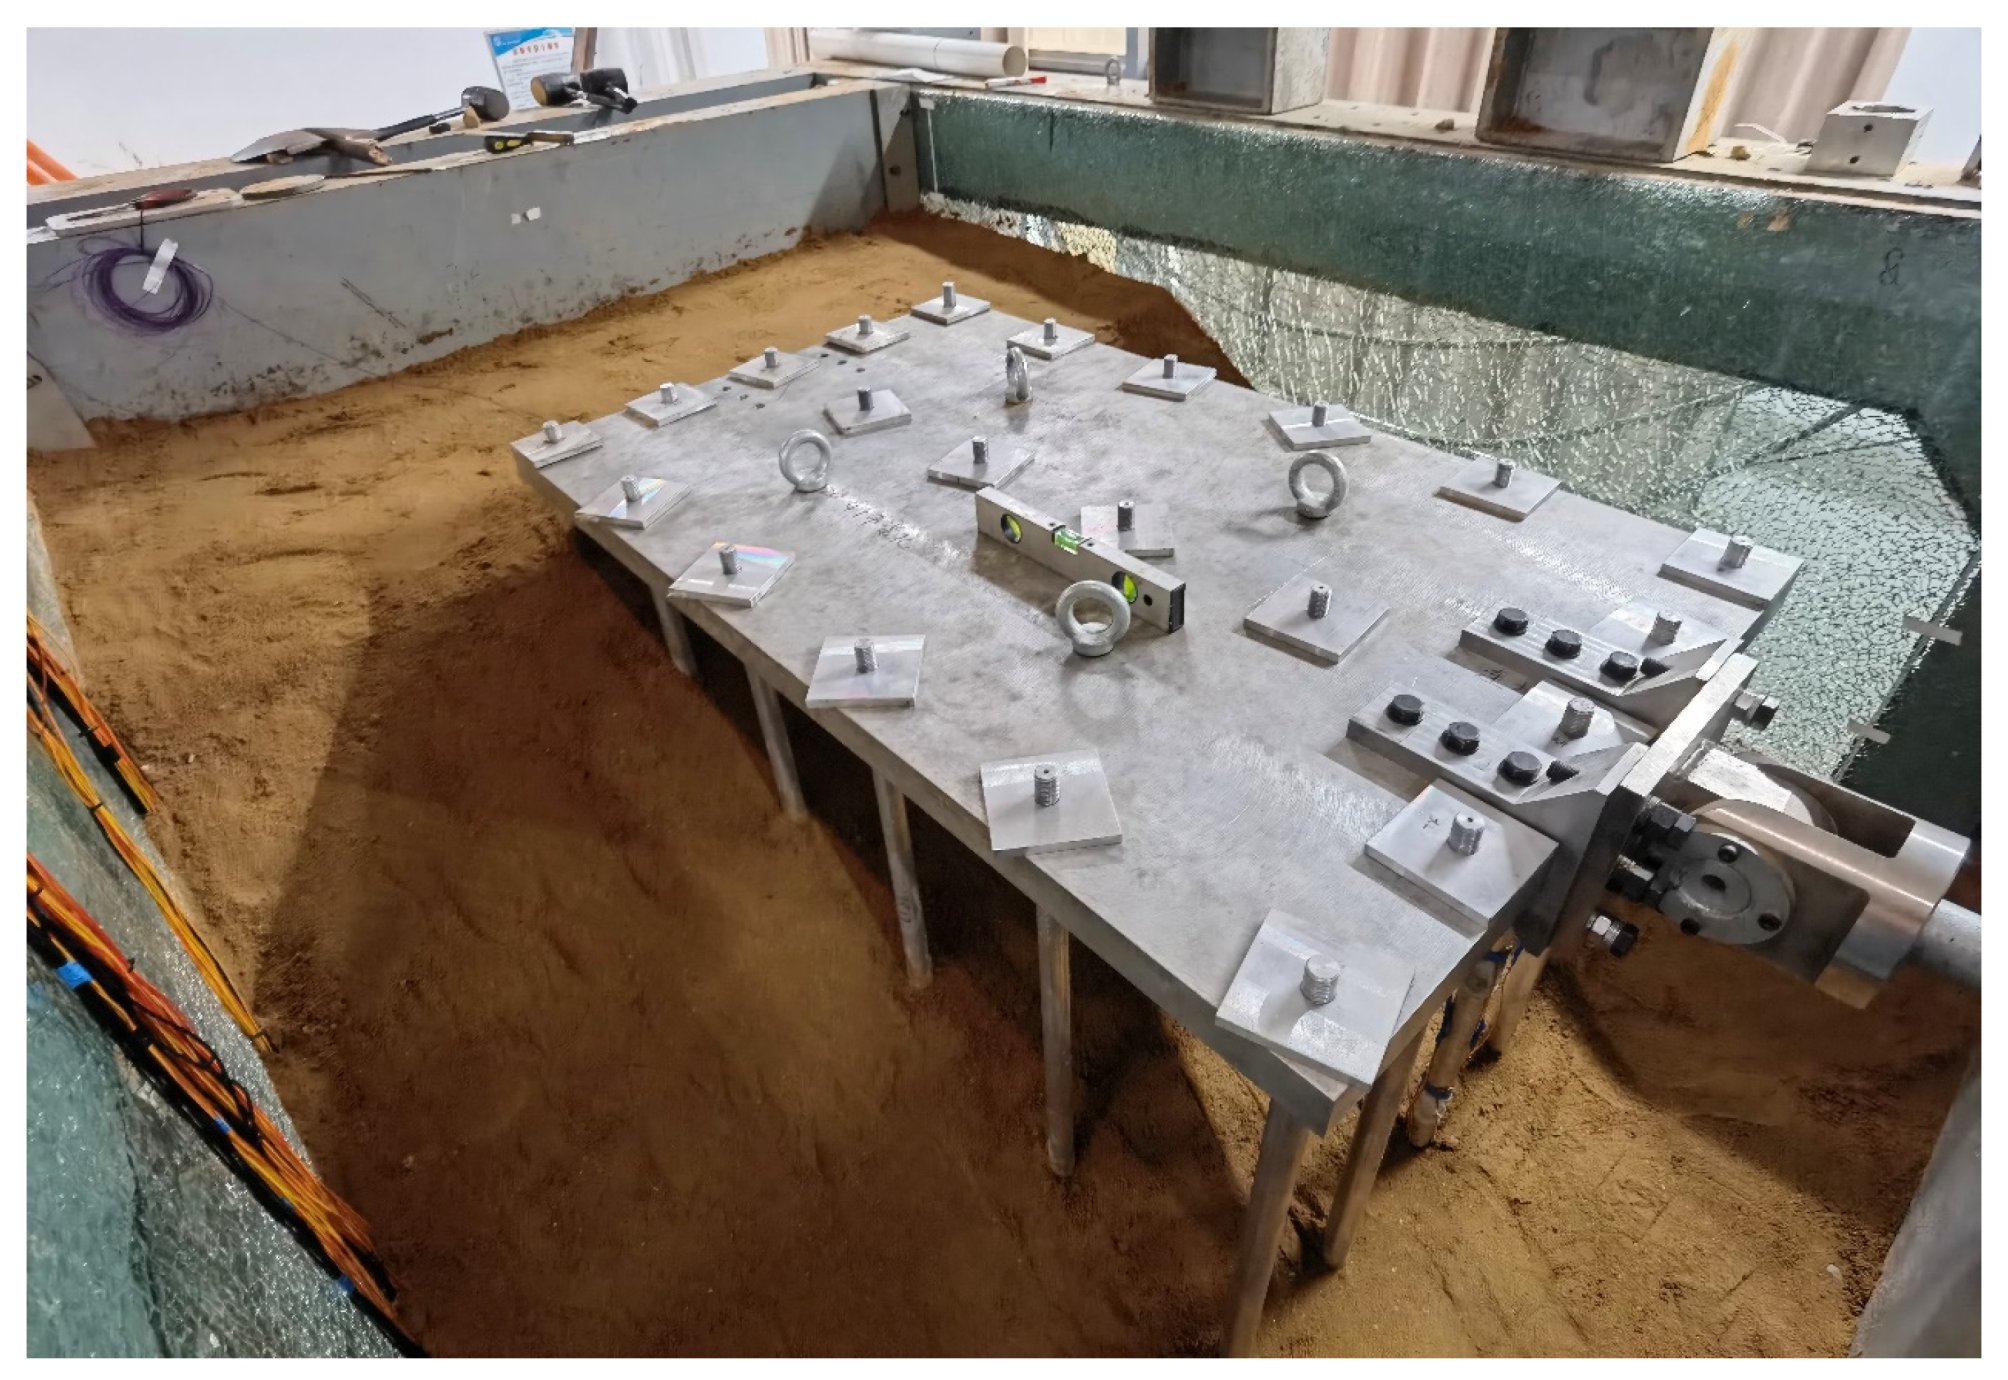
2.2. Design of Model Test

This quasi-static model test selected a 20 m wide segment from the PSW structure as the test prototype. As such, the selected wharf segment is 32.5 m long and 20 m wide and consists of 22 steel pipe piles in total, with a pile length of 33 m, as seen in Figure 1b. The test was conducted at the Civil Engineering Laboratory Center of East China University of Technology.
The test facility mainly consists of a soil container and a horizontal actuator. The internal dimension of the soil container in this test facility is 2.5 m long, 2.0 m wide, and 2.0 m high. The hydraulic actuator has a 200 kN load capacity, ±200 mm stroke capacity, and a maximum loading speed of 4.7 mm/s. The test model was designed based on the similarity theory [16,19,20] according to the test requirements, the characteristics of materials, and the conditions of the test facility. Considering the dimension of the selected prototype wharf structure and test facility, the geometric similarity ratio (Cl = Lm/Lp) between the test model and prototype was decided to be 1/25. Herein, L is the length, and m and p represent model and prototype, respectively. With this ratio, the space of the test equipment can be effectively used, and enough space is left for the actuator to operate. The distance from the model to the boundary is large enough that boundary effects in the soil can also be avoided. The required model parameters and the parameters provided by the actual test model are summarized in Table 1. The common parameters for the similarity design of the test model are shown in Table 2. Based on the above, the length of the model pile was decided to be 1.32 m.
The prototype wharf structure employs two types of steel pipe pile with outer diameters of 1000/1200 mm and thickness of 18 mm. Thus, the inertia moments of the pipe piles are 1.17 × 10⁻² m4 and 6.70 × 10⁻³ m4, respectively. The inertia moment similarity ratio CI = Cl4, so the corresponding inertia moments of the model piles are 2.99 × 10⁻⁸ m4 and 1.71 × 10⁻⁸ m4, respectively. As such, two types of model pipe pile were selected for the final test, and the parameters of the model pile are given in Table 1. The model piles have inertia moments of 3.12 × 10⁻⁸ m4 and 1.73 × 10⁻⁸ m4, respectively, which approximately satisfy the similarity ratio requirement.
The superstructure of the prototype wharf consists of a concrete deck and beams. The mass of the selected wharf segment is approximately 1978.85 t. Correspondingly, the mass similarity ratio Cm can be computed through Cρ·Cl3, and Cρ is the material density similarity ratio. It can be calculated that the mass of the model superstructure is 143.62 kg. The model uses a 47 mm thick aluminum plate to simulate the superstructure, and 22 pipe piles are bolted to the model deck rigidly. The arrangement of the piles can be seen in Figure 2. In order to evaluate the response of the piles under cyclic loading, six pairs of strain gauges were arranged on both sides of each pile in model row C, seen in Figure 3. Two displacement sensors were installed at the top of piles A6 and E6, as seen in Figure 4.
Particularly, it is difficult to employ the same or similar ratio for a sand stratum similar to the design of model structure when using the model test method to study soil–pile interaction [16,21,22]. Therefore, the soils selected in this test employed the actual medium sand with a moisture content of 2.3%, dry density of 1.7 g/cm3, and internal friction angle of 33°.
The arrangement of the model inside the soil container for the test is shown in Figure 4 and Figure 5. The sand stratum with a thickness of 400 mm was constructed firstly at the bottom of the soil container. Subsequently, the model wharf structure was installed in the center of the soil container with a distance of 407 mm from the pile tip to the bottom of the container. Thus, it can be seen that there was sufficient space around the model structure to reduce the impact of boundary effects [23]. Meanwhile, the right side of the model deck was jointed to the actuator through the pre-designed bolted connection (Figure 5). After the installation of the model wharf structure, the sand was slowly poured into the soil container to the specified height. The final setup of the quasi-static model test of the PSW–ground system is shown in Figure 5.

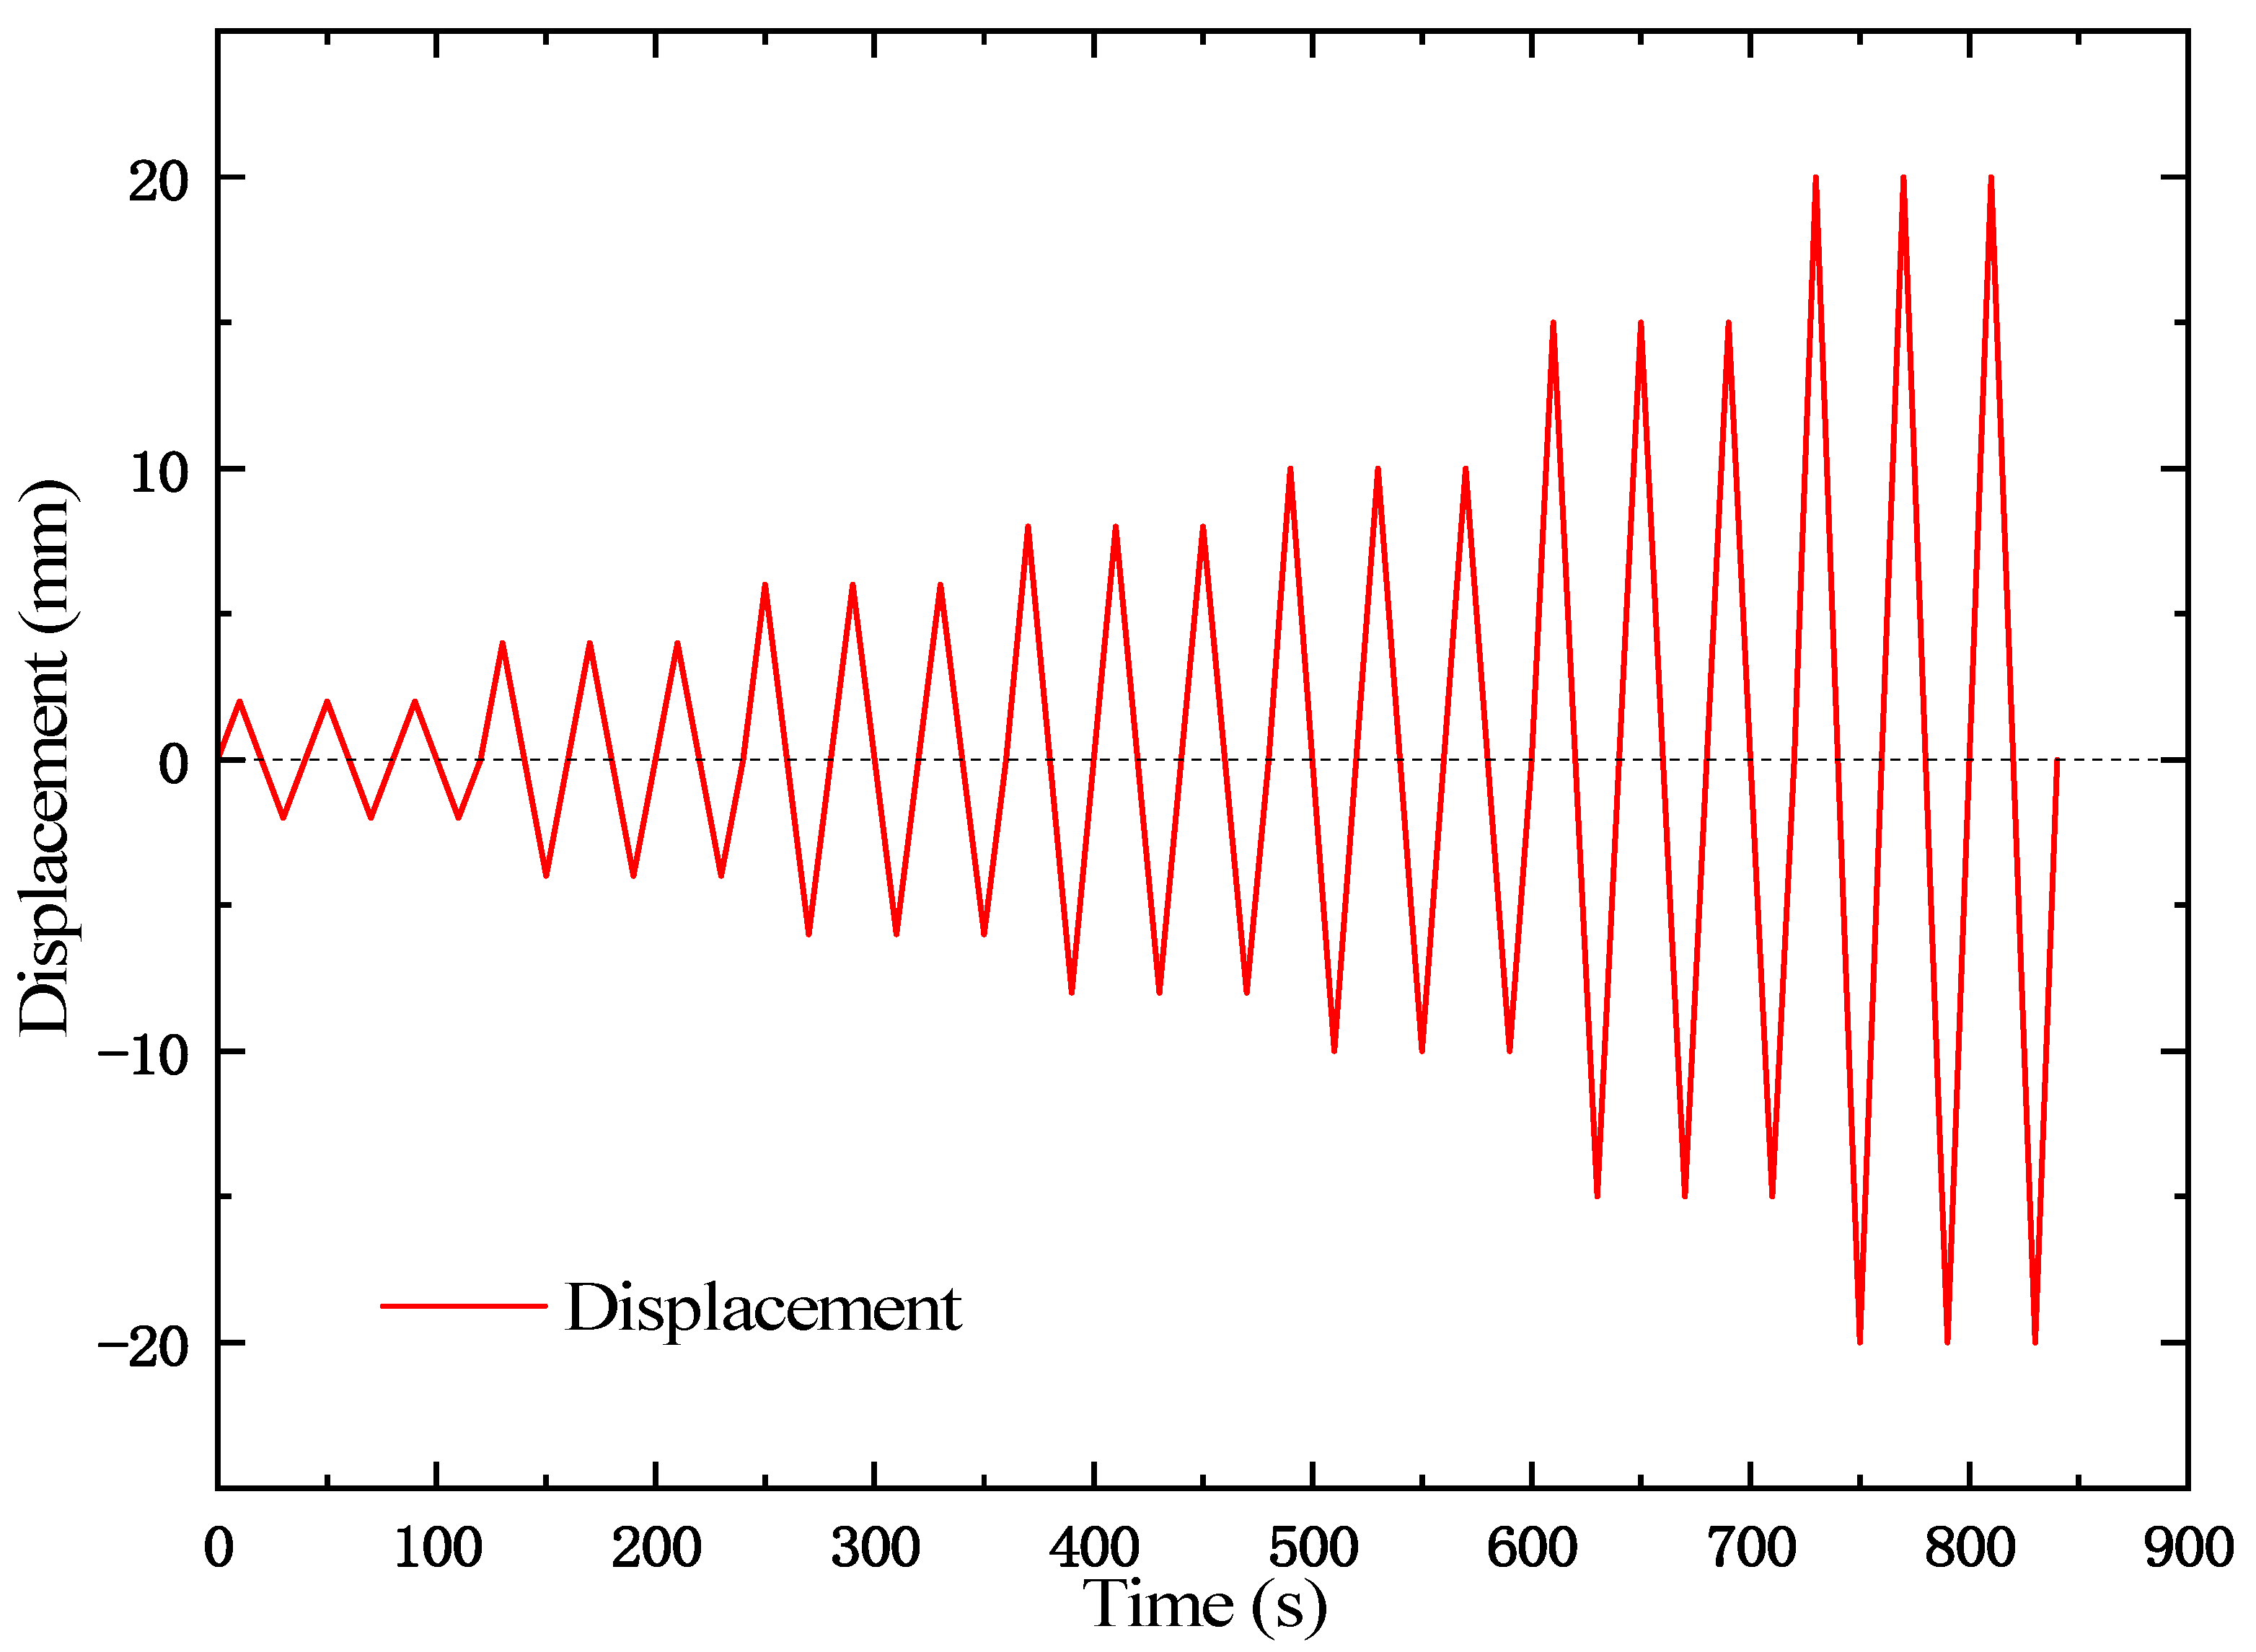
2.3. Test Loading Procedures

This quasi-static test mainly focused on the dynamic characteristics of the PSW structure located in the sloping ground and qualitatively investigated the dynamic performance of the pile foundation of the PSW structure. The actuator was attached to the right side of the deck to apply cyclic lateral loading, as seen in Figure 5. The test device utilizes a servo-controlled hydraulic actuator with a displacement capacity of ±200 mm. The test was performed with displacement-controlled loading with three cycles per level. The loading frequency was 0.025 Hz, and the loading amplitudes were 2, 4, 6, 8, 10, 15, and 20 mm (Figure 6).

3. Test Results and Analysis

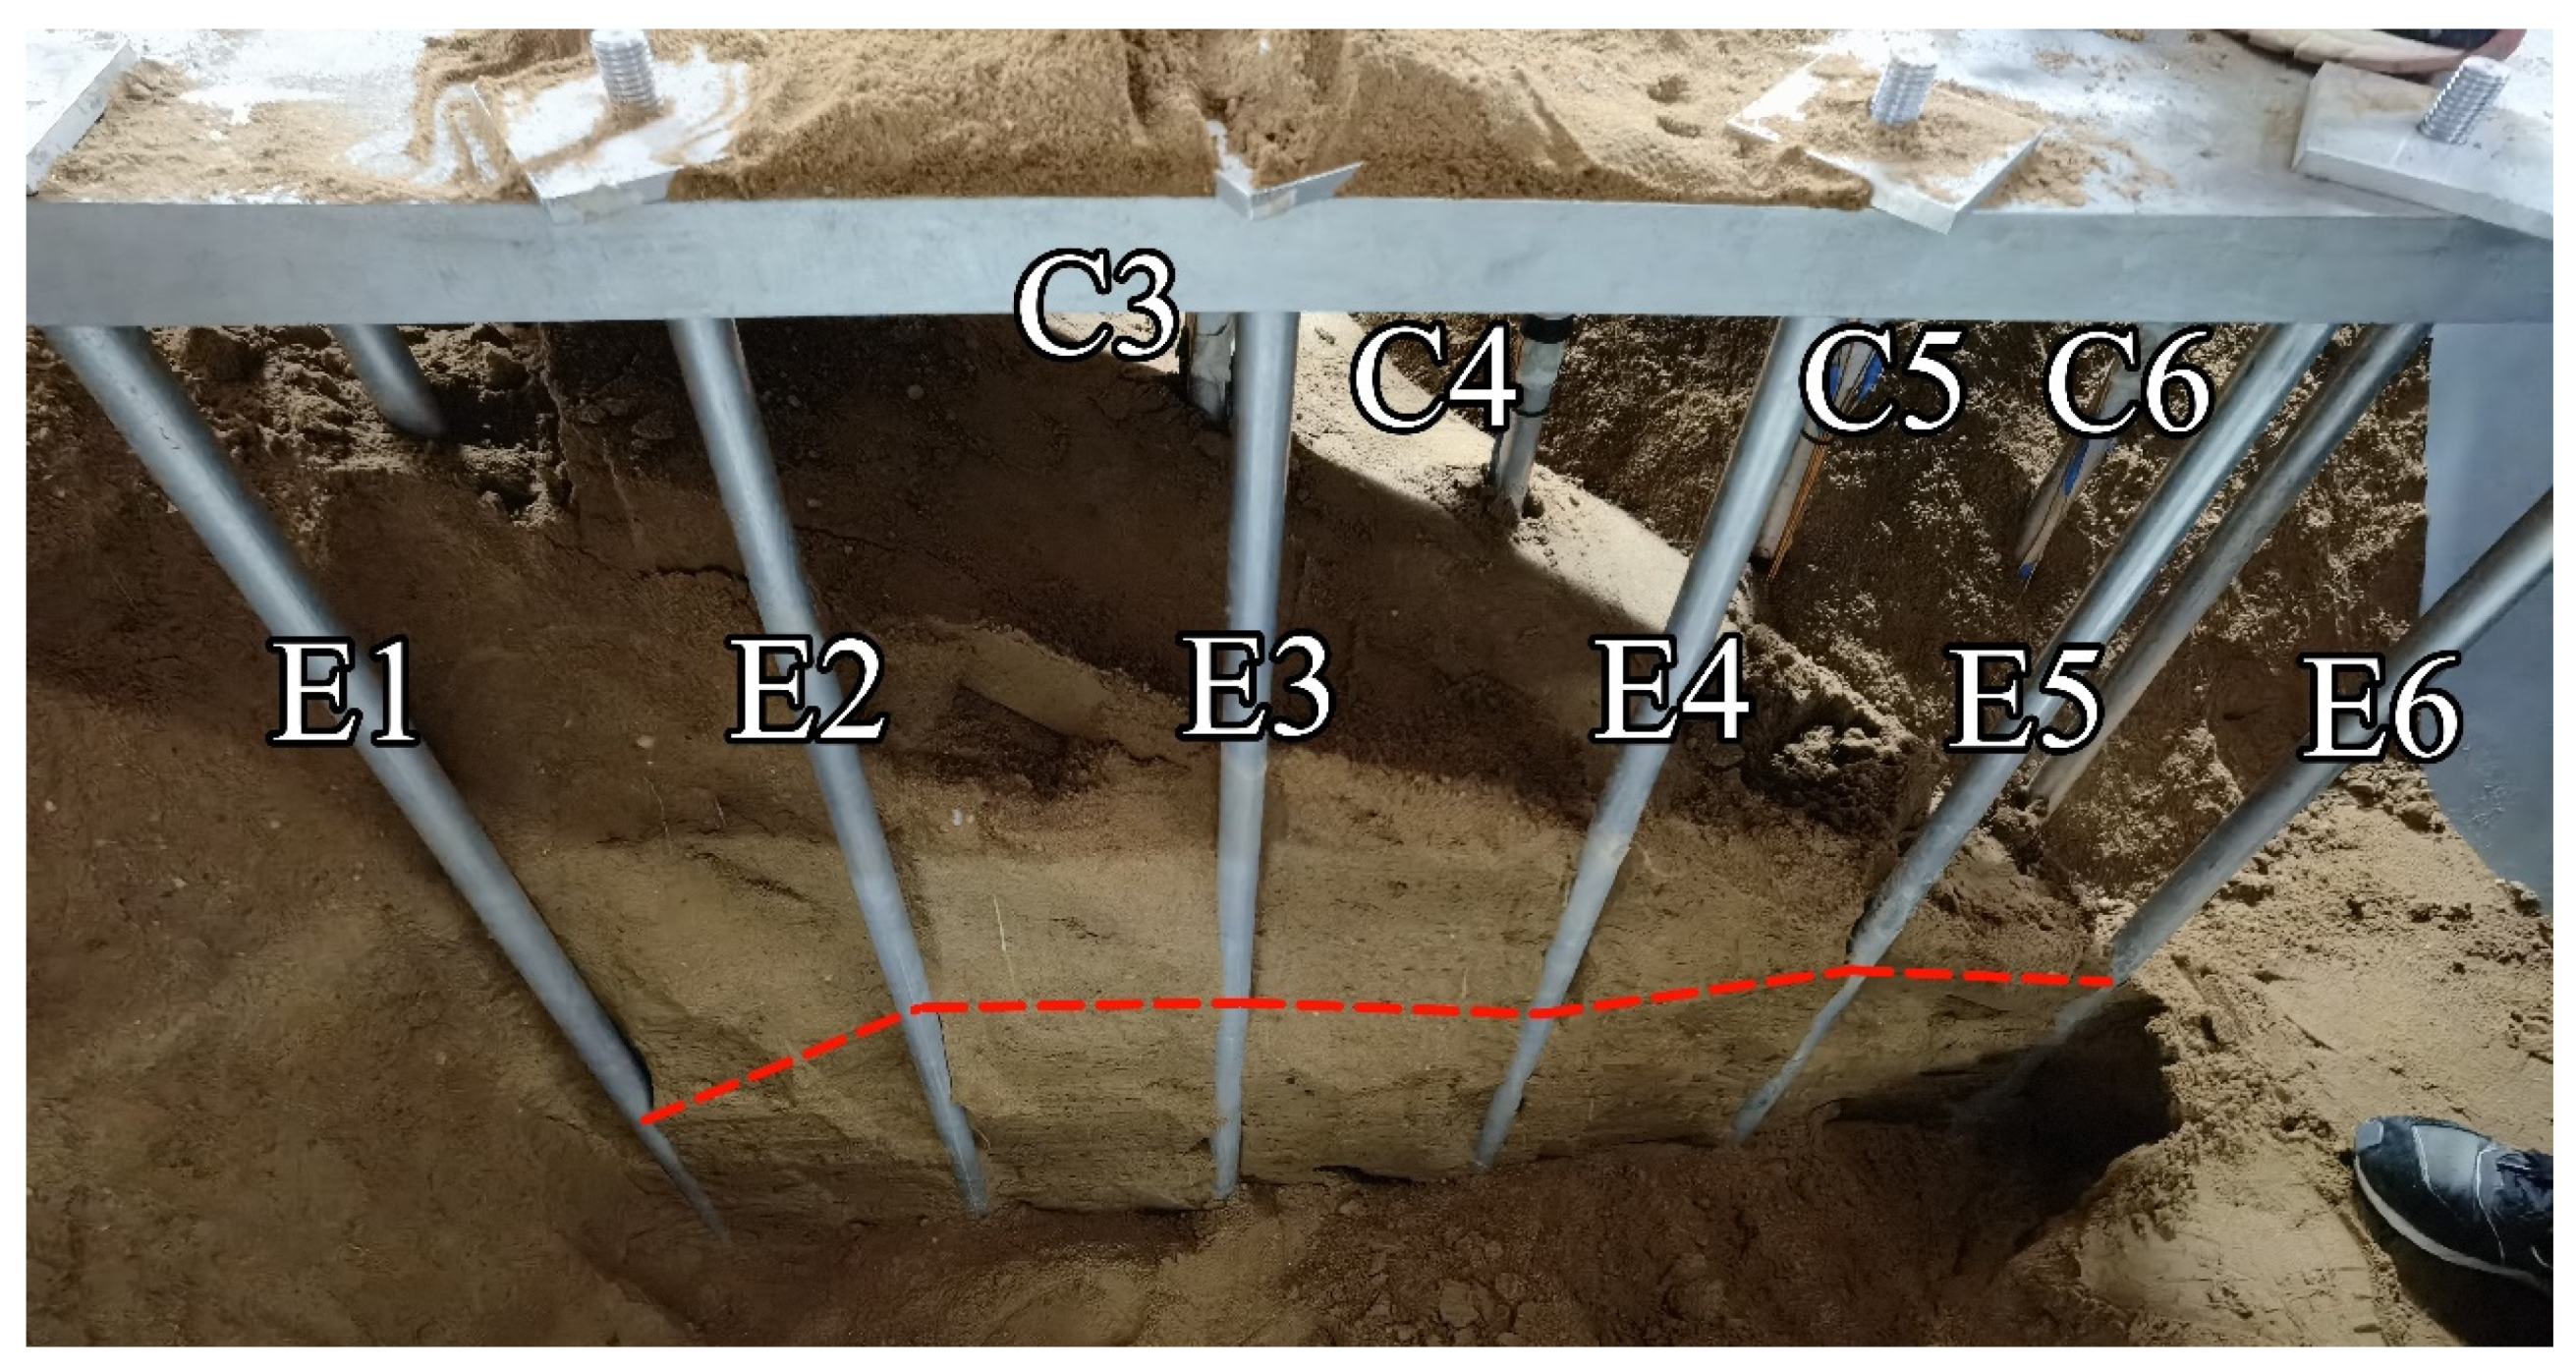
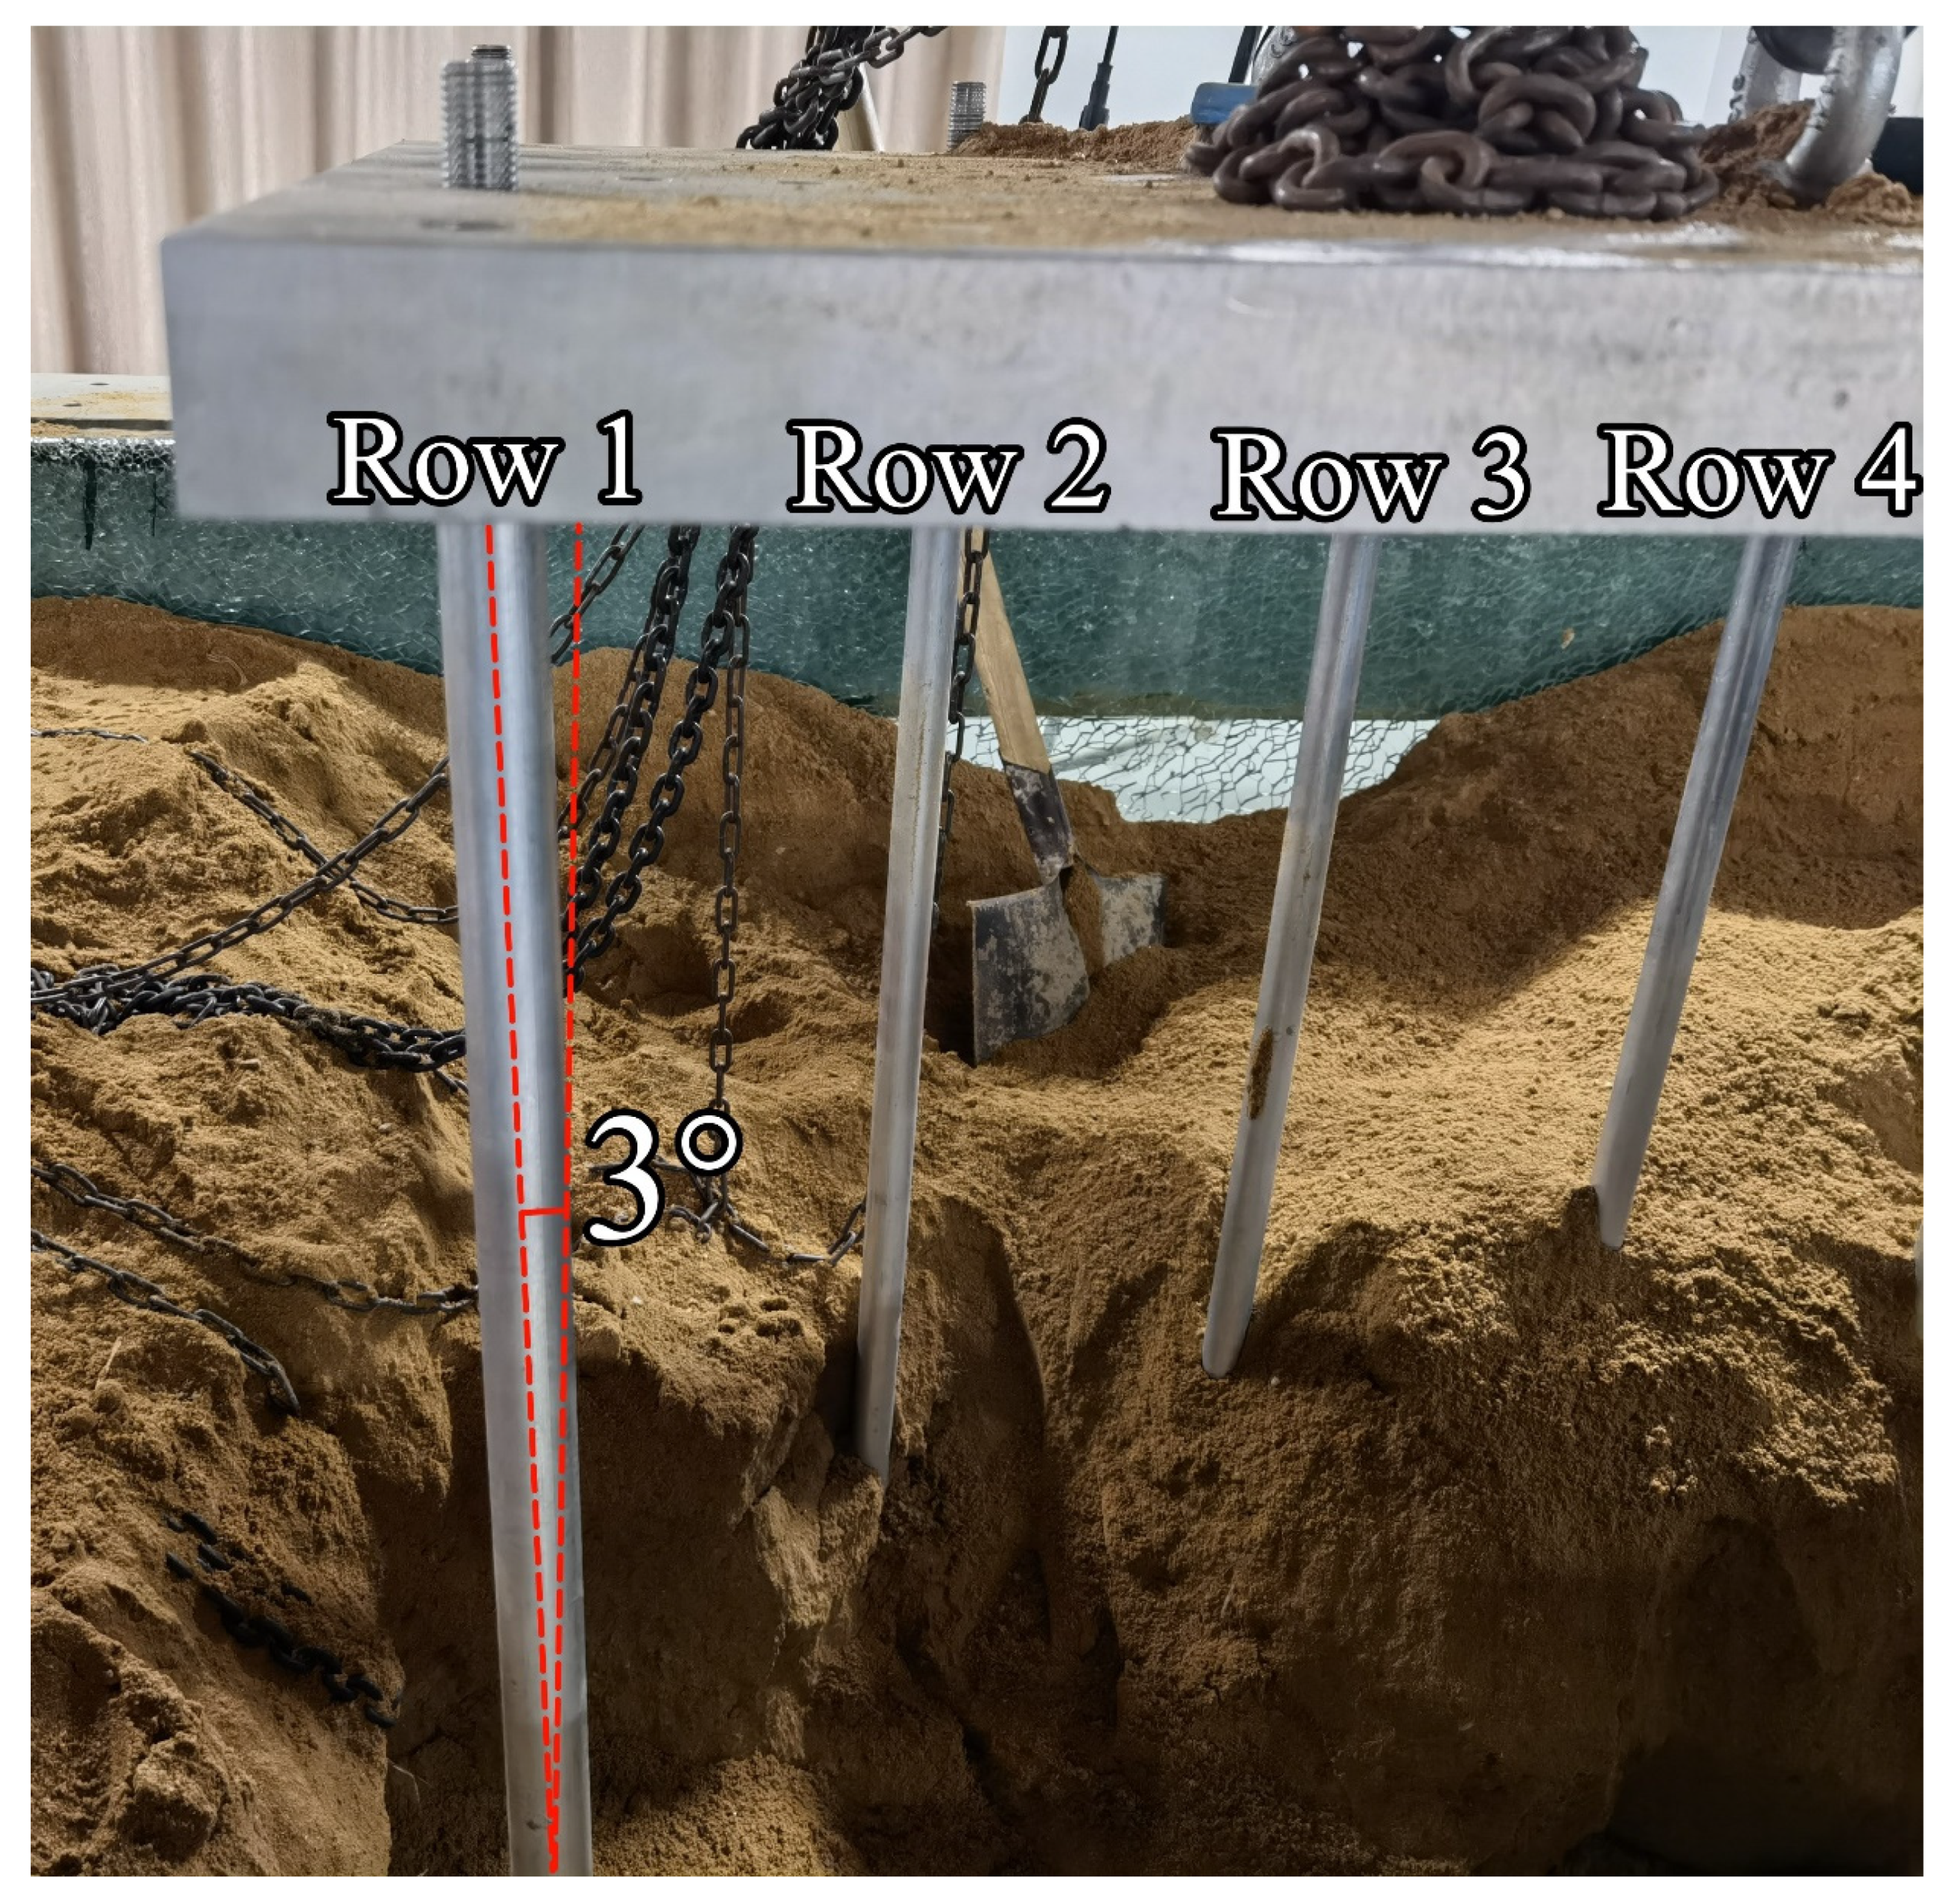
3.1. Sand Stratum Failure and Pile Deformation

After all loading steps, the failure state of the sand stratum inside the soil container is as shown in Figure 7. The cracks of the sand stratum around the landside piles (piles in row 1) are the most severe and connected. The failure extent of the sand stratum around the piles along column E decreases sequentially from the landside pile (E1) to the seaside pile (E6). Multiple deep shear cracks can be observed around pile E1 at an angle of roughly 35° along the axial line of pile row 1. One of the shear cracks is located at the top of the slope towards the edge of the soil container, and the other two are located on the slope towards the downslope. Similar sand stratum failures can be also observed around pile row 6. Compared with pile row 1, the failure extent of sand stratum around pile row 6 appears to be much slighter.
Meanwhile, continuous shear cracks are also observed on the outside of piles along the axial line of pile column E. The failure of the sand stratum around pile column A is similar to that around pile column E. These cracks are caused by soil wedge slip of general shear failure. No shear cracks are observed around the other four piles (i.e., C2 to C5) in the center area of the pile group, where only limited extrusion failure of the sand stratum is observed. Table 3 shows the cracks observed around the piles, which do not include the vast gaps and continuous shear cracks between the piles. The actuator push direction is used as the zero-degree line, and the angle (accurate to 5°) is measured in the clockwise direction.
Through excavating the sand stratum at the location of pile column E after the test, the deep sand stratum failure can be observed, as shown in Figure 8. Similarly, the failure of the sand stratum around pile E1 is the most severe, and the failure depth is the greatest. From pile E1 to pile E6, the failure severity of the sand stratum decreases, the maximum failure depth of the sand stratum becomes shallower (red line in Figure 8), and the maximum failure depths are 63 cm, 45 cm, 36 cm, 27 cm, 11 cm, and 2 cm, respectively.
When the test is completed, residual deformation of the bolts, which are used to fix the model piles at the top of pile row 1, can be observed, shown in Figure 9. The deformation of the pile top tilts about 3° relative to its original position. That is because the deck and piles are rigidly connected, and a significant bending moment occurs at the top of the pile during cyclic loading. The landside piles have the deepest pile embedded depth and suffer the largest constraints in the lower part by the soil surrounding. Due to the relatively short portion above the ground surface of the landside pile, for the same pile top displacement, the angular displacement generated at the landside pile top is larger. That leads to a greater bending moment and results in bending deformation of the pile top bolt. It can also be seen from the pile bending moment results in the later section that the maximum bending moment is generated at the top of the landside pile. No deformation was observed for pile rows 2~6.

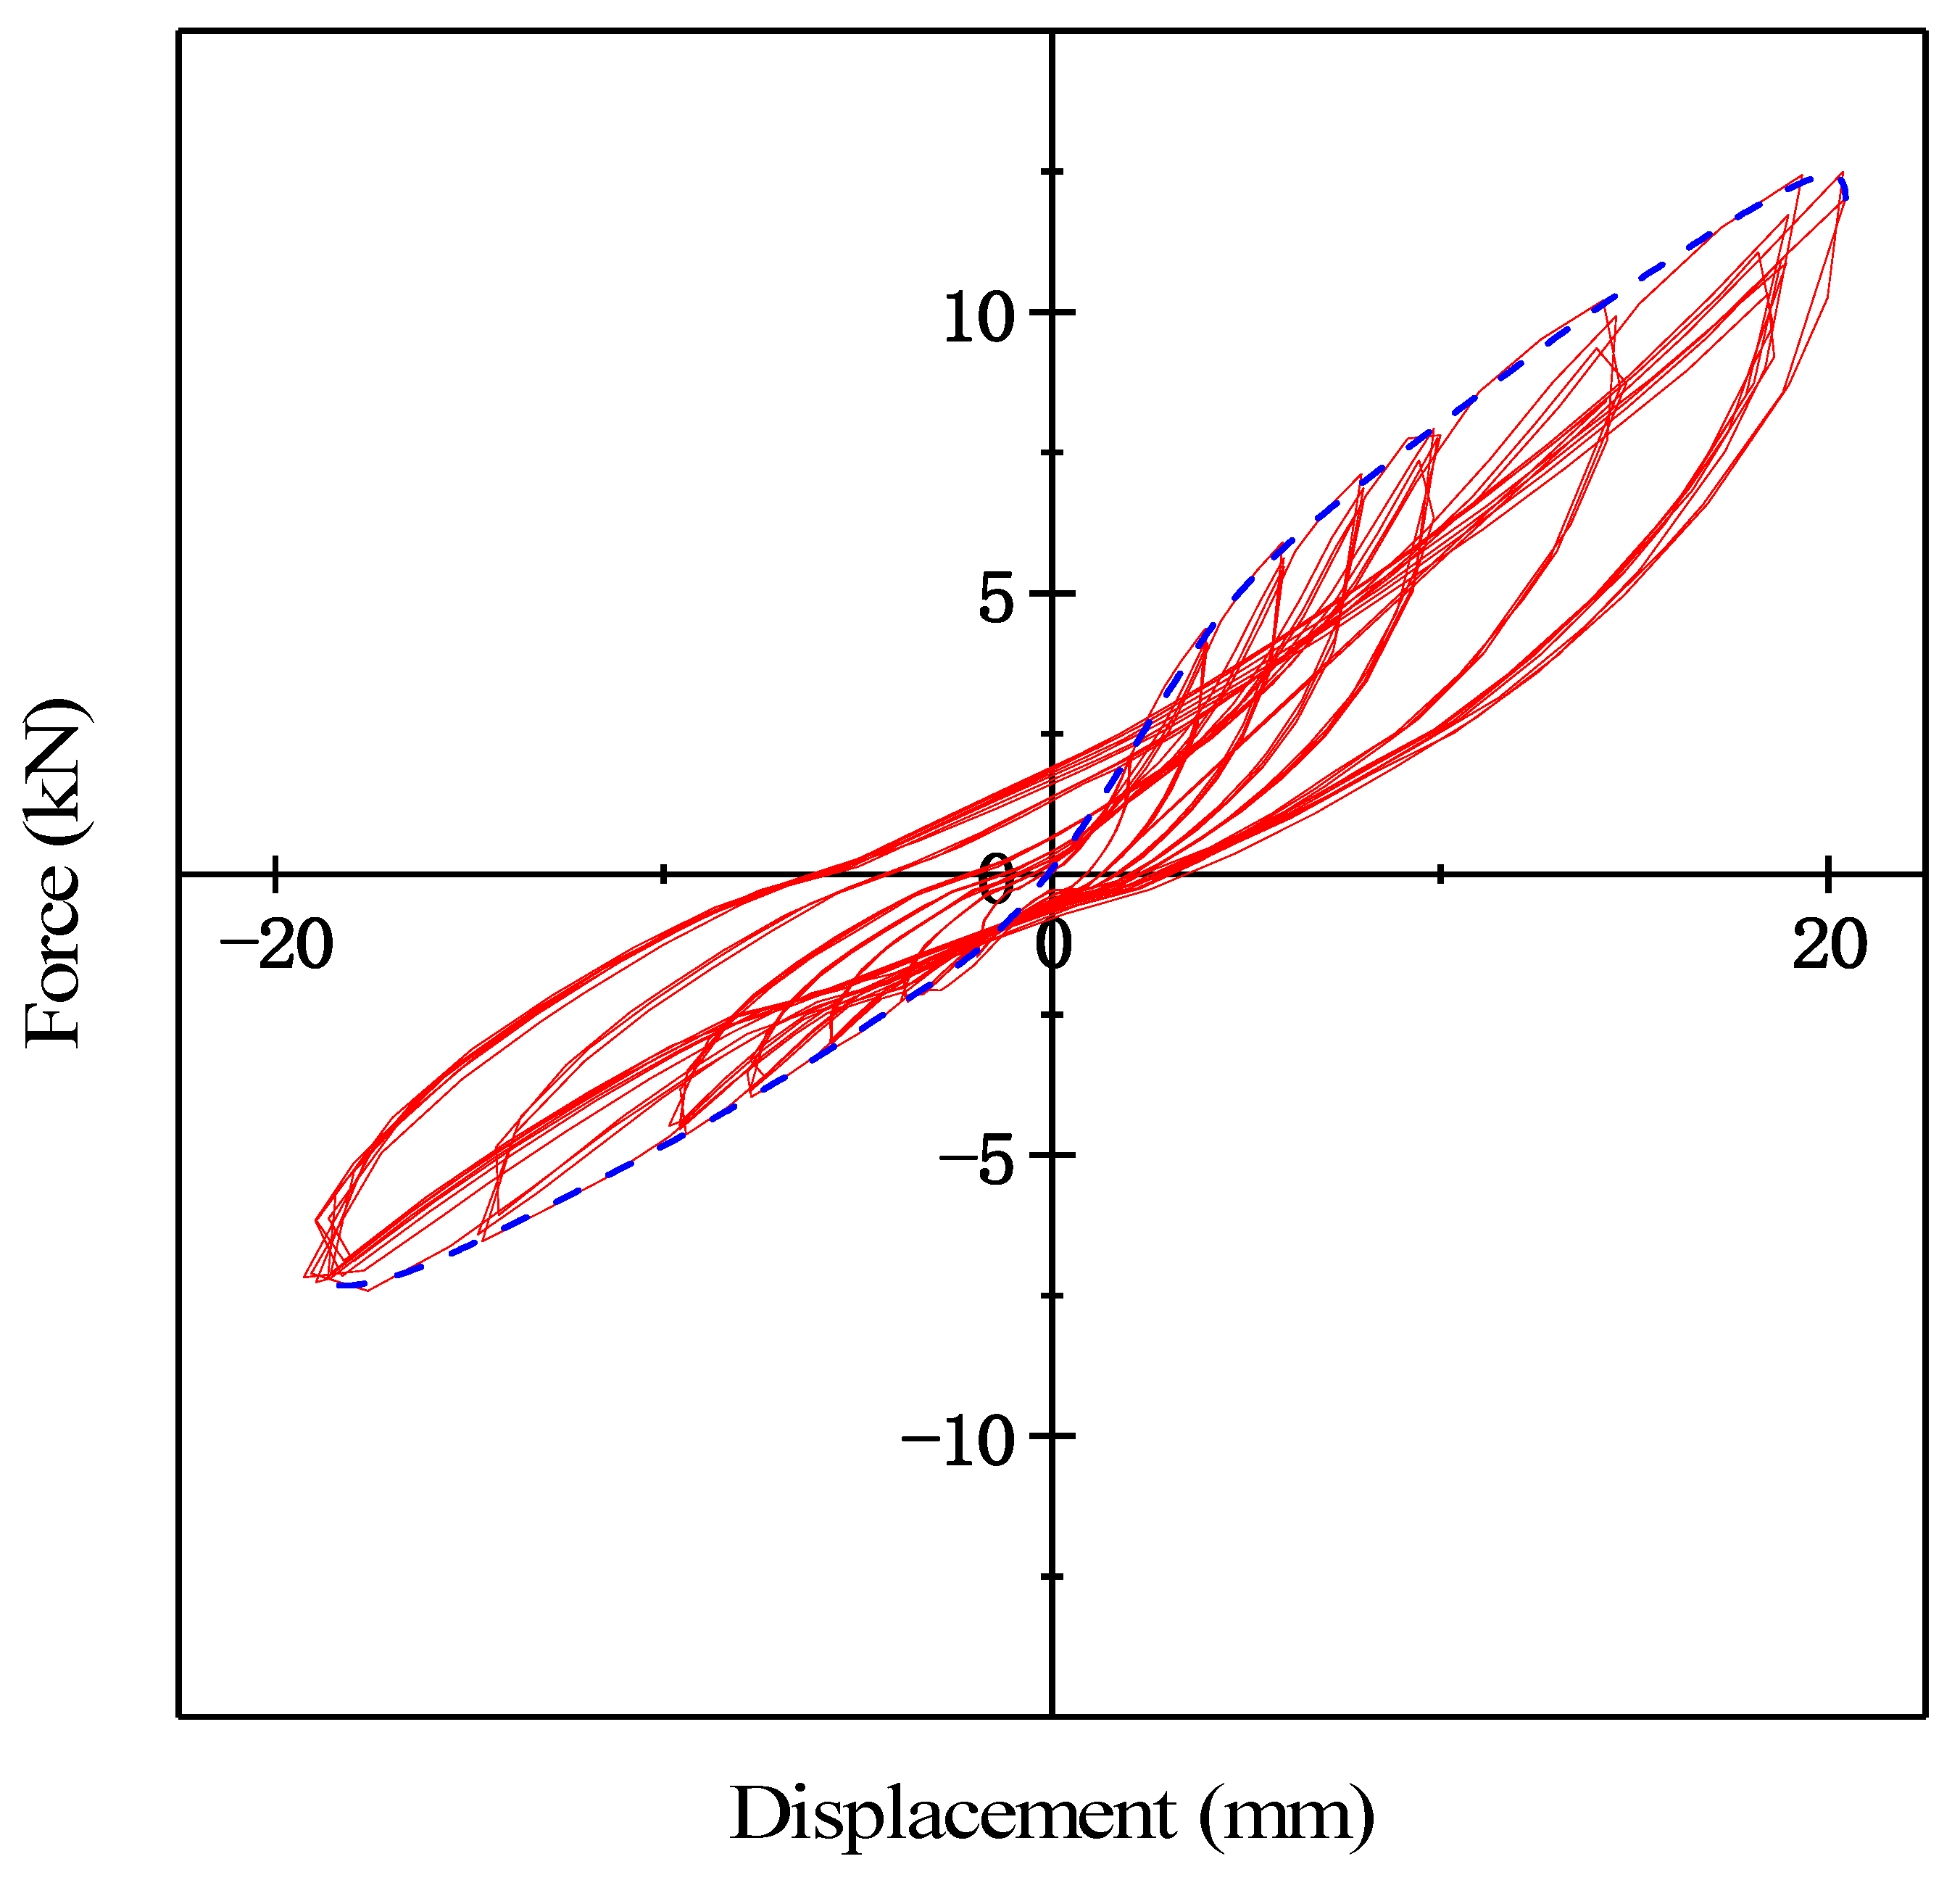
3.2. Hysteresis Curve and Skeleton Curve

The hysteresis curve describes the relationship between the applied displacement and the resistance of the PSW–ground system at each loading cycle during the cyclic lateral loading. The skeleton curve is the hysteresis curve’s envelope and represents this system’s stiffness change characteristic at each loading cycle. In general, the skeleton curve is formed by connecting the peak load–displacement points at each level of cyclic lateral loading. Based on the above, Figure 10 shows the hysteresis curve and skeleton curve of the PSW–ground system. It can be seen that the graphs are not symmetrical, and this is due to the sloping ground inside the soil container.
Furthermore, in Figure 10, the shape of the hysteresis curve is quite narrow and thin, and the displacement–load force relationship is approximately linear. For each loading level, the three hysteresis loops do not entirely coincide, and the resistance force of the PSW–ground system decreases sequentially. The reason for this is the vast stiffness difference between soil and pile, which will cause the deformation of soil and pile not to be coordinated. During the loading process, the model piles are still in the elastic stage, but the soil around the piles has gradually entered the plastic stage. As the soil cannot return to its original position due to deformation, voids are created between the piles and the soil. The presence of such voids results in the soil resistance not being well transferred to the pile, and the energy is converted into the deformation of the piles.

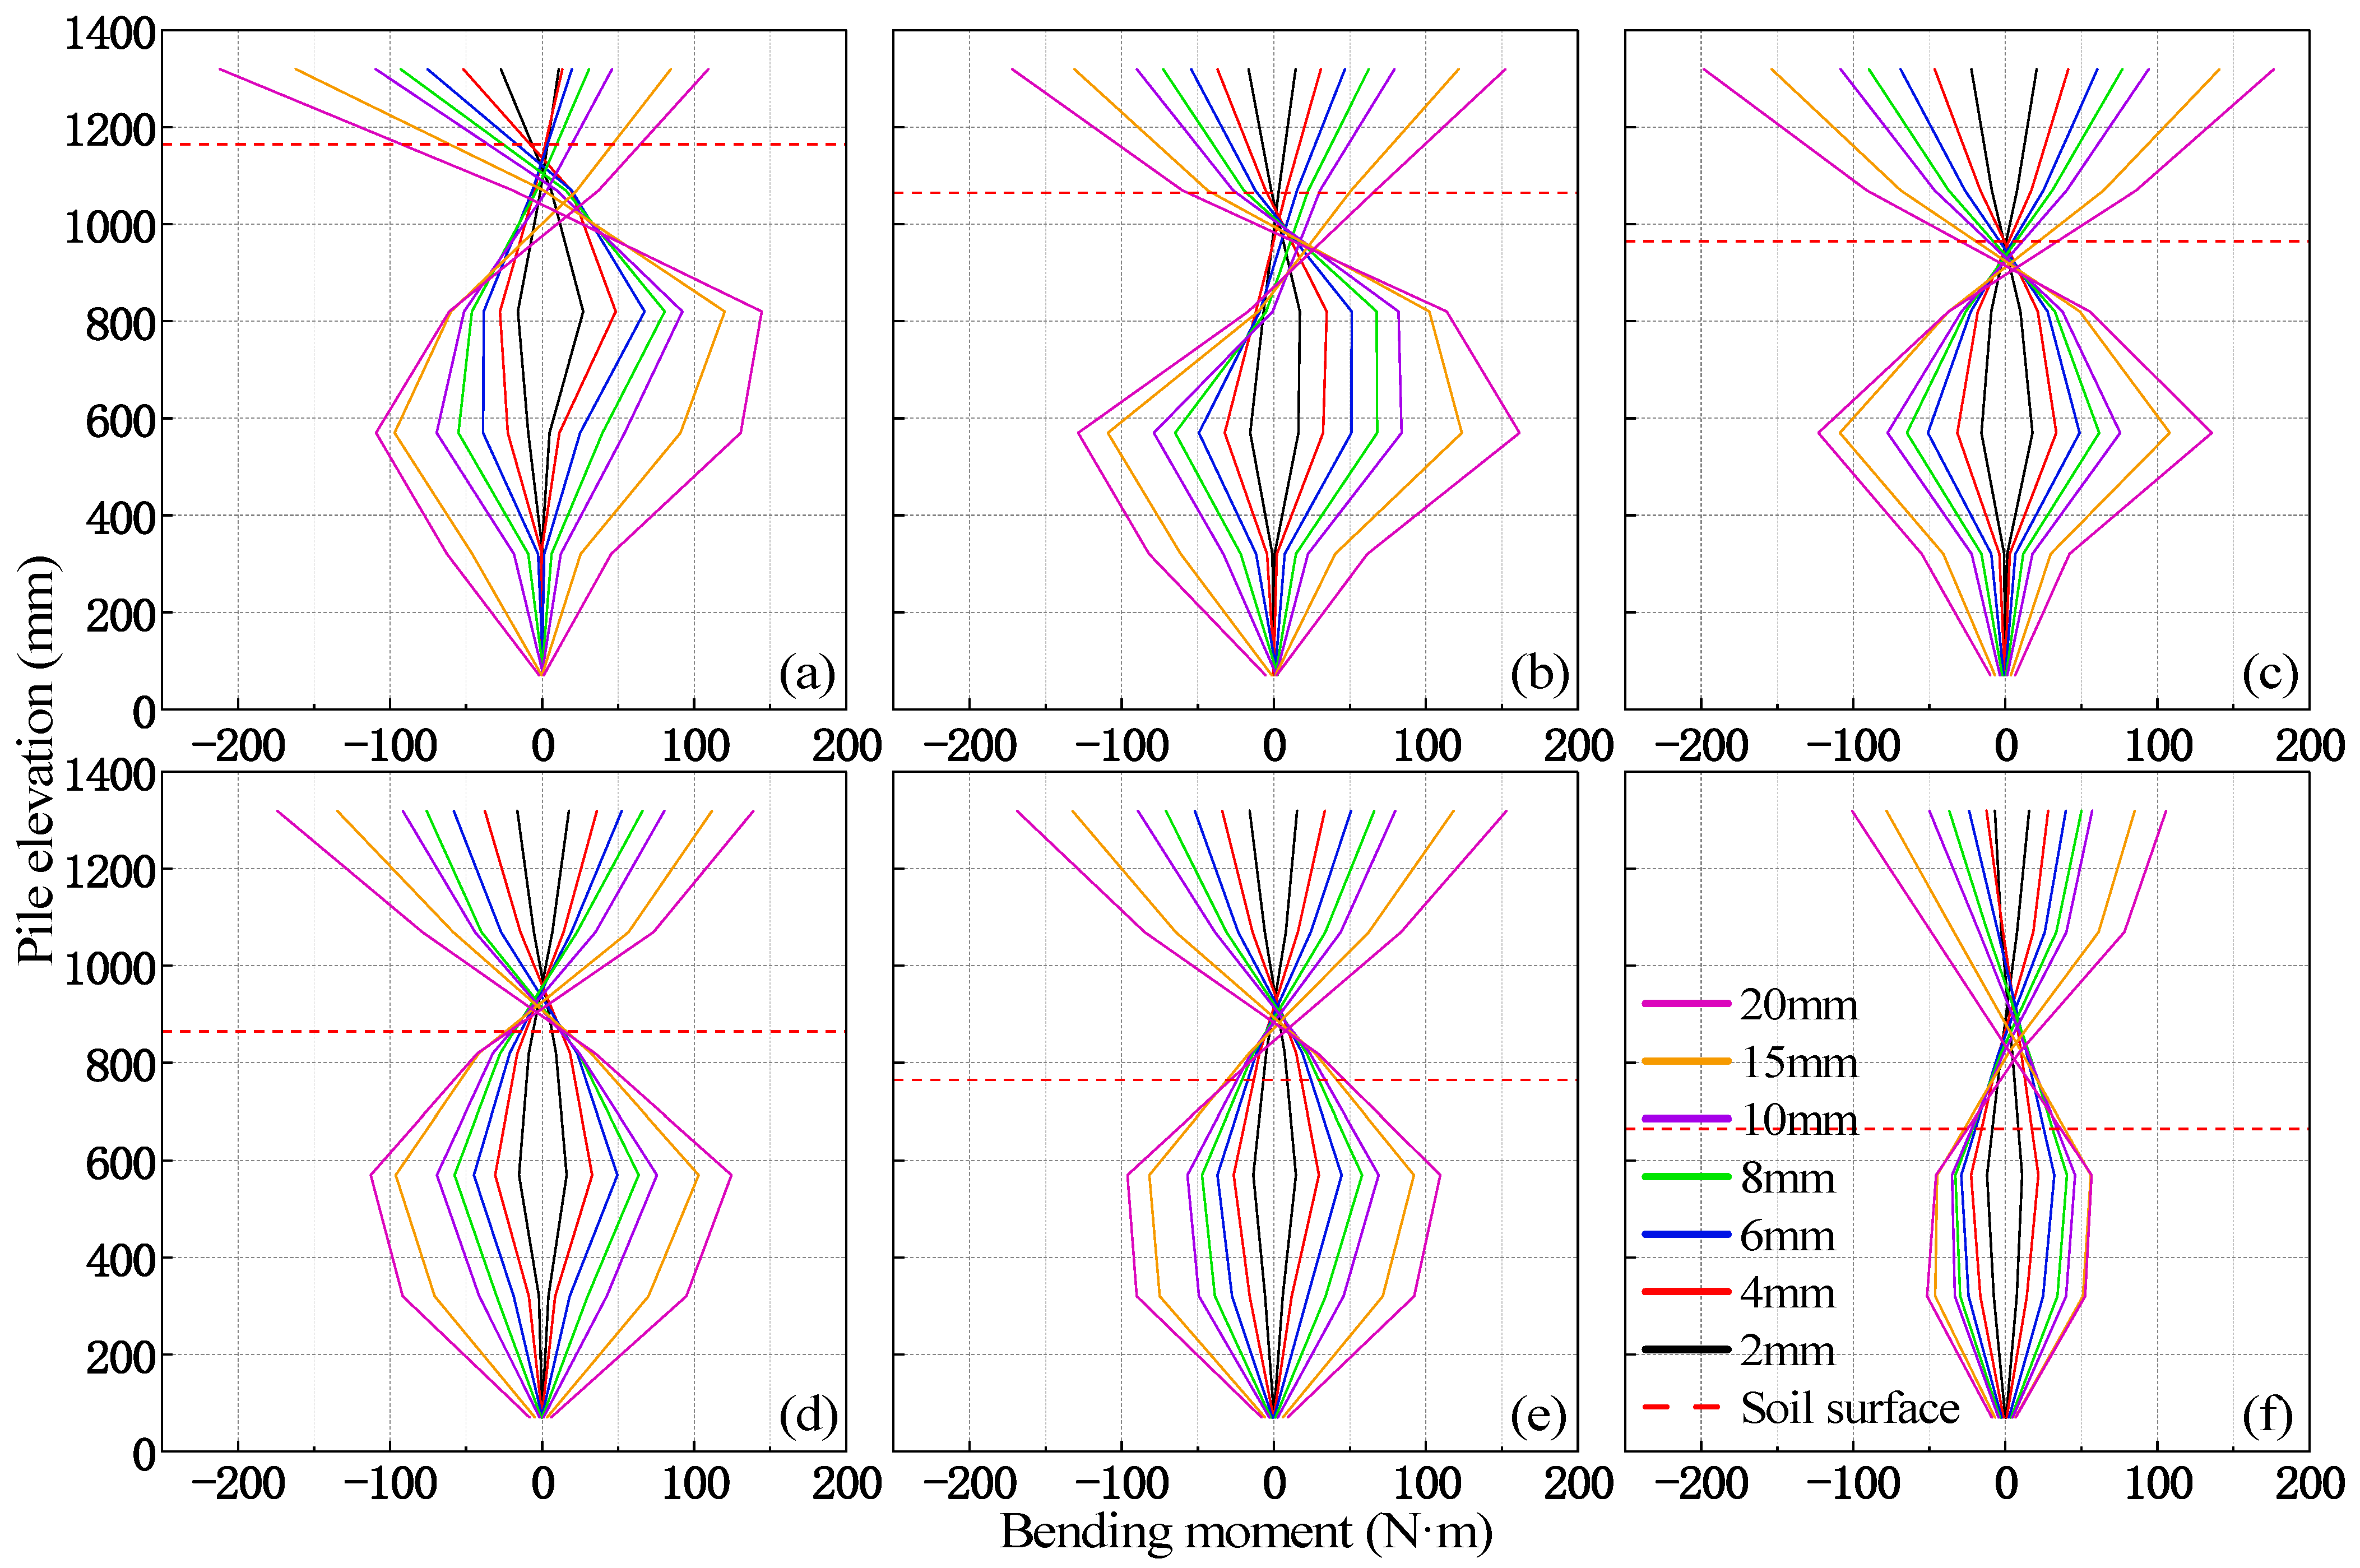
3.3. Pile Bending Moment

Strain gauges were attached on opposite sides of the pile along the direction of lateral loading to obtain the bending moments on the pile. The bending moments on the pile can be calculated from the recorded strains using the traditional Euler–Bernoulli beam theory [24]:
M = E I ε 1 ε 2 D
where M is the pile bending moment at the measure point. EI is the bending stiffness of the cross-section. ε1 and ε2 are the tensile and compressive strains on two sides of the pile, respectively. D denotes the outer diameter of the pile.
Figure 11 shows the bending moments of piles C1–C6 at different loading levels. In Figure 11, the bending moments on the piles in two loading directions are different. That is due to the slope of the soil surface. In other words, the wharf structure bears greater soil resistance when the structure is pushed in the upslope direction. There are two peaks on the bending moment curve of the pile. One of the peaks is located at the pile top, and the other appears in the middle and lower parts. The maximum bending moment occurs at the pile top. The bending moment gradually decreases to zero with an increase in pile depth, then continues to increase to 320~820 mm elevation (depending on the pile embedded depth) and finally decreases to around zero. The maximum bending moment occurs at the pile top due to the constraint effect of the deck on the pile. The peak bending moment at the lower part of the pile is caused by soil resistance. From piles C1 to C6, there is a decreasing trend of the bending moment at the pile top. In the lower part of the pile, the peak bending moment occurs at 200~400 mm below the ground surface and decreases sequentially with the decrease in pile embedded depth from piles C1 to C6.
It can be observed from Figure 11a,b that the bending moment graphs obtained in two loading directions are quite asymmetric. The peak bending moment in the lower part of the pile under push loading (in the right half of the figure) occurs at a higher location than that under pull loading (in the left half of the figure). In Figure 11c–e, this bending moment profile gradually tends to symmetry. The bending moment profile in Figure 11f is nearly symmetrical, and the bending moments for the two loading directions are almost the same, with only minor differences. That is because the landside pile (C1) has a larger pile embedded depth and a shorter free length above the ground surface. The pile is prevented by the soil from deforming sufficiently, and the pile is fully supported by the soil resistance. The pile embedded depth decreases in the downslope direction, and the pile free length above the ground surface increases sequentially. Without the constraint from the soil around the pile, the pile can satisfy the horizontal displacement demand of the pile top by adequate deformation. Since the ground surface is inclined, there is a difference in soil depth for the two directions; therefore, the soil resistance against the pile is different.
With the increase in applied displacement amplitude, the bending moments on piles increase gradually and vary with depth in a similar trend under different loaded displacement amplitudes. In Figure 11a, the peak bending moment in the lower part of the pile occurs at the pile elevation of 820 mm when the pile top displacement is 2 mm. With the gradual increase in loading displacement amplitude, the location where the peak bending moment occurs has a downward trend. This peak bending moment appears at the pile elevation of 570 mm when the pile top displacement reaches 20 mm. That is because the horizontal load gradually increases with the loading displacement amplitude, and the shallow sand stratum enters the plastic yielding state. The yield zone of the sand stratum around the pile continues to move deeper, and the load is delivered to the deeper sand stratum. The peak bending moment profile of the pile also moves downward due to the reduction in the upper soil resistance. Similar comments are made for the other five piles with strain records.

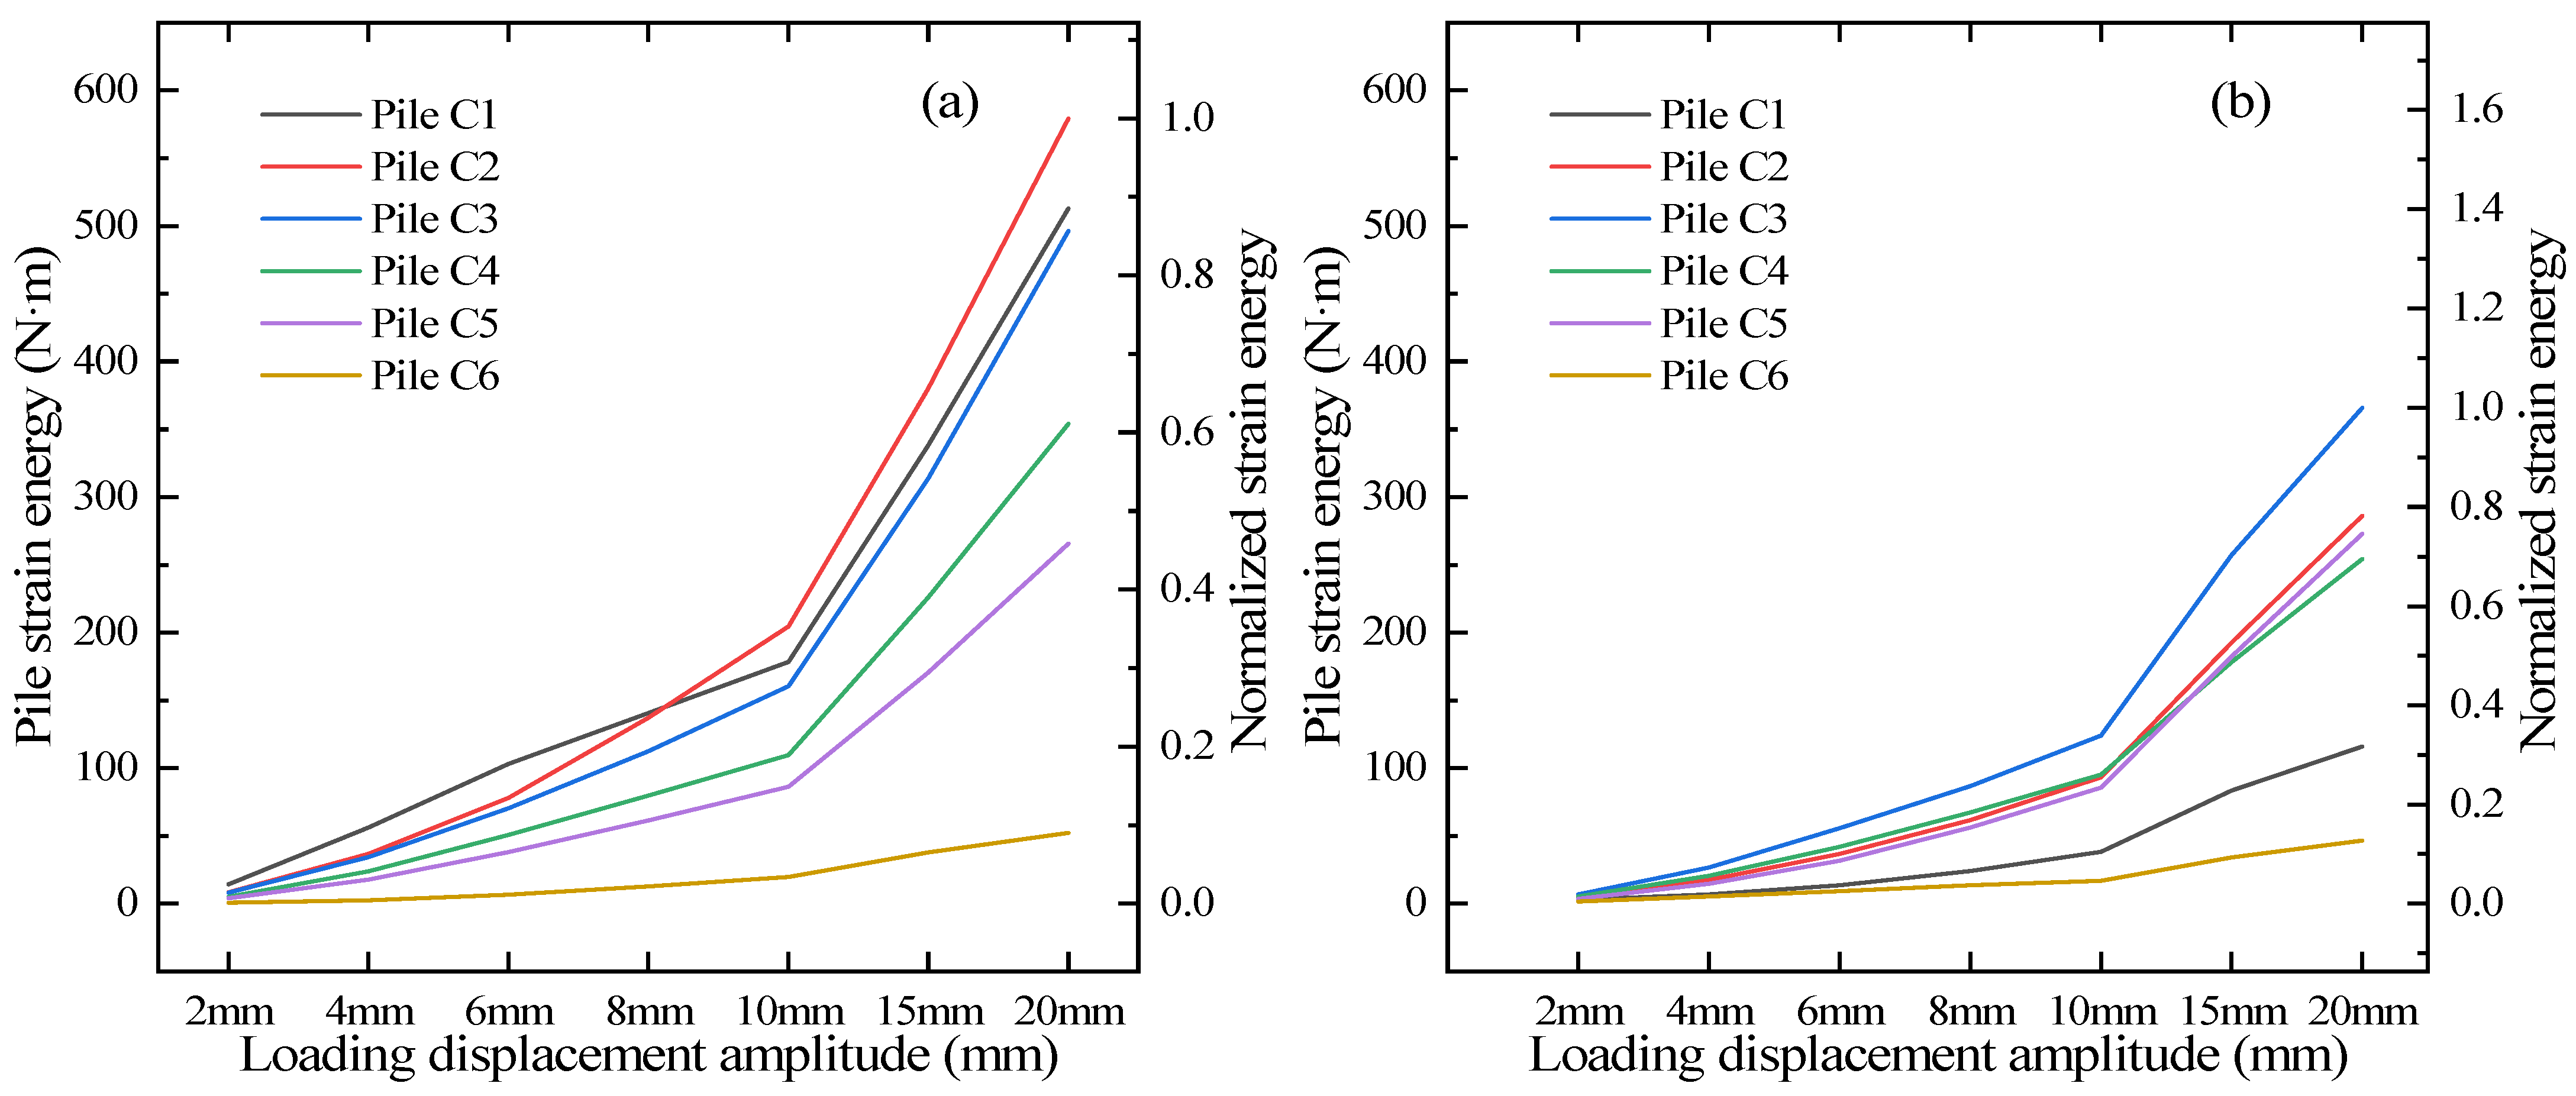
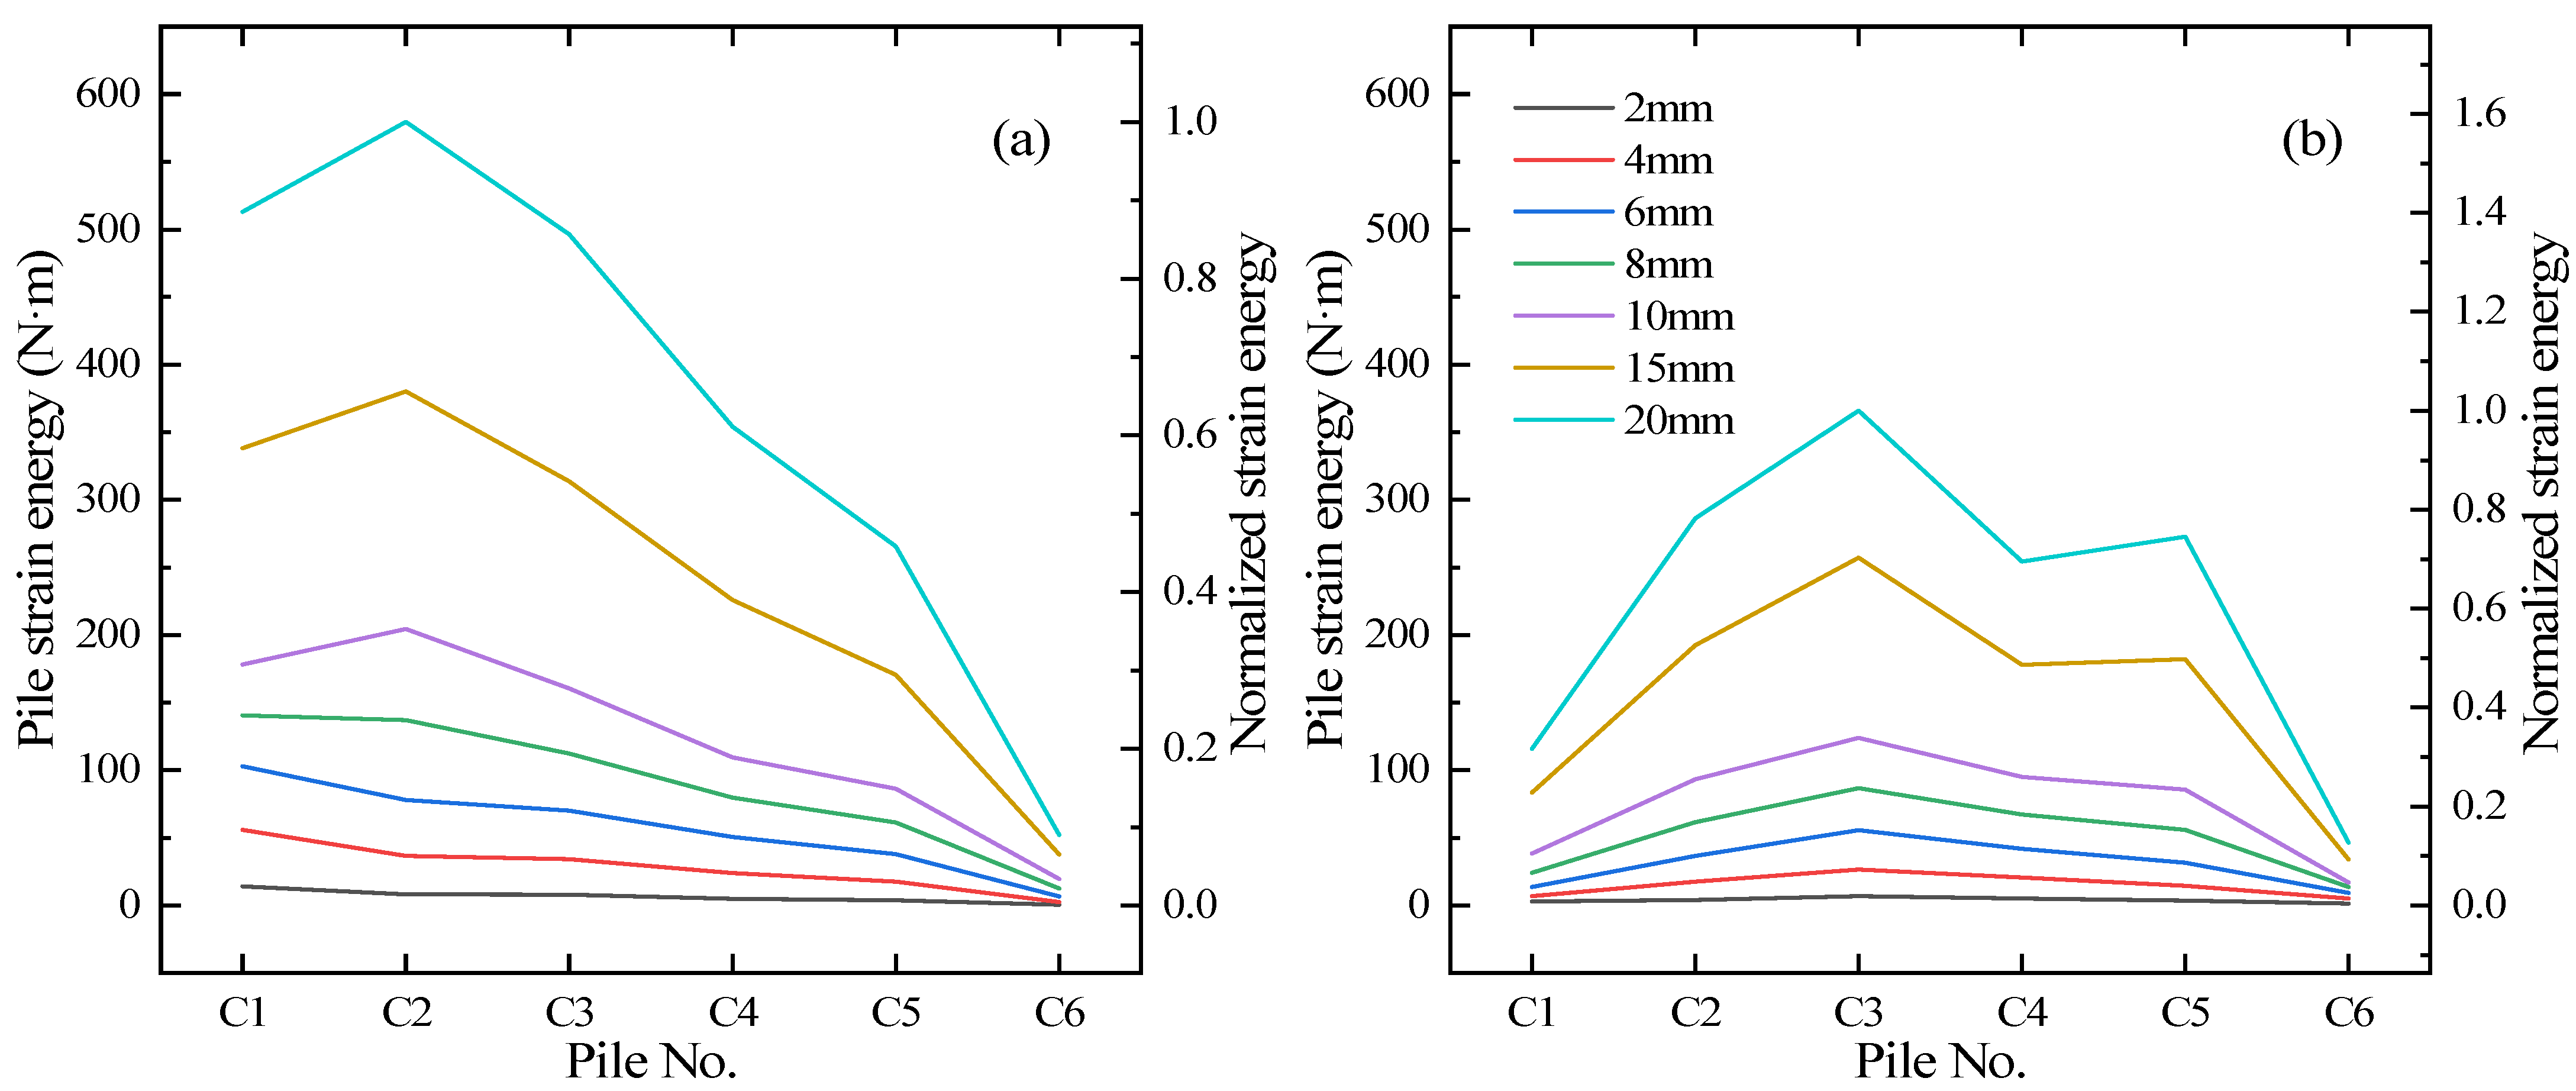
3.4. Pile Strain Energy Distribution Analysis

The model piles are considered to be in the elastic state during the loading process of the whole test, and the load carried by each pile is dynamically changed with the increase in loading. The most direct reflection of this change is the strain data collected from the piles. Therefore, the recorded strain data can be utilized to further analyze the characteristics of the load distribution of wharf piles on the sloping ground. In this section, the distribution characteristics of internal forces within wharf piles are investigated using the energy method.
During the quasi-static cyclic lateral loading process, the external work of the actuator is transformed into the strain energy of the PSW–ground system, assuming that there is no energy loss within the system.
W = Vε
where W is the external work applied by the actuator, and Vε is the strain energy of the PSW–ground system. The strain energy Vε of this system consists of two parts, i.e., the strain energy of the wharf structure (VεPSW) and the strain energy of soil around the piles (Vεsoil).
Vε = VεPSW + Vεsoil
In particular, the strain energy distribution of soil around the piles is extremely complex and difficult to measure and calculate. Therefore, it is not considered in this study, and only the strain energy of the wharf structure is analyzed.
In the quasi-static horizontal cyclic loading process, there is a vast difference between the stiffness of the deck and the pile, so the deck can be considered as a rigid body. The actuator is installed on the middle of the deck, and the deck only moves horizontally and does not generate strain energy. Hence, the strain energy of the wharf structure (VεPSW) can be further simplified to the strain energy of the pile (VεPile).
The wharf model used in the test is geometrically symmetric, and loading is applied on the central axis of the structure so the piles do not twist but only bend. The strain energy of the pile consists of bending strain energy and shear strain energy. The heights of the two types of tested pile are 44 and 51 times their diameters, respectively. As such, the pile shear strain energy is much smaller than the bending strain energy. When ignoring the shear strain energy of the pile, the pile strain energy (VεPile) can be calculated by the following expression:
V ε P i l e = 0 L M 2 x 2 E I d x
where L is the pile length, M(x) is the bending moment at elevation x of the pile, and EI is the pile bending stiffness. In this study, the strain energy distribution characteristics of six piles on column C are investigated through the recorded strain data. The total strain energy VεC of the piles on column C can be calculated by the following expression:
V ε C = i = 1 6 V ε P i l e   i
Based on the above expressions, the strain energy and normalized strain energy concerning loading direction and pile embedded depth, as well as strain energy percentage curves for each pile on column C, can be obtained, shown in Figure 12, Figure 13 and Figure 14.
In Figure 12 and Figure 13, the strain energy of each pile under the two loading directions is quite different. In the upslope direction, seen in Figure 12a, the growth trend of strain energy is similar for all piles, and the strain energy of pile C6 (seaside pile) is the smallest. When loading displacement amplitude is less than 10 mm, the strain energy decreases sequentially from pile C1 to C6, as seen in Figure 12a and Figure 13a. When the loading displacement amplitude exceeds 10 mm, the strain energy of pile C2 surpasses that of pile C1. That is because the soil around pile C1 fails, providing less soil resistance with increased loading displacement amplitude. The soil around pile C2 damages less, so pile C2 generates more strain energy. Compared to the upslope direction, the strain energy of the pile in the downslope direction is quite different, in which the strain energy decreases for all six piles. In Figure 12b and Figure 13b, the strain energy of pile C3 is the largest, and the strain energy of piles C2, C4, and C5 is very close. The strain energy of pile C1 is significantly smaller than those of piles C2 to C5, and the strain energy of pile C6 is still the smallest. The strain energy of pile C4 is higher than that of pile C5 when the loading amplitude is not more than 10 mm. When the loading amplitude reaches 15 mm, the situation changes, and the strain energy of pile C5 exceeds that of pile C4. That indicates that the soil around pile C4 also failed, increasing the strain energy carried by the neighboring piles.
Figure 14 shows the strain energy percentage of each pile in both loading directions. In the upslope direction, the strain energy percentage of pile C1 decreases continuously with the increase in loading displacement amplitude. Meanwhile, the strain energy percentage of the other five piles steadily increases. When the loading displacement amplitude exceeds 10 mm, the strain energy percentage of pile C2 also begins to decrease, and the rate of decrease is similar to that of pile C1. The strain energy percentage of piles C3 to C6 increases steadily during loading. Figure 14b illustrates the strain energy percentage of each pile in the downslope direction. Piles C3 and C4 contribute more strain energy, and the strain energy percentage of piles C3 and C4 decreases as the loading displacement amplitude increases. The strain energy percentage of piles C2 and C5 rises steadily and surpasses that of pile C4 at the end of loading. Due to the failure of soil around the pile, the strain energy percentage of pile C1 quickly decreases at the beginning of loading. However, the general trend slowly decreases from the loading displacement amplitude of 2 mm to 20 mm. Pile C6 still has the lowest strain energy percentage, but the strain energy percentage of piles C6 in the downslope direction is significantly higher than in the upslope direction, which also shows a slow decreasing trend overall.
For the pile group on the horizontal ground, the strain energy of piles is related to the distance to the center of the pile group. Piles farther away from the central area generate more strain energy. The direction of applied lateral loading affects the distribution of strain energy, and piles at the front side of the direction generate more strain energy [19]. However, these characteristics change significantly on the sloping ground, and the difference in pile embedded depth leads to a change in the distribution pattern of strain energy. From Figure 12, Figure 13 and Figure 14, comparing the strain energy of each pile in both loading directions, the following comments can be made:
(i)
The loading direction significantly affects the pile strain energy. The strain energy produced by the pile group under upslope direction loading is significantly large, approximately 1.7 times greater than that under downslope direction loading;
(ii)
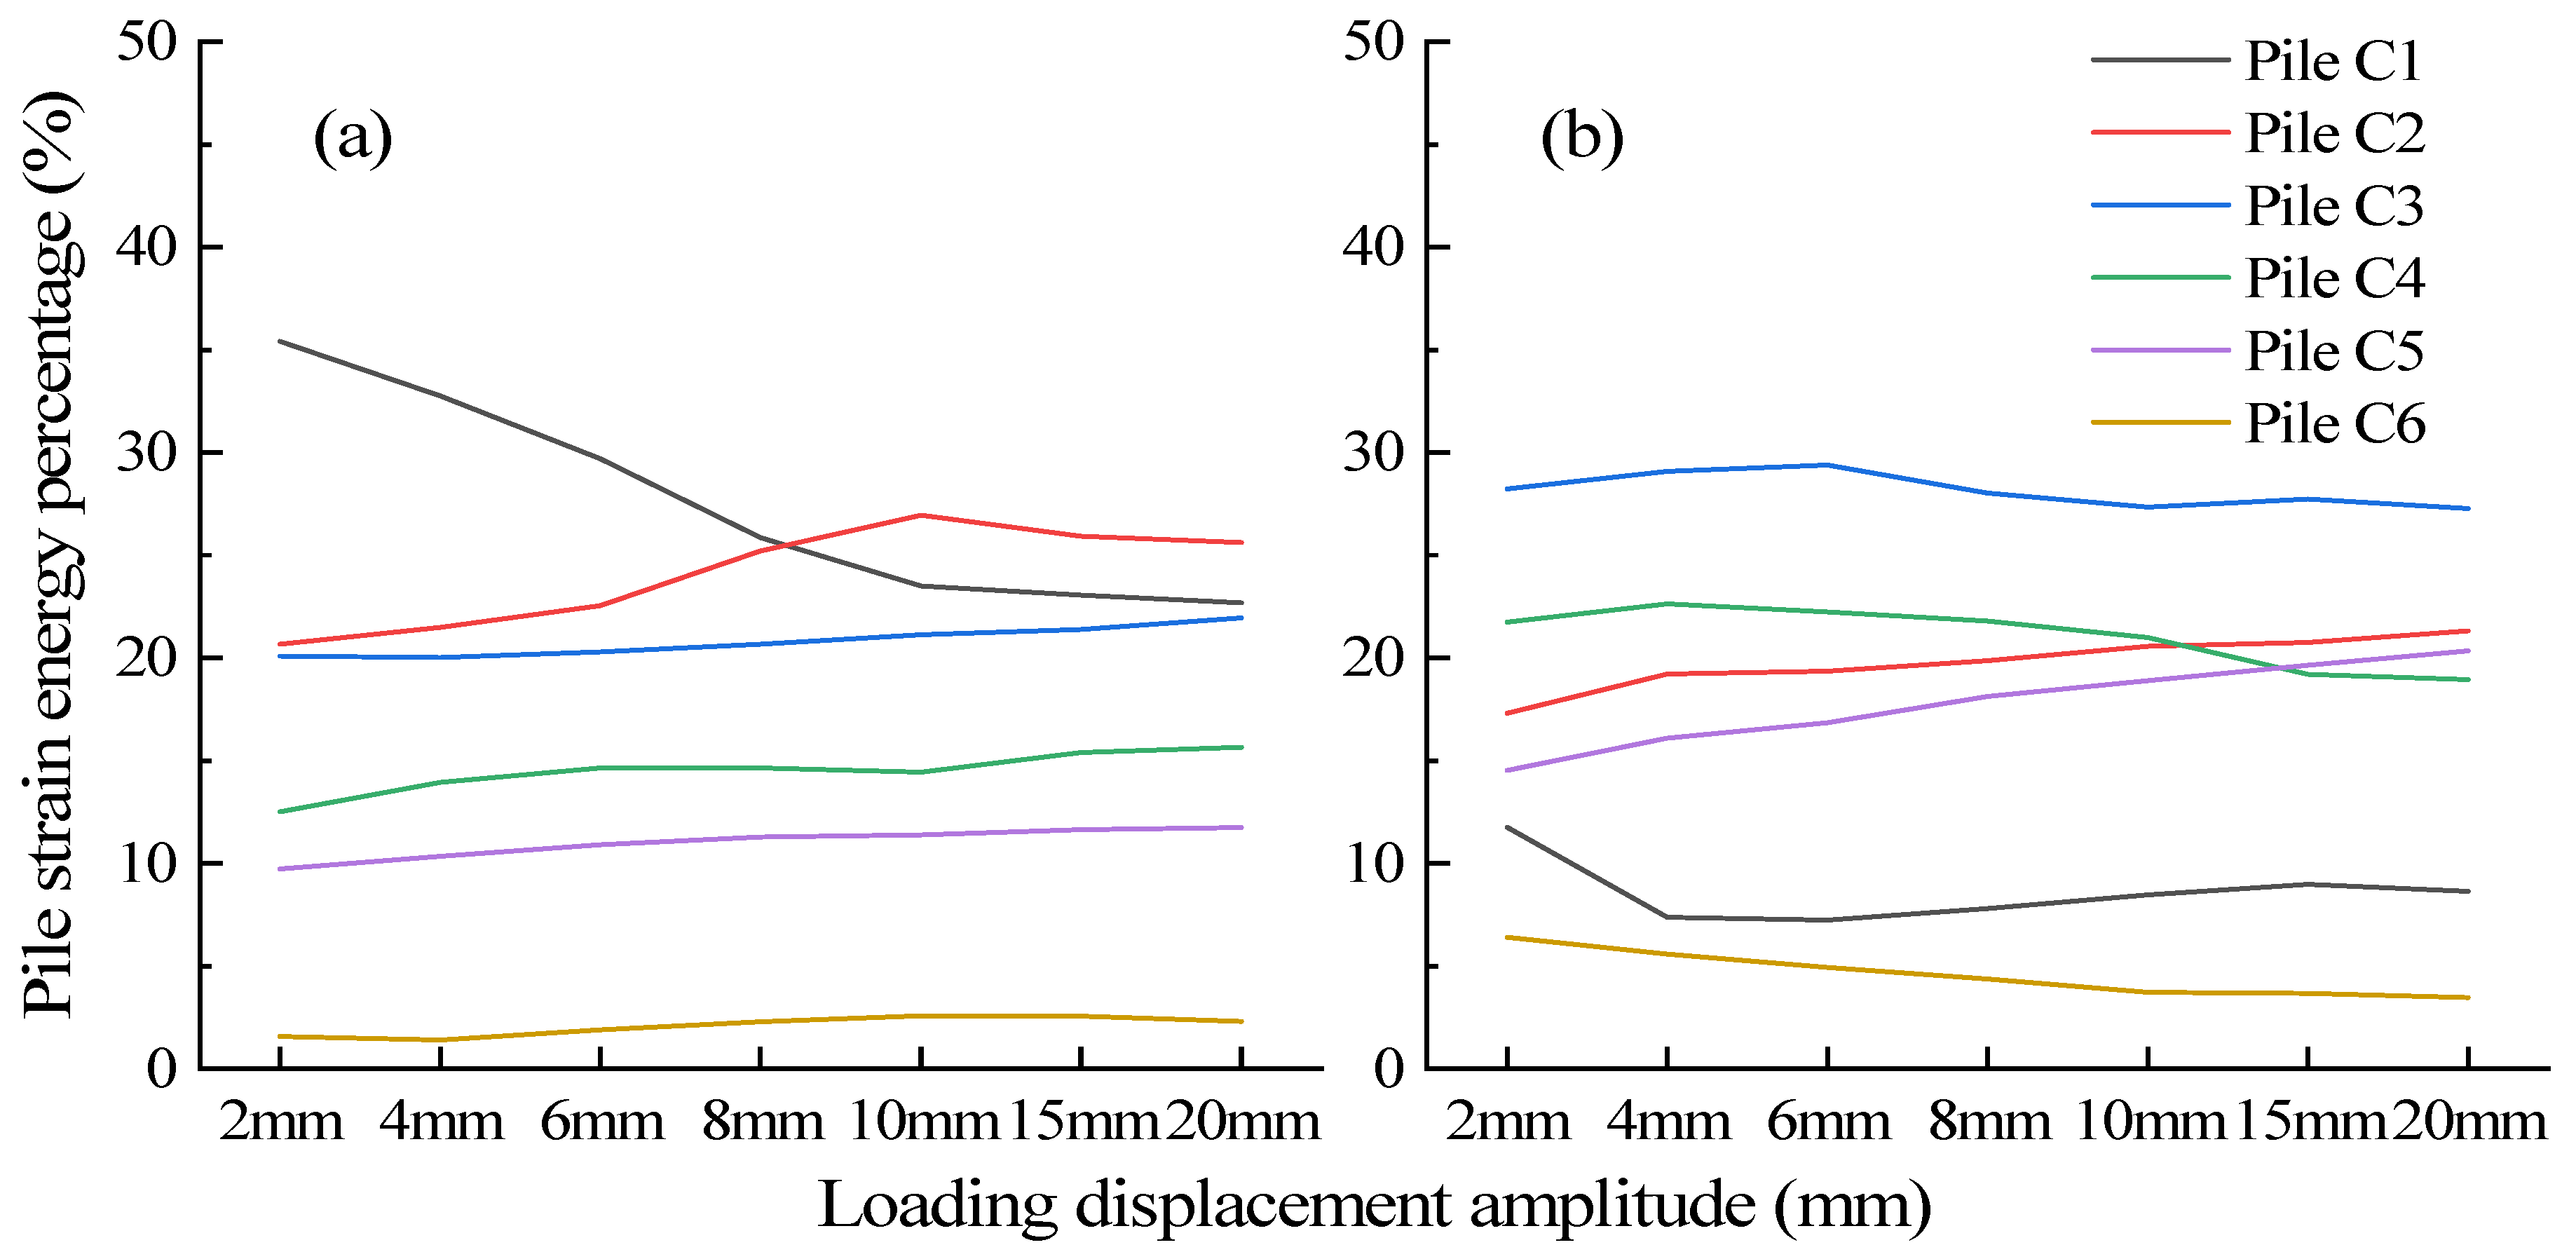
When loading towards the upslope direction, the strain energy of each pile increases sequentially with the pile embedded depth until the soil–pile interaction system enters the nonlinear phase. When loading towards the downslope direction, the piles at the center of the pile group have the largest strain energy percentage and slowly decrease as the loading displacement amplitude increases. At the same time, the strain energy percentage of the neighboring outer piles gradually increases. The strain energy gradually spreads from the center piles to both sides;
(iii)
Piles C1 and C3 present the largest strain energy percentage in the upslope and downslope loading directions, respectively. Pile C6 has the lowest strain energy percentage in both loading directions.

4. Conclusions

This study performs a quasi-static model test of a PSW–ground system under cyclic lateral loading. The detailed design of this model test is presented. The dynamic response characteristics of the PSW–ground system are evaluated through the test results. Based on the investigated scenario, the following conclusions can be drawn:
(1)
The failure area of the sand stratum around piles decreases from the landside piles (row 1) to the seaside piles (row 6). Perforation shear cracks can be observed around outside piles. After the test, residual deformation can be presented in the bolts at the top of pile row 1;
(2)
The hysteresis curve of the PSW–ground system indicates that the displacement–force relationship is approximately linear. The resistance force of the PSW–ground system decreases with the number of cycles for the same loading level. That indicates that the failure of the peri-pile soil occurs sequentially during the loading process, leading to the decrease in energy-absorbing capacity of the PSW–ground system;
(3)
Two peak bending moments on the pile are observed under cyclic lateral loading. The maximum bending moment occurs at the pile top, so the pile–deck connections of the PSW structure should be strengthened during wharf design. The second peak exists in the middle and lower part of the pile. As the loading displacement amplitude increases, the location where the second peak occurs has a downward trend. The bending moments on the piles are obviously different under two loading directions. The bending moments on piles with larger pile embedded depth show significant asymmetry;
(4)
The strain energy of the PSW structure under upslope direction loading is approximately 1.7 times larger than that under downslope direction loading. The soil–pile interaction on the sloping ground has a directional nature and is influenced by the pile embedded depth and loading direction;
(5)
On the sloping ground, the landside and the center area piles of the PSW have the largest bending moment and strain energy. During the seismic design of the PSW structure, the landside and center area piles should be strengthened for bending resistance.
This test is only the first part of a series of studies on the seismic performance of the PSW structure. The PSW structural hysteresis characteristics, pile bending moment characteristics, and strain energy distribution characteristics derived from the test can be used to validate the reliability of the numerical model. Matching the test results with the behavior predicted by the simulation helps improve the accuracy and reliability of the analytical method. Although the quasi-static test is widely used in the study of the seismic performance of structures, it also has the disadvantage of being unable to reflect the effects of acceleration-dependent inertial forces and velocity-dependent damping forces. Therefore, the authors will also perform a shaking table modeling test for the following studies.

Author Contributions

Conceptualization, J.W.; methodology, J.W. and L.S.; validation, J.W., L.X. and L.S.; formal analysis, J.W.; investigation, J.W.; resources, J.W.; data curation, J.W.; writing—original draft preparation, J.W.; writing—review and editing, J.W., L.X. and L.S.; visualization, J.W.; supervision, X.L.; project administration, L.S.; funding acquisition, L.S. All authors have read and agreed to the published version of the manuscript.

Funding

This research and the APC were funded by National Natural Science Foundation of China (42211530078, 42072310, and 51808307).

Institutional Review Board Statement

Not applicable.

Informed Consent Statement

Not applicable.

Data Availability Statement

Dataset available on request from the corresponding authors.

Acknowledgments

Haian Liang at the East China University of Technology provided much useful assistance in performing the quasi-static model test of the PSW. This assistance and support are gratefully acknowledged.

Conflicts of Interest

The authors declare no conflicts of interest.

References

  1. Akai, K.; Bray, J.D.; Boulanger, R.W.; Christian, J.T. Geotechnical Reconnaissance of the Effects of the January 17, 1995, Hyogoken-Nanbu Earthquake, Japan; Diane Publishing: Darby, PA, USA, 1997. [Google Scholar]
  2. Tsai, J.; Chung, L.L.; Liu, K.G.Y. Damage and recovery from the 1999 Chichi earthquake in Taiwan. In Progress of Geo-disaster Mitigation Technology in Asia; Springer: Berlin/Heidelberg, Germany, 2013; pp. 171–186. [Google Scholar] [CrossRef]
  3. Werner, S.; McCullough, N.; Bruin, W.; Augustine, A.; Rix, G.; Crowder, B.; Tomblin, J. Seismic performance of Port de Port-au-Prince during the Haiti earthquake and post-earthquake restoration of cargo throughput. Earthq. Spectra 2011, 27 (Suppl. S1), 387–410. [Google Scholar] [CrossRef]
  4. Liao, W.I.; Loh, C.H.; Wan, S. Earthquake responses of RC moment frames subjected to near-fault ground motions. Struct. Des. Tall Build. 2001, 103, 219–229. [Google Scholar] [CrossRef]
  5. Yang, D.; Pan, J.; Li, G. Interstory drift ratio of building structures subjected to near-fault ground motions based on generalized drift spectral analysis. Soil Dyn. Earthq. Eng. 2001, 3011, 1182–1197. [Google Scholar] [CrossRef]
  6. Vafaei, D.; Eskandari, R. Seismic response of mega buckling-restrained braces subjected to fling-step and forward-directivity near-fault ground motions. Struct. Des. Tall Spec. Build. 2015, 249, 672–686. [Google Scholar] [CrossRef]
  7. Chen, X.; Liu, Y.; Zhou, B.; Yang, D. Seismic response analysis of intake tower structure under near-fault ground motions with forward-directivity and fling-step effects. Soil Dyn. Earthq. Eng. 2020, 132, 106098. [Google Scholar] [CrossRef]
  8. Giannakou, A.; Gerolymos, N.; Gazetas, G.; Tazoh, T.; Anastasopoulos, I. Seismic behavior of batter piles: Elastic response. J. Geotech. Geoenviron. Eng. 2010, 1369, 1187–1199. [Google Scholar] [CrossRef]
  9. Fan, W.; Yuan, W.C. Numerical simulation and analytical modeling of pile-supported structures subjected to ship collisions including soil-structure interaction. Ocean. Eng. 2014, 91, 11–27. [Google Scholar] [CrossRef]
  10. Muthukkumaran, K.; Arun, K.S. Erratum to: Effect of seabed slope on the pile behaviour of a fixed offshore platform under lateral forces. J. Ocean. Eng. Mar. Energy 2015, 1, 223–236. [Google Scholar] [CrossRef]
  11. Su, L.; Lu, J.; Elgamal, A.; Arulmoli, A.K. Seismic performance of a pile-supported wharf: Three-dimensional finite element simulation. Soil Dyn. Earthq. Eng. 2017, 95, 167–179. [Google Scholar] [CrossRef]
  12. Vytiniotis, A.; Panagiotidou, A.I.; Whittle, A.J. Analysis of seismic damage mitigation for a pile-supported wharf structure. Soil Dyn. Earthq. Eng. 2019, 119, 21–35. [Google Scholar] [CrossRef]
  13. McCullough, N.J.; Dickenson, S.E.; Schlechter, S.M. The seismic performance of piles in waterfront applications. In Ports 2001: America’s Ports: Gateway to the Global Economy; American Society Of Civil Engineers: Reston, VA, USA, 2001; pp. 1–10. [Google Scholar] [CrossRef]
  14. Restrepo, J.I.; Yin, P.; Jaradat, O.A.; Weismair, M. Performance of new pile-deck connections under earthquakes. In Ports 2007: 30 Years of Sharing Ideas: 1977–2007; American Society Of Civil Engineers: Reston, VA, USA, 2007; pp. 1–10. [Google Scholar] [CrossRef]
  15. Schlechter, S.M.; Dickenson, S.E.; McCullough, N.J.; Boland, J.C. Influence of batter piles on the dynamic behavior of pile-supported wharf structures. In Ports 2004: Port Development in the Changing World; American Society Of Civil Engineers: Reston, VA, USA, 2004; pp. 1–10. [Google Scholar] [CrossRef]
  16. Roeder, C.W.; Graff, R.; Soderstrom, J.; Yoo, J.H. Seismic performance of pile-wharf connections. J. Struct. Eng. 2005, 1313, 428–437. [Google Scholar] [CrossRef]
  17. Takahashi, A.; Takemura, J. Liquefaction-induced large displacement of pile-supported wharf. Soil Dyn. Earthq. Eng. 2005, 2511, 811–825. [Google Scholar] [CrossRef]
  18. Kawamata, Y. Seismic Performance of a Pile-Supported Container Wharf Structures in Rockfill. Ph.D. Thesis, Oregon State University, Corvallis, OR, USA, 2009. [Google Scholar]
  19. Bedon, C.; Morassi, A. Dynamic testing and parameter identification of a base-isolated bridge. Eng. Struct. 2014, 60, 85–99. [Google Scholar] [CrossRef]
  20. Chisari, C.; Bedon, C.; Amadio, C. Dynamic and static identification of base-isolated bridges using Genetic Algorithms. Eng. Struct. 2015, 102, 80–92. [Google Scholar] [CrossRef]
  21. Jing, L.P.; Wang, G.; Li, J.R.; Sun, Y.L.; Zhou, Z.Y.; Qi, W.H. Shaking table tests and numerical simulations of dynamic interaction of soil-pile-nuclear island system. Chin. J. Geotech. Eng. 2022, 441, 163–172. [Google Scholar] [CrossRef]
  22. Li, B.; Jing, L.P.; Wang, Y.G.; Tu, J.; Qi, W.H. Experimental study on seismic behavior of nuclear-island pile foundation under cyclic lateral loading. Chin. J. Geotech. Eng. 2023, 45, 2119–2128. [Google Scholar] [CrossRef]
  23. Park, R.J.T. Seismic Performance of Steel-Encased Concrete Piles. Ph.D. Thesis, University of Canterbury, Christchurch, New Zealand, 1986. [Google Scholar]
  24. Gerber, T.M. P-y Curves for Liquefied Sand Subject to Cyclic Loading Based on Testing of Full-Scale Deep Foundations. Ph.D. Thesis, Brigham Young University, Provo, UT, USA, 2003. [Google Scholar]
Figure 1. Configuration of a typical PSW structure: (a) cross-section; (b) standard segment layout.
Jmse 12 00115 g001aJmse 12 00115 g001b
Figure 2. Model arrangement in the test.
Jmse 12 00115 g002
Figure 3. Strain gauge arrangement in the test.
Jmse 12 00115 g003
Figure 4. Arrangement in the soil container.
Jmse 12 00115 g004
Figure 5. Model installation in the soil container.
Jmse 12 00115 g005
Figure 6. Loading procedures in the test.
Jmse 12 00115 g006
Figure 7. Diagram of soil failure.
Jmse 12 00115 g007
Figure 8. Deep soil damage diagram.
Jmse 12 00115 g008
Figure 9. Deformation at the top of pile row 1.
Jmse 12 00115 g009
Figure 10. Hysteresis curve and skeleton curve of the PSW structure.
Jmse 12 00115 g010
Figure 11. Bending moment on piles: (a) pile C1; (b) pile C2; (c) pile C3; (d) pile C4; (e) pile C5; (f) pile C6.
Jmse 12 00115 g011
Figure 12. Strain energy and normalized strain energy of piles concerning loading displacement amplitude: (a) upslope direction loading; (b) downslope direction loading.
Jmse 12 00115 g012
Figure 13. Strain energy and normalized strain energy of piles concerning pile properties: (a) upslope direction loading; (b) downslope direction loading.
Jmse 12 00115 g013
Figure 14. Strain energy percentage of piles: (a) upslope direction loading; (b) downslope direction loading.
Jmse 12 00115 g014
Table 1. Parameters of prototype and test model.
ParameterPrototypeTest Model
RequiredProvided
Pile length (m)331.321.32
Pile outer diameter (mm)1200/1829.62/530/5
Thickness (mm)1000/1825.96/426/4
Pile materialQ345B steelA6061 aluminum alloyA6061 aluminum alloy
Mass of deck (t)1978.850.140.14
Table 2. Common parameters for model similarity design.
ParameterDimensionSimilarity Ratio
Geometric dimension LLCl
Density ρFL−4T2Cρ
Elastic modulus EFL−2CE
Inertia moment IL4CI = Cl4
Mass mFL−1T2Cm = Cρ·Cl3
Table 3. Crack statistics around piles.
Crack No.Length (cm)Max Width (mm)Angle (°)Crack No.Length (cm)Max Width (mm)Angle (°)
A1-133.26130E1-121.335
A1-215.55125E1-212.82340
A1-313.5455E1-332.25305
A2-128.4530E1-429.55235
A2-238.33120E1-527.66235
A2-342.66145E1-614.81235
A2-412.73305E1-76.55230
A3-15.13135E2-129.44220
A6-17.62150E2-225.32210
C1-133.8425E3-19.72235
C6-111.52180E6-110.22250
D1-113.43310
Disclaimer/Publisher’s Note: The statements, opinions and data contained in all publications are solely those of the individual author(s) and contributor(s) and not of MDPI and/or the editor(s). MDPI and/or the editor(s) disclaim responsibility for any injury to people or property resulting from any ideas, methods, instructions or products referred to in the content.

