Article

Experimental Investigation on Particle Breakage Behavior of Marine Silica Sand under High-Stress Triaxial Shear

1
Key Lab of Electric Power Infrastructure Safety Assessment and Disaster Prevention of Jilin Province, Northeast Electric Power University, Jilin 132012, China
2
School of Civil Engineering and Architecture, Northeast Electric Power University, Jilin 132012, China
3
State Grid Jibei Beijing Power Transmission and Transformation Co., Ltd., Beijing 102401, China
4
Zhejiang Electric Transmission and Transformation Co., Ltd., Hangzhou 310016, China
5
College of Architecture and Civil Engineering, Beijing University of Technology, Beijing 110124, China
*
Authors to whom correspondence should be addressed.
J. Mar. Sci. Eng. 2023, 11(9), 1825; https://doi.org/10.3390/jmse11091825
Submission received: 12 August 2023 / Revised: 15 September 2023 / Accepted: 17 September 2023 / Published: 19 September 2023
(This article belongs to the Special Issue Engineering Properties of Marine Soils and Offshore Foundations)

Abstract

:
There is often obvious particle breakage for silica sand under high-stress, which will lead to the bearing capacity reduction and excessive settlement of the foundation. This paper focuses on the particle breakage characteristics of marine silica sand from the East China Sea under high-stress conditions. A series of conventional triaxial tests for silica sand, including consolidated drained (CD) and consolidated undrained (CU) shear tests, were conducted under the confining pressures in the range of 2–8 MPa to investigate the breakage rule during the shearing process. The developments of particle breakage index Br with axial strain ε1 and volumetric strain εv present hyperbolic and linear trends, respectively. A hyperbolic model was adopted to describe the relationship of Br and ε1 and the corresponding model parameters were obtained. The particle breakage index also has a good correlation with the input work per unit volume under various average stresses, regardless of the stress history. Furthermore, the relationship between the fractal dimension and the particle breakage was studied based on the particle size distribution curve. It is concluded that the fractal dimension increases in an up–convex hyperbolic trend with the increase of particle breakage index. The dividing radius for whether the silica sand particles exhibit the fractal features is determined as approximately 0.4 mm. This is anticipated to provide reference and supplementary test data for analyzing sand constitutive models/environments regarding particle crushing.

1. Introduction

Silica sand is widely distributed in the offshore area of the East China Sea and is the main engineering material for offshore foundations. It is commonly believed that particle breakage often occurs when silica sands are subjected to high stress [1,2,3,4,5,6,7,8]. The soil at the tip of a deep pile foundation in an offshore oil drilling platform or at the bottom of rockfill dams may bear a high load, with the stress level sometimes reaching approximately 10 MPa [9]. Due to changes in the initial stress state or the groundwater pressure, the earth pressure and water pressure generated by these large loads will cause more particle breakage in silica sand [10,11]. Moreover, continuous particle breakage causes the gradation of silica sand in offshore foundations to change continuously [12,13], affecting its compressibility [14], dilatancy [15], critical state [16], and other mechanical properties, thus significantly changing the engineering characteristics of foundations, and ultimately directly affecting the design scheme of offshore foundation engineering and the safety of the project [17,18].
In the past few decades, various laboratory tests have been conducted to study the mechanical properties of silica sand and the evolution process of particle breakage, including ring shear tests [19,20], direct shear tests [21,22], one-dimensional compression tests [23,24], isotropic compression tests [25,26,27], conventional triaxial tests [28], true triaxial tests [29], cyclic tests [30,31,32], and creep tests [33]. Several studies have investigated the effect of particle breakage on the mechanical properties of sand. Kikumoto et al. [34] found that in the e–lgp′ plane, the critical-state line moved downward with an increase in the particle breakage index. Through triaxial tests, Carrera et al. [35] found that an increase in particle breakage may lead to an upward movement of the critical-state line. Bandini et al. [36] found that particle breakage in the triaxial shear process led to translation and rotation of the critical-state line; however, the critical-state friction angle did not change. Yu et al. [37] conducted a triaxial test on pre-crushed silica sand and found that particle breakage caused the critical-state line on the e–lgp′ plane to shift downward and rotate counterclockwise, while on the qp′ plane, all the critical-state points were on the initial critical-state line; however, the critical-state points varied with particle breakage under different drainage conditions. Silica sand particle breakage is related to factors such as the particle mineral composition, particle shape, effective stress path, and pore water pressure [38,39], and the characteristics of particle breakage can be typically explained by the fractal theory [40,41] and energy theory [42]. Afshar et al. [43] conducted several compression tests using X-ray and scanning electron microscopy and found that in the process of particle breakage, the sphericity and aspect ratio of fine silica sand decreased continuously, and the fractal condition of large granular silica sand ceased. Zhao et al. [44] found that when the particle size of Leighton Buzzard sand is lower than a certain value, regardless of the assumed shape, the characteristic dimension is proportional to the corresponding particle size, and the fractal dimension of the sand remains constant. In offshore foundation engineering applications, stress is a key parameter when considering particle breakage. However, most of the above studies analyzed the amount of particle breakage when the sample was loaded to the failure or critical state and rarely discussed the intermediate development process of particle breakage along specific stress paths [45]; that is, the influence of particle breakage on the strength parameters of the loading process (such as the peak strength of the softened material) could not be truly reflected. Hence, it is necessary to study the evolution of the particle-crushing process and its correlation with the mechanical properties of the silica sand.
Currently, research on particle breakage during the shear process of silica sand is limited. Existing studies have generally focused on the evolution process of the particle breakage of calcareous sand [46] and rockfill [47] under general stress conditions. Whether the crushing theory based on the above materials under general stress conditions can be applied to describe the particle-crushing evolution process of silica sand under high-stress conditions requires further verification. Owing to the strict conditions of high-stress triaxial tests, experiments on the evolution of the particle breakage of silica sand under high-stress conditions are lacking, thus, limited theoretical research on the evolution model of the particle breakage of quartz sand under high-stress conditions. In addition, the fractal characteristics of silica sand under different drainage conditions, particularly high stresses, have not been thoroughly studied.
In this study, a GDS high-stress triaxial test system was used to conduct shear tests on consolidated drained (CD) and consolidated undrained (CU) silica sand specimens at high stresses to investigate the effects of stress level, axial strain, and drainage conditions on the degree of particle breakage. The evolution law of the particle breakage of silica sand during shearing was analyzed, and the parameters of the particle breakage model of silica sand were obtained. The evolution of the fractal dimension in the particle-breaking process was discussed, and the relationship between the volume deformation, fractal dimension, input work, and particle breaking was studied.

2. Materials and Methods

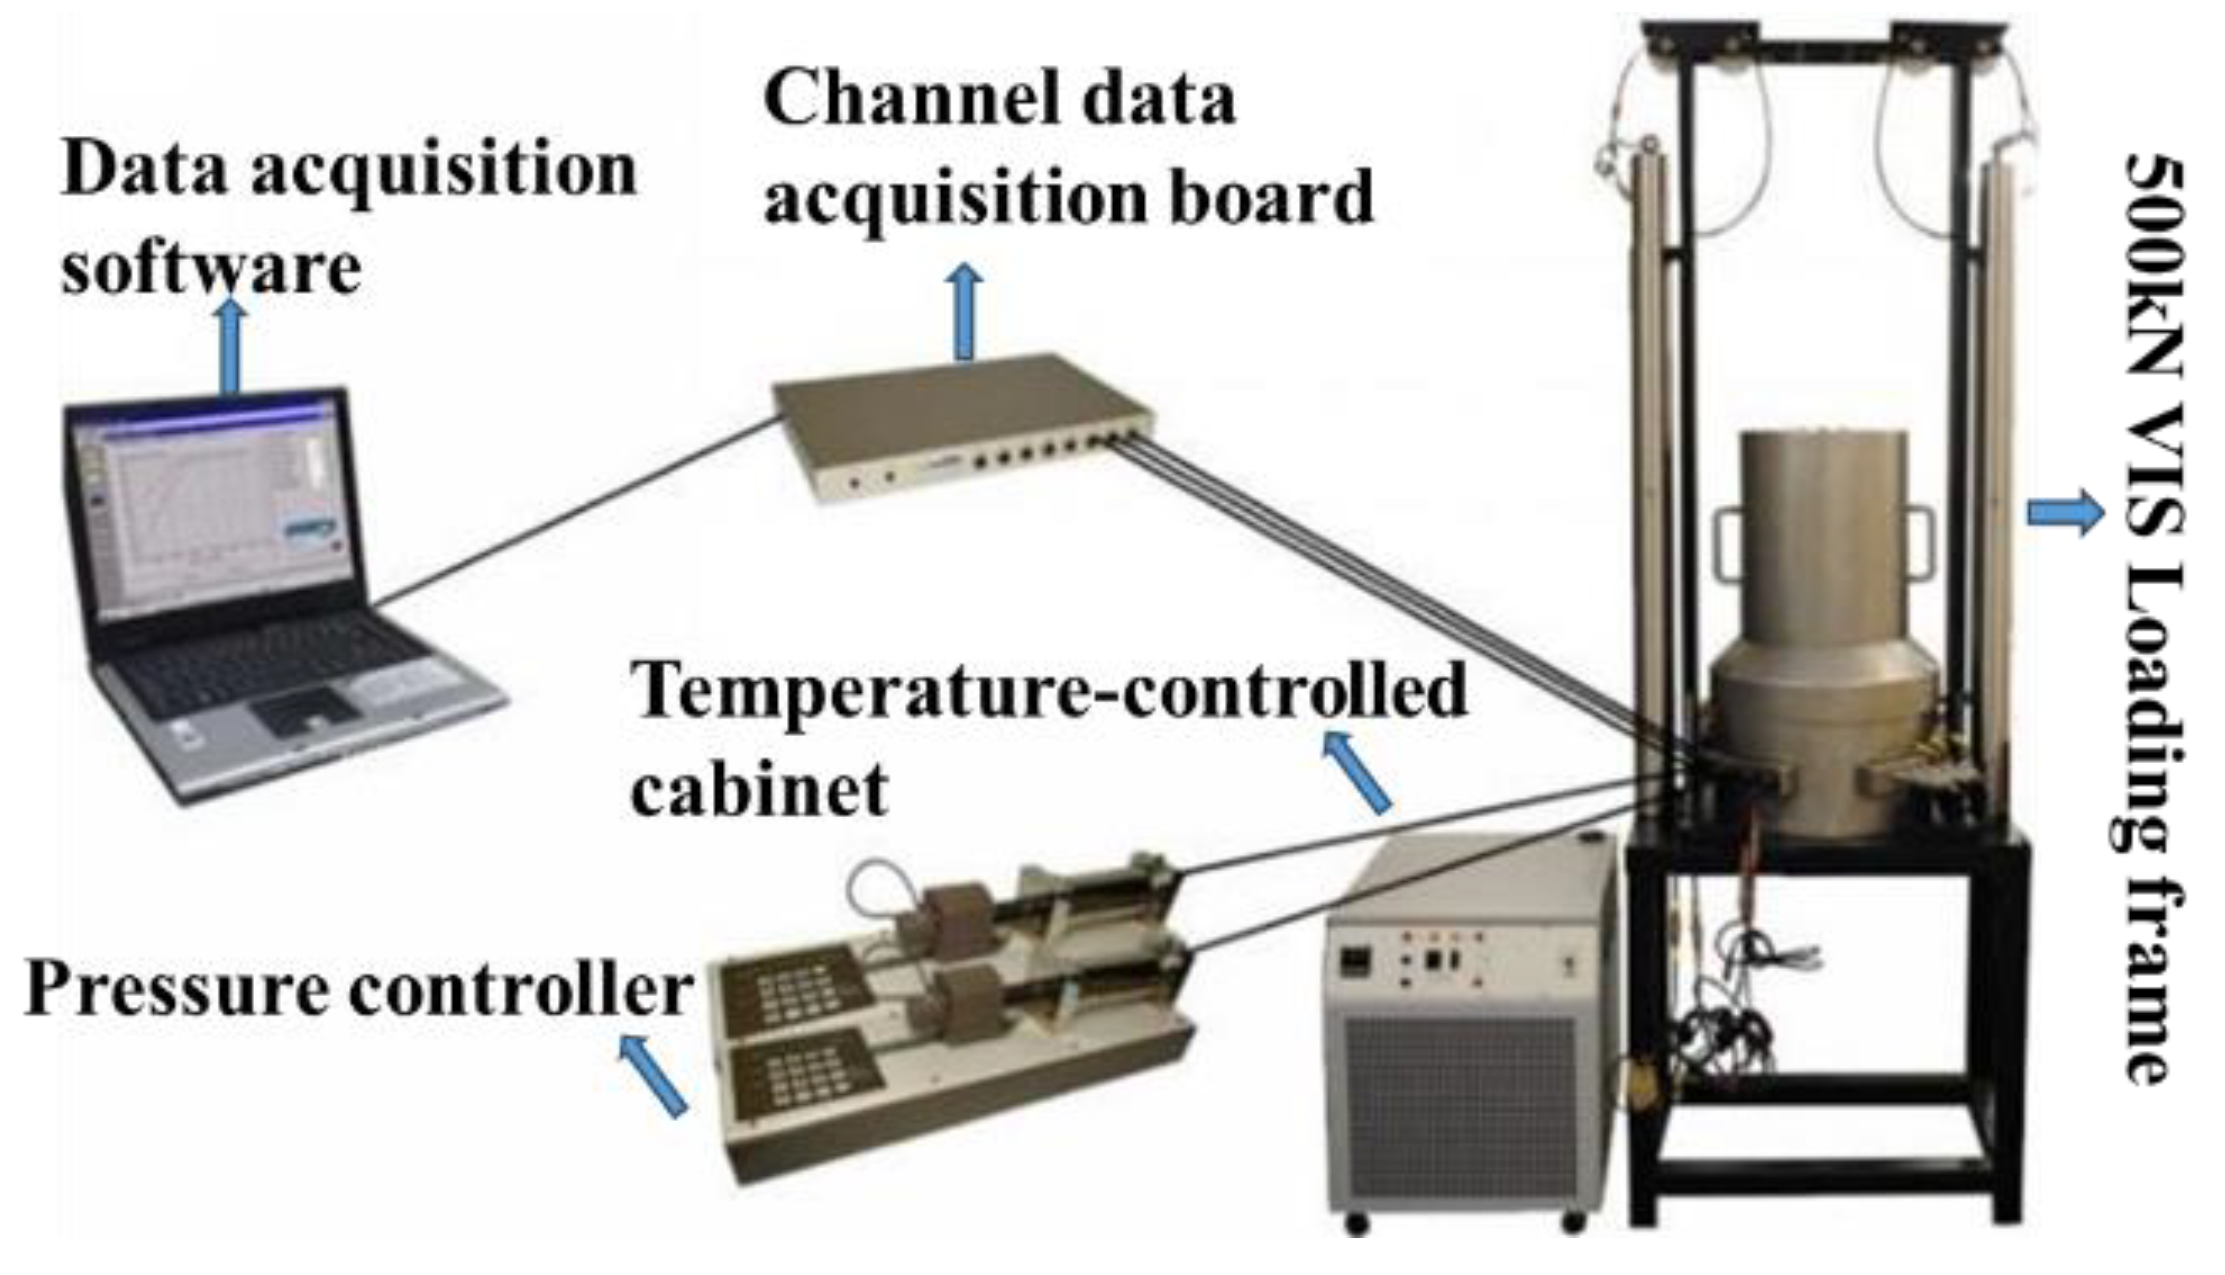
2.1. Triaxial Test Equipment

A British GDS high-stress environment triaxial test system (HPETTS) was used, as shown in Figure 1. The test system was mainly composed of GDSLAB data acquisition software (GDSLab v2.5.4.42), a channel data acquisition board, a pressure/volume controller, a 500 kN VIS load frame, and a three-axis pressure chamber. The three-axis pressure chamber comprised an upper shaft pressure chamber and a lower confining pressure chamber, and the maximum bearing capacity can reach 32 MPa. In addition to the test chamber, the high-stress triaxial test system was equipped with control and data acquisition systems. The control system includes an axial pressure controller, a confining pressure controller, and a reverse pressure controller. Both systems can apply pressures of up to 32 MPa with an accuracy of 0.001%. The stress and volume changes were recorded every second using the data acquisition system. The measuring range of the confining pressure and reverse pressure volume controller was 0–16 MPa, and the measuring range of the axial pressure volume controller was 0–32 MPa. The sensor and data conversion device of the high-stress triaxial test system automatically collected the test data for the deviatoric stress q, effective axial pressure, effective confining pressure, pore pressure u, volume change, and axial strain ε 1 .

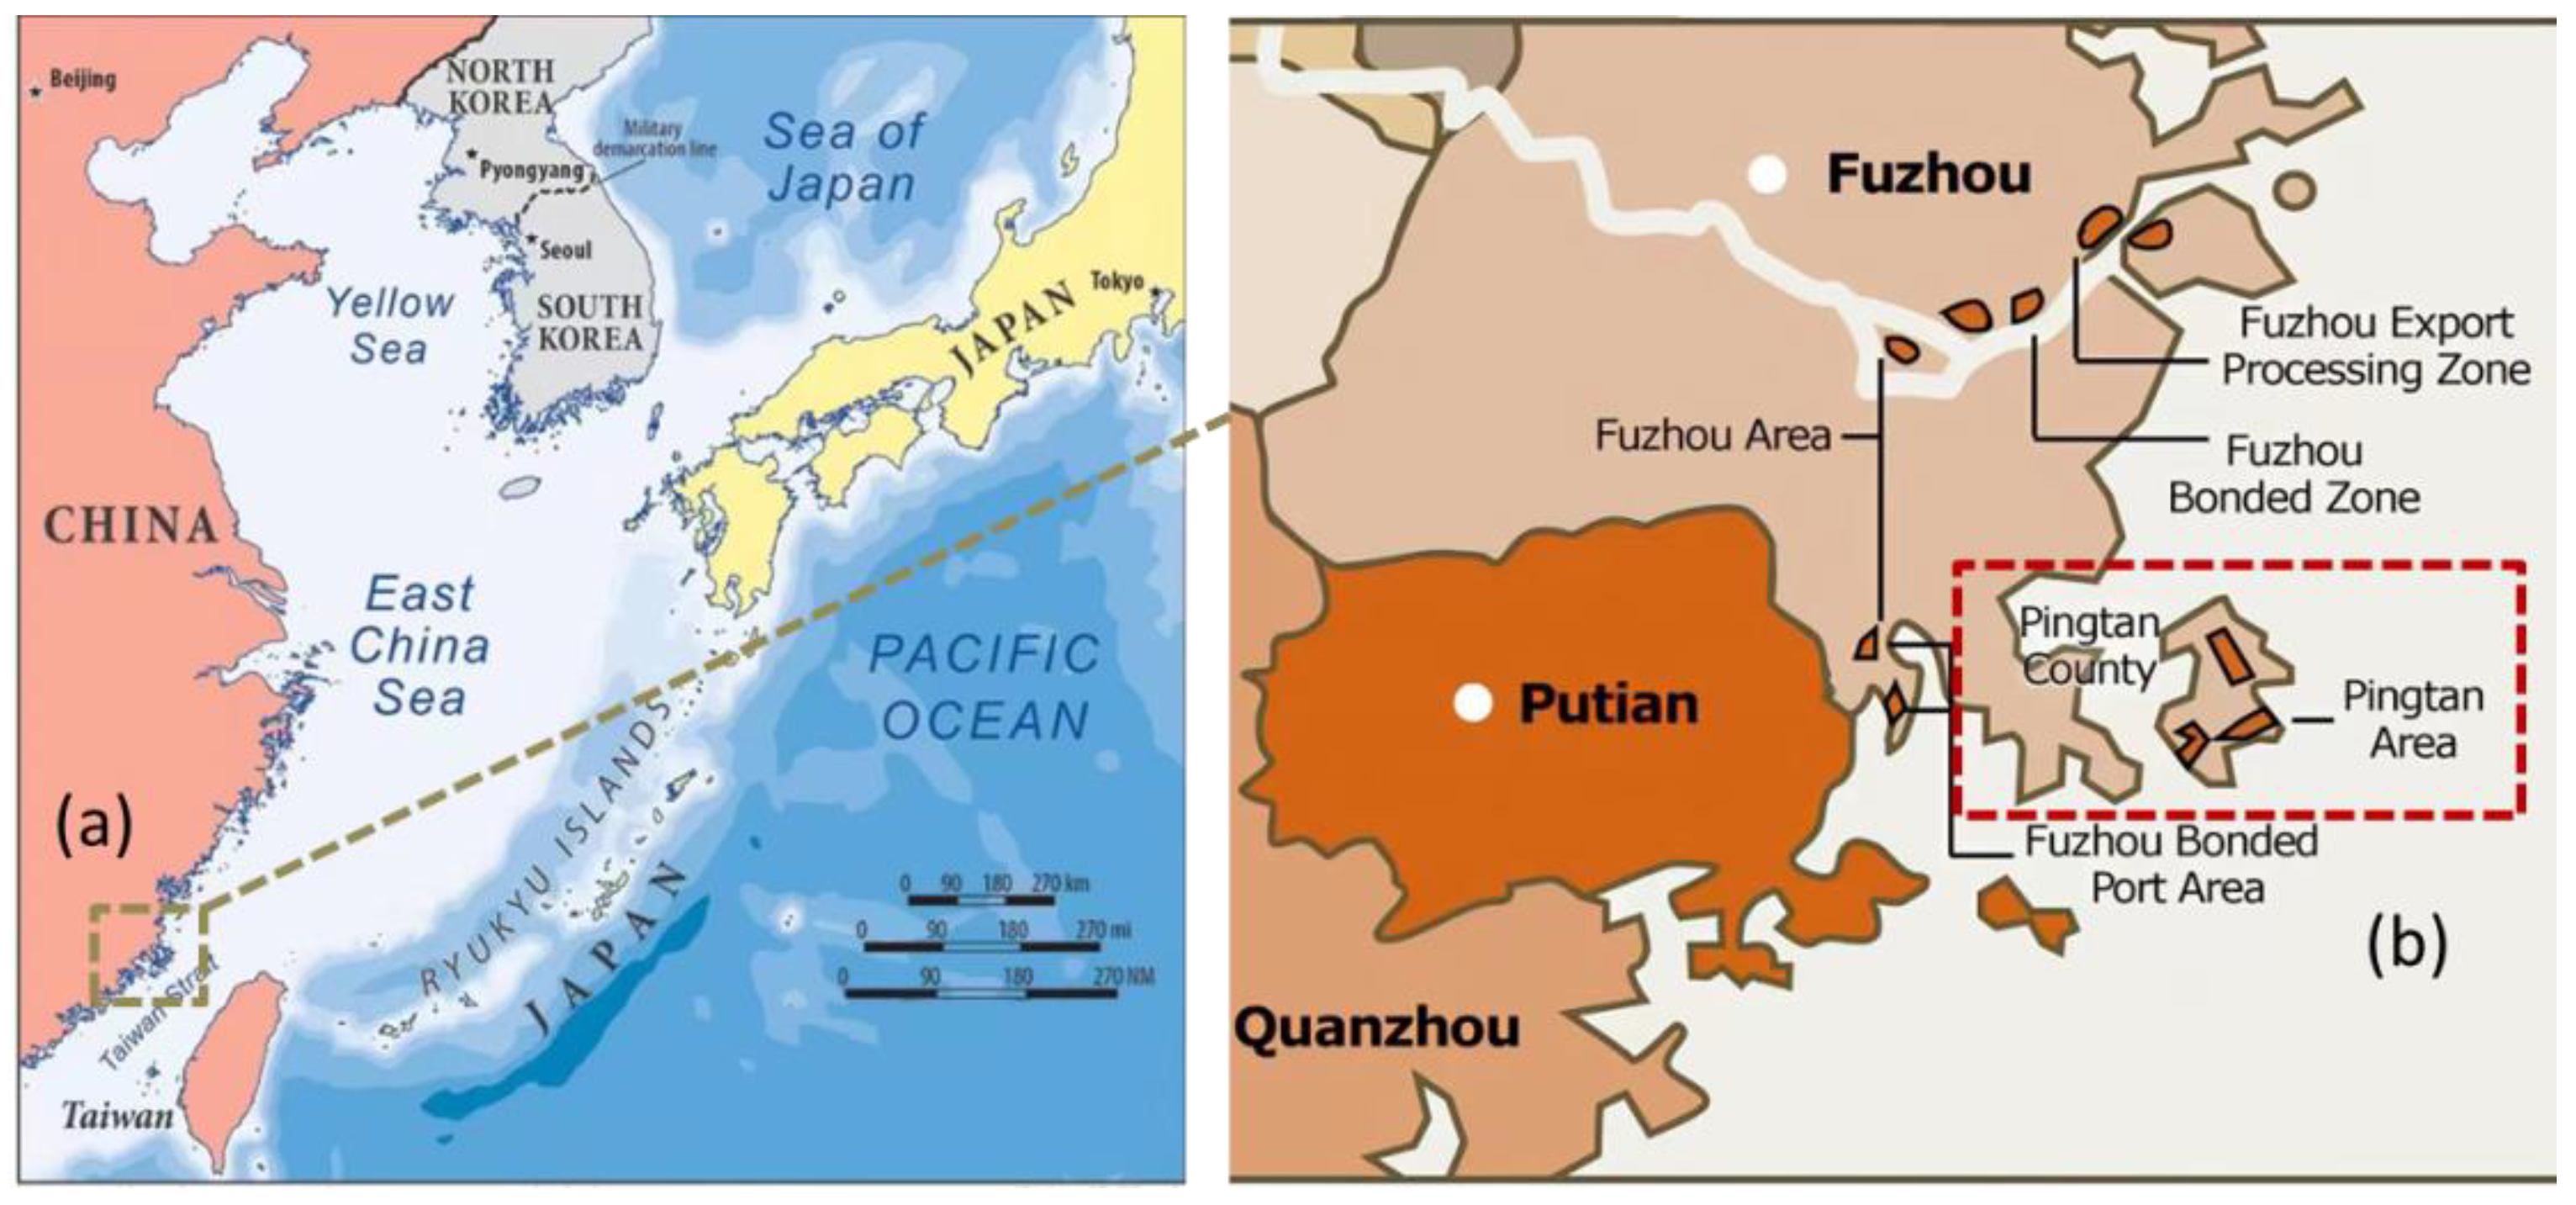
2.2. Test Material and Condition

Sand samples were obtained from Pingtan, Fujian province, near the East China Sea, and the geographic location is shown in Figure 2. The main component of the Fujian sand is quartz. An image of the silica sand sample is shown in Figure 3a. Silica sand has a uniform shape and smooth surface, similar to the characteristics of Leighton Buzzard sand [38,44], Ottawa sand, and Toyoura sand. Figure 3b shows the initial particle size distribution (PSD) curve of the silica sand. Fujian sand was sieved into five-grain groups: d1 (0.5–0.6 mm), d2 (0.6–0.7 mm), d3 (0.7–0.8 mm), d4 (0.8–0.9 mm), and d5 (0.9–1 mm). Silica sand was then prepared according to the principle of equal proportion. This ensured that the initial particle composition of each sample was identical. Table 1 lists the physical characteristics of the silica sand.

2.3. Test Program

Triaxial compression tests under two different drainage conditions (CD and CU tests) were conducted to study the influence of drainage conditions on the mechanical properties and particle breakage of silica sand. A sample with an initial relative density of 75% (dense sand) was prepared using the drop sand method (a reconstruction method that simulates the free-falling behavior of natural objects). The mass of the sand was predetermined, and all the samples prepared had a diameter of 50 mm and a height of 100 mm. Before the triaxial compression test, to ensure that the sand sample was fully saturated, it was subjected to ventilation saturation for 3 h and water head saturation for 10 h. A reverse pressure was applied step-by-step to 500 kPa in increments of 50 kPa for reverse pressure saturation, ensuring that Skempton’s B value after the saturation test was greater than 0.97. To prevent the rubber film from being punctured by the corners of silica sand samples under high-pressure conditions, a rubber film with a thickness of 1 mm was adopted. The application of this method to a structural sample can be referred to in [8]. A total of 32 high-pressure triaxial shear tests were conducted, as listed in Table 2 ( ε v is the volumetric strain, D is the fractal dimension, and W is the input work per unit volume), R2 is the correlation coefficient, and the larger the R2, the higher the degree of coincidence. To quantify particle breakage after compression, all the tests were performed in increments of 2, 4, 6, and 8 MPa when the specified average effective stress range was 2–8 MPa, and the strain shear rate in the test was 0.05%/min. To analyze the change in the particle breakage during the shearing process, parallel tests with axial strains of 5%, 10%, 15%, and 20% were conducted in each confining pressure test, and the corresponding PSD curves were obtained by performing a sieving analysis.

3. Results and Analysis

To study the influence of the stress level, drainage condition, strain termination point, and other factors on the particle crushing characteristics of silica sand, several high-pressure triaxial tests were conducted under CD and CU conditions. After the tests, the corresponding particle size distribution curves were obtained through the sieving analysis. Considering the high workload involved in the tests, the initial relative compactness was set to Dr = 75%, with four pressure levels of 2, 4, 6, and 8 MPa. Two drainage conditions were set for each stress level. To measure the amount of particle breakage during shearing, corresponding parallel tests were performed under different stress levels. The test was stopped at the termination strain point ε 1 = 5%, 10%, 15%, and 20%, and the particle breakage index at the termination strain points was calculated. Table 2 presents the detailed test data.

3.1. Examining Similarity of Parallel Specimens

The degree of particle breakage can be reflected by the change in the particle scale. However, due to the lack of a method for monitoring the change in the particle scale during the test process, the method of testing the parallel sample was used to study the evolution of particle crushing with loading. Several samples with the same initial state were loaded to different axial strains along the same stress path, and then the grading curves under the corresponding axial strains were obtained through indoor screening. By comparing the changes in the grading, the specific particle breakage was obtained under the current axial strain. Figure 4 shows the ratio of the deviatoric stress to the average effective stress under confining pressure q / p –axial strain ε 1 relationship curve. The graph shows that the difference of q / p ε 1 curves under a CD test for different termination strains is small, except when σ 3 = 2 MPa and 8 MPa, axial strain of ε 1 = 5% corresponding to the extreme difference for q / p of 13.4% and 14.7%, respectively, and the extreme differences for other confining pressures and strains are between 3% and 9%. The reason for this difference is that in the triaxial drained tests, a small difference in the volumetric strain can lead to a large difference in the effective confining pressure, resulting in a large deviation in the stress–strain curves. Therefore, the stress–strain difference of the parallel specimens in the CD test is acceptable. Overall, the extreme differences of q / p for the parallel tests are all less than 15%, indicating that the repeatability of the CD test is good at different axial strain termination points under different confining pressures. For the CU test, the four curves under σ3 = 4 MPa have the largest extreme difference of 9.2% when ε1 = 5%, and the range of the other conditions is 1.2–7.2%, indicating that the CU test with different strain termination points under different confining pressures has good repeatability.
Figure 5 shows the effective stress paths under different confining pressures during the CD and CU tests. The hollow circles in the figure represent the points at which the axial strains were 5%, 10%, 15%, and 20%. The peak strength points under different confining pressures are between the particle breakage measurement points and close to the axial strain when the test was stopped.

3.2. Mechanical Properties of Silica Sand

Figure 6a shows the deviatoric stress–axial strain relationship curves of silica sand. The deviatoric stress and initial modulus increase with an increase in the confining pressure. When σ3 = 2 MPa, the qε1 curve shows a softening characteristic, and the deviatoric stress reaches a peak value at ε1 of 6%, then gradually decreases, but still does not reach a stable critical state even at ε1 = 20%. When σ3 ≥ 4 MPa, the qε1 curves of the sand showed different degrees of strain hardening; that is, the deviatoric stresses increase with the increase in the axial strain. The greater the confining pressure, the more evident the hardening feature for the stress–strain curve. Figure 6b shows the deviatoric stress–axial strain relationship curves obtained from the CU tests. The deviatoric stress increases with the increase in the confining pressure, and the strain at the peak point gradually advances. With the increase in the axial strain, the deviatoric stress curves under different confining pressures all show a strain-softening behavior.
Figure 7a shows the volumetric strain–axial strain ( ε v ε 1 ) relationship curves for different confining pressures; shear contraction is positive, and shear expansion is negative. As shown, the sample undergoes a second phase change at σ 3 = 2 MPa, in which the sample presents reduced volume first, followed by shear expansion. With the increase in the axial strain, the sample again exhibits shear contraction. The corresponding axial strains of the two phase-change points in the diagram are 2.5% and 15.9%, respectively. When σ 3 > 2 Mpa, the sand sample was subjected to shear contraction with an increase in the axial strain; the greater the confining pressure, the more significant the shear contraction. Figure 7b shows the pore pressure in the CU test and axial strain relationship curve. From the graph, when σ 3 = 2 Mpa, the pore pressure is positive initially, and it reached a maximum at ε 1 = 1%, and then began to decrease, gradually decreasing to a negative value, reaching a minimum at ε 1 = 12.8% and then increasing. Similar to the CD test, two-phase transitions can be observed in the test process, indicated by black circles. When σ 3 > 2 Mpa, with an increase in the axial strain, the pore pressure increases rapidly in the early stage and is always positive in the shear process; the greater the confining pressure, the higher the pore pressure. Under different confining pressures, the pore pressure, after reaching the peak deviatoric stress, gradually tended to be flat but continued to increase gradually.
Figure 8 shows the relationship between the void ratio e of silica sand samples and the effective mean stress p′ under different confining pressures. It can be seen that the void ratio gradually decreases with the increase of mean effective stress during the consolidation compression process, and a steep drop does not occur. The decrease in void ratio is commonly due to compaction and particle breakage, and particle breakage is the main factor leading to a sharp drop in the e–lgp′ curve [37,48]. Therefore, it is inferred from the curve’s characteristics that the particle breakage during consolidation is extremely small and can be ignored.
The relationship between the void ratio e and the mean effective stress p′ is expressed in Equation (1):
e = 0.579 0.015 × ln ( p + 0.187 1 + 0.187 )

3.3. Evolution of PSD Curves with Axial Strain

Figure 9 shows the distribution of the particle size before and after the test under different confining pressures. Under the high-pressure conditions, the fine particles produced by the crushing of each sample increased significantly. With the increase in the axial strain, the content of large particles decreased while that of the small particles increased, and the greater the axial strain or confining pressure, the more significant this phenomenon was. The grading of the samples changed to a wide particle size distribution.
To quantify the particle breakage degree of silica sand under high stresses, this study adopted the particle breakage index theory proposed by Hardin [42], as shown in Figure 10. The particle breakage index, Br is given by Equation (2):
B r = B t B p = S < A B C D > S < A B C F >
where Bt is the area enclosed by the initial and shear grading curves, and Bp is the area enclosed by the initial grading curve and a straight line with a particle size of 0.074 mm.
Based on the definition of the particle breakage index Br proposed by Hardin, that is, Equation (2), the relationship curves between the Br and the axial strain ε 1 of silica sand in the CD and CU tests were plotted, as shown in Figure 11. The particle breakage index Br increases with increasing axial strain. The particle breakage index Br of the CU test under each confining pressure is between the range of the values of Br for σ 3 = 2–4 MPa under the CD test. When σ 3 = 2 MPa, the difference in particle breakage index in the shear process of the CD and CU tests is small. The difference in the particle breakage index between the CD and CU tests increases with the axial strain and confining pressure when σ 3 > 2 MPa, that is, the particle breakage index of the CD test is significantly higher than that of the CU test. This is mainly because the positive pore pressure produced in the CU test reduces the effective stress, thereby inhibiting particle breakage. The higher the confining pressure, the greater the positive pore pressure, and the greater the difference in the particle breakage under different drainage conditions.

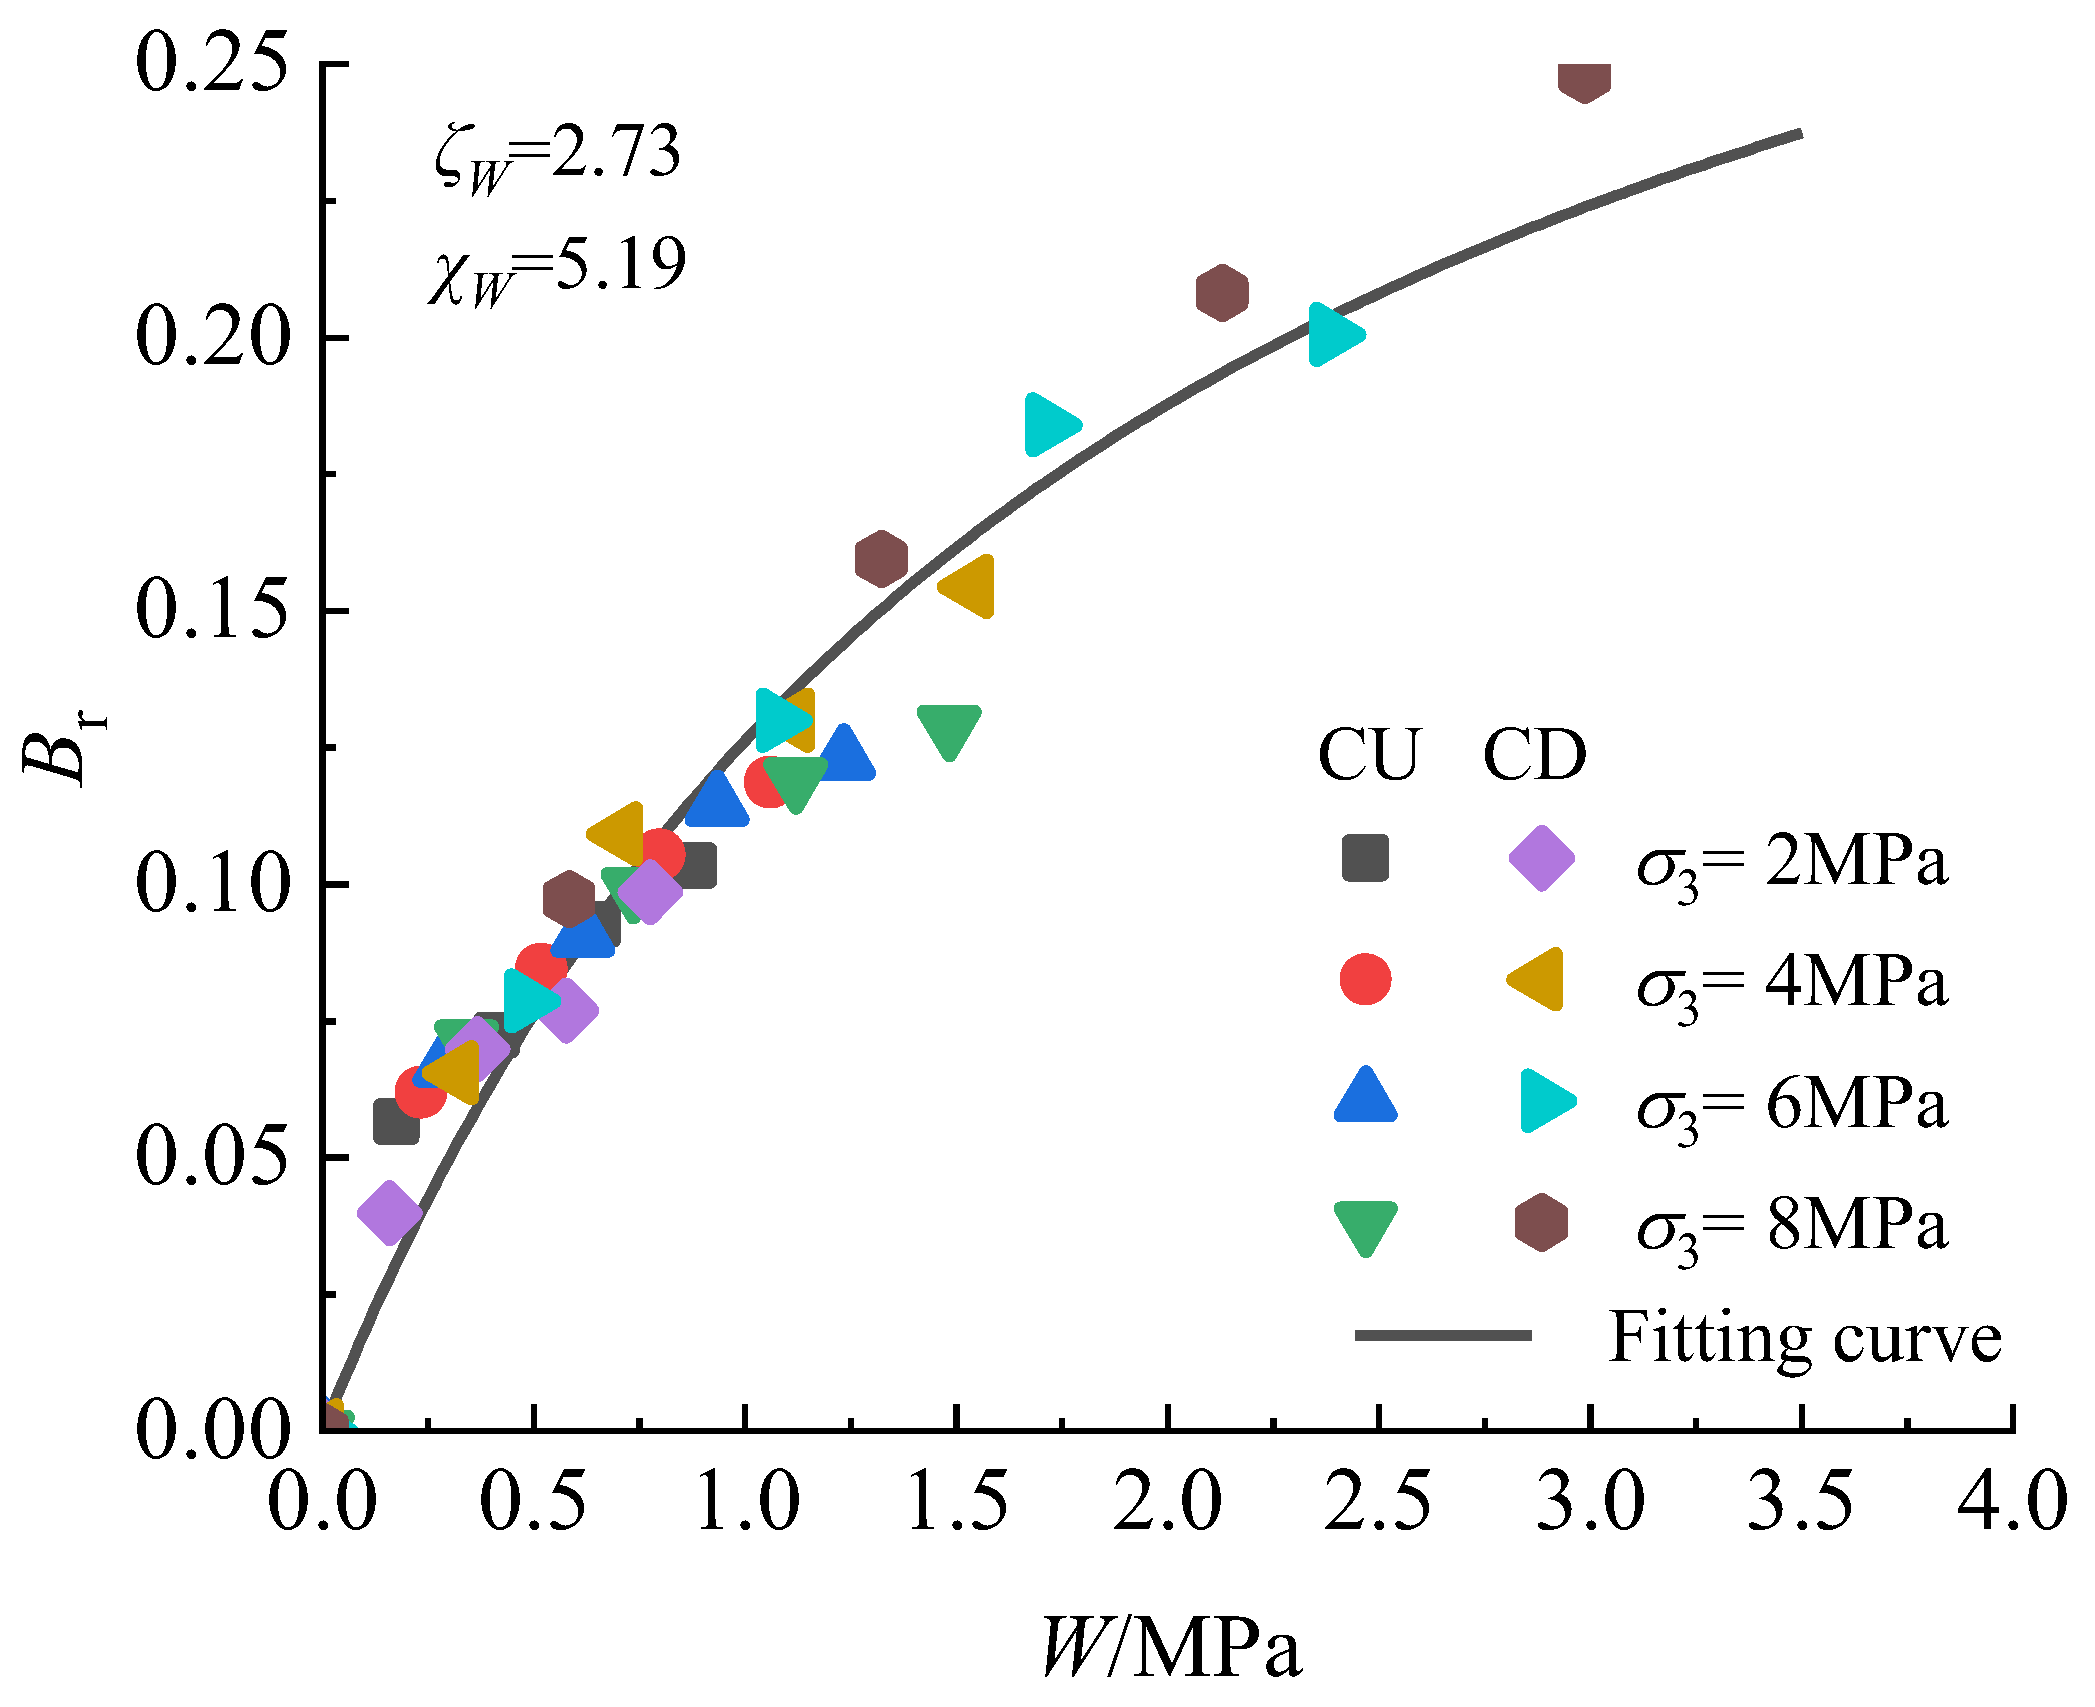
3.4. Correlations between Relative Breakage and Input Work and Volumetric Strain

Particle breakage in the shearing process of silica sand is due to the continuous work of the external forces on the material, and this process is irreversible; therefore, there is a good correspondence between the particle breakage index and input work. The total input work was mainly converted into the work consumed by particle breakage, frictional, and particle rearrangement. In this study, the input work W per unit volume is defined as follows [49]:
W = ( p d ε v + q d ε 1 )
where p′ is the effective mean stress, ε v is the volumetric strain increment, q is deviatoric stress, and ε 1 is the axial strain.
Figure 12 shows the relationship between the particle breakage index of all the samples and the input work per unit volume. Without considering the influences of the stress level, stress path, and end-strain point, the particle breakage index shows a hyperbolic nonlinear increase with increasing input work. The relationship between the particle breakage index B r and input work W per unit volume is given by Equation (4):
B r = W χ w + ζ w W
where W is the unit volume input work (MJ/m3 or MPa). The method of input work is like Equation (3).
The particle breakage index B r is the derivative of the unit volume of input work, which is the initial tangent modulus of W = 0, that is k B r 0 .
1 χ W = d B r d W = lim W 0 1 χ W + ζ W W k B r 0
When W approaches infinity, the maximum particle crushing rate can be obtained using the limit of Br, that is k B r u :
1 ζ W = lim W W χ W + ζ W W k B r u
In the equation, the material parameters χ W and ζ W are 5.19 and 2.73, respectively, k B r 0 is the reciprocal of χ W , and k B r u is the reciprocal of ζ W .
Figure 13 shows the relationship between the particle breakage index and the volumetric strain of silica sand. Regardless of the stress level, stress path, and end-strain point, the particle breakage index increased linearly with the increase in the volumetric strain. This relationship has also been observed in triaxial tests on rockfills under drainage conditions [46], calcareous sand drainage triaxial tests [45], and silica sand compression tests with different stress paths [38]. The slope of the fitted curve in this study was greater than the value (0.018) adopted by Wu et al. [8] for dense specimens. This is because the particle coordination number (the number of accessible particles around the particle) increases with relative compactness, and this effect reduces the average contact force on the silica sand particles. The relationship between the particle breakage index and the volumetric strain of silica sand can be expressed as follows:
B r = 0.038 + 2.0 ε v

3.5. Evolution Law of Particle Breakage of Silica Sand

The particle breakage evolution law of geotechnical materials is nonlinear, with an increase in the axial strain during soil shearing. The particle breakage evolution law proposed by several researchers can be applied to the analysis of rockfills [47] and calcareous sands [46]. However, whether it can be applied to silica sand, how to select the relevant model parameters, and whether the fracture evolution process of silica sand under high pressures can be reasonably described remains to be verified. Therefore, based on the test results of all the samples in this study, we found that the particle breakage and the axial strain of the silica sand soil exhibited a good hyperbolic relationship. The relationship between the particle breakage index and the axial strain of silica sand soil can be expressed as follows:
B r = ε a 1 / R B 0 + ε a / B r ¯
Here, ε α is the axial strain, B r ¯ is the maximum particle breakage index produced under the current confining pressure, and R B 0 represents the initial growth rate of particle breakage when ε α = 0. The expressions for these two physical quantities are as follows:
R B 0 = c 1 p / p a c 2
B r ¯ = p A p a + p B r ¯ ¯
Here, c 1 and c 2 are the material parameters; P a is the standard atmospheric pressure; A is a dimensionless parameter; and B r ¯ ¯ is the final particle breakage index, representing the final degree of particle breakage that can be produced under extremely high confining pressure and continuous loading conditions. For the Hardin particle breakage index, it is believed that when sand is subjected to sufficient pressure, particles of any size will eventually break into particles with a size lower than 0.075 mm, which means that B r ¯ ¯ = 1.
Figure 14 shows the fitting effect of the particle breakage model. In both the CD and CU tests, the particle breakage model results are in good agreement with the test results, indicating that the model can accurately describe the particle breakage change process of silica sand at high stresses under CD and CU conditions. The model parameters c 1 , c 2 , and A of silica sand soil were 0.43, 0.38, and 96.8, respectively, as listed in Table 3.

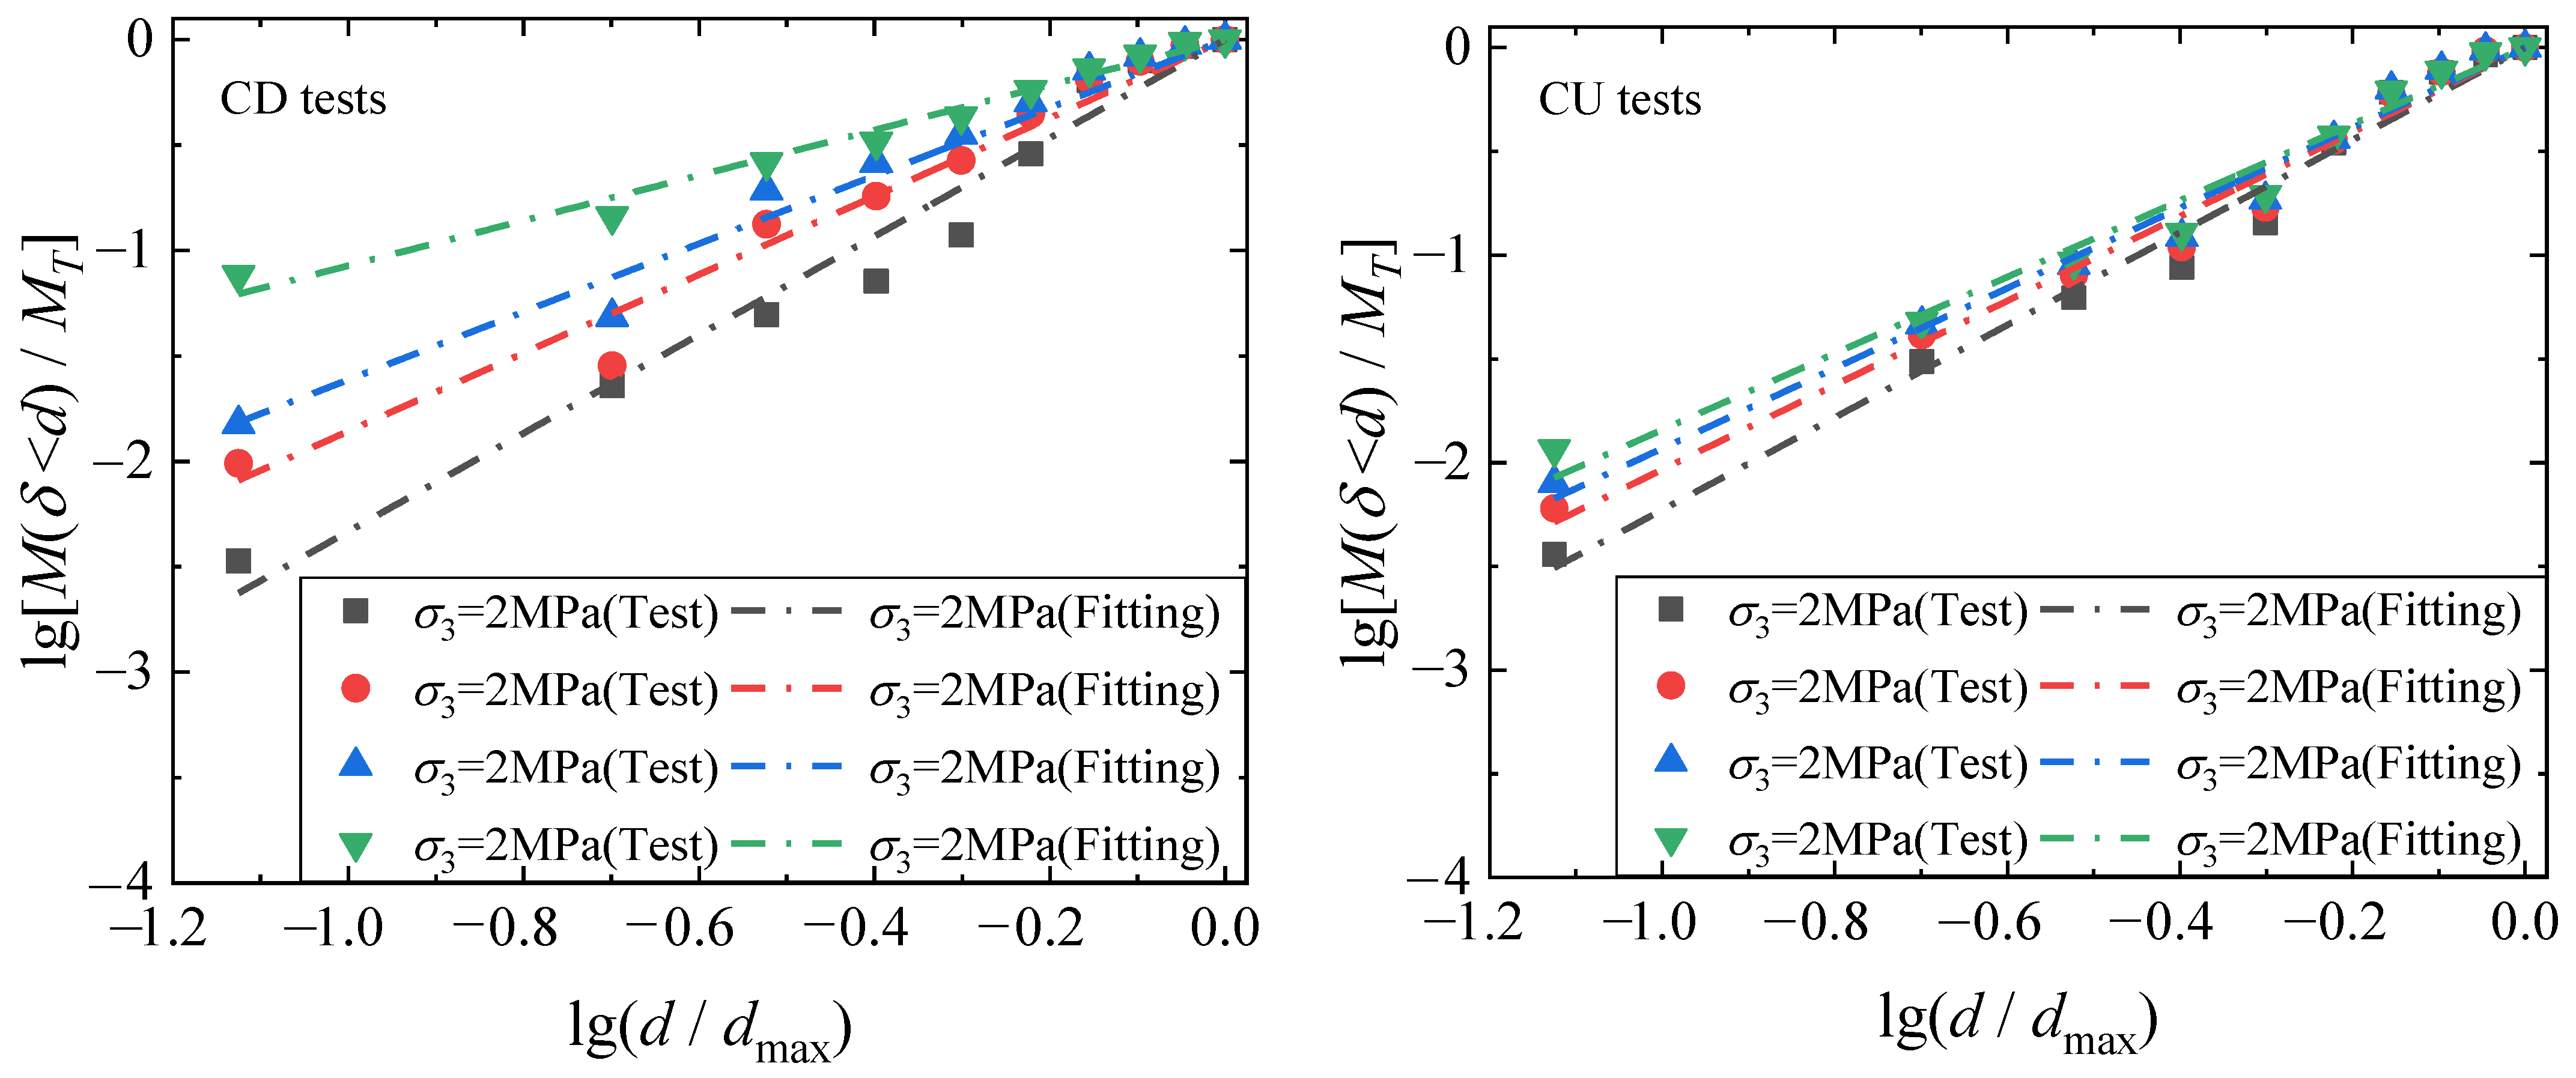
3.6. Effect of Particle Breakage on Fractal Dimension

The compaction and crushing of the silica sand particles can be considered an energy-dissipation process with self-similar characteristics [50]. Therefore, the fractal theory was applied to describe the particle size distribution of the silica sand after compaction. Based on the associated particle number and the characteristic scale [51], the basic definition of a fractal can be obtained as follows:
M d ( x < d ) M T = ( d d max ) 3 D
where D is the fractal dimension, Md is the particle mass with a radius less than r, MT is the total mass, and dmax is the dimension of the largest particle.
Figure 15 shows the fractal distribution of the silica sand samples under different stress levels. Table 2 presents the fractal dimensions. The fractal dimension in each graph increases with an increase in the fine particle content, and the fractal characteristics become more evident with an increase in the termination strain. For silica sand grains, the PSD curves show self-similarity at high stresses owing to particle breakage.
Figure 16 shows the fractal distribution of silica sand samples under different effective mean stresses. Under the same effective confining pressure conditions, the fractal degree of the CD tests is obviously greater than that of the CU tests for the cases of σ3 > 2 MPa. This is because the confining pressures in the CD tests for σ3 > 2 MPa are higher, causing the fractal dimension to extend in a larger direction.
Figure 17 shows the curve of the particle breakage index and fractal dimensions of silica sand samples under different stress ratios. As shown in the figure, the fractal dimension gradually increases with an increase in the relative particle crushing amount, exhibiting hyperbolic characteristics consistent with the results of the one-dimensional compression test of the silica sand. The crushing strength of particles depends on their size and coordination number, and the dominance of the coordination number on the particle size makes silica sand particles exhibit fractal characteristics in essence and have real fractal dimensions [44]. The force distribution of the large particles with high coordination numbers is uniform, and the probability of breakage is significantly lower than that of small particles with low coordination numbers. Therefore, particle breakage is dominant in smaller particles, satisfying the fractal condition and continuously protecting larger particles [43]. In the shearing process, with an increase in the axial strain, the increase in the relative fractal dimension of the particles decreases to zero (i.e., the limiting fractal dimension). The relationship between the particle breakage index and the fractal dimension is expressed as follows:
D = B r 0.192 B r + 0.056 0.606
Figure 18 shows the particle size distribution of silica sand under different stress levels. As shown, with an increase in the stress level, the particle size distribution of the silica sand changes from a uniform distribution to a uniform gradient distribution. The higher the stress level, the greater the shift in the particle size distribution curve toward the direction of a greater uniform gradient.
The fractal dimension was measured using the relationship between the number of particles and their sizes. The particle radius r is equivalent to the radius of a sphere with the same particle volume, and N is the number of particles. The relationship in logarithmic coordinates is expressed as follows:
3 lg ( r ) + lg N ( > r ) ( 3 D ) lg ( r )
Figure 19 shows the fractal distribution of the particle sizes of silica sand at different stress levels. The line with a 3D slope in the figure represents the fractal case of a particle. The silica sand particles exhibited self-similarity under different drainage conditions, and the fractal dimension increased with an increase in the particle breakage index. Some large particles with limited fragmentation terminated the particle fractal condition, and it was determined that the dividing line between silica sand particles with fractal characteristics and those without fractal characteristics was approximately 0.4 mm, similar to the results of the 1D compression test of Leighton Buzzard sand (LBS) reported by Zhao et al. [38].
Figure 20 shows a histogram of the particle content of silica sand particles with a radius of no more than 0.4 mm (r ≤ 0.4 mm) obtained from the high-stress triaxial test of CD and CU. Clearly, the content w of a particle with a radius r ≤ 0.4 mm increases with the increase of the confining pressure σ3 when the drainage conditions are the same. When the confining pressure is σ3 = 2 MPa, the difference of sand particle content w with r ≤ 0.4 mm between the CD test and the CU test is small; they are 11.95% and 14.52%, respectively. With the increase of confining pressure, the sand particle content w with r ≤ 0.4 mm in the CD test obviously increases, while the content w in the CU test gradually increases. This is attributed to the different effective stresses generated under different drainage conditions.
Figure 21 shows the relationship between the fractal dimensions of the particles with a radius less than 0.4 mm and the fine particle content. Clearly, the fractal dimension increases with the increase in the silica sand particle content (ω ≤ 0.4), the slope of the curve is linear, and the linear growth form is independent of the stress path and stress level. The fitting line is expressed as follows:
D = 0.477 + 0.041 ω 0.4

4. Conclusions

In this study, high-stress triaxial shear tests were conducted on silica sand, and the evolution law of particle breakage during shearing under different drainage conditions was obtained. The relationship between the particle breakage and fractal dimension during shearing was studied. The conclusions obtained from the tests are as follows:
  • In the CD and CU tests, the particle breakage index Br of silica sand increased with increasing confining pressure and axial strain. However, the particle breakage index in the CD test was more evidently affected by the confining pressure and shearing process, whereas that in the CU test exhibited relatively small changes and was generally lower than that in the CD test, mainly because the pore water pressure generated in the CU test reduced the effective stress, thus significantly inhibiting the influence of the confining pressure on particle breakage.
  • In the high-stress shearing process, the particle breakage of silica sand increased with an increase in the axial strain in a hyperbolic form, and a mathematical model was developed to describe the change in the particle breakage index of silica sand under CD and CU conditions. A hyperbolic model was proposed to describe the relationship between the particle breakage index amount and the input work per unit volume under different drainage conditions.
  • An up-convex hyperbolic model was proposed to correlate all the test results of the fractal dimension and relative fragmentation. The fractal feature terminated at the radius of the particles that were broken to a certain extent. The dividing line between silica sand particles with the fractal features and those without the fractal features was approximately 0.4 mm. For particles with radii less than or equal to 0.4 mm, the fractal dimension increased linearly with increasing particle content.

Author Contributions

Conceptualization, formal analysis, and writing—review and editing, R.C. and D.H.; investigation and writing—original draft preparation, T.Z. and Z.W.; investigation and data curation, T.Z., Z.W., C.Y. and N.X. All authors have read and agreed to the published version of the manuscript.

Funding

This research was funded by the National Natural Science Foundation of China (grant number 52078108); Jilin Province Youth Science and Technology Innovation Leader, Team Project of Provincial Department of Science and Technology (grant number 20210509058RQ); and the Scientific Research Project of Jilin Provincial Department of Education (grant number JJKH20210103KJ).

Institutional Review Board Statement

Not applicable.

Informed Consent Statement

Not applicable.

Data Availability Statement

Authors have confirmed the upload data.

Conflicts of Interest

The authors declare no conflict of interest.

References

  1. Hagerty, M.M.; Hite, D.R.; Ullrich, C.R.; Hagerty, D.J. One-dimensional high-pressure compression of granular media. J. Geotech. Eng. 1993, 119, 1–18. [Google Scholar] [CrossRef]
  2. Wang, Y.; Zhang, S.; Ao, D.H.; Yu, Y.; Sun, X. Particle breakage characteristics of rockfills under complex stress paths. Chin. J. Geotech. Eng. 2018, 40, 698–706. [Google Scholar]
  3. Dong, Y.; Wang, D.; Randolph, M.F. Investigation of impact forces on pipeline by submarine landslide with material point method. Ocean. Eng. 2017, 146, 21–28. [Google Scholar] [CrossRef]
  4. Sun, Q.L.; Wang, Q.; Shi, F.Y.; Alves, T.; Gao, S.; Xie, X.N.; Wu, S.G.; Li, J.B. Runup of landslide-generated tsunamis controlled by paleogeography and sea-level change. Commun. Earth Environ. 2022, 3, 244. [Google Scholar] [CrossRef]
  5. Fan, N.; Jiang, J.; Nian, T.; Dong, Y.; Guo, L.; Fu, C.; Tian, Z.; Guo, X. Impact action of submarine slides on pipelines: A review of the state-of-the-art since 2008. Ocean. Eng. 2023, 286, 115532. [Google Scholar] [CrossRef]
  6. Xiao, Y.; Desai, C.S.; Daouadji, A.; Stuedlein, A.W.; Liu, H.; Abuel-Naga, H. Grain crushing in geoscience materials–Key issues on crushing response, measurement and modeling: Review and preface. Geosci. Front. 2020, 11, 363–374. [Google Scholar] [CrossRef]
  7. Yamamuro, J.A.; Lade, P.V. Drained sand behavior in axisymmetric tests at high pressures. J. Geotech. Eng. 1996, 122, 109–119. [Google Scholar] [CrossRef]
  8. Wu, Y.; Yamamoto, H.; Cui, J.; Cheng, H. Influence of load mode on particle crushing characteristics of silica sand at high stresses. Int. J. Geomech. 2020, 20, 04019194. [Google Scholar]
  9. Yu, F. Characteristics of particle breakage of sand in triaxial shear. Powder Technol. 2017, 320, 656–667. [Google Scholar] [CrossRef]
  10. Yu, F. Particle breakage and the drained shear behavior of sands. Int. J. Geomech. 2017, 17, 04017041. [Google Scholar] [CrossRef]
  11. Yu, F. Particle breakage and the undrained shear behavior of sands. Int. J. Geomech. 2018, 18, 04018079. [Google Scholar] [CrossRef]
  12. Nakata, Y.; Hyodo, M.; Hyde, A.F.L.; Kato, Y.; Murata, H. Microscopic particle crushing of sand subjected to high pressure one-dimensional compression. Soils Found. 2001, 41, 69–82. [Google Scholar] [CrossRef]
  13. Lade, P.V.; Yamamuro, J.A.; Bopp, P.A. Significance of particle crushing in granular materials. J. Geotech. Eng. 1996, 122, 309–316. [Google Scholar] [CrossRef]
  14. Mehta, A.A.; Patel, A. An investigation on the particle breakage of Indian River sands. Eng. Geol. 2018, 233, 23–37. [Google Scholar] [CrossRef]
  15. Xiao, Y.; Liu, H.; Ding, X.; Chen, Y.; Jiang, J.; Zhang, W. Influence of particle breakage on critical state line of rockfill material. Int. J. Geomech. 2016, 16, 04015031. [Google Scholar] [CrossRef]
  16. Xiao, Y.; Liu, H. Elastoplastic constitutive model for rockfill materials considering particle breakage. Int. J. Geomech. 2017, 17, 04016041. [Google Scholar] [CrossRef]
  17. Yu, F. Influence of particle breakage on behavior of coral sands in triaxial tests. Int. J. Geomech. 2019, 19, 04019131. [Google Scholar] [CrossRef]
  18. Wu, Y.; Li, N.; Wang, X.; Cui, J.; Chen, Y.; Wu, Y.; Yamamoto, H. Experimental investigation on mechanical behavior and particle crushing of calcareous sand retrieved from South China Sea. Eng. Geol. 2021, 280, 105932. [Google Scholar] [CrossRef]
  19. Miao, G.; Airey, D. Breakage and ultimate states for a carbonate sand. Géotechnique 2013, 63, 1221–1229. [Google Scholar] [CrossRef]
  20. Liu, L.; Cai, G.; Liu, S. Compression properties and micro-mechanisms of rubber-sand particle mixtures considering grain breakage. Constr. Build. Mater. 2018, 187, 1061–1072. [Google Scholar] [CrossRef]
  21. Luzzani, L.; MR, C. On the relationship between particle breakage and the critical state of sands. Soils Found. 2002, 42, 71–82. [Google Scholar] [CrossRef]
  22. Coop, M.R.; Sorensen, K.K.; Bodas Freitas, T.; Georgoutsos, G. Particle breakage during shearing of a carbonate sand. Géotechnique 2004, 54, 157–163. [Google Scholar] [CrossRef]
  23. Nakata, Y.; Kato, Y.; Hyodo, M.; Hyde, A.F.; Murata, H. One-dimensional compression behaviour of uniformly graded sand related to single particle crushing strength. Soils Found. 2001, 41, 39–51. [Google Scholar] [CrossRef]
  24. Mesri, G.; Vardhanabhuti, B. Compression of granular materials. Can. Geotech. J. 2009, 46, 369–392. [Google Scholar] [CrossRef]
  25. Mun, W.; McCartney, J.S. Roles of particle breakage and drainage in the isotropic compression of sand to high pressures. J. Geotech. Geoenvironmental Eng. 2017, 143, 04017071. [Google Scholar] [CrossRef]
  26. Altuhafi, F.N.; Coop, M.R. Changes to particle characteristics associated with the compression of sands. Géotechnique 2011, 61, 459–471. [Google Scholar] [CrossRef]
  27. Xiao, Y.; Liu, H.; Chen, Q.; Ma, Q.; Xiang, Y.; Zheng, Y. Particle breakage and deformation of carbonate sands with wide range of densities during compression loading process. Acta Geotech. 2017, 12, 1177–1184. [Google Scholar] [CrossRef]
  28. Yu, F.; Su, L. Particle breakage and the mobilized drained shear strengths of sand. J. Mt. Sci. 2016, 13, 1481–1488. [Google Scholar] [CrossRef]
  29. Xiao, Y.; Liu, H.; Chen, Y.; Chu, J. Influence of intermediate principal stress on the strength and dilatancy behavior of rockfill material. J. Geotech. Geoenvironmental Eng. 2014, 140, 04014064. [Google Scholar] [CrossRef]
  30. Wang, G.; Zha, J. Particle breakage evolution during cyclic triaxial shearing of a carbonate sand. Soil Dyn. Earthq. Eng. 2020, 138, 106326. [Google Scholar] [CrossRef]
  31. Hyodo, M.; Wu, Y.; Aramaki, N.; Nakata, Y. Undrained monotonic and cyclic shear response and particle crushing of silica sand at low and high pressures. Can. Geotech. J. 2017, 54, 207–218. [Google Scholar] [CrossRef]
  32. Ding, Z.; He, S.H.; Sun, Y.F.; Xia, T.-D.; Zhang, Q.-F. Comparative study on cyclic behavior of calcareous sand and terrigenous siliceous sand for transportation infrastructure applications. Constr. Build. Mater. 2021, 283, 122740. [Google Scholar] [CrossRef]
  33. Xiao, Y.; Yuan, Z.; Desai, C.S.; Zaman, M.; Ma, Q.; Chen, Q.; Liu, H. Effects of load duration and stress level on deformation and particle breakage of carbonate sands. Int. J. Geomech. 2020, 20, 06020014. [Google Scholar] [CrossRef]
  34. Kikumoto, M.; Wood, D.M.; Russell, A. Particle crushing and deformation behaviour. Soils Found. 2010, 50, 547–563. [Google Scholar] [CrossRef]
  35. Carrera, A.; Coop, M.R.; Lancellotta, R. Influence of grading on the mechanical behaviour of Stava tailings. Géotechnique 2011, 61, 935–946. [Google Scholar] [CrossRef]
  36. Bandini, V.; Coop, M.R. The influence of particle breakage on the location of the critical state line of sands. Soils Found. 2011, 51, 591–600. [Google Scholar] [CrossRef]
  37. Yu, F.W. Particle breakage and the critical state of sands. Géotechnique 2017, 67, 713–719. [Google Scholar] [CrossRef]
  38. Zhao, B.; Wang, J.; Andò, E.; Viggiani, G.; Coop, M.R. Investigation of particle breakage under one-dimensional compression of sand using X-ray microtomography. Can. Geotech. J. 2020, 57, 754–762. [Google Scholar] [CrossRef]
  39. De Bono, J.P.; McDowell, G.R. The fractal micro mechanics of normal compression. Comput. Geotech. 2016, 78, 11–24. [Google Scholar] [CrossRef]
  40. Huang, J.Y.; Hu, S.S.; Xu, S.L.; Luo, S.N. Fractal crushing of granular materials under confined compression at different strain rates. Int. J. Impact Eng. 2017, 106, 259–265. [Google Scholar] [CrossRef]
  41. Zhou, W.; Wang, D.; Ma, G.; Cao, X.; Hu, C.; Wu, W. Discrete element modeling of particle breakage considering different fragment replacement modes. Powder Technol. 2020, 360, 312–323. [Google Scholar] [CrossRef]
  42. Hardin, B.O. Crushing of soil particles. J. Geotech. Eng. 1985, 111, 1177–1192. [Google Scholar] [CrossRef]
  43. Afshar, T.; Disfani, M.M.; Narsilio, G.A.; Arulrajah, A. Post-breakage changes in particle properties using synchrotron tomography. Powder Technol. 2018, 325, 530–544. [Google Scholar] [CrossRef]
  44. Zhao, B.; Wang, J.; Coop, M.R.; Viggiani, G.; Jiang, M. An investigation of single sand particle fracture using X-ray micro-tomography. Géotechnique 2015, 65, 625–641. [Google Scholar] [CrossRef]
  45. Negussey, D.; Wijewickreme, W.K.D.; Vaid, Y.P. Constant-volume friction angle of granular materials. Can. Geotech. J. 1988, 25, 50–55. [Google Scholar] [CrossRef]
  46. Wang, G.; Wang, Z.; Ye, Q.; Wei, X. Particle breakage and deformation behavior of carbonate sand under drained and undrained triaxial compression. Int. J. Geomech. 2020, 20, 04020012. [Google Scholar] [CrossRef]
  47. Jia, Y.; Xu, B.; Chi, S.; Xiang, B.; Xiao, D.; Zhou, Y. Particle breakage of rockfill material during triaxial tests under complex stress paths. Int. J. Geomech. 2019, 19, 04019124. [Google Scholar] [CrossRef]
  48. Ciantia, M.O.; Arroyo, M.; O’Sullivan, C.; Gens, A.; Liu, T. Grading evolution and critical state in a discrete numerical model of Fontainebleau sand. Géotechnique 2019, 69, 1–15. [Google Scholar] [CrossRef]
  49. Xiao, Y.; Wang, C.; Zhang, Z.; Liu, H.; Yin, Z.-Y. Constitutive modeling for two sands under high pressure. Int. J. Geomech. 2021, 21, 04021042. [Google Scholar] [CrossRef]
  50. McDowell, G.R.; Bolton, M.D. On the micromechanics of crushable aggregates. Géotechnique 1998, 48, 667–679. [Google Scholar] [CrossRef]
  51. Xiao, Y.; Yuan, Z.; Lv, Y.; Wang, L.; Liu, H. Fractal crushing of carbonate and quartz sands along the specimen height under impact loading. Constr. Build. Mater. 2018, 182, 188–199. [Google Scholar] [CrossRef]
Figure 1. GDS high-stress triaxial test system.
Jmse 11 01825 g001
Figure 2. The collection point of sand samples is located on Pingtan Island, Pingtan County, Fuzhou City, Fujian Province, adjacent to the East China Sea. (a) East China Sea, (b) Pingtan Area.
Jmse 11 01825 g002
Figure 3. (a) Image of silica sand sample. (b) Particle size distribution curve of silica sand under initial condition.
Jmse 11 01825 g003
Figure 4. Relationships between q / p and ε 1 with various confining pressures. (a) CD tests, (b) CU tests.
Jmse 11 01825 g004
Figure 5. Stress paths under various confining pressures. (a) CD tests, (b) CU tests.
Jmse 11 01825 g005
Figure 6. Relationships between q and ε 1 under various confining pressures. (a) CD tests, (b) CU tests.
Jmse 11 01825 g006
Figure 7. Relationships of ε v ε 1 and u ε 1 with various confining pressures. (a) CD tests, (b) CU tests.
Jmse 11 01825 g007
Figure 8. Void ratio versus mean effective stress during consolidation.
Jmse 11 01825 g008
Figure 9. Particle size distribution curves after triaxial tests. (a) CU test under σ3 = 2 MPa, (b) CU test under σ3 = 4 MPa, (c) CU test under σ3 = 6 MPa, (d) CU test under σ3 = 8 MPa, (e) CD test under σ3 = 2 MPa, (f) CD test under σ3 = 4 MPa, (g) CD test under σ3 = 6 MPa, and (h) CD test under σ3 = 8 MPa.
Jmse 11 01825 g009aJmse 11 01825 g009b
Figure 10. Particle breakage index definition proposed by Hardin [42].
Jmse 11 01825 g010
Figure 11. Relationship between Br and ε 1 under various confining pressures applied in the CD and CU tests. (a) CD test (b) CU test.
Jmse 11 01825 g011
Figure 12. Relationship between the particle breakage index and input energy.
Jmse 11 01825 g012
Figure 13. Relationship between the particle breakage index and the volumetric strain.
Jmse 11 01825 g013
Figure 14. Performance of breakage model. (a) CD tests, (b) CU tests.
Jmse 11 01825 g014
Figure 15. Relationship between lg[M( δ < d)/MT] and lg(d/dmax) at different axial strains. (a) CD test under σ3 = 2 MPa, (b) CU test under σ3 = 2 MPa, (c) CD test under σ3 = 4 MPa, (d) CU test under σ3 = 4 MPa, (e) CD test under σ3 = 6 MPa, (f) CU test under σ3 = 6 MPa, (g) CD test under σ3 = 8 MPa, and (h) CU test under σ3 = 8 MPa.
Jmse 11 01825 g015aJmse 11 01825 g015b
Figure 16. Relationship curves of lg[M( δ < d)/MT] and lg(d/dmax) with various confining pressures.
Jmse 11 01825 g016
Figure 17. Relationship between fractal dimension and the particle breakage index.
Jmse 11 01825 g017
Figure 18. Particle size distributions of silica sand under different stress levels.
Jmse 11 01825 g018
Figure 19. Fractal distributions for silica sand under different stress levels.
Jmse 11 01825 g019
Figure 20. Bar graphs of the evolution of the particle content (a) CD tests, (b) CU tests.
Jmse 11 01825 g020
Figure 21. Relationship between the fractal dimension and the fine particle content (r < 0.4 mm).
Jmse 11 01825 g021
Table 1. Properties of silica sand.
PropertyValue
Specific gravity, Gs2.65
Average grain size d50: mm0.75
Coefficient of uniformity, Cu1.45
Curvature coefficient, Cc0.96
Maximum void ratio, emax0.78
Minimum void ratio, emin0.55
Particle size range, mm0.5–1.0
Table 2. Test program and results of high-stress triaxial tests.
Test (No.)Type of ShearTermination Axial Strain (%)σ3
(MPa)
BrW (MJ/m3)DR2
TCD-1CD520.0400.1600.1700.940
TCD-2CD1020.0650.3190.3900.975
TCD-3CD1520.0790.4800.5500.981
TCD-4CD2020.0970.5840.6670.970
TCD-5CD540.0700.3670.3020.983
TCD-6CD1040.1090.7070.6910.988
TCD-7CD1540.1301.0740.8950.981
TCD-8CD2040.1601.3231.1420.976
TCD-9CD560.0770.5770.5190.989
TCD-10CD1060.0131.1160.9160.988
TCD-11CD1560.1751.7131.2440.986
TCD-12CD2060.2082.1291.3870.976
TCD-13CD580.0990.7760.7630.975
TCD-14CD1080.0151.5381.2390.994
TCD-15CD1580.2062.3841.5140.990
TCD-16CD2080.2482.9871.9280.980
TCU-1CU520.0570.1760.1970.923
TCU-2CU1020.0620.2340.3190.964
TCU-3CU1520.0670.2900.6110.978
TCU-4CU2020.0710.3410.9170.987
TCU-5CU540.0730.4130.1430.959
TCU-6CU1040.0840.5180.5170.973
TCU-7CU1540.0910.6170.8390.982
TCU-8CU2040.0990.7340.9670.983
TCU-9CU560.0930.6510.2870.960
TCU-10CU1060.1050.7980.7270.960
TCU-11CU1560.1140.9350.9640.973
TCU-12CU2060.1191.1211.1440.971
TCU-13CU580.1030.8790.4770.962
TCU-14CU1080.1191.0610.8650.971
TCU-15CU1580.1231.2341.0480.972
TCU-16CU2080.1291.4841.1580.976
Table 3. Parameters of the particle breakage model.
c 1 c 2 A B r ¯ ¯ R2
0.430.3896.810.997
Disclaimer/Publisher’s Note: The statements, opinions and data contained in all publications are solely those of the individual author(s) and contributor(s) and not of MDPI and/or the editor(s). MDPI and/or the editor(s) disclaim responsibility for any injury to people or property resulting from any ideas, methods, instructions or products referred to in the content.

