Article

A Hybrid Probabilistic Risk Analytical Approach to Ship Pilotage Risk Resonance with FRAM

1
Merchant Marine College, Shanghai Maritime University, Shanghai 201306, China
2
School of Nautical Technology, Jiangsu Shipping College, Nantong 226010, China
*
Author to whom correspondence should be addressed.
J. Mar. Sci. Eng. 2023, 11(9), 1705; https://doi.org/10.3390/jmse11091705
Submission received: 8 August 2023 / Revised: 27 August 2023 / Accepted: 28 August 2023 / Published: 29 August 2023
(This article belongs to the Special Issue Research and Evaluation of Ship Collision Risk)

Abstract

:
Collision risk in ship pilotage process has complex characteristics that are dynamic, uncertain, and emergent. To reveal collision risk resonance during ship pilotage process, a hybrid probabilistic risk analysis approach is proposed, which integrates the Functional Resonance Analysis Method (FRAM), Dempster–Shafer (D–S) evidence theory, and Monte Carlo (MC) simulation. First, FRAM is used to qualitatively describe the coupling relationship and operation mechanism among the functions of the pilotage operation system. Then, the D–S evidence theory is used to determine the probability distribution of the function output in the specified pilotage scenario after quantitatively expressing the function variability, coupling effect, and the influence of operation conditions through rating scales. Finally, MC simulation is used to calculate the aggregated coupling variability between functions, and the critical couplings and risk resonance paths under different scenarios are identified by setting the threshold and confidence level. The results show that ship collision risk transmission is caused by function resonance in the pilotage system, and the function resonance paths vary with pilotage scenarios. The critical coupling ‘F2-F7(I)’ emerges as a consistent factor in both scenarios, emphasizing the significance of maintaining a proper lookout. The hybrid probabilistic risk analytical approach to ship pilotage risk resonance with FRAM can be a useful method for analysing the causative mechanism of ship operational risk.

1. Introduction

Ship transportation is the primary mode of transportation for bulk goods and accounts for more than 80% of the freight volume in international trade [1]. To safeguard national sovereignty, ensure the navigational safety of port ships, and prevent water pollution, most countries have implemented compulsory pilotage for foreign ships arriving at ports. However, ships still face significant risks of collision, grounding, contact damage, and other accidents during pilotage owing to limited channel conditions, complex navigation environments, and dense ship traffic in pilotage waters despite the escorting of skilled professionals (i.e., pilots) who are familiar with the environment [2]. In addition, because of the restricted waters in ports and fragile environments, they are more likely to cause significant damage to human life, property loss, and pollution [3]. According to a report published by the International Group of P&I Clubs (IG), collisions account for more than half of pilot-related accidents [4]. Although there is a higher risk of collision during ship pilotage, it has not received sufficient attention compared to ship accident risk at sea.
As a typical maritime risk, ship collision risk is primarily studied in terms of risk identification, risk assessment, and risk control under the Formal Safety Assessment (FSA) framework advocated by the International Maritime Organization [5]. Risk identification, as the basis of risk assessment and control, aims to reveal the potential causes and mechanisms of accident risks. The key to identifying maritime risks is determining the system’s risk influencing factors (RIFs), which is generally achieved through historical data analysis or expert judgment [6]. The composition and influencing mechanisms of RIFs are constantly changing owing to developments in shipping technology and safety management. The latest investigation on ship accidents shows that more than 80% of them are related to human and organisational factors [7]. Therefore, they have been widely studied [8]. The Human Factor Analysis and Classification System is a comprehensive human error analysis method based on the Reason model and is currently one of the most widely used human factor identification and modelling methods [9]. The Cognitive Reliability Error Analysis Method, a second-generation reliability analysis method, is combined with other quantitative analysis methods to conduct quantitative research on human error probability [10]. Wu et al. [11] reviewed the research methods and technologies of human and organisational factors in a maritime risk analysis and revealed that the development of maritime autonomous surface ships (MASS) has brought new changes and challenges to maritime risk analysis. MASS significantly contributes to reducing the impact of human factors on ship safety through intelligent technology [12], although it may introduce new risks, such as cyberattacks [13]. The developments of advanced technology, management modes, and the perspectives of research problems all changed the composition and formation mechanisms of RIFs. Moreover, because RIFs are dynamic and coupled during pilotage operations, it is necessary to identify risks based on their characteristics.
Ship pilotage operation risk refers to the risk caused by the dynamic characteristics and coupling effects of system RIFs during the ship pilotage process. The focus of maritime risk has gradually changed from regional macro risk to single-ship operational process risk. Therefore, studying ship operational risks under different scenarios has become an important issue [14]. The identification and analysis of RIFs should not only consider specific scenario factors, such as the operating environment, ship characteristics, and human factors, but also the dynamic variability of RIFs. Fan et al. [8] determined the RIFs of the four operational stages of MASS from the perspectives of humans, ships, technology, and the environment to comprehensively analyse the risks during MASS navigation. Chang et al. [12] identified the significant operational risks of MASS using failure mode and effects analysis. Gil et al. [15] obtained the RIFs of the bow crossing distance encountered by different ships under different sailing scenarios based on 10 years of automatic identification system data learning. In addition, with the development of Arctic shipping routes, safety issues during the navigation of ships in Arctic waters have also become a concern. Considering the influence of special environmental factors such as floating ice and low temperatures during navigation, scholars have identified and studied ship accident risks such as ship besetting [16], ship–ice collision [17], ship–ship collision [9], and grounding [18] in Arctic waters. Yu et al. [14] considered dynamic geometric risk factors related to local traffic factors, in addition to static factors such as ship characteristics, to quantitatively analyse the overall risk of a ship during its voyage. Yu et al. [19] identified the RIFs of navigation and the natural environment from the perspective of geometric risk and used a Bayesian network to assess the collision risk of ships and offshore facilities in real scenarios.
With the development of the technology and safety theory, the accident causation theory has undergone different developmental stages [6]. Traditional theoretical models, such as the domino, epidemiological, and Swiss cheese models, imply a linear thinking mode of system structure decomposition and causality [20], making it difficult to explain the dynamic characteristics of complex system factors and the coupling relationships between factors. According to the dynamic adaptability, evolution, and nonlinearity of a complex system, the coupling between RIFs and the emergence of the system should be fully considered to reveal the causes of risk. System analysis methods, such as Accident Map, Systematic Theoretical Accident Model and Process, and Functional Resonance Analysis Method (FRAM), developed in recent years have been widely used in railway transportation, aviation, maritime, and safety management in other fields and are suitable for a risk analysis of complex socio-technical systems [21]. FRAM analyses the RIFs of dynamic systems from the perspective of functional characteristics [22]. As a system analysis method, FRAM has been continuously studied since its creation in 2004 [23] and has been widely used in the risk analysis of complex socio-technical systems in different fields [24], including maritime risk. Patriarca et al. [25] systematically reviewed the state-of-the-art FRAM in terms of methodology, application fields, and potential future research directions. As a typical socio-technical system, FRAM can help identify scenario-based RIFs and their complex coupling relationships during ship operations. Salihoglu and Besæiki [22] used FRAM to conduct a qualitative analysis of the Prestige oil spill accident, effectively identifying the key functions and internal influencing factors of the accident and demonstrating the outstanding advantages of FRAM in a marine accident analysis. The function variability and coupling between functions were examined through the identification and description of the main functions of fishery inspection, and a safe operation path under functional aggregation was explored to improve the safety of artisanal fisheries [26]. However, as a qualitative analysis method, FRAM was inadequate for providing quantitative risk analysis results.
FRAM can be improved by integrating it with other methods to realise a quantitative or semi-quantitative study of system risk. Patriarca et al. [27] proposed a semi-quantitative FRAM analysis framework based on Monte Carlo (MC) simulations and considered the influence of different operating conditions on the safety assessment of air traffic management systems. Kaya et al. [28] combined FRAM with MC simulation and the critical matrix method to model a tram operation system and identified the critical coupling and system risk through semi-quantitative evaluation. Yu et al. [29] developed a data-driven approach that uses high confidence intervals of association rules to quantify functional coupling and identify the causative paths of potentially hazardous scenarios by merging association rules. Consequently, by integrating qualitative analysis of complex system functional mechanisms with complementary quantitative methods [30], FRAM facilitates quantifying functional variability and uncovering the mechanism of risk transmission through analysis of adverse functional resonance.
The remainder of this paper is organised as follows. In Section 2, a probability-based risk resonance analysis framework for ship pilotage operations is proposed by combining the D–S evidence theory and MC simulation with a quantitative improvement of the traditional FRAM, and the scenario and data of studied case are described. In Section 3, the proposed methodology is applied and verified by conducting a resonance analysis of the collision risk during the pilotage operation process of a container ship in Shanghai Port waters. In Section 4, we discuss the proposed method and its application results. Finally, Section 5 concludes the study.

2. Methodology

2.1. Problem Description and Framework

2.1.1. Problem Description of Ship Pilotage Risk Resonance

In the ship pilotage process, various system functions, such as human, technological, and organisational, are variable and coupled with each other according to the operation scenario to jointly complete various operation tasks. In the routine ship pilotage process, the adverse output of related functions, such as personnel negligence, operational errors, and equipment failures, may cause close-quarters situations and even ship accidents. Ship collisions are among the most common types of accidents during ship pilotage processes.
During the ship pilotage process, various system functions interact with each other through coupling. In daily operations, the output variability of upstream functions may have amplifying, damping, or no impact on the output variability of downstream functions, depending on the way of coupling between functions and the characteristics of functions. Adverse variability in functions, such as human operational errors or equipment malfunctions, do not directly lead to accidents, but rather generate functional resonance through coupling between functions. Resonance paths are formed between different functions resonance at the same time, leading to the occurrence of ship pilotage accidents. For ship collision avoidance operations, various operational errors when there is a collision risk is transmitted through functional resonance, ultimately leading to a collision due to the close distance between ships. Therefore, quantitative analysis of the variability and coupling effects between the functions of the ship pilotage system helps to reveal the accident cause mechanism under risk resonance.

2.1.2. A Hybrid Probabilistic Risk Analytical Approach

FRAM model, D–S evidence theory, and MC simulation were collectively used to quantitatively simulate the dynamic characteristics of functional variability and the coupling criticality between functions under different pilotage operation scenarios so as to identify the risk transmission path caused by functional resonance. First, FRAM modeling was used to identify the system functions for collision avoidance task during ship pilotage process, and the potential risk transmission paths in the pilotage system were qualitatively described from the perspective of function coupling. Then, the rating scale and probability distribution were used to quantify the dynamic uncertainty of resonance effects between functions, and the D–S evidence theory was introduced to fuse the evaluation results of probability distributions by different experts. Finally, by using MC multiple cyclic sampling simulation, the variability priority number (VPN) distribution between different functions coupling under specific pilotage scenarios can be obtained. By setting thresholds and confidence levels, critical functional couplings may be identified, and the functional resonance path composed of them can be further analysed. The research framework is shown in Figure 1.
Step 1: Construction of FRAM model. According to the ‘goal-action’ analysis, the task was decomposed into sub-tasks by the hierarchical task analysis method (HTA). Each sub-task was formalized according to its goal and the actions necessary to achieve it, the action acted as a sub-task of its upper level sub-task, that is, a meta-task. The relationship between a sub-task and its upper task depended on the operation plan, procedure, or timing. For the overall task of ship pilotage safety, HTA was used to divide it into two levels of sub-tasks in this paper, the implementation sequence of main sub-tasks was defined at the higher level, and each sub-task at the lower level was to be a group of actions (meta-tasks) [31]. The sub-tasks and meta-tasks were identified as system functions, and the function characteristics were described and analysed based on six aspects: input (I), output (O), precondition (P), control (C), resources (R), and time (T). The FRAM model was constructed to qualitatively analyse the operating mechanism of the pilotage system by combining functional hierarchy and logical association.
Step 2: Quantification of function variability and coupling. First, functional variability in the FRAM model was characterised by the timing and precision of the functional output, and the degree of output variability and coupling effect was expressed by setting relevant rating scales. The aggregated coupling between functions was then defined using the upstream function output variability, upstream–downstream function coupling effect, and operation condition effects. A discrete probability distribution was used to quantify functional dynamic characteristics in terms of timing and precision. The acquisition of the discrete probability distribution mainly relied on domain experts to evaluate based on the historical statistical data of piloted waters and relevant research results. The D–S evidence theory was used to fuse the evaluation results.
Step 3: Acquisition of the ship pilotage scenario data and MC simulations. Based on quantifying the function output variability and upstream–downstream function amplification factors by setting rating scales, the discrete probability distribution and operation condition effect of functions were obtained by considering specific pilotage operation scenario data. According to the quantitative expression of aggregated coupling, an MC multiloop simulation was used to obtain the coupling criticality distribution between the functions in the FRAM model.
Step 4: Function resonance path identification and risk transmission analysis. According to the distribution of the aggregated coupling values between system functions in a specific pilotage operation scenario obtained by MC simulation, the critical couplings in the pilotage operation process could be determined by setting the threshold and confidence level to identify the function resonance path in the ship pilotage system and then analysing the risk transmission process.

2.2. Modelling

2.2.1. FRAM in Ship Pilotage Risk Resonance

Considering the dynamic and nonlinear coupling characteristics of a ship pilotage system, FRAM revealed the causative mechanism of risk transmission from the perspectives of normal system operation and functional resonance [25]. FRAM is based on four basic principles: the equivalence principles of success and failure, approximate adjustment principle, emergence principle, and functional resonance principle. Generally, functions are identified according to the task decomposition or operation step division of the system. The system functions are divided into three types: technological, human, and organisational, and they are described from six aspects: I, O, T, R, P, and C [32]. The variability of the function output is determined by time and precision, and the aggregation of its variability is determined by examining the output variability of the upstream function, the variable influence of the upstream function on the downstream function, and the influence of the operation conditions [33]. FRAM analysis is used to identify the functional resonance effect and risk transmission during ship pilotage operations through qualitative analysis.

2.2.2. Quantitative Analysis Method of Aggregated Coupling

After a qualitative description of the operation mechanism of the ship pilotage system through FRAM modelling, the output variability of the upstream functions, coupling effects of the upstream and downstream functions, and scenario operational conditions were considered. The VPN was used to characterise the criticality of the aggregated coupling between functions. According to the data of a specific pilotage operation scenario, MC simulation was used to calculate the VPN distribution of the coupling between various functions to determine the critical coupling and coupling resonance path between functions. Accordingly, the risk transmission mechanism during the ship pilotage operation process was analysed [27].

Quantification of Function Output Variability

Generally, the variability of function output is characterised based on the two aspects of timing and precision. In terms of timing, the function output is represented as ‘Too early’, ‘Too late’, ‘On time’, and ‘Not at all’, and in terms of precision, it is represented as ‘Precise’, ‘Acceptable’, ‘Imprecise’, and ‘Wrong’. A rating scale may be developed to express the degree of function variability corresponding to different states: the larger the value, the greater the variation in the functional output. Variability of function output in specific pilotage scenarios is dynamically uncertain, a discrete probability distribution may be used to quantify functional dynamic characteristics in terms of timing and precision. Consider an upstream function whose output variability is as shown in Equation (1):
O V j = V j T V j P
where V j T represents the rating value of the upstream function output in terms of timing and V j P represents the rating value of the upstream function output in terms of precision.

Quantification of Coupling Effects between Functions

The upstream function generated a coupling effect by connecting one of the five aspects (I, P, T, P, or R) of the downstream function. Coupling different types of functions produced different effects, such as amplification, damping, or no influence on the variability of the downstream functions. Based on a qualitative analysis of the coupling effects between the functions, a rating scale was developed to quantitatively evaluate the coupling effects between the upstream and downstream functions. According to the output variability of the upstream function and the corresponding amplification factor, the coupling effect of the upstream function j on the downstream function i was determined, as shown in Equation (2):
C V i j = O V j · a i j T · a i j P
where a i j T represents the amplification factor of the coupling effect between the upstream function j and downstream function i in terms of timing, and a i j P represents the amplification factor of the coupling effect between the upstream function j and downstream function  i  in terms of precision, which satisfies the requirements of Equation (3).
a i j T ( a i j P ) > 1   upstream   output   has   an   amplifying   effect   on   the   downstream   function = 1   upstream   output   has   no   effect   on   the   downstream   function   < 1   upstream   output   has   a   damping   effect   on   the   downstream   function  

Quantification the Influence of Operation Scenario

When determining the aggregated coupling effect between functions in a specific ship pilotage process, it was necessary to consider not only the function output variability and the coupling effect of the upstream to downstream functions, but also the influence of the operating conditions of the specific pilotage scenario. For example, the hydrometeorological environment, traffic conditions, supervision and management level, and different combinations of these operation conditions constituted different pilotage operation scenarios. The operating conditions in the scenario were defined through the analysis of specific ship pilotage scenarios, and their performance was defined as scenario performance conditions (SPC), that is, S P C k , k = 1 , , m . Each S P C k had different effects on different functions. The effects of S P C k on the function j in a specific pilotage scenario are expressed as b j k , as shown in Equation (4):
b j k = 1 the   S P C k   has   a   high   impact   on   the   j   function   < 1 the   S P C k   has   a   moderate   impact   on   the   j   function = 0 the   S P C k   has   no   impact   on   the   j   function  
As the different S P C k and their performances differed in different pilotage operation scenario z ( z = 1 , , Z ) , it was assumed that the performance of S P C k in operation scenario z was S P C z k , and the performance of the operation condition S P C z k was represented by setting a rating scale, as shown in Equation (5). Therefore, the comprehensive effect e j z of all operation conditions on function j under the specified pilotage operating scenario z could be expressed as Equation (6). If e j z = 1 , it indicated that the pilotage operation scenario had no amplification effect on j function variability. The value range of e j z is shown in Equation (7):
S P C z k 4   High   variability   effect   of   S P C k 2   Low   variability   effect   of   S P C k   1   No   variability   effect   of   S P C k
e j z = k = 1 m S P C z k · b j k m
e j z = m a x 1 ; k = 1 m S P C z k · b j k m
Considering the output variability of upstream functions, the amplification effect between upstream and downstream functions, and the comprehensive effect of operating conditions in the ship pilotage operation scenario z , the VPN between functions could be expressed as Equation (8). This could be used to evaluate the criticality of coupling between functions to identify critical functions and function resonance paths, that is, risk transmission paths.
V P N i j z = V j T · V j P · a i j T · a i j P · e j z

2.2.3. Monte Carlo Simulation

MC is a method of calculating the mean value of a function of random variables based on the large number theorem and the central limit theorem, which can be a specific mean value of a multidimensional probability density function defined on multiple random variables. The speed of convergence and the magnitude of the error are independent of the complexity of the problem or the dimension of the phase space. This renders them ideal for complex systems [34]. Based on the function coupling quantification method introduced in Section 2.2.2, this study used the MATLAB platform to calculate the VPN among various functions in different ship pilotage operation scenarios using 1000 iterations of MC simulation to analyse the coupling effect between different functions [27].

2.2.4. D–S Evidence Theory

The key step in calculating the VPN value distribution of function coupling in a specific pilotage scenario through MC simulation is to determine the discrete probability distribution of the output V j T and V j P of each function. Subject matter experts (SMEs) evaluated the discrete probability distribution of each function’s output variability according to pilotage operation scenario data, professional knowledge, and benchmark. Considering the differences and uncertainties in expert judgment, the D–S evidence theory was adopted to fuse the evaluation results of different experts [35]. The general implementation steps of the D–S evidence theory are as follows [36].
Step 1: Identification of the recognition framework and evaluation criteria. It was assumed that in a certain functional output p , which had four states, the recognition framework was Θ = p 1 , p 2 , p 3 , p 4 . According to the types of functions and the related research literature, the probability distribution benchmark was determined by experts as the reference of evaluation criteria.
Step 2: Evaluation of probability distribution. m ( p i ) represented the basic probability distribution function of different states of functional output p evaluated by experts, as shown in Equation (9). Probability distribution assessments were made by SMEs based on their professional judgment reference benchmarks.
m ( p i ) 0 , 1 ; p i p m ( p i ) = 1
Step 3: Fusion of evaluation results. The probability distribution results under multiple pieces of evidence and the prior probability distribution of functional output p under data fusion may be obtained using the evidence synthesis rule to fuse the reliability judgements of different experts. This is shown in Equations (10) and (11).
k = 1 p a p b = m 1 ( p a ) · m 2 ( p b )
m 1 m 2 ( p i ) = 1 k p a p b = p i m 1 ( p a ) · m 2 ( p b )
where m 1 ( p a ) and m 2 ( p b ) represent the scores of experts m 1 and m 2 on the same factor state, respectively, and k represents the conflict in expert’s judgment information.
If a total of n experts participate in the survey, the fusion Equation (12) is as follows.
m 1 n = m 1 m 2 m n

2.3. Scenario and Data

This study selected Shanghai Port, one of the busiest ports in the world, as the application area. The case study revealed the critical functions and function couplings of the pilotage system under normal and abnormal operation scenarios through FRAM modelling and quantitative methods to analyse the transmission mechanism of ship collision risk based on functional resonance.

2.3.1. Scenario

The ship pilotage process of a large container ship (over 5000 TEU) sailing from the D6 buoy at the Yangtze estuary’s pilot embarkation point to the D47 buoy near the Waigaoqiao wharf was selected as a case study to apply and validate the established research framework. During the pilotage process, the ship travelled approximately 42 n miles through the Beicao deep-water channel of the Yangtze river estuary, the Yuanyuansha warning area, and the Waigaoqiao channel (Figure 2), which was the common route for large container ships entering and leaving the Waigaoqiao wharf. The pilotage operation task was difficult because of changeable hydrometeorological conditions, high traffic density, complicated ship encounters, and many collision risk factors.
The pilotage process was analysed from the pilot’s perspective to achieve the collision avoidance task of a ship during navigation. According to the historical pilotage process analysis of such ships combined with expert suggestions, task decomposition of the pilotage process was conducted using the HTA method (Figure 3). For the ship collision avoidance task, there were mainly five sub-tasks: ‘Position the ship’, ‘Identify the collision risk’, ‘Take collision avoidance measures’, ‘Adjust the ship position’, and ‘Maintain a safe distance’, which could be further divided into more meta-tasks. Figure 3 shows the composition and logical relationships between the sub-tasks and meta-tasks. The sub-tasks and meta-tasks were identified as 16 system functions, and each function was analysed and described from six aspects, such as I, P, C, R, T, and O. The coupling relationship between the upstream and downstream functions was determined based on the HTA analysis results and the logical relationship between the functions.
The established FRAM model was checked and proofread by SMEs and finally determined after improvement. Considering the transmission research on collision risk during ship pilotage, some functions with strong correlations with collision risk were selected to model the pilotage operation process to determine the critical coupling better and effectively reduce the complexity of the MC simulation calculation. FRAM Model Visualiser software (version 0.4.2) was used to build the FRAM model of the ship pilotage process (Figure 4). The model could further improve the analysis granularity to decompose some functions or increase the description of some functions and the coupling between them.
Many scenario conditions affect the ship collision risk in the pilotage operation process, including the status of operators, the ship’s technical status, the natural environment, and safety management. This study primarily selected four operation conditions, including traffic condition S P C 1 , hydrometeorological condition S P C 2 , pilot status S P C 3 , and ship technical status S P C 4 , by setting the performance of the four operation conditions to compose six pilotage scenarios (Table 1).

2.3.2. Data

Quantification of Variability in Function Output

Referring to the relevant literature [26], a rating scale (Table 2) was used to measure the variability in the timing and precision of the function output. The greater the value in the table, the greater the variability in the functional performance output and the greater the impact on downstream functions. In the ship pilotage operation process, the output variability of each function exhibited a certain randomness in terms of timing and precision. The probability distributions of the output variability for different types of functions differed, whereas the function outputs of similar systems in the same field were similar. Therefore, with reference to the relevant research results in the field of ship transportation [37] and historical data, the general discrete probability distribution table (Table 3) for different types of functional outputs (technical, human or organisational) was determined as the benchmark for the probability evaluation of the functional output. Subsequently, SMEs in the field of ship pilotage evaluated the discrete probability distributions of the functions output variability according to the benchmark and combined them with the description of the operation scenarios. The D–S evidence theory was adopted to fuse the evaluation results of the SMEs to obtain the final probability distributions.

Quantification of Aggregated Coupling

To determine the output variability of each function and its probability distributions in the ship pilotage process, it was necessary to comprehensively consider the output variability of the upstream function, the upstream amplification effect on the downstream function, and the influence of the operation scenarios to quantify the aggregated coupling effect between system functions, and determine the critical function coupling through MC simulation analysis. The transmission of collision risk was analysed using functional resonance path identification after analysing the form in which the system function variability came together and led to an undesirable result.
First, the value range of a i j T and a i j T of the amplification effect for the upstream function on the downstream function was [2, 1, 0.5] in reference to the relevant literature [28], indicating that the upstream function output variability had an amplification effect, no effect, and damping effect on the downstream function, respectively. The specific values of a i j T and a i j T depended on the output results of the upstream function and the coupling mode of the upstream and downstream functions. As the output of the upstream function had a probability distribution, the state with the highest probability was considered as the output result for judgment. Second, the effects of the operation conditions in specific pilotage scenarios were quantified. With reference to the relevant literature [28], the value range of b j k for the effects of pilotage conditions S P C k on the output of function j was set as [1, 0.5, 0], indicating that operation conditions S P C k had a high impact, moderate impact, and no impact on the output variability of function j , respectively.
The value range of S P C k for the four pilotage operation conditions was set as [1, 2, 4], indicating that the operation conditions S P C k had no variability effect, a low variability effect, and a high variability effect in the specific pilotage operation scenario, respectively. The higher the variability effect of the operation conditions, the greater the effect on the relevant functions. In addition, the extent of the effects of the four operation conditions on different system functions was analysed individually using performance analysis of each operation condition, and the value b j k of different operation conditions on each function was determined (Table 4).

3. Results

3.1. Quantification of Function Coupling of Ship Pilotage System

The quantitative analysis method introduced in Section 2.2 was used to calculate the variability of various functions and coupling effects in the FRAM model to identify the critical functions and critical coupling under different pilotage operation scenarios based on a qualitative analysis of the collision avoidance operation in the ship pilotage process. Accordingly, the resonance path and transmission mechanism of the ship collision risk in a ship pilotage operation system were analysed.
Six pilotage scenarios (Table 1) were established by assuming the states of the four operation conditions to conduct risk transmission research during the ship pilotage process. First, the SMEs in Table 5 were invited to evaluate the probability distribution of the output variability of each function in the six pilotage scenarios by referring to the benchmark in Table 3. Subsequently, the D–S evidence theory was adopted to fuse the evaluation results of the five SMEs to obtain the corresponding function output probability distribution. Finally, the value distribution of V P N i j z of the coupling between the functions in the six pilotage operation scenarios was obtained using the MC simulation.
The probability distribution of the output ‘Encounter situation’ of function <Maintain a proper lookout> (F2) in terms of timing was taken as an example to illustrate the application flow of D–S evidence theory in obtaining the probability distribution of function output. First, the output ‘Encounter situation’ of F2 was divided into ‘On time’ (p1), ‘Too early’ (p2), ‘Too late’ (p3), and ‘Not at all’ (p4). Then, as F2 is a human function, the probability distribution benchmark of its output variability in terms of timing was determined as {0.60, 0.15, 0.20, 0.05} according to Table 3. By combining pilotage scenario data and their professional knowledge, five SMEs in Table 5 evaluated the output probability distribution in terms of timing by referring to the benchmark, the results were shown in Table 6. The differences in the evaluation results reflected the diversity in expert experience and cognition. Finally, the coefficient K calculated according to Equation (10) was 3.85 × 10⁻³, and the probability distribution after evidence fusion calculated according to Equations (11) and (12) was shown in the last column of Table 6. The probability distribution of each upstream function output in the FRAM model in terms of timing and precision can be obtained by evaluating and calculating through the method in turn.
According to the relevant data of the coupling between the function <Maintain a proper lookout> and <Ship scenario awareness> in row 1 of Table 7, MC simulation obtained the distribution of values of V P N i j z for coupling ‘F2-F3(I)’ in operation scenarios 1 and 6, as shown in Figure 5.

3.2. Risk Resonance Analysis in Ship Pilotage Process

3.2.1. Determination of Threshold and Identification of Critical Coupling

MC simulation was used to obtain the V P N i j z value distribution of the coupling between various functions in different pilotage scenarios by quantifying the corresponding parameters under different operation conditions of the six pilotage scenarios. To determine the critical coupling between the system functions, it was necessary to determine the threshold. The threshold of V P N i j z was calculated by setting a critical situation, i.e., the output of the upstream function was ‘Too late’ in terms of timing, ‘Acceptable’ in terms of precision, and the upstream function had an amplification effect on the downstream function. In this case, the value V P N i j z calculation that did not consider the influence of the operation conditions was the minimum threshold V P N = 24 (i.e., V j T = 3, V j P = 2, a i j T = 2, a i j P = 2, e j z = 1). The confidence level of V P N i j z value below the threshold in 1000 iterations of the MC simulation was set to 95%. Therefore, when the MC simulation result of the V P N i j z value of a certain function coupling satisfied P ( V P N i j z > V P N ) > 0.05 , the coupling was considered critical.
After analysing the pilotage process of container ship in six operational scenarios in the studied Shanghai Port waterway, the probability distributions of V j T and V j P of each function in the FRAM model were determined, as along with the corresponding a i j T and a i j P values. Then, the e j z values of the six pilotage operation scenarios were analysed and calculated, and the V P N i j z distributions of different functional couplings in the six operation scenarios were obtained through MC simulation. According to the threshold V P N and critical coupling criteria specified above, the cumulative probability P ( V P N i j z > V P N ) of each functional coupling exceeding the threshold was statistically calculated. The results are shown in Figure 6, where the critical coupling and function resonance paths under different operation scenarios can be determined, and the collision risk transmission mechanism during ship pilotage operation process can be analysed accordingly.

3.2.2. Analysis of Collision Risk Resonance during Ship Pilotage Process

The simulation results of ship pilotage operation scenarios 1 and 6 were selected, and their critical couplings were drawn in the FRAM model (red lines in Figure 7 and Figure 8).
A comparative analysis could reveal their interaction, the generation of a resonance path for risk transmission, and the causative mechanism of collision risk during ship pilotage operations. The main conclusions are as follows:
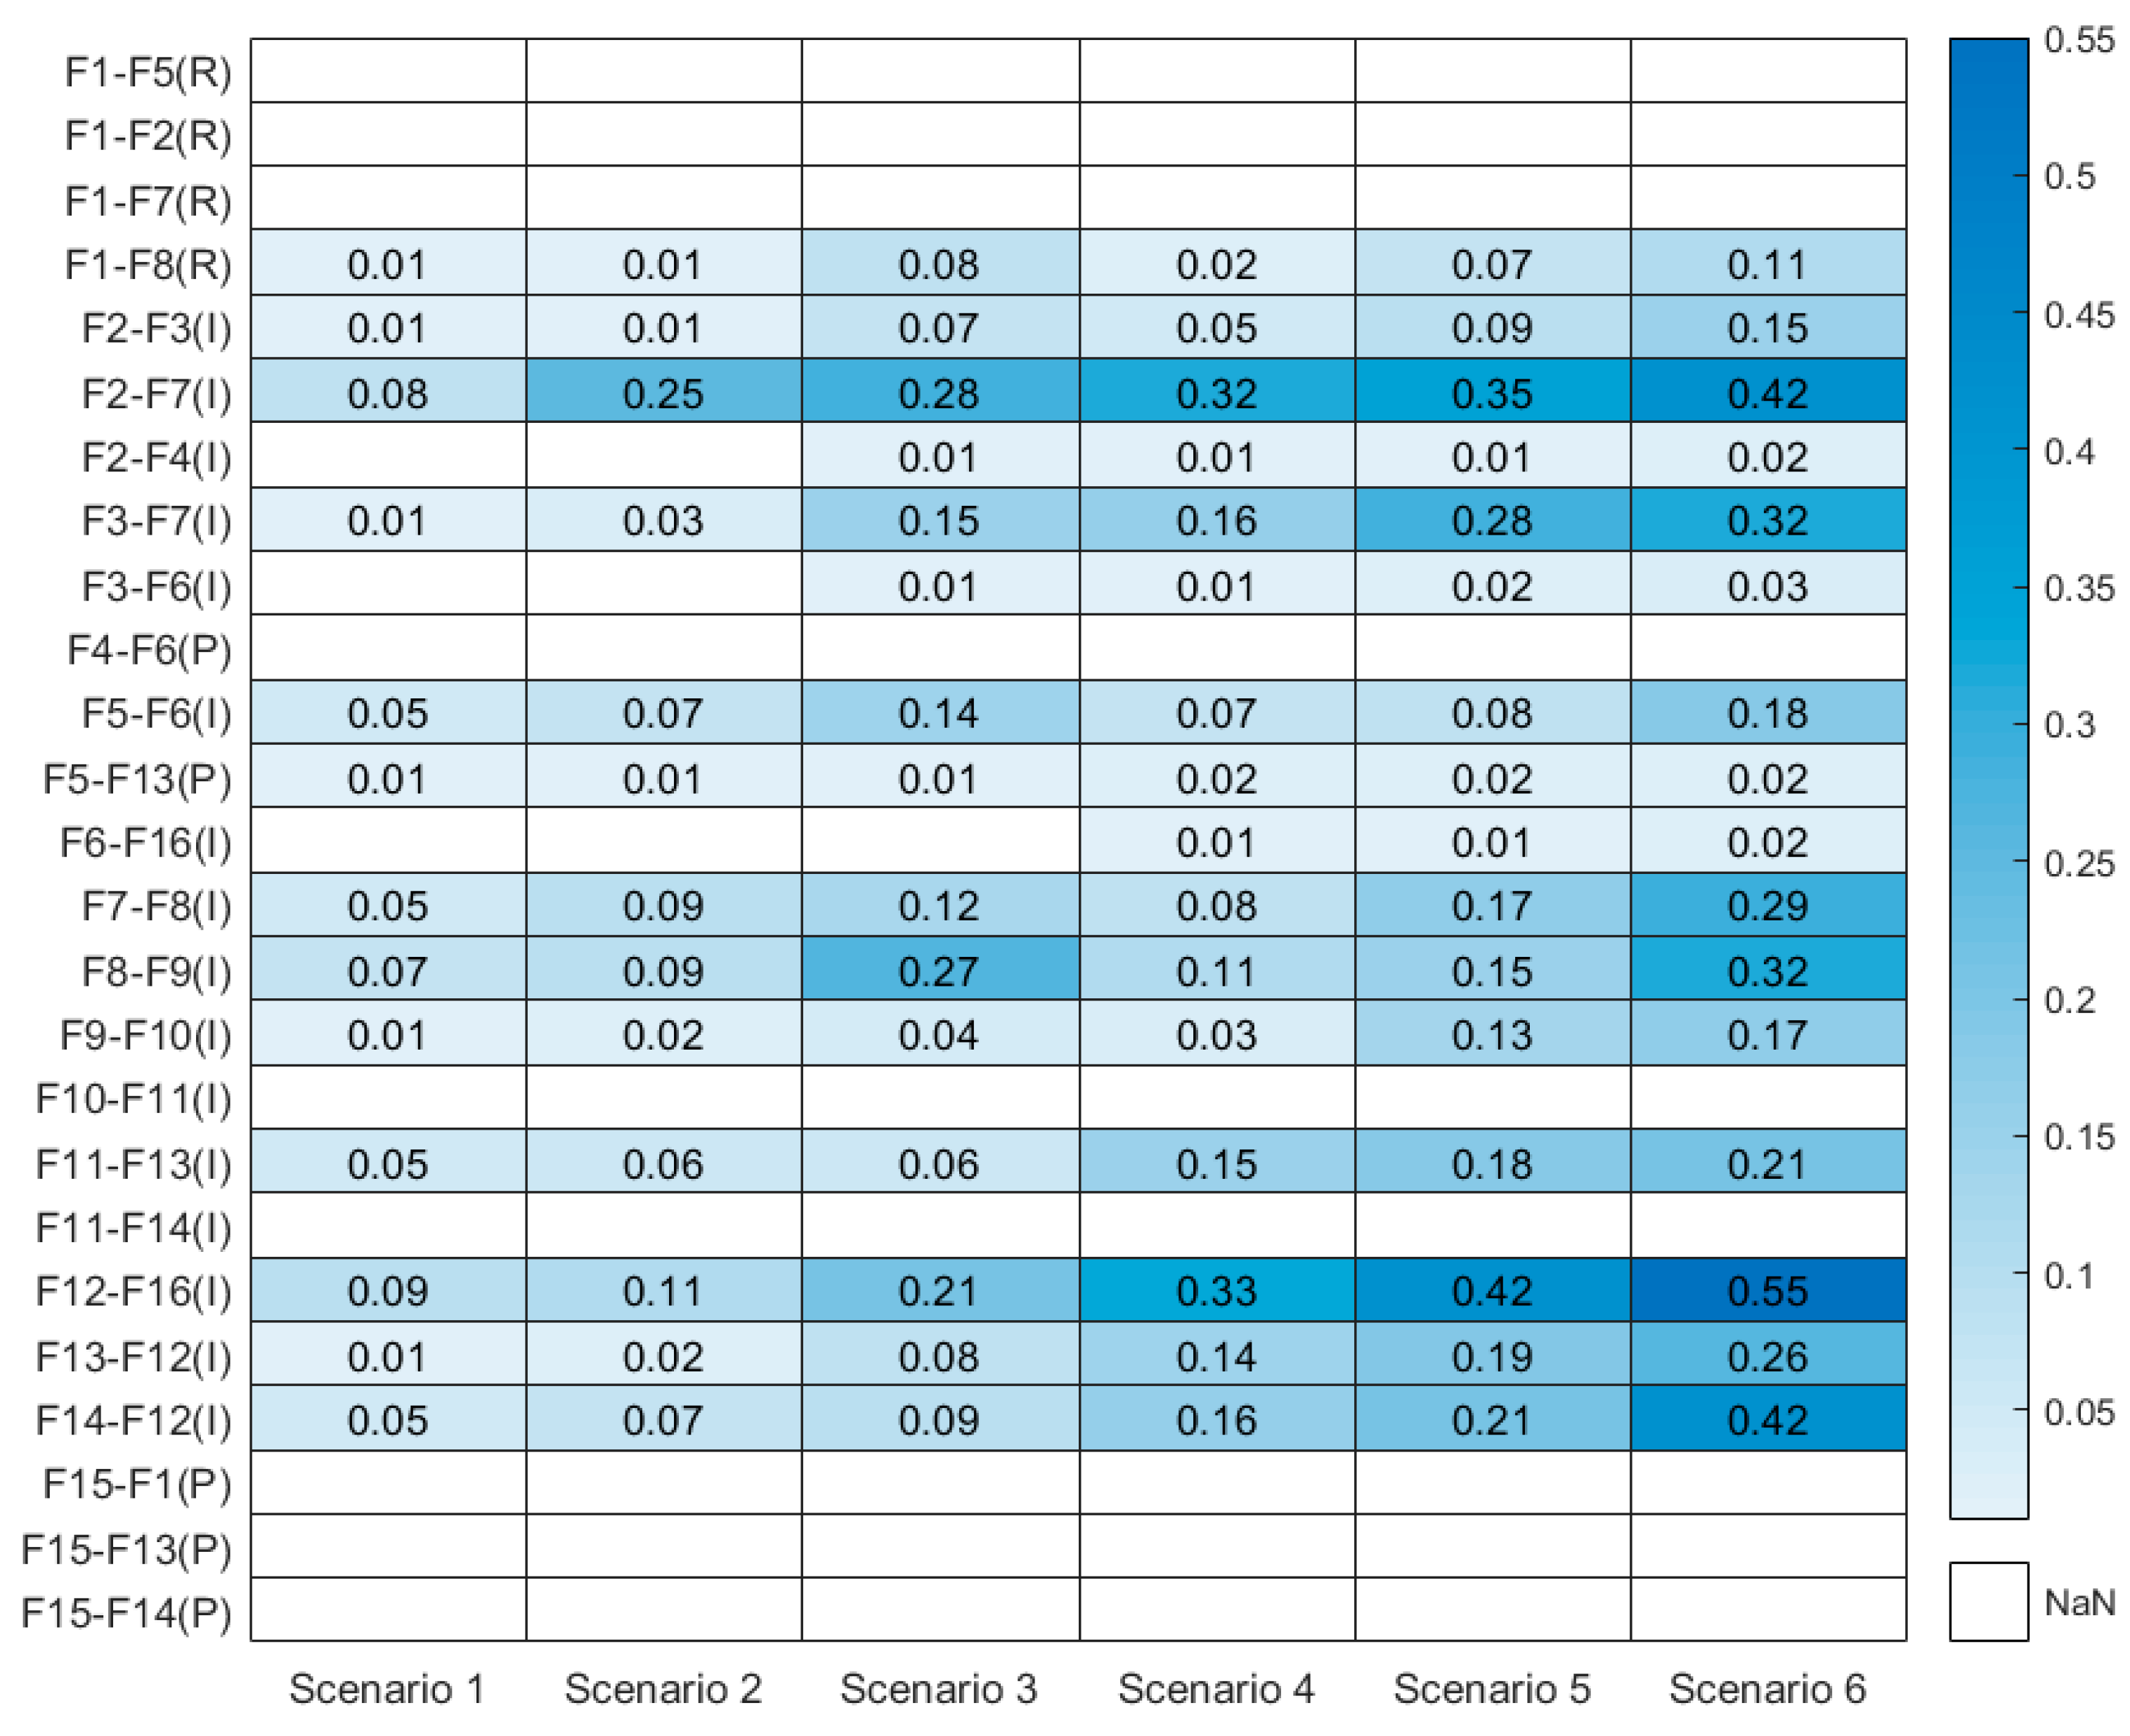
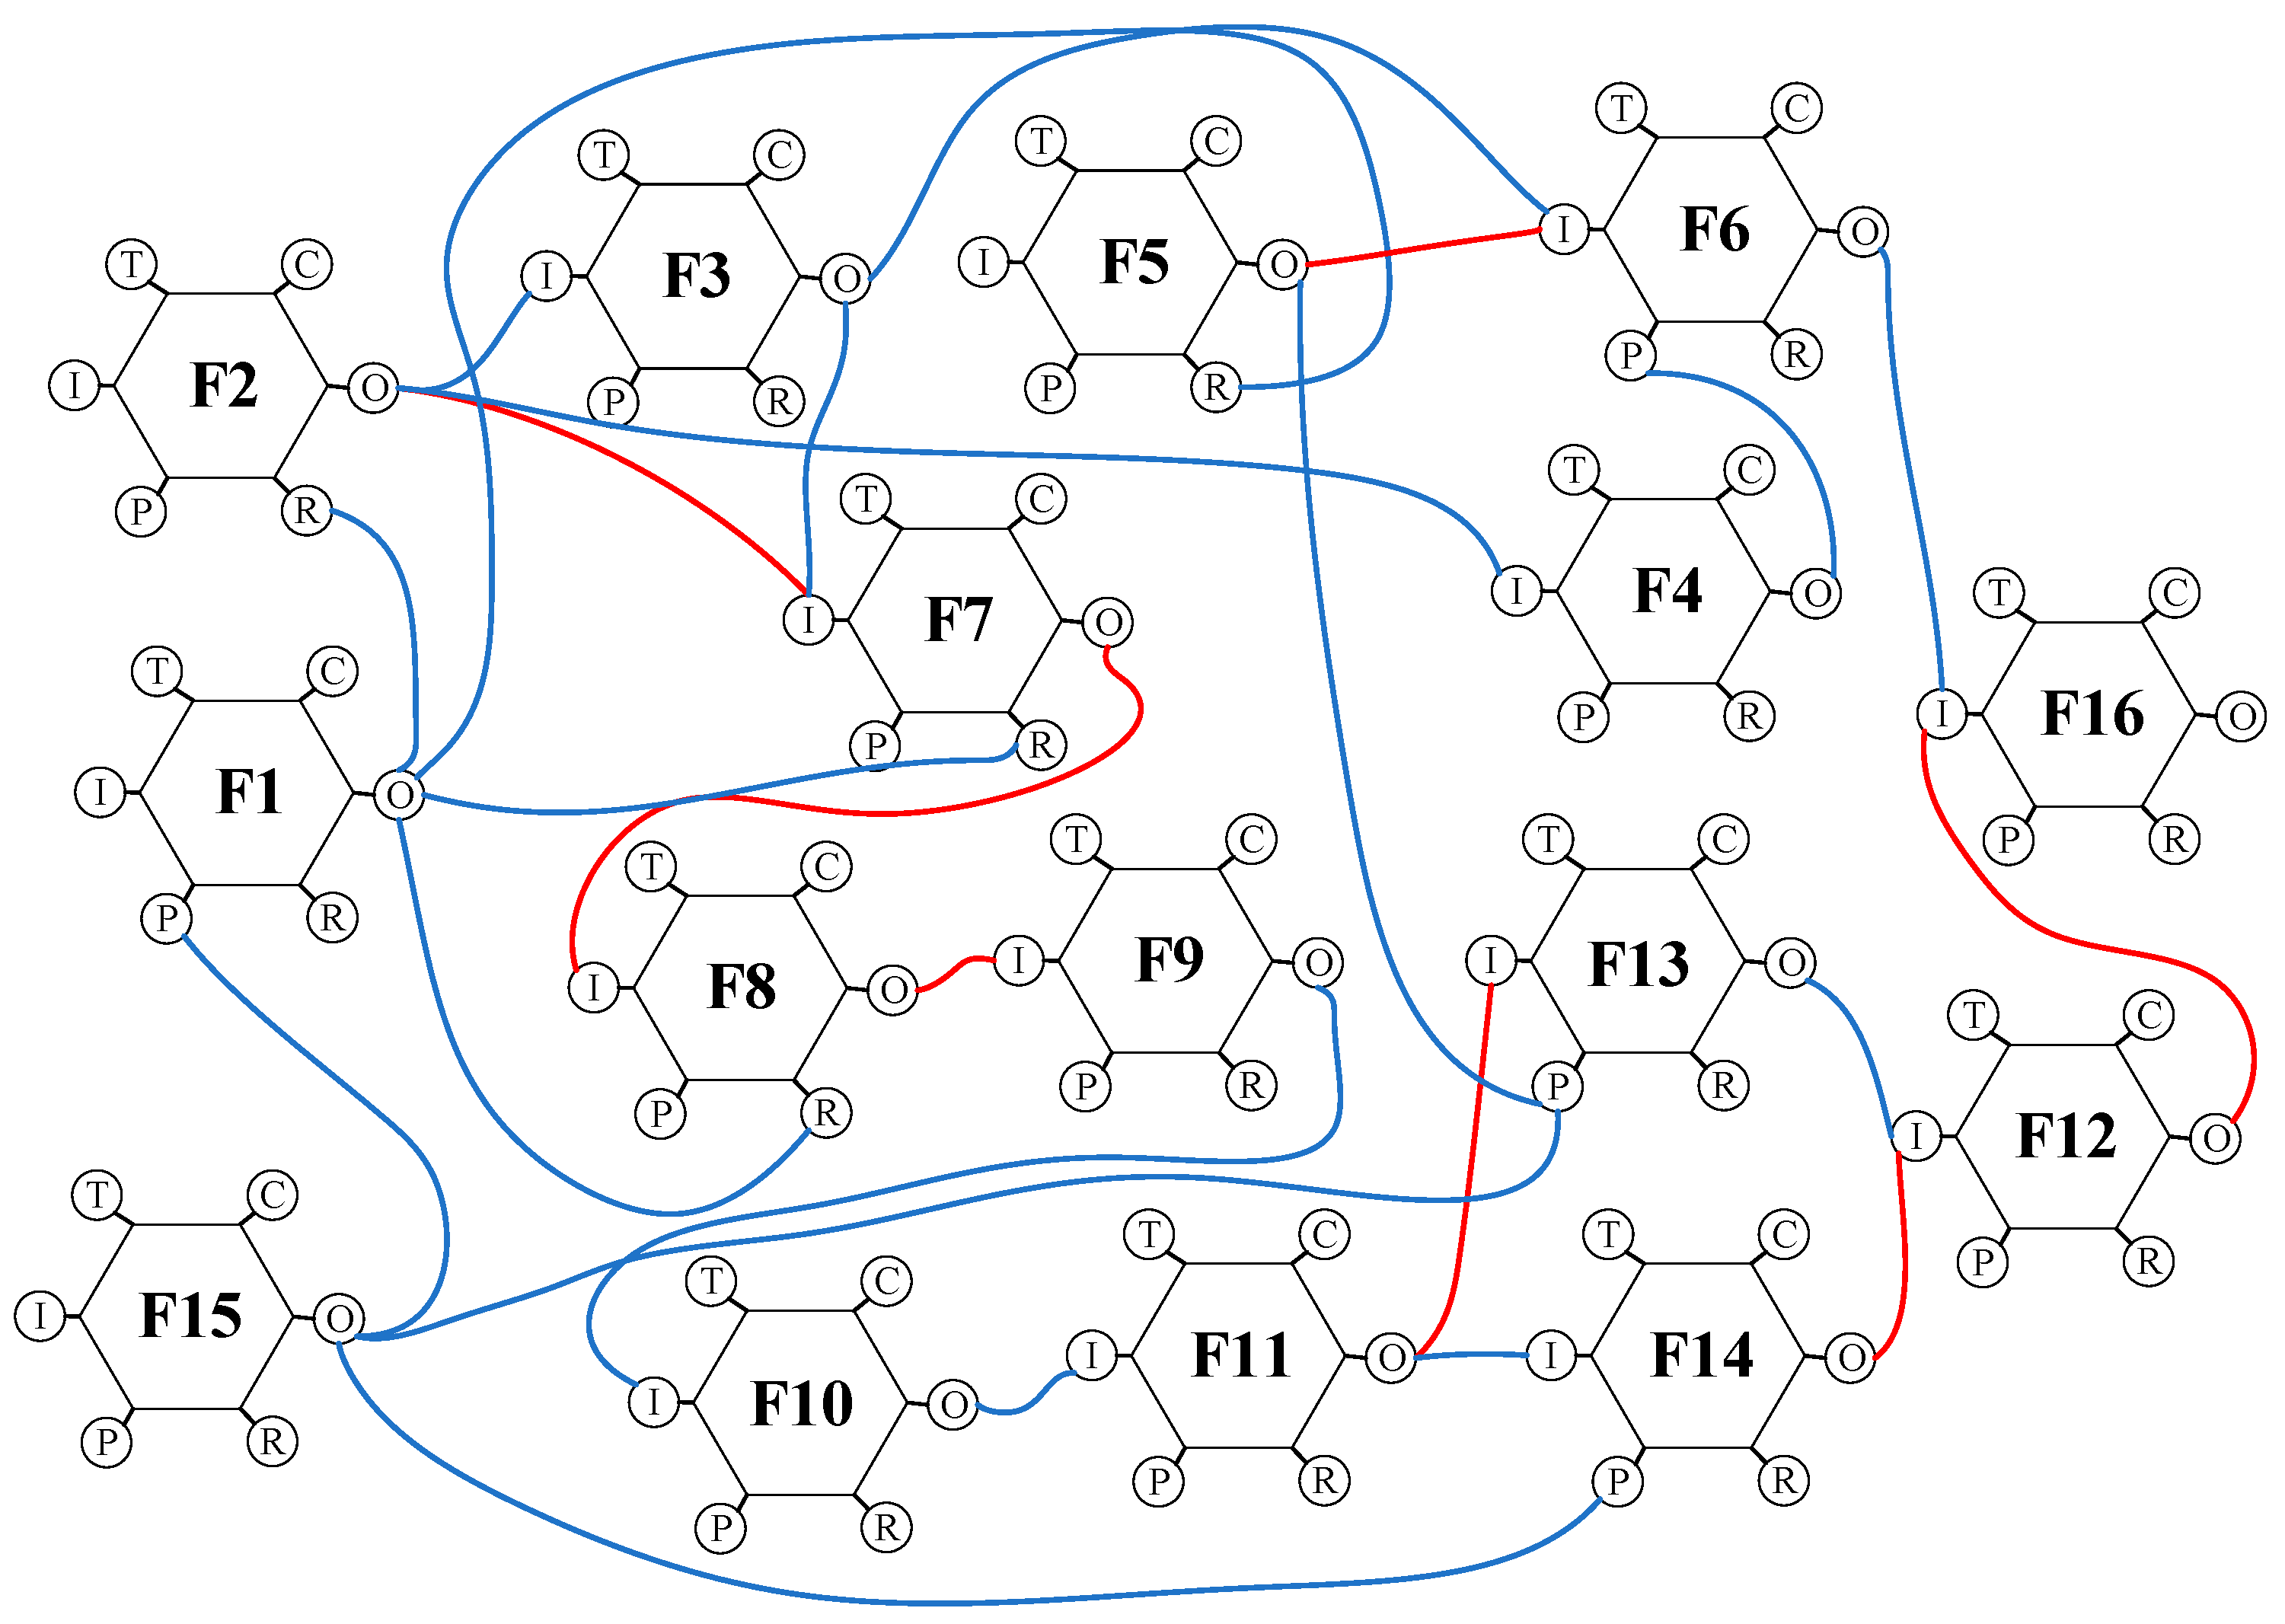
  • There are seven critical couplings of the pilotage operation system in scenario 1 (Figure 7) that are relatively dispersed, indicating that the adverse output of some functions may be damped and weakened in the downstream functions. The probability of a collision accident risk arising from the system function resonance was low. In operation scenario 6, new critical couplings emerged in the pilotage system as the variability of traffic conditions, and pilot status increased. Hence, the number of critical couplings increased to twelve in Figure 8, and a relatively continuous function resonance path appeared, such as ‘F2-F7(I)-F8(I)-F9(I)-F10(I)’. In the pilotage operation scenario 6, the adverse output of the system functions was more likely to be transmitted through the function resonance path, causing system function resonance effects and increasing the risk of accidents.
  • The comparative assessment between scenarios 1 and 6 further demonstrated the role of operation conditions in shaping system risks. The critical coupling ‘F2-F7(I)’ emerged as a consistent factor in both scenarios, emphasizing the significance of maintaining a proper lookout. In scenario 6, where complexities in traffic conditions prevailed, lookout negligence (‘F2-F3(I)’) became a critical coupling, showcasing the direct impact of operational challenges on risk factors. Moreover, the deterioration of the pilot status further reduced the ability to identify collision risk. Therefore, pilot and crews needed to strengthen their cooperation, fair usage of navigational instruments, and maintain a proper lookout during the entire pilotage process to identify collision risks in time [38].
  • Furthermore, the study identified the necessity of combining ‘changing speed’ and ‘changing course’ methods during ship pilotage in narrow waters, as evidenced by the emergence of a new critical coupling (‘F13-F12(I)’) in scenario 6. This result underscored the alignment between MC simulation outcomes and real-world operational conditions, bolstering the method’s effectiveness. In conclusion, the study’s comparative analysis of different scenarios showcased the interplay between operational conditions and system risks, affirming the efficacy of the proposed quantitative FRAM approach. The findings provided valuable insights into collision risk management during ship pilotage operations and laid the groundwork for future studies focused on addressing real-world complexities and temporal risk evaluation.
  • Critical coupling and function resonance paths were identified through a quantitative analysis of the coupling effects for different functions under different operation scenarios to analyse the transmission mechanism of system risks. This method indicated the causative mechanism of system risk from the perspective of the system operation mechanism, emphasising that strong coupling between system functions was the main reason for risk transmission and accidents. The coupling between system functions indicated the amplifying effect of risk transmission and the damping effect. Therefore, the focus of risk management differed from the previous concern about failure factors. However, this was to select appropriate monitoring indicators for the critical coupling and functions of the system, restrain the adverse output of the functions, and improve the ability of functions to address variability. Alternatively, introducing new system functions to manage critical functions could block a function’s resonance path.
  • The operation conditions of a real ship pilotage process changed constantly as the ship moved. The ship pilotage system could be represented as a state vector that changed with time, and the state space of the system was determined by the function output and the coupling effect of the functions. Thus, the variability of the function output and the system risk in the ship pilotage process represented a temporal state transition.

4. Discussion

4.1. Analysis of Risk Resonance in Ship Pilotage Process

Traditional risk identification methods advocate analysing the causes of accidents based on system decomposition and secondary causality, often ignoring the coupling correlation and dynamic characteristics of system factors. However, as a typical complex socio-technical system, the ship pilotage operation risk is nonlinear, uncertain, time-varying, and emerging. The FRAM system analysis method is introduced and based on qualitative functional modelling and a description of the ship pilotage process, with the quantitative representation of functional variability coupling and MC simulation; the resonance path is identified to reveal the causative mechanism of pilotage risk transmission under functional resonance. The case study proves that this method can effectively identify the functional resonance path under different pilotage operation scenarios. A comparative analysis of the identification results of different operation scenarios can reveal the effects of operation conditions on system risk and the transmission path, providing a theoretical basis for accurately controlling pilotage risk under different operation scenarios.

4.2. Analysis of FRAM Quantisation

FRAM is an excellent method for complex system risk causation analysis. However, owing to its qualitative characteristics, it faces problems of heavy workload and considerable uncertainty when analysing the system risk of multiple scenarios. In this study, the system function resonance path and risk transmission in different pilotage operation scenarios were analysed by integrating MC simulation and D–S evidence theory, enriching the quantitative analysis of complex system risk using FRAM and enhancing the ability and effectiveness of FRAM for operational risk analysis. The combination with other quantitative methods should be studied further for the quantitative analysis of FRAM. Therefore, to determine the parameters and obtain the probability distribution of the function output, the fuzzy set theory [37] and N-K theory [39] can be used to deal with the uncertainty of various subjective and objective data.

4.3. Human Factors in Ship Collision Risk

Collision avoidance is a critical task in ship pilotage process. The pilot, as the decision-maker, needs to constantly lookout to find the collision risk, make proper response decisions according to his professional judgment, and issue orders to the crews to finish the collision avoidance operation to ensure the pilotage safety. Therefore, the human factors, such as the pilot’s experience, level, and physical condition, have influence on the identification and judgment of collision risk. In addition, the crew’s cooperation ability will also affect the implementation effect of collision avoidance measures. FRAM modeling was used to explain the influence of human factors on function operation from multiple dimensions, such as input, time, resource, precondition, and control, and qualitatively represent the transmission effect of human factors among system functions through the coupling effect between them.
In addition, in the process of quantifying the FRAM model, the influence of human factors was also fully considered. First, the influence of different states of pilot status (SPC3) on functional variability and coupling effects was fully considered in the setting of six simulated pilotage scenarios. Then, the quantitative process of functional variability and coupling effect also considered the influence of human factors. In particular, experts were required to evaluate the probability distribution of functional variability after analysing the influence of human factors, such as pilot and crews in specific pilotage scenarios. However, this method is based on the assumed states when considering the influence of human factors, which is difficult to characterise the personalized and dynamic characteristics of human factors in a single ship pilotage process. Therefore, in the future, it is necessary to adopt a stochastic process-based modeling method to address the human factor’s state transition characteristics in ship pilotage process and deduce the operational risk evolution characteristics under the dynamic multi-factors coupling.

4.4. The Uncertainty and Limitation Analysis of This Method

Integrating FRAM with MC simulation can reveal the coupling resonance between system functions under different pilotage operation scenarios, analyse the transmission of operational risks through resonance path identification, and effectively address the quantitative analysis of scenario risks. This is an excellent system risk analysis method. However, there are still some uncertainties and limitations [40].
First, establishing the FRAM model and obtaining the probability distribution of the functional output rely mainly on domain-expert knowledge. Although this study invited several experts from different institutions to participate in the evaluation and adopted the D–S evidence theory to reduce the subjective bias of experts, certain uncertainties still exist. Second, to reduce computational complexity, this study only considers six pilotage scenarios composed of four operation conditions to conduct the MC simulation. These operation conditions can be further expanded. However, the increase in operation conditions will lead to an exponential growth in the number of operation scenarios, thus greatly increasing computational complexity. Finally, this quantitative analysis method is only a semi-quantitative analysis method used to identify risk transmission in a hypothetical pilotage operation scenario. The real operation scenario is temporal [35], and it is difficult for this method to address the quantitative problem of dynamic risk in a temporal operation scenario.

5. Conclusions

Ship pilotage processes have a high collision risk owing to the complex and changing water environment and dense navigation traffic [41]. FRAM modelling was used to describe the operation mechanism of a ship pilotage system from the perspective of functional characteristics. The critical couplings between functions under six pilotage operation scenarios were identified using a quantitative MC simulation method to analyse the resonance path generated by the strong coupling between system functions. Thus, the causative mechanism of risk transmission under dynamic variability of the function and nonlinear coupling was revealed. A case study demonstrated that the VPNs of functional couplings vary with ship pilotage operation scenarios. A comparative analysis of the simulation results of scenarios 1 and 6 showed that with the deterioration of operation conditions, new functional resonance paths emerged in the pilotage operation system, and the ship collision risk increased. The transmission path of the collision risk could be identified by analysing the resonance path composed of the critical coupling in a specific operation scenario. The FRAM analysis solved the problem of selecting the monitoring indicators and formulated relevant indicators for the ship pilotage process according to risk transmission identification in specific pilotage operation scenarios to strengthen the pertinence and effectiveness of monitoring. Based on this, control measures were formulated to dampen the adverse output of functions and function resonance.
In this study, a quantitative FRAM analysis method was used to reveal the risk transmission mechanism of hypothetical pilotage operation scenarios. However, there are still limitations in the quantitative risk analysis of the real ship pilotage operation process. In future studies, a quantitative risk evaluation analysis method based on a random process may be proposed based on the nonlinear and dynamic characteristics of pilotage operation systems [42]. Based on real operational data and subjective and objective evidence, the temporal risk in the real ship pilotage process will be analysed to explain the evolutionary characteristics of operational risk. This study provides theoretical support for the engineering management of the ship pilotage process.

Author Contributions

Conceptualization, Y.G. and S.H.; methodology, Y.G. and Y.J.; software, Y.G.; validation, Y.X.; formal analysis, S.H.; investigation, W.L.; data curation, Y.G.; writing—original draft preparation, Y.G. and S.H.; writing—review and editing, Y.J.; visualization, Y.G. and W.L.; supervision, Y.J.; funding acquisition, Y.G. and S.H. All authors have read and agreed to the published version of the manuscript.

Funding

The research is financially supported by the National Natural Science Foundation of China (Grant No. 52272353), and also the Jiangsu Qing Lan Project (2023) and Nantong Science and Technology Plan Project (Grant No. JC22022062).

Institutional Review Board Statement

Not applicable.

Informed Consent Statement

Not applicable.

Data Availability Statement

Not applicable.

Acknowledgments

The authors would like to thank the Shanghai Harbour Pilot Association and Shanghai Maritime Safety Administration for their support in data provision. The authors would also like to thank the subject matter experts for their constructive suggestions.

Conflicts of Interest

The authors declare no conflict of interest.

References

  1. Wang, M.; Wang, H. Exploring the failure mechanism of container port logistics system based on multi-factor coupling. J. Mar. Sci. Eng. 2023, 11, 1067. [Google Scholar] [CrossRef]
  2. Wu, L.; Jia, S.; Wang, S. Pilotage planning in seaports. Eur. J. Oper. Res. 2020, 287, 90–105. [Google Scholar] [CrossRef]
  3. Basnet, S.; Bahootoroody, A.; Chaal, M.; Valdez Banda, O.A.; Lahtinen, J. A decisionmaking framework for selecting an MBSE language—A case study to ship pilotage. Exp. Syst. Appl. 2022, 193, 116451. [Google Scholar] [CrossRef]
  4. Zhang, X.; Chen, W.; Xi, Y.; Hu, S.; Tang, L. Dynamics simulation of the risk coupling effect between maritime pilotage human factors under the HFACS framework. J. Mar. Sci. Eng. 2020, 8, 144. [Google Scholar] [CrossRef]
  5. Zhang, D.; Yan, X.; Yang, Z.; Wall, A.; Wang, J. Incorporation of formal safety assessment and Bayesian network in navigational risk estimation of the Yangtze river. Reliab. Eng. Syst. Saf. 2013, 118, 93–105. [Google Scholar] [CrossRef]
  6. Chen, P.; Huang, Y.; Mou, J.; Gelder, P. Probabilistic risk analysis for ship-ship collision: State-of-the-art. Saf. Sci. 2019, 117, 108–122. [Google Scholar] [CrossRef]
  7. Kujala, P.; Hanninen, M.; Arola, T.; Ylitalo, J. Analysis of the marine traffic safety in the Gulf of Finland. Reliab. Eng. Syst. Saf. 2009, 8, 1349–1357. [Google Scholar] [CrossRef]
  8. Fan, C.; Wróbel, K.; Montewka, J.; Gil, M.; Wan, C.; Zhang, D. A framework to identify factors influencing navigational risk for maritime autonomous surface ships. Ocean Eng. 2020, 202, 107188. [Google Scholar] [CrossRef]
  9. Zhang, M.; Zhang, D.; Goerlandt, F.; Yan, X.; Kujala, P. Use of HFACS and fault tree model for collision risk factors analysis of icebreaker assistance in ice-covered waters. Saf. Sci. 2019, 111, 128–143. [Google Scholar] [CrossRef]
  10. Yang, Z.; Abujaafar, K.M.; Qu, Z.; Wang, J.; Nazir, S.; Wan, C. Use of evidential reasoning for eliciting Bayesian subjective probabilities in human reliability analysis: A maritime case. Ocean Eng. 2019, 186, 106095. [Google Scholar] [CrossRef]
  11. Wu, B.; Yip, T.L.; Yan, X.; Soares, C.G. Review of techniques and challenges of human and organizational factors analysis in maritime transportation. Reliab. Eng. Syst. Saf. 2022, 219, 108249. [Google Scholar] [CrossRef]
  12. Chang, C.H.; Kontovas, C.; Yu, Q.; Yang, Z. Risk assessment of the operations of maritime autonomous surface ships. Reliab. Eng. Syst. Saf. 2021, 207, 107324. [Google Scholar] [CrossRef]
  13. Wang, Y.; Chen, P.; Wu, B.; Wan, C.; Yang, Z. A trustable architecture over blockchain to facilitate maritime administration for MASS systems. Reliab. Eng. Syst. Saf. 2022, 219, 108246. [Google Scholar] [CrossRef]
  14. Yu, Q.; Teixeira, Â.P.; Liu, K.; Rong, H.; Soares, C.G. An integrated dynamic ship risk model based on Bayesian networks and evidential reasoning. Reliab. Eng. Syst. Saf. 2021, 216, 107993. [Google Scholar] [CrossRef]
  15. Gil, M.; Kozioł, P.; Wróbel, K.; Montewka, J. Know your safety indicator–A determination of merchant vessels bow crossing range based on big data analytics. Reliab. Eng. Syst. Saf. 2022, 220, 108311. [Google Scholar] [CrossRef]
  16. Fu, S.; Zhang, D.; Montewka, J.; Yan, X.; Zio, E. Towards a probabilistic model for predicting ship besetting in ice in Arctic waters. Reliab. Eng. Syst. Saf. 2016, 155, 124–136. [Google Scholar] [CrossRef]
  17. Khan, B.; Khan, F.; Veitch, B. A dynamic Bayesian network model for ship-ice collision risk in the Arctic waters. Saf. Sci. 2020, 130, 104858. [Google Scholar] [CrossRef]
  18. Baksh, A.; Abbassi, R.; Garaniya, V.; Khan, F. Marine transportation risk assessment using Bayesian network: Application to Arctic waters. Ocean. Eng. 2018, 159, 422–436. [Google Scholar] [CrossRef]
  19. Yu, Q.; Liu, K.; Yang, Z.; Wang, H.; Yang, Z. Geometrical risk evaluation of the collisions between ships and offshore installations using rule-based Bayesian reasoning. Reliab. Eng. Syst. Saf. 2021, 210, 107474. [Google Scholar] [CrossRef]
  20. Xi, Y.; Yang, Z.; Fang, Q.; Chen, W.; Wang, J. A new hybrid approach to human error probability quantification–applications in maritime operations. Ocean Eng. 2017, 138, 45–54. [Google Scholar] [CrossRef]
  21. Zhang, Y.; Dong, C.; Guo, W.; Dai, J.; Zhao, Z. Systems theoretic accident model and process (STAMP): A literature review. Saf. Sci. 2022, 152, 105596. [Google Scholar] [CrossRef]
  22. Salihoglu, E.; Beşikçi, E. The use of Functional Resonance Analysis Method (FRAM) in a maritime accident: A case study of Prestige. Ocean Eng. 2021, 219, 108223. [Google Scholar] [CrossRef]
  23. Hollnagel, E. Barriers and Accident Prevention; Ashgate Publishing: Aldershot, UK, 2004. [Google Scholar]
  24. De Carvalho, P.V.R. The use of Functional Resonance Analysis Method (FRAM) in a mid-air collision to understand some characteristics of the air traffic management system resilience. Reliab. Eng. Syst. Saf. 2011, 96, 1482–1498. [Google Scholar] [CrossRef]
  25. Patriarca, R.; Di Gravio, G.; Woltjer, R.; Costantino, F.; Praetorius, G.; Ferreira, P.; Hollnagel, E. Framing the FRAM: A literature review on the functional resonance analysis method. Saf. Sci. 2020, 129, 104827. [Google Scholar] [CrossRef]
  26. Saldanha, M.C.W.; Carvalho, R.J.M.; Arcuri, R.; Amorim, A.G.; Vidal, M.C.R.; Carvalho, P.V.R. Understanding and improving safety in artisanal fishing: A safety-II approach in raft fishing. Saf. Sci. 2020, 122, 104522. [Google Scholar] [CrossRef]
  27. Patriarca, R.; Gravio, G.D.; Costantino, F. A Monte Carlo evolution of the Functional Resonance Analysis Method (FRAM) to assess performance variability in complex systems. Saf. Sci. 2017, 91, 49–60. [Google Scholar] [CrossRef]
  28. Kaya, G.K.; Ozturk, F.; Sariguzel, E.E. System-based risk analysis in a tram operating system: Integrating Monte Carlo simulation with the functional resonance analysis method. Reliab. Eng. Syst. Saf. 2021, 215, 107835. [Google Scholar] [CrossRef]
  29. Yu, M.; Erraguntla, M.; Quddus, N.; Kravaris, C. A data-driven approach of quantifying function couplings and identifying paths towards emerging hazards in complex systems. Process Saf. Environ. Prot. 2021, 150, 464–477. [Google Scholar] [CrossRef]
  30. Zinetullina, A.; Yang, M.; Khakzad, N.; Golman, B.; Li, X. Quantitative resilience assessment of chemical process systems using functional resonance analysis method and dynamic Bayesian network. Reliab. Eng. Syst. Saf. 2021, 205, 107232. [Google Scholar] [CrossRef]
  31. Shepherd, A. Hierarchial Task Analysis; CRC Press: Boca Raton, FL, USA, 2003. [Google Scholar]
  32. Hollnagel, E. FRAM: The Functional Resonance Analysis Method Modelling Complex Socio-Technical Systems; Ashgate: Surrey, UK, 2012. [Google Scholar]
  33. Kaya, G.K.; Ovali, H.F.; Ozturk, F. Using the functional resonance analysis method on the drug administration process to assess performance variability. Saf. Sci. 2019, 118, 835–840. [Google Scholar] [CrossRef]
  34. Palluotto, L.; Dumont, N.; Rodrigues, P.; Gicquel, O.; Vicquelin, R. Assessment of randomized Quasi-Monte Carlo method efficiency in radiative heat transfer simulations. J. Quant. Spectrosc. Radiat. Transf. 2019, 236, 106570. [Google Scholar] [CrossRef]
  35. Gong, Y.; Su, X.; Qian, H.; Yang, N. Research on fault diagnosis methods for the reactor coolant system of nuclear power plant based on D-S evidence theory. Ann. Nucl. Energy. 2018, 112, 395–399. [Google Scholar] [CrossRef]
  36. Li, B.; Pang, F.W. An approach of vessel collision risk assessment based on the D-S evidence theory. Ocean Eng. 2013, 74, 16–21. [Google Scholar] [CrossRef]
  37. Fu, S.; Yu, Y.; Chen, J.; Han, B.; Wu, Z. Towards a probabilistic approach for risk analysis of nuclear-powered icebreakers using FMEA and FRAM. Ocean Eng. 2022, 260, 112041. [Google Scholar] [CrossRef]
  38. Guo, Y.; Jin, Y.; Hu, S.; Yang, Z.; Xi, Y.; Han, B. Risk evolution analysis of ship pilotage operation by an integrated model of FRAM and DBN. Reliab. Eng. Syst. Saf. 2023, 229, 108850. [Google Scholar] [CrossRef]
  39. Huang, W.; Yin, D.; Xu, Y.; Zhang, R.; Xu, M. Using N-K Model to quantitatively calculate the variability in Functional Resonance Analysis Method. Reliab. Eng. Syst. Saf. 2022, 217, 108058. [Google Scholar] [CrossRef]
  40. Hirose, T.; Sawaragi, T. Extended FRAM model based on cellular automaton to clarify complexity of socio-technical systems and improve their safety. Saf. Sci. 2020, 123, 104556. [Google Scholar] [CrossRef]
  41. Uddin, M.I.; Awal, Z.I. Systems-theoretic approach to safety of inland passenger ship operation in Bangladesh. Saf. Sci. 2020, 126, 104629. [Google Scholar] [CrossRef]
  42. Guo, X.; Ji, J.; Khan, F.; Ding, L.; Tong, Q. A novel fuzzy dynamic Bayesian network for dynamic risk assessment and uncertainty propagation quantification in uncertainty environment. Saf. Sci. 2021, 141, 105285. [Google Scholar] [CrossRef]
Figure 1. Research framework of ship pilotage risk resonance analysis.
Jmse 11 01705 g001
Figure 2. Illustration of ship pilotage process (D6–D47). The scope of the study is the pilotage process of the ship from the D6 buoy to the D47 buoy, with the blue line indicating the ship’s route. The red and yellow lines in the channel represent ship tracks, and the darker the color, the higher the density of ship traffic.
Jmse 11 01705 g002
Figure 3. HTA analysis of ship pilotage process.
Jmse 11 01705 g003
Figure 4. FRAM model of ship pilotage operations. The hexagons indicate the functions of ship pilotage operation system, and the labels on the lines between the functions indicate their coupling content.
Jmse 11 01705 g004
Figure 5. MC simulation example of VPN distribution (scenario 1,6). The horizontal coordinate indicates the VPN value of the coupling between the function <Maintain a proper lookout> and <Ship scenario awareness>. The vertical coordinate indicates the proportion of the value (display in logarithmic form). Where blue histogram indicates scenarios 1 and yellow histogram indicates scenarios 6.
Jmse 11 01705 g005
Figure 6. Coupling simulation results under six pilotage scenarios. The values of the blue area indicate the probability that the VPN of functional coupling exceed the threshold. The larger the value, the more critical the coupling is. The probability value of coupling greater than 0.05 is identified as the critical coupling.
Jmse 11 01705 g006
Figure 7. Ship collision risk resonance paths in scenario 1. These hexagons, e.g., F1, F2, indicate functions in the ship pilotage operation system. The red lines indicate the critical couplings between functions, the blue lines indicate general couplings.
Jmse 11 01705 g007
Figure 8. Ship collision risk resonance paths in scenario 6. These hexagons, e.g., F1, F2, indicate functions in the ship pilotage operation system. The red lines indicate the critical couplings between functions, the blue lines indicate general couplings.
Jmse 11 01705 g008
Table 1. Setting of operation conditions for ship pilotage scenarios.
Pilotage ScenariosSPC1SPC2SPC3SPC4
Scenario 11211
Scenario 21221
Scenario 31241
Scenario 44211
Scenario 54221
Scenario 64241
Table 2. Variability rating in timing and precision.
AspectsVariabilityValueAspectsVariabilityValue
TimingOn time1PrecisionPrecise1
Too early2Acceptable2
Too late3Imprecise3
Not at all4Wrong4
Table 3. Benchmark for the probability distribution of the function output.
VariabilityTechnicalHumanOrganisational
On time0.80.60.7
Too early0.050.150.1
Too late0.10.20.1
Not at all0.050.050.1
Precise0.850.20.25
Acceptable0.10.50.45
Imprecise0.040.20.25
Wrong0.010.10.05
Table 4. The influence of four operation conditions.
Functions SPC1SPC2SPC3SPC4
Monitor with navigational instruments (F1)000.51
Maintain a proper lookout (F2)10.510
Ship scenario awareness (F3)10.510.5
Determine the ship’s position (F4)010.50
Consider the effect of wind currents (F5)010.50.5
Position the ship (F6)0.5110.5
Identify the collision risk (F7)10.510
Analyse the collision risk (F8)0.5010
Make response decisions (F9)0.50.510
Give control orders (F10)10.50.50
Take collision avoidance measures (F11)010.51
Adjust the ship position (F12)00.501
Control course correctly (F13)00.50.51
Control speed correctly (F14)00.50.51
Keep the equipment in order (F15)000.51
Maintain a safe distance (F16)0.50.510.5
Table 5. Details of the panel of SMEs.
NO InstitutionsEducationAgeExperienceGender
1Maritime Safety AdministrationMaster
degree
35As a Wusong VTS officer of Shanghai MSA, he has 8 years of experience in ship safety supervision in the studied waters.Male
2Pilot stationBachelor
degree
48As a senior pilot at Shanghai pilot station, he has extensive experience piloting large container ships in the studied waters.Male
3Shipping companyBachelor
degree
52As a captain of a large container ship, he steered the ship through the studied waters at least 10 times.Male
4Pilot stationBachelor
degree
46As an officer of Shanghai Pilot Station, he has rich pilotage experience and participated in formulating pilotage operation plans.Male
5Maritime UniversityDoctoral
degree
49As a professor at Maritime University, he has more than 10 years of research experience in ship pilotage safety.Male
Table 6. States probability distribution of ‘Encounter situation’ in terms of timing.
VariabilityBenchmarkSME 1SME 2SME 3SME 4SME 5Fused Probability
On time0.600.50
m 1 p 1
0.30
m 2 p 1
0.65
m 3 p 1
0.25
m 4 p 1
0.10
m 5 p 1
0.63
Too early0.150.05
m 1 p 2
0.25
m 2 p 2
0.15
m 3 p 2
0.35
m 4 p 2
0.55
m 5 p 2
0.09
Too late0.200.30
m 1 p 3
0.35
m 2 p 3
0.15
m 3 p 3
0.25
m 4 p 3
0.20
m 5 p 3
0.27
Not at all0.050.15
m 1 p 4
0.10
m 2 p 4
0.05
m 3 p 4
0.15
m 4 p 4
0.15
m 5 p 4
0.01
Table 7. Examples of function coupling values.
Upstream FunctionsDownstream FunctionsProbability Distribution of Upstream Function OutputAmplifying Factors
SymbolOutputSymbolAspect V j T V j P a i j T a i j P
F2Encounter situationF3InputJmse 11 01705 i001Jmse 11 01705 i00210.5
F1Ship’s movementF7ResourceJmse 11 01705 i003Jmse 11 01705 i0040.50.5
F11Steer by orderF13InputJmse 11 01705 i005Jmse 11 01705 i00611
Disclaimer/Publisher’s Note: The statements, opinions and data contained in all publications are solely those of the individual author(s) and contributor(s) and not of MDPI and/or the editor(s). MDPI and/or the editor(s) disclaim responsibility for any injury to people or property resulting from any ideas, methods, instructions or products referred to in the content.

