Review

Deep Learning-Based Approaches for Oil Spill Detection: A Bibliometric Review of Research Trends and Challenges

by
Rodrigo N. Vasconcelos
1,2,3,*,
André T. Cunha Lima
2,4,5,
Carlos A. D. Lentini
2,4,6,7,
José Garcia V. Miranda
2,
Luís F. F. de Mendonça
6,7,8,
José M. Lopes
2,6,
Mariana M. M. Santana
9,
Elaine C. B. Cambuí
10,
Deorgia T. M. Souza
1,
Diego P. Costa
3,4,
Soltan G. Duverger
3,11 and
Washington S. Franca-Rocha
1
1
State University of Feira de Santana—UEFS, Feira de Santana 44036-900, Bahia, Brazil
2
Department of Earth and Environment Physics, Physics Institute, Campus Ondina, Federal University of Bahia—UFBA, Salvador 40170-280, Bahia, Brazil
3
GEODATIN—Data Intelligence and Geoinformation, Bahia Technological Park Rua Mundo, 121—Trobogy, Salvador 41301-110, Bahia, Brazil
4
Interdisciplinary Center for Energy and Environment (CIEnAm), Federal University of Bahia UFBA, Salvador 40170-115, Bahia, Brazil
5
SENAI-Cimatec, Salvador 41650-010, Bahia, Brazil
6
Geosciences Institute (IGEO/UFBA), Federal University of Bahia—UFBA, Salvador 40170-115, Bahia, Brazil
7
Geosciences Institute (PPGEOF), Federal University of Bahia—UFBA, Salvador 40170-115, Bahia, Brazil
8
Department of Oceanography, Geoscience Institute, Campus Ondina, Federal University of Bahia—UFBA, Salvador 40170-280, Bahia, Brazil
9
Forest Engineering Institute (FEI/UEAP), State University of Amapá—UEAP, Av. Pres. Getúlio Vargas, 650 Centro, Macapá 68900-070, Amapá, Brazil
10
Institute of Biology, Federal University of Bahia—UFBA, Salvador 40170-115, Bahia, Brazil
11
Federal University of Bahia—UFBA, Salvador 40110-100, Bahia, Brazil
*
Author to whom correspondence should be addressed.
J. Mar. Sci. Eng. 2023, 11(7), 1406; https://doi.org/10.3390/jmse11071406
Submission received: 24 May 2023 / Revised: 14 June 2023 / Accepted: 17 June 2023 / Published: 12 July 2023
(This article belongs to the Special Issue Marine Oil Spills 2023)

Abstract

:
Oil spill detection and mapping using deep learning (OSDMDL) is crucial for assessing its impact on coastal and marine ecosystems. A novel approach was employed in this study to evaluate the scientific literature in this field through bibliometric analysis and literature review. The Scopus database was used to evaluate the relevant scientific literature in this field, followed by a bibliometric analysis to extract additional information, such as architecture type, country collaboration, and most cited papers. The findings highlight significant advancements in oil detection at sea, with a strong correlation between technological evolution in detection methods and improved remote sensing data acquisition. Multilayer perceptrons (MLP) emerged as the most prominent neural network architecture in 11 studies, followed by a convolutional neural network (CNN) in 5 studies. U-Net, DeepLabv3+, and fully convolutional network (FCN) were each used in three studies, demonstrating their relative significance too. The analysis provides insights into collaboration, interdisciplinarity, and research methodology and contributes to the development of more effective policies, strategies, and technologies for mitigating the environmental impact of oil spills in OSDMDL.

1. Introduction

Oil spills in the ocean have become one of the most significant environmental issues in modern times [1,2,3,4,5,6]. These spills cause severe damage to ecosystems, biodiversity, and the loss of essential ecosystem processes [7,8]. Furthermore, the impact of oil spills is not limited to the environment, as they can also adversely affect the economy and public health [9,10].
Despite the annual decline in oil spills, catastrophic releases still occur in oil production and transportation [11,12,13]. More recent examples include the incidents related to the Exxon Valdez oil spill in 1989, the Hebei Spirit oil spill in 2007, and the launch of the Deepwater Horizon in 2010.
Ocean oil spills are a serious environmental concern, given the recent increase in environmental disasters, [1,2,14]. Their consequences can be devastating, leading to the degradation of entire ecosystems, loss of biodiversity, and disturbance of critical ecological processes [15,16].
In this sense, remote sensing has become a popular science among researchers, who have increasingly used remote data for oil spill detection and mapping (OSDM) to monitor, survey, and manage its associated risks. Despite the advances, there is still a need to establish a consensus on the most effective methods for OSDM [3,4,5,6,17,18,19]. Therefore, a comprehensive overview of the existing literature in this field is essential to identify the most promising and effective techniques, for example [3,4].
In light of the recent growing occurrence and seriousness of oil spill incidents, there is an urgent requirement to enhance the dependability and precision of methods used in OSDM [3,4,5,6,17,18,19]. Techniques of detection, monitoring, and classifying oil spills in oceans and seas are challenging [3,4], so researchers have introduced machine learning algorithms to solve them.
Numerous machine learning techniques have been used for detecting oil spills. Decision trees [20], support vector machines (SVM) [21,22], random forests [23,24,25], and artificial neural networks (ANN) are the most common techniques described in the literature [26,27,28,29,30].
Among the machine learning techniques, deep learning has recently received more attention [14,30,31,32,33]. In general terms, deep learning is categorized as a subdivision of machine learning methods [34]. Unlike conventional machine learning algorithms that rely on predetermined features, deep learning algorithms gain knowledge directly from the data [31,33,34]. Several advances have recently been made in deep learning architectures for detecting oil spills [2,30,33]. In this sense, describing the current state and trends in the literature field of oil spill detection and mapping with deep learning is essential to consolidate practical analytical techniques and approaches to identify and monitor it and deepen the knowledge and maturation of this scientific field [6,14,30].
Bibliometrics is an influential tool researchers use to gain insights into global trends and developments within a specific topic [35,36]. This method involves applying mathematical and statistical tools to analyze the published literature across various academic disciplines identifying trends and patterns, and the impact of research efforts by individuals, research groups, institutions, countries, and journals [1,37,38,39,40]. Moreover, bibliometric reviews can help researchers to identify key contributors to a field of research and determine which research areas may require more attention or investment [36,41,42], which can help funding initiatives, collaboration strategies, and policy decisions [1,37,38].
This study helps to fill the knowledge gaps and identify the current state and trends in the scientific literature of oil spill detection and mapping with deep learning (OSDMDL) using bibliometric analysis. Several questions are addressed, including the most significant country contributions, publication trends, leading researchers, and influential journals. Overall, it provides a comprehensive overview of the scientific research on OSDMDL, identifying possible avenues for further research.
The manuscript is structured as follows. Section 2 provides a detailed description of the materials and methods employed in the study. It includes information about the search strategies and conducted analysis. Section 3 presents the results related to the publishing trends of oil spill detection and mapping (OSDMDL), including co-occurrence networks, top-cited authors, countries, and journals. Section 4 discusses the findings and their implications. Finally, the manuscript concludes with the concluding remarks section, which summarizes the key points and highlights the significance of the study’s outcomes.

2. Materials and Methods

The proposed research framework is structured into two main steps, from database selection to graphical analysis, as described in Table 1, and is illustrated in the flowchart diagram (Figure 1).
We employed a comprehensive methodological approach that incorporates the fundamental principles of traditional bibliometric analyses, utilizing both qualitative and quantitative descriptors. We integrated various analytical tools to provide a more comprehensive understanding of our target topic. Additionally, we sequentially scrutinized our findings by analyzing the co-occurrence network to comprehend better the patterns associated with implementing remote sensing technology and its advancements in OSDMDL.

2.1. Bibliographic Base

For our research, we have used the Scopus database, which Elsevier established in November 2004. It is a vast bibliographic resource covering various scientific literature from various fields [43]. The database includes citation analysis data from 1996, providing a comprehensive overview of the world’s research products. The Scopus database currently contains over 53 million published references from more than 24,000 scientific journals [43]. The web-based system of the Scopus database offers a range of tools that enable efficient and objective searching of the literature in specific fields using basic and advanced search queries [43]. These features facilitate rapid and consistent information acquisition, offering a detailed and comprehensive view of scientific fields [43]. Given the characteristics of the Scopus database, we have selected it as the primary literature source for our study (refer to Figure 1). By utilizing this valuable resource, we anticipate obtaining a more thorough understanding of our research subject.
A search query was then formulated to include relevant keywords, phrases, and Boolean operators to obtain the most accurate and precise results. As an initial search strategy, we used the following search query “TITLE-ABS-KEY ((“Oil Spill detection” OR “Oil Spill mapping”) AND (“Neural network” OR “Deep neural network” OR “Convolutional neural network” OR “CNN” OR “deep belief network” OR “DBN” OR “recurrent neural network” OR “RNN” OR “conditional generative adversarial networks” OR “CGANs” OR “semantic segmentation model” OR” fully convolutional networks” OR “FCNs” OR “Feature Merge Networks” OR “FMNet” OR “U-Shaped Network” OR “U-Net” OR “deep convolutional neural networks” OR “DCNNs” OR “conditional adversarial network” OR “MCAN” OR “Conditional Generative Adversarial Network” OR “CGAN”))”.
The screening was performed manually, examining all titles and abstracts. When there was uncertainty about a paper’s relevance to our evaluation of the OSDMDP field, we thoroughly read the paper. Irrelevant papers, such as gray literature and review papers, were all excluded. We also excluded conference proceedings, book chapters, and books to ensure we obtained a more focused subset of OSDMDP-related papers published up to 2022. By doing so, we avoided any redundancy that may have arisen from the same content being published multiple times in different literary productions. The subsequent step was to analyze the most frequently cited papers to identify the most authoritative sources [43].

2.2. Data Analysis

This study utilized the Bibliometrix package [40] and VOSviewer 1.6.17 [44,45,46,47] software to conduct quantitative and statistical publications analyses and generate a co-occurrence network of terms, respectively.
Bibliometrix is a statistical programming tool for analyzing scientometrics and bibliometrics data [48]. At the same time, VOSviewer is a specifically designed tool for bibliometric analysis used to create visualization maps of various aspects related to scientific publications, including scientific journals, researchers, research organizations, countries, keywords, and abstracts [44,45,46,47].
To create co-occurrence networks of words and terms, we incorporated all the information in the articles’ titles, abstracts, and keywords. We selected the “map based on text data” option in VOSviewer 1.6.17 [44,45,46,47] and used bibliographic database files to accomplish this. We employed a binary counting algorithm to count all occurrences of words and terms and then constructed a thesaurus file to avoid semantic errors resulting from a redundancy of meanings (see Table S3 in Supplementary Materials for more details).
To obtain the complete information for constructing the co-occurrence network, we used a threshold value of one associated with the minimum number of occurrences of terms and words. The complete set of terms and words was used to build the network [44,45,46,47].
To analyze author production, scientific production in different countries, collaborations between countries, trends over time, author production over time, most cited articles, and the number of publications based on the impact of the source, we utilized the Bibliometrix library [48].
Subsequently, we performed a second division of the literary data, selecting the most cited articles. This selection represented approximately 50% of the total number of selected articles. We extracted various attributes from each article, including data image, digital image processing, temporal data image usage, spatial data resolution, study site, primary objective, study topic, spectral index, total citation, percentage of total citation, and total citation per year.
All analytical figures and analyses were conducted on R version 4.0.4 [49,50], using the Rstudio IDE, version 1.4.1106 [51], along with the ggplot2 version 3.3.5 [52] and Bibliometrix—version 3.1.4. libraries [48]. Table S3 contains a tabulated summary of the parameters employed in constructing the co-occurrence network, countries’ collaboration world map, and thesaurus file.

3. Results

3.1. Publishing Trends

After refining the database and carefully reviewing the literature, we identified 70 published documents using the OSDMDL methodology (see Table 2, Figure 2, and Table S1 for more details). Regarding publication trends, the production of OSDMDL-related articles has shown some inconsistency over the years. Specifically, the mean and standard deviation are ~2.6 ± 3.8 papers/year.
Although the subject of machine learning has grown lately, it involves a robust and complex methodology, which restricts the number of researchers using it. Understanding all the deep learning process steps requires good scientific and programming skills to apply these methodologies. It is the reason for the low number of manuscripts published annually. Soon, with all the last decade’s technological advances, we see the number of publications in this area grow. Visually we can see 5 distinct production peaks in 2013, 2016, 2018, 2020, and 2022 (Figure 2). The highest productivity levels were observed in 2022, with 18 published papers, and in 2020, with 7 published papers, respectively.
The occurrence of oil spill events requires new research, and the consequent development of new detection and monitoring techniques. Therefore, manuscript production peaks usually follow major oil spill events in the last decade. These years’ publications represent 35.7% of the total articles published in the OSDMDL scientific field. In contrast, the production of articles between 1996 and 2012 only accounts for 14% of the published papers. However, we have noted a steady increase in cumulative publications in later years, particularly since 2013, as seen in Figure 2. These findings suggest that the OSDMDL scientific field has gained increasing popularity recently and remains a focal point for researchers. The use of machine learning and deep learning in complex data classification and decision-making in many academic areas has enabled the development of new algorithms capable of mathematically optimizing spatial data pattern detection and recognition systems [53].
The decade with the highest number of publications related to the OSDMDL methodology was the 2010s, with 33 papers published (Table 2). It corresponds to 47.1% of the published documents and has an average of 3.3 ± 1.8 standard deviation (SD). This process was strongly linked to the Deepwater Horizon oil spill case, owned and operated by Transocean, located in the Macondo basin (Mississippi Canyon) in the Mexican Gulf. It spilled more than 5 million oil barrels into the ocean. Naturally, due to the large scale of this spill, there was a significant increase in detection and monitoring studies at the time. Following the 2010s, 2020–2022 had 31 papers published, representing 44.3% of the total published documents with a mean of 10.3 ± 6.6 SD. We also found only 5 papers published during the 2000s, representing 7.1% of the publications with a mean of 0.5 ± 0.7 SD. Similarly, only 1 paper was published in the 1990s, representing 1.4% of the total published documents with a mean of 0.2 ± 0.5 SD. We believe that low technology has made applying such complex techniques through limited computer systems difficult.
Table 2 presents the trend statistics associated with production between 1996 and 2022. In terms of statistics related to the growth rate of the number of published papers, it is noted that, except for the period from 1996–1999 with a zero-growth rate, all other periods showed an increase, with 2020–2022 standing out with a growth rate of 60.36% (Table 2).
When analyzing the number of authors per decade, another pattern emerges, such as the increase in paper production, with a more significant number of authors in more recent decades. Specifically, the decades 2010–2019 and 2020–2022 had the highest numbers of authors, with 107 and 120, respectively.
Upon evaluating the co-authors per papers metric, it was possible to verify that the period from 2020–2022 had the highest values, with a score of 4.58. It was followed by the 2000–2009 decade, with a score of 3.8, then by the 2010–2019 period, with a score of 3.7, and finally, 1996–1999, with a score of 1 (Table 2). A higher value indicates a higher degree of collaboration between researchers during that period, with 2020–2022 having the highest degree of collaboration. It is worth noting that this metric only considers the paper’s quality or impact. However, it can be used as an indicator of collaboration and interdisciplinarity within a research field (Table 2).
Additionally, there was a noticeable increase in international collaboration, with the highest percentage of co-authorships (12.12%) found in 2000–2019 (Table 2). Interestingly, the 2020–2022 decade shows a similar percentage of co-authorships to the previous decade, with 12.9% (Table 2).
The co-occurrence network depicted in Figure 3 revealed various themes and research methods employed by authors in the OSDMDL literature. A total of 1423 items were identified from the network from 1996–2022. The top 5 most frequent unigrams were “Spill” (48 occurrences), “SAR” (35), “detection” (24), “Accuracy” (24), and “experiment” (14) (Figure 3). The term “accuracy” appears prominently as it involves training metrics and analysis of the results applied to neural networks. Accuracy represents the ability of the trained neural net to identify the targets precisely. Therefore, the authors need to know the effectiveness of the applied methodology.
The co-occurrence network was represented in 35 clusters during this period. The top 10 most frequent unigrams formed clusters that accounted for approximately 42.23% of the network. The 10 clusters with the highest number of items (Figure 3) were colored red (76), green (69), dark blue (64), khaki (62), purple (59), light blue (59), orange (56), brown (54), magenta (53), and pink (49).
Based on their representativeness, let us look at each of the ten main clusters dealing with various OSDMDL-related issues:
Cluster 1: This cluster primarily focuses on neural networks, network approaches, experimental results, dark spot detection, and dark formation detection. Researchers in this cluster use various neural network models to detect and classify oil spills.
Cluster 2: The second cluster revolves around oil spill detection, network methods, recall metrics, overall accuracy, and environmental factors. Researchers in this cluster develop and evaluate different network methods for detecting oil spills, considering environmental factors that affect oil spill detection accuracy.
Cluster 3: This cluster is focused on synthetic aperture radar (SAR), accuracy, marine oil spill detection, convolutional neural networks (CNN), and marine oil pollution. Researchers in this cluster work on developing and improving SAR-based methods for detecting marine oil spills, using CNN models and other techniques to enhance accuracy.
Cluster 4: This one deals with artificial neural networks, oil spill accidents, ocean waves, sunglint effects, and optical images. Researchers in this cluster explore the use of artificial neural networks for detecting oil spills, considering various factors that affect detection accuracy, such as ocean waves and sunglint effects.
Cluster 5: The fifth cluster focuses on image data, classification, remote sensing analysis, time series images, and image segmentation. Researchers in this cluster develop and evaluate image-based methods for detecting and classifying oil spills using various data analysis techniques.
Cluster 6: This cluster centers around pixel value, network development, polarimetric features, remote sensing, and Terrasar X images. Researchers in this cluster use polarimetric features of Terrasar X images and other remote sensing data to develop and optimize network-based approaches for detecting oil spills.
Cluster 7: It deals with performance measures, sea surface, biogenic slick, polarimetric synthetic aperture radar images, and original SAR images. Researchers in this cluster develop and evaluate performance measures for detecting oil spills, taking into account various factors that affect detection accuracy, such as biogenic slicks and polarimetric SAR images.
Cluster 8: This one focuses on data processing, improved fully convolutional network (FCN), satellite images, discrimination, and oil spill events. Researchers in this cluster use FCN-based methods for processing satellite images and detecting oil spills, considering factors that affect discrimination accuracy.
Cluster 9: This cluster revolves around satellite data, wind conditions, film thickness, optimal classifier, and field observation. Researchers in this cluster develop and evaluate various methods for detecting and classifying oil spills using satellite data, considering factors that affect detection accuracy, such as wind conditions and oil film thickness.
Cluster 10: The final cluster centers around support vector machines (SVM), stage, target type, network process, and optimum network. Researchers in this cluster explore SVM-based methods for detecting and classifying oil spills at different stages, dealing with different types of targets, and optimizing network processes for better detection accuracy.
Figure 4 shows how oil detection technologies have developed. Interestingly, the bigram frequency terms tend to occur after 2015, with a notable increase between 2018 and 2022. We can observe that, in previous years, there was a predominance of remote sensing data for spatial analysis techniques, especially SAR data. In the last 5 years, with the computational advance and the possibility of CNN analysis in parallel systems and GPUs (graphics processing units), detection studies in neural networks and multilayer textural analysis development have grown significantly.
However, it is worth mentioning that some bigram terms, such as “dark formation”, deserve special attention despite not having a high frequency in a particular year. It is because “dark formation” has been consistently present since 2008, indicating its significance in the broader context of the subject matter. As the identification of oil spills in SAR images is based on “dark formation”, despite the evolution of identification and monitoring techniques, we continue to use specular reflectance in SAR data as the main methodology to identify these targets.

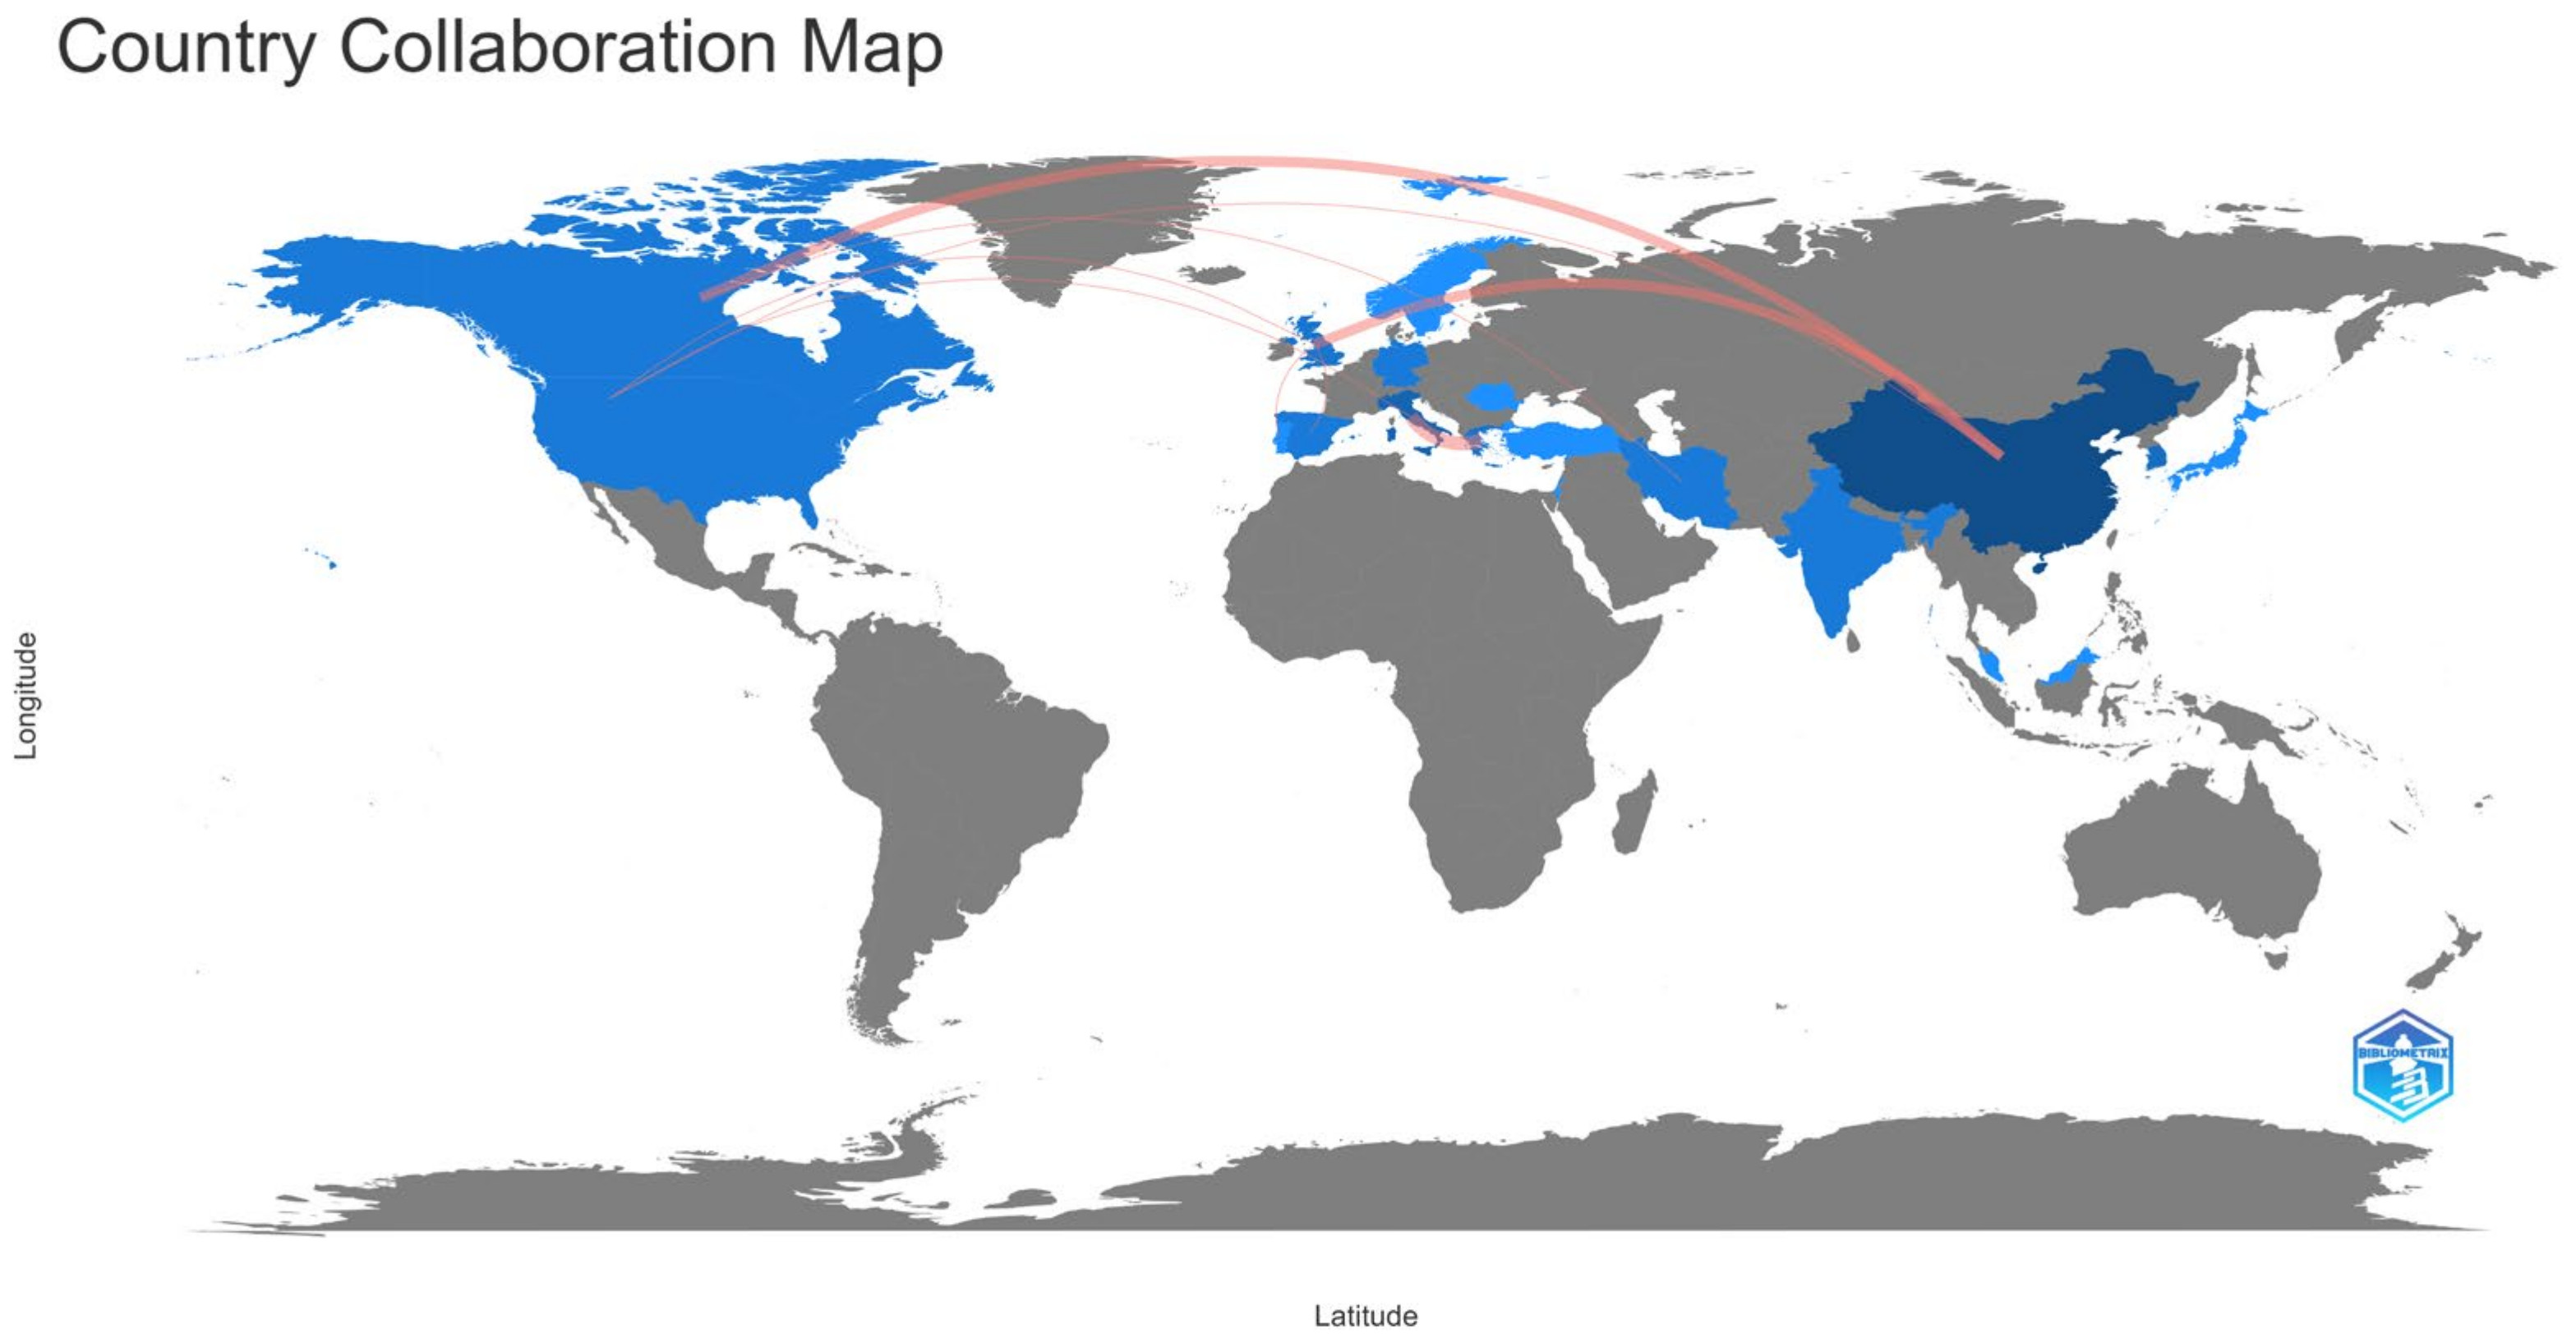
3.2. Country Contribution

In the scientific field of OSDMDL, China emerged as the leading contributor among the top 10 countries, with a substantial share of 23.1% (33) of the total scientific production. Italy secured the second spot with 7% (10), followed by South Korea at 4.2% (6). The United Kingdom and the United States shared the fourth position, each with a 3.5% (5) contribution. Germany and Greece both recorded a 2.8% (4) contribution, while Canada, India, and Iran each contributed 2.1% (3) to the field (Figure 5).
It is important to note that scientific production is a crucial indicator of a country’s research output and contribution to the global knowledge base. The fact that China is leading the way in OSDMDL research suggests that the country is investing significantly in this field and has the necessary resources and expertise to produce high-quality research. Similarly, the presence of Italy, South Korea, the United Kingdom, the United States, Germany, Greece, Canada, India, and Iran in the top ten countries indicates their active involvement and interest in advancing research in OSDMDL.
Figure 5 depicts the flow and intensity of collaboration between countries based on author and institutional collaborations. The width of the edges in the figure indicates the strength of the links between countries. It provides valuable insights into the nature and extent of collaborative efforts in the OSDMDL research field, highlighting countries actively engaged in joint research and knowledge exchange.
Upon assessing the collaborative efforts among nations, it is noteworthy that the United Kingdom (UK) and China have displayed significant involvement, with a contribution of 19.23% (5) each, accounting for 38.46% of the total collaborations. On the other hand, Italy has exhibited a substantial level of engagement, representing 15.38% (4) of the collaborative activities. Canada, the United States of America (USA), and Greece have each displayed a comparable level of involvement, contributing to 11.54% (3). In contrast, Portugal, Spain, and Iran have shown a relatively lower level of collaborative activities, contributing to one-third of it each (1).
It is worth noting that the present study undertook an individualized evaluation of the collaborative efforts among nations, thus highlighting the degree of their involvement while also considering any collaboration among them.

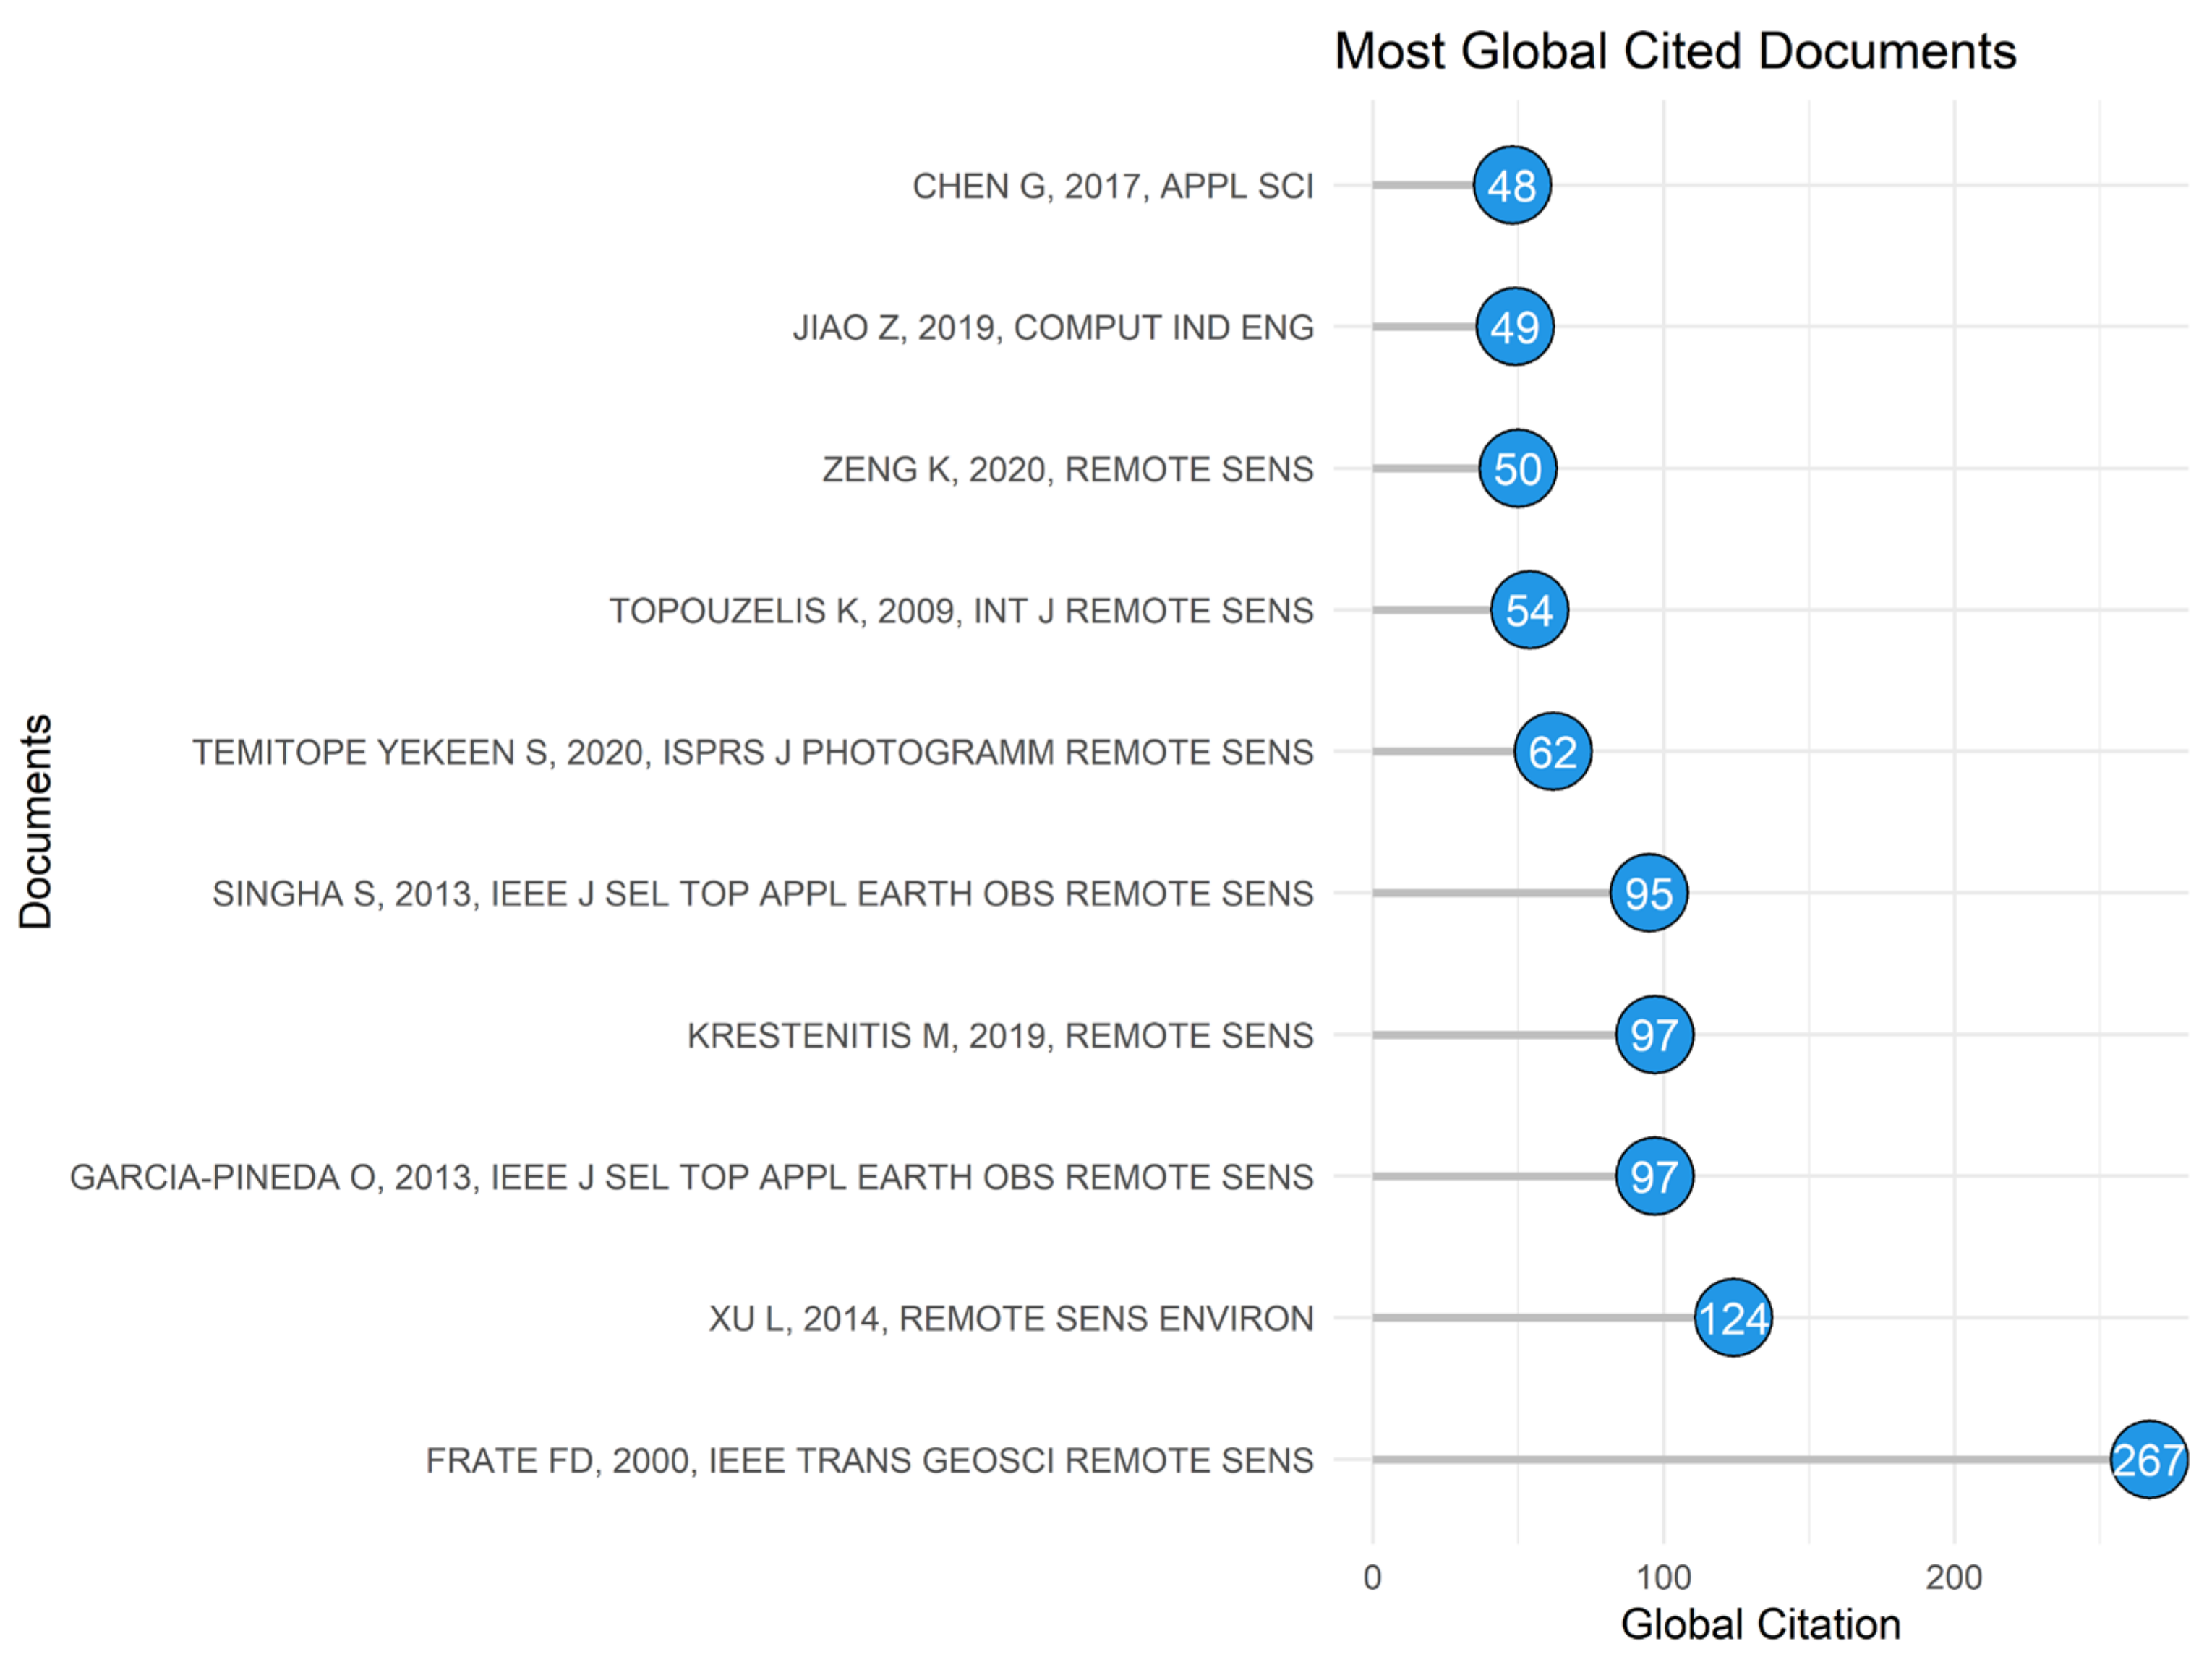
3.3. Most Influential Publication

Upon analyzing the literature in the OSDMDL field, it was observed that a select subset of 37 articles stood out due to their high citation count, representing 52.8% of the articles in the selected field (see Table S2 for more details). The remarkable finding was that this subset had accumulated 93% of the total citations, accounting for 1551 out of 1667 citations in the OSDMDL field.
This result shows the impact of these 37 articles in the OSDMDL field, which researchers have widely recognized and cited. The higher citation count for these articles could be attributed to their contribution to advancing the understanding of OSDMDL and their utility in guiding future research.
Upon analyzing the most highly cited articles in the field of interest, it was observed that the top 10 articles accounted for 56.5% of the total citations, amounting to 943 citations, as depicted in Figure 6. This observation suggests that a small fraction of the literature in the field has garnered disproportionate attention and influence.
When evaluating the top 5 neural network architectures most commonly used in the 37 selected studies focused on the OSDMDL field, it was observed that multilayer perceptrons (MLP) stood out, being present in 11 studies. It was followed by the convolutional neural network (CNN) architecture used in five studies, while U-Net, DeepLabv3+, and fully convolutional network (FCN) were all used in three studies. It is worth noting that among the 37 studies evaluated, only 12 (32.4%) utilized more than 1 neural network architecture to generate their results. Among these studies, the multilayer perceptrons (MLP) and deep convolutional neural network (DCNN) architectures were the most commonly used.
The high frequency of using MLPs can be attributed to their widely used and well-established architecture for neural networks, known for their ability to perform well in various machine learning tasks, including image and signal processing, classification, and regression. On the other hand, the use of DCNNs can be explained by their superior performance in image processing tasks, as they can learn increasingly complex and abstract features from input images through multiple convolutional layers. It is noteworthy that while MLPs and DCNNs are the most used neural network architectures in the evaluated studies, other architectures, such as CNNs, U-Net, DeepLabv3+, and FCN, also have their strengths and are frequently used in specific applications.
When evaluating the top five sensor systems primarily used, it was observed that the combination of Envisat ASAR and RADARSAT-2 was used in seven articles, indicating a significant preference over other systems. Next, ERS-SAR 2 was used in six articles, demonstrating similar popularity. Sentinel-1, on the other hand, was used in five articles, a common choice among researchers. Finally, TerraSAR-X was used in three articles, indicating that its use is still less every day than the other options. Free SAR data were few and did not have continuous acquisition.
Machine learning studies require a significant number of samples to train the codes. Therefore, most publications directly reflected the RADARSAT and Envisat ASAR most extensive time series data. Moreover, since 2014, we have had a significant database of Sentinel SAR data, which now has more than 15 confirmed oil spill cases in its global records. The TerraSAR-X and COSMO-SkyMed data also presented official records of spills, but their paid platform makes most of the studies applied to this theme unfeasible. Upon analyzing the use of features in the studies, it is clear that 40.5% of the papers utilized it. It is a surprising finding, as features are essential to image analysis and machine learning algorithms. Among the studies that used features, some categories were the most frequently used.
One of the most utilized categories was texture features. Texture features are a way to describe the spatial arrangement of pixels within an image, and they are often used to help differentiate between objects or regions of interest. In addition, geometrical and statistical features were also used, providing valuable information about the shape and distribution of objects within the image. For many years, this was the principal methodology applied to identify oil targets in the ocean using SAR images. However, it became less effective over the years with the development of deep learning technologies. Spectral bands were another prominent feature utilized.
Upon analyzing the patterns related to image preprocessing, it could be observed that a vast majority, around 65%, employed one or more preprocessing techniques. It indicates the importance of image preprocessing in remote sensing studies to obtain accurate results. The most commonly used techniques were related to image normalization, which reduces the presence of speckles, and the data rescaling to improve the image quality.

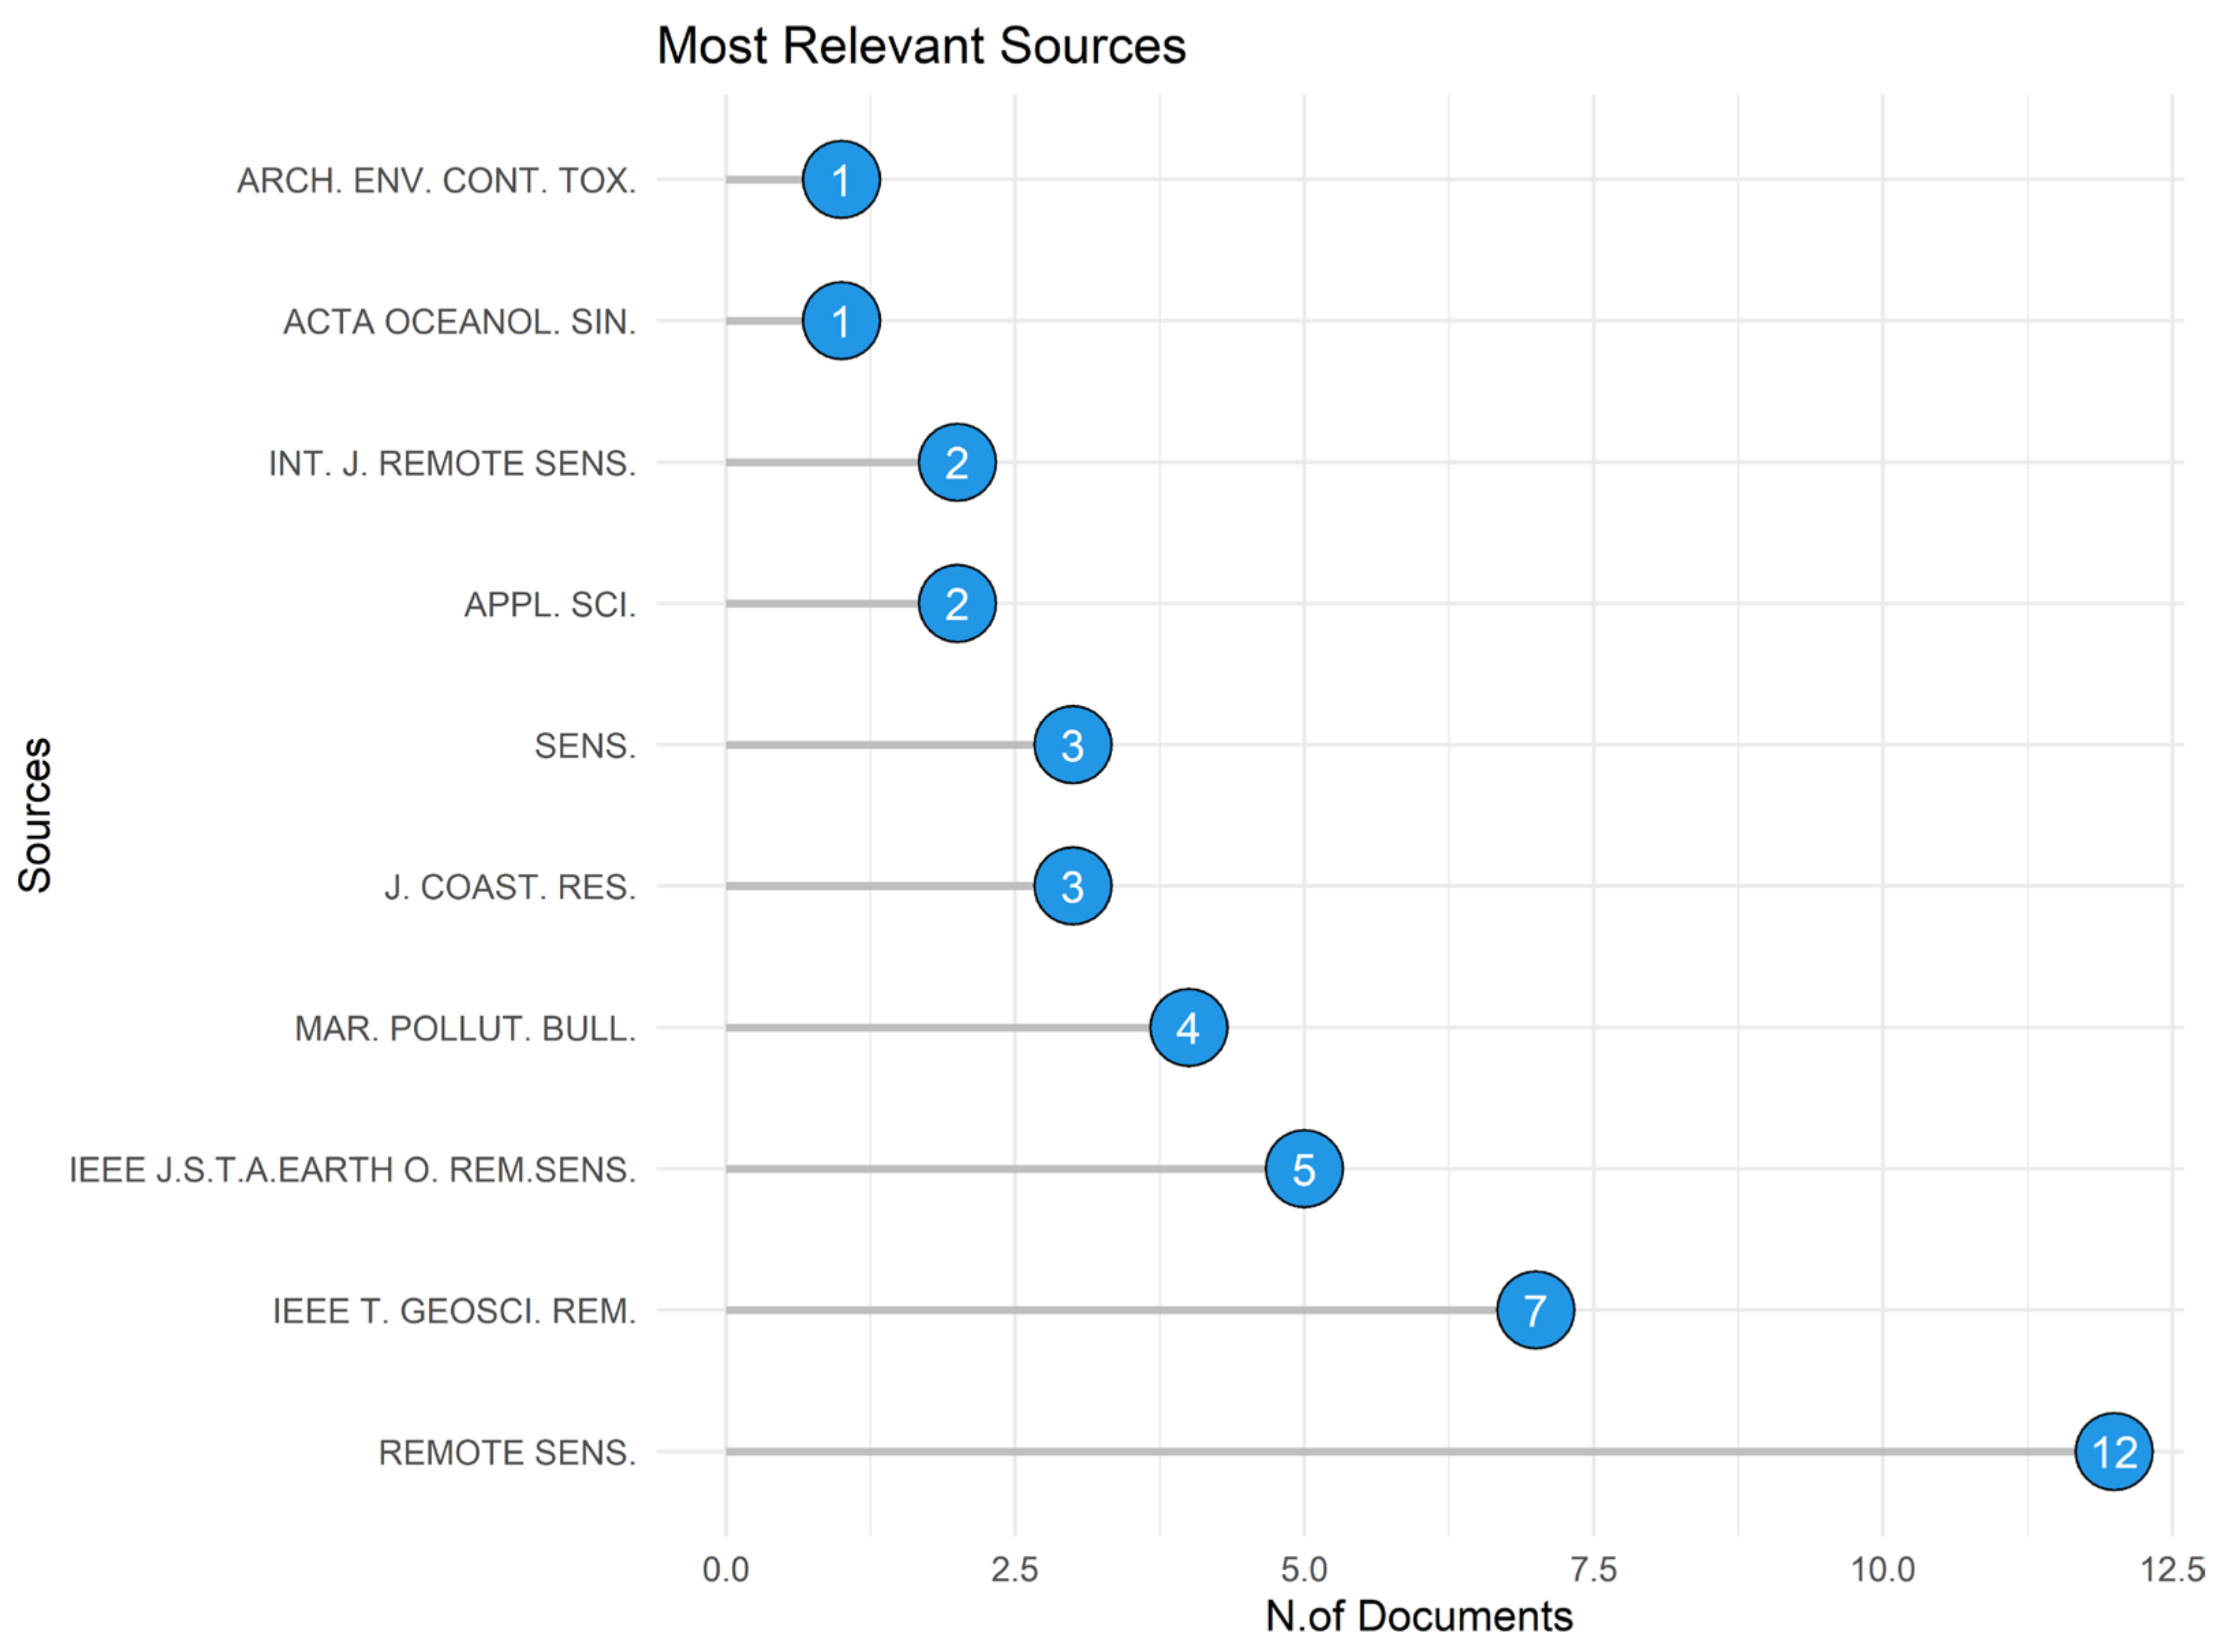
3.4. Influential Journals

Figure 7 illustrates the distribution of articles among various journals that have published OSDMDL-related research. The analysis of the results indicates that 40 different journals have contributed to the knowledge in this field. Among these journals, the 10 most notable sources in terms of the number of articles published are “Remote Sensing,” with 12 articles, representing approximately 17.1% of the total, followed by “IEE Transactions on Geoscience and Remote Sensing”, with 7 articles accounting for 10% of the total. “IEEE Journal of Selected Topics in Applied Earth Observations and Remote Sensing” comes in third with 5 articles, approximately 7.1% of the total. “Marine Pollution Bulletin” had 4 papers, about 5.7% of the total.
In comparison, “The Journal of Coastal Research” and “Sensors” had 3 articles each, representing roughly 4.3% of the total for each one. “Applied Sciences” and “International Journal of Remote Sensing” had 2 articles each, accounting individually for about 2.86%. Finally, “Acta Oceanologica Sinica” and “Archives of Environmental Contamination and Toxicology” had 1 article each, representing approximately 1.43% individually. These findings provide insights into the most influential journals in the OSDMDL research domain and can help researchers identify critical sources for future research in this area.
The impact of the top 10 journals in the context of OSDMDL, based on the number of citations, is illustrated in Figure 7. The two most influential journals in this field are IEEE Transactions on Geoscience and Remote Sensing, with significantly more citations than the rest. The total number of citations for the remaining journals in the top 10 is relatively similar.

3.5. Authors Contributing

When analyzing Figure 8, we can observe the top 10 authors who have published the most in the context of OSDMDL. Our analysis of the selected articles revealed the presence of 225 different authors, with an average of 4.07 authors per article, but only 3 articles had a single author. The top 5 most prominent authors were Li Y., who ranked first with 7 papers, representing 10% of the analyzed articles. Zhang J. followed in second place with 5 papers and approximately 7.1%. Del Frate F., Jung H-S., and Gong P. tied in third place with 4 papers, which accounts for approximately 6% for each author (Figure 8).
When examining the temporal trends of authors in the context of the OSDMDL, it became evident that some authors had a significant presence in the number of published articles while also showing a consistent production level over time. The three authors who stood out the most in this regard were Del Frate F., Li J., and Li Y. As shown in Figure 8, these authors have maintained a relatively steady level of productivity throughout the years, which may indicate their continued interest and contribution to this research topic. Their consistent production also suggests a high level of expertise and knowledge in OSDMDL.

4. Discussion

We conducted a comprehensive literature review and identified 70 documents that have been published using the OSDMDL scientific target topic. Although our results emphasized the importance and relevance of OSDMDL-related papers, they revealed that its production has been inconsistent over the years, with five distinct peaks. The highest peak was observed between 2020 and 2022. As we explained, due to the computational advance and the possibility of CNN analysis in parallel systems and GPUs (graphics processing units), the development of detection studies in neural networks and multilayer textural analysis grew significantly. Overall, there has been an increase in published papers across all periods, except for 1996–1999, which showed a decline in production. The detailed statistics in Table 2 highlight the changes in production over the years, with recent years showing a significant increase in OSDMDL-related publications. These findings suggest that this topic is rapidly expanding, and more research is needed to address this field’s challenges and opportunities [1,2,4,14,33].
In this study, the authors analyzed the OSDMDL methodology trends over 26 years. The first works deal with radar remote sensing techniques for detecting oil spills on the ocean surface. These studies showed that known parameters, such as polarization, backscatter, and damping ratio, helped apply deep learning techniques effectively today. The results show that the number of papers published in this field has consistently increased over time, with the highest growth rate observed in the last three years. It suggests a growing interest among researchers in the field of OSDMDL.
Another interesting finding is the increase in the number of authors per decade, with the highest numbers found in 2010–2019 and 2020–2022. It indicates that the field is becoming more collaborative and interdisciplinary, with researchers from different backgrounds working together [1,2,4,14,33]. This increasing collaboration reflects the highest score observed in the last three years [1,2,4,14,33]. This trend of international collaboration has a positive development in the OSDMDL-related research topic as it allows for exchanging a broader range of perspectives and expertise. Overall, the outcomes of this study offer a significant understanding of the patterns of collaboration and interdisciplinary approaches within the field of OSDMDL.
The diversity of OSDMDL-conducted research is highlighted by the various themes and methods identified here. Policymakers and researchers can use this information to understand the field better and identify areas for further research. Moreover, the co-occurrence network created in this study provides a valuable tool for researchers to identify collaborations, trends, and gaps, helping them plan and prioritize future research efforts.
Words such as “oil spill,” “oil,” and “SAR” are some of the most common recurrent bigram terms in the literature after 2015, indicating promising opportunities for future research and innovation in detecting and mitigating oil spills. However, specific bigram terms such as “dark formation” have consistently appeared since 2008, highlighting their significance in the broader context of OSDMDL. The study suggests that researchers should consider these recurring terms while researching OSDMDL.
Our results show a detailed analysis of the scientific production and collaborative efforts in the field of OSDMDL. One notable finding is that China has emerged as the leading contributor, accounting for 23.1% of the total scientific production, followed by Italy and South Korea. The UK and the USA shared the fourth position with a contribution of 3.5% each. It highlights the dominance of certain countries in this field and emphasizes the need for more diverse contributions from other countries. Furthermore, the collaborative efforts among nations were also discussed, with the UK and China displaying significant involvement while Portugal, Spain, and Iran showed relatively lower levels of collaborative activities. It indicates that more collaborative efforts are needed to facilitate the exchange of knowledge and expertise among researchers from different countries.
Another significant finding is that highly cited OSDMDL articles represent only a tiny fraction but have accumulated most of the citations. The top 10 most cited articles accounted for 56.5% of total citations, indicating that a small fraction of the literature in the field has gained disproportionate attention and influence. It highlights the importance of producing high-quality research that can significantly advance the understanding of OSDMDL and guide future research.
Our results suggest that researchers must carefully select appropriate neural network architectures, sensor systems, features, and preprocessing techniques to produce reliable and accurate results. For example, the multilayer perceptrons (MLP) and convolutional neural network (CNN) architectures were the most generally used, and the combination of Envisat ASAR and RADARSAT-2 was the most frequently used sensor system.
In this study, we investigated the distribution of articles related to OSDMDL across different journals and identified the most impactful sources for future research. Our results revealed that 40 journals have contributed to this field, with Remote Sensing, IEEE Transactions on Geoscience and Remote Sensing, and IEEE Journal of Selected Topics in Applied Earth Observations and Remote Sensing being the top 3 journals in terms of the number of published articles. Interestingly, these three journals also accounted for the most citations, with IEEE Transactions on Geoscience and Remote Sensing and Remote Sensing having a significantly higher number of citations than the other journals. The dominance of these few top journals in terms of published articles and citations highlights the influence of these journals on the field. Therefore, researchers should publish their work in these high-impact journals to increase the visibility and impact of their research.
Through the analysis of the selected articles, the top 10 authors who had published the most in the context of OSDMDL revealed that the authors’ collaboration was paramount. We found 225 authors involved, with an average of 4.07 authors per article. Researchers working in this domain are more likely to collaborate with other researchers, which can lead to more comprehensive and diverse research outcomes. Notably, the most influential authors identified in this study are from different countries, including China, Italy, and South Korea. This finding suggests that the OSDMDL research domain is an international research area that attracts scholars from diverse geographic regions.
We also discovered that only three articles had a single author, indicating that collaborative work is a common practice in this research domain. Li Y. emerged as the most prominent author with seven papers, followed by Zhang J. with five papers. Del Frate F., Jung H-S., and Gong P. tied for third place with four papers each. These authors have significantly contributed to the developing knowledge in the OSDMDL field.
When analyzing the authors’ temporal trend, three authors stood out with a consistent level of productivity over time: Del Frate F., Li J., and Li Y. They may possess a high level of expertise and interest in the field, based on the consistency in their contribution level to the field, as indicated by Figure 6. Identifying authors with a consistent level such as this is significant as it indicates their long-term commitment to the field and their sustained efforts in advancing the understanding of OSDMDL. Their research can guide future studies and shape the direction of OSDMDL-related topics.
Pinpointing authors such as these three can help identify potential collaborators and mentors for early career scientists and potential research groups or institutions that are actively involved in OSDMDL research.

5. Conclusions

This article is the first to use bibliometric review methods to assess the evolution of the OSDMDL literature. Through this study, we provide insights into scientific production related to countries, journals, and methods of analysis and evaluation that focus on remote sensing in OSDMDL.
This article examines the literature on OSDMDL over the past 26 years (1996–2022). The study uses a qualitative and quantitative word association network approach to provide an overview of the research trends in this field. The authors conducted a bibliometric analysis with systematic review elements and identified significant and exciting aspects of OSDMDL research. The findings indicate a significant increase in published articles in this field. However, there still needs to be more opportunities to expand conceptual and theoretical studies and methodological aspects of OSDMDL.
Several areas should be prioritized in the future. One crucial area is the investigation of novel neural network architectures, as recent developments in this field have yet to be fully explored. Researchers can discover new and more effective ways to detect and monitor oil spills by delving into these new techniques.
Another promising area for theoretical and methodological advances is the exploration of preprocessing and feature space analysis techniques. These techniques play a crucial role in the accuracy of results and the overall effectiveness of the models used in OSDMDL. By improving these techniques, researchers can enhance the accuracy of their models and thus provide better tools for detecting and monitoring oil spills.
Advances in the OSDMDL field allow for improving the effectiveness of oil spill detection and monitoring tools. By leveraging the latest technologies and techniques, researchers can develop more effective and efficient methods for detecting and responding to oil spills, ultimately minimizing their impact on the marine environment.

Supplementary Materials

The following supporting information can be downloaded at: https://www.mdpi.com/article/10.3390/jmse11071406/s1, Table S1: The table describes the details associated with selected papers in OSDMDL. The columns contain the information SR–(First Author, year, and paper), LA–(Language), TI–(Paper title), PY–(Publication year), and TC–(Total citation).; Table S2: The table describes the details associated with 37 most influential publication selected papers in OSDMDL, Table S3: The table describes the summary of Parameter Values in Co-occurrence Network, Countries’ Collaboration World Map, and Thesaurus File. References [54,55,56,57,58,59,60,61,62,63,64,65,66,67,68,69,70,71,72,73,74,75,76,77,78,79,80,81,82,83,84,85,86,87,88,89,90,91,92,93,94,95,96,97,98,99,100,101,102,103,104,105,106,107,108,109,110,111,112,113,114,115,116,117] are cited in the Supplementary Materials.

Author Contributions

Conceptualization, R.N.V., C.A.D.L., A.T.C.L., D.P.C., S.G.D., J.G.V.M., L.F.F.d.M., J.M.L., M.M.M.S., W.S.F.-R., D.T.M.S. and E.C.B.C.; methodology, R.N.V., C.A.D.L., A.T.C.L., J.G.V.M., E.C.B.C. and D.P.C.; software execution, R.N.V., M.M.M.S., D.P.C., S.G.D. and E.C.B.C., writing—original draft preparation, R.N.V., C.A.D.L., A.T.C.L., W.S.F.-R. and L.F.F.d.M.; writing—review and editing, R.N.V., C.A.D.L., W.S.F.-R., A.T.C.L., S.G.D., M.M.M.S. and E.C.B.C.; supervision, R.N.V., C.A.D.L. and A.T.C.L.; funding acquisition, C.A.D.L. and A.T.C.L. All authors have read and agreed to the published version of the manuscript.

Funding

This work was funded by the Brazilian Navy, the National Council for Scientific and Technological Development (CNPQ), and the Ministry of Science, Technology, and Innovation (MCTI) in the CNPQ/MCTI 06/2020 call—Research and Development for Coping with Oil Spills on the Brazilian Coast—Ciências do Mar Program, grant #440852/2020-0. During this work, RNV was supported by the CNPQ research fellowship (Process #81330/2021-4), JGVM by the CNPQ research fellowship (Process #308758/2021-8) and W.S.F.-R. Technology in Interdisciplinary and Transdisciplinary Studies in Ecology and Evolution (INCT IN-TREE).

Institutional Review Board Statement

Not applicable.

Informed Consent Statement

Not applicable.

Data Availability Statement

Not applicable.

Acknowledgments

We appreciate comments and suggestions from the anonymous reviewers that helped improve the quality and presentation of the manuscript.

Conflicts of Interest

The authors declare no conflict of interest.

References

  1. Vasconcelos, R.N.; Cunha Lima, A.T.; Lentini, C.A.D.; Miranda, G.V.; Mendonça, L.F.; Silva, M.A.; Cambuí, E.C.B.; Lopes, J.M.; Porsani, M.J. Oil Spill Detection and Mapping: A 50-Year Bibliometric Analysis. Remote Sens. 2020, 12, 3647. [Google Scholar] [CrossRef]
  2. Jafarzadeh, H.; Mahdianpari, M.; Homayouni, S.; Mohammadimanesh, F.; Dabboor, M. Oil Spill Detection from Synthetic Aperture Radar Earth Observations: A Meta-Analysis and Comprehensive Review. GIsci. Remote Sens. 2021, 58, 1022–1051. [Google Scholar] [CrossRef]
  3. Fingas, M.; Brown, C. Review of Oil Spill Remote Sensing. Mar. Pollut. Bull. 2014, 83, 9–23. [Google Scholar] [CrossRef] [Green Version]
  4. Fingas, M.; Brown, C.E. A Review of Oil Spill Remote Sensing. Sensors 2018, 18, 91. [Google Scholar] [CrossRef] [Green Version]
  5. Alpers, W.; Holt, B.; Zeng, K. Oil Spill Detection by Imaging Radars: Challenges and Pitfalls. In Proceedings of the 2017 IEEE International Geoscience and Remote Sensing Symposium (IGARSS), Fort Worth, TX, USA, 23–28 July 2017; IEEE: Piscataway, NJ, USA, 2017; pp. 1522–1525. [Google Scholar]
  6. Topouzelis, K.N. Oil Spill Detection by SAR Images: Dark Formation Detection, Feature Extraction and Classification Algorithms. Sensors 2008, 8, 6642–6659. [Google Scholar] [CrossRef] [Green Version]
  7. Picou, J.S.; Gill, D.A.; Dyer, C.L.; Curry, E.W. Disruption and Stress in an Alaskan Fishing Community: Initial and Continuing Impacts of the Exxon Valdez Oil Spill. Organ. Environ. 1992, 6, 235–257. [Google Scholar] [CrossRef]
  8. Lopes, J.M.; Lentini, C.A.D.; Mendonça, L.F.F.; Cunha Lima, A.T.; Vasconcelos, R.N.; Silva, A.X.; Porsani, M.J. Absorbed Dose Rate for Marine Biota Due to the Oil Spilled Using ICRP Reference Animal and Monte Carlo Simulation. Appl. Radiat. Isot. 2022, 188, 110354. [Google Scholar] [CrossRef]
  9. Li, P.; Cai, Q.; Lin, W.; Chen, B.; Zhang, B. Offshore Oil Spill Response Practices and Emerging Challenges. Mar. Pollut. Bull. 2016, 110, 6–27. [Google Scholar] [CrossRef]
  10. Lawa, R.J.; Kelly, C. The Impact of the “Sea Empress” Oil Spill. Aquat. Living Resour. 2004, 17, 389–394. [Google Scholar] [CrossRef] [Green Version]
  11. ITOPF. ITOPF Oil Tanker Spill Statistics 2019; ITOPF: London, UK, 2019. [Google Scholar]
  12. Roser, M. Oil Spills. Available online: https://ourworldindata.org/oil-spills (accessed on 26 September 2020).
  13. ICSMD-The International Charter Space and Major Disasters. Oil Spills Disasters charter. Available online: https://disasterscharter.org/ (accessed on 1 May 2023).
  14. Al-Ruzouq, R.; Gibril, M.B.A.; Shanableh, A.; Kais, A.; Hamed, O.; Al-Mansoori, S.; Khalil, M.A. Sensors, Features, and Machine Learning for Oil Spill Detection and Monitoring: A Review. Remote Sens. 2020, 12, 3338. [Google Scholar] [CrossRef]
  15. Bayindir, C.; Frost, J.D.; Barnes, C.F. Assessment and Enhancement of SAR Noncoherent Change Detection of Sea-Surface Oil Spills. IEEE J. Ocean. Eng. 2018, 43, 211–220. [Google Scholar] [CrossRef]
  16. Salberg, A.B.; Rudjord, Ø.; Solberg, A.H.S. Oil Spill Detection in Hybrid-Polarimetric SAR Images. IEEE Trans. Geosci. Remote Sens. 2014, 52, 6521–6533. [Google Scholar] [CrossRef]
  17. Brekke, C.; Solberg, A.H.S. Oil Spill Detection by Satellite Remote Sensing. Remote Sens. Environ. 2005, 95, 1–13. [Google Scholar] [CrossRef]
  18. Gens, R. Oceanographic Applications of SAR Remote Sensing. GIsci. Remote Sens. 2008, 45, 275–305. [Google Scholar] [CrossRef]
  19. Leifer, I.; Lehr, W.J.; Simecek-Beatty, D.; Bradley, E.; Clark, R.; Dennison, P.; Hu, Y.; Matheson, S.; Jones, C.E.; Holt, B.; et al. State of the Art Satellite and Airborne Marine Oil Spill Remote Sensing: Application to the BP Deepwater Horizon Oil Spill. Remote Sens. Environ. 2012, 124, 185–209. [Google Scholar] [CrossRef] [Green Version]
  20. Topouzelis, K.N.; Psyllos, A. Oil Spill Feature Selection and Classification Using Decision Tree Forest on SAR Image Data. ISPRS J. Photogramm. Remote Sens. 2012, 68, 135–143. [Google Scholar] [CrossRef]
  21. Li, K.; Yu, H.; Xu, Y.; Luo, X. Detection of Marine Oil Spills Based on HOG Feature and SVM Classifier. J. Sens. 2022, 2022, 3296495. [Google Scholar] [CrossRef]
  22. Dong, Z.-M.; Guo, L.-X.; Zeng, J.-K.; Zhou, X.-B. Oil-Spills Detection in Net-Sar Radar Images Using Support Vector Machine. Open Autom. Control. Syst. J. 2015, 7, 1958–1962. [Google Scholar] [CrossRef] [Green Version]
  23. Conceição, M.R.A.; Mendonça, L.F.F.; Lentini, C.A.D.; Lima, A.T.C.; Lopes, J.M.; Vasconcelos, R.N.; Gouveia, M.B.; Porsani, M.J. Sar Oil Spill Detection System through Random Forest Classifiers. Remote Sens. 2021, 13, 2044. [Google Scholar] [CrossRef]
  24. Lentini, C.A.D.; de Mendonça, L.F.F.; Conceição, M.R.A.; Lima, A.T.C.; de Vasconcelos, R.N.; Porsani, M.J. Comparison between Oil Spill Images and Look-Alikes: An Evaluation of SAR-Derived Observations of the 2019 Oil Spill Incident along Brazilian Waters. An. Acad. Bras. Cienc. 2022, 94, 1. [Google Scholar] [CrossRef] [PubMed]
  25. Vasconcelos, R.N.; Lentini, C.A.D.; Cunha Lima, A.T.; Mendonça, L.F.F.; Miranda, G.V.; Cambuí, E.C.B.; Costa, D.P.; Duverger, S.G.; Gouveia, M.B.; Lopes, J.M.; et al. Oil Spill Detection Based on Texture Analysis: How Does Feature Importance Matter in Classification? Int. J. Remote Sens. 2022, 43, 4045–4064. [Google Scholar] [CrossRef]
  26. Del Frate, F.; Petrocchi, A.; Lichtenegger, J.; Calabresi, G. Neural Networks for Oil Spill Detection Using ERS-SAR Data. IEEE Trans. Geosci. Remote Sens. 2000, 38, 2282–2287. [Google Scholar] [CrossRef] [Green Version]
  27. Krestenitis, M.; Orfanidis, G.; Ioannidis, K.; Avgerinakis, K.; Vrochidis, S.; Kompatsiaris, I. Oil Spill Identification from Satellite Images Using Deep Neural Networks. Remote Sens. 2019, 11, 1762. [Google Scholar] [CrossRef] [Green Version]
  28. Garcia-Pineda, O.; MacDonald, I.R.; Li, X.; Jackson, C.R.; Pichel, W.G. Oil Spill Mapping and Measurement in the Gulf of Mexico with Textural Classifier Neural Network Algorithm (TCNNA). IEEE J. Sel. Top. Appl. Earth Obs. Remote Sens. 2013, 6, 2517–2525. [Google Scholar] [CrossRef]
  29. Singha, S.; Bellerby, T.J.; Trieschmann, O. Satellite Oil Spill Detection Using Artificial Neural Networks. IEEE J. Sel. Top. Appl. Earth Obs. Remote Sens. 2013, 6, 2355–2363. [Google Scholar] [CrossRef]
  30. Yang, Y.-J.; Singha, S.; Mayerle, R. A Deep Learning Based Oil Spill Detector Using Sentinel-1 SAR Imagery. Int. J. Remote Sens. 2022, 43, 4287–4314. [Google Scholar] [CrossRef]
  31. Shaban, M.; Salim, R.; Abu Khalifeh, H.; Khelifi, A.; Shalaby, A.; El-Mashad, S.; Mahmoud, A.; Ghazal, M.; El-Baz, A. A Deep-Learning Framework for the Detection of Oil Spills from SAR Data. Sensors 2021, 21, 2351. [Google Scholar] [CrossRef]
  32. Jha, M.N.; Levy, J.; Gao, Y. Advances in Remote Sensing for Oil Spill Disaster Management: State-of-the-Art Sensors Technology for Oil Spill Surveillance. Sensors 2008, 8, 236–255. [Google Scholar] [CrossRef] [Green Version]
  33. Huby, A.A.; Sagban, R.; Alubady, R. Oil Spill Detection Based on Machine Learning and Deep Learning: A Review. In Proceedings of the 2022 5th International Conference on Engineering Technology and its Applications (IICETA), Al-Najaf, Iraq, 31 May–1 June 2022; IEEE: Piscataway, NJ, USA, 2022; pp. 85–90. [Google Scholar]
  34. Cresson, R. Deep Learning for Remote Sensing Images with Open Source Software, 1st ed.; CRC Press: Boca Raton, FL, USA, 2020; Volume 1, ISBN 9781003020851. [Google Scholar]
  35. Andres, A. Measuring Academic Research. Measuring Academic Research 2009; Woodhead Publishing Limited: Cambridge, UK, 2010. [Google Scholar] [CrossRef]
  36. De Bellis, N. (Ed.) Leadership Lessons for Health Care Providers; Elsevier: Lanham, MD, USA, 2017; ISBN 9780128018668. [Google Scholar]
  37. Vasconcelos, R.N.; Costa, D.P.; Duverger, S.G.; Lobão, J.S.B.; Cambuí, E.C.B.; Lentini, C.A.D.; Lima, A.T.C.; Schirmbeck, J.; Mendes, D.T.; Rocha, W.J.S.F.; et al. Bibliometric Analysis of Surface Water Detection and Mapping Using Remote Sensing in South America. Scientometrics 2023, 128, 1667–1688. [Google Scholar] [CrossRef]
  38. Santana, M.M.M.; Mariano-Neto, E.; Vasconcelos, R.N.; Dodonov, P.; Medeiros, J.M.M. Mapping the Research History, Collaborations and Trends of Remote Sensing in Fire Ecology. Scientometrics 2021, 126, 1359–1388. [Google Scholar] [CrossRef]
  39. Ullah, R.; Asghar, I.; Griffiths, M.G. An Integrated Methodology for Bibliometric Analysis: A Case Study of Internet of Things in Healthcare Applications. Sensors 2022, 23, 67. [Google Scholar] [CrossRef] [PubMed]
  40. Gizzi, F.T.; Potenza, M.R. The Scientific Landscape of November 23rd, 1980 Irpinia-Basilicata Earthquake: Taking Stock of (Almost) 40 Years of Studies. Geosciences 2020, 10, 482. [Google Scholar] [CrossRef]
  41. Roldan-Valadez, E.; Salazar-Ruiz, S.Y.; Ibarra-Contreras, R.; Rios, C. Current Concepts on Bibliometrics: A Brief Review about Impact Factor, Eigenfactor Score, CiteScore, SCImago Journal Rank, Source-Normalised Impact per Paper, H-Index, and Alternative Metrics. Ir. J. Med. Sci. 2019, 188, 939–951. [Google Scholar] [CrossRef] [PubMed]
  42. Shi, Y.; Blainey, S.; Sun, C.; Jing, P. A Literature Review on Accessibility Using Bibliometric Analysis Techniques. J. Transp. Geogr. 2020, 87, 102810. [Google Scholar] [CrossRef]
  43. Elsevier Content—How Scopus Works—Scopus—|Elsevier Solutions. Available online: https://www.elsevier.com/solutions/scopus/how-scopus-works/content (accessed on 26 September 2020).
  44. van Eck, N.J.; Waltman, L. Bibliometric Mapping of the Computational Intelligence Field. Int. J. Uncertain. Fuzziness Knowl. Based Syst. 2007, 15, 625–645. [Google Scholar] [CrossRef]
  45. van Eck, N.J.; Waltman, L. Software Survey: VOSviewer, a Computer Program for Bibliometric Mapping. Scientometrics 2010, 84, 523–538. [Google Scholar] [CrossRef] [Green Version]
  46. van Eck, N.J.; Waltman, L.; Hofmann, M. Text Mining and Visualization; Chisholm, A., Ed.; Chapman and Hall/CRC: Boca Raton, FL, USA, 2016; ISBN 9780429161971. [Google Scholar]
  47. Van Eck, N.J.; Waltman, L.; Van Den Berg, J.; Kaymak, U. Visualizing the Computational Intelligence Field. IEEE Comput. Intell. Mag. 2006, 1, 6–10. [Google Scholar] [CrossRef] [Green Version]
  48. Aria, M.; Cuccurullo, C. Bibliometrix: An R-Tool for Comprehensive Science Mapping Analysis. J. Informetr. 2017, 11, 959–975. [Google Scholar] [CrossRef]
  49. Team, R.C. The R Project for Statistical Computing. 2023, pp. 1–12. Available online: http://www.R-Project.Org/ (accessed on 1 May 2023).
  50. R Core Team R. A Language and Environment for Statistical Computing; R Core Team R: Vienna, Austria, 2020. [Google Scholar]
  51. RStudio RStudio|Open Source & Professional Software for Data Science Teams—RStudio. Available online: https://rstudio.com/ (accessed on 26 September 2020).
  52. Wickham, H. Ggplot2: Create Elegant Data Visualisations Using the Grammar of Graphics, R package version 3.6.1; R Core Team R: Vienna, Austria, 2018. [CrossRef] [Green Version]
  53. Somvanshi, M.; Chavan, P.; Tambade, S.; Shinde, S.V. A Review of Machine Learning Techniques Using Decision Tree and Support Vector Machine. In Proceedings of the 2016 International Conference on Computing Communication Control and automation (ICCUBEA), Pune, India, 12–13 August 2016; IEEE: Piscataway, NJ, USA, 2016; pp. 1–7. [Google Scholar]
  54. Chen, R.; Jia, B.; Ma, L.; Xu, J.; Li, B.; Wang, H. Marine Radar Oil Spill Extraction Based on Texture Features and BP Neural Network. J. Mar. Sci. Eng. 2022, 10, 1904. [Google Scholar] [CrossRef]
  55. Chen, Y.; Wang, Z. Marine Oil Spill Detection from SAR Images Based on Attention U-Net Model Using Polarimetric and Wind Speed Information. Int. J. Environ. Res Public Health 2022, 19, 2315. [Google Scholar] [CrossRef]
  56. Margarita, F.; Nishchhal, N. Verification of Marine Oil Spills Using Aerial Images Based on Deep Learning Methods. Inform. Autom. 2022, 21, 937–962. [Google Scholar] [CrossRef]
  57. Zhang, J.; Feng, H.; Luo, Q.; Li, Y.; Zhang, Y.; Li, J.; Zeng, Z. Oil Spill Detection with Dual-Polarimetric Sentinel-1 SAR Using Superpixel-Level Image Stretching and Deep Convolutional Neural Network. Remote Sens. 2022, 14, 3900. [Google Scholar] [CrossRef]
  58. Du, K.; Ma, Y.; Jiang, Z.; Lu, X.; Yang, J. Detection of Oil Spill Based on CBF-CNN Using HY-1C CZI Multispectral Images. Acta Oceanol. Sin. 2022, 41, 166–179. [Google Scholar] [CrossRef]
  59. Huang, X.; Zhang, B.; Perrie, W.; Lu, Y.; Wang, C. A Novel Deep Learning Method for Marine Oil Spill Detection from Satellite Synthetic Aperture Radar Imagery. Mar. Pollut. Bull. 2022, 179, 113666. [Google Scholar] [CrossRef]
  60. Chen, P.; Zhou, H.; Li, Y.; Liu, B.; Liu, P. Oil Spill Identification in Radar Images Using a Soft Attention Segmentation Model. Remote Sens. 2022, 14, 2180. [Google Scholar] [CrossRef]
  61. Rousso, R.; Katz, N.; Sharon, G.; Glizerin, Y.; Kosman, E.; Shuster, A. Automatic Recognition of Oil Spills Using Neural Networks and Classic Image Processing. Water 2022, 14, 1127. [Google Scholar] [CrossRef]
  62. Duan, P.H.; Xie, Z.J.; Kang, X.D.; Li, S.T. Self-Supervised Learning-Based Oil Spill Detection of Hyperspectral Images. Sci. China Technol. Sci. 2022, 65, 793–801. [Google Scholar] [CrossRef]
  63. Zhang, T.; Guo, J.; Xu, C.; Zhang, X.; Wang, C.; Li, B. A New Oil Spill Detection Algorithm Based on Dempster-Shafer Evidence Theory. J. Oceanol. Limnol. 2022, 40, 456–469. [Google Scholar] [CrossRef]
  64. Yang, J.; Ma, Y.; Hu, Y.; Jiang, Z.; Zhang, J.; Wan, J.; Li, Z. Decision Fusion of Deep Learning and Shallow Learning for Marine Oil Spill Detection. Remote Sens. 2022, 14, 666. [Google Scholar] [CrossRef]
  65. Mahmoudi Ghara, F.; Shokouhi, S.B.; Akbarizadeh, G. A New Technique for Segmentation of the Oil Spills from Synthetic-Aperture Radar Images Using Convolutional Neural Network. IEEE J. Sel. Top. Appl. Earth Obs. Remote Sens. 2022, 15, 8834–8844. [Google Scholar] [CrossRef]
  66. Yanling, D.; Jianhua, C.; Quanmiao, W.; Dongmei, H. Marine Oil-Spill Detection in Multi-Polarization Image-Based SAR on Improved FCN. Laser Optoelectron. Prog. 2022, 59. [Google Scholar] [CrossRef]
  67. Ma, X.; Xu, J.; Wu, P.; Kong, P. Oil Spill Detection Based on Deep Convolutional Neural Networks Using Polarimetric Scattering Information from Sentinel-1 SAR Images. IEEE Trans. Geosci. Remote Sens. 2022, 60, 1–13. [Google Scholar] [CrossRef]
  68. Jiang, Z.; Zhang, J.; Ma, Y.; Mao, X. Hyperspectral Remote Sensing Detection of Marine Oil Spills Using an Adaptive Long-Term Moment Estimation Optimizer. Remote Sens. 2022, 14, 157. [Google Scholar] [CrossRef]
  69. Zhang, C.; Wang, Q.; Lu, P.; Ge, Y.; Atkinson, P.M. Fast and Slow Changes Constrained Spatio-Temporal Subpixel Mapping. IEEE Trans. Geosci. Remote Sens. 2022, 60, 1–16. [Google Scholar] [CrossRef]
  70. Dasari, K.; Anjaneyulu, L.; Nadimikeri, J. Application of C-Band Sentinel-1A SAR Data as Proxies for Detecting Oil Spills of Chennai, East Coast of India. Mar. Pollut. Bull. 2022, 174, 113182. [Google Scholar] [CrossRef]
  71. De Laurentiis, L.; Jones, C.E.; Holt, B.; Schiavon, G.; Del Frate, F. Deep Learning for Mineral and Biogenic Oil Slick Classification with Airborne Synthetic Aperture Radar Data. IEEE Trans. Geosci. Remote Sens. 2021, 59, 8455–8469. [Google Scholar] [CrossRef]
  72. Fan, Y.; Rui, X.; Zhang, G.; Yu, T.; Xu, X.; Poslad, S. Feature Merged Network for Oil Spill Detection Using Sar Images. Remote Sens. 2021, 13, 3174. [Google Scholar] [CrossRef]
  73. Li, Y.; Lyu, X.; Frery, A.C.; Ren, P. Oil Spill Detection with Multiscale Conditional Adversarial Networks with Small-Data Training. Remote Sens. 2021, 13, 2378. [Google Scholar] [CrossRef]
  74. Wang, B.; Shao, Q.; Song, D.; Li, Z.; Tang, Y.; Yang, C.; Wang, M. A Spectral-Spatial Features Integrated Network for Hyperspectral Detection of Marine Oil Spill. Remote Sens. 2021, 13, 1568. [Google Scholar] [CrossRef]
  75. Park, S.; Ahn, M.H.; Li, C.; Kim, J.; Jeon, H.; Kim, D.J. Evaluation of Oil Spill Detection Models by Oil Spill Distribution Characteristics and Cnn Architectures Using Sentinel-1 Sar Data. Korean J. Remote Sens. 2021, 37, 1475–1490. [Google Scholar] [CrossRef]
  76. Seydi, S.T.; Hasanlou, M.; Amani, M.; Huang, W. Oil Spill Detection Based on Multiscale Multidimensional Residual CNN for Optical Remote Sensing Imagery. IEEE J. Sel. Top. Appl. Earth Obs. Remote Sens. 2021, 14, 10941–10952. [Google Scholar] [CrossRef]
  77. Baek, W.K.; Jung, H.S.; Kim, D. Oil Spill Detection of Kerch Strait in November 2007 from Dual-Polarized TerraSAR-X Image Using Artificial and Convolutional Neural Network Regression Models. J. Coast. Res. 2020, 102, 137–144. [Google Scholar] [CrossRef]
  78. Temitope Yekeen, S.; Balogun, A.L.; Wan Yusof, K.B. A Novel Deep Learning Instance Segmentation Model for Automated Marine Oil Spill Detection. ISPRS J. Photogramm. Remote Sens. 2020, 167, 190–200. [Google Scholar] [CrossRef]
  79. Bianchi, F.M.; Espeseth, M.M.; Borch, N. Large-Scale Detection and Categorization of Oil Spills from Sar Images with Deep Learning. Remote Sens. 2020, 12, 2260. [Google Scholar] [CrossRef]
  80. Zhang, J.; Feng, H.; Luo, Q.; Li, Y.; Wei, J.; Li, J. Oil Spill Detection in Quad-Polarimetric SAR Images Using an Advanced Convolutional Neural Network Based on Superpixel Model. Remote Sens. 2020, 12, 944. [Google Scholar] [CrossRef] [Green Version]
  81. Zeng, K.; Wang, Y. A Deep Convolutional Neural Network for Oil Spill Detection from Spaceborne SAR Images. Remote Sens. 2020, 12, 1015. [Google Scholar] [CrossRef] [Green Version]
  82. Song, D.; Zhen, Z.; Wang, B.; Li, X.; Gao, L.; Wang, N.; Xie, T.; Zhang, T. A Novel Marine Oil Spillage Identification Scheme Based on Convolution Neural Network Feature Extraction from Fully Polarimetric SAR Imagery. IEEE Access 2020, 8, 59801–59820. [Google Scholar] [CrossRef]
  83. Park, S.H.; Jung, H.S.; Lee, M.J. Oil Spill Mapping from Kompsat-2 High-Resolution Image Using Directional Median Filtering and Artificial Neural Network. Remote Sens. 2020, 12, 253. [Google Scholar] [CrossRef] [Green Version]
  84. Jiao, Z.; Jia, G.; Cai, Y. A New Approach to Oil Spill Detection That Combines Deep Learning with Unmanned Aerial Vehicles. Comput. Ind. Eng. 2019, 135, 1300–1311. [Google Scholar] [CrossRef]
  85. Yang, J.F.; Wan, J.H.; Ma, Y.; Zhang, J.; Bin Hu, Y.; Jiang, Z.C. Oil Spill Hyperspectral Remote Sensing Detection Based on DCNN with Multi-Scale Features. J. Coast. Res. 2019, 90, 332–339. [Google Scholar] [CrossRef]
  86. Park, S.H.; Jung, H.S.; Lee, M.J.; Lee, W.J.; Choi, M.J. Oil Spill Detection from Planetscope Satellite Image: Application to Oil Spill Accident near Ras Al Zour Area, Kuwait in August 2017. J. Coast. Res. 2019, 90, 251–260. [Google Scholar] [CrossRef]
  87. Guo, H.; Wei, G.; An, J. Dark Spot Detection in SAR Images of Oil Spill Using Segnet. Appl. Sci. 2018, 8, 2670. [Google Scholar] [CrossRef] [Green Version]
  88. Li, Y.; Zhang, Y.; Yuan, Z.; Guo, H.; Pan, H.; Guo, J. Marine Oil Spill Detection Based on the Comprehensive Use of Polarimetric SAR Data. Sustainability 2018, 10, 4408. [Google Scholar] [CrossRef] [Green Version]
  89. Nieto-Hidalgo, M.; Gallego, A.J.; Gil, P.; Pertusa, A. Two-Stage Convolutional Neural Network for Ship and Spill Detection Using SLAR Images. IEEE Trans. Geosci. Remote Sens. 2018, 56, 5217–5230. [Google Scholar] [CrossRef] [Green Version]
  90. Yu, X.; Zhang, H.; Luo, C.; Qi, H.; Ren, P. Oil Spill Segmentation via Adversarial F-Divergence Learning. IEEE Trans. Geosci. Remote Sens. 2018, 56, 4973–4988. [Google Scholar] [CrossRef]
  91. Kim, D.; Jung, H.S. Mapping Oil Spills from Dual-Polarized Sar Images Using an Artificial Neural Network: Application to Oil Spill in the Kerch Strait in November 2007. Sensors 2018, 18, 2237. [Google Scholar] [CrossRef] [Green Version]
  92. Gallego, A.J.; Gil, P.; Pertusa, A.; Fisher, R.B. Segmentation of Oil Spills on Side-Looking Airborne Radar Imagery with Autoencoders. Sensors 2018, 18, 797. [Google Scholar] [CrossRef] [Green Version]
  93. Mera, D.; Fernández-Delgado, M.; Cotos, J.M.; Viqueira, J.R.R.; Barro, S. Comparison of a Massive and Diverse Collection of Ensembles and Other Classifiers for Oil Spill Detection in SAR Satellite Images. Neural Comput. Appl. 2017, 28, 1101–1117. [Google Scholar] [CrossRef]
  94. Senthil Murugan, J.; Parthasarathy, V. AETC: Segmentation and Classification of the Oil Spills from SAR Imagery. Environ. Forensics 2017, 18, 258–271. [Google Scholar] [CrossRef]
  95. Chen, G.; Li, Y.; Sun, G.; Zhang, Y. Application of Deep Networks to Oil Spill Detection Using Polarimetric Synthetic Aperture Radar Images. Appl. Sci. 2017, 7, 968. [Google Scholar] [CrossRef]
  96. Li, Y.; Cui, C.; Liu, Z.; Liu, B.; Xu, J.; Zhu, X.; Hou, Y. Detection and Monitoring of Oil Spills Using Moderate/High-Resolution Remote Sensing Images. Arch. Environ. Contam. Toxicol. 2017, 73, 154–169. [Google Scholar] [CrossRef]
  97. Singha, S.; Ressel, R. Offshore Platform Sourced Pollution Monitoring Using Space-Borne Fully Polarimetric C and X Band Synthetic Aperture Radar. Mar. Pollut. Bull. 2016, 112, 327–340. [Google Scholar] [CrossRef] [Green Version]
  98. Ma, L. Support Tucker Machines Based Marine Oil Spill Detection Using SAR Images. Indian J. Geo Mar. Sci. 2016, 45, 1445–1449. [Google Scholar]
  99. Lee, M.S.; Park, K.A.; Lee, H.R.; Park, J.J.; Kang, C.K.; Lee, M. Detection and Dispersion of Thick and Film-Like Oil Spills in a Coastal Bay Using Satellite Optical Images. IEEE J. Sel. Top Appl. Earth Obs. Remote Sens. 2016, 9, 5139–5150. [Google Scholar] [CrossRef]
  100. Vijayakumar, S.; Swarnalatha, P.; Rukmini, S. A Neural Network Classification Approach for Oil Spill Detection on Sar Images. IIOAB J. 2016, 7, 225–235. [Google Scholar]
  101. Guo, Y.; Wang, X.; Zhang, H. Oil Spill Detection by SAR Images Based on Human Perception. Wuhan Daxue Xuebao Xinxi Kexue Ban Geomat. Inf. Sci. Wuhan Univ. 2016, 41, 395–401. [Google Scholar] [CrossRef]
  102. Taravat, A.; Oppelt, N. Adaptive Weibull Multiplicative Model and Multilayer Perceptron Neural Networks for Dark-Spot Detection from SAR Imagery. Sensors 2014, 14, 22798–22810. [Google Scholar] [CrossRef] [Green Version]
  103. Xu, L.; Li, J.; Brenning, A. A Comparative Study of Different Classification Techniques for Marine Oil Spill Identification Using RADARSAT-1 Imagery. Remote Sens. Environ. 2014, 141, 14–23. [Google Scholar] [CrossRef]
  104. Singha, S.; Velotto, D.; Lehner, S. Near Real Time Monitoring of Platform Sourced Pollution Using TerraSAR-X over the North Sea. Mar. Pollut. Bull 2014, 86, 379–390. [Google Scholar] [CrossRef] [PubMed]
  105. Taravat, A.; Latini, D.; Del Frate, F. Fully Automatic Dark-Spot Detection from Sar Imagery with the Combination of Nonadaptive Weibull Multiplicative Model and Pulse-Coupled Neural Networks. IEEE Trans. Geosci. Remote Sens. 2014, 52, 2427–2435. [Google Scholar] [CrossRef]
  106. Shahsavarhaghighi, S.; Sahebi, M.R.; Valdanzoej, M.J.; Haddadi, G.A. A Comparison of IEM and SPM Model for Oil Spill Detection Using Inversion Technique and Radar Data. J. Indian Soc. Remote Sens. 2013, 41, 425–431. [Google Scholar] [CrossRef]
  107. Yanling, L. A Neural Network Filter to Estimate the Doa of Small Targets. J. Theor. Appl. Inf. Technol. 2013, 49. [Google Scholar]
  108. Del Frate, F.; Latini, D.; Pratola, C.; Palazzo, F. PCNN for Automatic Segmentation and Information Extraction from X-Band SAR Imagery. Int. J. Image Data Fusion 2013, 4, 75–88. [Google Scholar] [CrossRef]
  109. Vespe, M.; Posada, M.; Ferraro, G.; Greidanus, H. Data Fusion of Sar Derived Features and Ancillary Information for Automatic Oil Spill Detection. Fresenius Environ. Bull. 2011, 20, 36–43. [Google Scholar]
  110. Ozkan, C.; Ozturk, C.; Sunar, F.; Karaboga, D. The Artificial Bee Colony Algorithm in Training Artificial Neural Network for Oil Spill Detection. Neural Netw. World 2011, 21, 473–492. [Google Scholar] [CrossRef]
  111. Vasilescu, J.; Marmureanu, L.; Carstea, E.; Cristescu, C.P. Oil Spills Detection from Fluorescence Lidar Measurements. UPB Sci. Bull. Ser. A Appl. Math. Phys. 2010, 72, 149–154. [Google Scholar]
  112. Topouzelis, K.; Karathanassi, V.; Pavlakis, P.; Rokos, D. Potentiality of Feed-Forward Neural Networks for Classifying Dark Formations to Oil Spills and Look-Alikes. Geocarto Int. 2009, 24, 179–191. [Google Scholar] [CrossRef]
  113. Topouzelis, K.; Stathakis, D.; Karathanassi, V. Investigation of Genetic Algorithms Contribution to Feature Selection for Oil Spill Detection. Int. J. Remote Sens. 2009, 30, 611–625. [Google Scholar] [CrossRef]
  114. Topouzelis, K.; Karathanassi, V.; Pavlakis, P.; Rokos, D. Dark Formation Detection Using Neural Networks. Int. J. Remote Sens. 2008, 29, 4705–4720. [Google Scholar] [CrossRef]
  115. Obi, S.; Okajima, K.; Koizumi, Y.; Murata, M. Introduction of Infomax Learning Algorithm and Application for Oil Spill Detection in SAR Images Introduction of Infomax Learning Algorithm and Application for Oil Spill Detection in SAR Images Non-Member. IEEJ Trans. Fundam. Mater. 2006, 126, 496–503. [Google Scholar] [CrossRef] [Green Version]
  116. Taravat, A.; Del Frate, F. Development of Band Ratioing Algorithms and Neural Networks to Detection of Oil Spills Using Landsat ETM+ Data. EURASIP J. Adv. Signal. Process. 2012, 2012, 107. [Google Scholar] [CrossRef]
  117. Ziemke, T. Radar Image Segmentation Using Recurrent Artificial Neural Networks. Pattern Recognit. Lett. 1996, 17, 319–334. [Google Scholar] [CrossRef]
Figure 1. The diagram depicts the sequence of procedures implemented throughout the various stages of the study.
Jmse 11 01406 g001
Figure 2. Annual growth rate of OSDMDL publications (black curve, left y-axis) compared to the cumulative annual growth (red curve, right y-axis) of the database (1996–2022).
Jmse 11 01406 g002
Figure 3. Word co-occurrence network presented in titles, abstracts, keywords, and general feature information of the papers published between 1996 and 2022.
Jmse 11 01406 g003
Figure 4. Temporal trends of the most frequent bigrams abstract terms between 2008 and 2022. The blue circle size indicates the frequency, and blue lines indicate temporal trends of bigrams terms along time.
Jmse 11 01406 g004
Figure 5. The co-authoring collaboration network by countries from documents published. The red lines indicate collaboration between authors from different countries, and the width indicates the frequency of collaborations.
Jmse 11 01406 g005
Figure 6. The figure shows the ten most impactful papers based on total citations. The blue circles on the right side indicate the respective citation numbers.
Jmse 11 01406 g006
Figure 7. The figure shows the ten most impactful papers based on total citations. The blue circles on the right side indicate the respective citation numbers.
Jmse 11 01406 g007
Figure 8. Temporal trends of essential authors between 1990 and 2021. The blue circle size indicates the number of published papers, and the red lines indicate temporal trends of papers published for each author over time.
Jmse 11 01406 g008
Table 1. This table presents a concise overview of the relationships between the research questions, the data sources used, and the analytical methods employed in this study.
QuestionsAnalysisSource Data
How do OSDMDL study publication trends behave?General statistics/word Co-occurrence network/country collaboration spatial networkAll papers
Which countries stand out in terms of OSDMDL production? General statistics/word Co-occurrence network/country collaboration spatial networkAll papers
What are the most influential papers in the OSDMDL field?General description tablesMost cited papers
Which journals are most prominent in terms of the number of articles published in the OSDMDL field?General statistics/general description and citation tablesAll papers
What is the overall picture of collaboration between countries regarding the OSDMDL field?General statistics/general description and citation tables/country collaboration spatial networkAll papers
What is the central theme, focus, and approach most prominent in research in the OSDMDL field?Word Co-occurrence network/
general description
All
Table 2. General statistics are associated with production sources, papers by parents, funding institutions, authors, and affiliation. In the center of the graph is the co-occurrence network of terms and words. The different colors represent different clusters.
Main Information
Timespan1996:20221996:19992000:20092010:20192020:2022
Sources (Journals)40142417
Documents70153331
Annual growth rate %11.7608.0116.6560.36
Document contents
AUTHORS
Authors225113107120
Authors of single-authored docs31020
Authors collaboration
Single-authored docs31020
Co-authors per doc4.0713.83.734.58
International co-authorships %15.7106012.1212.9
Document types
article70153331
Disclaimer/Publisher’s Note: The statements, opinions and data contained in all publications are solely those of the individual author(s) and contributor(s) and not of MDPI and/or the editor(s). MDPI and/or the editor(s) disclaim responsibility for any injury to people or property resulting from any ideas, methods, instructions or products referred to in the content.

